 Haicheng Xu
 Mei Liu1
 Xinglong Dai
- 1Shandong Facility Horticulture Bioengineering Research Center, Weifang University of Science and Technology, Weifang, China
- 2State Key Laboratory of Crop Biology, Agronomy College of Shandong Agricultural University, Tai’an, China
The increasing costs of agricultural production and environmental concerns reinforce the need to reduce resource inputs. Improvements in nitrogen (N) use efficiency (NUE) and water productivity (WP) are critical for sustainable agriculture. We aimed to optimize management strategy to increase wheat grain yield, promote N balance, and improve NUE and WP. A 3-year experiment was conducted with four integrated treatments: conventional practice treatment (CP); improvement of conventional practice treatment (ICP); high-yield management treatment (HY), which aimed for maximizing grain yield regardless of resource inputs cost; and integrated soil and crop system management treatment (ISM), which aimed for testing an optimal combination of sowing date, seeding rate, and fertilization and irrigation management. The average grain yield for ISM was 95.86% of that for HY and was 5.99% and 21.72% higher than that for ICP and CP, respectively. ISM promoted N balance as relatively higher aboveground N uptake, lower inorganic N residue, and lowest inorganic N loss. The average NUE for ISM was 4.15% lower than that for ICP and was remarkably higher than that for HY and CP by 26.36% and 52.37%, respectively. The increased soil water consumption under ISM was mainly due to its increased root length density. Along with a high level of grain yield, ISM obtained a relatively adequate water supply due to the effective use of soil water storage, thereby increasing the average WP by 3.63%–38.10% in comparison with other integrated management treatments. These results demonstrated that optimized management strategy (appropriately delaying sowing date, increasing seeding rate, and optimizing fertilization and irrigation management) used under ISM could promote N balance and improve WP while increasing grain yield and NUE in winter wheat. Therefore, ISM can be considered a recommendable management strategy in the target region.
1 Introduction
In 2015, approximately 25.2 million tons of nitrogen (N) fertilizers were applied in China, where wheat production accounts for 13.5% of this N consumption (Heffer et al., 2017). Less than 50% of the N applied to farmland is recovered in crop plants (West et al., 2014). The excess N could be responsible for air pollution, soil acidification, water quality degradation, and increased greenhouse gas emission (Guo et al., 2010; Jiao, 2010; Zhang et al., 2015; Cui et al., 2018). The Huang-Huai-Hai Plain of China (HPC) is the major region of crop production in China, producing more than 70% of domestic wheat (National Bureau of Statistics of China, 2021). In the HPC, the water consumption of high-yielding winter wheat is about 450−650 mm (Huang et al., 2016). Nevertheless, rainfall during wheat-growing season can merely meet 25%−40% of crop water requirement (Zhang et al., 2006). That means additional irrigation is required. However, in farmer’s fields, excessive and irregular irrigation usually results in severe water waste and unsustainable grain yield (Guo et al., 2014; Man et al., 2015). Hence, optimized management strategies will be needed to improve wheat yield, N use efficiency (NUE), and water productivity (WP) while minimizing adverse environmental impacts.
Crop production alters N balance in aboveground N uptake (AGN), soil inorganic N residue (INR), and inorganic N loss (INL), ultimately affecting NUE and environmental health (Puntel et al., 2016; Liu et al., 2018; Li et al., 2022). The better N balance implies higher NUE and lower N loss. In the HPC, winter wheat–summer maize rotation is the predominant cropping system. In this system, poor uptake and utilization of residual soil nitrate N after harvest (Ju et al., 2006; Lu et al., 2021) leads to resource waste and environmental pollution. Numerous studies have shown that the proper management strategy can increase AGN or NUE, including optimized N management (Hartmann et al., 2015; Lu et al., 2015), proper irrigation (Wang et al., 2014; Ye et al., 2022), and appropriate seeding rate (Dai et al., 2013; Dai et al., 2014), thereby reducing INR and INL. In addition, the N nutrition index (NNI) can be used as an indicator of N uptake at canopy level (Lemaire et al., 2008). Agronomic practices such as fertilization and irrigation management can easily influence NNI (Lemaire and Gastal, 1997). Furthermore, many previous studies have demonstrated that the correlation between NUE and NNI was significantly negative (Dordas, 2011; Hu et al., 2014).
Root distribution directly affects crop nutrient uptake and soil water absorption. The cultivar, soil type, and fertilization and irrigation management practices can significantly affect the growth and spatial distribution of root systems (Dai et al., 2014; Wang et al., 2014; Man et al., 2016; Dai et al., 2017; Feng et al., 2023). A larger root system can commonly lead to the increases in total water consumption through the increases in extraction of the stored soil water (Cooper et al., 1987). The increased water absorption from the deep soil may be helpful for wheat canopy to maintain grain production (Walter and Moril, 2005). Therefore, optimizing the vertical distribution of wheat root system is important to improve the grain yield and WP.
Wheat production is influenced by a combination of various cultivation factors. To determine the effects of combined cultivation factors is more representative for wheat production studies. The integrated management strategy is defined as a comprehensive management framework including appropriate variety, sowing date, seeding rate, and fertilization and irrigation management (Chen et al., 2011; Chen et al., 2014; Cui et al., 2018). The better performance in terms of grain yield and resource efficiency has been achieved (Xu H. C. et al., 2018; Cheng et al., 2020). In an earlier study, we have elucidated the differences in wheat grain yield formation and N use under four integrated management treatments (Xu H. C. et al., 2018). However, the effects of integrated management practices on N balance and water utilization are poorly understood.
Therefore, we wonder whether the optimized management strategy could promote N balance and improve WP while increasing grain yield and NUE in winter wheat. We evaluated the effects of integrated management strategy on crop N accumulation and redistribution, crop N status, direction and proportion of soil inorganic N, soil water consumption, and WP. The objective of the present study was to determine whether the optimized management strategy could increase grain yield, promote N balance, and improve NUE and WP in the target region.
2 Materials and methods
2.1 Site description
As a part of a long-term field experiment with wheat starting in 2009, field experiments were conducted from 2012 to 2015 in Tai’an, Shandong Province, China (35°58′N, 117°03′E), which experiences a temperate continental monsoon climate. The annual cumulative temperature above 10°C and solar duration were at least 4,213°C and 2,627 h, respectively. The frost-free period in 1 year was 195 days. The annual average precipitation and rainfall during wheat grown season between 1981 and 2012 were 754.34 and 193.63 mm. The soil was sandy loam. Organic matter, total N, available phosphorous (P), and available potassium (K) in the upper 0.2 m of the soil before sowing in 2012−2013, 2013−2014, and 2014−2015 are shown in Table 1. The winter wheat–summer maize rotation was performed in this area. The previous summer maize straw was returned to the soil every year. Precipitation during the three wheat-growing seasons was 157.20, 132.40, and 164.30 mm, respectively (Figure 1). All meteorological data were collected from an automatic weather station (CR800 data logger, Campbell Scientific, Rockford, IL, USA).
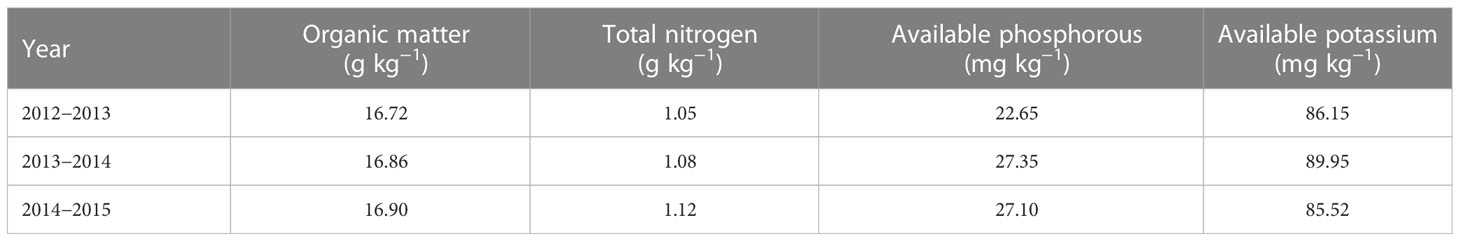
Table 1 Nutrient status of top 0- to 20-cm soil before sowing in 2012−2013, 2013−2014, and 2014−2015 growing seasons.
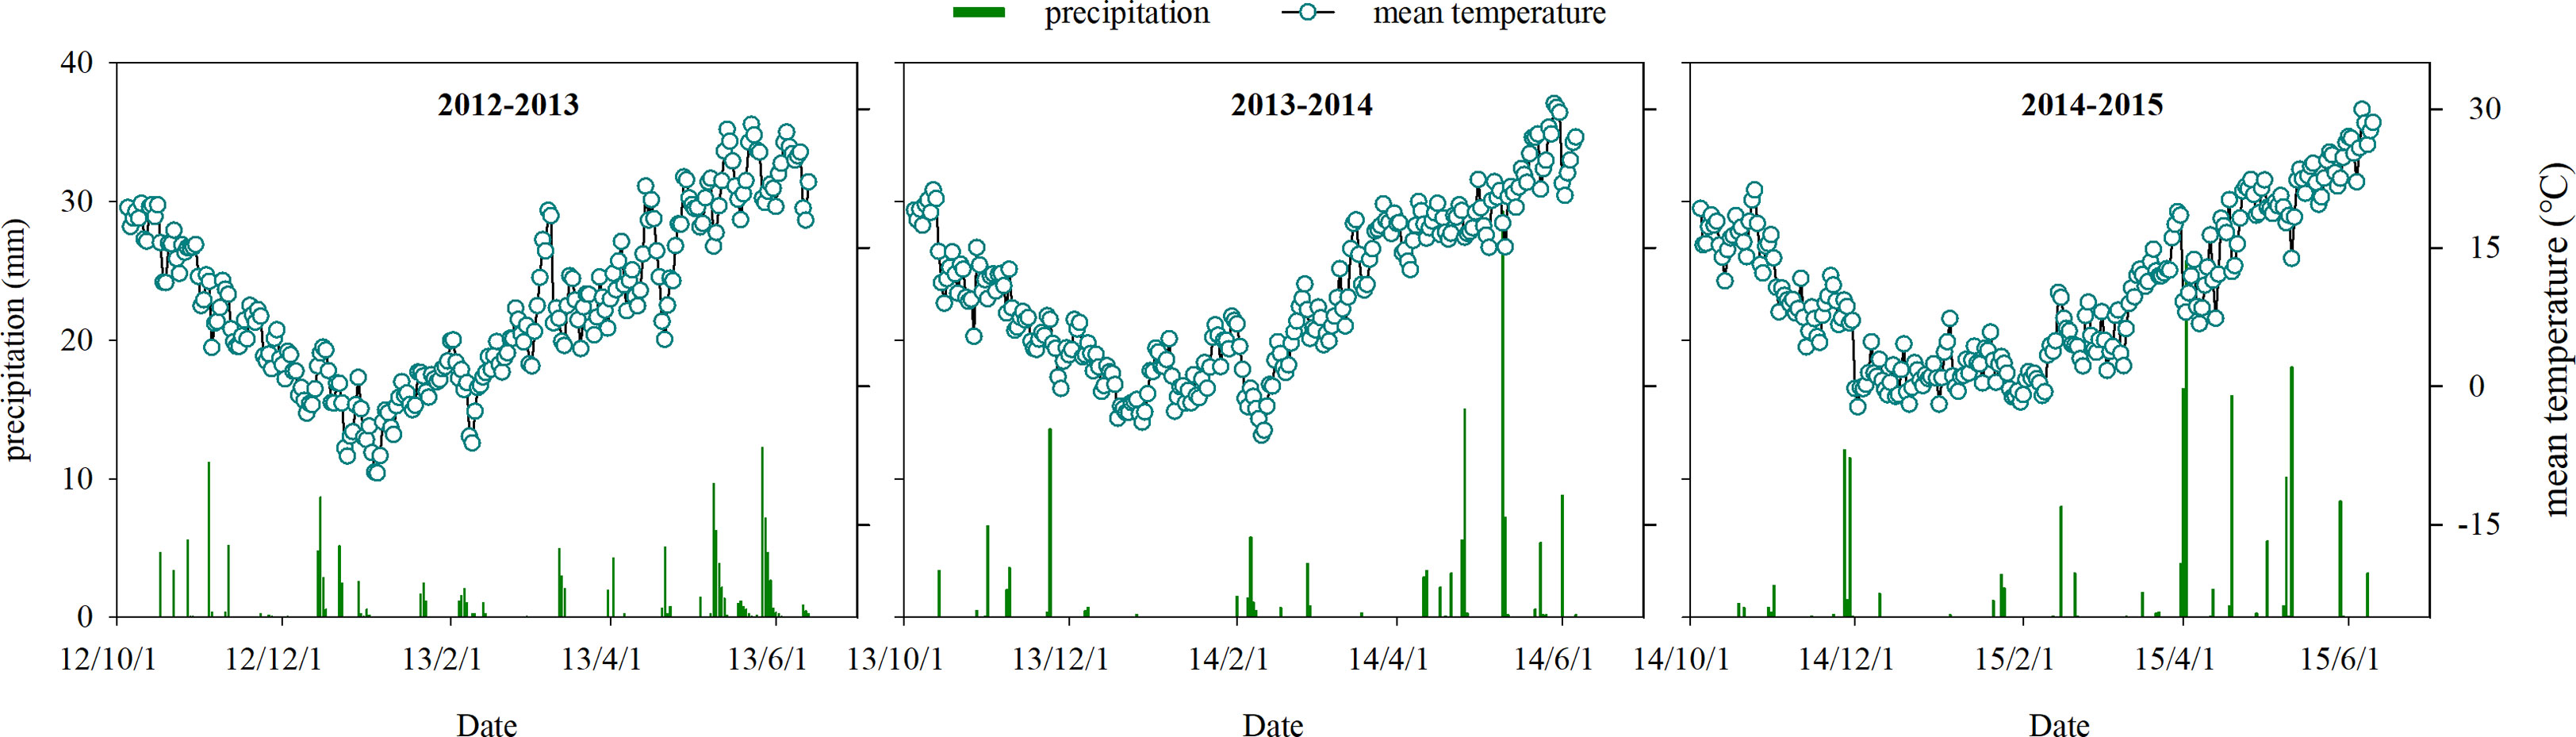
Figure 1 The mean temperature and precipitation recorded during the 2012 to 2015 wheat-growing seasons in experimental fields.
2.2 Experimental design
The following four integrated management treatments were included in a randomized complete block design with four replicates: CP (conventional practice treatment), ICP (improvement of conventional practice treatment), HY (high-yield management treatment), and ISM (integrated soil and crop system management treatment) were carried out. For CP, the conventional planting practices of the local farmers were conducted; for ICP, it was based on improving conventional farmers’ practices in the region, mostly through increasing seeding rate, delaying sowing date, and decreasing fertilizer rate and irrigation amount, to increase wheat yield and improve resource efficiency; for HY, the purpose was to test wheat yield potential by adjusting the management practices such as further increased seeding rate, further increased fertilizer rate, and revised fertilization timing, regardless of the resource inputs cost; for ISM, the whole wheat production system based on the local environment was redesigned, drawing on appropriate delayed sowing date, a higher seeding rate, and lower fertilizer or irrigation input compared with HY. The size of each experimental plot was 120 m2 (3 × 40 m) with 12 rows (0.25 m apart). The widely planted winter wheat variety “Tainong 18”, which was the cultivar with large ears and low tillering capacity, was grown in the field.
The combination details of sowing date, seeding rate, and fertilization and irrigation management are shown in Table 2. Sowing dates for the four integrated treatments were 5, 8, 8, and 12 October, respectively. Seeding rates increased by 75 seeds m−2 with each integrated treatment from CP (225 seeds m−2) to ISM (450 seeds m−2). Urea, calcium superphosphate, and potassium chloride were used as the N, P, and K fertilizers. For each treatment, 210−315 kg N ha−1, 90−210 kg P2O5 ha−1, and 30−150 kg K2O ha−1 were applied. N topdressing for CP was applied at the regreening stage, whereas that for ICP, HY, and ISM was applied at the jointing stage. The basal and topdressing ratios of N fertilizer for four integrated treatments were 6:4, 5:5, 4:6, and 4:6, respectively. P fertilizers were applied as basal fertilizers prior to wheat drilling for all integrated treatments. K fertilizers for both CP and ICP were applied as basal fertilizers. K topdressing for HY and ISM were applied at jointing stage, and the basal and topdressing ratios of K fertilizer for both HY and ISM were 6:4. Over 3 years, CP was irrigated five times (post-sowing, before winter, regreening, anthesis, and anthesis + 15 days), and ICP and HY were irrigated four times (post-sowing, jointing, anthesis, and anthesis + 15 days). ISM was irrigated four times (post-sowing, jointing, anthesis, and anthesis + 15 days) in 2012−2013 and 2013−2014 and was irrigated three times (post-sowing, jointing, and anthesis) in 2014−2015. The amount of irrigation was 70 mm each time, which was measured by a water meter. No significant incidences of weeds, pests, or diseases were observed in each plot. In addition, treatment plots with no applied N were established. All conditions were the same as described above, except for N application.
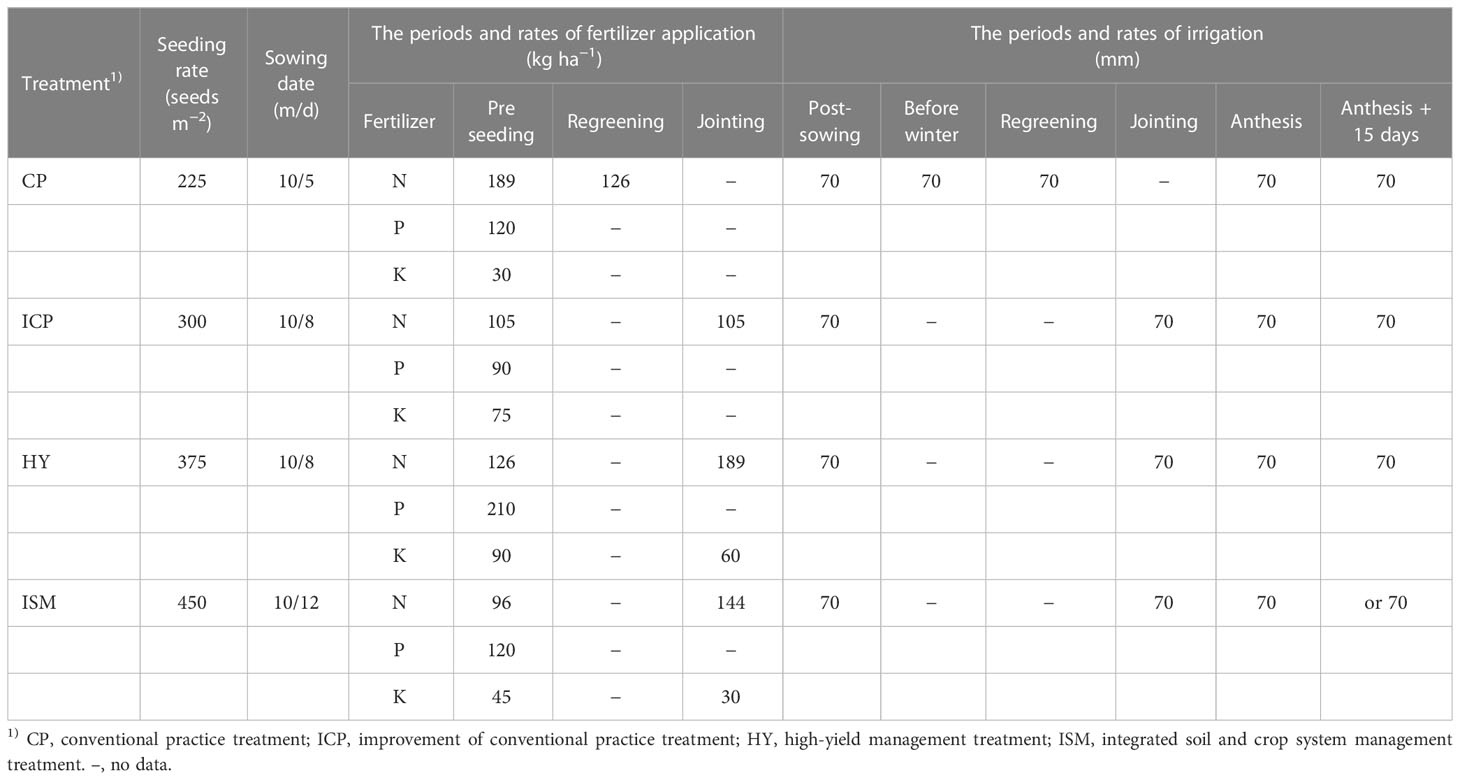
Table 2 The seeding rate, sowing date, nutrients, and irrigation management used in the different integrated treatments.
2.3 Sampling and measurements
2.3.1 N accumulation and transport
The representative plants from a 1.0-m2 quadrat in each plot were collected at anthesis and maturity. Samples were divided into leaves, stems + sheaths, spikes (ear rachises + glumes), and grains (only at maturity). The wheat plant components were dried at 105°C for 15 min, oven-dried at 70°C until constant weight, and subsequently weighed. N concentration was determined using the Kjeldahl method (Bremner and Tabatabai, 1972). N accumulation of each wheat plant component was calculated by obtaining the product of dry matter weight and N concentration. The AGN (kg ha−1) was calculated as the sum of N accumulation of the measured wheat plant components. NNI was estimated according to the ratio of the actual plant N concentration and the critical N concentration at anthesis, where the latter was estimated according to the dilution curve for winter wheat described by Justes et al. (1994). Post-anthesis N remobilization (NR; kg ha−1), post-anthesis N uptake (PANU; kg ha−1), NR efficiency (NRE; %), and contribution proportion of NR and PANU to N accumulation in grains (N-grain; kg ha−1) were calculated as described by Moll et al. (1982) and Gaju et al. (2014), as follows:
where NA is the N accumulation in the crop component at anthesis (kg ha−1), NM is the N accumulation in the crop component at maturity (kg ha−1), AGNM is the AGN at maturity (kg ha−1), AGNA is the AGN at anthesis (kg ha−1), CPNR is the contribution proportion of NR to N-grain (%), and CPPANU is the contribution proportion of PANU to N-grain (%).
2.3.2 Soil inorganic N
Soil samples were collected from each treatment plot at random with 0.2-m increments up to a depth of 1 m prior to wheat drilling and at maturity. Following the method described by Liu et al. (2003), the fresh soil samples collected from the same depth in each treatment plot were pooled and extracted immediately with KCl solution (1 mol L−1) to determine inorganic N (nitrate N and ammonium N) concentrations by using a continuous flow analyzer (Bran + Lubbe, Norderstedt, Germany). Available N was calculated as the sum of fertilizer N and INR in 0- to 100-cm-depth soil before sowing.
2.3.3 N balance
The apparent N mineralization (ANM; kg ha−1) was calculated as the difference between the N output and N input in the plots without N fertilizer application (Olfs et al., 2005), as follows:
The INL (kg ha−1) was calculated as the difference between the N input and the N output in the plots where N was applied (Yin et al., 2018), as follows:
where INRM is the INR at maturity (kg ha−1), INRS is the INR before sowing (kg ha−1), NFA is the N fertilizer amount (kg ha−1).
2.3.4 Soil water consumption and total water consumption
Soil moisture was measured with 0.2-m increments up to a depth of 2 m in each plot by using a time domain reflectometry (Trime-Pico, Germany). The soil water consumption in the 0- to 2-m-depth soil was calculated as the difference between the soil water content before sowing and at maturity. At the study site, groundwater runoff and recharge can be ignored. Total water consumption was calculated as the sum of seasonal precipitation, irrigation amount, and soil water consumption (Li et al., 2019).
2.3.5 Root length
Roots measurements were made only in 2014−2015. Root sampling was conducted at anthesis stage. In each integrated treatment, we sampled roots from a representative area of the site occupied by a group of wheat plants. The area was 0.4 m wide (measured parallel to the rows) and 0.5 m long (measured perpendicular to the rows and covering wheat plants in two rows). Each cubic soil sample was divided into 0.2-m increments to a depth of 1.4 m. All root samples were sorted by washing out any soil and dyed immediately with methyl blue for 12 h. The root samples were scanned with a flatbed scanner (HP Scanjet 8200, Hewlett–Packard, Palo Alto, CA, USA) and were analyzed with an image analyzer (Delta-T Devices Ltd, Cambridge, UK) to measure the root lengths, consistent with Dai et al. (2013; 2014). Root length density (RLD; mm cm−3) was calculated as the total length of roots divided by the corresponding soil volume. The depths above which 95% of the roots were located (D95) were calculated to summarize the vertical distribution of RLD (Hund et al., 2009) and were calculated as described by Dai et al. (2014).
2.3.6 Grain yield, N utilization, and water productivity
Grain yield was determined from a 3-m2 quadrat (with six rows, 2 m apart) in each experimental plot at maturity. The wheat grain was naturally air-dried, weighed, and then adjusted to the standard 13% moisture content. NUE (kg kg−1) was defined as the grain yield per unit available N (Moll et al., 1982). N fertilizer productivity (NFP; kg kg−1) was defined as the grain yield per unit fertilizer N. WP (kg ha−1 mm−1) was calculated by dividing the grain yield by total water consumption (Xu X. X. et al., 2018).
2.4 Statistical analysis
Statistical analysis was performed with DPS version 7.05 software (Hangzhou Ruifeng Information Technology Co., Ltd., China). Multiple comparisons were performed after a preliminary F-test. Differences between means were evaluated on the basis of the least significant difference at P< 0.05. Drawing figures were conducted by using SigmaPlot 12.5 (Systat Software, San Jose, CA, USA).
3 Results
3.1 N accumulation and partitioning at anthesis
Year and treatment significantly affected AGNA, whereas their interaction did not. Over 3 years, AGNA among the integrated treatments followed the ranking HY > ISM > ICP ≈ CP (Table 3). HY consistently achieved the highest AGNA. No remarkable difference in AGNA was observed between CP and ICP. The average AGNA for ISM was 84.73% of that for HY and was 12.07% higher than that for CP.
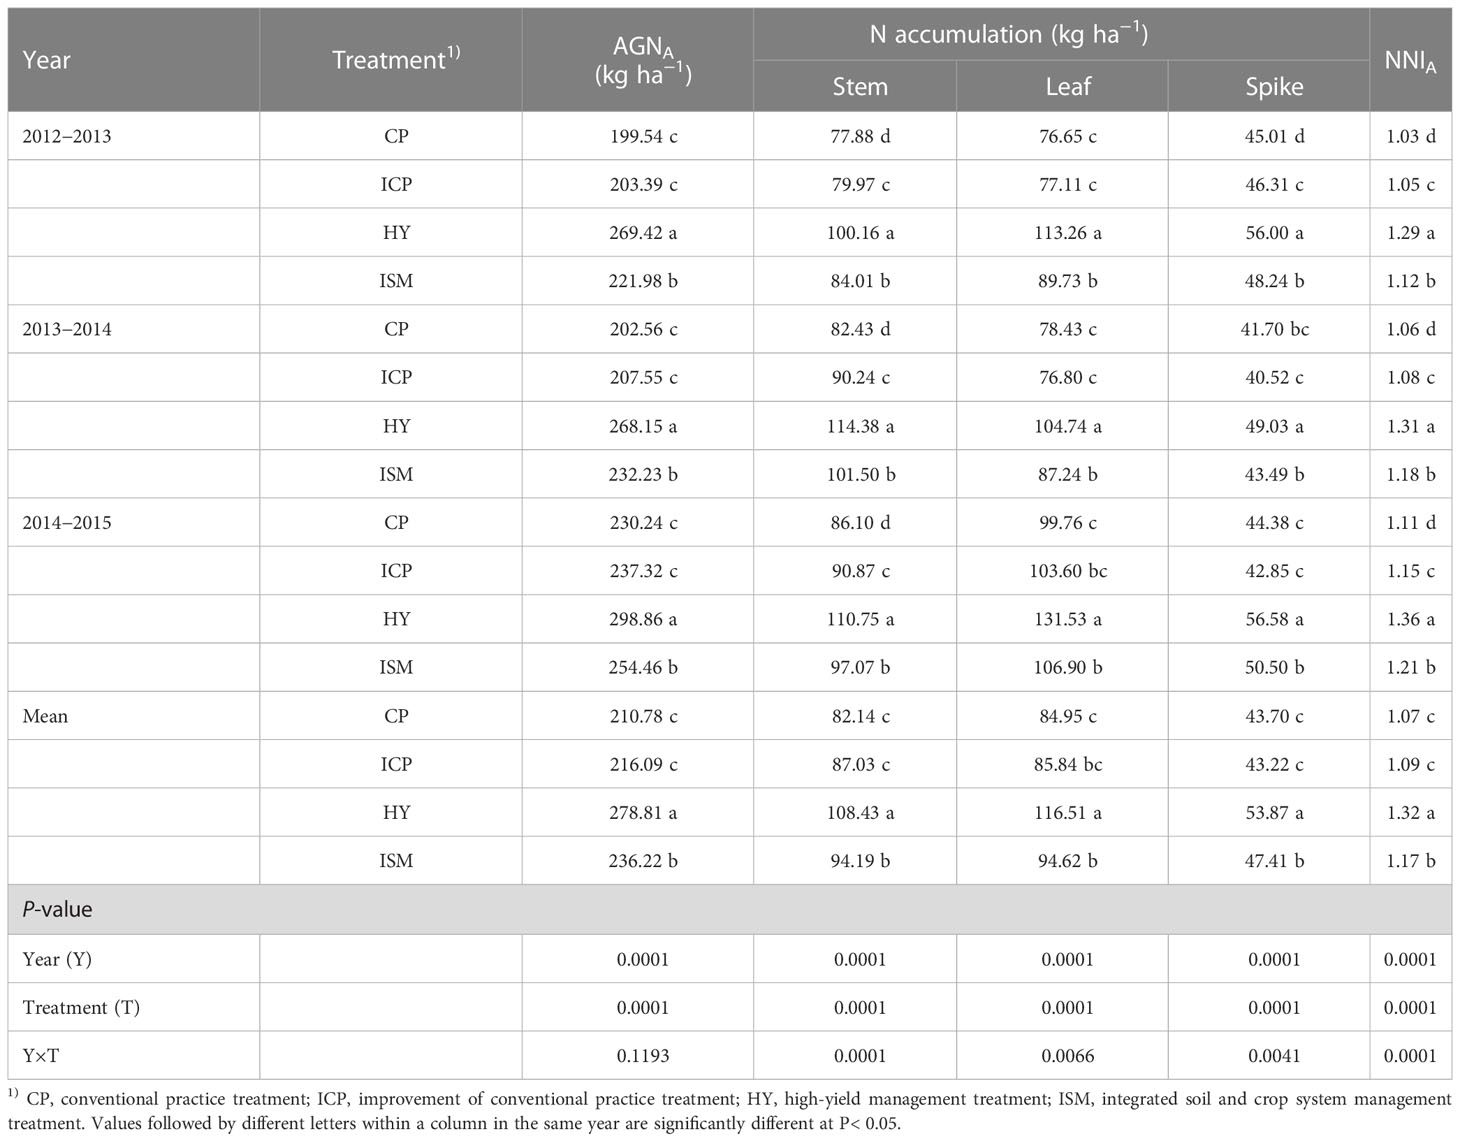
Table 3 N accumulation in crop components, aboveground N uptake (AGNA), and N nutrition index (NNIA) at anthesis under different integrated treatments from 2012 to 2015.
The effects of treatment, year, and their interaction on N accumulation in crop components and NNI at anthesis (NNIA) were significant (Table 3). Over 3 years, the stem N among the integrated treatments had the following rank order: HY > ISM > ICP > CP. For the leaf N, the order was HY > ISM ≥ ICP ≈ CP. For the spike N, the order was HY > ISM ≥ ICP ≥ CP. The N accumulation in all crop components was the highest for HY, followed by ISM, and the lowest for CP. NNIA was used as an indicator of N uptake at canopy level incurred by the integrated treatments. Over 3 years, NNIA among all integrated treatments followed the ranking HY > ISM > ICP > CP. The values of NNI were all more than 1, which indicated that wheat grown under all the integrated treatments was in situation of a luxury N consumption.
3.2 N remobilization and post-anthesis N uptake
Year, treatment, and their interaction significantly affected N accumulation in grains (N-grain) at maturity. N-grain among the integrated treatments followed the ranking HY > ISM > ICP > CP. The average N-grain for ISM was 91.80% of that for HY and was 9.63% and 26.43% higher than that for ICP and CP, respectively (Table 4).
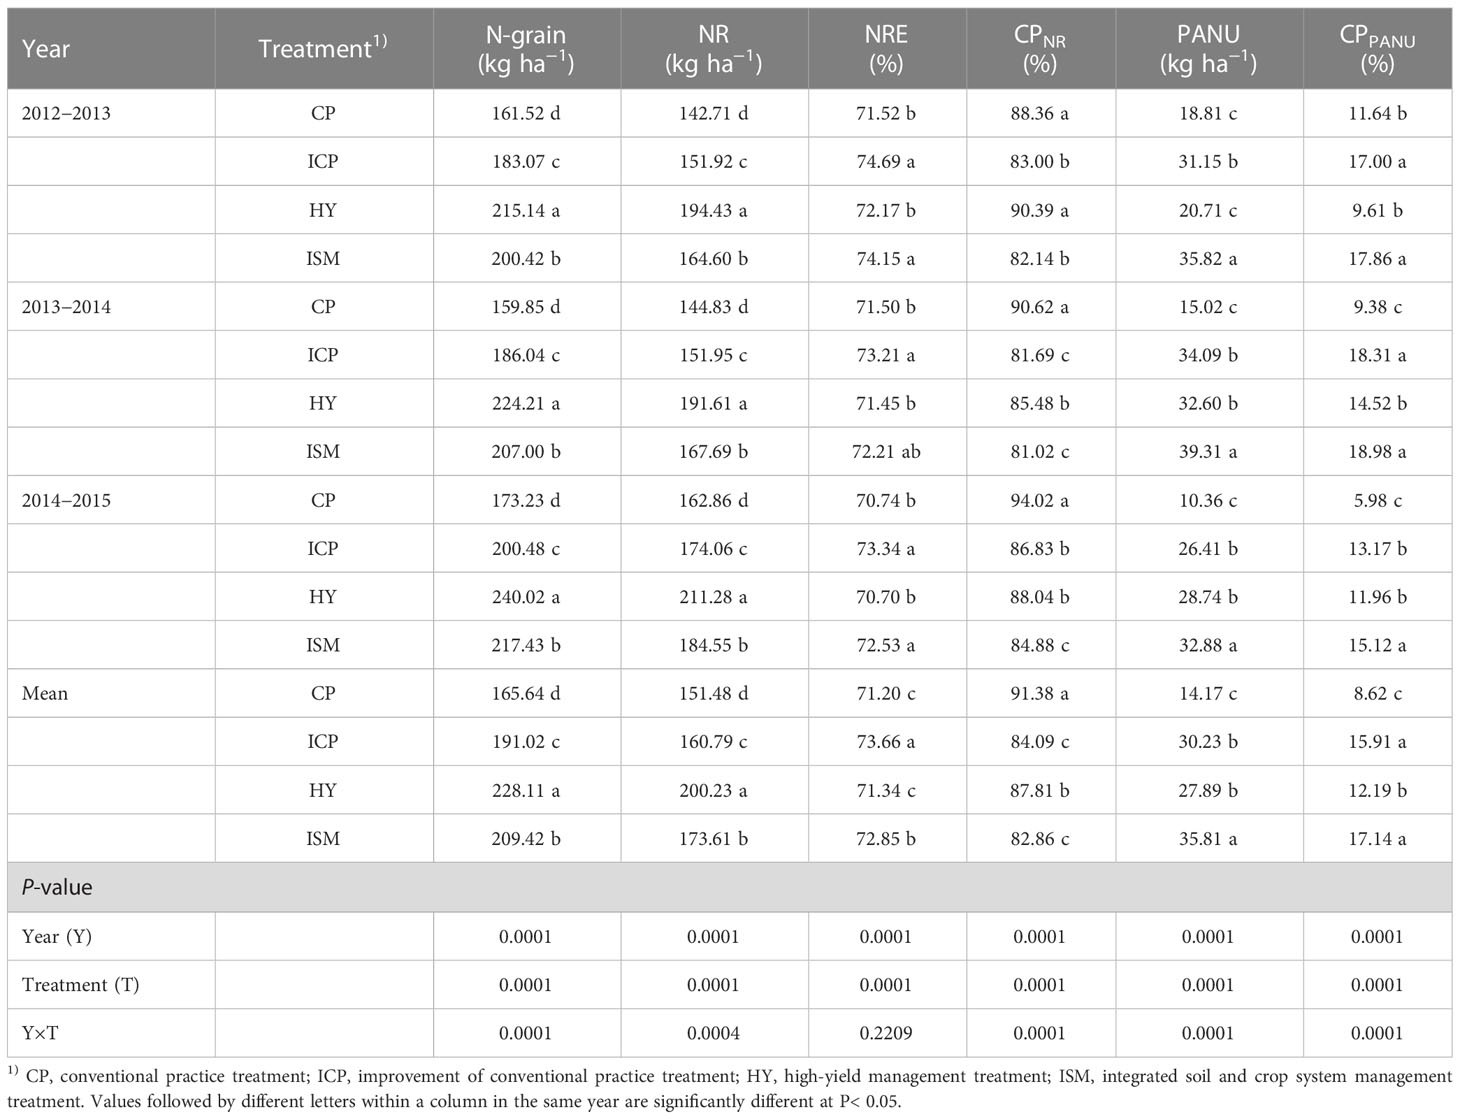
Table 4 N accumulation in grains (N-grain), N remobilization (NR), N remobilization efficiency (NRE), post-anthesis N uptake (PANU), contribution proportion of NR to N-grain (CPNR), and contribution proportion of PANU to N-grain (CPPANU) under different integrated treatments from 2012 to 2015.
The effects of treatment, year, and their interaction on post-anthesis NR were significant (Table 4). Over 3 years, NR among the integrated treatments exhibited the same rank order as N-grain. The average NR for ISM was 86.71% of that for HY and was 7.98% and 14.61% higher than that for ICP and CP, respectively. Year and treatment significantly affected NRE, whereas their interaction did not. Over 3 years, the NRE was the largest for ICP and ISM and the smallest for CP and HY. No remarkable differences in NRE were observed between ICP and ISM and between CP and HY. The average NRE for ISM was 2.12% and 2.32% higher than that for HY and CP, respectively. Year, treatment, and their interaction significantly affected the contribution proportion of NR to N-grain (CPNR). The CPNR was the largest for CP and the smallest for ISM. The CPNR obtained with HY in 2012−2013 and 2013−2014, respectively, was significantly higher than that with ICP, whereas no remarkable difference in CPNR was observed between ICP and HY in 2014−2015. The effects of treatment, year, and their interaction on PANU and the contribution proportion of PANU to N-grain (CPPANU) were significant (Table 4). PANU for the integrated treatments followed a similar ranking of ISM > ICP ≈ HY > CP in 2013−2014 and 2014−2015 except in 2012−2013, where the ranking of treatments was ISM > ICP > HY ≈ CP. The average PANU across 3 years for ISM was significantly higher than that for ICP, HY, and CP by 18.43%, 28.40%, and 152.76%, respectively. The CPPANU was the largest for ISM and the smallest for CP. The CPPANU obtained with ICP in 2012−2013 and 2013−2014, respectively, was significantly higher than that with HY, whereas no remarkable difference in CPPANU was observed between ICP and HY in 2014−2015. The average CPPANU for ISM was 7.75%, 40.59%, and 98.75% higher than that for ICP, HY, and CP, respectively. These results showed that the highest NR was the main reason HY produced the highest N-grain. ISM increased N-grain mainly due to the increases in both NR and PANU and the improvement of NRE compared with CP and ICP.
3.3 N balance
The effects of treatment, year, and their interaction on ANM and INRS were significant (Table 5). The ANM among all integrated treatments had the following rank order: HY > ISM > ICP ≥ CP. Over 3 years, the INRS was the highest for HY and the lowest for ICP. The INRS obtained with ISM in 2012−2013 was significantly higher than that with ICP, whereas no remarkable differences in INRS were observed between ISM and ICP in 2013−2014 and 2014−2015. The average INRS for ISM was 23.24% and 14.27% lower than that for HY and CP, respectively.
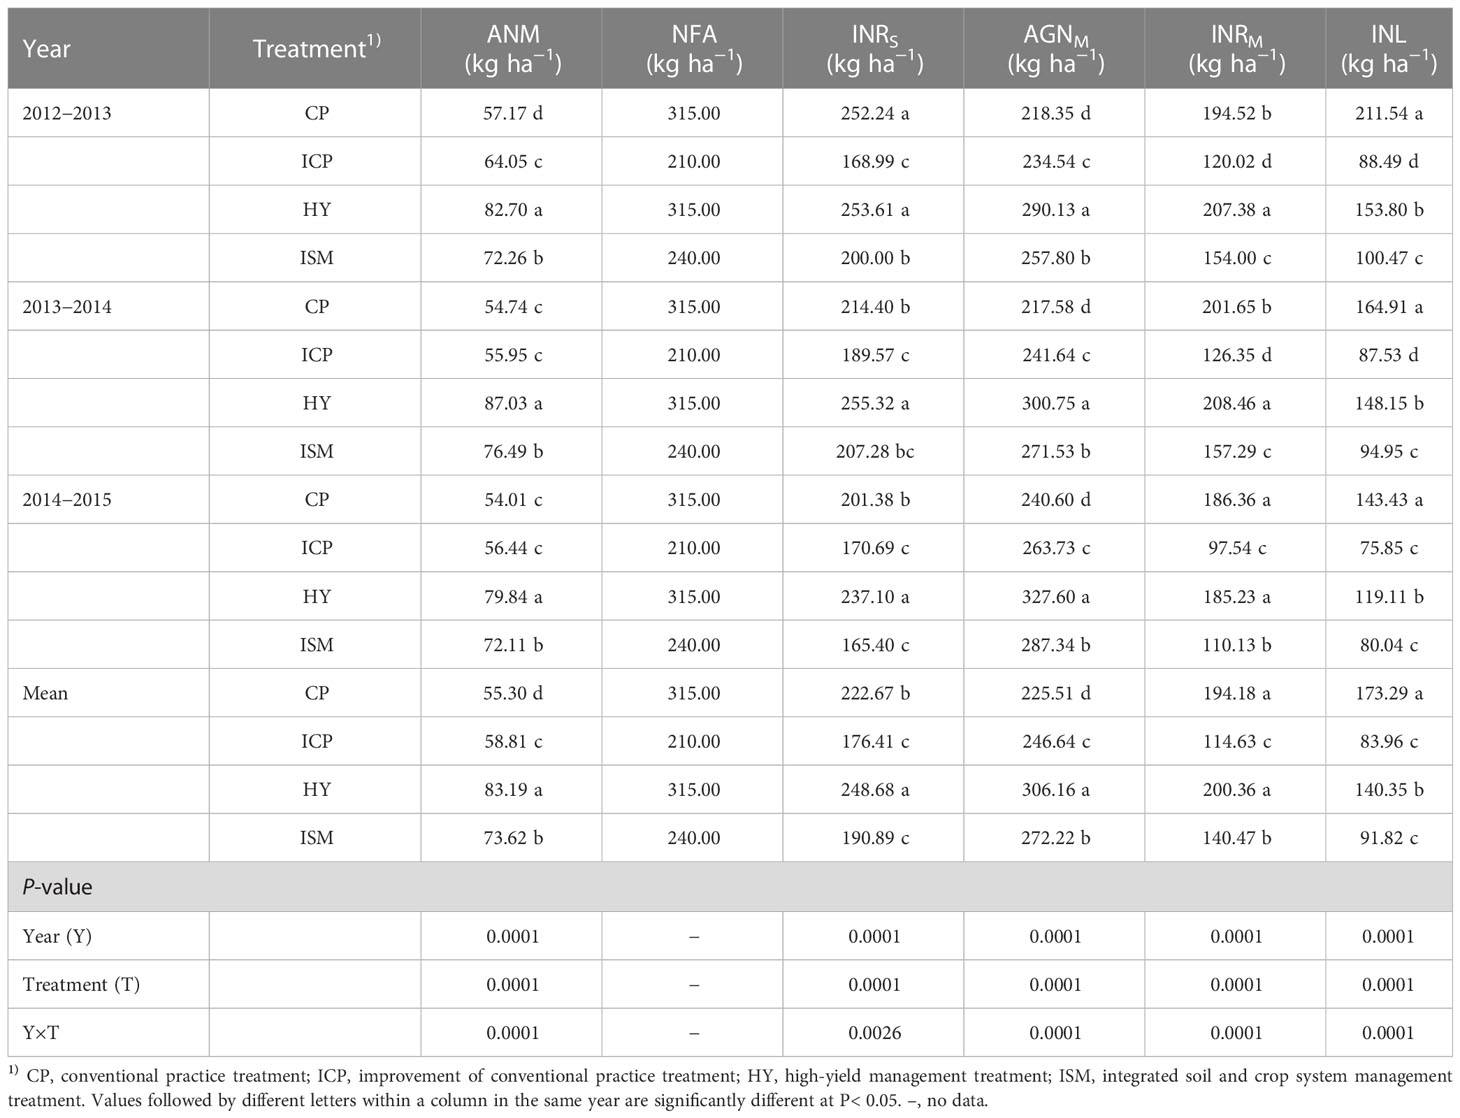
Table 5 Apparent N mineralization (ANM), N fertilizer amount (NFA), inorganic N residue before sowing (INRS), aboveground N uptake at maturity (AGNM), inorganic N residue at maturity (INRM), and inorganic N loss (INL) under different integrated treatments from 2012 to 2015.
The direction of soil inorganic N can be divided into three parts: AGNM, INRM, and INL (Figure 2 and Table 5). Significant effects of treatment, year, and their interaction on AGNM, INRM, and INL were observed. Over 3 years, AGNM among the integrated treatments followed the ranking HY > ISM > ICP > CP. The average AGNM for ISM was 88.92% of that for HY and was 10.37% and 20.71% higher than that for ICP and CP, respectively. INRM among all integrated treatments had the following rank order: HY ≥ CP > ISM > ICP. INRM obtained with HY in 2012−2013 and 2013−2014 was significantly higher than that with CP, whereas no remarkable difference in INRM was observed between HY and CP in 2014−2015. The average INRM for ISM was 29.89% and 27.66% lower than that for HY and CP, respectively. INL among the integrated treatments followed the ranking CP > HY > ISM ≥ ICP. The INL obtained with ISM in 2012−2013 and 2013−2014, respectively, was significantly higher than that with ICP, whereas no remarkable difference in INL was observed between ISM and ICP in 2014−2015. The average INL for ISM was significantly lower than that for HY and CP by 34.58% and 47.01%, respectively. These indicated that the integrated management strategy used under ISM supported better N balance by producing a high level of AGNM and decreasing INRM and INL compared with HY and CP.
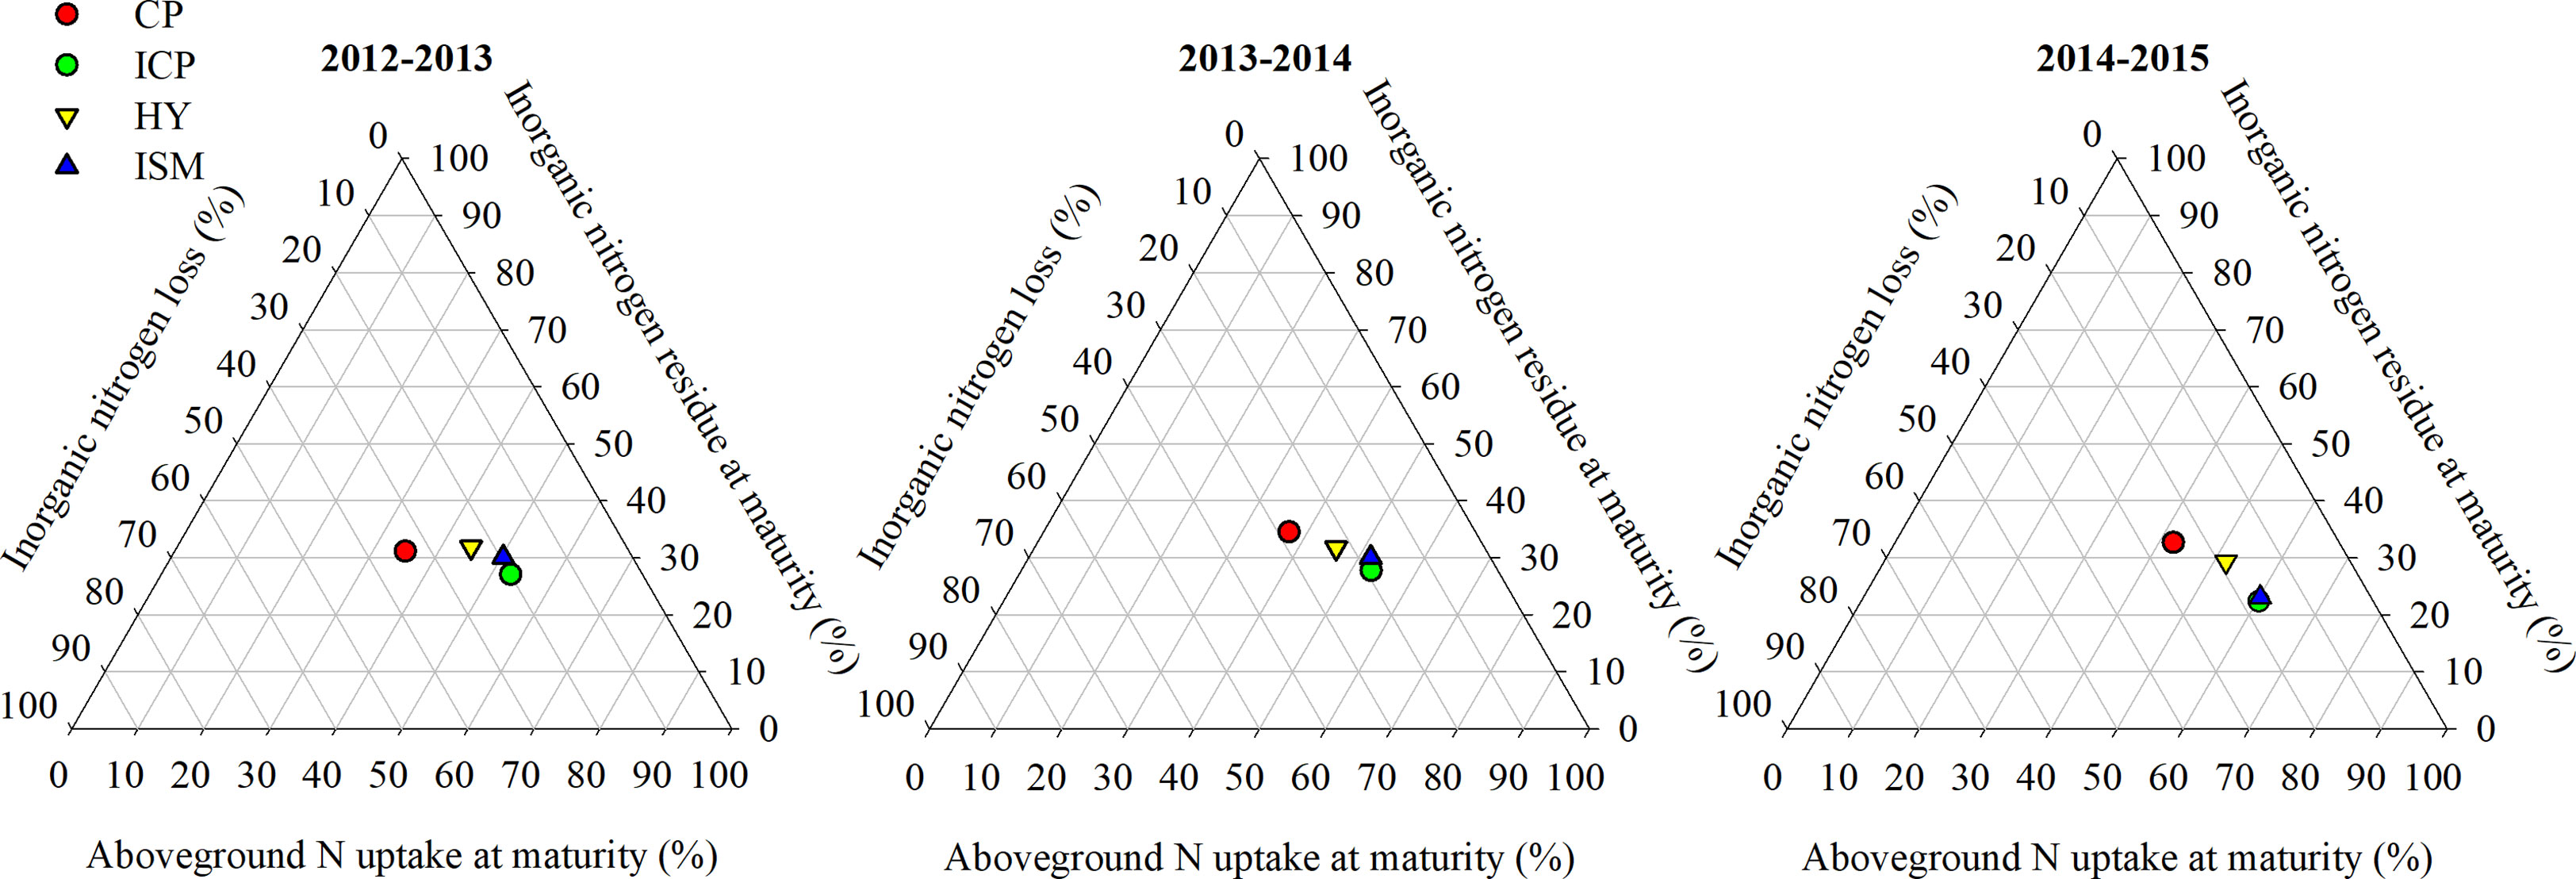
Figure 2 Direction and proportion of soil inorganic N under different integrated treatments from 2012 to 2015. CP, conventional practice treatment; ICP, improvement of conventional practice treatment; HY, high-yield management treatment; ISM, integrated soil and crop system management treatment.
3.4 Total water consumption and soil water consumption
Integrated treatments had a significant effect on total water consumption and soil water consumption in 0- to 200-cm-depth soil (Figure 3). In 2013−2014, total water consumption in ISM was 3.56% higher than that in ICP and was 3.88% and 6.20% lower than that in HY and CP, respectively. The soil water consumption in ISM was 24.64% lower than that in HY but was 38.51% and 202.26% higher than that in ICP and CP, respectively. In 2014−2015, the total water consumption in ISM was significantly lower than that in ICP, HY, and CP by 6.44%, 10.46%, and 15.03%, respectively. However, the soil water consumption in ISM was 21.89%, 75.55%, and 190.32% higher than that in HY, ICP, and CP, respectively. Over 2 years, the soil water consumption in the 0- to 200-cm soil layer obtained with ISM and HY was consistently higher than that with ICP and CP (Figure 4). The lowest soil water consumption in each soil layer was obtained with CP. We observed no significant differences in soil water consumption in the 100- to 200-cm soil layer between ISM and HY. However, inconsistent trends between HY and ISM over 2 years were observed. The soil water consumption in the 0- to 80-cm soil layer for ISM was lower than that for HY in 2013−2014 but was significantly higher than that for HY in 2014−2015. Compared with HY, the soil water consumption for ISM was remarkably higher in the 60- to 100-cm soil layer in 2014−2015. That is, ISM significantly increased the absorption of deep soil water.
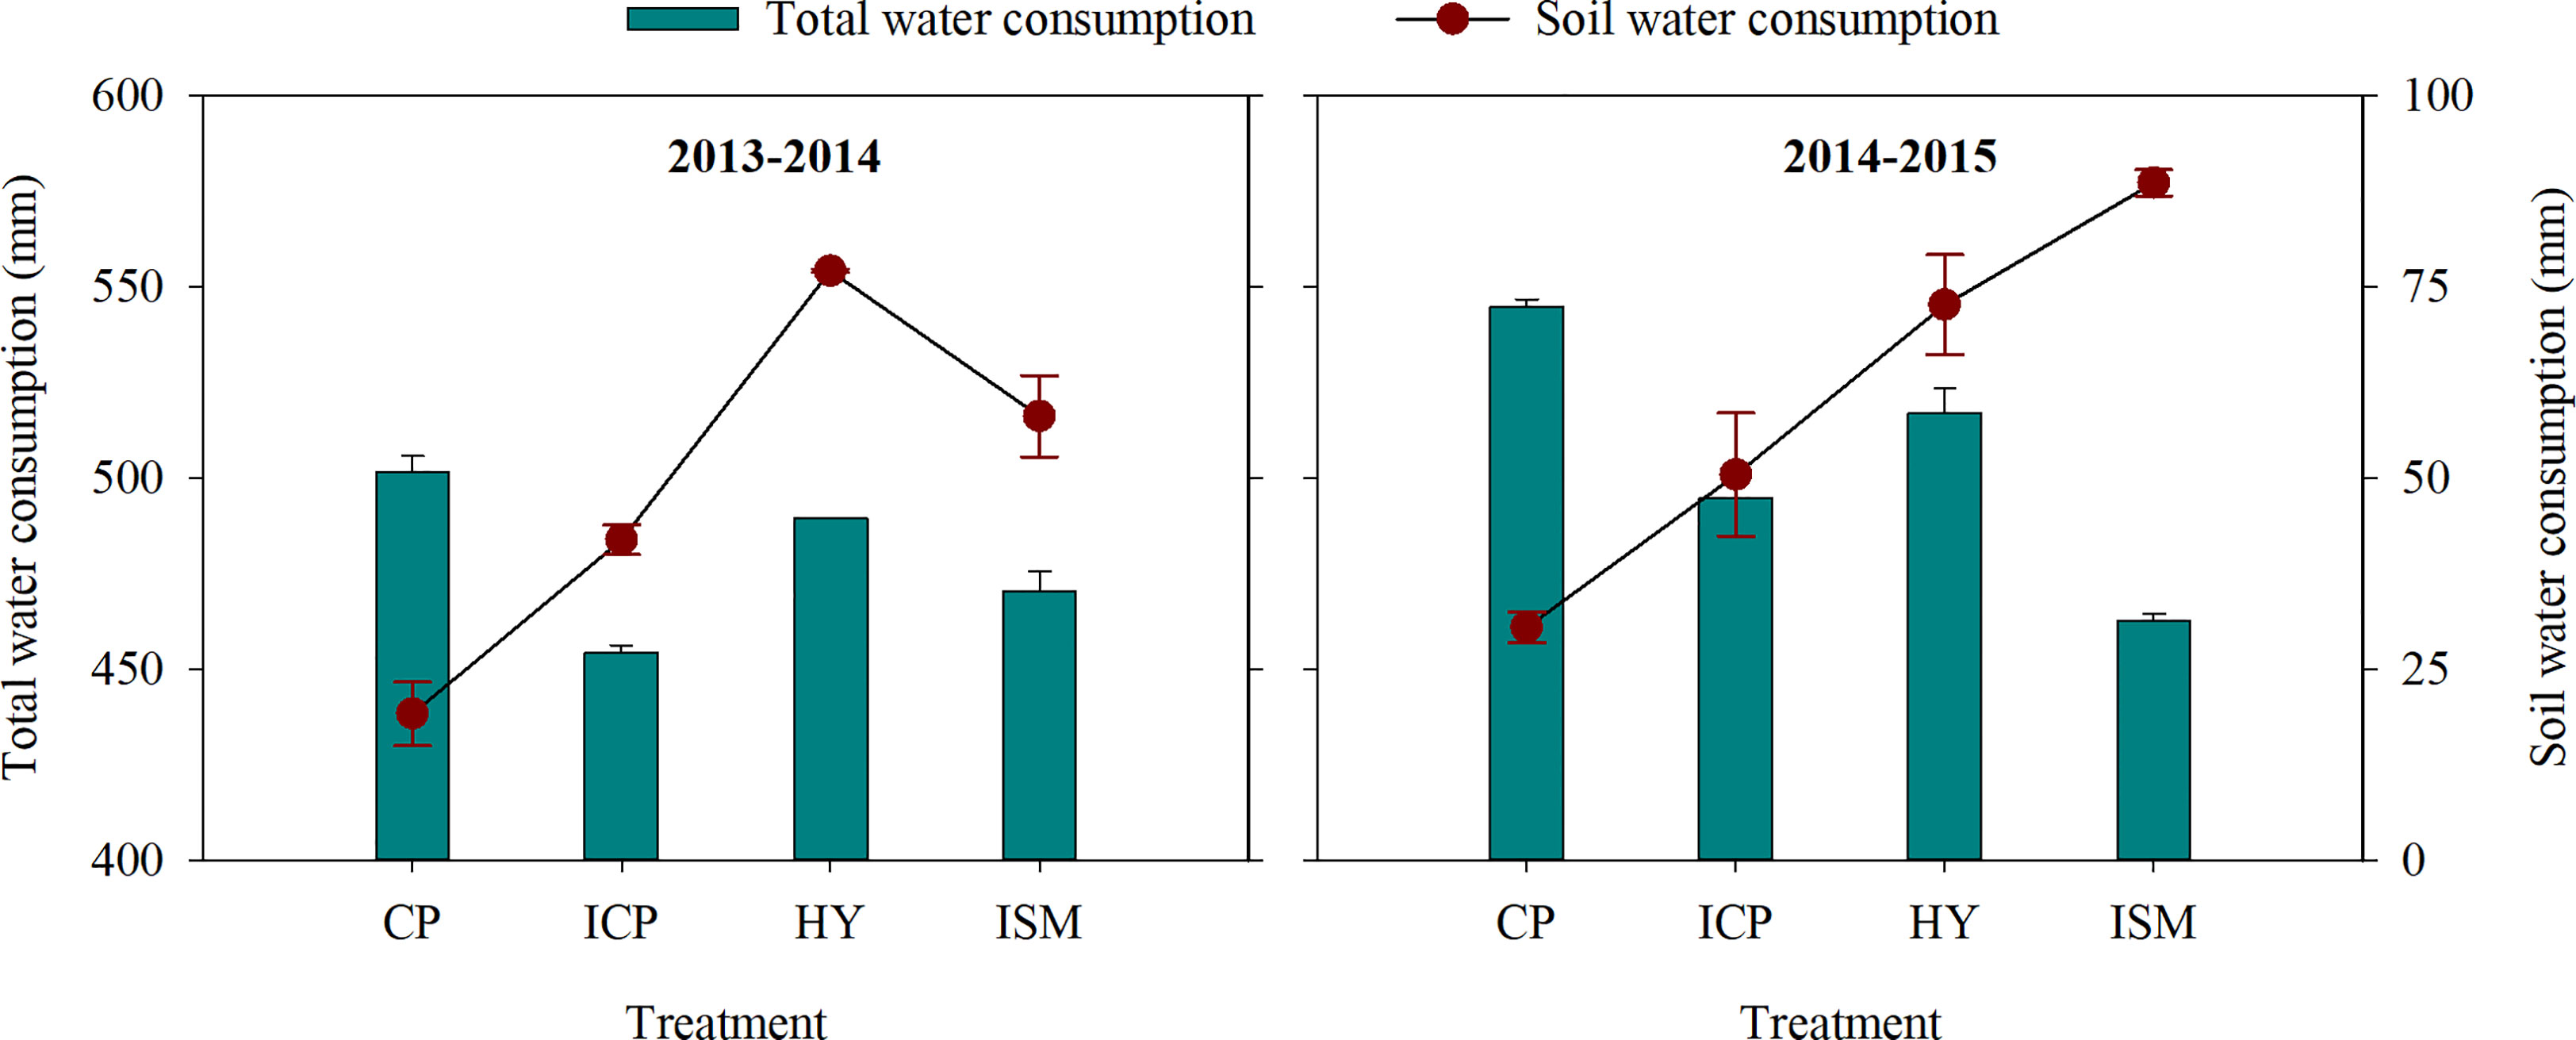
Figure 3 Total water consumption and soil water consumption during the entire growing season under different integrated treatments in 2013−2014 and 2014−2015. CP, conventional practice treatment; ICP, improvement of conventional practice treatment; HY, high-yield management treatment; ISM, integrated soil and crop system management treatment. Error bars represent the standard deviation of the mean.
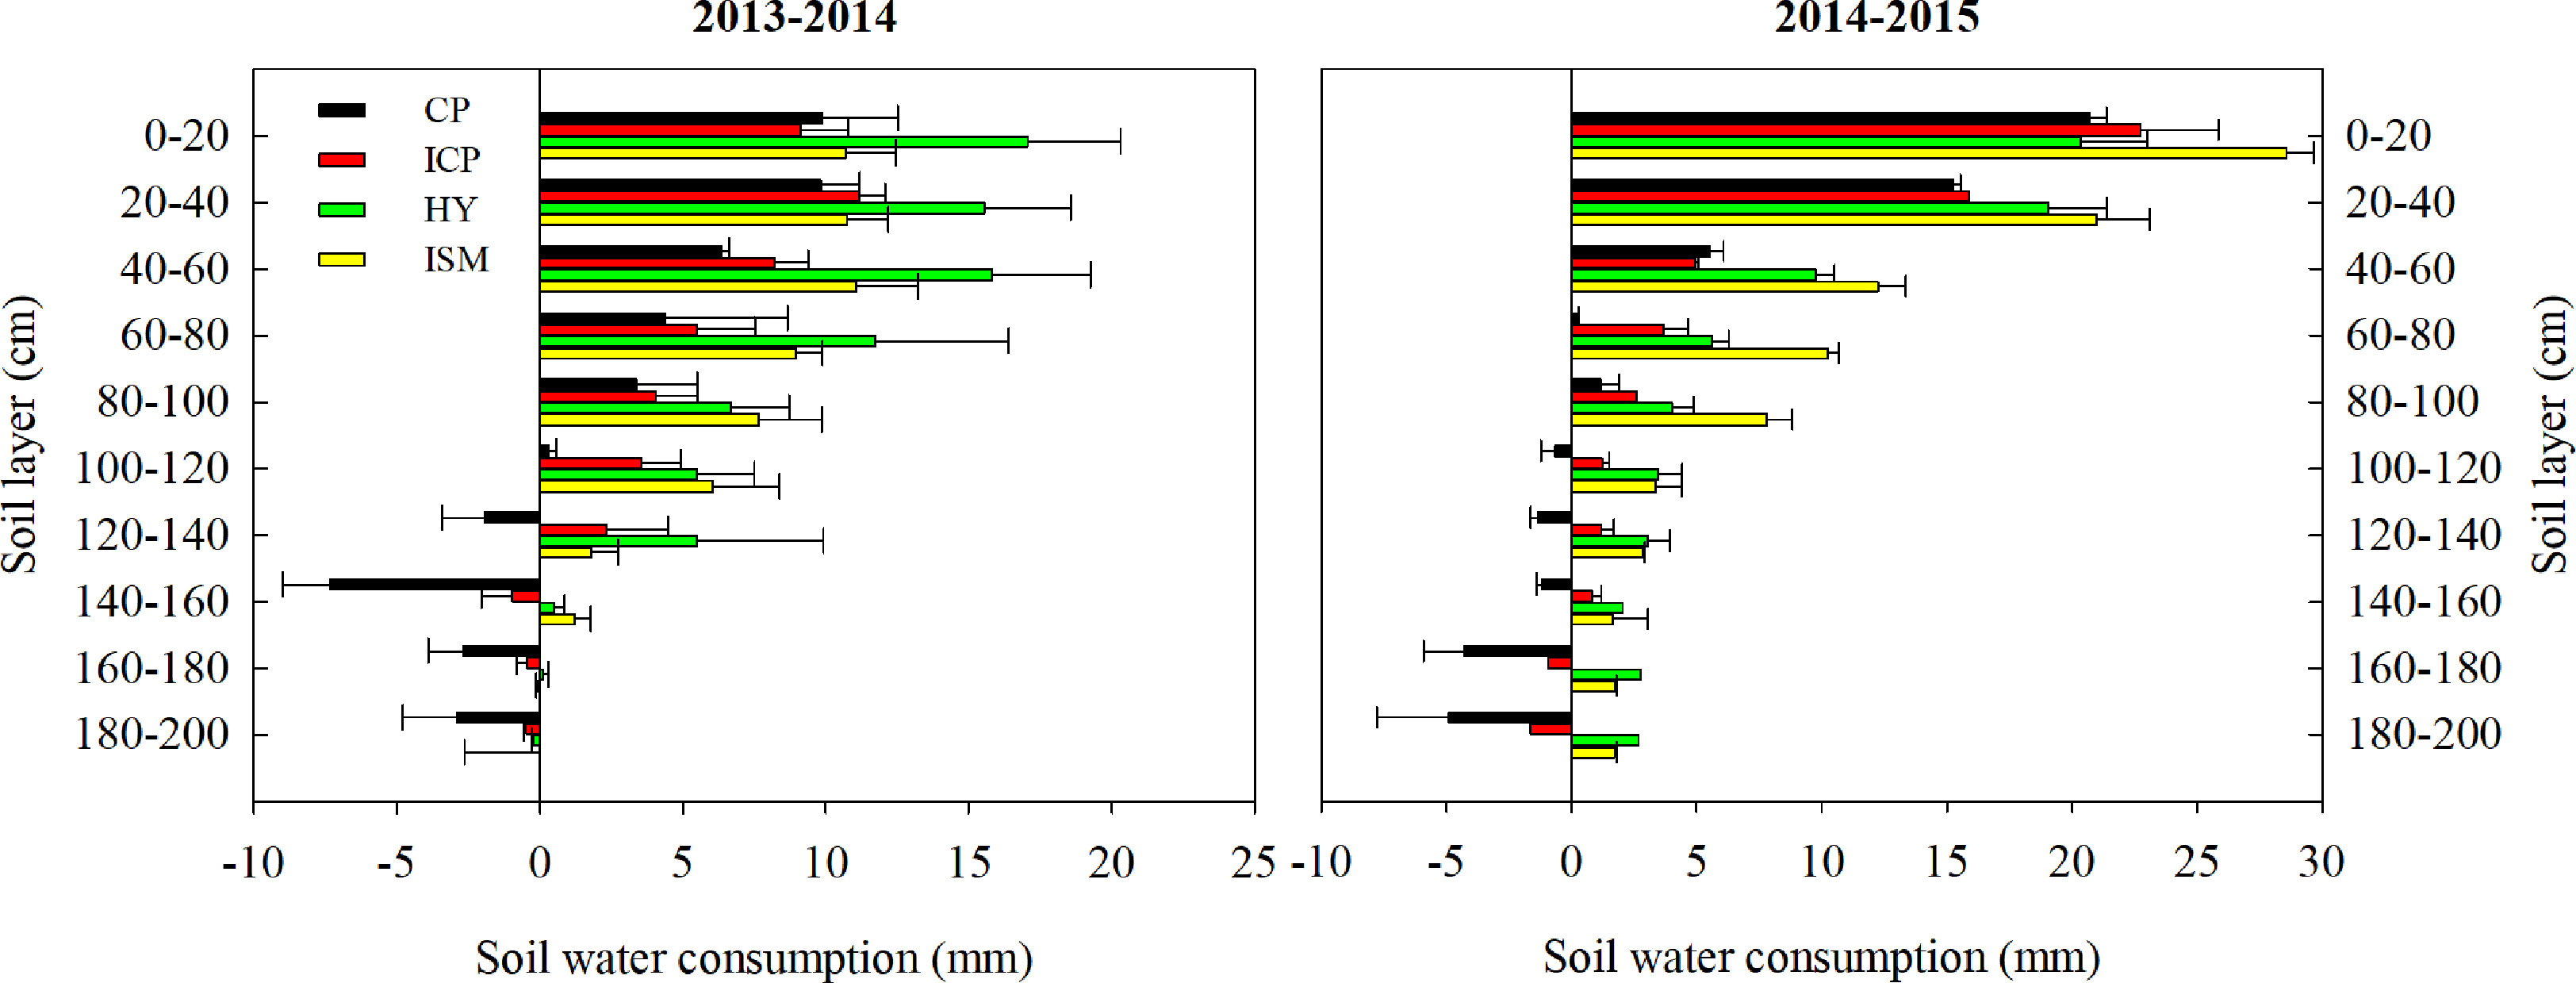
Figure 4 Soil water consumption at each 20-cm interval of soil depth in 0- to 200-cm soil layer during the entire growing season under different integrated treatments in 2013−2014 and 2014−2015. CP, conventional practice treatment; ICP, improvement of conventional practice treatment; HY, high-yield management treatment; ISM, integrated soil and crop system management treatment. Error bars represent the standard deviation of the mean.
3.5 Root distribution
The root distribution in 0- to 140-cm-depth soil was significantly affected by integrated management practices. The average RLD obtained with ISM was 14.86%, 35.83%, and 60.45% larger than that with HY, ICP, and CP, respectively (Figure 5A). The RLD decreased with depth under all integrated treatments (Figure 5B). The RLD at each 20-cm interval of soil depth was the largest for ISM and the smallest for CP. The RLD in the 80- to 140-cm soil layer for ISM was significantly larger than that for HY, whereas no significant differences in RLD in the 0- to 80-cm soil layer were observed between ISM and HY. The RLD in the 40- to 60-cm soil layer for ICP was larger than that for CP, whereas no remarkable differences in other soil layers were observed between ICP and CP. The D95 among the integrated treatments followed the ranking ISM > ICP ≥ HY ≥ CP (Figure 5C). In summary, the integrated management strategy used under ISM could achieve the larger and deeper RLD than other integrated management treatments.
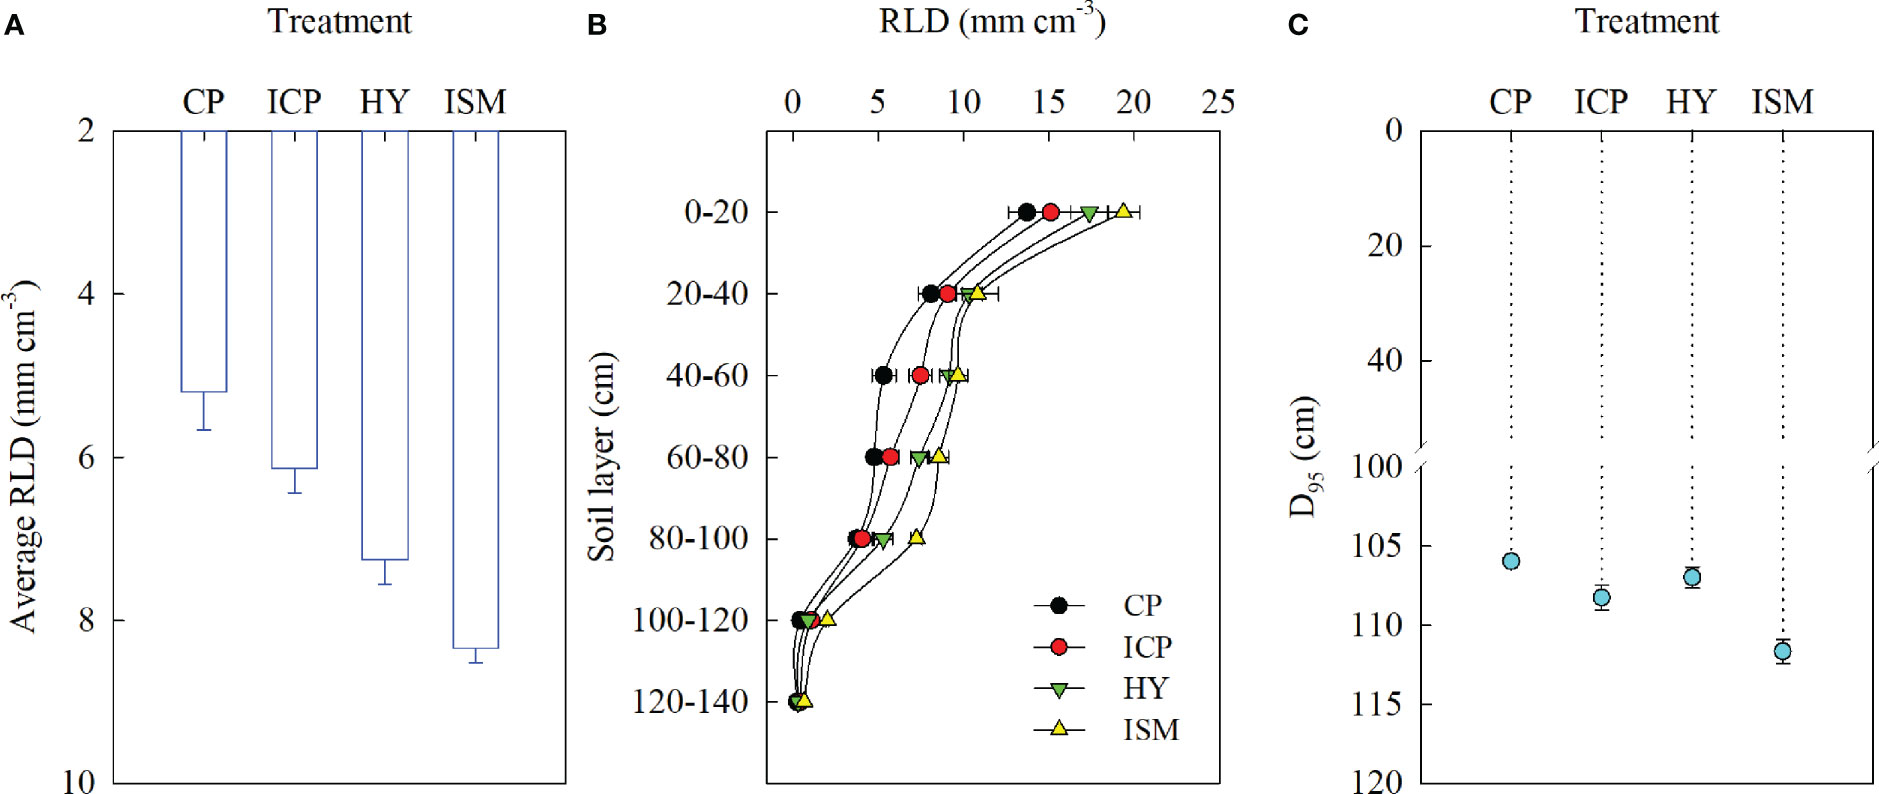
Figure 5 Average root length density (RLD) in 0- to 140-cm-depth soil (A), RLD at each 20-cm interval of soil depth (B), the depth above which 95% of the roots were located (D95) (C) under different integrated treatments in 2014−2015. CP, conventional practice treatment; ICP, improvement of conventional practice treatment; HY, high-yield management treatment; ISM, integrated soil and crop system management treatment. Error bars represent the standard deviation of the mean.
3.6 Grain yield, N utilization, and water productivity
Year and treatment significantly affected grain yield, but their interaction did not. Over 3 years, grain yield among all integrated treatments followed the ranking HY > ISM > ICP > CP. The average grain yield for ISM was 95.86% of that for HY and was 5.99% and 21.72% higher than that for ICP and CP, respectively (Table 6).
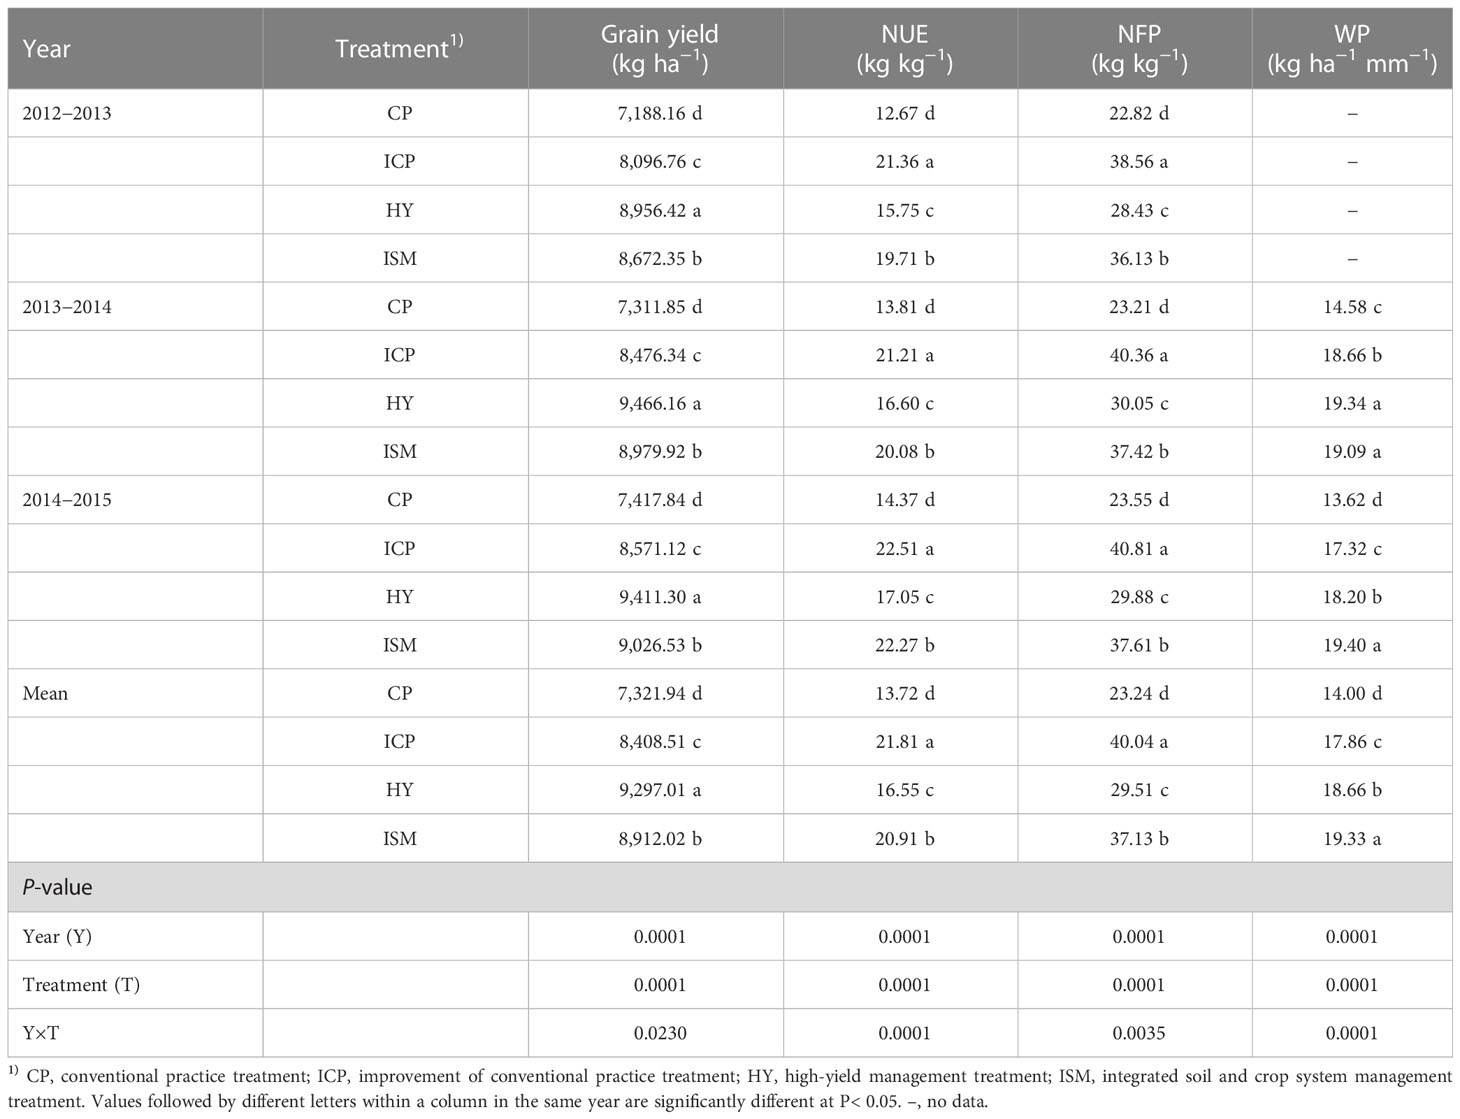
Table 6 Grain yield, N use efficiency (NUE), N fertilizer productivity (NFP), and water productivity (WP) under different integrated treatments from 2012 to 2015.
The effects of treatment, year, and their interaction on NUE, NFP, and WP were significant (Table 6). Over 3 years, NUE among the integrated treatments followed the ranking ICP > ISM > HY > CP. The average NUE for ISM was 4.15% lower than that for ICP and was remarkably higher than that for HY and CP by 26.36% and 52.37%, respectively. NFP among the integrated treatments exhibited the same ranking as NUE. The average NFP for ISM was 7.26% lower than that for ICP and was 25.81% and 59.75% higher than that for HY and CP, respectively. Over 2 years, WP among the integrated treatments followed the ranking ISM ≥ HY > ICP > CP. The WP obtained with ISM was significantly higher than that with HY in 2014−2015, whereas no significant difference in WP was observed between ISM and HY in 2013−2014. The WP averaged across 2 years for ISM was 3.63%, 8.28%, and 38.10% higher than that for HY, ICP, and CP, respectively.
3.7 Correlation analysis
The correlations between RLD and grain yield, WP, PANU, AGNM, and soil water consumption are presented in Table 7. WP, PANU, and soil water consumption showed significant positive correlations with RLD in all soil layers. RLD in the 0- to 120-cm soil layers was positively related to grain yield, whereas RLD in the 120- to 140-cm soil layer was not correlated with grain yield. There were no significant correlations between AGNM and RLD in the 80- to 140-cm soil layers, but AGNM and RLD in the 0- to 80-cm soil layers were significantly positively correlated.
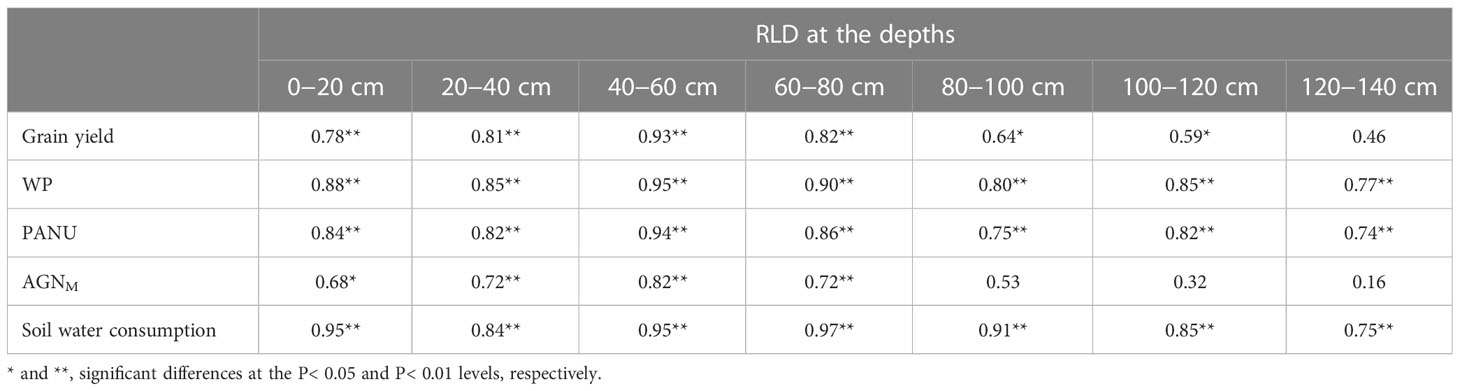
Table 7 Correlation analysis between root length density (RLD) in different soil layers and grain yield, water productivity (WP), post-anthesis N uptake (PANU), aboveground N uptake at maturity (AGNM), and soil water consumption.
4 Discussion
In the present study, integrated management practices showed the combined effects on crop N accumulation at anthesis. AGNA was the highest for HY, followed by ISM, and the lowest for ICP and CP. Previous studies have exhibited that optimized N management (Meng et al., 2013; Hartmann et al., 2015; Lu et al., 2015), proper irrigation (Guo et al., 2014; Wang et al., 2014; Ye et al., 2022), appropriately increasing seeding rate (Dai et al., 2013; Dai et al., 2014) can significantly increase plant N accumulation. However, late sowing may typically reduce N accumulation (Dai et al., 2017; Yin et al., 2018). The abovementioned results indicate that the increased the seeding rate, when combined with the optimized fertilization and irrigation management practices, can compensate for the decrease in N accumulation caused by late sowing. In wheat, N accumulation and redistribution are important processes that determine crop production and grain N accumulation. In general, NR can contribute 50% to 95% of N-grain, and PANU can contribute 5% to 50% (De Ruiter and Brooking, 1994; Kichey et al., 2007). NR is highly dependent on AGNA, and PANU is relevant to soil N availability. Both NR and PANU decreased with N deficiency (Bly and Woodward, 2003; Gaju et al., 2014). Moreover, increasing irrigation could reduce NR and increase PANU (Mon et al., 2016). Compared with CP, ICP obtained a higher NR due to its higher AGNA, lower N supply and late N application, and lower irrigation amount. Similarly, the higher NR with ISM was mainly contributed to the increased AGNA and the optimized N fertilization and irrigation management. On average, NR contributed 82.86% to 91.38% of N-grain, whereas PANU contributed 8.62% to 17.14%. In comparison to other integrated treatments, wheat grown under ISM supported the highest PANU and CPPANU. Thus, the higher NR and the highest PANU were obtained with ISM, which ultimately resulted in the higher N-grain.
To evaluate NUE and N loss precisely, we paid attention to crop-soil system and studied the N balance under integrated management strategies. Crop production alters N balance in AGNM, INR, and INL, ultimately affecting NUE and environmental health (Liu et al., 2018; Li et al., 2022). In the present study, ISM supported better N balance by producing a high level of AGNM and decreasing INRM and INL. The AGNM was the highest for HY, followed by ISM, and the lowest for CP. The higher AGNM obtained with ISM was attributed to its higher AGNA and highest PANU. N fertilization both satisfies the needs of wheat growth and is responsible for the agro-environmental pollution due to denitrification and leaching (Fageria and Baligar, 2005; Sainju et al., 2017). Over-irrigation can also lead to high INR in the soil layers (Kang et al., 2017). Significantly higher INRM and INL were observed for CP and HY due to the higher INRS and highest NFA than for ICP and ISM, which results in resource waste and increases the possibility of environmental pollution. The soil N pools cannot expand forever, and, at high levels of N input, saturation values may soon occur. Along with the highest NFA, the lowest AGNM for CP and the highest ANM for HY may be the common influential causes of excess soil N, leading to high levels of N waste under CP and HY. An interesting finding is that INL under all integrated treatments decreased with years, which is mainly attributed to the year-on-year increased AGNM and the slightly decreased N inputs. In addition, the NNI at anthesis can be used as a diagnostic tool for determining crop N status at canopy level (Lemaire and Gastal, 1997). Values more than 1 imply a luxury N consumption, whereas values lower than 1 imply a N deficiency (Lemaire et al., 2008). In our study, the average NNIA value was the highest for HY, followed by ISM, and the lowest for ICP and CP. Moreover, the values of NNI were all more than 1, which implied that wheat grown under all the integrated treatments was in situation of a luxury N consumption. Despite achieving better N balance and higher NUE, there are still great possibilities for improvements in agronomic management practices used under ISM.
With the increase in the total irrigation input, the total water consumption increased. A case study in 2014−2015, the highest total water consumption was obtained with CP and the lowest total water consumption was obtained with ISM. This was mainly due to CP and ISM, respectively, having the highest and the lowest irrigation amount. Compared with HY, the lower total water consumption with ICP was mainly due to its lower soil water consumption. Despite of the lowest irrigation amount, ISM obtained a relatively adequate water supply due to the effective use of soil water storage. In general, the root distributions are generally incorporated into considerations of soil water absorption and grain yield production. Agronomic practices can significantly affect the growth and spatial distribution of root systems. Significant increases in RLD at each soil depth were observed as seeding rate increased (Dai et al., 2014), and delayed sowing resulted in a reduction in RLD (Dai et al., 2017). A positive quadratic relationship between root weight density and amount of N application was observed (Wang et al., 2014). Moreover, proper irrigation can optimize the spatial distribution of roots (Man et al., 2016; Feng et al., 2023) and promote deeper root penetration into the soil (Wang et al., 2014). In the present study, the root distribution in 0- to 140-cm-depth soil was significantly affected by integrated management practices. Owing to further increased seeding rate, appropriate high N application, and proper irrigation input, the largest RLD at anthesis at each soil depth was obtained with ISM and so did the soil water consumption at the corresponding soil depths. This trend reflected that of the total soil water consumption. The growth of root system in the soil layer is crucial for soil water absorption (Guan et al., 2015; Feng et al., 2023). The larger RLD in the soil layers, the more soil water was absorbed by roots to satisfy the needs of plant growth at the late growth stage, which is conducive to achieving the higher grain yield (White et al., 2015). In the present study, the larger and deeper RLD was obtained with ISM, which implied that the ability to capture the deeper soil water and utilization efficiency of stored soil water under ISM was the highest. In addition, the correlation with grain yield was significant; namely, the increases in the deep root systems were conducive to utilization of deep soil water, which may be one of the major reasons for the higher grain yield and WP.
5 Conclusions
The integrated management strategy (including appropriately delaying sowing date, increasing seeding rate, and optimizing fertilization and irrigation management) used under ISM could increase grain yield, promote N balance, and improve NUE and WP. The grain yield obtained with ISM was 95.86% of that with HY and was significantly higher compared with ICP and CP across all 3 years. ISM promoted N balance as relatively higher AGNM, lower INRM, and lowest INL. The average NUE for ISM was 4.15% lower than that for ICP and was significantly higher compared with HY and CP. The NFP exhibited the same trend as NUE. The increased soil water consumption under ISM was mainly due to its increased RLD. ISM improved WP by about 3.63%–38.10% in comparison with other integrated management strategies. Taking high grain yield, better N balance, and high NUE and WP into consideration, ISM can be considered a recommendable management strategy in the target region.
Data availability statement
The original contributions presented in the study are included in the article/supplementary material. Further inquiries can be directed to the corresponding authors.
Author contributions
DP and XD designed the experiments, managed the projects and guided the writing of the article. HX, ML, YT, FZ, and WC performed the experiments. HX performed the data analysis and wrote the manuscript. MH gave useful suggestions during the process of this article. All authors contributed to the article and approved the submitted version.
Funding
This work was supported by the Initial Scientific Research Fund for High Level Talent of Weifang University of Science and Technology (KJRC2022004 and KJRC2021001), the Key Research and Development Program of Shandong Province (LJNY202103), and the Natural Science Foundation of Shandong Province (ZR2017BC105).
Conflict of interest
The authors declare that the research was conducted in the absence of any commercial or financial relationships that could be construed as a potential conflict of interest.
Publisher’s note
All claims expressed in this article are solely those of the authors and do not necessarily represent those of their affiliated organizations, or those of the publisher, the editors and the reviewers. Any product that may be evaluated in this article, or claim that may be made by its manufacturer, is not guaranteed or endorsed by the publisher.
References
Bly, A. G., Woodward, H. J. (2003). Foliar nitrogen application timing influence on grain yield and protein concentration of hard red winter and spring wheat. Agron. J. 95, 335–338. doi: 10.2134/agronj2003.3350
Bremner, J. M., Tabatabai, M. A. (1972). Use of an ammonia electrode for determination of ammonium in kjeldahl analysis of soils. Commun. Soil Sci. Plant Anal. 3, 159–165. doi: 10.1080/00103627209366361
Chen, X. P., Cui, Z. L., Fan, M. S., Vitousek, P., Zhao, M., Ma, W. Q., et al. (2014). Producing more grain with lower environmental costs. Nature 514, 486–489. doi: 10.1038/nature13609
Chen, X. P., Cui, Z. L., Vitousek, P. M., Cassman, K. G., Matson, P. A., Bai, J. S., et al. (2011). Integrated soil-crop system management for food security. PNAS 108, 6399–6404. doi: 10.1073/pnas.1101419108
Cheng, Y., Dai, X. L., Ren, H., Wang, Y. C., Liu, P., He, M. R. (2020). Precision double cropping synergistically improves wheat and maize yields as well as resource efficiency. Agron. J. 112, 1035–1048. doi: 10.1002/agj2.20047
Cooper, P. J. M., Gregory, P. J., Keatinge, J. D. H., Brown, S. C. (1987). Effects of fertilizer, variety and location on barley production under rainfed conditions in northern Syria 2. soil water dynamics and crop water use. Field Crops Res. 16, 67–84. doi: 10.1016/0378-4290(87)90054-2
Cui, Z. L., Zhang, H. Y., Chen, X. P., Zhang, C. C., Ma, W. Q., Huang, C. D., et al. (2018). Pursuing sustainable productivity with millions of smallholder farmers. Nature 555, 363–366. doi: 10.1038/nature25785
Dai, X. L., Wang, Y. C., Dong, X. C., Qian, T. F., Yin, L. J., Dong, S. X., et al. (2017). Delayed sowing can increase lodging resistance while maintaining grain yield and nitrogen use efficiency in winter wheat. Crop J. 5, 541–552. doi: 10.1016/j.cj.2017.05.003
Dai, X. L., Xiao, L. L., Jia, D. Y., Kong, H. B., Wang, Y. C., Li, C. X., et al. (2014). Increased plant density of winter wheat can enhance nitrogen-uptake from deep soil. Plant Soil 384, 141–152. doi: 10.1007/s11104-014-2190-x
Dai, X. L., Zhou, X. H., Jia, D. Y., Xiao, L. L., Kong, H. B., He, M. R. (2013). Managing the seeding rate to improve nitrogen-use efficiency of winter wheat. Field Crops Res. 154, 100–109. doi: 10.1016/j.fcr.2013.07.024
De Ruiter, J. M., Brooking, I. R. (1994). Nitrogen and dry matter partitioning of barley grown in a dryland environment. N. Z. J. Crop Hortic. Sci. 22, 45–55. doi: 10.1080/01140671.1994.9513805
Dordas, C. A. (2011). Nitrogen nutrition index and its relationship to n use efficiency in linseed. Eur. J. Agron. 34, 124–132. doi: 10.1016/j.eja.2010.11.005
Fageria, N. K., Baligar, V. C. (2005). Enhancing nitrogen use efficiency in crop plants. Adv. Agron. 88, 97–185. doi: 10.1016/S0065-2113(05)88004-6
Feng, S. W., Ding, W. H., Shi, C. C., Zhu, X. L., Hu, T. Z., Ru, Z. G. (2023). Optimizing the spatial distribution of roots by supplemental irrigation to improve grain yield and water use efficiency of wheat in the north China plain. Agric. Water Manage. 275, 107989. doi: 10.1016/j.agwat.2022.107989
Gaju, O., Allard, V., Martre, P., Le Gouis, J., Moreau, D., Bogard, M., et al. (2014). Nitrogen partitioning and remobilization in relation to leaf senescence, grain yield and grain nitrogen concentration in wheat cultivars. Field Crops Res. 155, 213–223. doi: 10.1016/j.fcr.2013.09.003
Guan, D. H., Zhang, Y. S., Al-Kaisi, M. M., Wang, Q. Y., Zhang, M. C., Li, Z. H. (2015). Tillage practices effect on root distribution and water use efficiency of winter wheat under rain-fed condition in the north China plain. Soil Tillage Res. 146, 286–295. doi: 10.1016/j.still.2014.09.016
Guo, J. H., Liu, X. J., Zhang, Y., Shen, J. L., Han, W. X., Zhang, W. F., et al. (2010). Significant acidification in major Chinese croplands. Science 327, 1008–1010. doi: 10.1126/science.1182570
Guo, Z. J., Zhang, Y. L., Zhao, J. Y., Shi, Y., Yu, Z. W. (2014). Nitrogen use by winter wheat and changes in soil nitrate nitrogen levels with supplemental irrigation based on measurement of moisture content in various soil layers. Field Crops Res. 164, 117–125. doi: 10.1016/j.fcr.2014.05.016
Hartmann, T. E., Yue, S. C., Schulz, R., He, X. K., Chen, X. P., Zhang, F. S., et al. (2015). Yield and n use efficiency of a maize–wheat cropping system as affected by different fertilizer management strategies in a farmer’s field of the north China plain. Field Crops Res. 174, 30–39. doi: 10.1016/j.fcr.2015.01.006
Heffer, P., Gruère, A., Roberts, T. (2017). Assessment of fertilizer use by crop at the global level 2014–2014/15 (Paris: International Fertilizer Association and International Plant Nutrition Institute), 1–18.
Hu, D. W., Sun, Z. P., Li, T. L., Yan, H. Z., Zhang, H. (2014). Nitrogen nutrition index and its relationship with n use efficiency, tuber yield, radiation use efficiency, and leaf parameters in potatoes. J. Integr. Agric. 13, 1008–1016. doi: 10.1016/S2095-3119(13)60408-6
Huang, H. P., Han, Y. P., Song, J. X., Zhang, Z. P., Xiao, H. (2016). Impacts of climate change on water requirements of winter wheat over 59 years in the Huang-Huai-Hai plain. Soil Water Res. 11, 11–19. doi: 10.17221/164/2014-SWR
Hund, A., Ruta, N., Liedgens, M. (2009). Rooting depth and water use efficiency of tropical maize inbred lines, differing in drought tolerance. Plant Soil 318, 311–325. doi: 10.1007/s11104-008-9843-6
Jiao, L. (2010). Water shortages loom as northern china’s aquifers are sucked dry. Science 328, 1462–1463. doi: 10.1126/science.328.5985.1462-a
Ju, X. T., Kou, C. L., Zhang, F. S., Christie, P. (2006). Nitrogen balance and groundwater nitrate contamination: comparison among three intensive cropping systems on the north China plain. Environ. pollut. 143, 117–125. doi: 10.1016/j.envpol.2005.11.005
Justes, E., Mary, B., Meynard, J. M., Machet, J. M., Huché-Thélier, L. (1994). Determination of a critical nitrogen dilution curve for winter wheat crops. Ann. Bot. 74, 397–407. doi: 10.1006/anbo.1994.1133
Kang, S. Z., Hao, X. M., Du, T. S., Tong, L., Su, X. L., Lu, H. N., et al. (2017). Improving agricultural water productivity to ensure food security in china under changing environment: from research to practice. Agric. Water Manage. 179, 5–17. doi: 10.1016/j.agwat.2016.05.007
Kichey, T., Hirel, B., Heumez, E., Dubois, F., Le Gouis, J. (2007). In winter wheat (Triticum aestivum l.), post-anthesis nitrogen uptake and remobilisation to the grain correlate with agronomic traits and nitrogen physiological markers. Field Crops Res. 102, 22–32. doi: 10.1016/j.fcr.2007.01.002
Lemaire, G., Gastal, F. (1997). “N uptake and distribution in plant canopies,” in Diagnosis of the nitrogen status in crops. Ed. Lemaire, G. (Heidelberg, DE: Springer-Verlag), 3–43.
Lemaire, G., Jeuffroy, M. H., Gastal, F. (2008). Diagnosis tool for plant and crop n status in vegetative stage: theory and practices for crop n management. Eur. J. Agron. 28, 614–624. doi: 10.1016/j.eja.2008.01.005
Li, Z., Cui, S., Zhang, Q. P., Xu, G., Feng, Q. S., Chen, C., et al. (2022). Optimizing wheat yield, water, and nitrogen use efficiency with water and nitrogen inputs in China: a synthesis and life cycle assessment. Front. Plant Sci. 13. doi: 10.3389/fpls.2022.930484
Li, J. P., Zhang, Z., Liu, Y., Yao, C. S., Song, W. Y., Xu, X. X., et al. (2019). Effects of micro-sprinkling with different irrigation amount on grain yield and water use efficiency of winter wheat in the north China plain. Agric. Water Manage. 224, 105736. doi: 10.1016/j.agwat.2019.105736
Liu, Z., Gao, J., Gao, F., Dong, S. T., Liu, P., Zhao, B., et al. (2018). Integrated agronomic practices management improve yield and nitrogen balance in double cropping of winter wheat-summer maize. Field Crops Res. 221, 196–206. doi: 10.1016/j.fcr.2018.03.001
Liu, X. J., Ju, X. T., Zhang, F. S., Pan, J. R., Christie, P. (2003). Nitrogen dynamics and budgets in a winter wheat-maize cropping system in the north China plain. Field Crops Res. 83, 111–124. doi: 10.1016/S0378-4290(03)00068-6
Lu, D. J., Lu, F. F., Pan, J. X., Cui, Z. L., Zou, C. Q., Chen, X. P., et al. (2015). The effects of cultivar and nitrogen management on wheat yield and nitrogen use efficiency in the north China plain. Field Crops Res. 171, 157–164. doi: 10.1016/j.fcr.2014.10.012
Lu, J. S., Xiang, Y. Z., Fan, J. L., Zhang, F. C., Hu, T. T. (2021). Sustainable high grain yield, nitrogen use efficiency and water productivity can be achieved in wheat-maize rotation system by changing irrigation and fertilization strategy. Agric. Water Manage. 258, 107177. doi: 10.1016/j.agwat.2021.107177
Man, J. G., Shi, Y., Yu, Z. W., Zhang, Y. L. (2015). Dry matter production, photosynthesis of flag leaves and water use in winter wheat are affected by supplemental irrigation in the Huang-Huai-Hai plain of China. PloS One 10, e0137274. doi: 10.1371/journal.pone.0137274
Man, J. G., Shi, Y., Yu, Z. W., Zhang, Y. L. (2016). Root growth, soil water variation, and grain yield response of winter wheat to supplemental irrigation. Plant Prod. Sci. 19, 193–205. doi: 10.1080/1343943X.2015.1128097
Meng, Q. F., Yue, S. C., Chen, X. P., Cui, Z. L., Ye, Y. L., Ma, W. Q., et al. (2013). Understanding dry matter and nitrogen accumulation with time-course for high-yielding wheat production in China. PloS One 8, e68783. doi: 10.1371/journal.pone.0068783
Moll, R. H., Kamprath, E. J., Jackson, W. A. (1982). Analysis and interpretation of factors which contribute to efficiency of nitrogen utilization. Agron. J. 75, 562–564. doi: 10.2134/agronj1982.00021962007400030037x
Mon, J., Bronson, K. F., Hunsaker, D. J., Thorp, K. R., White, J. W., French, A. N. (2016). Interactive effects of nitrogen fertilization and irrigation on grain yield, canopy temperature, and nitrogen use efficiency in overhead sprinkler-irrigated durum wheat. Field Crops Res. 191, 54–65. doi: 10.1016/j.fcr.2016.02.011
National Bureau of Statistic of China (2021). China Statistical yearbook (Beijing: China Statistics Press).
Olfs, H. W., Blankenau, K., Brentrup, F., Jasper, J., Link, A., Lammel, J. (2005). Soil- and plant-based nitrogen-fertilizer recommendations in arable farming. J. Plant Nutr. Soil Sci. 168, 414–431. doi: 10.1002/jpln.200520526
Puntel, L. A., Sawyer, J. E., Barker, D. W., Dietzel, R., Poffenbarger, H., Castellano, M. J., et al. (2016). Modeling long-term corn yield response to nitrogen rate and crop rotation. front. Plant Sci. 7. doi: 10.3389/fpls.2016.01630
Sainju, U. M., Lenssen, A. W., Allen, B. L., Stevens, W. B., Jabro, J. D. (2017). Soil residual nitrogen under various crop rotations and cultural practices. J. Plant Nutr. Soil Sci. 180, 187–198. doi: 10.1002/jpln.201600496
Walter, Z. L., Moril, I. (2005). Deep root water uptake ability and water use efficiency of pearl millet in comparison to other millet species. Plant Prod. Sci. 8, 454–460. doi: 10.1626/pps.8.454
Wang, C. Y., Liu, W. X., Li, Q. X., Ma, D. Y., Lu, H. F., Feng, W., et al. (2014). Effects of different irrigation and nitrogen regimes on root growth and its correlation with above-ground plant parts in high-yielding wheat under field conditions. Field Crops Res. 165, 138–149. doi: 10.1016/j.fcr.2014.04.011
West, P. C., Gerber, J. S., Engstrom, P. M., Mueller, N. D., Brauman, K. A., Carlson, K. M., et al. (2014). Leverage points for improving global food security and the environment. Science 345, 325–328. doi: 10.1126/science.1246067
White, C. A., Sylvester-Bradley, R., Berry, P. M. (2015). Root length densities of UK wheat and oilseed rape crops with implications for water capture and yield. J. Exp. Bot. 66, 2293–2303. doi: 10.1093/jxb/erv077
Xu, H. C., Dai, X. L., Chu, J. P., Wang, Y. C., Yin, L. J., Ma, X., et al. (2018). Integrated management strategy for improving the grain yield and nitrogen-use efficiency of winter wheat. J. Integr. Agric. 17, 315–327. doi: 10.1016/S2095-3119(17)61805-7
Xu, X. X., Zhang, M., Li, J. P., Liu, Z. Q., Zhao, Z. G., Zhang, Y. H., et al. (2018). Improving water use efficiency and grain yield of winter wheat by optimizing irrigation in the north China plain. Field Crops Res. 221, 219–227. doi: 10.1016/j.fcr.2018.02.011
Ye, T. Y., Ma, J. F., Zhang, P., Shan, S., Liu, L. L., Tang, L., et al. (2022). Interaction effects of irrigation and nitrogen on the coordination between crop water productivity and nitrogen use efficiency in wheat production on the north China plain. Agric. Water Manage. 271, 107787. doi: 10.1016/j.agwat.2022.107787
Yin, L. J., Dai, X. L., He, M. R. (2018). Delayed sowing improves nitrogen utilization efficiency in winter wheat without impacting yield. Field Crops Res. 221, 90–97. doi: 10.1016/j.fcr.2018.02.015
Zhang, X., Davidson, E. A., Mauzerall, D. L., Searchinger, T. D., Dumas, P., Shen, Y. (2015). Managing nitrogen for sustainable development. Nature 528, 51–59. doi: 10.1038/nature15743
Keywords: optimized management strategy, grain yield, nitrogen balance, water productivity, winter wheat
Citation: Xu H, Liu M, Tang Y, Zhao F, Cao W, He M, Peng D and Dai X (2023) Optimized management strategy increased grain yield, promoted nitrogen balance, and improved water productivity in winter wheat. Front. Plant Sci. 14:1182568. doi: 10.3389/fpls.2023.1182568
Received: 08 March 2023; Accepted: 28 April 2023;
Published: 30 May 2023.
Edited by:
Gaetano Pandino, University of Catania, ItalyCopyright © 2023 Xu, Liu, Tang, Zhao, Cao, He, Peng and Dai. This is an open-access article distributed under the terms of the Creative Commons Attribution License (CC BY). The use, distribution or reproduction in other forums is permitted, provided the original author(s) and the copyright owner(s) are credited and that the original publication in this journal is cited, in accordance with accepted academic practice. No use, distribution or reproduction is permitted which does not comply with these terms.
*Correspondence: Dianliang Peng, cGRscGRsMjAwOUAxMjYuY29t; Xinglong Dai, YWRhaXNkbnlAMTYzLmNvbQ==