- 1Key Laboratory for Environment and Disaster Monitoring and Evaluation of Hubei, Innovation Academy for Precision Measurement Science and Technology, Chinese Academy of Sciences, Wuhan, China
- 2University of Chinese Academy of Sciences, Beijing, China
- 3Honghu Lake Station for Wetland Ecosystem Research, Chinese Academy of Sciences, Honghu, China
- 4Yangtze River Basin Ecological Environment Monitoring and Scientific Research Center, Yangtze River Basin Ecological Environment Supervision and Administration Bureau, Ministry of Ecological Environment, Wuhan, China
Wetland vegetation biomass is an essential indicator of wetland health, and its estimation has become an active area of research. Zizania latifolia (Z. latifolia) is the dominant species of emergent vegetation in Honghu Wetland, and monitoring its aboveground biomass (AGB) can provide a scientific basis for the protection and restoration of this and other wetlands along the Yangtze River. This study aimed to develop a method for the AGB estimation of Z. latifolia in Honghu Wetland using high-resolution RGB imagery acquired from an unoccupied aerial vehicle (UAV). The spatial distribution of Z. latifolia was first extracted through an object-based classification method using the field survey data and UAV RGB imagery. Linear, quadratic, exponential and back propagation neural network (BPNN) models were constructed based on 17 vegetation indices calculated from RGB images to invert the AGB. The results showed that: (1) The visible vegetation indices were significantly correlated with the AGB of Z. latifolia. The absolute value of the correlation coefficient between the AGB and CIVE was 0.87, followed by ExG (0.866) and COM2 (0.837). (2) Among the linear, quadratic, and exponential models, the quadric model based on CIVE had the highest inversion accuracy, with a validation R2 of 0.37, RMSE and MAE of 853.76 g/m2 and 671.28 g/m2, respectively. (3) The BPNN model constructed with eight factors correlated with the AGB had the best inversion effect, with a validation R2 of 0.68, RMSE and MAE of 732.88 g/m2 and 583.18 g/m2, respectively. Compared to the quadratic model constructed by CIVE, the BPNN model achieved better results, with a reduction of 120.88 g/m2 in RMSE and 88.10 g/m2 in MAE. This study indicates that using UAV-based RGB images and the BPNN model provides an effective and accurate technique for the AGB estimation of dominant wetland species, making it possible to efficiently and dynamically monitor wetland vegetation cost-effectively.
1 Introduction
Wetland vegetation is an important component of wetland ecosystems and plays a crucial role in the ecological function of the wetland environment (Wan et al., 2019; Zhou et al., 2021). Aboveground biomass (AGB) of wetland vegetation serves as a key indicator to evaluate the health status and the carbon storage capacity of wetland ecosystems (Shen et al., 2021). Monitoring the AGB of wetland vegetation can provide a scientific basis for the conservation and restoration of wetland ecosystems, which is essential for achieving carbon neutrality targets (Shao et al., 2022). Due to the poor accessibility of wetlands and the influence of complex environmental factors, traditional manual harvesting methods for obtaining the AGB is not only time-consuming and labor-intensive, but also difficult to implement on a large scale.
Remote sensing techniques that provide timely, up-to-date spatial information are increasingly indispensable for wetland assessment and management, overcoming the limitations of traditional approaches (Adam et al., 2010). As an emerging low-altitude remote sensing technology, unoccupied aerial vehicles (UAVs) are more convenient platforms for remote sensing data acquisition than satellites. UAV remote sensing not only has the advantage of high flexibility and cost efficiency, but also high spatial resolution from sub-meter to centimeter level, providing high spatial detail (Klemas, 2015). Therefore, the use of UAV-based images has the potential to explain the heterogeneous structure of wetland vegetation (Jing et al., 2017). Many studies have successfully performed wetland vegetation mapping and monitoring based on UAV remote sensing (Meng et al., 2017; Corti Meneses et al., 2018; Yan et al., 2019; Durgan et al., 2020; Zhou et al., 2021). Cao et al. (Cao et al., 2018) verified the effectiveness of UAV hyperspectral images in mangrove species identification. Fu et al. (Fu et al., 2021) evaluated the ability of the optimized Random Forest (RF) algorithm and SegNet algorithm to classify wetland vegetation communities based on low-altitude UAV images. In addition, the spatiotemporal monitoring of invasive species in wetlands has also been successfully conducted by remote sensing data derived from UAVs (Abeysinghe et al., 2019; Anderson et al., 2021; Brooks et al., 2021). Furthermore, efforts have also been paid to estimate wetland vegetation density and fractional vegetation cover (FVC) based on UAVs (Zhou et al., 2018; Pinton et al., 2021).
However, most of these studies are related to the horizonal surface information of wetland vegetation (Wang et al., 2017a), whereas there are far fewer studies on the AGB inversion of wetland vegetation than for forest (Lin et al., 2018), grassland (Villoslada Peciña et al., 2021) and crop biomass inversions (Zheng et al., 2019; Zhang et al., 2021). This is because the growing conditions of wetland vegetation are more complex with higher spatial and temporal variability compared to other types of ecosystems. In addition, due to the poor accessibility of wetlands, it is difficult to collect validation samples, hindering the development of wetland vegetation biomass studies. Doughty et al. successfully estimated marsh biomass by using the correlation between several vegetation indices and the AGB with a determination coefficient (R2) of 0.67 and a root mean square error (RMSE) of 344 g/m2 based on multispectral UAV imagery (Doughty and Cavanaugh, 2019). Their subsequent research results showed that the accuracy of UAV-based biomass inversion (R2 = 0.40, RMSE=534.6 g/m2) was higher than the Landsat-based result (R2 = 0.26, RMSE=596.8 g/m2), showing that UAV images could better reflect the spatial variability of wetland vegetation biomass at a fine scale (Doughty et al., 2021).
With the development of UAV technology, small consumer UAVs have been shown to be suitable for wetland surveys, overcoming the limitations of wetland vegetation biomass monitoring. Some scholars have pointed out that UAVs equipped with RGB sensors make the acquisition of high-resolution images and field survey data more convenient and affordable than UAVs equipped with other types of sensors (Kutugata et al., 2021). Furthermore, the visible vegetation indices generated from RGB images (e.g., Excess green index (ExG), Color index of vegetation (CIVE), Vegetation index (VEG), Combination index (COM)) have been shown to have a certain relationship with the growth status of vegetation, which is helpful for the quantitative and continuous vegetation monitoring (Klemas, 2015; Yue et al., 2019; Liu et al., 2021). Linear/nonlinear statistical regression models constructed by vegetation indices and field survey samples are the most commonly used for traditional vegetation biomass inversion (Bendig et al., 2015; Zheng et al., 2019). In recent years, studies have found that machine learning algorithms (e.g., random forest (RF), support vector machine (SVM), back propagation neural network (BPNN)) can perform better for vegetation biomass estimation due to the superior ability to identify and simulate the correlation of the datasets (Wang et al., 2016; Viljanen et al., 2018; Zhu et al., 2019; Sharma et al., 2022; Zhang et al., 2022). Presently, most existing studies about wetland vegetation have been conducted on landscape and community levels (Gao et al., 2019; Wan et al., 2019; Wang et al., 2022). Few researchers have attempted to combine machine learning algorithms and high-resolution RGB images to estimate the AGB of wetland vegetation at the species level.
The objective of this study is to demonstrate the feasibility of using high-resolution UAV RGB images for species-level AGB estimation in wetlands. Zizania latifolia (Z. latifolia), the dominant species of emergent vegetation in Honghu Wetland Nature Reserve, was selected as the research object to demonstrate the feasibility of UAV RGB images in the AGB estimation. Z. latifolia, commonly thriving in shallow water, exhibits robust growth. Its roots are firmly anchored in the waterbed, while the stem and leaves extend above the surface of the water. This article considers the fresh weight of the portion above the water surface as the AGB of Z. latifolia. First, we extracted multi-features from RGB images to map the spatial distribution of Z. latifolia using the object-based classification method. Then, the linear, quadratic, exponential regressions and the BPNN model were constructed based on 17 vegetation indices to invert the AGB of Z. latifolia. Finally, the accuracy of different inversion models was compared to figure out the optimal inversion model. This paper provides a technical reference for accurate and rapid AGB monitoring of wetland vegetation at the species level in an accurate and rapid way.
2 Materials
2.1 Study area
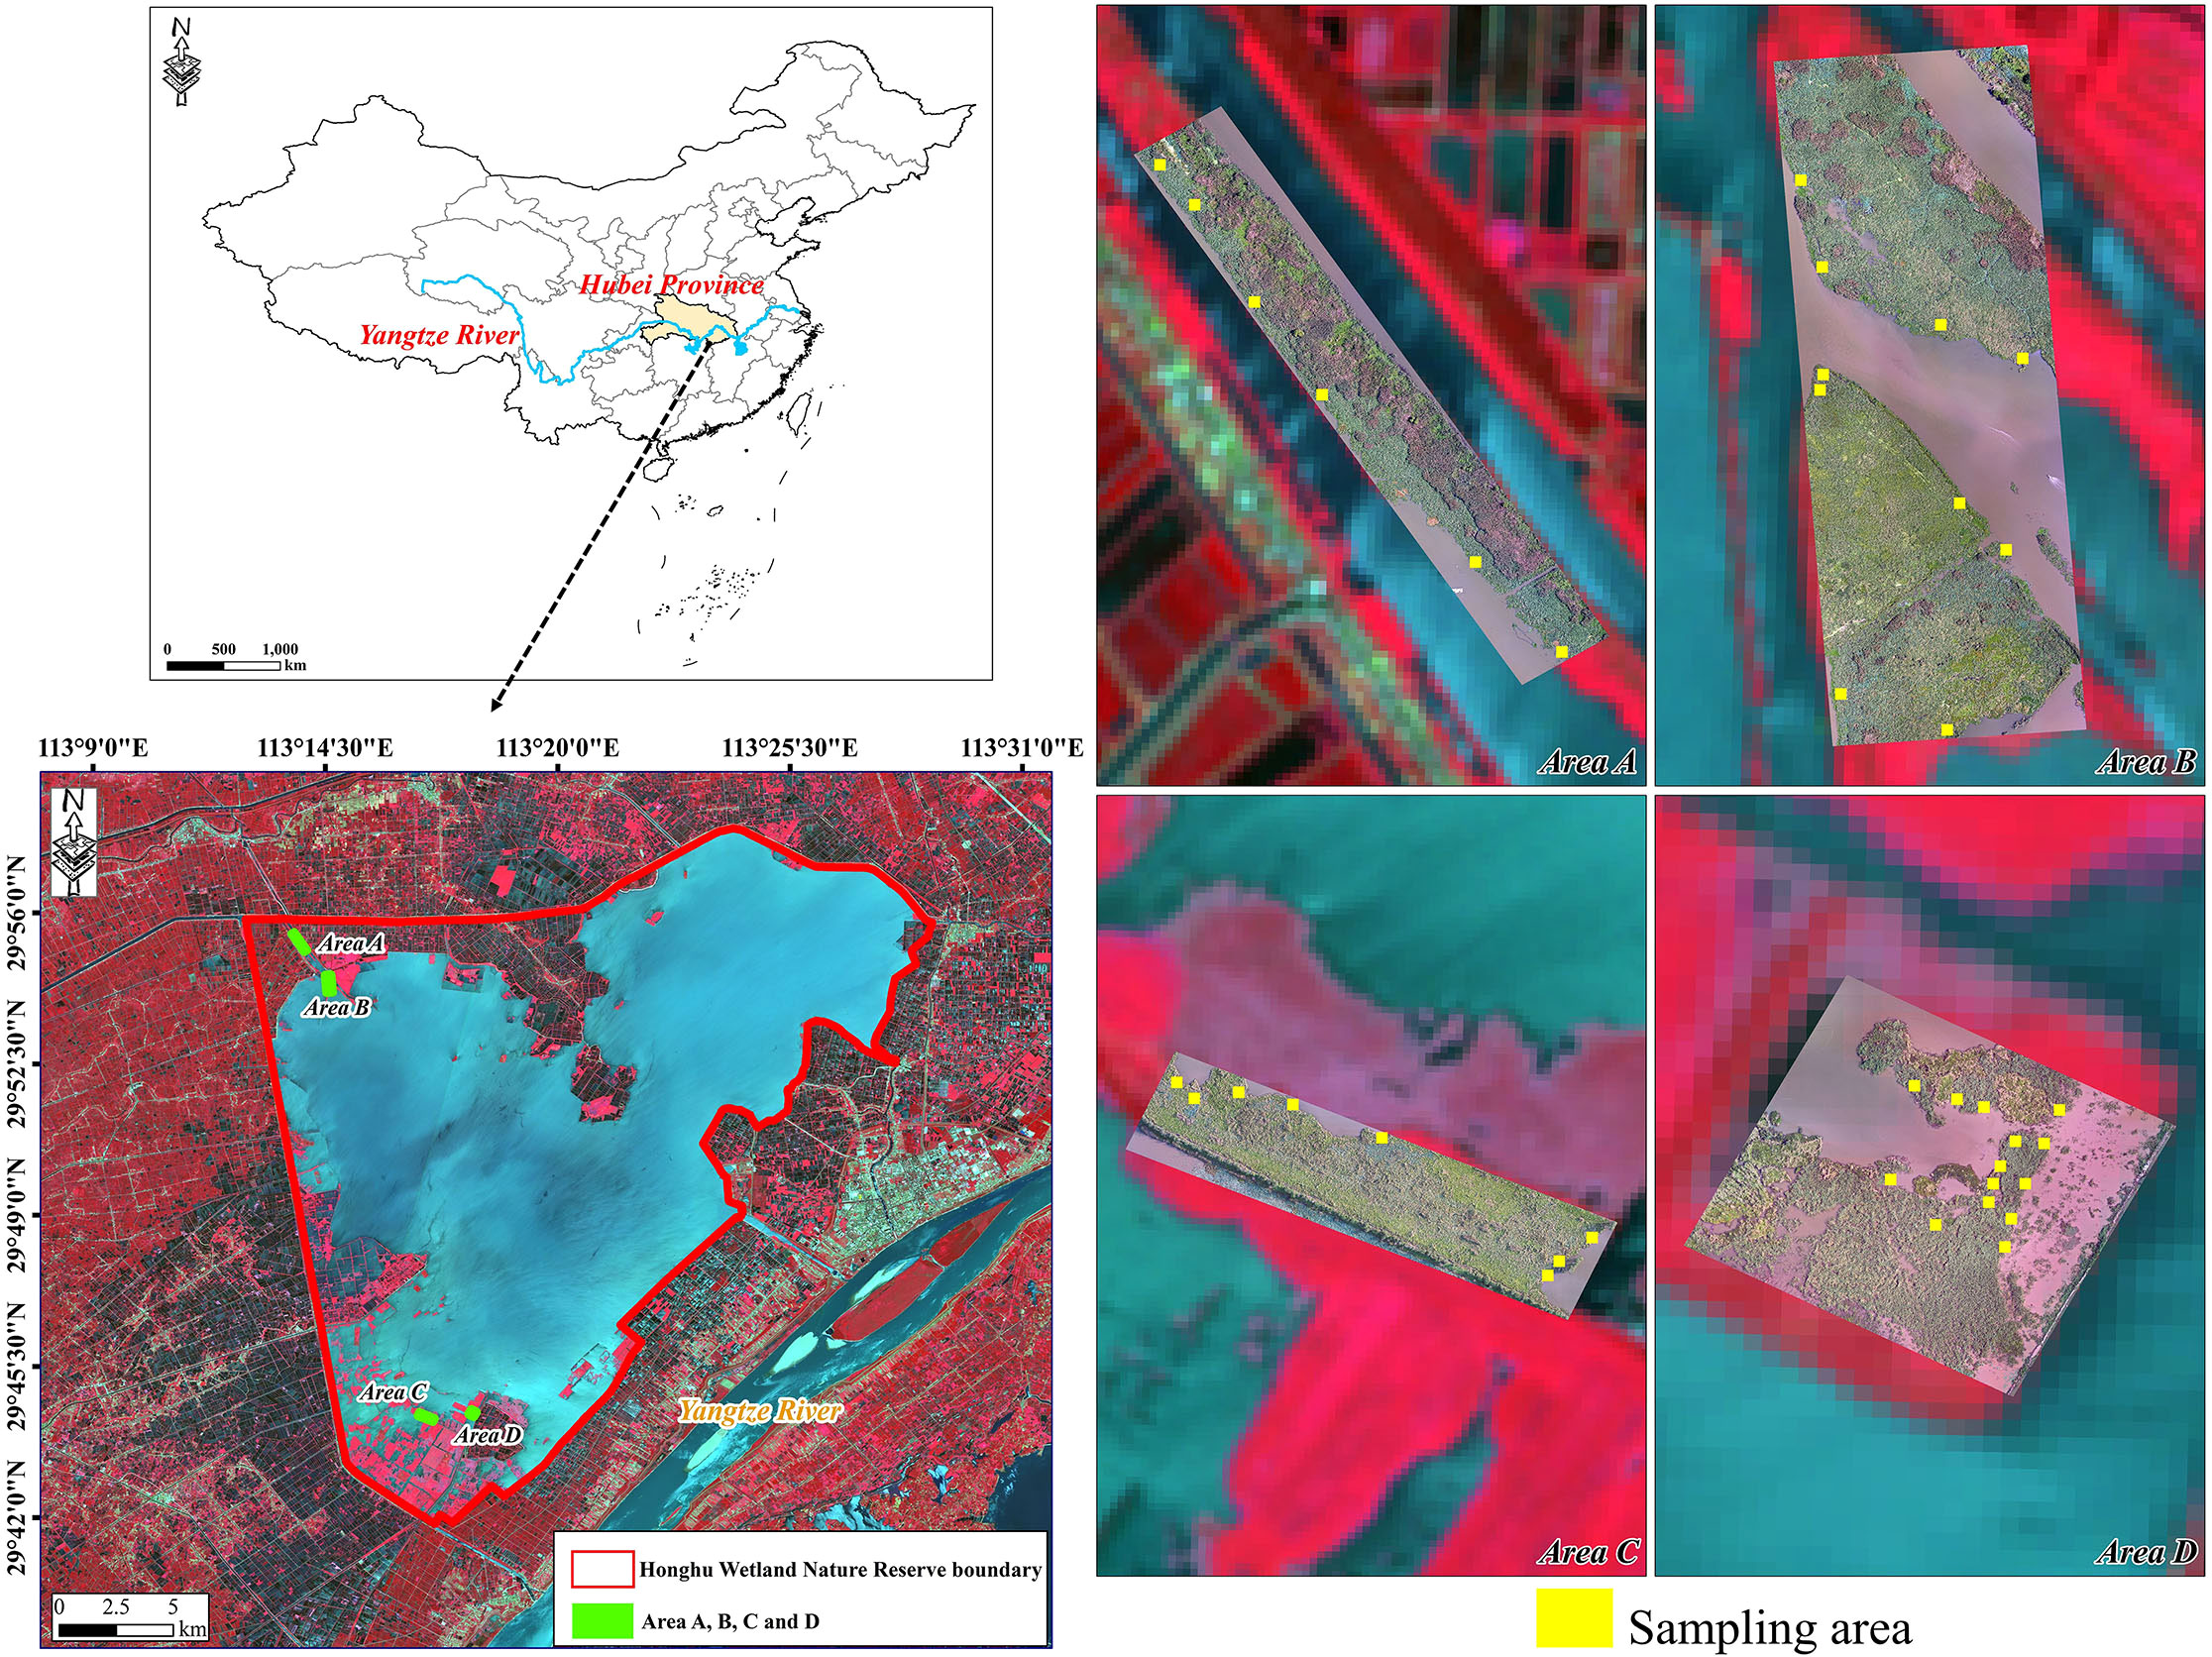
Honghu Wetland (29°41′–29°58′N, 113°12′–113°28′E), listed as a Wetland of International Importance under the Ramsar Convention, is located in the southeast of Hubei Province, China, with a surface area of approximately 414 km2 (Figure 1). The lowest average temperature in January is +3.8 °C, while the highest average temperature in July is +28.9 °C. Annual rainfall ranges from 1000 to 1300 mm. As the largest freshwater lake in Hubei Province, Honghu plays an important role in flood control and storage, water conservation, and biodiversity maintenance in the middle and lower reaches of the Yangtze River (Li et al., 2021). Honghu Wetland has excellent hydrological conditions suitable for vegetation growth and therefore high biodiversity. Z. latifolia is the dominant species of emergent vegetation in Honghu Wetland. Monitoring Z. latifolia is crucial to understanding the processes and laws of the carbon cycle in the Honghu Wetland ecosystem.
2.2 Acquisition of UAV-based RGB images
Based on the experience of field surveys conducted over several consecutive months, we selected four plots within the study area, namely Area A, B, C and D, for UAV-based RGB image acquisition. The four sample areas are located in the riparian zone and have rich vegetation types, which can typically represent the growth status of Z. latifolia in Honghu Wetland. The UAV flight mission was deployed on July 29 and 30, 2021, when Z. latifolia reached its peaking growing season. All the flights were conducted from 10:00 to 12:00 in cloudless and windless weather conditions. The original RGB images were acquired by the L1D-20c camera on a DJI Mavic Pro drone at an altitude of 100 m, with a lateral overlap of 70% and a forward overlap of 80%. The exposure and shutter speed were set depending on the light conditions. All images were imported to Pix4Dmapper to generate digital orthophoto maps (DOM) and digital surface models (DSM) for four plots. The final spatial resolution of the acquired RGB images was approximately 2.4 cm.
2.3 Field sampling data
We carried out field surveys simultaneously with UAV missions in four areas. Each plot had a large area of Z. latifolia, with vigorous growth stages and an average height of 1.20 to 1.54 m. A total of 38 sampling areas (0.6 m .6 m) containing only Z. latifolia were randomly distributed in four areas (Figure 1). The geographical coordinates and average height of each sampling area were recorded. The Z. latifolia above the water level was harvested, and the AGB was measured using an electronic scale with an accuracy of 10 g. Out of the 38 field samples, 30 samples were selected randomly for modeling, and the remaining 8 samples were used for model validation.
3 Methods
In this study, the UAV-based RGB images and field survey data were used to estimate the AGB of Z. latifolia in Honghu Wetland. As shown in Figure 2, there were four main steps, including image pre-processing, spatial distribution mapping of Z. latifolia, correlation analysis between vegetation indices and the AGB, construction and accuracy assessment of AGB estimation models.
3.1 The object-based classification method
The object-based classification method uses the objects aggregated by pixels with minimal heterogeneity for classification, which is different from the traditional pixel-based classification method. Semantic features of objects derived from high-resolution images, such as texture, shape, topology and context, are used as inputs for machine learning algorithms to distinguish feature categories (Chen et al., 2018). Previous studies have reported that reducing the number of high-dimensional features is crucial for enhancing classifier performance, and the recursive feature elimination (RFE) algorithm is a commonly used feature selection method (Fu et al., 2022). Our previous study has also demonstrated that the combination of multi-feature selection (using the RFE) and object-based classification method can significantly improve the classification accuracy of wetland vegetation, with an overall accuracy exceeding 90% and the kappa above 0.9, and user’s accuracy (UA) and producer’s accuracy (PA) of Z. latifolia were 75% and 95.45% (Zhou et al., 2021). This accuracy is considered to meet the follow-up requirements for the AGB estimation of Z. latifolia.
In the present study, we first extracted a total of 53 features including spectral information, texture features, vegetation indices, height information and geometric features in eCognition Developer 9.0. Then, the RFE was used for multi-feature selection to remove redundant features in RStudio. The selected features were set as the input of the RF model for Z. latifolia classification. Finally, the spatial distribution of Z. latifolia in four areas was obtained through this semi-automated classification process.
3.2 Selection of visible vegetation indices
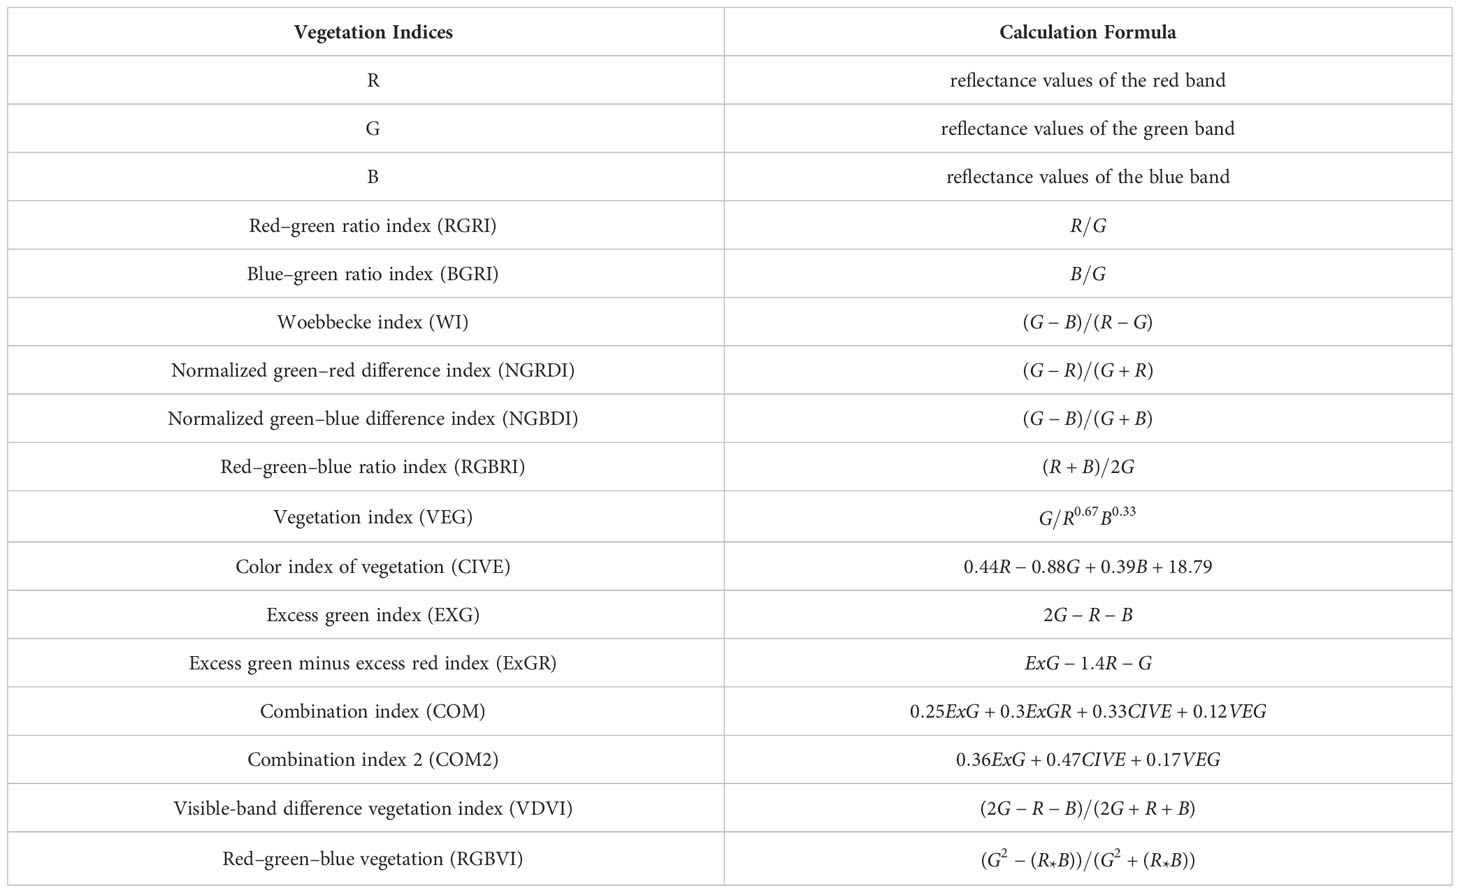
A visible vegetation index is formed by the combination of R, G and B bands, which effectively reflects the changes in vegetation canopy spectral information, and is widely used in vegetation classification and biomass estimation (Zhang et al., 2019). Based on existing research results, 17 commonly used visible light vegetation indices were extracted from UAV-based RGB images, including R, G, B, Red–green ratio index (RGRI), Blue–green ratio index (BGRI), Woebbecke index (WI), Normalized green–red difference index (NGRDI), Normalized green–blue difference index (NGBDI), Red–green–blue ratio index (RGBRI), Vegetation index (VEG), Color index of vegetation (CIVE), Excess green index (ExG), Excess green minus excess red index (ExGR), Combination index (COM), Combination index 2 (COM2), Visible-band difference vegetation index (VDVI) and Red–green–blue vegetation (RGBVI) (Woebbecke et al., 1995; Guijarro et al., 2011; Guerrero et al., 2012; Calderon et al., 2013; Torres-Sanchez et al., 2014; Bendig et al., 2015; Du and Noguchi, 2017; Wan et al., 2018; Xie et al., 2020). The description of each vegetation index is shown in Table 1. To avoid data redundancy by using all the vegetation indices for modeling, Pearson Correlation Analysis was used to study the correlation between the AGB of Z. latifolia and vegetation indices, and the main determinants of the biomass were determined. In this study, the ground resolution of the UAV-RGB images in four areas was resampled to 0.6 m to keep it consistent with the size of the field samples. Centering on each sample point, we calculated the average of the 5 pixels as the value of each vegetation index. Then, IBM SPSS Statistics 25 and RStudio software were used to execute correlation analysis and visualization.
3.3 Construction of AGB estimation models
3.3.1 Univariate regression analyses
Regression analysis modeling is used to study the quantitative relationship between different variables by establishing mathematical models and is widely applied in biomass inversion (Gao et al., 2017). In this paper, the AGB of Z. latifolia was taken as the dependent variable, and vegetation indices were taken as independent variables. The linear, quadratic and exponential models with single variable were constructed, and the accuracy of each regression model was compared to obtain the optimal regression model for the AGB inversion of Z. latifolia.
3.3.2 Artificial neural network model
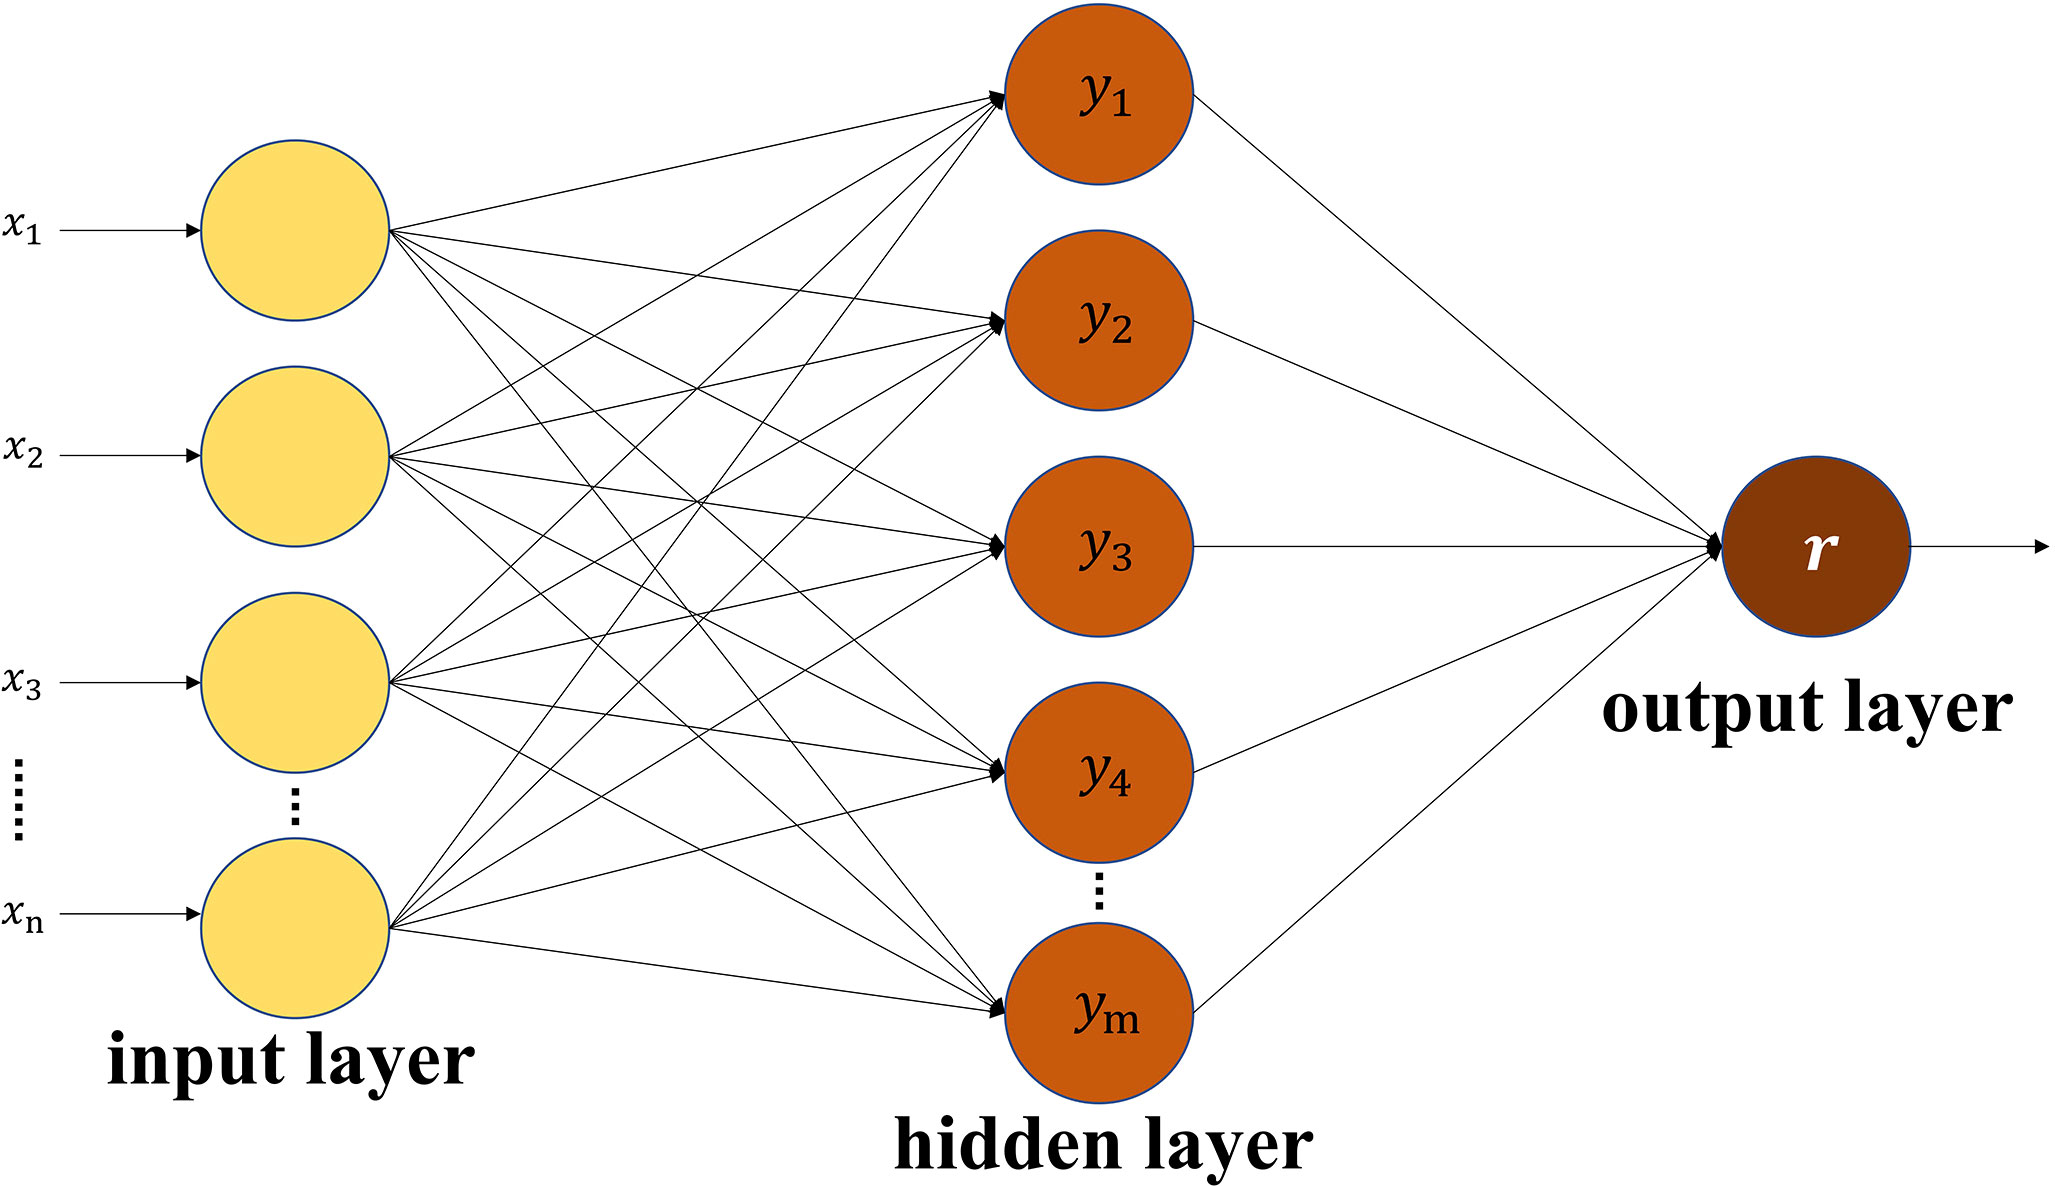
The artificial neural network model can better simulate the nonlinear relationship between each variable, reduce the error caused by human intervention, and is more practical than other linear or nonlinear regression models (Deb et al., 2017; Yang et al., 2018). The BPNN is one of the most widely used neural network models with obvious advantages for complex data processing. It approximates the original law of the data mainly through repeated training and continuous fitting (Han et al., 2018). The BPNN is a multi-layer feedforward network trained by an error back propagation algorithm, which mainly includes two processes: information forward propagation and error back propagation. A three-layer BP neural network model is composed of an input layer, a hidden layer and an output layer (Yang et al., 2018). As shown in Figure 3, n is the number of input neurons, m is the number of hidden neurons, and r is the output neuron of the output layer (Wang et al., 2019). The number of neurons in the hidden layer needs to be determined through experience and repetitive experiments, which affects the effect of model fitting. The basic idea of the BPNN is to input samples to the hidden layer for processing and then transmit it to the output layer. If the error is large, it will carry out back propagation, and reduce the error by modifying the number of neurons until the expected value is reached, and then the network training is completed.
In this study, the BPNN model was constructed using the neural network toolbox in Matlab software. Vegetation indices strongly correlated with the AGB of Z. latifolia were used as the input of the BPNN model, and the parameters were continuously adjusted until the constructed model met the accuracy requirements.
3.4 Model accuracy assessment
The mean absolute error (MAE), RMSE and R2 were used to evaluate the performance of each model. MAE represents the average value of the absolute errors. RMSE is used to measure the deviation between the predicted value and the measured value. R2 is a commonly used index to judge the fitting effect of a model with a value between 0 and 1. A model with a higher R2, a smaller MAE and RMSE owns higher AGB inversion accuracy (Yue et al., 2019). The calculation formula is shown as follows (Huang et al., 2016):
where is the measured AGB of sample i, is the estimated AGB of sample i, the estimated mean AGB, n is the number of validation samples.
4 Results
4.1 Spatial distribution mapping of Z. latifolia
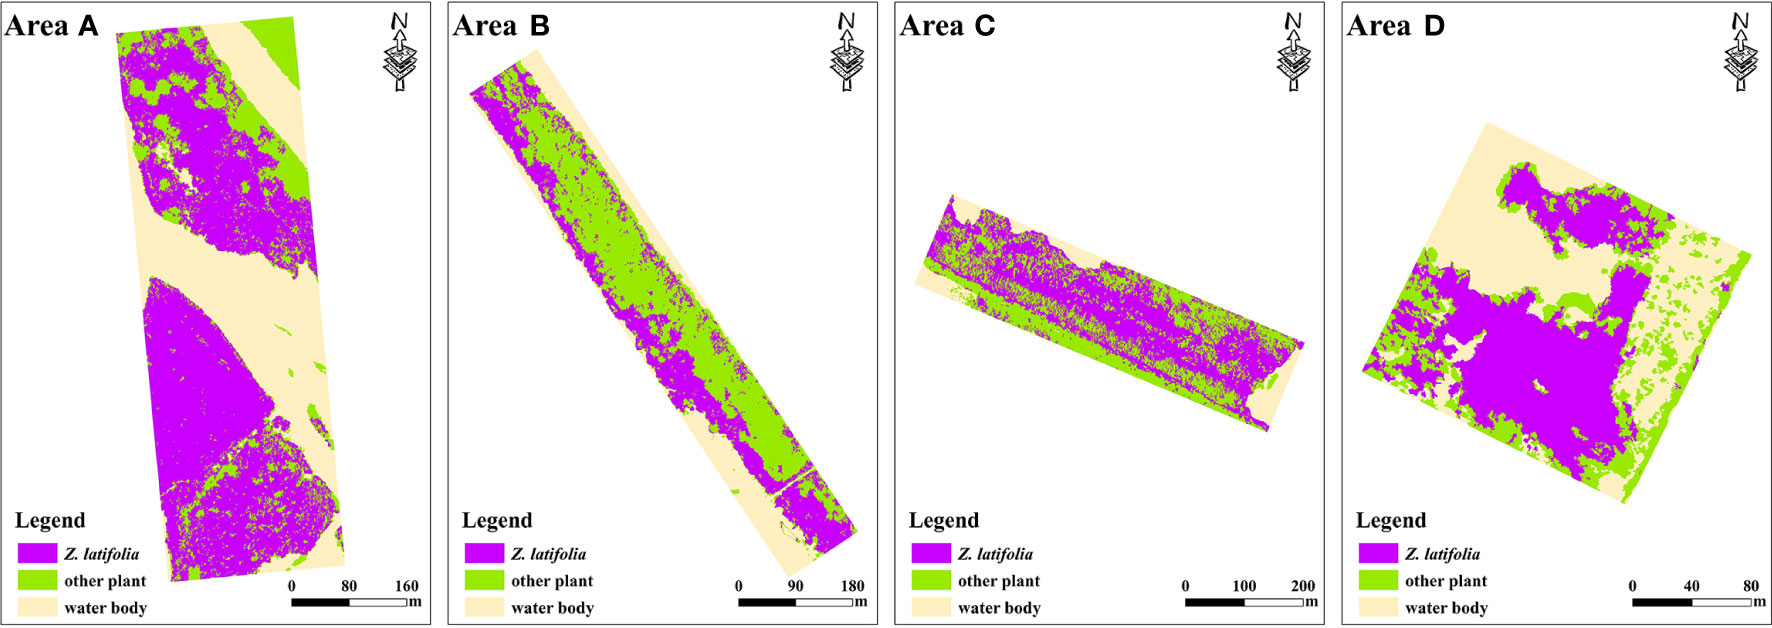
According to the features derived from the UAV-RGB images, the spatial information of Z. latifolia in area A-D was extracted (Figure 4). Based on field surveys, we selected 231 ground validation samples to evaluate the classification accuracy of Z. latifolia. The validation results showed that the overall accuracy was more than 90.7%. Z. latifolia had fewer misclassifications and omission classifications, with both the PA and UA exceeding 90%, which was considered to meet the experimental requirements of subsequent AGB inversion.
4.2 Correlation analysis
The visualization result of the correlation matrix showed that eight of seventeen vegetation indices were significantly correlated with the AGB of Z. latifolia (Figure 5). We discovered that the measured AGB of Z. latifolia had a strong negative correlation with CIVE (-0.870), and a strong positive correlation with ExG (0.866) and COM2 (0.837). In addition, the AGB was also positively correlated with G (0.736), B (0.662) and R (0.584), and negatively correlated with ExGR (-0.534) and COM (-0.476). The remaining nine of seventeen vegetation indices were not correlated with the AGB of Z. latifolia.
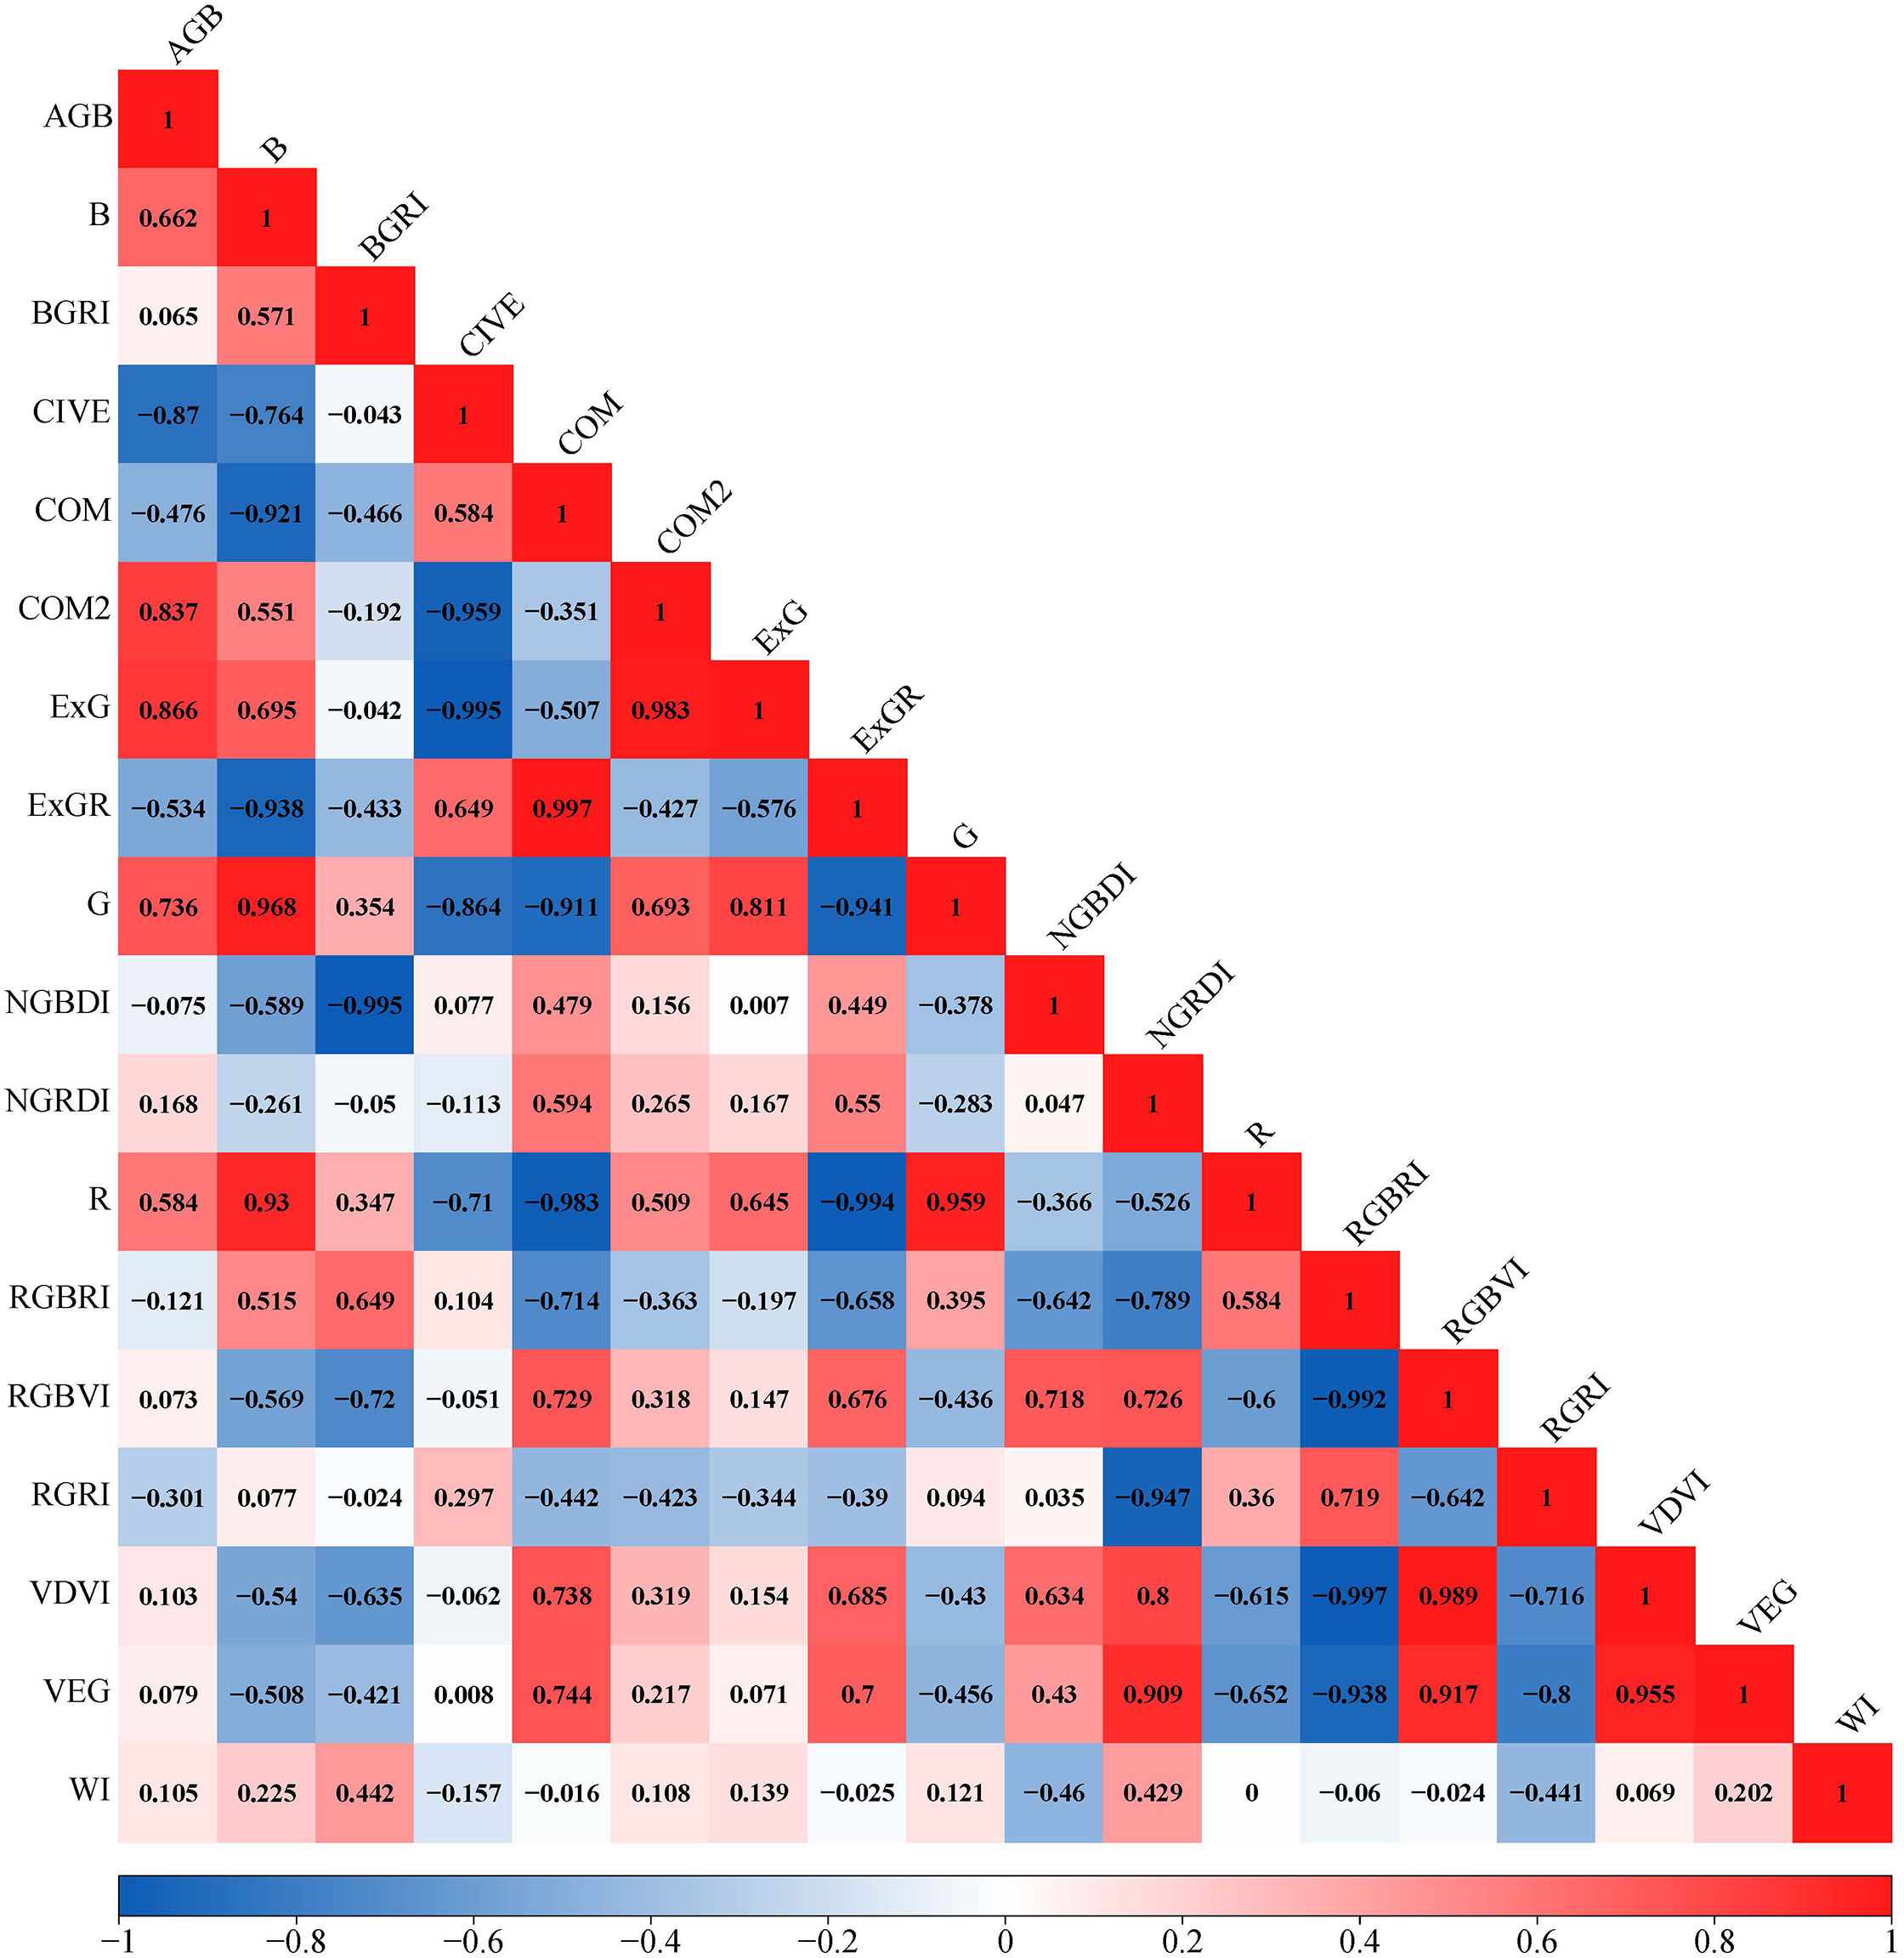
Figure 5 Visualization of the correlation matrix for vegetation indices and the AGB. Red indicates positive correlation, blue indicates negative correlation, and the darker the color, the stronger the correlation.
4.3 Accuracy assessment of univariate regression models
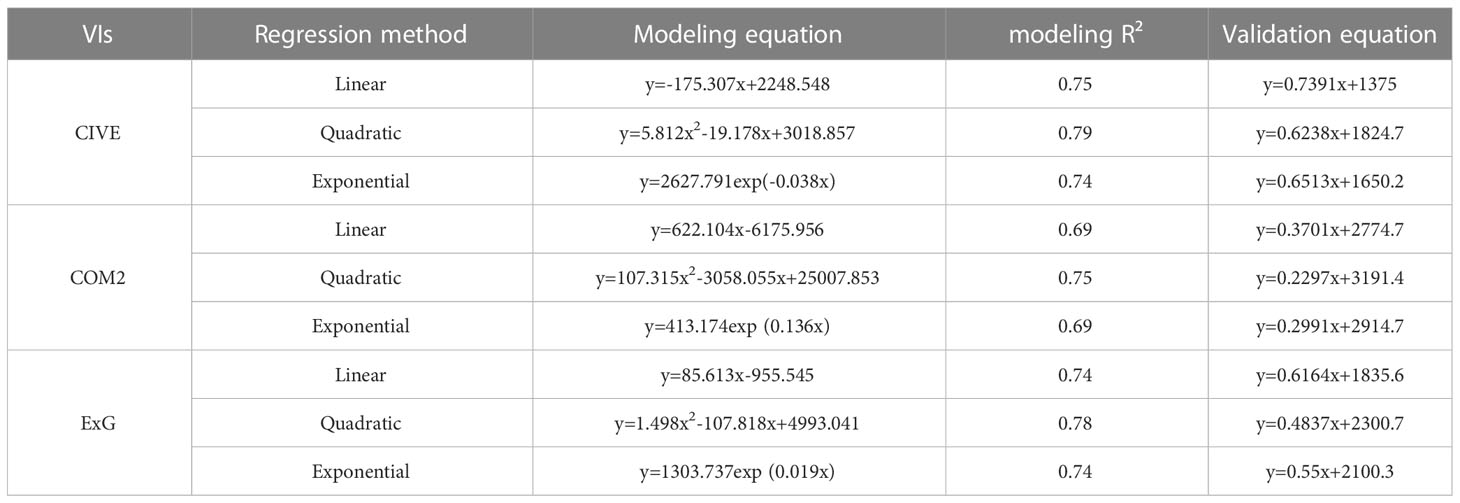
According to the correlation analysis, vegetation indices with an absolute correlation greater than 0.8 (CIVE, ExG and COM2) were selected to construct univariate regression models (Table 2). For different vegetation indices, the modeling R2 of the quadratic model were all greater than or equal to 0.75 and were higher than those of the linear and exponential models. The quadratic model constructed by CIVE had the highest modeling R2 (0.79) which was higher than that of the quadratic model constructed by ExG (0.78) and COM2 (0.75). According to the accuracy validation results in Figure 6, CIVE was the best vegetation index for the AGB inversion of Z. latifolia. The quadratic model constructed by CIVE had the optimal inversion accuracy (validation R2 = 0.37, RMSE=853.76 g/m2 and MAE=671.28 g/m2), followed by the quadratic model constructed by ExG (validation R2 = 0.29, RMSE=851.34 g/m2 and MAE=687.33 g/m2).
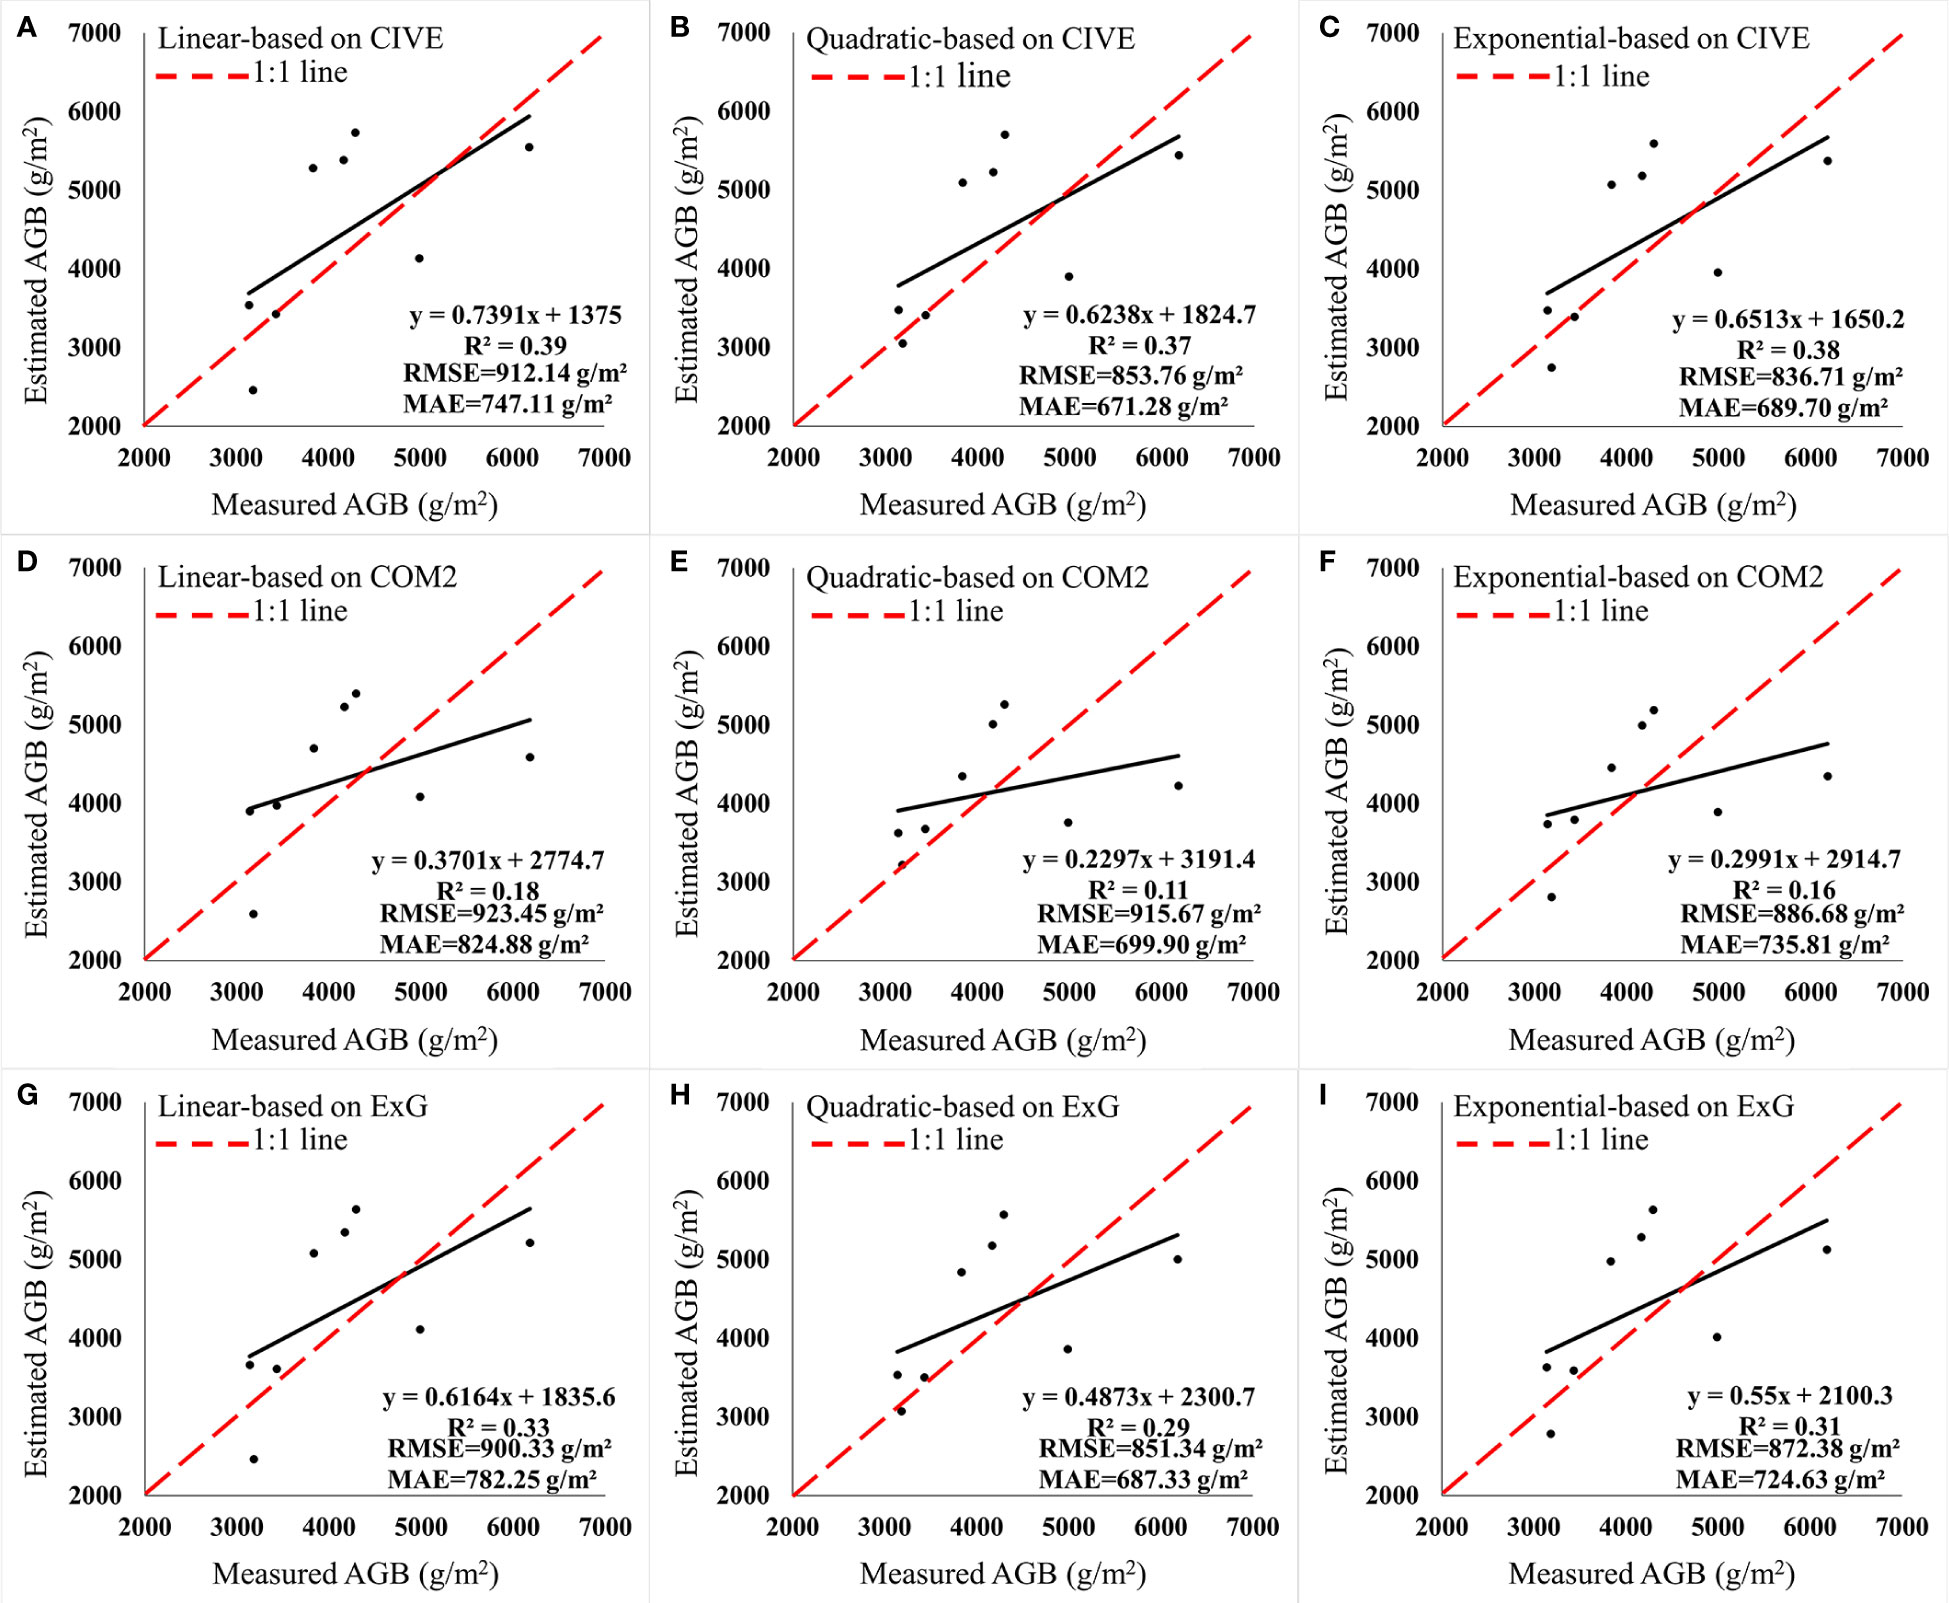
Figure 6 Accuracy validation of univariate regression models. (A–C) Models based on CIVE. (D–F) Models based on COM2. (G–I) Models based on ExG.
4.4 Accuracy assessment of the BPNN model
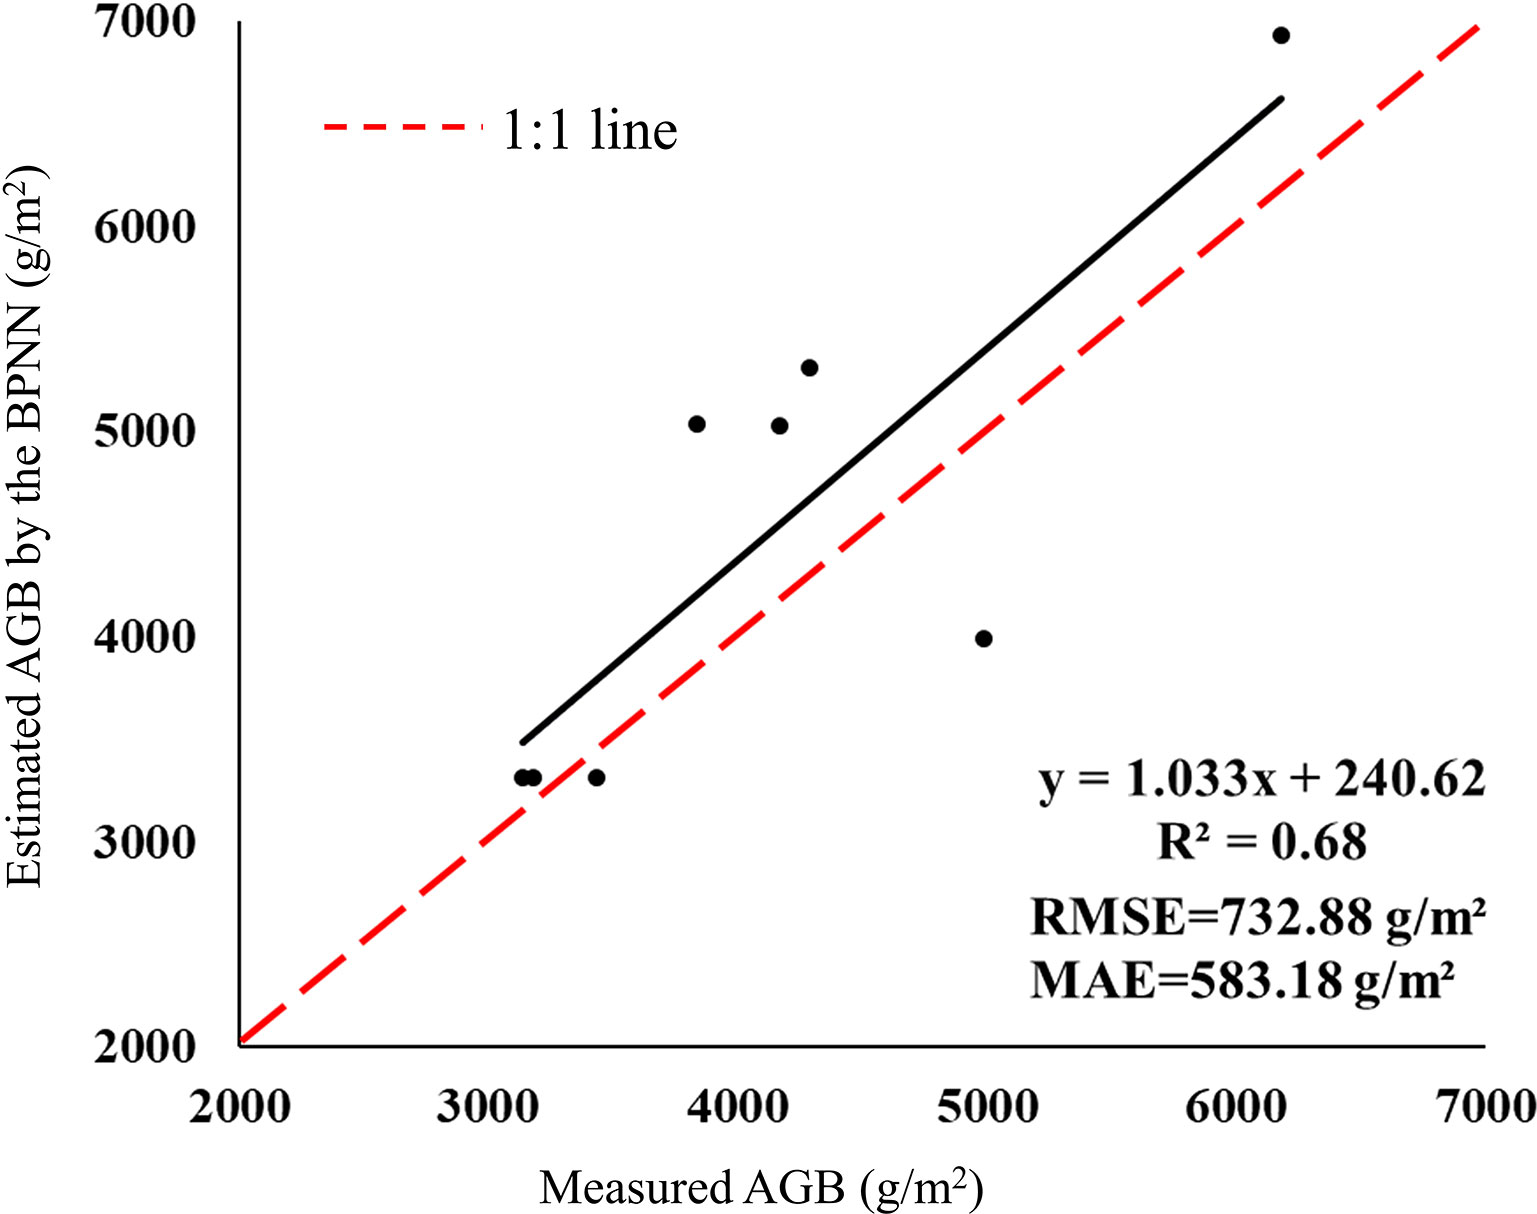
The R, G, B, ExG, ExGR, CIVE, COM and COM2, which are significantly correlated with the AGB of Z. latifolia, were selected as model inputs and the measured AGB was set as the model output. The range of the neuron numbers in the hidden layer was calculated based on a previously published formula, and then the optimal neuron number was determined through repeated experiments (Guo et al., 2000). Finally, the optimal neuron number in the hidden layer was set as three. The Levenberg-Marquardt algorithm (trainlm) was selected as the training method, and the maximum iteration was set as 1000. After continuous training, the final BPNN constructed met the accuracy requirements with a validation R2 of 0.68, RMSE and MAE of 732.88 g/m2 and 583.18 g/m2, respectively (Figure 7). Compared with the quadratic model constructed by CIVE, the validation R2 of the BPNN was increased by 0.31, RMSE and MAE were reduced by 120.88 g/m2 and 88.10 g/m2, respectively. The results showed that the inversion accuracy of the BPNN model was significantly improved compared with univariate models, indicating that the BPNN model could effectively improve the AGB inversion accuracy of Z. latifolia.
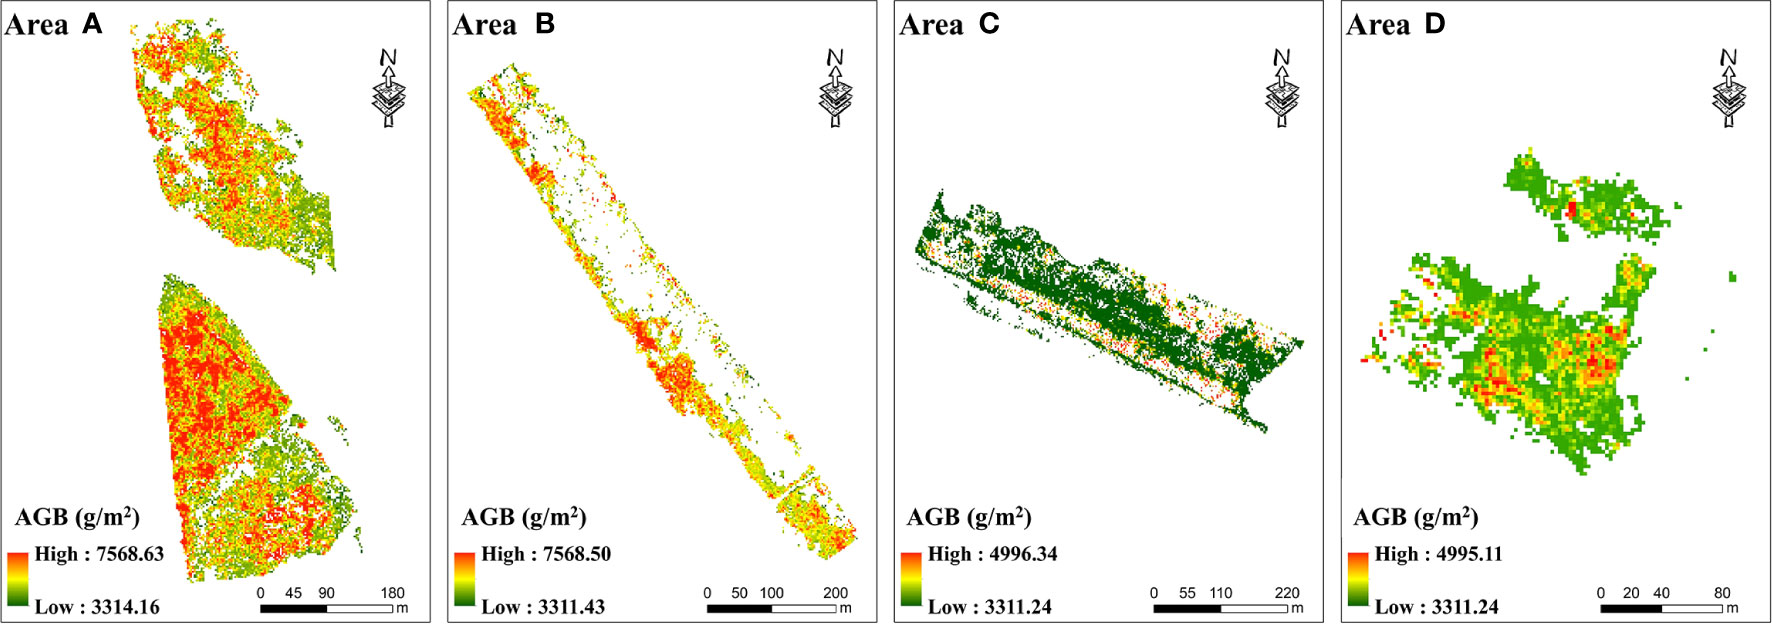
The BPNN model satisfying the inversion accuracy requirements was used to simulate the AGB of Z. latifolia in Area A, B, C and D. As shown in Figure 8, the highest AGB of Z. latifolia was about 7568 g/m2 in Area A and B, and about 4996 g/m2 in Area C and D. There was no significant difference in the lowest AGB of four areas, which was about 3311 g/m2. Area B had the highest average AGB at 6132.57 g/m2, while Area A had a slightly lower average AGB at 5879.54 g/m2. The average AGB of Area C and Area D was 3499.97 g/m2 and 3653.96 g/m2, respectively, which was lower than Area A and B.
5 Discussion
5.1 Correlations between AGB and vegetation indices
In the present study, the AGB of Z. latifolia was positively correlated with ExG, COM2, R, G, and B, and negatively correlated with ExGR, CIVE, and COM. Our results confirmed that CIVE, COM2, and ExG were the most important metrics for the AGB inversion of Z. latifolia, with the a correlation coefficient above 0.8 in absolute value, which is consistent with previous research results (Zhang et al., 2018; Kutugata et al., 2021; Anchal et al., 2022; Chen et al., 2022). According to the results of the correlation visualization, there is a high correlation between vegetation indices. Only WI had a poor correlation with other vegetation indices, and Morgan et al. (Morgan et al., 2021) also had similar results in their previous study. Vegetation indices are closely related to vegetation growth. The visible vegetation indices derived from high-resolution RGB images make it possible to quickly and economically monitor wetland vegetation biomass. Due to the different characteristics of wetland vegetation, the construction and selection of vegetation indices is important to improve the accuracy of biomass estimation.
5.2 Advantages and disadvantages of BPNN models
Compared with the traditional univariate regression models, BPNN models have strong advantages in solving complex non-linear data, enhancing data processing efficiency and improving the AGB estimation accuracy. Numerous studies have confirmed the usefulness of BPNN models for vegetation classification, grass biomass inversion, and vegetation growth monitoring, but their superiority in wetland vegetation biomass estimation has been less elaborated (Zhu et al., 2015; Yang et al., 2018; Wang et al., 2019). In this study, the BPNN model constructed by the vegetation indices that were significantly correlated with the AGB of Z. latifolia achieved high estimation accuracy with a validation R2 of 0.68, RMSE and MAE of 732.88 g/m2 and 583.18 g/m2, respectively. The estimation accuracy of the BPNN model was significantly higher than that of traditional regression models, which is consistent with the results of previous studies (Yang et al., 2018; Zhu et al., 2019). Therefore, BPNN models hold potential in the monitoring and mapping the biomass of wetland vegetation, but still suffer from some disadvantages such as slow convergence speed and being easily trapped in local minima (Wang et al., 2017b; Gao et al., 2018; Wang et al., 2019). The commonly used machine learning algorithms such as RF, SVM, etc., have specific advantages and disadvantages. Whether the combination of multiple machine learning algorithms can effectively improve the inversion accuracy of biomass of wetland vegetation in subsequent studies needs to be further explored.
5.3 AGB estimation by using UAV-based RGB imagery
Due to the complexity of wetland environments, monitoring wetland vegetation at the species level has been studied poorly. However, the biomass mapping of dominant species in wetlands is ecologically important. In this study, we have achieved high accuracy in the AGB inversion, which can provide a reference for monitoring Z. latifolia, as well as other dominant species in wetlands. We demonstrated that high-resolution UAV-based RGB imagery can bridge the gap between field survey data and remote sensing data, making it possible to map species-level biomass. This is consistent with other studies that UAVs as an emerging low-altitude remote sensing technology can provide cost-effective manners for surveying and monitoring resources, such as barley biomass estimation, tree count derivation, and forest biomass estimation (Bendig et al., 2015; Mohan et al., 2017). Our previous study showed that high-resolution UAV-based RGB imagery enables fine classifications of wetland vegetation, laying the foundation for subsequent biomass inversion of individual species (Zhou et al., 2021). Lopatin et al. (Lopatin and Lopatina, 2017) also successfully conducted a similar study using UAV imagery to map the biomass distribution of Phragmites australis, and pointed out that UAV remote sensing has great potential to provide accurate maps of biomass distribution at different phenological stages.
In this study, despite providing an effective technical method for the AGB estimation of wetland vegetation at the species level, there are still some limitations. First, wetland environments are complex with low accessibility, and the limited number of field samples affects the generalization ability of the BPNN model and reduces the estimation accuracy. Second, it is difficult to implement biomass inversion on a large scale due to the limited coverage area of UAV images. Based on current research status, further studies can explore the use of non-destructive indicators acquired from UAV imagery to invert wetland vegetation biomass, such as Fractional Vegetation Cover (FVC), which can not only avoid the difficulties of sample collection, but also reduces the damage to the wetland environment caused by field sampling. Similar studies have been done to demonstrate that there is a correlation between FVC and the biomass of shrub communities (Guo et al., 2021). However, the applicability in the estimation of wetland vegetation biomass remains to be verified. In addition, due to the convenience and timeliness of consumer UAVs, we can construct a field sample library for vegetations at different phenological stages in the expectation of achieving automatic matching of vegetation biomass. Although using the visible vegetation indices for the AGB estimation can yield satisfactory results, the influence of the introduction of texture features generated by UAV high-resolution images on the estimation accuracy remains to be explored. Furthermore, the combination of multi-source remote sensing data is an efficient way to achieve high-precision inversion of wetland vegetation biomass on a large scale. UAV imagery has ultra-high resolution but limited coverage, whereas satellite remote sensing data have wide spatial coverage and can provide abundant spectral information. For example, new hyperspectral images (e.g., GF-5, EnMap and PRISMA) contain hundreds of consecutive narrow bands, providing new possibilities for more accurate quantitative estimation of vegetation traits (Castaldi et al., 2016; Verrelst et al., 2021). The combination of multiplatform remote sensing data is powerful for dynamically monitor wetland vegetation with high application potential (Gao et al., 2019).
High-resolution remote sensing images provided by consumer-grade UAVs can realize high-precision wetland vegetation biomass inversion at the species level. Overcoming temporal and spatial limitations, this technique can assist in mapping biomass distribution, which is of great significance to the monitoring of invasive and dominant species, with great application prospects.
6 Conclusion
In this study, univariate regression models and the BPNN were compared to estimate the AGB of Z. latifolia in Honghu Wetland, demonstrating the feasibility of using UAV-based RGB images to monitor the growth status of wetland vegetation. The main conclusions are as follows:
(1) The AGB of Z. latifolia was significantly correlated with CIVE, COM2, ExG, G, ExGR, COM, R and B. The highest correlation was found with CIVE with an absolute correlation coefficient of 0.87. The vegetation index derived from the UAV RGB images can be used as an indicator for the AGB inversion of Z. latifolia.
(2) Among the univariate regression models constructed by CIVE, COM2 and ExG, the quadratic model based on CIVE has the highest inversion accuracy (validation R2 = 0.37, RMSE=853.76 g/m2, MAE = 671.28 g/m2). The BPNN constructed with eight vegetation indices had the best inversion effect (validation R2 = 0.68, RMSE=732.88 g/m2, MAE=583.18 g/m2). Compared with the quadratic model constructed by CIVE, the validation R2 was increased by 0.31, RMSE and MAE were reduced by 120.88 g/m2 and 88.10 g/m2, respectively. The results showed that the BPNN was the best model for the AGB inversion of Z. latifolia in Honghu Wetland.
(3) Although the spectral information of UAV-based RGB images is limited, their high-resolution can provide abundant features, which is helpful for the classification and biomass inversion of wetland vegetation at the species level. Consumer-grade UAVs are easier to deploy in complex wetland environments and have a distinct advantage in data acquisition. Future research should focus on the use of UAV images combined with satellite remote sensing images to monitor the growth of different types of wetland vegetation, and explore the relationship between non-destructive indicators and vegetation biomass.
Data availability statement
The raw data supporting the conclusions of this article will be made available by the authors, without undue reservation.
Author contributions
RZ, EL, and CY conceived the study, designed the experiments, and collected the data. RZ analyzed the data and completed the laboratory experiments. RZ, EL, and CY constructed the methodological framework and engaged in critical discussion. RZ wrote the manuscript. EL, CY, XC, and XW revised the manuscript. All authors contributed to the article and approved the submitted version.
Funding
This work was supported by the Hubei Provincial Natural Science Foundation of China (Grant No. 2022CFB335), the Natural Science Foundation of China (Grant No. 42171381, U22A20567,42204136).
Acknowledgments
We are grateful to the Honghu Wetland Nature Reserve Administration for the access to the study area and field facilities. Thanks to the Key Laboratory for Environment and Disaster Monitoring and Evaluation of Hubei for providing the UAV equipment and data processing software.
Conflict of interest
The authors declare that the research was conducted in the absence of any commercial or financial relationships that could be construed as a potential conflict of interest.
Publisher’s note
All claims expressed in this article are solely those of the authors and do not necessarily represent those of their affiliated organizations, or those of the publisher, the editors and the reviewers. Any product that may be evaluated in this article, or claim that may be made by its manufacturer, is not guaranteed or endorsed by the publisher.
References
Abeysinghe, T., Milas, A. S., Arend, K., Hohman, B., Reil, P., Gregory, A., et al. (2019). Mapping invasive phragmites australis in the old woman creek estuary using UAV remote sensing and machine learning classifiers. Remote Sens. 11 (11), 1380. doi: 10.3390/rs11111380
Adam, E., Mutanga, O., Rugege, D. (2010). Multispectral and hyperspectral remote sensing for identification and mapping of wetland vegetation: a review. Wetlands Ecol. Manage. 18 (3), 281–296. doi: 10.1007/s11273-009-9169-z
Anchal, S., Bahuguna, S., Pal, P. K., Kumar, D., Murthy, P. V. S., Kumar, A., et al. (2022). Non-destructive method of biomass and nitrogen (N) level estimation in stevia rebaudiana using various multispectral indices. Geocarto Int. 37 (22), 6409–6421. doi: 10.1080/10106049.2021.1939436
Anderson, C. J., Heins, D., Pelletier, K. C., Bohnen, J. L., Knight, J. F. (2021). Mapping invasive phragmites australis using unoccupied aircraft system imagery, canopy height models, and synthetic aperture radar. Remote Sens. 13 (16), 3303. doi: 10.3390/rs13163303
Bendig, J., Yu, K., Aasen, H., Bolten, A., Bennertz, S., Broscheit, J., et al. (2015). Combining UAV-based plant height from crop surface models, visible, and near infrared vegetation indices for biomass monitoring in barley. Int. J. Appl. Earth Observation Geoinformation 39, 79–87. doi: 10.1016/j.jag.2015.02.012
Brooks, C., Weinstein, C., Poley, A., Grimm, A., Marion, N., Bourgeau-Chavez, L., et al. (2021). Using uncrewed aerial vehicles for identifying the extent of invasive phragmites australis in treatment areas enrolled in an adaptive management program. Remote Sens. 13 (10), 1895. doi: 10.3390/rs13101895
Calderon, R., Navas-Cortes, J. A., Lucena, C., Zarco-Tejada, P. J. (2013). High-resolution airborne hyperspectral and thermal imagery for early, detection of verticillium wilt of olive using fluorescence, temperature and narrow-band spectral indices. Remote Sens. Environ. 139, 231–245. doi: 10.1016/j.rse.2013.07.031
Cao, J. J., Leng, W. C., Liu, K., Liu, L., He, Z., Zhu, Y. H. (2018). Object-based mangrove species classification using unmanned aerial vehicle hyperspectral images and digital surface models. Remote Sens. 10 (1), 20. doi: 10.3390/rs10010089
Castaldi, F., Palombo, A., Santini, F., Pascucci, S., Pignatti, S., Casa, R. (2016). Evaluation of the potential of the current and forthcoming multispectral and hyperspectral imagers to estimate soil texture and organic carbon. Remote Sens. Environ. 179, 54–65. doi: 10.1016/j.rse.2016.03.025
Chen, Y. L., Fang, S. B., Sun, M., Liu, Z. P., Pan, L. H., Mo, W. H., et al. (2022). Mangrove growth monitoring based on camera visible images-a case study on typical mangroves in guangxi. Front. Earth Sci. 9. doi: 10.3389/feart.2021.771753
Chen, G., Weng, Q. H., Hay, G. J., He, Y. N. (2018). Geographic object-based image analysis (GEOBIA): emerging trends and future opportunities. Giscience Remote Sens. 55 (2), 159–182. doi: 10.1080/15481603.2018.1426092
Corti Meneses, N., Brunner, F., Baier, S., Geist, J., Schneider, T. (2018). Quantification of extent, density, and status of aquatic reed beds using point clouds derived from UAV-RGB imagery. Remote Sens. 10 (12), 18. doi: 10.3390/rs10121869
Deb, D., Singh, J. P., Deb, S., Datta, D., Ghosh, A., Chaurasia, R. S. (2017). An alternative approach for estimating above ground biomass using resourcesat-2 satellite data and artificial neural network in bundelkhand region of India. Environ. Monit. Assess. 189 (11), 576. doi: 10.1007/s10661-017-6307-6
Doughty, C. L., Ambrose, R. F., Okin, G. S., Cavanaugh, K. C. (2021). Characterizing spatial variability in coastal wetland biomass across multiple scales using UAV and satellite imagery. Remote Sens. Ecol. Conserv. 7 (3), 411–429. doi: 10.1002/rse2.198
Doughty, C. L., Cavanaugh, K. C. (2019). Mapping coastal wetland biomass from high resolution unmanned aerial vehicle (UAV) imagery. Remote Sens. 11 (5), 16. doi: 10.3390/rs11050540
Du, M. M., Noguchi, N. (2017). Monitoring of wheat growth status and mapping of wheat yield's within-field spatial variations using color images acquired from UAV-camera system. Remote Sens. 9 (3), 289. doi: 10.3390/rs9030289
Durgan, S. D., Zhang, C. Y., Duecaster, A., Fourney, F., Su, H. B. (2020). Unmanned aircraft system photogrammetry for mapping diverse vegetation species in a heterogeneous coastal wetland. Wetlands 40 (6), 2621–2633. doi: 10.1007/s13157-020-01373-7
Fu, B. L., He, X., Yao, H., Liang, Y. Y., Deng, T. F., He, H. C., et al. (2022). Comparison of RFE-DL and stacking ensemble learning algorithms for classifying mangrove species on UAV multispectral images. Int. J. Appl. Earth Observation Geoinformation 112, 102890. doi: 10.1016/j.jag.2022.102890
Fu, B. L., Liu, M., He, H. C., Lan, F. W., He, X., Liu, L. L., et al. (2021). Comparison of optimized object-based RF-DT algorithm and SegNet algorithm for classifying karst wetland vegetation communities using ultra-high spatial resolution UAV data. Int. J. Appl. Earth Observation Geoinformation 104, 15. doi: 10.1016/j.jag.2021.102553
Gao, Y. N., Gao, J. F., Wang, J., Wang, S. S., Li, Q., Zhai, S. H., et al. (2017). Estimating the biomass of unevenly distributed aquatic vegetation in a lake using the normalized water-adjusted vegetation index and scale transformation method. Sci. Total Environ. 601, 998–1007. doi: 10.1016/j.scitotenv.2017.05.163
Gao, Y. N., Li, Q., Wang, S. S., Gao, J. F. (2018). Adaptive neural network based on segmented particle swarm optimization for remote-sensing estimations of vegetation biomass. Remote Sens. Environ. 211, 248–260. doi: 10.1016/j.rse.2018.04.026
Gao, Y., Liang, Z. Y., Wang, B., Wu, Y. L., Liu, S. Y. (2019). UAV and satellite remote sensing images based aboveground biomass inversion in the meadows of lake shengjin. J. Lake Sci. 31 (2), 517–528.
Guerrero, J. M., Pajares, G., Montalvo, M., Romeo, J., Guijarro, M. (2012). Support vector machines for crop/weeds identification in maize fields. Expert Syst. Appl. 39 (12), 11149–11155. doi: 10.1016/j.eswa.2012.03.040
Guijarro, M., Pajares, G., Riomoros, I., Herrera, P. J., Burgos-Artizzu, X. P., Ribeiro, A. (2011). Automatic segmentation of relevant textures in agricultural images. Comput. Electron. Agric. 75 (1), 75–83. doi: 10.1016/j.compag.2010.09.013
Guo, Z. C., Wang, T., Liu, S. L., Kang, W. P., Chen, X., Feng, K., et al. (2021). Biomass and vegetation coverage survey in the mu us sandy land - based on unmanned aerial vehicle RGB images. Int. J. Appl. Earth Observation Geoinformation 94, 102239. doi: 10.1016/j.jag.2020.102239
Guo, H. T., Zhang, D. L., Ma, G. F. (2000). Some problems to be considered in using BP algorithm. J. Jiamusi University(Natural Sci. Edition) 18 (4), 363–365.
Han, S., Zhen, Y., Tan, Q. M., Liu, Y. Q., Zhang, H. B. (2018). Remote sensing inversion of aboveground biomass in yancheng coastal wetlands. For. Resour. Manage. 4), 105–111.
Huang, C. D., Ye, X. Y., Deng, C. B., Zhang, Z. L., Wan, Z. (2016). Mapping above-ground biomass by integrating optical and SAR imagery: a case study of xixi national wetland park, China. Remote Sens. 8 (8), 647. doi: 10.3390/rs8080647
Jing, R., Gong, Z. N., Zhao, W. J., Pu, R. L., Deng, L. (2017). Above-bottom biomass retrieval of aquatic plants with regression models and SfM data acquired by a UAV platform - a case study in wild duck lake wetland, Beijing, China. Isprs J. Photogrammetry Remote Sens. 134, 122–134. doi: 10.1016/j.isprsjprs.2017.11.002
Klemas, V. V. (2015). Coastal and environmental remote sensing from unmanned aerial vehicles: an overview. J. Coast. Res. 31 (5), 1260–1267. doi: 10.2112/jcoastres-d-15-00005.1
Kutugata, M., Hu, C. S., Sapkota, B., Bagavathiannan, M. (2021). Seed rain potential in late-season weed escapes can be estimated using remote sensing. Weed Sci. 69 (6), 653–659. doi: 10.1017/wsc.2021.39
Li, E. H., Yang, C., Cai, X. B., Wang, Z., Wang, X. L. (2021). Plant diversity and protection measures in honghu wetland. Resour. Environ. Yangtze Basin 30 (3), 623–635.
Lin, J. Y., Wang, M. M., Ma, M. G., Lin, Y. (2018). Aboveground tree biomass estimation of sparse subalpine coniferous forest with UAV oblique photography. Remote Sens. 10 (11), 19. doi: 10.3390/rs10111849
Liu, W. J., Li, Y. J., Liu, J., Jiang, J. M. (2021). Estimation of plant height and aboveground biomass of toona sinensis under drought stress using RGB-d imaging. Forests 12 (12), 1747. doi: 10.3390/f12121747
Lopatin, E., Lopatina, A. (2017). Assessing and mapping energy biomass distribution using a UAV in Finland. Biofuels-Uk 8 (4), 485–499. doi: 10.1080/17597269.2017.1302663
Meng, X. L., Shang, N., Zhang, X. K., Li, C. Y., Zhao, K. G., Qiu, X. M., et al. (2017). Photogrammetric UAV mapping of terrain under dense coastal vegetation: an object-oriented classification ensemble algorithm for classification and terrain correction. Remote Sens. 9 (11), 23. doi: 10.3390/rs9111187
Mohan, M., Silva, C. A., Klauberg, C., Jat, P., Catts, G., Cardil, A., et al. (2017). Individual tree detection from unmanned aerial vehicle (UAV) derived canopy height model in an open canopy mixed conifer forest. Forests 8 (9), 340. doi: 10.3390/f8090340
Morgan, G. R., Wang, C. Z., Morris, J. T. (2021). RGB indices and canopy height modelling for mapping tidal marsh biomass from a small unmanned aerial system. Remote Sens. 13 (17), 3406. doi: 10.3390/rs13173406
Pinton, D., Canestrelli, A., Wilkinson, B., Ifju, P., Ortega, A. (2021). Estimating ground elevation and vegetation characteristics in coastal salt marshes using UAV-based LiDAR and digital aerial photogrammetry. Remote Sens. 13 (22), 30. doi: 10.3390/rs13224506
Shao, P. S., Han, H. Y., Yang, H. J., Li, T., Zhang, D. J., Ma, J. Z., et al. (2022). Responses of above- and belowground carbon stocks to degraded and recovering wetlands in the yellow river delta. Front. Ecol. Evol. 10. doi: 10.3389/fevo.2022.856479
Sharma, P., Leigh, L., Chang, J. Y., Maimaitijiang, M., Caffe, M. (2022). Above-ground biomass estimation in oats using UAV remote sensing and machine learning. Sensors 22 (2), 601. doi: 10.3390/s22020601
Shen, X. J., Jiang, M., Lu, X. G., Liu, X. T., Liu, B., Zhang, J. Q., et al. (2021). Aboveground biomass and its spatial distribution pattern of herbaceous marsh vegetation in China. Sci. China-Earth Sci. 64 (7), 1115–1125. doi: 10.1007/s11430-020-9778-7
Torres-Sanchez, J., Pena, J. M., de Castro, A. I., Lopez-Granados, F. (2014). Multi-temporal mapping of the vegetation fraction in early-season wheat fields using images from UAV. Comput. Electron. Agric. 103, 104–113. doi: 10.1016/j.compag.2014.02.009
Verrelst, J., Rivera-Caicedo, J. P., Reyes-Munoz, P., Morata, M., Amin, E., Tagliabue, G., et al. (2021). Mapping landscape canopy nitrogen content from space using PRISMA data. Isprs J. Photogrammetry Remote Sens. 178, 382–395. doi: 10.1016/j.isprsjprs.2021.06.017
Viljanen, N., Honkavaara, E., Nasi, R., Hakala, T., Niemelainen, O., Kaivosoja, J. (2018). A novel machine learning method for estimating biomass of grass swards using a photogrammetric canopy height model, images and vegetation indices captured by a drone. Agriculture-Basel 8 (5), 70. doi: 10.3390/agriculture8050070
Villoslada Peciña, M., Bergamo, T. F., Ward, R. D., Joyce, C. B., Sepp, K. (2021). A novel UAV-based approach for biomass prediction and grassland structure assessment in coastal meadows. Ecol. Indic. 122, 107227. doi: 10.1016/j.ecolind.2020.107227
Wan, L., Li, Y. J., Cen, H. Y., Zhu, J. P., Yin, W. X., Wu, W. K., et al. (2018). Combining UAV-based vegetation indices and image classification to estimate flower number in oilseed rape. Remote Sens. 10 (9), 1484. doi: 10.3390/rs10091484
Wan, R. R., Wang, P., Wang, X. L., Yao, X., Dai, X. (2019). Mapping aboveground biomass of four typical vegetation types in the poyang lake wetlands based on random forest modelling and landsat images. Front. Plant Sci. 10. doi: 10.3389/fpls.2019.01281
Wang, J., Huang, J., Gao, P., Wei, C. W., Mansaray, L. R. (2016). Dynamic mapping of rice growth parameters using HJ-1 CCD time series data. Remote Sens. 8 (11), 931. doi: 10.3390/rs8110931
Wang, J., Liu, Z. J., Yu, H. Y., Li, F. F. (2017a). Mapping spartina alterniflora biomass using LiDAR and hyperspectral data. Remote Sens. 9 (6), 14. doi: 10.3390/rs9060589
Wang, Y. J., Shen, X. J., Tong, S. Z., Zhang, M. Y., Jiang, M., Lu, X. G. (2022). Aboveground biomass of wetland vegetation under climate change in the Western songnen plain. Front. Plant Sci. 13. doi: 10.3389/fpls.2022.941689
Wang, L., Wang, P. X., Liang, S. L., Qi, X., Li, L., Xu, L. X. (2019). Monitoring maize growth conditions by training a BP neural network with remotely sensed vegetation temperature condition index and leaf area index. Comput. Electron. Agric. 160, 82–90. doi: 10.1016/j.compag.2019.03.017
Wang, T. T., Xiao, Z. Q., Liu, Z. G. (2017b). Performance evaluation of machine learning methods for leaf area index retrieval from time-series MODIS reflectance data. Sensors 17 (1), 81. doi: 10.3390/s17010081
Woebbecke, D. M., Meyer, G. E., Vonbargen, K., Mortensen, D. A. (1995). COLOR INDEXES FOR WEED IDENTIFICATION UNDER VARIOUS SOIL, RESIDUE, AND LIGHTING CONDITIONS. Trans. Asae 38 (1), 259–269. doi: 10.13031/2013.27838
Xie, B., Yang, W. N., Wang, F. (2020). A new estimate method for fractional vegetation cover based on UV visual light spectrum. Sci. Surv. Mapp. 45, 75–77.
Yan, Y. A., Deng, L., Liu, X. L., Zhu, L. (2019). Application of UAV-based multi-angle hyperspectral remote sensing in fine vegetation classification. Remote Sens. 11 (23), 18. doi: 10.3390/rs11232753
Yang, S. X., Feng, Q. S., Liang, T. G., Liu, B. K., Zhang, W. J., Xie, H. J. (2018). Modeling grassland above-ground biomass based on artificial neural network and remote sensing in the three-river headwaters region. Remote Sens. Environ. 204, 448–455. doi: 10.1016/j.rse.2017.10.011
Yue, J. B., Yang, G. J., Tian, Q. J., Feng, H. K., Xu, K. J., Zhou, C. Q. (2019). Estimate of winter-wheat above-ground biomass based on UAV ultrahigh-ground-resolution image textures and vegetation indices. Isprs J. Photogrammetry Remote Sens. 150, 226–244. doi: 10.1016/j.isprsjprs.2019.02.022
Zhang, D. D., Mansaray, L. R., Jin, H. W., Sun, H., Kuang, Z. M., Huang, J. F. (2018). A universal estimation model of fractional vegetation cover for different crops based on time series digital photographs. Comput. Electron. Agric. 151, 93–103. doi: 10.1016/j.compag.2018.05.030
Zhang, H. F., Tang, Z. G., Wang, B. Y., Meng, B. P., Qin, Y., Sun, Y., et al. (2022). A non-destructive method for rapid acquisition of grassland aboveground biomass for satellite ground verification using UAV RGB images. Global Ecol. Conserv. 33, e01999. doi: 10.1016/j.gecco.2022.e01999
Zhang, Y., Xia, C. Z., Zhang, X. Y., Cheng, X. H., Feng, G. Z., Wang, Y., et al. (2021). Estimating the maize biomass by crop height and narrowband vegetation indices derived from UAV-based hyperspectral images. Ecol. Indic. 129, 12. doi: 10.1016/j.ecolind.2021.107985
Zhang, X. L., Zhang, F., Qi, Y. X., Deng, L. F., Wang, X. L., Yang, S. T. (2019). New research methods for vegetation information extraction based on visible light remote sensing images from an unmanned aerial vehicle (UAV). Int. J. Appl. Earth Observation Geoinformation 78, 215–226. doi: 10.1016/j.jag.2019.01.001
Zheng, H. B., Cheng, T., Zhou, M., Li, D., Yao, X., Tian, Y. C., et al. (2019). Improved estimation of rice aboveground biomass combining textural and spectral analysis of UAV imagery. Precis. Agric. 20 (3), 611–629. doi: 10.1007/s11119-018-9600-7
Zhou, Z. M., Yang, Y. M., Chen, B. Q. (2018). Estimating spartina alterniflora fractional vegetation cover and aboveground biomass in a coastal wetland using SPOT6 satellite and UAV data. Aquat. Bot. 144, 38–45. doi: 10.1016/j.aquabot.2017.10.004
Zhou, R., Yang, C., Li, E., Cai, X., Yang, J., Xia, Y. (2021). Object-based wetland vegetation classification using multi-feature selection of unoccupied aerial vehicle RGB imagery. Remote Sens. 13, 4910. doi: 10.3390/rs13234910
Zhu, Y. H., Liu, K., Liu, L., Wang, S. G., Liu, H. X. (2015). Retrieval of mangrove aboveground biomass at the individual species level with WorldView-2 images. Remote Sens. 7 (9), 12192–12214. doi: 10.3390/rs70912192
Keywords: wetland vegetation, Zizania latifolia, aboveground biomass, unoccupied aerial vehicle, back propagation neural network
Citation: Zhou R, Yang C, Li E, Cai X and Wang X (2023) Aboveground biomass estimation of wetland vegetation at the species level using unoccupied aerial vehicle RGB imagery. Front. Plant Sci. 14:1181887. doi: 10.3389/fpls.2023.1181887
Received: 08 March 2023; Accepted: 26 June 2023;
Published: 17 July 2023.
Edited by:
Yuanrun Zheng, Chinese Academy of Sciences (CAS), ChinaReviewed by:
Monica Pinardi, Institute for Electromagnetic Sensing of the Environment, ItalyJian Zhang, Huazhong Agricultural University, China
Copyright © 2023 Zhou, Yang, Li, Cai and Wang. This is an open-access article distributed under the terms of the Creative Commons Attribution License (CC BY). The use, distribution or reproduction in other forums is permitted, provided the original author(s) and the copyright owner(s) are credited and that the original publication in this journal is cited, in accordance with accepted academic practice. No use, distribution or reproduction is permitted which does not comply with these terms.
*Correspondence: Chao Yang, eWFuZ2NoYW9AY2pqZy5tZWUuZ292LmNu; Enhua Li, bGllaEB3aGlnZy5hYy5jbg==
 Rui Zhou
 Chao Yang1,3,4*
 Enhua Li