 Yan Xiao
 Xing-Juan Li2
 Xiao-Long Jiang
 Chun Li
 Dai-Ke Tian
- 1College of Life Sciences, Hunan Normal University, Changsha, China
- 2Shanghai Key Laboratory of Plant Functional Genomics and Resources, Shanghai Chenshan Botanical Garden, Shanghai, China
- 3College of Forestry, Central South University of Forestry and Technology, Changsha, China
- 4Vegetable Germplasm Innovation and Variety Improvement Key Laboratory of Sichuan Province, Horticulture Institute of Sichuan Academy of Agricultural Sciences, Chengdu, China
- 5Institute of Plant Conservation, Hunan Botanic Garden, Changsha, China
Introduction: Begonia L., one of the 10 largest plant genera, contains over 2,100 species, most of which have a very limited distribution range. Understanding the spatial genetic structure and distribution dynamics of a widespread species in this genus will contribute to clarifying the mechanism responsible for Begonia speciation.
Methods: In this study, we used three chloroplast DNA markers (ndhF-rpl32, atpI-atpH, and ndhA intron), coupled with species distribution modeling (SDM), to investigate the population genetic structure and distribution dynamics of Begonia grandis Dryand., the species of Begonia with the widest distribution in China.
Results: Thirty-five haplotypes from 44 populations clustered into two groups, and haplotype divergence began in the Pleistocene (1.75 Mya). High genetic diversity (Hd = 0.894, HT = 0.910), strong genetic differentiation (FST = 0.835), and significant phylogeographical structure (GST/NST = 0.848/0.917, P < 0.05) were observed. The distribution range of B. grandis migrated northwards after the last glacial maximum, but its core distribution area remained stable.
Discussion: Combined, the observed spatial genetic patterns and SDM results identified the Yunnan-Guizhou Plateau, the Three Gorges region, and the Daba Mountains as potential refugia of B. grandis. BEAST-derived chronogram and haplotype network analysis do not support the Flora Reipublicae Popularis Sinicae and Flora of China for subspecies classification based on morphological characteristics. Our results support the hypothesis that population-level allopatric differentiation may be an important speciation process for the Begonia genus and a key contributor to its rich diversity.
1 Introduction
Climate oscillations in the Quaternary, in addition to other climatic factors such as the strengthening of the Asian monsoon, exerted a significant influence on species distribution and vegetation assembly (Hewitt, 2000; An et al., 2001; Hewitt, 2004). Southwest and subtropical China are among the most critical temperate biological relics of the Quaternary ice-age cycles. Given that subtropical (Central/East/South) China, including the hilly mid-elevation areas that lie between the Qinling Mountains-Huai River line (at c. 34°N) and the tropical South (at c. 22°N), was not covered by glaciers during the Quaternary, and because of its complex terrain, this region became a suitable habitat for plants and provided multiple refugia, such as the Yunnan-Guizhou Plateau, Hengduan Mountains, Nanling Mountains, Wuling Mountains, Qinling Mountains, and Daba Mountains. These refugia are also hotspots of plant diversity and endemism in today’s subtropical China (Qiu et al., 2011). The east-west oriented Nanling Mountains, Daba Mountains, and Qinling Mountains may serve as plant migration routes between China’s eastern and western regions, while the north-south trending Wuling Mountains, Luoxiao Mountains, and Wuyi Mountains facilitate the north-south migration of plants (Wang, 1992).
Begonia L., belonging to the family Begoniaceae, is widely dispersed in pantropical forest ecosystems across Africa, America, and Asia. With over 2,100 accepted species1 (Hughes et al., 2015, updated: December 6, 2022), Begonia is one of the ten largest plant genera and is also the genus with the fastest increase in the number of new species published in the last 20 years (Frodin, 2004; Moonlight et al., 2018; Tian et al., 2018). Begonia is one of the most diverse plant taxa, harboring a rich morphological diversity (Forrest and Hollingsworth, 2003; Tebbitt et al., 2006; Tian et al., 2018). One of the best-known flowers worldwide, Begonia has excellent ornamental value, particularly regarding foliage and flowers, and more than 15,000 cultivars have been raised to date (Tian et al., 2018). With few exceptions (e.g., B. longifolia Blume, B. palmata D.Don, B. grandis Dryand., B. handelii Irmsch., and B. fimbristipula Hance.), Begonia species have a restricted distribution range, especially these native to limestone karsts (Kiew, 2001; Tebbitt, 2005; Tebbitt et al., 2006; Hughes and Hollingsworth, 2008). The species of Begonia that have widespread distribution often have rich morphological diversity and atypical dispersal attributes, such as fleshy fruits or bulbils (Hughes and Hollingsworth, 2008). Additionally, given its rich diversity of morphological and habitat types, Begonia is highly valuable for conservation, speciation, and diversity research. Over recent years, Begonia has been employed as a model for understanding the evolution of species-rich genera (Thomas, 2010; Dewitte et al., 2011). The existing population genetic data indicate that Begonia has a strong population genetic structure, high genetic differentiation (FST range = 0.277–0.937), and limited gene flow (Matolweni et al., 2000; Hughes et al., 2003; Hughes and Hollingsworth, 2008; Nakamura et al., 2014; Twyford et al., 2014; Chan et al., 2018; Li et al., 2018; Tseng et al., 2019).
Begonia grandis, assigned to Begonia sect. Diploclinium (Lindl.) A.DC, is one of the few widely distributed begonias native to China. Its distribution ranges from c. 75 m to 3400 m elevation, 97.45° to 121.78° E longitude, and 22.98° to 40.67° N latitude (Li et al., 2014). It is the only true hardy and the most cold-resistant species of Begonia and can overwinter at temperatures as low as −27°C. Begonia grandis is a deciduous perennial with both underground tubers and aerial stems and is the only species of Begonia that produces asexual reproductive bulbils in the axils. Begonia grandis has a long history of cultivation in China owing to its high ornamental, medicinal, and cultural value (Li et al., 2014), and is also of considerable phylogenetics importance given its particular systematics placement. It is considered to be one of the basal groups of the clade “Diploclinium grade” (Rajbhandary et al., 2011; Thomas et al., 2011; Moonlight et al., 2018). Begonia grandis is classified into three subspecies and three varieties in Flora Reipublicae Popularis Sinicae (FRPS) (Ku, 1999). However, Flora of China (FOC) has only accepted three subspecies [B. grandis subsp. grandis Dryand., B. grandis subsp. sinensis (A. Candolle) Irmscher, and B. grandis subsp. holostyla Irmscher] (Gu et al., 2007). Although both morphological and molecular evidence (unpublished data) suggest that this species is markedly different from other begonias, the classification of its subspecies is still controversial, and its population history dynamics remain unknown.
In this study, we collected samples of B. grandis (including all three subspecies described in FOC) from a wide range of habitats and assessed its genetic variation and population structure based on three chloroplast DNA (cpDNA) markers (ndhF-rpl32, atpI-atpH, and ndhA intron), coupled with species distribution modeling (SDM). We aimed to (1) reveal the population genetic pattern of B. grandis, (2) infer its potential glacial refugia and dispersal corridor, and (3) provide a useful reference for subspecies classification, germplasm conservation, and utilization of this widespread species.
2 Materials and methods
2.1 Population sampling
A total of 352 individual B. grandis plants were sampled from 44 wild populations (8 per population) covering all native distribution regions in China except Tibet (Table 1). For each population, the collected samples were separated from each other by at least 10 m. The collected fresh leaf samples were immediately stored in silica gel for later use. The voucher specimens of each population were stored at the Herbarium of Shanghai Chenshan Botanical Garden (CSH).
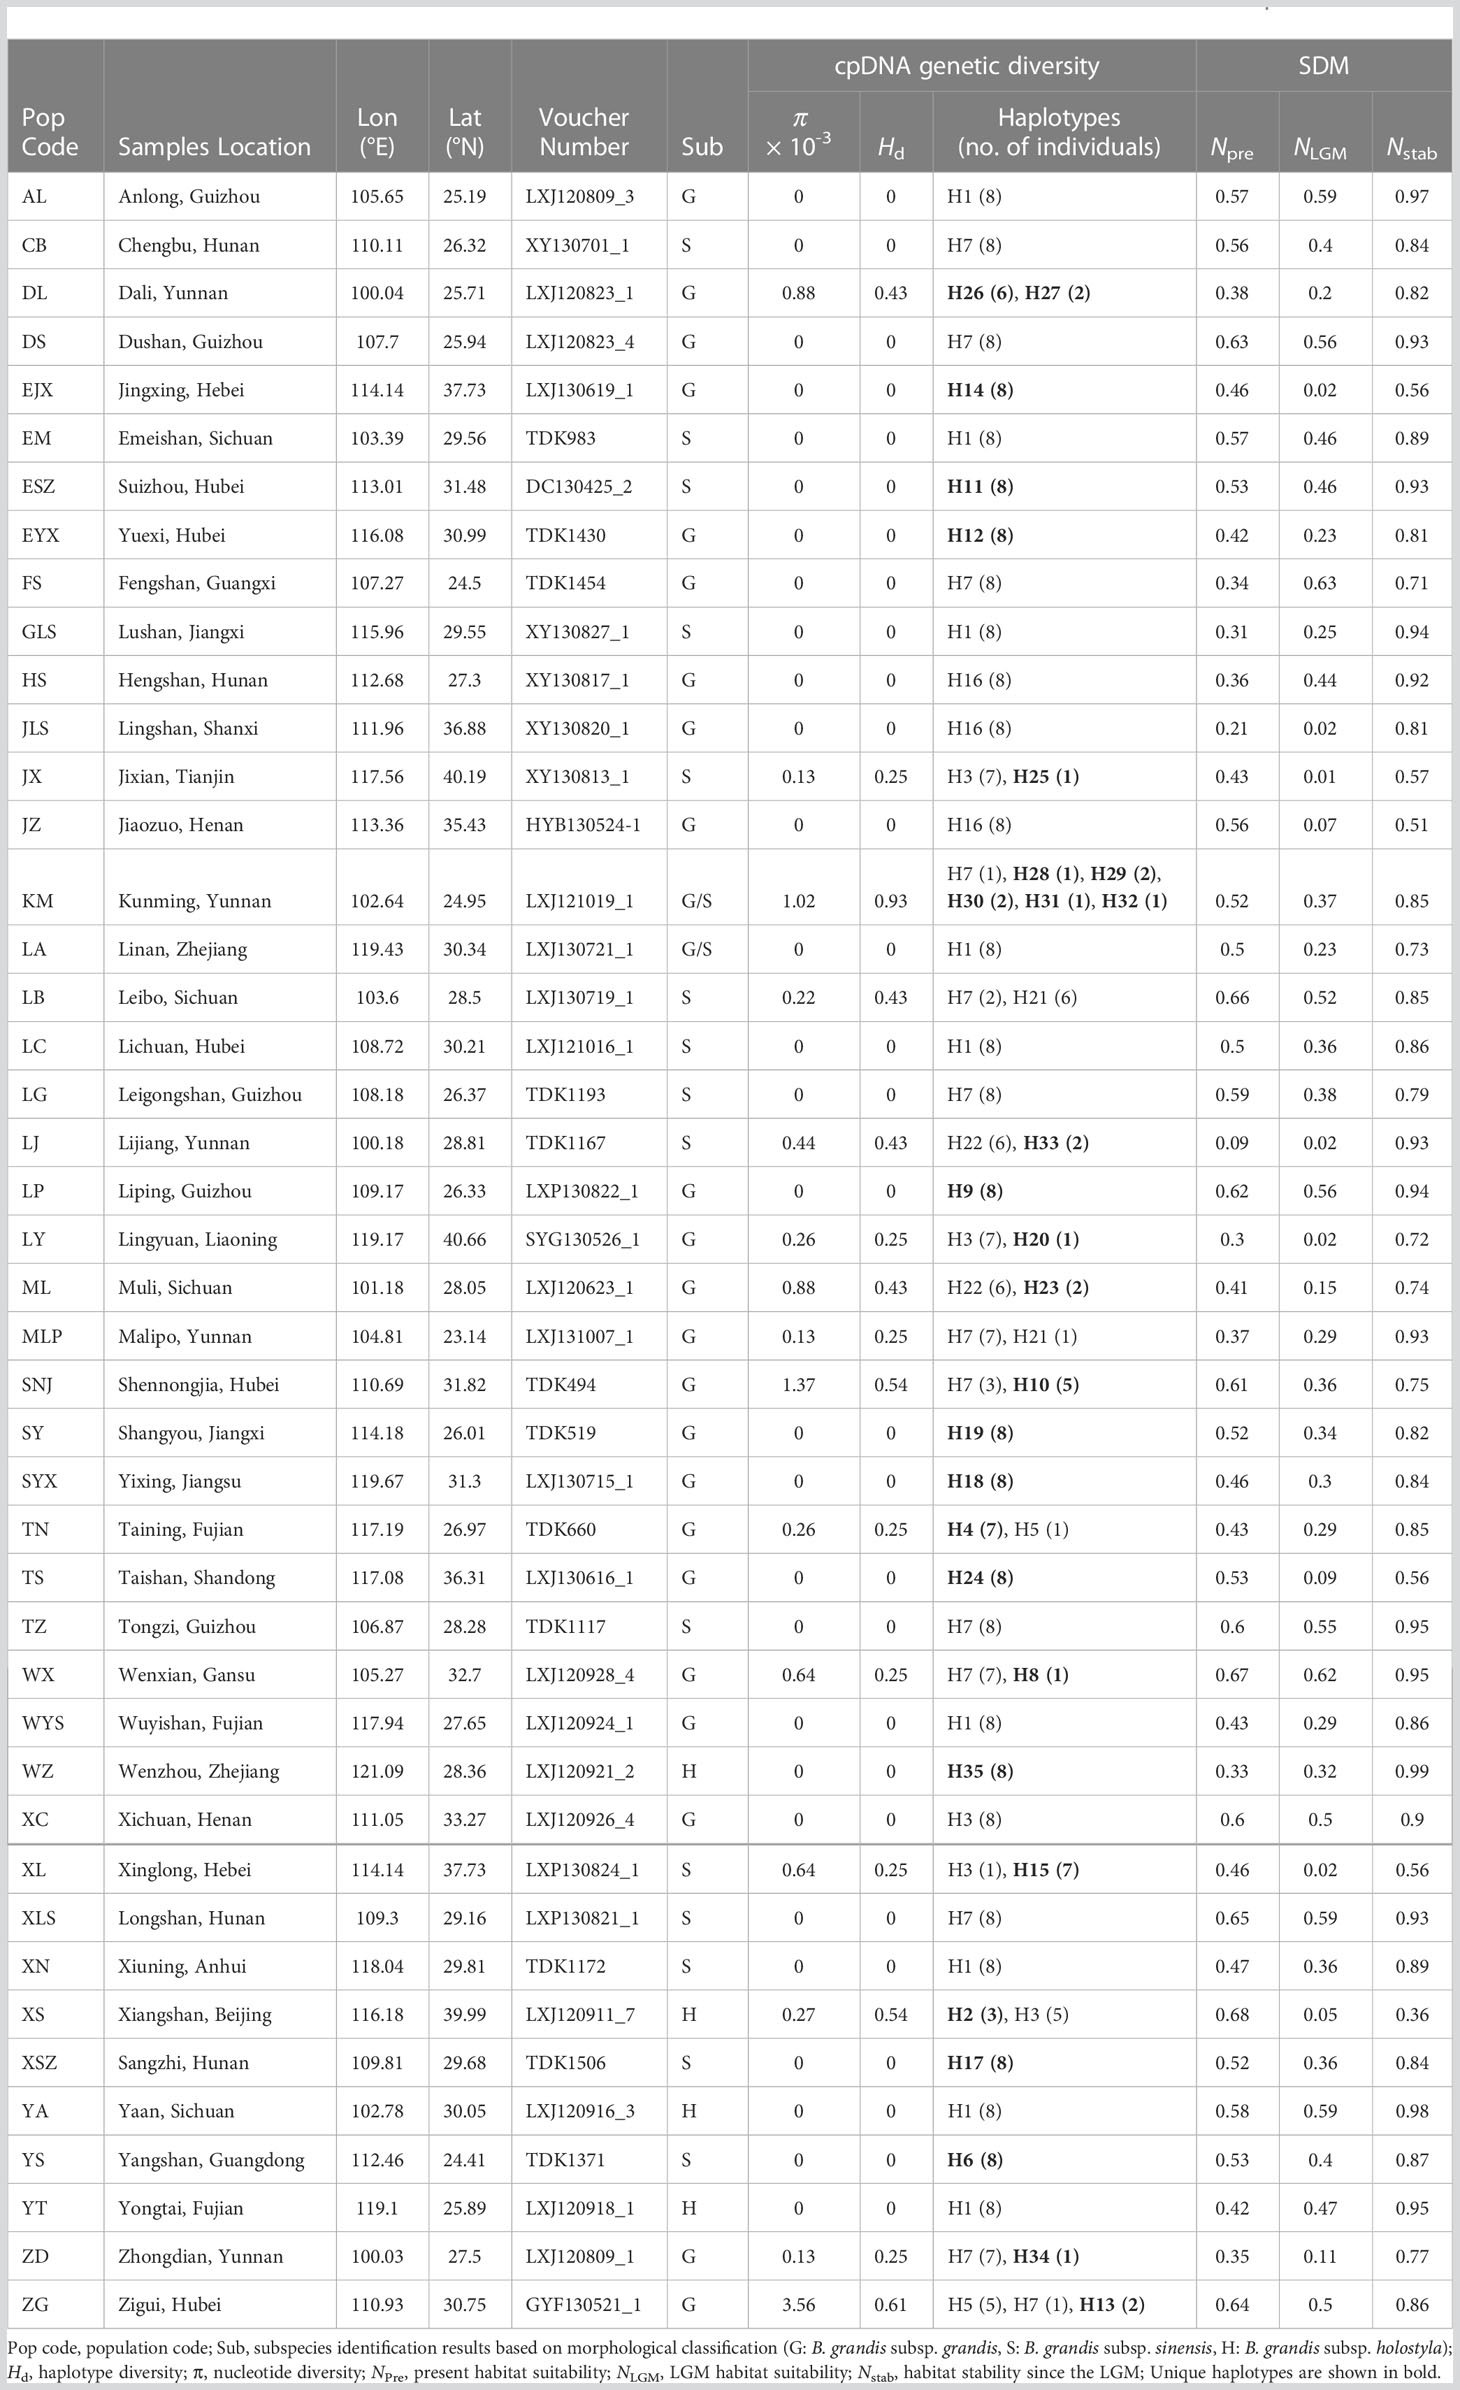
Table 1 Sampling information, cpDNA genetic diversity, locality habitat suitability, and stability obtained from SDMs for B. grandis.
2.2 DNA extraction, PCR amplification, and sequencing
Total genomic DNA was extracted using the DNAsecure Plant Kit (Tiangen Biotech, Beijing, China), following the manufacturer’s protocol. In a preliminary investigation of chloroplast variation, 24 cpDNA markers were sequenced for 12 samples from 6 natural localities. Because the ndhF-rpl32 (Thomas, 2010), atpI-atpH, and ndhA intron (Shaw et al., 2007) chloroplast regions were found to display greater variation than the other markers examined, these regions were subsequently amplified for all individuals using the same primer pairs (Supplementary Table S1).
PCR amplification was carried out in 20-μL volumes containing 11 μL of ddH2O, 4 μL of 5× Fast HiFidelity PCR buffer, 2 μL of DNA template, 1 μL of 20× Fast PCR Enhancer, 0.8 μL of each forward and reverse primer, and 0.4 μL of Fast HiFidelity Polymerase (Tiangen Biotech). PCR was carried out using the following program: An initial denaturation at 94°C for 2 min, followed by 35 cycles of denaturation at 94°C for 15 s, annealing at 60°C for 10 s, and elongation at 68°C for 30 s, with a final elongation step at 68°C for 5 min. The amplification products were sequenced by Shanghai Maipu Biotechnology Co., Ltd. and Sangon Biotech Co., Ltd. (both in Shanghai, China).
Nucleotide sequences were manually edited in SeqMan (Swindell and Plasterer, 1997), and then aligned using MEGA5 (Tamura et al., 2011) with subsequent manual adjustment with BioEdit v7.0.4.1 (Hall, 1999).
2.3 Genetic diversity and phylogeographic structure analysis
The cpDNA haplotypes, polymorphic sites, haplotype diversity (Hd), and nucleotide diversity (π) were calculated using DnaSP v5.10 (Librado and Rozas, 2009). Haplotype spatial distribution maps were generated using ArcGIS 10.5.2 Permutation tests, implemented in PERMUT v1.0 (Pons and Petit, 1996), were employed to calculate total gene diversity (HT), within-population gene diversity (HS), GST, and NST based on 1,000 random permutations. GST is an unordered measure of genetic differentiation based solely on haplotype frequencies that do not incorporate phylogenetic distance, while NST estimates genetic differentiation based on considering similarities among different haplotypes that incorporate phylogenetic distance. A value for GST significantly lower than that for NST indicates the presence of phylogeographic structure. Analysis of molecular variance (AMOVA) was computed in Arlequin 3.5 (Excoffier and Lischer, 2010). A median-joining network was constructed using Network 5.0.1.1 (Bandelt et al., 1999) to evaluate phylogenetic relationships among haplotypes. Bayesian Analysis of Population Structure (BAPS) (Corander et al., 2008), a spatial clustering model, was employed to detect clusters of genetically similar populations and the spatial clustering of DNA sequences. Possible historical demographic expansions were examined under neutrality tests using Tajima’s (1989) D and Fu's (1997) Fs statistics. D-values significantly different from 0 are usually correlated with selection, bottlenecks, or population expansion, while a significantly negative Fs value indicates a recent demographic expansion. Mismatch distribution analysis (Schneider and Excoffier, 1999) was also used to infer the demographic histories of the species. Unimodal pairwise mismatch distributions indicate that populations have experienced recent demographic expansion, while multimodal distributions are related to demographic equilibrium or decline (Slatkin and Hudson, 1991; Rogers and Harpending, 1992). The raggedness index (HRag) and P-values were computed to test the significance of the population expansion model. All these analyses were conducted in Arlequin 3.5 (Excoffier and Lischer, 2010). The estimates of pairwise genetic distance (FST) were regressed against geographic distance using a Mantel test with 999 random permutations in GenAlEx 6.5 (Peakall and Smouse, 2012) to test for isolation by distance (IBD) patterns among populations.
2.4 Phylogenetic analysis and estimation of divergence times
Phylogenetic relationships of the haplotypes and the outgroup (B. pedatifida H. Léveillé) were reconstructed using a Bayesian approach implemented in BEAST v1.8.2 (Drummond et al., 2012). The divergence time was estimated using the GTR + I substitution model based on the Akaike information criterion (AIC) selected by IQ-TREE ModelFinder (Kalyaanamoorthy et al., 2017). As there is no fossil record or information regarding specific substitution rates for Begonia, a mean of 2 × 10⁻⁹ substitutions/site/year (s/s/y) was set for cpDNA based on the range of the synonymous substitution rates of chloroplast genes (1 × 10⁻⁹ to 3 × 10⁻⁹ s/s/y) (Wolfe et al., 1987) to estimate divergence time. An initial MCMC chain was run for 1 × 10⁷ generations to select optimal parameters for the BEAST analysis. Tracer v1.53 (Rambaut and Drummond, 2007) was used to examine the parameter ucld.stdev. A value greater than 0 for this parameter suggests that the data were appropriate for an uncorrelated lognormal relaxed-clock model. All effective sample sizes of each parameter from Tracer v1.5 were ensured to be greater than 200. The final MCMC chain was run for 1 × 10⁷ generations with sampling every 1,000 generations using an uncorrelated lognormal relaxed-clock model and a constant population size. The maximum clade credibility (MCC) tree was generated with a 10% burn-in using TreeAnnotator v1.6.1 (Drummond and Rambaut, 2007). Finally, these results were compiled into a single tree visualized in Figtree v1.3.1.4
2.5 Species distribution model and visualizing dispersal corridors
Under the assumption that the climatic preference of B. grandis has not changed since the last glacial/interglacial cycle and will not change in the future (Nogués-Bravo, 2009), maximum entropy modeling performed in MaxEnt v3.4.1 (Phillips et al., 2006) was used to compare the geographic distribution of B. grandis in the present with that in the last glacial maximum (LGM) and the future. All herbarium specimens were validated before being used for data analysis. After removing duplicate records, 332 points of B. grandis were obtained from field collections, the Chinese Virtual Herbarium,5 and the National Specimen Information Infrastructure of China.6
Nineteen bioclimatic variables at a 2.5-arcmin resolution for the present (1960–1990), the LGM (approximately 22,000 years ago, Community Climate System Model [CCSM]), and the future (2060–2080, RCP8.5) were downloaded from WorldClim 1.4.7 Multicollinearity among variables was measured using a Pearson correlation matrix estimated in R v3.6.0.8 Nine climate variables were obtained when subsets of variables with high correlations (r > 0.8) were reduced to single variables (Supplementary Table S2). Potential species distributions were calculated using the mean of 10 duplicate results with random seeds. The area under the curve (AUC) calculated from a receiver operating characteristic (ROC) was used to evaluate the model performance. The AUC ranged between 0.5 and 1, with 0.5 representing a random prediction and 1 representing the maximum projection. Species distribution maps for the present and other periods were created based on the maximum training sensitivity plus specificity threshold (Jiménez-Valverde and Lobo, 2007). Three indices were calculated to compare changes in species distributions, namely, the habitat distribution area ratio (Na), habitat expansion extent (Ne), and locality habitat stability (NStab). Na = (distribution areas of the present)/(distribution areas of the LGM or future), where a value close to 1 denotes a stable distribution, and a value noticeably higher or lower than 1 denotes a change in the distribution region of a species. Ne = [1 − (overlap distribution areas of the LGM or future and present/present distributions area)] × 100% represents the percentage of expansion or contraction between the LGM or future and the present. NStab = 1 − | NPre − NLGM|, where NPre and NLGM mean habitat suitability of the present and LGM distribution area, respectively.
SDMtoolbox (Brown, 2014) in ArcGIS 10.5 was used to map the dispersal routes of B. grandis since the late Quaternary. The specific steps for this method were as follows: Firstly, a resistance layer was created by inverting the SDMs (1−SDM), and the resistance layer was then used to create a cost distance raster for each sample locality. Secondly, corridor layers were created between two localities that only shared haplotypes using the cost distance raster. Thirdly, the least cost path (LCP) method was used to better depict environmental heterogeneity in dispersal. The value of each corridor layer was classified as low, medium, or high, and then these three levels were subdivided into new values (5, 2, and 1). Finally, all of the reclassified corridor layers were summarized and standardized from 0 to 1, and the dispersal corridors of B. grandis were eventually identified.
3 Results
3.1 Genetic diversity and structure
The lengths of the ndhF-rpl32, atpI-atpH, and ndhA intron sequences ranged from 708 to 875, 747 to 847, and 716 to 1072 bp, respectively. The combined length of the three aligned chloroplast fragments was 2,164 bp. Based on the three sequences, 35 haplotypes representing 46 polymorphic sites, including three singleton variable sites and 43 parsimony informative sites, were identified from 352 samples (Table 1 and Figure 1). Haplotype diversity (Hd) and nucleotide diversity (π) were 0.894 and 2.9 × 10⁻³, respectively (Table 2). The Hd and π within populations were 0–0.929 and 0–3.56 × 10⁻³, respectively (Table 1). Total gene diversity (HT) and within-population gene diversity (HS) were estimated to be 0.910 and 0.138, respectively (Table 2). Only 15 populations represented diversity, and only two populations (ZG and KM) had more than two haplotypes (Table 1). The KM (Hd = 0.929, π = 1.02 × 10⁻³) and ZG (Hd = 0.607, π = 3.56 × 10⁻³) populations had the highest haplotype diversity and the highest nucleotide diversity, respectively (Table 1). Only 7 of the 35 haplotypes (H1, H3, H5, H7, H16, H21, and H22) were shared in two or more populations, while each of the remaining 28 haplotypes (80%) occurred only in a single population (Table 1 and Figure 1A). H7 was the most common haplotype (found in 13 populations, with a frequency of 21.6%), followed by H1 (found in 9 populations, with a frequency of 20.5%), and these haplotypes were mainly distributed south of the Yunnan-Guizhou Plateau and Yangtze River, respectively (Table 1).
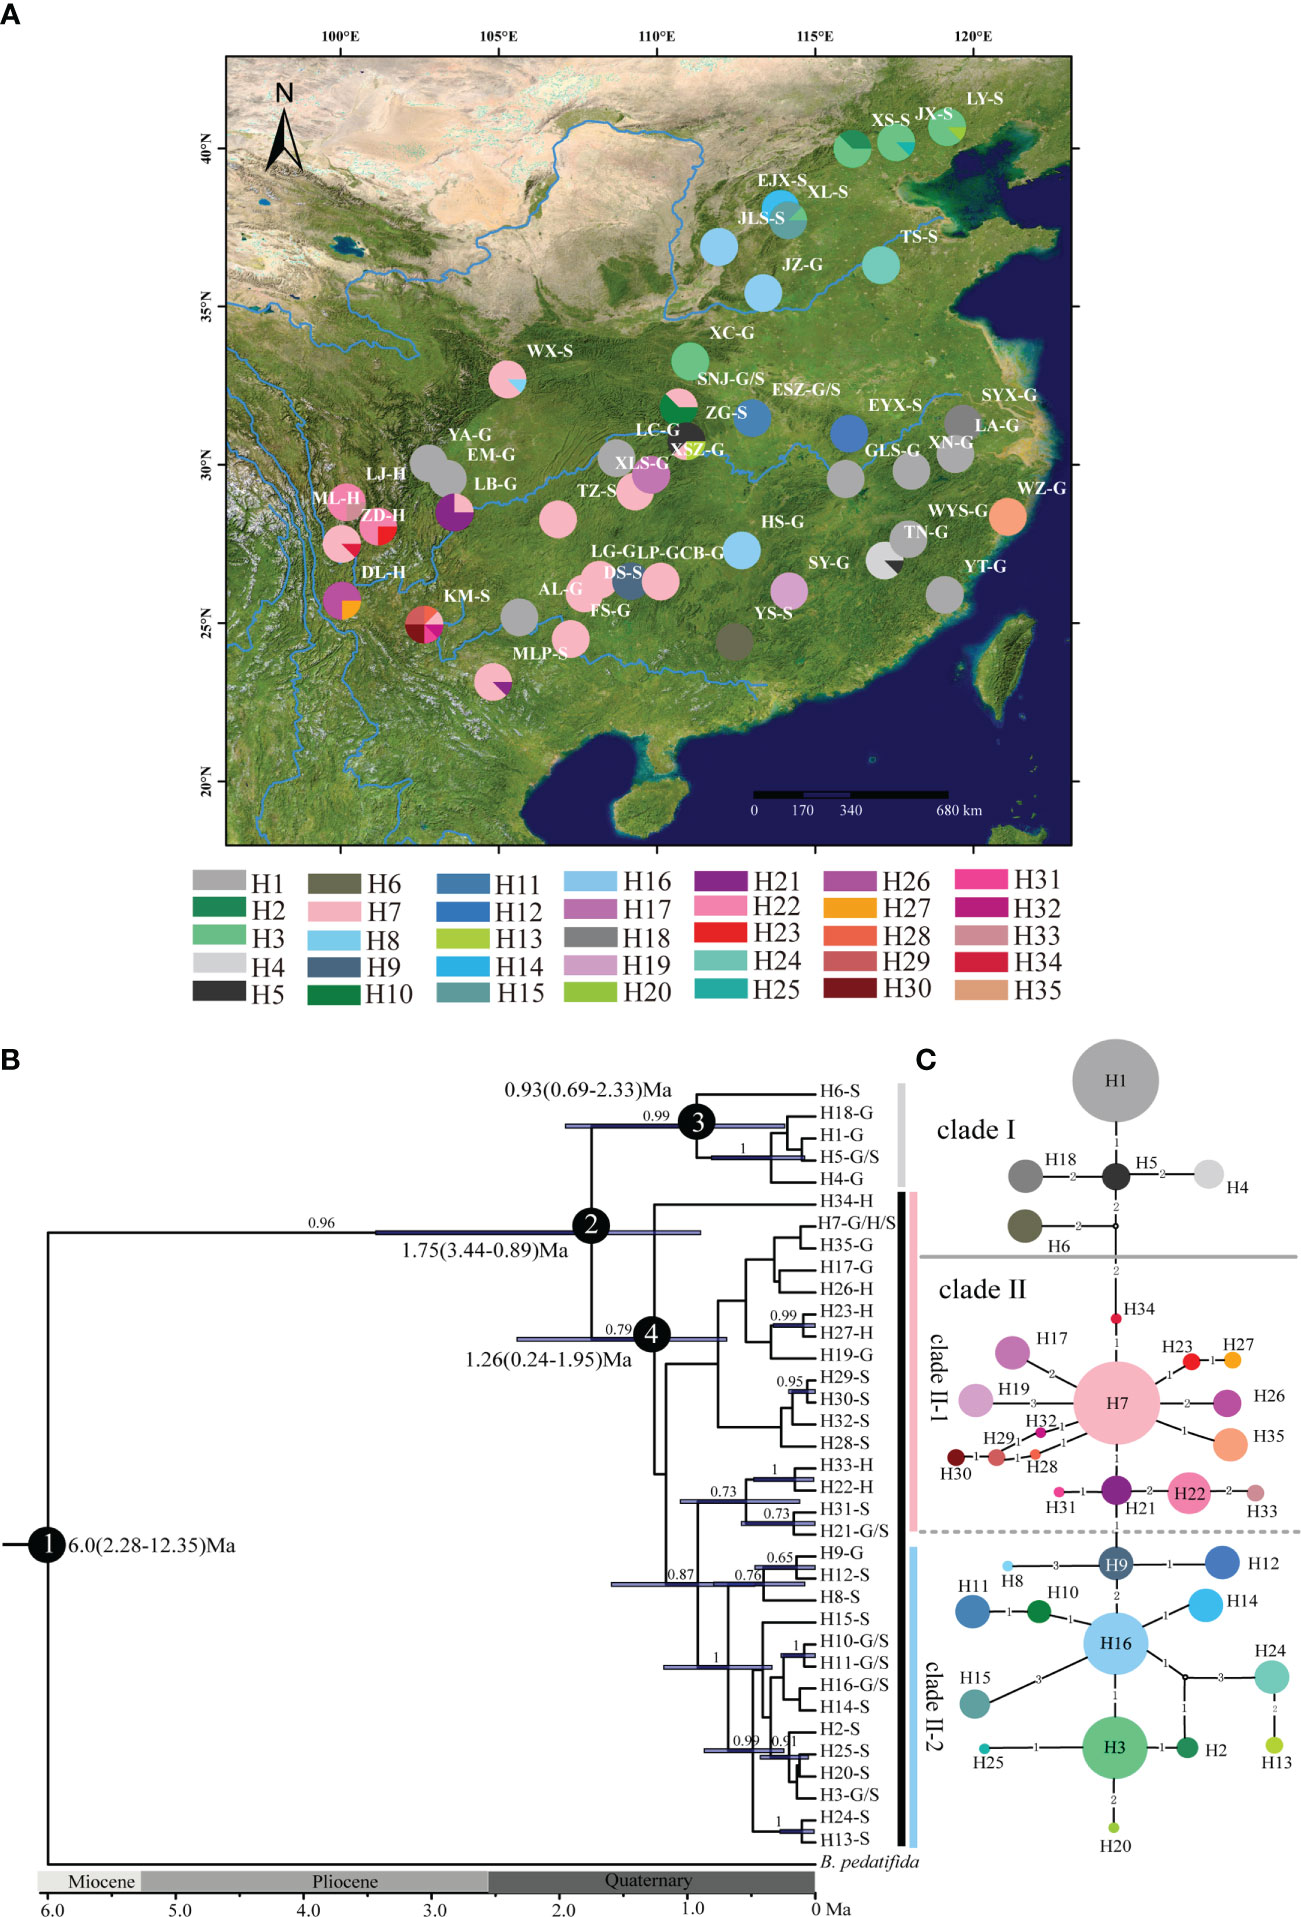
Figure 1 Analysis of cpDNA haplotypes of B. grandis. (A) Geographic distribution of 35 cpDNA haplotypes detected. The colored pie charts represent the frequency of haplotypes at each sampling site. Haplotype colors corresponding to the charts are displayed in the bottom panel. (B) BEAST-derived chronograms for cpDNA haplotypes. Numbers on branches are Bayesian posterior probabilities (shows posterior probability over 0.5 on branches). The blue bar length represents the 95% HPD of the species divergence time. (C) Haplotypes of the cp DNA network. The size of the circles represents the frequency of haplotypes in populations. Capital G, S, and H after population code with “-” in (A) and after haplotypes with “-” in (B) mean the subspecies identification results based on morphological classification, B. grandis subsp. grandis, B. grandis subsp. sinensis, and B. grandis subsp. holostyla, respectively.
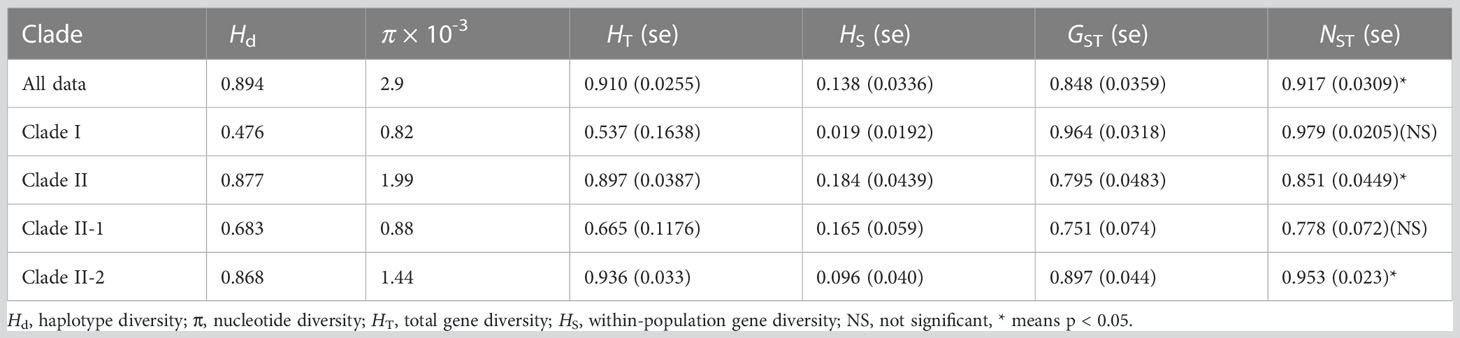
Table 2 Genetic diversity of the B. grandis at clade level based on cpDNA.
Based on the BEAST tree, the haplotypes H1, H4, H5, H6, and H18 were grouped into clade I, while the remaining haplotypes (H2, H3, H7–H17, and H19–H35) were grouped into clade II (Figure 1B). The genetic diversity of the populations in clade I (Hd = 0.476, π = 0.82 × 10⁻³, HT = 0.537, HS = 0.019) was lower than that of the populations in clade II (Hd = 0.877, π = 1.99 × 10⁻³, HT = 0.897, HS = 0.184) (Table 2). BAPS results suggested the existence of three geographical clusters, namely, clade I (the same as in the BEAST tree), clade II-1 (H7, H17, H19, H21–H23, H26–H35), and clade II-2 (H2, H3, H8–H16, H20, H24, H25) (Figures 1B, C and Supplementary Figure S1). Clade II-1 was mainly located in the southern part of its distribution range, while clade II-2 was mainly found in the northern part. The genetic diversity of the populations in clade II-1 (Hd = 0.683, π = 0.88 × 10⁻³, HT = 0.665, HS = 0.165), and clade II-2 (Hd = 0.868, π = 1.44 × 10⁻³, HT = 0.936, HS = 0.096) were calculated (Table 2).
Non-hierarchical AMOVA revealed high genetic differentiation at the species level (FST = 0.8352, P < 0.001), with 83.52% of the total variation found among populations, and only 16.48% within populations (Table 3). Genetic differentiation in clade I (FST = 0.984) was greater than that in clade II (FST = 0.774). However, hierarchical AMOVA indicated that 39.96% of this differentiation was distributed between clade I and clade II, 48.13% was explained by variation among populations within clades, and only 11.90% was found within populations (Table 3). In terms of the three geographic groups, hierarchical AMOVA indicated that 70.62% of this differentiation was distributed between three geographic groups (clade I, clade II-1, and clade II-2), 25.86% was explained by variation among populations within clades, and only 3.52% was found within populations (Table 3).
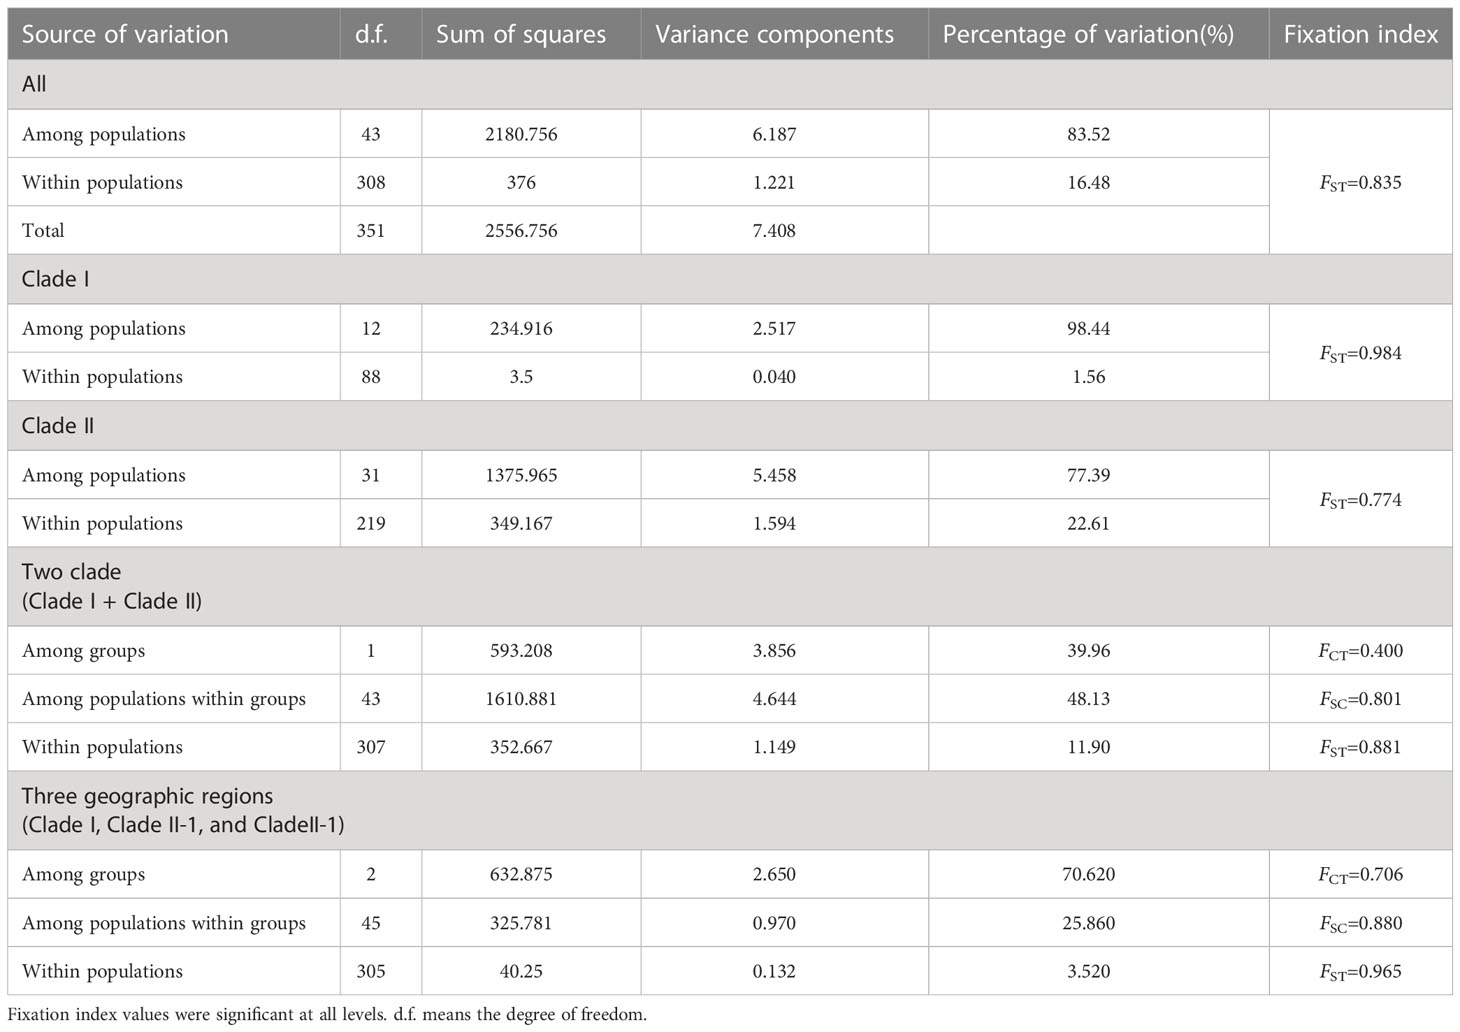
Table 3 Analyses of molecular variance (AMOVA) based on cpDNA for populations of B. grandis.
A permutation test (Table 2) showed that there was significant phylogeographic structure at the species level (GST/NST = 0.848/0.917, P < 0.05) and in clade II (GST/NST = 0.797/0.851, P < 0.05), but not in clade I (GST/NST = 0.964/0.979, P > 0.05). Clade II-1 (GST/NST = 0.751/0.778, P > 0.05) exhibited no significant phylogeographic structure, but clade II-2 (GST/NST = 0.897/0.953, P < 0.05) did (Table 2). Mantel test results indicated that there was a significant correlation between genetic and geographical distance matrices (R2 = 0.022, P = 0.007, Supplementary Figure S2), indicating an isolation-by-distance effect among B. grandis populations. The findings of neutrality tests (Tajima’s D = −0.501, P = 0.348; Fu’s Fs = 4.639, P = 0.850) indicated that this species had not recently undergone demographic expansion at the species level. Populations in geographic regions clade I (Tajima’s D = −0.294, P = 0.365; Fu’s Fs = 2.387, P = 0.892) and clade II-2 (Tajima’s D = −0.776, P = 0.231; Fu’s Fs = 2.002, P = 0.285) had also not undergone demographic expansion. The investigation of mismatch distributions revealed multimodal distributions that are in line with stable population size (Supplementary Figure S3). While, clade II-1 (Tajima’s D = −1.408, P = 0.052; Fu’s Fs = −5.515, P = 0.036) unfolded demographic expansion in neutrality tests inconsistent with the investigation of mismatch distributions that revealed multimodal distributions (Supplementary Figure S3).
3.2 Phylogenetic analysis and divergence time
The BEAST tree supported the monophyly of B. grandis with a posterior probability (PP) of 0.96. Thirty-five haplotypes were clustered into two clades (clade I PP = 0.99; clade II PP = 0.79) (Figure 1B). Begonia grandis and B. pedatifida diverged c. 6.0 million years ago (Mya) with the 95% highest probability density (HPD) date ranging from 2.28 to 12.35 Mya (Figure 1B; node 1). Moreover, the divergence time between clade I and clade II was estimated at 1.75 Mya (95% HPD: 3.44–0.89 Mya; node 2). The lineage diversification of clades I and II was estimated at 0.93 Mya (clade I lineage 95% HPD: 0.69–2.33 Mya; node 3) and 1.26 Mya (clade II lineage 95% HPD: 0.24–1.95 Mya; node 4), respectively. The network analysis resolved two haplotype clades, which was consistent with the haplotype structure of the BEAST tree (Figure 1C).
3.3 Species distribution model and dispersal corridors
The maxent model showed high predictive power with a high AUC value (0.955 ± 0.002). The present distributional predictions of the species were consistent with its extant natural distribution (Figure 2). Species distribution maps were generated with the value of the maximum training sensitivity plus specificity logistic (0.220 ± 0.024) serving as the species absence/presence threshold. The comparison of the distribution of the three periods (LGM, present, and future) indicated that (1) after the LGM, B. grandis underwent northward migration, and the total distribution area of the present was greater than that of the LGM (Na = 1.12, Ne = 37.17%); (2) from the present to the future (2070), the potential range of B. grandis will experience northward migration, with the loss of distribution area occurring mainly in parts of central and southern China (Na = 1.24, Ne = 32.37%) (Supplementary Figure S4). Precipitation of the warmest quarter (bio18) explained more than half of the variation (51.53% ± 0.92), followed by annual mean temperature (bio1) (41.0% ± 1.30) and temperature seasonality (bio4) (3.98 ± 0.64) in the identification of the areas of B. grandis occurrence.
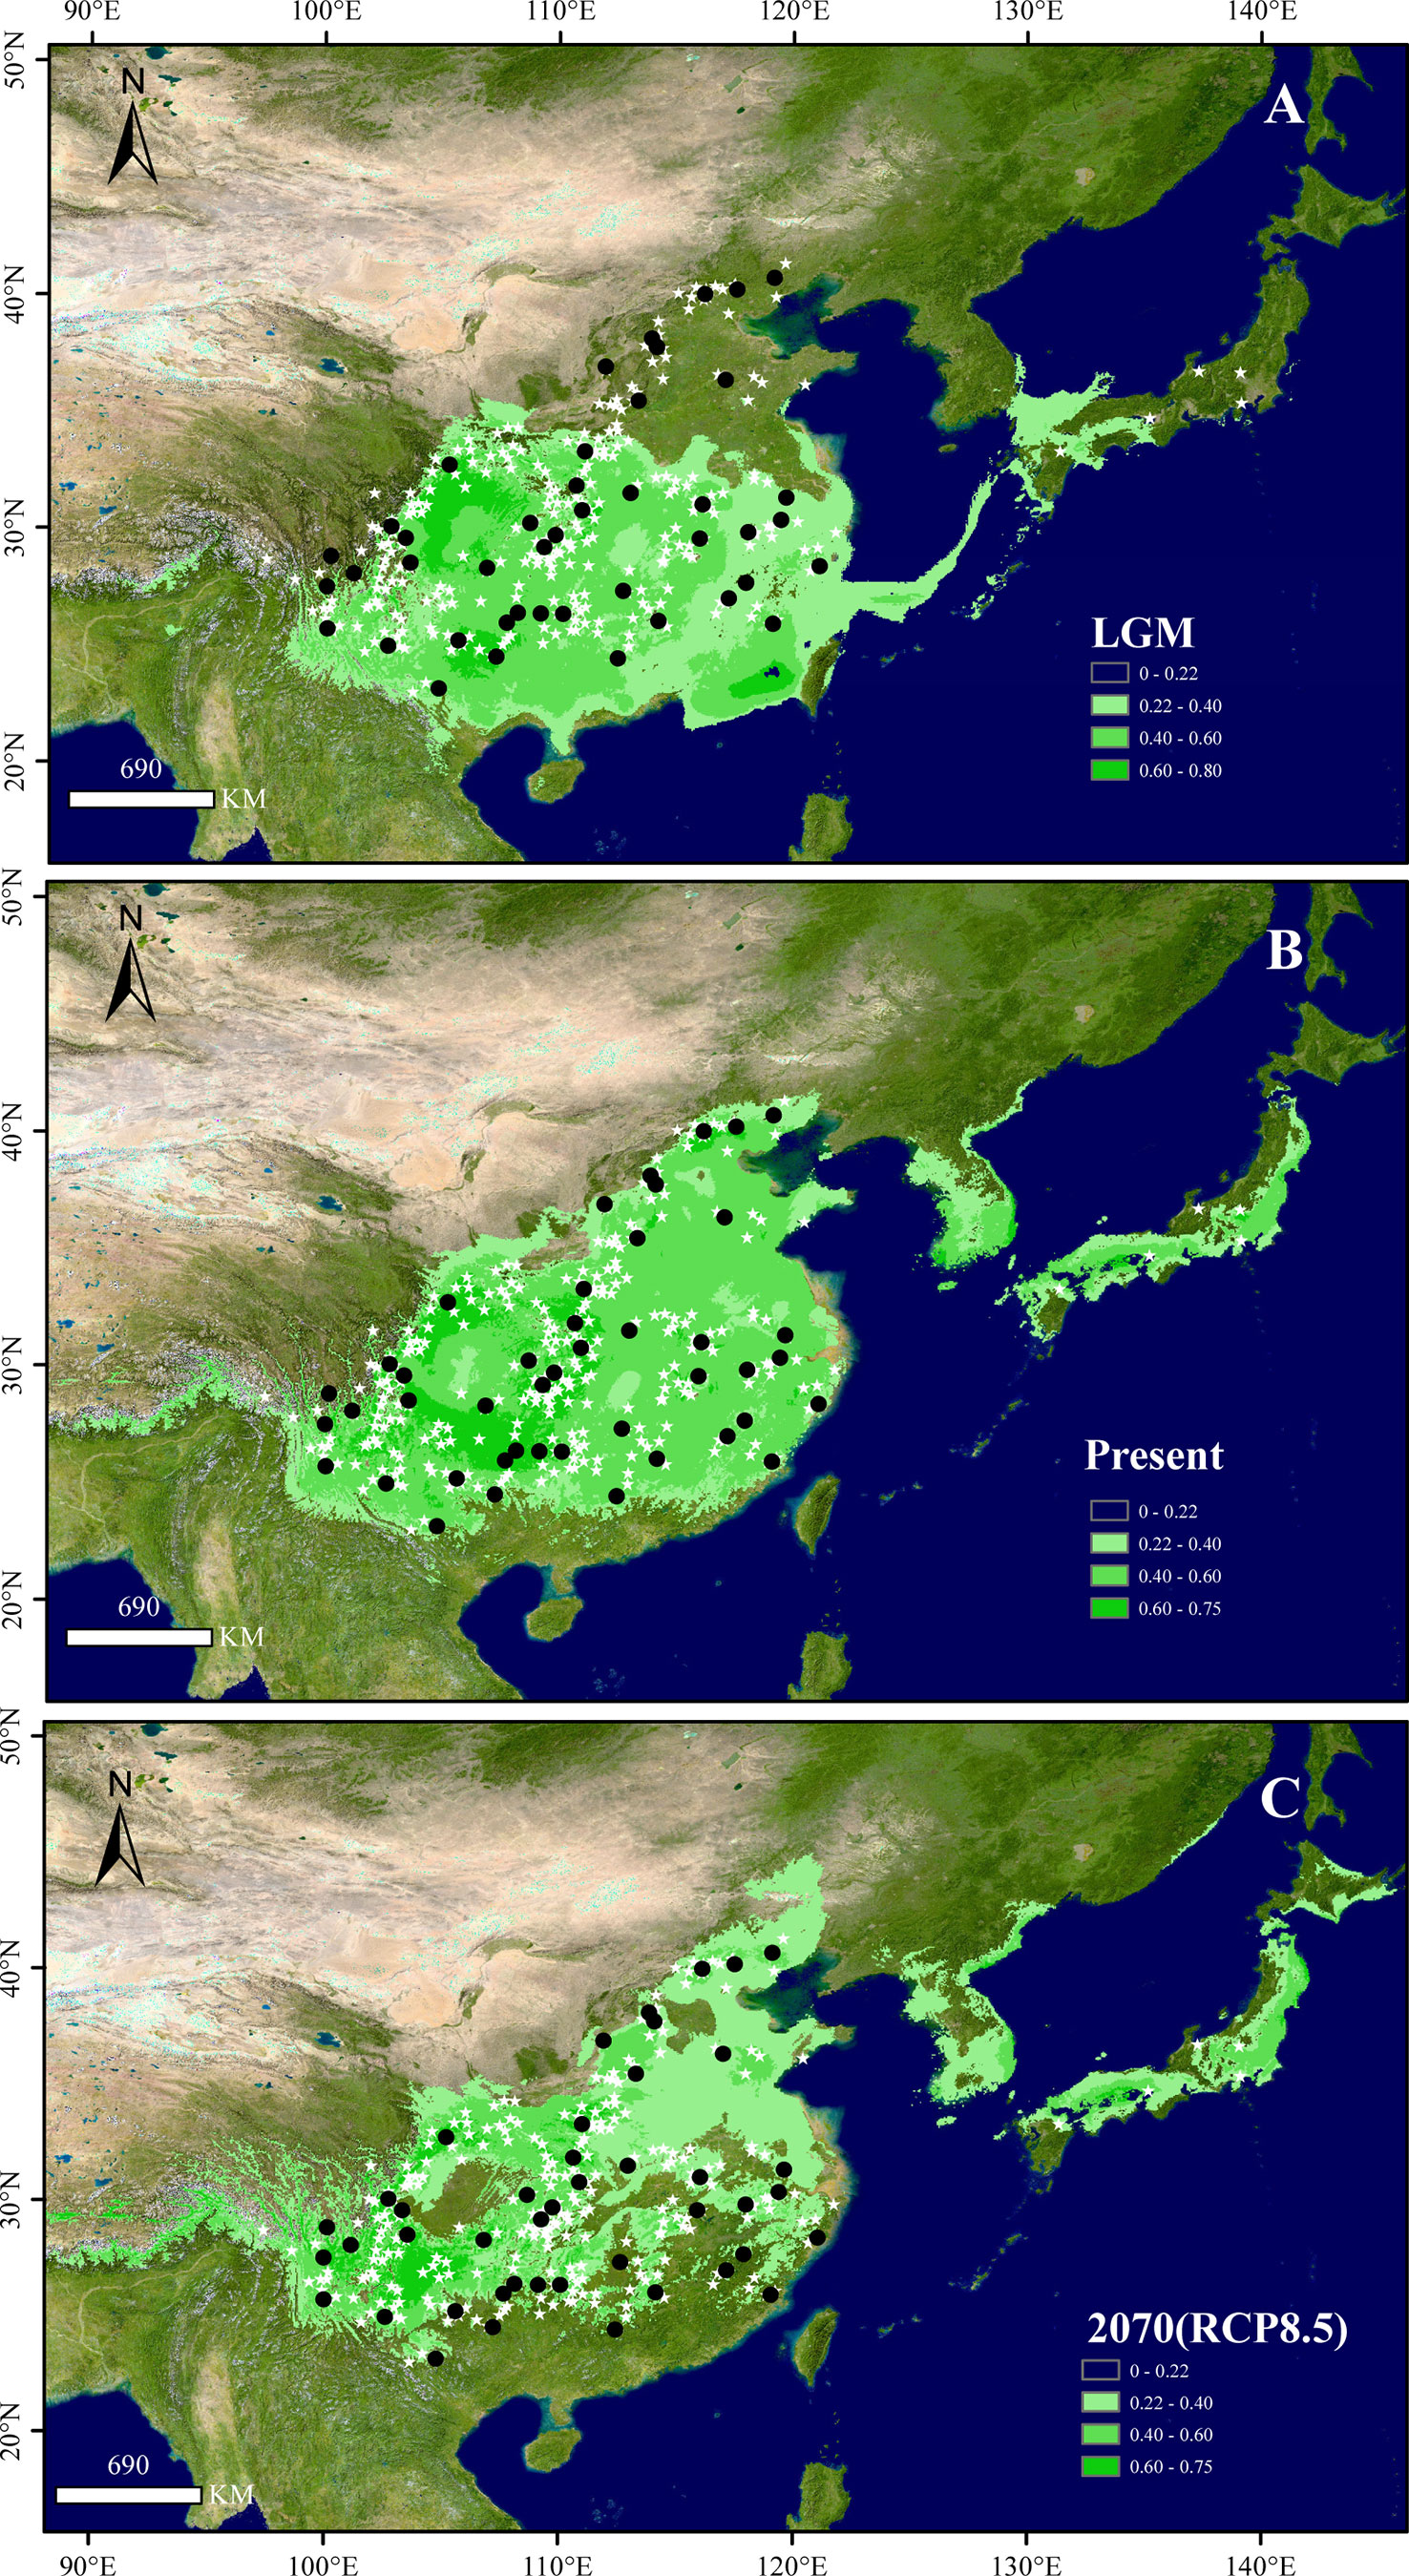
Figure 2 Potential distribution of B. grandis at the (A) last glacial maximum (LGM), (B) present, and (C) 2070 under the RCP8.5 scenario. Black dots show the sampling sites used in this study, and white stars show the occurrence sites obtained from herbarium records. The colors in (A-C), from light to dark green, represent the fitness zone from low to high. The maximum training sensitivity plus specificity threshold (0.220 ± 0.024) was used to determine the species presence threshold.
The supposed dispersal corridors of the LGM and the present were visualized based on SDM results (Figure 3). The dispersal routes across periods revealed that dispersal generally centered on the Yunnan-Guizhou plateaus and the mountains surrounding the Sichuan Basin. The Wuling Mountains were crucial in the north-south migration of this species, while the northern end of the Sichuan Basin, the Wushan Mountains, and the Daba Mountains served as routes for east-west migration. The Yangtze River valley east of the Wushan Mountains served as a vital link between the eastern and western populations.
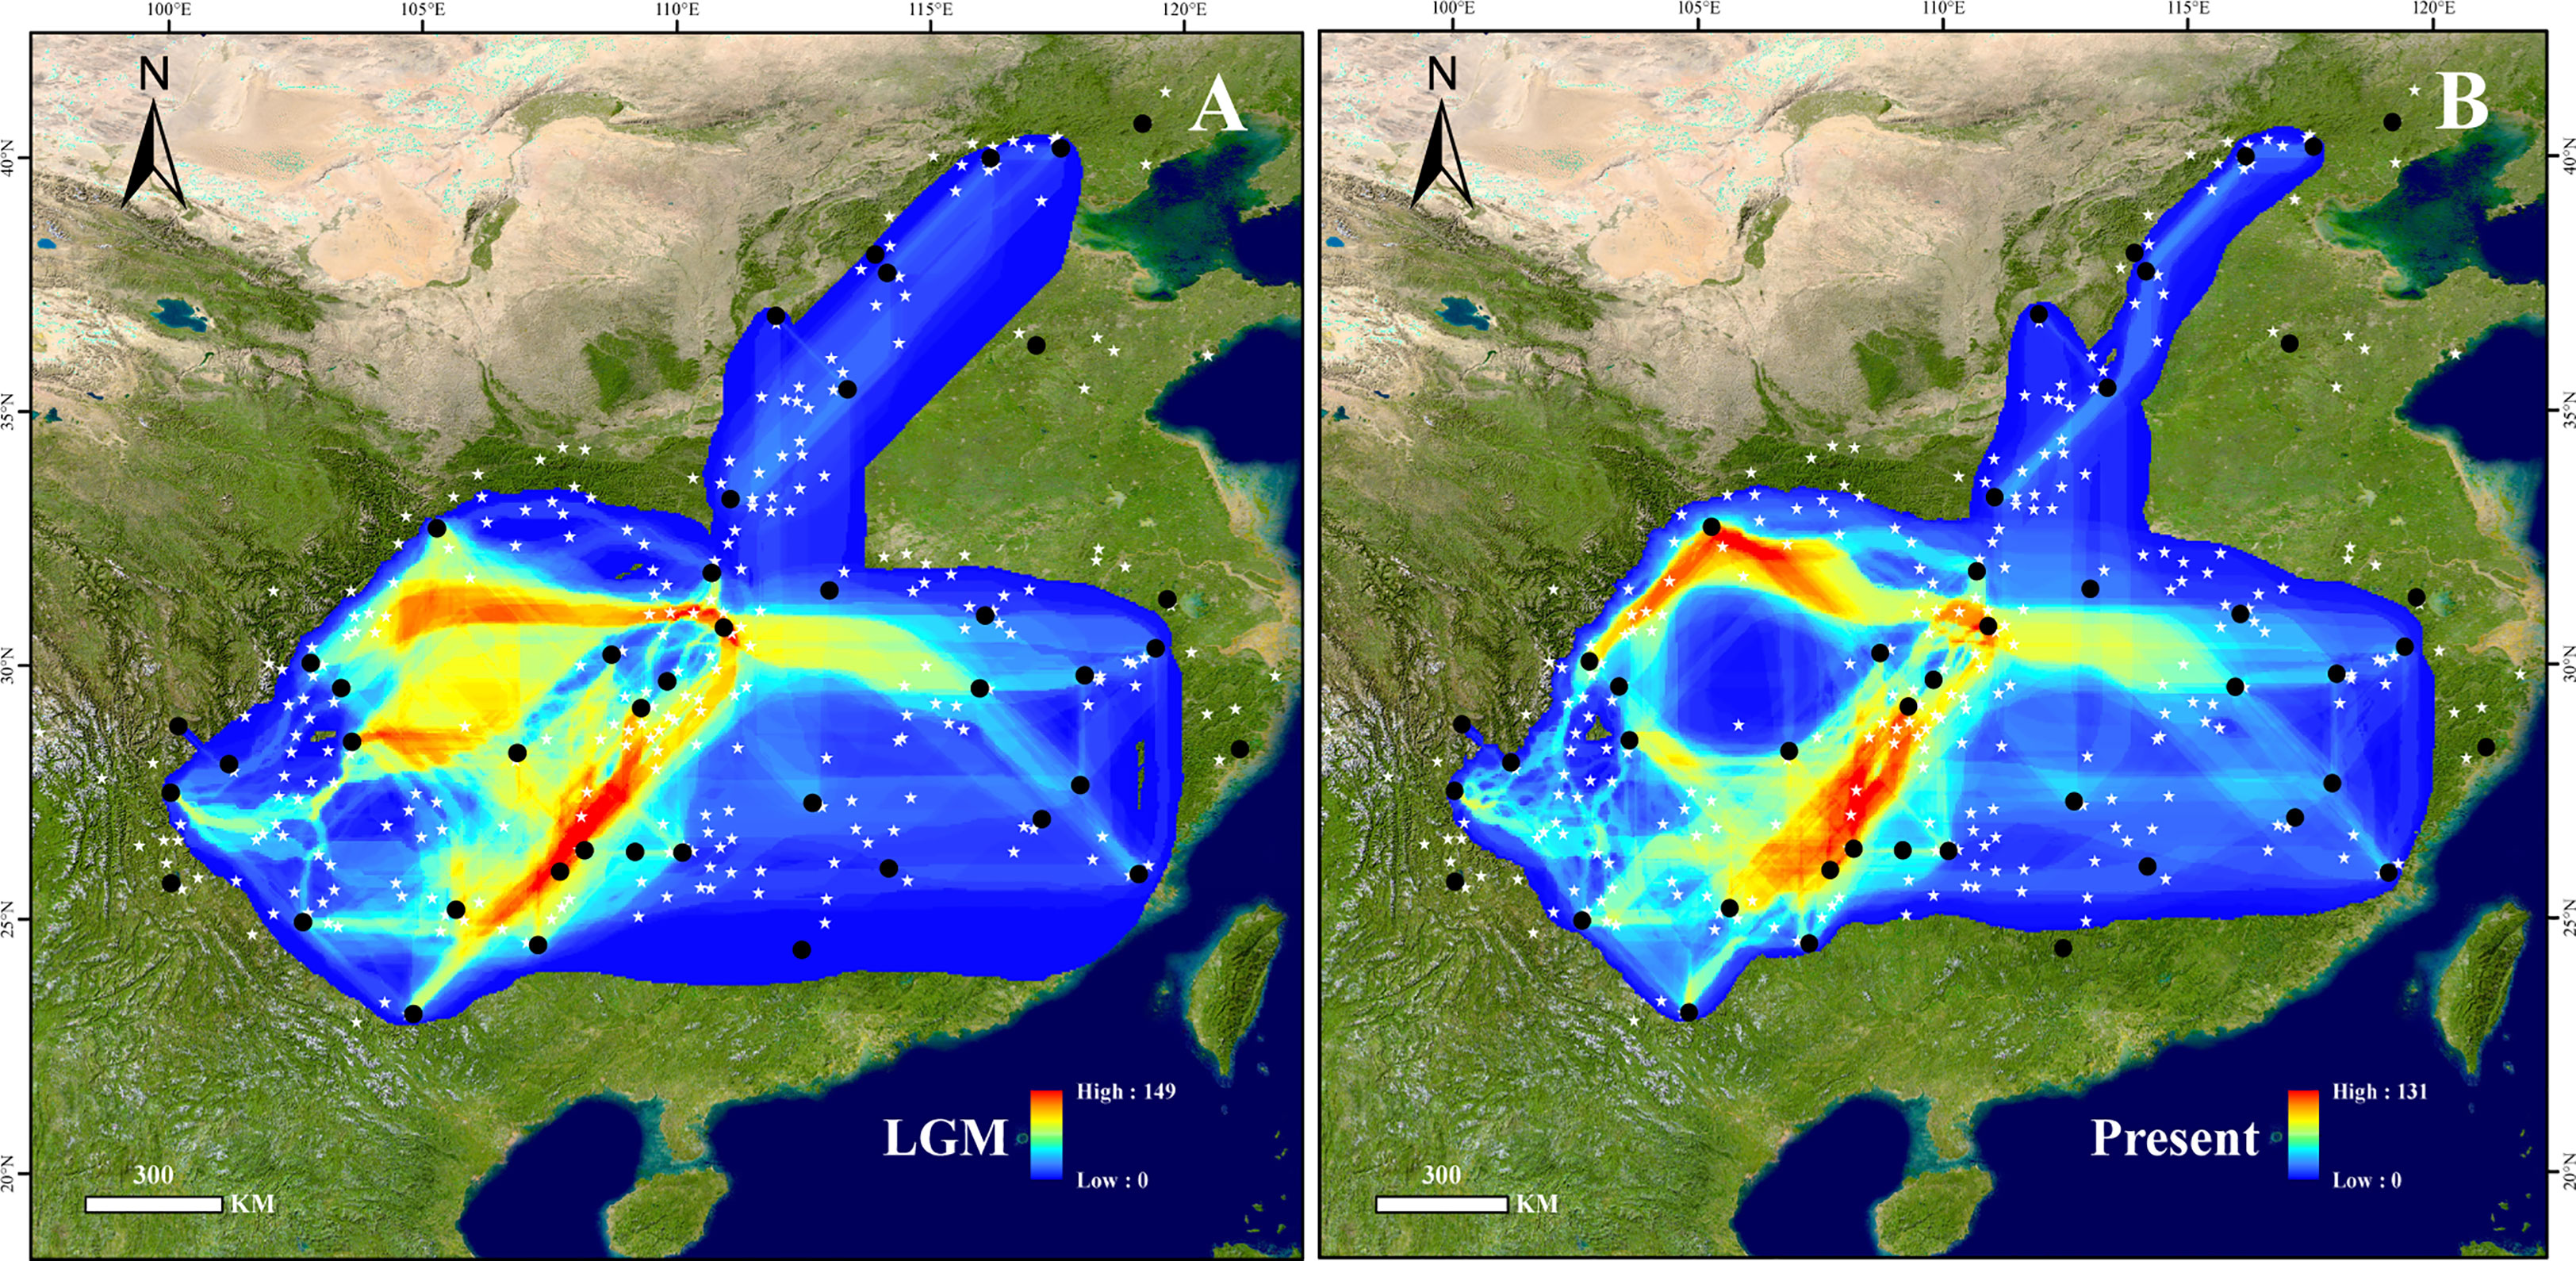
Figure 3 Potential dispersal corridors of B. grandis at the (A) last glacial maximum (LGM) and (B) present. Black dots show the sampling sites used in this study, and white stars show the occurrence sites obtained from herbarium records. The colors in (A, B), from blue to red, represent the potential of species dispersal corridors from low to high.
4 Discussion
4.1 Genetic diversity and genetic differentiation
In this study, we found that B. grandis has high genetic diversity (Hd = 0.894, π = 2.9 × 10⁻³, HT = 0.910), which is very similar to that found for B. heracleifolia Schltdl. & Cham. (HT = 0.937), another widespread species of Begonia (Twyford et al., 2013). Begonia grandis is extensively distributed in China, from the northern edge of the tropics, across vast subtropical regions, to the temperate region of the north of the country. Such high environmental heterogeneity and habitat fragmentation may lead to geographical isolation among populations, thereby increasing the probability of drift and mutation and, consequently, increasing genetic diversity across populations. This result was consistent with a previously stated view that widespread species tend to have higher genetic diversity than narrowly distributed ones (Hamrick and Godt, 1996).
We found B. grandis displayed high total gene diversity (HT = 0.910), low genetic diversity within populations (HS = 0.138), and variation primarily among populations (83.52%), suggesting that the genetic diversity of this species was mainly due to interpopulation differences. Notably, we detected significant genetic differentiation (FST = 0.835) and phylogeographic structure (GST < NST, P < 0.05) in this species. Begonia grandis inhabits stone walls, slopes, waterfalls, stone crevices, and caves along gullies. It is also highly dependent on a specific microenvironment and has requirements for water, relative humidity, light, and temperature within specific ranges. Accordingly, B. grandis is usually fragmented and sporadic in distribution, and most of its populations are small (Li et al., 2014). Temperate forests in the Sino-Japanese Floristic Region were more considerably fragmented during the LGM than today, resulting in even more pronounced habitat discontinuities (Metcalfe et al., 2000; Cárdenas et al., 2011; Qiu et al., 2011). Even though begonias have tiny seeds (1–2 mm long), wind dispersal does not seem to be an effective dispersal mechanism in sheltered forests (Hughes and Hollingsworth, 2008). Geographic isolation and limited seed dispersal may result in minimal gene flow among populations. Small and isolated populations will experience significant genetic drift, resulting in a loss of genetic diversity within populations and an enhancement of genetic differentiation between populations (Quinn and Harrison, 1988). Genetic drift and local adaptations may have contributed to the huge diversity of leaf morphologies in B. grandis. Previous genetic studies of Begonia have also shown limited dispersal, gene flow, and strong genetic differentiation between populations in discontinuous habitats (Matolweni et al., 2000; Twyford et al., 2013; Nakamura et al., 2014). In addition, B. grandis often propagates via asexual bulbils, and large natural populations of this plant may be primarily clonal (Nakata et al., 2012), which may also explain the low average within-population genetic diversity.
4.2 Potential glacial refugia and dispersal corridors
Glacial refugia are geographic regions that retain habitats suitable for the persistence of a species during glacial periods, especially in the LGM, and represent locations of postglacial recolonization (Comes and Kadereit, 1998). The mountains in subtropical China became some of the most important refugia during the Quaternary glacial period (Qiu et al., 2011). Populations in refugia frequently exhibit higher levels of genetic diversity (Comes and Kadereit, 1998). However, genetic diversity can also be promoted by the geographical overlap of different populations and the hybridization or introgression between closely related species (Petit et al., 2003). Species distribution model analysis is not affected by interspecies interaction and dispersal ability. Therefore, SDMs can more objectively and precisely simulate the potential distribution of species in different periods, providing a valid basis and vital reference for the identification of refugia (Elith and Leathwick, 2009).
The notable genetic differentiation and phylogeographic structure of B. grandis suggested the existence of multiple glacial refugia. SDM analysis showed that the Yunnan-Guizhou Plateau, the Three Gorges region, and the Daba Mountains represented stable habitats suitable for the persistence of B. grandis since the LGM (Table 1 and Figure 2). Meanwhile, the KM population of the Yunnan-Guizhou Plateau exhibited the highest haplotype diversity among all the populations, with six haplotypes (H7, H28, H29, H30, H31, and H32; Hd = 0.929) as well as high nucleotide diversity (π = 1.02 × 10⁻³). The ZG population in the Three Gorges region had the highest nucleotide diversity (π = 3.56 × 10⁻³) and also a very high haplotype diversity (Hd = 0.607). Populations (SNJ and WX) in the Daba Mountains also had high genetic diversity (SNJ: π = 1.37 × 10⁻³, Hd = 0.54; WX: π = 0.64 × 10⁻³, Hd = 0.25). We speculate that the Yunnan-Guizhou Plateau, the Three Gorges region, and the Daba Mountains were glacial refugia and dispersal corridors for B. grandis based on the long-term stability of the habitats and the high genetic diversity of the local populations (Table 1, Figures 1A, 2, 3). Although the populations (XS, XL, and JX) in north China also displayed high genetic diversity, they had no suitable habitats during the LGM (XS: NLGM = 0.05; XL: NLGM = 0.02; JX: NLGM = 0.01), and their haplotypes were near the end of the haplotype network rather than being ancestral. This suggested that these populations were not derived from refugia but were a result of northward migration after the glacial period. The eastern populations may have migrated through the Daba Mountains, the Wushan Mountains, and the Yangtze River valley, while the northern populations may have migrated through the Taihang Mountain Range, although the dispersal corridors analysis only weakly supported this possibility. Notably, because B. grandis has significant ornamental value, some eastern populations may have been introduced as ornamental plants from Southwest China, such as population YT found in hills beside temples, and populations XN, LA, and WYS that are found in nature reserves or forest parks. Having asexual bulbils and underground tubers, which become dormant in winter, B. grandis is well adapted to low temperatures, which may explain why its habitat has expanded northward since the LGM.
4.3 Subspecies classification
The results of the phylogenetic and haplotype network analysis do not support subspecies classification of the FRPS and FOC based on morphological characteristics (Ku, 1999; Gu et al., 2007). There were three possible reasons for this discrepancy. First, we did not use enough chloroplast markers in our analysis, and thus our results cannot accurately reflect the current subspecies classification. Secondly, the classification based on morphology was unreasonable or inaccurate because the key morphological traits were continuous. Thirdly, the subspecific classification in both FRPS and FOC may not have reached the subspecies division level (Ku, 1999; Gu et al., 2007). Based on the comprehensive results of the current and previous studies, we think that the latter two reasons are more likely (Li et al., 2021). For example, one population may have individuals with red, purple, and green abaxial leaves and may have large variations in leaf and leaf edge shapes. Additionally, the degree of filament connation does not differ markedly between populations. Although B. grandis subsp. holostyla Irmsch., distributed in northwestern Yunnan province, is styles-free and has an unbranched stigma, unlike the populations in other places of this province, it is not monophyletic based on molecular marker analysis. This group may be a transitional type and cannot, therefore, be treated as a subspecies. Our results suggested that B. grandis should not be divided into subspecies as done by FRPS and FOC, and more morphological and genomic data must be combined to support subspecies treatment in future work.
4.4 Suggestions for resource conservation and utilization
Begonia grandis has important ornamental value and is often cultivated as a landscape plant in scenic or tourist sites in China. It is also an important traditional medicine. Effective protection of the wild sources of B. grandis is a basic requirement for the sustainable use of this species. Based on the pattern of genetic diversity distribution and the results of SDM, populations with high genetic diversity, unique haplotypes, stable habitats, special traits, or extreme distribution should be protected in situ or conserved ex situ as a priority. Specifically, the populations in southwest regions with potential as refugia, such as the Yunnan-Guizhou Plateau, the Three Gorges region, and the Daba Mountains, have high genetic diversity, and their habitats are stable. The populations in Lingyuan City of Liaoning Province and Chayu County of Tibet Province are in extreme distribution points and have the highest cold resistance. Attention should also focus more on the conservation and utilization of some populations with special traits, such as those with stable, white-spotted leaves in Yongshun county of Hunan province. Meanwhile, as the populations of southern China are the most vulnerable to climate change, they should be continuously monitored.
5 Conclusions and perspectives
Begonia grandis is more tolerant to low temperatures than any other species of Begonia. The high haplotype diversity and total gene diversity of B. grandis may indicate that its adaptation to low temperatures allowed it to survive in small but ecologically suitable and isolated habitats throughout the Pleistocene. Thus, its niche has undergone a broad expansion, especially after the glacial periods. The asexual reproductive bulbils in the leaf axils were an important feature in the short-distance dispersal of this species. Given their significant ornamental value, some populations of B. grandis located near temples and scenic sites in eastern China may have been introduced from southwest China. The characteristics of B. grandis mentioned above increase its competitiveness and may be an important reason for its wide distribution. Like other begonias, the seeds, pollens, and bulbils of B. grandis have limited dispersal ability in relatively closed forests. Moreover, B. grandis strongly depends on a specific microenvironment. This leads to fragmented geographical distribution patterns that limit gene flow, which may be an important reason for the significant genetic differentiation between populations. The population genetic structure of B. grandis, with high total genetic diversity, high haplotype diversity, low within-population gene diversity, and significant genetic differentiation between populations, is consistent with a macroevolutionary pattern (Hughes and Hollingsworth, 2008). Restricted gene flow and solid reproductive barriers make it possible to maintain both inter- and intra-species boundaries, which may explain the rich diversity of species in Begonia as well as the significant genetic differentiation at the population level (Hughes and Hollingsworth, 2008; Twyford et al., 2014; Twyford et al., 2015). Begonia grandis provides an excellent example for the study of the population genetics of widespread begonias. Combined with previous cases (e.g., B. heracleifolia, B. fenicis Merr., and B. luzhaiensis T. C. Ku), our study sheds light on the evolutionary mechanisms responsible for generating and maintaining species diversity in one of the world’s largest plant genera. However, the information on polymorphism based on the chloroplast markers used in our study is limited. Further genome-wide data are needed to more thoroughly reveal the population genetic structure and population history dynamics of B. grandis. In addition, population genetic studies of other widespread species, such as B. longifolia, B. palmata, B. handelii, and B. fimbristipula, are also warranted.
Data availability statement
The datasets presented in this study can be found in online repositories. The names of the repository/repositories and accession number(s) can be found below: https://www.ncbi.nlm.nih.gov/, OQ433949-OQ433994.
Author contributions
D-KT, CL, X-LJ, and YX designed the study; D-KT, X-JL, X-PL, CL, and YX conducted the field surveys; X-JL and YX performed the laboratory work; YX and X-LJ analyzed the data; YX, X-LJ, and D-KT prepared the manuscript; D-KT, YX, X-LJ, and W-PL revised the manuscript. All authors contributed to the article and approved the submitted version.
Funding
This work was supported by grants from the National Natural Science Foundation of China (31570199) and the Shanghai Municipal Administration of Forestation and City Appearances (G222405 and G202401).
Acknowledgments
The authors wish to thank the following people for their assistance in collecting plant material in the field: Mr. Li-Zhi Tian (Shanghai Xinbang Agricultural Investment Co., Ltd.), Dr. Ren-Ping Kuang (College of Life Sciences, Hunan Normal University), Mrs. Ting-Ting Du (College of Life Sciences, Hunan Normal University), Mr. Yan-Bo Huang (Shanghai Chenshan Botanical Garden), and Mr. Chong-Jian Zhou (Hubei Guizhenyuan Chinese Herbal Medicine Co., Ltd.).
Conflict of interest
The authors declare that the research was conducted in the absence of any commercial or financial relationships that could be construed as a potential conflict of interest.
Publisher’s note
All claims expressed in this article are solely those of the authors and do not necessarily represent those of their affiliated organizations, or those of the publisher, the editors and the reviewers. Any product that may be evaluated in this article, or claim that may be made by its manufacturer, is not guaranteed or endorsed by the publisher.
Supplementary material
The Supplementary Material for this article can be found online at: https://www.frontiersin.org/articles/10.3389/fpls.2023.1178245/full#supplementary-material
Footnotes
- ^ https://padme.rbge.org.uk/begonia/home
- ^ http://www.esri.com/software/arcgis/
- ^ http://tree.bio.ed.ac.uk/software/tracer
- ^ http://tree.bio.ed.ac.uk/software/figtree/
- ^ https://www.cvh.ac.cn/
- ^ http://www.nsii.org.cn/2017/home.php
- ^ http://www.worldclim.org/
- ^ https://www.r-project.org/
References
An, Z. S., Kutzbach, J. E., Prell, W. L., Porter, S. C. (2001). Evolution of Asian monsoons and phased uplift of the Himalaya-Tibetan plateau since late Miocene times. Nature 411, 62–66. doi: 10.1038/35075035
Bandelt, H. J., Forster, P., Röhl, A. (1999). Median-joining networks for inferring intraspecific phylogenies. Mol. Biol. Evol. 16, 37–48. doi: 10.1093/oxfordjournals.molbev.a026036
Brown, J. L. (2014). SDMtoolbox: a python-based GIS toolkit for landscape genetic, biogeographic and species distribution model analyses. Methods Ecol. Evol. 5, 694–700. doi: 10.1111/2041-210X.12200
Cárdenas, M. L., Gosling, W. D., Sherlock, S. C., Poole, I., Pennington, R. T., Mothes, P. (2011). The response of vegetation on the Andean flank in western Amazonia to pleistocene climate change. Science 331, 1055–1058. doi: 10.1126/science.1197947
Chan, Y. M., Tnah, L. H., Lee, S. L., Bhassu, S., Lee, C. T., Chua, L. S. L. (2018). Limited dispersal and geographic barriers cause population differentiation and structuring in Begonia maxwelliana at both large and small scales. Plant Ecol. Divers. 11, 69–83. doi: 10.1080/17550874.2018.1471625
Comes, H. P., Kadereit, J. W. (1998). The effect of quaternary climatic changes on plant distribution and evolution. Trends Plant Sci. 3, 432–438. doi: 10.1016/S1360-1385(98)01327-2
Corander, J., Marttinen, P., Sirén, J., Tang, J. (2008). Enhanced Bayesian modelling in BAPS software for learning genetic structures of populations. BMC Bioinf. 9, 1–14. doi: 10.1186/1471-2105-9-539
Dewitte, A., Twyford, A. D., Thomas, D. C., Kidner, C. A., Van Huylenbroeck, J. (2011). “The origin of diversity in begonia: genome dynamism, population processes and phylogenetic patterns,” in The dynamical processes of biodiversity-case studies of evolution and spatial distribution. Eds. Grillo, O., Venora, G. (Rijeka: Intech Open Press), 27–52.
Drummond, A. J., Rambaut, A. (2007). BEAST: Bayesian evolutionary analysis by sampling trees. BMC Evol. Biol. 7, 1–8. doi: 10.1186/1471-2148-7-214
Drummond, A. J., Suchard, M. A., Xie, D., Rambaut, A. (2012). Bayesian Phylogenetics with BEAUti and the BEAST 1.7. Mol. Biol. Evol. 29, 1969–1973. doi: 10.1093/molbev/mss075
Elith, J., Leathwick, J. R. (2009). Species distribution models: ecological explanation and prediction across space and time. Annu. Rev. Ecol. Evol. Syst. 40, 677–697. doi: 10.1146/annurev.ecolsys.110308.120159
Excoffier, L., Lischer, H. E. (2010). Arlequin suite ver 3.5: a new series of programs to perform population genetics analyses under Linux and windows. Mol. Ecol. Resour. 10, 564–567. doi: 10.1111/j.1755-0998.2010.02847.x
Forrest, L. L., Hollingsworth, P. M. (2003). A recircumscription of Begonia based on nuclear ribosomal sequences. Plant Syst. Evol. 241, 193–211. doi: 10.1007/s00606-002-0033-y
Frodin, D. G. (2004). History and concepts of big plant genera. Taxon 53, 753–776. doi: 10.2307/4135449
Fu, Y. X. (1997). Statistical tests of neutrality of mutations against population growth, hitchhiking and background selection. Genetics 147, 915–925. doi: 10.1093/genetics/147.2.915
Gu, C. Z., Peng, C. I., Turland, N. J. (2007). “Begoniaceae,” in Flora of China, vol. 13 . Eds. Wu, Z. Y., Raven, P. H., Hong, D. Y. (Beijing and St. Louis: Science Press and Missouri Botanical Garden Press), 153–207.
Hall, T. A. (1999). BioEdit: a user-friendly biological sequence alignment editor and analysis program for windows 95/98/NT. Nucleic Acids Symp. Ser. 41, 95–98.
Hamrick, J. L., Godt, M. W. (1996). Effects of life history traits on genetic diversity in plant species. Phil. Trans. R. Soc Lond. B 351, 1291–1298. doi: 10.1098/rstb.1996.0112
Hewitt, G. M. (2000). The genetic legacy of the quaternary ice ages. Nature 405, 907–913. doi: 10.1038/35016000
Hewitt, G. M. (2004). Genetic consequences of climatic oscillations in the quaternary. Phil. Trans. R. Soc Lond. B 359, 183–195. doi: 10.1098/rstb.2003.1388
Hughes, M., Hollingsworth, P. M. (2008). Population genetic divergence corresponds with species-level biodiversity patterns in the large genus Begonia. Mol. Ecol. 17, 2643–2651. doi: 10.1111/j.1365-294X.2008.03788.x
Hughes, M., Hollingsworth, P. M., Miller, A. G. (2003). Population genetic structure in the endemic Begonia of the socotra archipelago. Biol. Conserv. 113, 277–284. doi: 10.1016/S0006-3207(02)00375-0
Hughes, M., Moonlight, P., Jara, A., Pullan, M. (2015) Begonia Resource Centre. Available at: https://padme.rbge.org.uk/begonia/home (Accessed December 6, 2022).
Jiménez-Valverde, A., Lobo, J. M. (2007). Threshold criteria for conversion of probability of species presence to either–or presence–absence. Acta.Oecol 31, 361–369. doi: 10.1016/j.actao.2007.02.001
Kalyaanamoorthy, S., Minh, B. Q., Wong, T. K., von Haeseler, A., Jermiin, L. S. (2017). ModelFinder: fast model selection for accurate phylogenetic estimates. Nat. Methods 14, 587. doi: 10.1038/nmeth.4285
Kiew, R. U. T. H. (2001). The limestone begonias of sabah, Borneo–flagship species for conservation. Gard. Bull. Singapore 5, 241–286.
Ku, C. Z. (1999). “Begoniaceae,” in Flora Reipublicae Popularis Sinicae, vol. 52 . Ed. Wu, C. Y. (Beijing: Science Press), 126–269.
Li, C., Cheng, J. L., Li, Y. Y., Tian, D. K. (2018). Genetic diversity of Begonia versicolor (Begoniaceae), a narrow endemic species in southeast Yunnan of China. Taiwania 63, 49. doi: 10.6165/tai.2018.63.49
Li, Y. C., Fu, N. F., Sun, J. Z., Xiao, Y., Cao, J. G., Tian, D. K., et al. (2021). Intraspecific phenotypic diversity in Begonia grandis. Bull. Bot. Res. 41, 775–788. doi: 10.7525/j.issn.1673-5102.2021.05.016
Li, X. J., Tian, D. K., Li, C., Liu, K. M., Li, X. P., Nakata, M. (2014). The history, culture, utilization, germplasm diversity and research advances of Begonia grandis dryand. Botanical Res. 3, 117–139. doi: 10.12677/BR.2014.33017
Librado, P., Rozas, J. (2009). DnaSP v5: a software for comprehensive analysis of DNA polymorphism data. Bioinformatics 25, 1451–1452. doi: 10.1093/bioinformatics/btp187
Matolweni, L. O., Balkwill, K., McLellan, T. (2000). Genetic diversity and gene flow in the morphologically variable, rare endemics Begonia dregei and Begonia homonyma (Begoniaceae). Am. J. Bot. 87, 431–439. doi: 10.2307/2656639
Metcalfe, S. E., O'Hara, S. L., Caballero, M., Davies, S. J. (2000). Records of late Pleistocene-Holocene climatic change in Mexico-a review. Quaternary Sci. Rev. 19, 699–721. doi: 10.1016/S0277-3791(99)00022-0
Moonlight, P. W., Ardi, W. H., Padilla, L. A., Chung, K. F., Fuller, D., Girmansyah, D., et al. (2018). Dividing and conquering the fastest-growing genus: towards a natural sectional classification of the mega-diverse genus Begonia (Begoniaceae). Taxon 67, 267–323. doi: 10.12705/672.3
Nakamura, K., Kokubugata, G., Rubite, R. R., Huang, C. J., Kono, Y., Yang, H. A., et al. (2014). In situ glacial survival at the northern limit of tropical insular Asia by a lowland herb Begonia fenicis (Begoniaceae). Bot. J. Linn. Soc. 174, 305–325. doi: 10.1111/boj.12138
Nakata, M., Ueno, T., Li, J. X. (2012). Chromosome number and pollen fertility of Begonia grandis (Begoniaceae) from Japan and China. Bull. Botanic Gardens Toyama 17, 23–29.
Nogués-Bravo, D. (2009). Predicting the past distribution of species climatic niches. Global Ecol. Biogeogr. 18, 521–531. doi: 10.1111/j.1466-8238.2009.00476
Peakall, R., Smouse, P. E. (2012). GenAlEx 6.5: genetic analysis in excel. population genetic software for teaching and research–an update. Bioinformatics 28, 2537–2539. doi: 10.1093/bioinformatics/bts460
Petit, R. J., Aguinagalde, I., de Beaulieu, J. L., Bittkau, C., Brewer, S., Cheddadi, R., et al. (2003). Glacial refugia: hotspots but not melting pots of genetic diversity. Science 300, 1563–1565. doi: 10.1126/science.1083264
Phillips, S. J., Anderson, R. P., Schapire, R. E. (2006). Maximum entropy modeling of species geographic distributions. Ecol. Modell. 190, 231–259. doi: 10.1016/j.ecolmodel.2005.03.026
Pons, O., Petit, R. (1996). Measuring and testing genetic differentiation with ordered versus unordered alleles. Genetics 144, 1237–1245. doi: 10.1093/genetics/144.3.1237
Qiu, Y. X., Fu, C. X., Comes, H. P. (2011). Plant molecular phylogeography in China and adjacent regions: tracing the genetic imprints of quaternary climate and environmental change in the world's most diverse temperate flora. Mol. Phylogenet. Evol. 59, 225–244. doi: 10.1016/j.ympev.2011.01.012
Quinn, J. F., Harrison, S. P. (1988). Effects of habitat fragmentation and isolation on species richness: evidence from biogeographic patterns. Oecologia 75, 132–140. doi: 10.1007/BF00378826
Rajbhandary, S., Hughes, M., Phutthai, T., Thomas, D. C., Shrestha, K. K. (2011). Asian Begonia: out of Africa via the Himalayas. Gard. Bull. Singapore 63, 277–286.
Rambaut, A., Drummond, A. J. (2007) Tracer. Available at: http://tree.bio.ed.ac.uk/software/tracer (Accessed December 9, 2022).
Rogers, A. R., Harpending, H. (1992). Population growth makes waves in the distribution of pairwise genetic differences. Mol. Biol. Evol. 9, 552–569. doi: 10.1093/oxfordjournals.molbev.a040727
Schneider, S., Excoffier, L. (1999). Estimation of past demographic parameters from the distribution of pairwise differences when the mutation rates vary among sites: application to human mitochondrial DNA. Genetics 152, 1079–1089. doi: 10.1093/genetics/152.3.1079
Shaw, J., Lickey, E. B., Beck, J. T., Farmer, S. B., Liu, W., Miller, J., et al. (2007). Comparison of whole chloroplast genome sequences to choose noncoding regions for phylogenetic studies in angiosperms: the tortoise and the hare III. Am. J. Bot. 94, 275–288. doi: 10.3732/ajb.94.3.275
Slatkin, M., Hudson, R. R. (1991). Pairwise comparisons of mitochondrial DNA sequences in stable and exponentially growing populations. Genetics 129, 555–562. doi: 10.1093/genetics/129.2.555
Swindell, S. R., Plasterer, T. N. (1997). “SEQMAN,” in Sequence data analysis guidebook. methods in molecular medicine™, vol. 70 . Ed. Swindell, S. R. (Totowa, NJ: Springer Press), 75–89. doi: 10.1385/0-89603-358-9:75
Tajima, F. (1989). Statistical method for testing the neutral mutation hypothesis by DNA polymorphism. Genetics 123, 585–595. doi: 10.1093/genetics/123.3.585
Tamura, K., Peterson, D., Peterson, N., Stecher, G., Nei, M., Kumar, S. (2011). MEGA5: molecular evolutionary genetics analysis using maximum likelihood, evolutionary distance, and maximum parsimony methods. Mol. Biol. Evol. 28, 2731–2739. doi: 10.1093/molbev/msr121
Tebbitt, M. C. (2005). Begonias: cultivation, identification, and natural history (Portland: Timber Press).
Tebbitt, M. C., Lowe-Forrest, L., Santoriello, A., Clement, W. L., Swensen, S. M. (2006). Phylogenetic relationships of Asian Begonia, with an emphasis on the evolution of rain-ballist and animal dispersal mechanisms in sections Platycentrum, Sphenanthera and Leprosae. Syst. Bot. 31, 327–336. doi: 10.1600/036364406777585784
Thomas, D. C. (2010). Phylogenetics and historical biogeography of southeast Asian Begonia l. (Begoniaceae). Ph.D. dissertation (Glasgow: University of Glasgow).
Thomas, D. C., Hughes, M., Phutthai, T., Rajbhandary, S., Rubite, R., Ardi, W. H., et al. (2011). A non-coding plastid DNA phylogeny of Asian Begonia (Begoniaceae): evidence for morphological homoplasy and sectional polyphyly. Mol. Phylogenet. Evol. 60, 428–444. doi: 10.1016/j.ympev.2011.05.006
Tian, D. K., Xiao, Y., Tong, Y., Fu, N. F., Liu, Q. Q., Li, C. (2018). Diversity and conservation of Chinese wild begonias. Plant Diversity 40, 75–90. doi: 10.1016/j.pld.2018.06.002
Tseng, Y. H., Huang, H. Y., Xu, W. B., Yang, H. A., Peng, C. I., Liu, Y., et al. (2019). Phylogeography of Begonia luzhaiensis suggests both natural and anthropogenic causes for the marked population genetic structure. Bot. Stud. 60, 1–19. doi: 10.1186/s40529-019-0267-9
Twyford, A. D., Kidner, C. A., Ennos, R. A. (2014). Genetic differentiation and species cohesion in two widespread central American Begonia species. Heredity 112, 382–390. doi: 10.1038/hdy.2013.116
Twyford, A. D., Kidner, C. A., Ennos, R. A. (2015). Maintenance of species boundaries in a Neotropical radiation of Begonia. Mol. Ecol. 24, 4982–4993. doi: 10.1111/mec.13355
Twyford, A. D., Kidner, C. A., Harrison, N., Ennos, R. A. (2013). Population history and seed dispersal in widespread central American Begonia species (Begoniaceae) inferred from plastome-derived microsatellite markers. Bot. J. Linn. Soc. 171, 260–276. doi: 10.1111/j.1095-8339.2012.01265.x
Wang, W. T. (1992). On some distribution patterns and some migration routes found in the eastern Asiatic region. Acta Phytotaxonomica Sin. 30, 1–24 (in Chinese).
Keywords: phylogeography, species distribution modeling, glacial refugia, chloroplast DNA, population genetic structure, Begonia
Citation: Xiao Y, Li X-J, Jiang X-L, Li C, Li X-P, Li W-P and Tian D-K (2023) Spatial genetic patterns and distribution dynamics of Begonia grandis (Begoniaceae), a widespread herbaceous species in China. Front. Plant Sci. 14:1178245. doi: 10.3389/fpls.2023.1178245
Received: 02 March 2023; Accepted: 21 April 2023;
Published: 10 May 2023.
Edited by:
Xiaohua Jin, Institute of Botany (CAS), ChinaReviewed by:
Hai-Fei Yan, South China Botanical Garden (CAS), ChinaShaoqing Tang, Guangxi Normal University, China
Chun-Lei Xiang, Kunming Institute of Botany (CAS), China
Copyright © 2023 Xiao, Li, Jiang, Li, Li, Li and Tian. This is an open-access article distributed under the terms of the Creative Commons Attribution License (CC BY). The use, distribution or reproduction in other forums is permitted, provided the original author(s) and the copyright owner(s) are credited and that the original publication in this journal is cited, in accordance with accepted academic practice. No use, distribution or reproduction is permitted which does not comply with these terms.
*Correspondence: Wei-Ping Li, bHdwQGh1bm51LmVkdS5jbg==; Dai-Ke Tian, ZGt0aWFuQGNlbXBzLmFjLmNu