- 1Suzhou Polytechnic Institute of Agriculture, Suzhou, China
- 2Nanjing Institute of Agricultural Mechanization, Ministry of Agriculture and Rural Affairs, Nanjing, China
- 3Nanjing Institute of Technology, Nanjing, China
Traditional agricultural production requires numerous human and material resources; however, agricultural production efficiency is low. The successful development of plant protection unmanned aerial vehicles (UAVs) has changed the operation mode of traditional agricultural production, saving human, material, and financial resources and significantly improving production efficiency. To summarize the process of improving the productivity of plant protection UAVs, this study established a productivity calculation model of UAVs based on the time composition of the UAV agricultural plant protection process, including spraying, turning, replenishment, and transfer times. The time required for the unmanned aircraft application process was counted through years of tracking the application process of eight different plant protection unmanned aircraft. Plot lengths of 100, 300, 500, 700, 1,000, 1,500, 2,000, 2,500, 3,000, and 3,500 m were established to calculate the theoretical productivity. The results showed that the productivity of different types of plant protection UAVs increased with an increase in plot length in the range of 100 to 1,500 m; however, when the plot length reached a certain value, the productivity growth rate slowed down or even decreased slightly. Simultaneously, based on the working area per 10,000 mu, the recommended plot length and the number of configured models for different models were recommended. If the plant protection UAV was distinguished by electric and oil power, the time utilization rate of electric plant protection UAVs was 72.7%, and the labor productivity was 56.4 mu/person·h. In contrast, the time utilization rate of the heavy load oil-powered plant protection unmanned aircraft was 86%, and the labor productivity was 63.5 mu/person ·h. This study can support plant protection UAV enterprises to optimize equipment efficiency, provide evaluation methods for the operation efficiency assessment of plant protection UAVs, provide a reference for the selection of plant protection UAVs, and provide a basis for field planning.
1 Introduction
The plant protection unmanned aerial vehicle (UAV) has several advantages compared with the ground boom sprayer, which include high operation efficiency, strong ability to handle emergencies, low operating cost, and labor intensity (Lou et al., 2017). Specifically, it solves the difficult problem of ground equipment and manual work in the late stage of crop growth. Furthermore, with the further implementation of China’s land transfer policy, the scale of agricultural production has continued to expand (Xue and Lan, 2013; Feng and Yang, 2014), the cost of rural labor has continued to rise, and the demand for unmanned aerial vehicle application in agricultural plant protection has become increasingly strong (Kirk, 2003). Therefore, technical research, equipment development, and operation mode formulation of plant protection UAV spraying operations have become the research hotspots of scientific research units, enterprises, and promotion departments in plant protection machinery.
Recently, studies have reported considerable innovations in improving the quality and efficiency of plant protection unmanned aerial vehicle operations from spraying operation parameter matching, equipment performance optimization, and operation path planning (Zhang et al., 2021). Several studies have been conducted on the application of plant protection UAVs, such as operating speed (Kirk et al., 2001; Qin et al., 2014), spray volume and height (Lan et al., 2010), spray width (Zhu et al., 2019), droplet size (Qiu et al., 2013), natural wind speed (Chen et al., 2017a), and airflow field (Carlton, 1999; Chen et al., 2017b), on the influence of droplet deposition, establishing an advanced and specific spraying operation parameter model and its evaluation method (Zhang et al., 2015; Wang et al., 2016a).
Productivity improvement studies mainly focused on the path planning of pesticide application (Wang et al., 2016b), such as the accuracy and control of the route of plant protection unmanned aircraft based on the farmland environment (Ru et al., 2012; Yang et al., 2017), the development of an efficient matching algorithm for plant protection unmanned aircraft operations (Xu et al., 2017), the deployment and decision-making of the UAV flying defense team (Cao et al., 2019), and the monitoring technology of the pesticide application state of the plant protection unmanned aircraft (Xu et al., 2017; Yang et al., 2019).
Current studies mainly focus on improving the operation quality of plant protection UAVs and the reliability of spraying equipment, which provides much technical support for popularizing and applying plant protection UAVs. The productivity of plant protection UAVs is very important for farmland size planning and equipment configuration for intensive production; however, there are no relevant studies. Therefore, this study collected production data of plant protection UAVs from 2016 to 2020 to summarize the method of enhancing their production process. Furthermore, the study proposes the appropriate plot length and configuration quantity for each model under stable labor productivity, providing data support for applying plant protection UAVs.
2 Material and methods
2.1 Technical index of productivity
The technical indicators of plant protection unmanned aerial vehicle spraying operation productivity include hourly working time productivity, net spraying hourly productivity, shift time utilization, and labor productivity. Equations 1–4 (Qiao et al., 2016) are as follows:
where Wb is the actual hourly productivity, mu/h; U is the actual working area, mu; TT is the flight time, h; WS is the hourly productivity of net spraying, mu/h; TZ is the net spraying time, h; τ is the time utilization, %; Gj is labor productivity, mu/person·h; and Aj is the number of crew members, people.
2.2 Job productivity model
2.2.1 Model basis
The productivity of plant protection unmanned aircraft was acquired according to GB/5667-2008 (Standardization Administration of China, 2008):
where W is the productivity, mu/h; B is the spraying amplitude of plant protection unmanned aircraft, m; v is the application speed, m/s; and τ is the time utilization rate, the ratio between the net application time and the total time during the application duration of plant protection UAV. Plant protection UAV pesticide application requires frequent take-off and landing, and the time utilization model is shown in Equation 6.
where Tzi is the net spraying time when spraying the ith tank of spray liquid, s, and TTi is the total time for spraying the ith tank of spray liquid, s.
2.2.2 Total operation time model
The reliability of the plant protection UAV is not part of the content of this test, the scale of the test is large, and communication and coordination will cause time delays. Therefore, the total time of this test is the sum of the time of each operation sortie statistical spraying task. The spraying operation of the plant protection UAV includes preparation before the first operation (assembly, maintenance, and debugging), supply (maintenance, dosing, refueling, or battery replacement), attitude adjustment before the operation (stabilizing the rotor speed and entering the flight trajectory), spraying, U-turn (acceleration and deceleration and U-turn), return and flameout (empty travel and rotor stop), and supply point transfer and other links. The total time model of its work is shown in Equation 7:
where Tfp is the preparation time before the first operation, s; Tsi is the total refill time at the ith tank of solution, s, including refilling, refueling, battery replacement, maintenance, and other time; Tami is the adjustment time before the application operation at the ith tank of liquid, s, time from ignition to when spraying begins; Taiis the net spray time when the ith tank is sprayed, s; Tri is the turnaround time when the ith tank of medicine, s; Ttoiis the return flameout time at the ith tank of medicine, s, from the end of spraying until the rotor stops rotating; and Tsuiis the transfer time of the ith resupply point, s.
Research on the time composition and representation of plant protection unmanned aircraft production operations aims to improve the basic theory of production performance and testing methods, summarize the production performance testing methods of agricultural machinery, construct an unmanned aircraft production efficiency model, and propose processing solutions to improve the production performance of different unmanned aircraft platforms in response to their production data.
2.2.3 Replenishment time calculation model
The net spraying time is mainly affected by the maximum travel, replenishment times, and time the plant protection unmanned aircraft can operate with a full tank of spray liquid. Among them, the maximum stroke that can be operated with a full tank of spray liquid is related to the capacity of the tank, the operating speed, and the total flow of the nozzle. The model calculation is shown in Equation 8:
where Lmax is the maximum stroke that can be operated with a full tank of liquid, m; Q is the (maximum) spray liquid loading capacity, L; and q is the total flow rate of the nozzle, L/min. The flight path is planned with the fewest supply points and the fewest number of U-turns during spraying operations. For example, suppose the length of the plot is L, and the width of the plot is Bf; the number of operational trips of the plant protection UAVs to complete the application of a field is the ratio of the width of the field to the width of the spray operation, and combined, thus, the calculation is shown in Equation 9:
where B is the spraying working width, m; Bf is the width of the plot, m; and Nx is the number of operating strokes. The width of the plot should be designed as much as possible to be double the spray width of the plant protection unmanned aircraft to ensure that the spraying operation does not occur with heavy and missing spraying and spreading of empty strokes.
1) When , the replenishment points are
The number of refills is
2) When , only one resupply point is set up on one side of the ground.
The number of refills is
2.2.4 Productivity calculation model
To obtain the productivity model Equation 12 of plant protection unmanned aerial vehicle spraying operation, substitute Equations 6–11 into Equation 5:
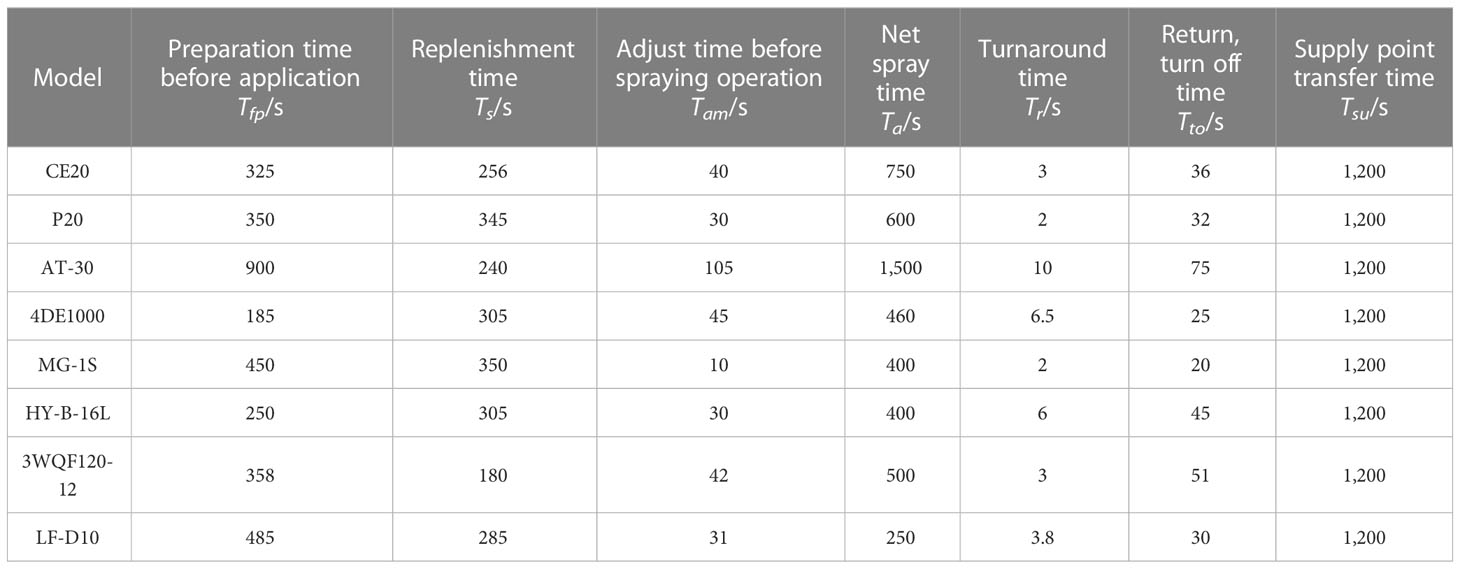
where Nsis the number of refills, Nam is the number of adjustments before application operations, Nto is the number of returns and flameouts and Na is the number of spraying operations frame. Ns = Nam = Nto = Na.The number of turns is Nr = Nb(Nx − 1). Test statistics determine each time item in the formula, and the time data of each model are shown in Table 1.
2.3 Plant protection UAV
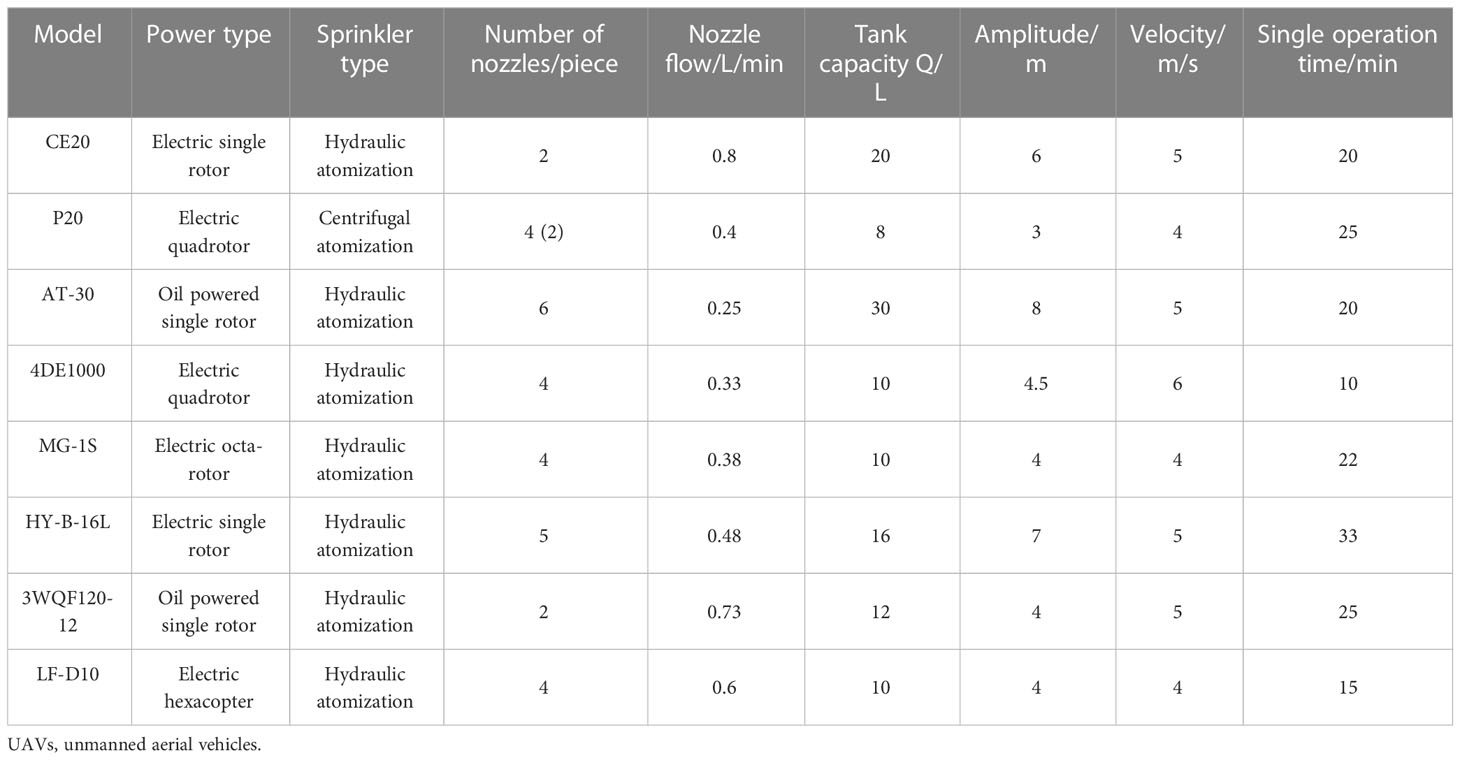
A total of eight types of plant protection unmanned aircraft with different power, atomization methods, and the number of rotors were selected for this test. As shown in Figure 1. The power included electric and oil power, and the rotors included single, four, six, and eight rotors. The weight was 8–30 kg. The basic parameters of the test plant protection UAVs are shown in Table 2.
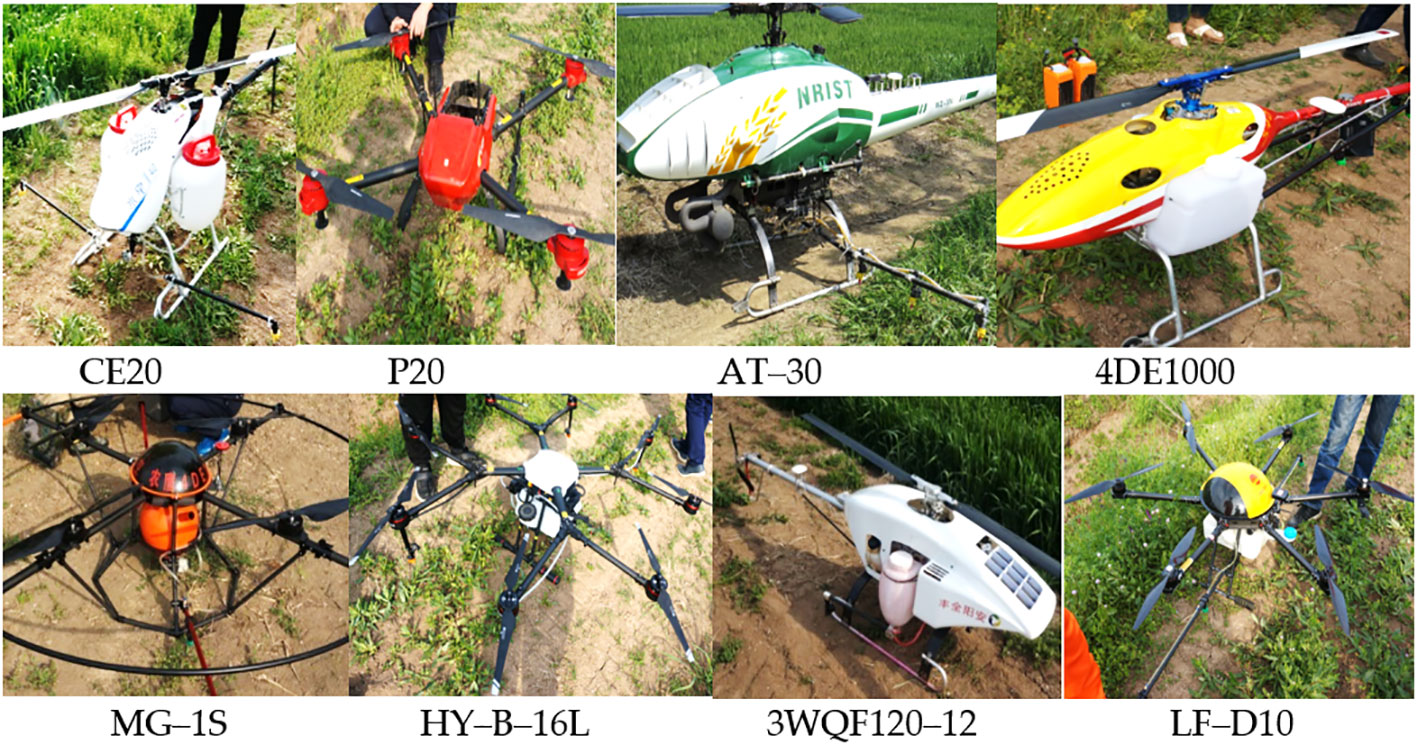
Figure 1 The UAVs used in testing. Note: the P20 is installed with four nozzles, but only two nozzles spray at a time. UAVs, unmanned aerial vehicles.
2.4 Test conditions and methods
Eight adjacent plots were selected for allocation to each plant protection UAV, each 730 m in length, with CE20, P20, 4DE1000, HY-B-16L, MG-1S, LF-D10, 3WQF120-12, and AT-30 operating plots of 60.3, 51.7, 21.5, 21.5, 21.1, 19.1, 41.8, and 52.8 mu, respectively.
Based on continuous tracking of plant protection unmanned aircraft productivity tests for many years, Excel 2010 software was used to process data and draw curves, among which the key replenishment point calculation condition statement function was as follows:
IF(Nb = 1,CEILING(20/CEILING(Lmax/(2 * L),1),1),((Nb − 1) * 10 + CEILING(20 *(2 * L − (Nb − 1) * Lmax)/(2 * Lmax),1))).
The test crews were professionals from each plant protection unmanned aircraft company, and each crew developed his/her operation plan according to the characteristics of his/her unmanned aircraft. In addition, each crew had a researcher responsible for recording the total effective operation time, the net spraying time, and the time consumption of each time item.
2.5 Data acquisition and recording
The total time consumption and net spraying time of the three plant protection operations were recorded and averaged as shown in Table 3. In addition, the technical indicators such as time utilization, hourly productivity, net spraying hourly productivity, and labor productivity were calculated according to Equations 1–4, respectively, according to the number of crew members and the actual operating area of each model. The calculation results are shown in Table 3.
The productivity test was conducted together with the efficacy test to facilitate the organization of the test. A fixed operating area was arranged for different units. So that the normal application operations are not affected, each operational sortie was used as a statistical unit to track and test various time items occurring during application operations of different models and to record the time consumed by each time item. Therefore, the data in Table 1 are a combination of years of test data for each time item with abnormal data exclusion, and the average of the time items of all sorties during the operation period is the test result, as shown in Table 1. The transfer time of the resupply point was set to 20 min because the crews of different types of plant protection UAVs were configured by the ability of one crew to complete the transfer at one time, and the article was calculated according to the transfer length of 600 m and the weight walking speed of 0.5 m/s.
3 Results and discussion
3.1 Comparative analysis of technical indicators of productivity of different models
As observed from Equation 2, the net spraying hourly productivity of plant protection UAVs is an important indicator of the inherent performance of plant protection unmanned aircraft, including spraying width, operating speed, and tank capacity. The actual hourly productivity of the impact indicators, in addition to the inherent performance of the equipment and time utilization, is also a key factor affecting the hourly productivity.
The test results in Table 3 completely verified the law, such as the AT30 plant protection UAV with a tank capacity of 30 L, a spraying width of 8 m, and an operating speed of 5 m/s. Therefore, the net spraying time of this model was the highest among all models, reaching 117.3 mu/h. In contrast, the LF-D10 plant protection UAV has a tank capacity of 10 L, a spraying width of 4 m, and an operating speed of 4 m/s; thus, the net spraying time of this model was the lowest among all models, only 42.4 mu/h. However, the complexity of the operations and the level of organizational proficiency of the different models lead to significant differences in time utilization, ranging from a minimum of 20% to a maximum of 45%, which was affected by time utilization AT30’s actual hourly productivity of 26.4 mu/h, which was lower than CE20’s actual hourly productivity of 30.15 mu/h. Furthermore, the labor productivity calculation model Equation 4 shows that the labor productivity is related to the actual hourly productivity and unit configuration labor; therefore, the labor productivity of P20 with a 2-labor unit configuration can reach up to 13.6 mu/person·h. In contrast, the actual labor productivity of AT30 was only 6.6 mu/person·h owing to the low time utilization and a large amount of labor allocated to the unit.
From the above analysis, the actual operational efficiency of plant protection unmanned aircraft application is affected by the inherent performance of the unit as well as closely related to the reasonable configuration of the unit’s labor force, the level of organization and coordination of the crew, and the degree of operational proficiency (time utilization).
3.2 Analysis of the relationship between theoretical productivity and plot length
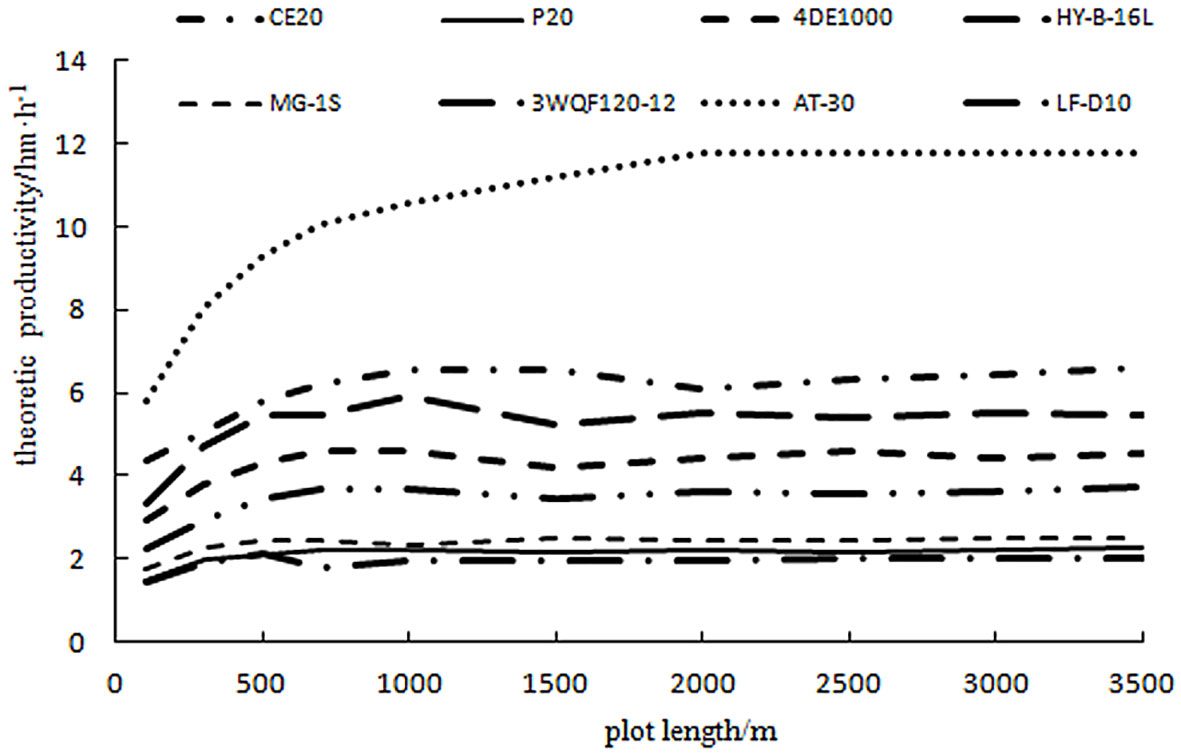
From the time consumption data of the plant protection unmanned aircraft in Table 1, the variation law of crew productivity and plot conditions can be derived according to the productivity model Equation 12. To study the effect of plot length on the productivity of each plant protection UAV, the width of the operating plot for each model in the study was calculated according to 20 operating strokes, and the plot lengths were calculated from 100, 300, 500, 700, 1,000, 1,500, 2,000, 2,500, 3,000, and 3,500 m. Combined with the data in Table 1 using Excel 2010 software to prepare the calculation program, the theoretical productivity of each model with the plot length variation law is shown in Figure 2.
Analysis of Figure 2 shows that the productivity of different models of plant protection UAVs increases with plot length on the 100–1,500-m interval, but the increase varies. When the block length reaches a certain value, the rate of increase in productivity slows down or even decreases slightly.
To derive the plot lengths corresponding to the maximum productivity of the different models, the curves in Figure 2 focused on the 100–1,500-m plot length interval to obtain the optimum plot lengths for the different models and their corresponding theoretical productivity, as shown in Table 4. Analysis of the data in Table 4 shows that the theoretical productivity of the plant protection unmanned aircraft can reach a maximum of 10.1 ha/h. The theoretical productivity of each model also varies greatly because the theoretical productivity is related to the time of each statistical item in Table 1 and is more affected by key parameters such as spraying width, operating speed, and the tank capacity of the plant protection unmanned aircraft. However, theoretical productivity does not consider the differences in organizational coordination, staffing, and requirements of each model, and these parameters are important indicators of time utilization and labor productivity.
According to the operating area of 10,000 mu, the effective period of each pest control is calculated by 5 days, and each unit works 8 h/day; combined with the maintenance requirements of each model, Table 4 recommends the number of plant protection unmanned aircraft required for the operating area of 10,000 mu for different models.
3.3 Labor productivity improvement
From the model Equation 5, the productivity of plant protection UAVs is related to the spraying width, operating speed, and time utilization; the optimal spraying width and operating speed are determined for a specific plant protection UAV type to improve productivity only by the time utilization of the application operation. Model Equation 4 reveals that labor productivity is related to productivity and has an important relationship with the number of units configured; therefore, reducing the number of units is the most direct way to improve labor productivity.
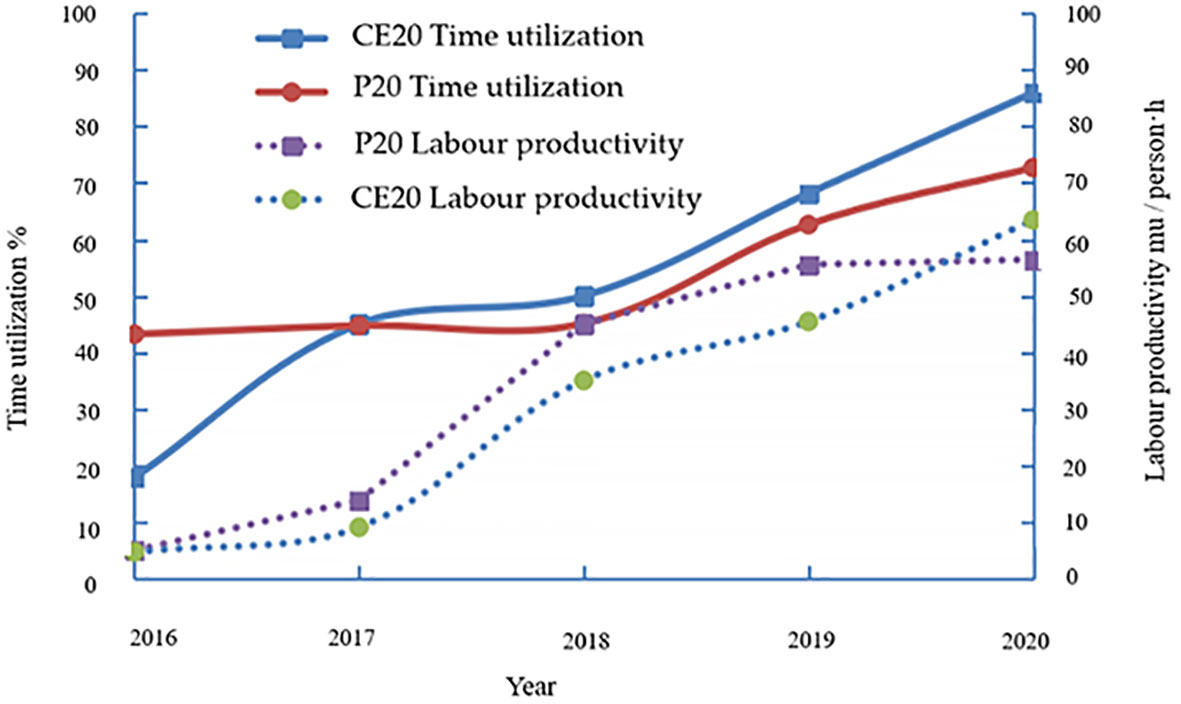
As observed in Figure 3, with the advancement of the battery technology of electric UAVs and the reliability of oil-powered plant protection UAVs, the time utilization rate of electric plant protection UAVs increased from 43% in 2016 to 72.7% in 2020, and the labor productivity increased from 4.85 mu/person·h in 2016 to 56.4 mu/person·h in 2020. In contrast, the time utilization rate of oil-powered aircraft increased from 17.8% in 2016 to 86% in 2020, and labor productivity increased from 4.55 mu/person·h in 2016 to 63.5 mu/person·h in 2020. The reason for this is the high failure rate of the early oil-powered plant protection unmanned aircraft. The complex take-off and landing process leads to low efficiency, and with the reliability of the aircraft to improve the equipment control, and autonomous improvement, efficiency greatly improved.
4 Conclusion
1) This study determined the time composition of plant protection UAV application operations and established a mathematical model of the variation pattern of operational productivity and plot length.
2) The actual operational efficiency of plant protection UAV application is affected by the inherent performance of the crew and is closely related to the reasonable configuration of the crew’s labor force, the level of organization and coordination of the crew, and the degree of operational proficiency (time utilization).
3) The optimal plot lengths of different types of plant protection UAVs and their corresponding theoretical productivity were obtained, and the number of UAVs required for each 10,000 mu of operating area was recommended.
4) As battery technology for electric UAVs and the reliability of oil-powered plant protection UAVs progressed, the time utilization of electric and oil-powered plant protection UAVs increased from 2016 to 2020.
The study conclusions obtained can support plant protection UAV enterprises to optimize equipment efficiency, provide evaluation methods for the operational efficiency assessment of plant protection UAVs, provide a reference for the selection of plant protection UAVs, and provide a basis for field planning.
Data availability statement
The original contributions presented in the study are included in the article/supplementary material. Further inquiries can be directed to the corresponding author.
Author contributions
WQ designed the study. WQ, PC, and BW performed most experiments. WQ analyzed the data and wrote the first draft of the manuscript. PC revised the manuscript. BW supervised the project and reviewed the manuscript. All authors contributed to the article and approved the submitted version.
Funding
This research was funded by the National Natural Science Foundation of China (Grant No. 31971804), Jiangsu Modern Agricultural Machinery Equipment and Technology Demonstration and Promotion Project (Grant No. NJ2022-17), Suzhou Agricultural Independent Innovation Project (SNG2022061), Suzhou Agricultural Vocational and Technical College Landmark Achievement Cultivation Project (CG[2022]02), and Natural Science Foundation of Jiangsu Province (Grant No. BK20191128).
Conflict of interest
The authors declare that the research was conducted in the absence of any commercial or financial relationships that could be construed as a potential conflict of interest.
Publisher’s note
All claims expressed in this article are solely those of the authors and do not necessarily represent those of their affiliated organizations, or those of the publisher, the editors and the reviewers. Any product that may be evaluated in this article, or claim that may be made by its manufacturer, is not guaranteed or endorsed by the publisher.
References
Cao, G., Zhang, Q., Chen, C., Zhang, M., Zhang, J., Huang, Y. (2019). Scheduling model of UAV plant protection team based on multi-objective optimization. Trans. Chin. Soc Agric. Mach. 50 (11), 92–101. doi: 10.6041/j.issn.1000-1298.2019.11.010
Carlton, J. B. (1999). Technique to reduce chemical usage and concomitant drift from aerial sprays: U. s. Patent 5, 975, 425, pp 08–15.
Chen, S., Lan, Y., Bradley, K. F., Jiyu, L. I., Aimin, L. I. U., Yuedong, M. A. O. (2017a). Effect of wind field below rotor on distribution of aerial spraying droplet deposition by using multi-rotor UAV. Trans. Chin. Soc Agric. Mach. 48 (8), 105–113. doi: 10.6041/j.issn.1000-1298.2017.08.011
Chen, S., Lan, Y., Li, J., Xu, X., Wang, Z., Peng, B. (2017b). Evaluation and test of effective spraying width of aerial spraying on plant protection UAV. Trans. Chin. Soc Agric. Eng. 33 (7), 82–0. doi: 10.11975/j.issn.1002-6819.2017.07.011
Feng, Y., Yang, Q. (2014). Key research fields and basic directions of Chinese rural-land comprehensive consolidation in transitional period. Trans. Chin. Soc Agric. Eng. 30 (1), 175–182. doi: 10.3969/j.issn.1002-6819.2014.01.023
Kirk, I. W. (2003). “Electrostatic coalescence for aerial spray drift mitigation,” in National cotton council of America (Nashville: Beltwide Cotton Conferences), 189–191.
Kirk, I. W., Hoffmann, W. C., Carlton, J. B. (2001). Aerial electrostatic spray system performance. Trans. ASAE 44 (5), 1089–1092. doi: 10.13031/2013.6431
Lan, Y., Thomson, S. J., Huang, Y., Hoffmann, W. C., Zhang, H. (2010). Current status and future directions of precision aerial application for site-specific crop management in the u. s. a. Comput. Electron. Agric. 74 (1), 34–38. doi: 10.1016/j.compag.2010.07.001
Lou, S. Y., Xue, X. Y., Gu, W., Cui, L. F., Xiao, H. T., Tian, Z. (2017). Current status and trends of agricultural plant protection unmanned aerial vehicle. J. Agric. Mech. Res. 39 (12), 1–6. doi: 10.13427/j.cnki.njyi.2017.12.001
Qiao, J., Han, Z., Hong, K., Chen, H., Hao, Y., Zhang, X. (2016). Variation of technology productivity of harvesting outfit along with site conditions. Trans. Chin. Soc Agric. Eng. 32 (7), 43–50. doi: 10.11975/j.issn.1002-6819.2016.07.006
Qin, W., Xue, X., Zhou, L., Zhang, S., Sun, Z., Kong, W., et al. (2014). Effects of spraying parameters of unmanned aerial vehicle on droplets deposition distribution of maize canopies. Trans. Chin. Soc Agric. Eng. 30 (5), 50–56. doi: 10.3969/j.issn.1002-6819.2014.05.007
Qiu, B., Wang, L., Cai, D., Wu, J., Ding, G., Guan, X. (2013). Effects of flight altitude and speed of unmanned helicopter on spray deposition uniform. Trans. Chin. Soc Agric. Eng. 29 (24), 25–32. doi: 10.3969/j.issn.1002-6819.2013.24.004
Ru, Y., Jia, Z., Fan, Q., Che, J. (2012). Remote control spraying system based on unmanned helicopter. Trans. Chin. Soc Agric. Mach. 43 (6), 47–52. doi: 10.6041/j.issn.1000-1298.2012.06.009
Standardization Administration of China GB/5667–2008 agricultural machinery production test methods. Beijing: Standards Press of China, (2008).
Wang, C., He, X., Wang, X., Wang, Z., Pan, H., He, Z. (2016a). Testing method of spatial pesticide spraying deposition quality balance for unmanned aerial vehicle. Trans. Chin. Soc Agric. Eng. 32 (11), 54–61. doi: 10.11975/j.issn.1002-6819.2016.11.008
Wang, C., He, X., Wang, X., Wang, Z., Wang, S., Li, L., et al. (2016b). Distribution characteristics of pesticide application droplets deposition of unmanned aerial vehicle based on testing method of spatial quality balance. Trans. Chin. Soc Agric. Eng. 32 (24), 89–97. doi: 10.11975/j.issn.1002-6819.2016.24.012
Xu, B., Chen, L., Xu, M., Tan, Y. (2017). Path planning algorithm for plant protection UAVs in multiple operation areas. Trans. Chin. Soc Agric. Mach. 48 (2), 75–81. doi: 10.6041/j.issn.1000-1298.2017.02.010
Xue, X., Lan, Y. (2013). Agricultural aviation applications in USA. Trans. Chin. Soc Agric. Mach. 44(5), 194–201. doi: 10.6041/j.issn.1000-1298.2013.05.034
Yang, X., Xinyu, X., Zhu, S., Chun, C., Wei, G., Chen, C., et al. (2019). Online spraying quality assessment system of plant protection unmanned aerial vehicle based on android client. Comput. Electron. Agric. 166, 104938. doi: 10.1016/j.compag.2019.104938
Yang, Z., Zheng, L., Li, M., Yang, W., Sun, H. (2017). Matching algorithm for plant protecting unmanned aerial vehicles and plant protecting jobs based on r-tree spatial index. Trans. Chin. Soc Agric. Eng. 33 (Supp.1), 92–98. doi: 10.11975/j.issn.1002-6819.2017.z1.014
Zhang, M., Li, T., Luo, W., Pu, P., Wang, C., Zhu, X. (2021). Quality of plant protection drone operations and their evaluation of the effectiveness of plant protection against corn borer. China Plant Prot. 41 (06), 66–69. doi: 10.3969/j.issn.1672-6820.2021.06.013
Zhang, S., Xue, X., Qin, W., Sun, Z., Ding, S., Zhou, L. (2015). Simulation and experimental verification of aerial spraying drift on n-3 unmanned spraying helicopter. Trans. Chin. Soc Agric. Eng. 31 (3), 87–93. doi: 10.3969/j.issn.1002-6819.2015.03.01
Keywords: unmanned aerial vehicle, spraying pesticide, productivity, model, evaluation method
Citation: Qin W, Chen P and Wang B (2023) Productivity model and experiment of field crop spraying by plant protection unmanned aircraft. Front. Plant Sci. 14:1168228. doi: 10.3389/fpls.2023.1168228
Received: 17 February 2023; Accepted: 22 March 2023;
Published: 19 April 2023.
Edited by:
Xiaolan Lv, Jiangsu Academy of Agricultural Sciences (JAAS), ChinaReviewed by:
Shilin Wang, Jiangsu Academy of Agricultural Sciences (JAAS), ChinaXiaojing Yan, Institute of Plant Protection (CAAS), China
Copyright © 2023 Qin, Chen and Wang. This is an open-access article distributed under the terms of the Creative Commons Attribution License (CC BY). The use, distribution or reproduction in other forums is permitted, provided the original author(s) and the copyright owner(s) are credited and that the original publication in this journal is cited, in accordance with accepted academic practice. No use, distribution or reproduction is permitted which does not comply with these terms.
*Correspondence: Weicai Qin, cWlud2VpY2FpQGNhYXMuY24=
 Weicai Qin1,2*
 Panyang Chen