 Wenjing Tao
 Ruiying Li1†
 Zhimin Li
 Licao Cui
95% of researchers rate our articles as excellent or good
Learn more about the work of our research integrity team to safeguard the quality of each article we publish.
Find out more
ORIGINAL RESEARCH article
Front. Plant Sci. , 26 April 2023
Sec. Plant Bioinformatics
Volume 14 - 2023 | https://doi.org/10.3389/fpls.2023.1168124
This article is part of the Research Topic Genetic and Epigenetic Regulatory Mechanisms in Higher Plants in Response to Abiotic Stress View all 6 articles
Gene duplication resulting from whole-genome duplication (WGD), small-scale duplication (SSD), or unequal hybridization plays an important role in the expansion of gene families. Gene family expansion can also mediate species formation and adaptive evolution. Barley (Hordeum vulgare) is the world’s fourth largest cereal crop, and it contains valuable genetic resources due to its ability to tolerate various types of environmental stress. In this study, 27,438 orthogroups in the genomes of seven Poaceae were identified, and 214 of them were significantly expanded in barley. The evolutionary rates, gene properties, expression profiles, and nucleotide diversity between expanded and non-expanded genes were compared. Expanded genes evolved more rapidly and experienced lower negative selection. Expanded genes, including their exons and introns, were shorter, they had fewer exons, their GC content was lower, and their first exons were longer compared with non-expanded genes. Codon usage bias was also lower for expanded genes than for non-expanded genes; the expression levels of expanded genes were lower than those of non-expanded genes, and the expression of expanded genes showed higher tissue specificity than that of non-expanded genes. Several stress-response-related genes/gene families were identified, and these genes could be used to breed barley plants with greater resistance to environmental stress. Overall, our analysis revealed evolutionary, structural, and functional differences between expanded and non-expanded genes in barley. Additional studies are needed to clarify the functions of the candidate genes identified in our study and evaluate their utility for breeding barley plants with greater stress resistance.
Gene duplication provides a rich source of genetic material that facilitates genome evolution and environmental adaptation; it is thus an important driver of genomic and genetic diversity (Kimura and Ohta, 1974; Panchy et al., 2016). Due to whole-genome duplication (WGD) and small-scale duplication (SSD) events, plant genomes contain a large number of duplicated genes (Freeling, 2009; Glover et al., 2015). WGD occurs frequently in the plant kingdom but rarely in the animal and fungal kingdoms (Salman-Minkov et al., 2016). WGD events have been documented in multiple angiosperms, such as rice (Yu et al., 2005), maize (Gaut et al., 2000), and cotton (Li et al., 2015; Wang et al., 2022). SSDs, including tandem, segmental, and transposon-mediated duplications, are more common in plant genomes (Gout and Lynch, 2015; Panchy et al., 2016).
Thousands of duplicated genes have accumulated deleterious mutations over the evolutionary history of plants, and this has led to the generation of pseudogenes and eventually gene loss (Lynch and Conery, 2000; Assis and Bachtrog, 2013). However, many gene duplicates are preserved in the genome due to neofunctionalization, subfunctionalization, and increased gene-dosage advantage. In the neofunctionalization model, a copy maintains its ancestral function under negative selection (also known as purifying selection), and the new copy evolves under positive selection due to the generation of adaptive mutations (Walsh, 1995; Pegueroles et al., 2013). For example, aspen FD genes have evolved to transcriptionally regulate adaptive responses and the maturation of buds rather than interact with FLOWERING LOCUS T (FT) protein (Tylewicz et al., 2015). In the subfunctionalization model, two copies perform complementary functions and accumulate mutations, and their rates of evolution increase symmetrically under negative selection (Lynch and Force, 2000; Pegueroles et al., 2013). A classical duplicated gene of the anthocyanin biosynthetic pathway in Ipomoea can be explained by the subfunctionalization model (Des Marais and Rausher, 2008). Moreover, two cation/proton antiporter 1 (CPA1) protein family members in grapevine, VIT_19s0090g01480 and VIT_05s0020g01960, have undergone subfunctionalization, and this has mediated the response to salt stress in different tissues and stages (Ma et al., 2015). In the dosage model, all duplicated genes increase the quantity of protein products, and they are rapidly fixed under positive selection (De La Torre et al., 2015). In Arabidopsis thaliana, the genes involved in glycolysis have duplicated, and this has enhanced energy production (Blanc and Wolfe, 2004).
A gene family is a group of paralogous genes produced by gene duplication that usually show structural and functional similarities (Tatusov et al., 1997). In recent years, an increasing number of studies have shown that expansions of certain gene families, caused by duplication, are associated with specific traits, resistance to environmental stress, or adaptation in plants. Expanded gene families in jackfruit are involved in the response to biotic stimuli, transferase activity, and oxidoreductase activity (Lin X. et al., 2022). KASI and SAD genes have expanded in the macadamia genome and are involved in the elongation of fatty acid chains (Lin J. et al., 2022). Expansion of the chalcone synthase (CHS) gene family in mango has mediated the biosynthesis of urushiols and related phenolics (Wang et al., 2020). WGD and polyploidization events in elephant grass have increased the number of genes involved in rapid growth, biomass accumulation, and drought tolerance (Zhang et al., 2022). Expanded gene families provide a rich resource for functional research and genetic breeding in crops.
Barley (Hordeum vulgare) was domesticated in the Fertile Crescent approximately 10,000 years ago, making it one of the world’s earliest domesticated crops (Ullrich, 2010; Zeng et al., 2018). Today, barley is the fourth most produced grain globally after maize, rice, and wheat, and it is widely used in brewing, feed, food, and medicine (https://www.fao.org/). Barley is a highly adaptable crop compared with wheat; it is known to be highly resistant to high salinity and can be grown at high altitudes (Nevo et al., 2012). The newly updated barley genome assembly (Morex V3) is the most complete characterization of the barley genome to date, and this has accelerated comparative genomics analyses of barley and other species (Mascher et al., 2021). Here, proteins from barley and six other Poaceae species were found to be clustered in 27,438 orthogroups, and 214 have undergone significant expansions in barley. The non-synonymous substitution rate (Ka), synonymous substitution rate (Ks), and Ka/Ks were calculated to assess the evolutionary rates of and selection pressures on expanded and non-expanded genes. We found that the expanded genes are evolving faster, are smaller, show weaker codon usage bias, are more weakly expressed, and show higher tissue specificity in their expression than non-expanded genes. Our data also indicate that the expanded genes were involved in responses to biotic and abiotic stresses. Overall, our study reveals the evolutionary trajectories and roles of expanded genes in barley and provides new genetic resources that will aid subsequent functional studies and the breeding of improved barley varieties.
Non-redundant protein sequences from barley (Morex V3 HC protein) and six other Poaceae species were obtained, including Brachypodium distachyon (Brachypodium_distachyon_v3.0), rice (Oryza sativa, MSUv7), sorghum (Sorghum bicolor, Sorghum_bicolor_NCBIv3), rye (Secale cereale, Rye_Lo7_2018_v1p1p1), foxtail millet (Setaria italica, Setaria italica v2.0), and maize (Zea mays, Zm-B73-REFERENCE-NAM-5.0). OrthoFinder v2.5.4 was used for orthogroup clustering with the following parameters “-M msa -S diamond” (Emms and Kelly, 2019). Orthogroups containing more than 100 genes were not preserved for subsequent analysis. An ultrametric tree was constructed using the R8s program and a phylogenetic tree generated from 5,635 single-copy orthologs (Sanderson, 2003). The calibration time between barley and rice (median time = 50 Mya) was queried from the TimeTree database (http://timetree.org) (Kumar et al., 2017). Gene family expansion and contraction were determined by CAFÉ v4.2, and the threshold for statistical significance was p-value < 0.05 (De Bie et al., 2006). Syntenic analysis was performed to reveal the duplication mechanism of the expanded genes using BLASTP and MCscanX software with default parameter (Wang et al., 2012). Transposable element (TE) annotation file was downloaded from e!DAL database (https://doi.ipk-gatersleben.de/DOI/b2f47dfb-47ff-4114-89ae-bad8dcc515a1/865cd721-0571-473b-a2ec-92ce51ded713/0). Overlap analysis between expanded genes and TEs was carried out using bedtools v2.28.0. A search for the nucleotide binding-site–leucine-rich repeat (NBS-LRR) gene family was performed using InterProScan v5.56-89.0 against the Pfam NB-ARC domains (PF00931) (Blum et al., 2021). The chromosome locations of NBS-LRR genes were visualized using MapChart v2.32 (Voorrips, 2002).
To obtain a more comprehensive picture of gene–pair relationships, we compared barley with rye and B. distachyon. Multiple sequence alignment was performed using Clustal v1.2.4 (Higgins and Sharp, 1988). The PAL2NAL program (http://www.bork.embl.de/pal2nal/) was used to convert amino acid alignments into codon alignments (Suyama et al., 2006). The Ka, Ks, and Ka/Ks values were calculated by the CODEML sub-program in PAML v4.9 (Yang, 2007). Homologous gene pairs with Ka > 2, Ks > 2, Ks < 0.01, and Ka/Ks >10 were discarded, as these abnormal values can result in inaccurate estimates or the saturation of substitutions (Villanueva-Cañas et al., 2013).
The generic feature format file of barley Morex V3 (http://doi.org/10.5447/ipk/2021/3) and an in-house python script were used to calculate the gene length, intron length, exon length, first exon length, and number of exons (Mascher et al., 2021). Proteins with sequences longer than 100 amino acids were included to estimate codon usage bias. The codon adaptation index (CAI), codon bias index (CBI), frequency of optimal codons (Fop), and GC content were computed using CodonW v1.4.4 (http://codonw.sourceforge.net/).
EggNOG-mapper v2.1.7 (http://eggnog-mapper.embl.de/) was used to assign Gene Ontology (GO) and Kyoto Encyclopedia of Genes and Genomes (KEGG) annotations (Huerta-Cepas et al., 2018; Cantalapiedra et al., 2021). GO and KEGG enrichment analyses were performed using Tbtools v1.098763 (Chen et al., 2020). Plant Ontology (PO) enrichment analysis was carried out using the enricher function in the clusterProfiler package (Wu et al., 2021). GO terms, KEGG pathways, and PO terms with p-values < 0.05 and corrected p-values (Benjamini and Hochberg method) < 0.05 were retained. Transcription factors (TFs) were identified using the Plant Transcription Factor Database (PlantTFDB v5.0, http://planttfdb.gao-lab.org/prediction.php).
A total of 174 RNA-seq samples from 16 tissues/stages (PRJEB14349) and under different abiotic stresses (heat, salt, waterlogging, and water-deficit stress) (PRJNA32416, PRJNA54259, PRJNA602700, and PRJNA439267) were downloaded from the National Center for Biotechnology Information (NCBI) Sequence Reading Archive (SRA) database. Detailed sample information is provided in Supplementary Table S1. Raw reads were preprocessed using Trimmomatic v0.36 (Bolger et al., 2014). The high-quality reads were mapped to the barley reference genome (Morex V3) with HISAT v2.1.0 (Kim et al., 2015). SAMtools v1.3.1 was used to sort BAM files (Li et al., 2009). Fragments per kilobase of exon per million fragments mapped (FPKM) values were calculated using StringTie v1.3.5 with the genomic annotation file (Pertea et al., 2015). Highly and weakly expressed genes were genes with FPKM ≥ 50 and FPKM ≤ 3, respectively (Chen et al., 2013; Guo et al., 2017). The value of τ varies from 0 to 1 and was used to measure tissue specificity, with higher τ values implying higher tissue specificity (Yanai et al., 2004). Categorical and overall tissue-specific genes refer to genes expressed in one tissue (also defined as τ = 1) and two or more tissues (also defined as τ < 1), respectively (Schug et al., 2005).
Weighted correlation network analysis (WGCNA) was employed to construct co-expression networks using the FPKM of the coding sequences (CDSs). The numbers 6 and 20 were the soft-thresholding powers for stage/tissue and stress networks, respectively. The co-expression modules were obtained using the parameters “mergeCutHeight = 0.2 and minModuleSize = 30.” The top 1% weighted values associated with TF-type expanded genes were retained for subsequent analysis (Langfelder and Horvath, 2008). The BLASTP search of barley and A. thaliana (https://www.arabidopsis.org/) predicted similar proteins and potential functions of co-expressed genes with an E-value < 1e-5. Cytoscape v3.7.2 was used to visualize the co-expression networks. For genes with homologs in A. thaliana, the gene IDs of barley were annotated as gene IDs in A. thaliana to more visually reflect the potential biological functions of the genes (Shannon et al., 2003).
The barley resequencing datasets were retrieved from the NCBI SRA database (PRJEB8044), including 89 wild accessions and 126 landrace accessions (Russell et al., 2016). The detailed information is shown in Supplementary Table S2. Trimmomatic v0.36 was used to perform quality control (Bolger et al., 2014). BWA v0.7.17-r1188 was applied to construct the genome index of barley Morex V3 and map the clean reads to the reference genome using the BWA-MEM algorithm (https://github.com/lh3/bwa). Picard tools v2.1.1 was used to sort the BAM files and remove duplicates induced by PCR amplification (https://broadinstitute.github.io/picard/). SNP calling was performed by the HaplotypeCaller module in GATK v3.5 (https://github.com/broadinstitute/gatk). The SNPs were filtered using the following criteria: quality by depth (QD) < 2.0, Fisher strand (FS) > 60.0, mapping quality (MQ) < 40.0, mapping quality rank sum (MQRankSum) < –12.5, and read position rank sum (ReadPosRankSum) < –8.0. The SNPs were annotated using SnpEff v5.1d with the parameters “-no-intergenic -no-downstream -no-upstream” (Cingolani et al., 2012). SNPs with minor allele frequency (MAF) > 0.05 and max missing rate < 0.2 were retained for subsequent analyses.
Principal component analysis (PCA) was performed using the smartPCA algorithm in the EIGENSOFT v7.2.1 program (Price et al., 2006). The Tracy–Widom test was used to determine the significance of the eigenvectors. The neighbor-joining (NJ) tree was generated using TreeBest v1.9.2 with 1,000 bootstrap replicates. FigTree v1.4.4 was used to visualize the phylogenetic tree (http://tree.bio.ed.ac.uk/software/) (Vilella et al., 2009). Population structure was analyzed using ADMIXTURE v1.3.0 with K-values from 2 to 4 (Alexander et al., 2009). Nucleotide diversity (π) and Wright’s F-statistic index (FST) were estimated using VCFtools v0.1.16 (Danecek et al., 2011). DnaSP v6.12.03 was used to identify haplotypes, and the haplotype networks were visualized using PopART v1.7 with the median-joining method (Bandelt et al., 1999; Leigh and Bryant, 2015; Rozas et al., 2017). The online Gene Structure Display Server v2.0 (http://gsds.gao-lab.org/) was used to visualize gene structure and SNP locations (Hu et al., 2015).
The R (v4.1.0) package ggplot2 was used to generate stacked plots, frequency distribution plots, and box plots, and the plots were integrated into panels using the cowplot package. The RIdeogram package was used to visualize the chromosomal distributions of the Ka, Ks, and Ka/Ks values. Heat maps were drawn using the pheatmap package. The correlation heatmaps were visualized using the corplot package. The wilcox.test, cor.test, chisq.test, and LSD.test functions in the R statistical environment were used to perform the Mann–Whitney U test, Spearman’s rank correlation test, Fisher’s exact test, and least significant difference (LSD) test, respectively. The three levels of significance in all statistical tests were as follows: *p < 0.05, **p < 0.01, and ***p < 0.001. The workflow is shown in Figure 1.
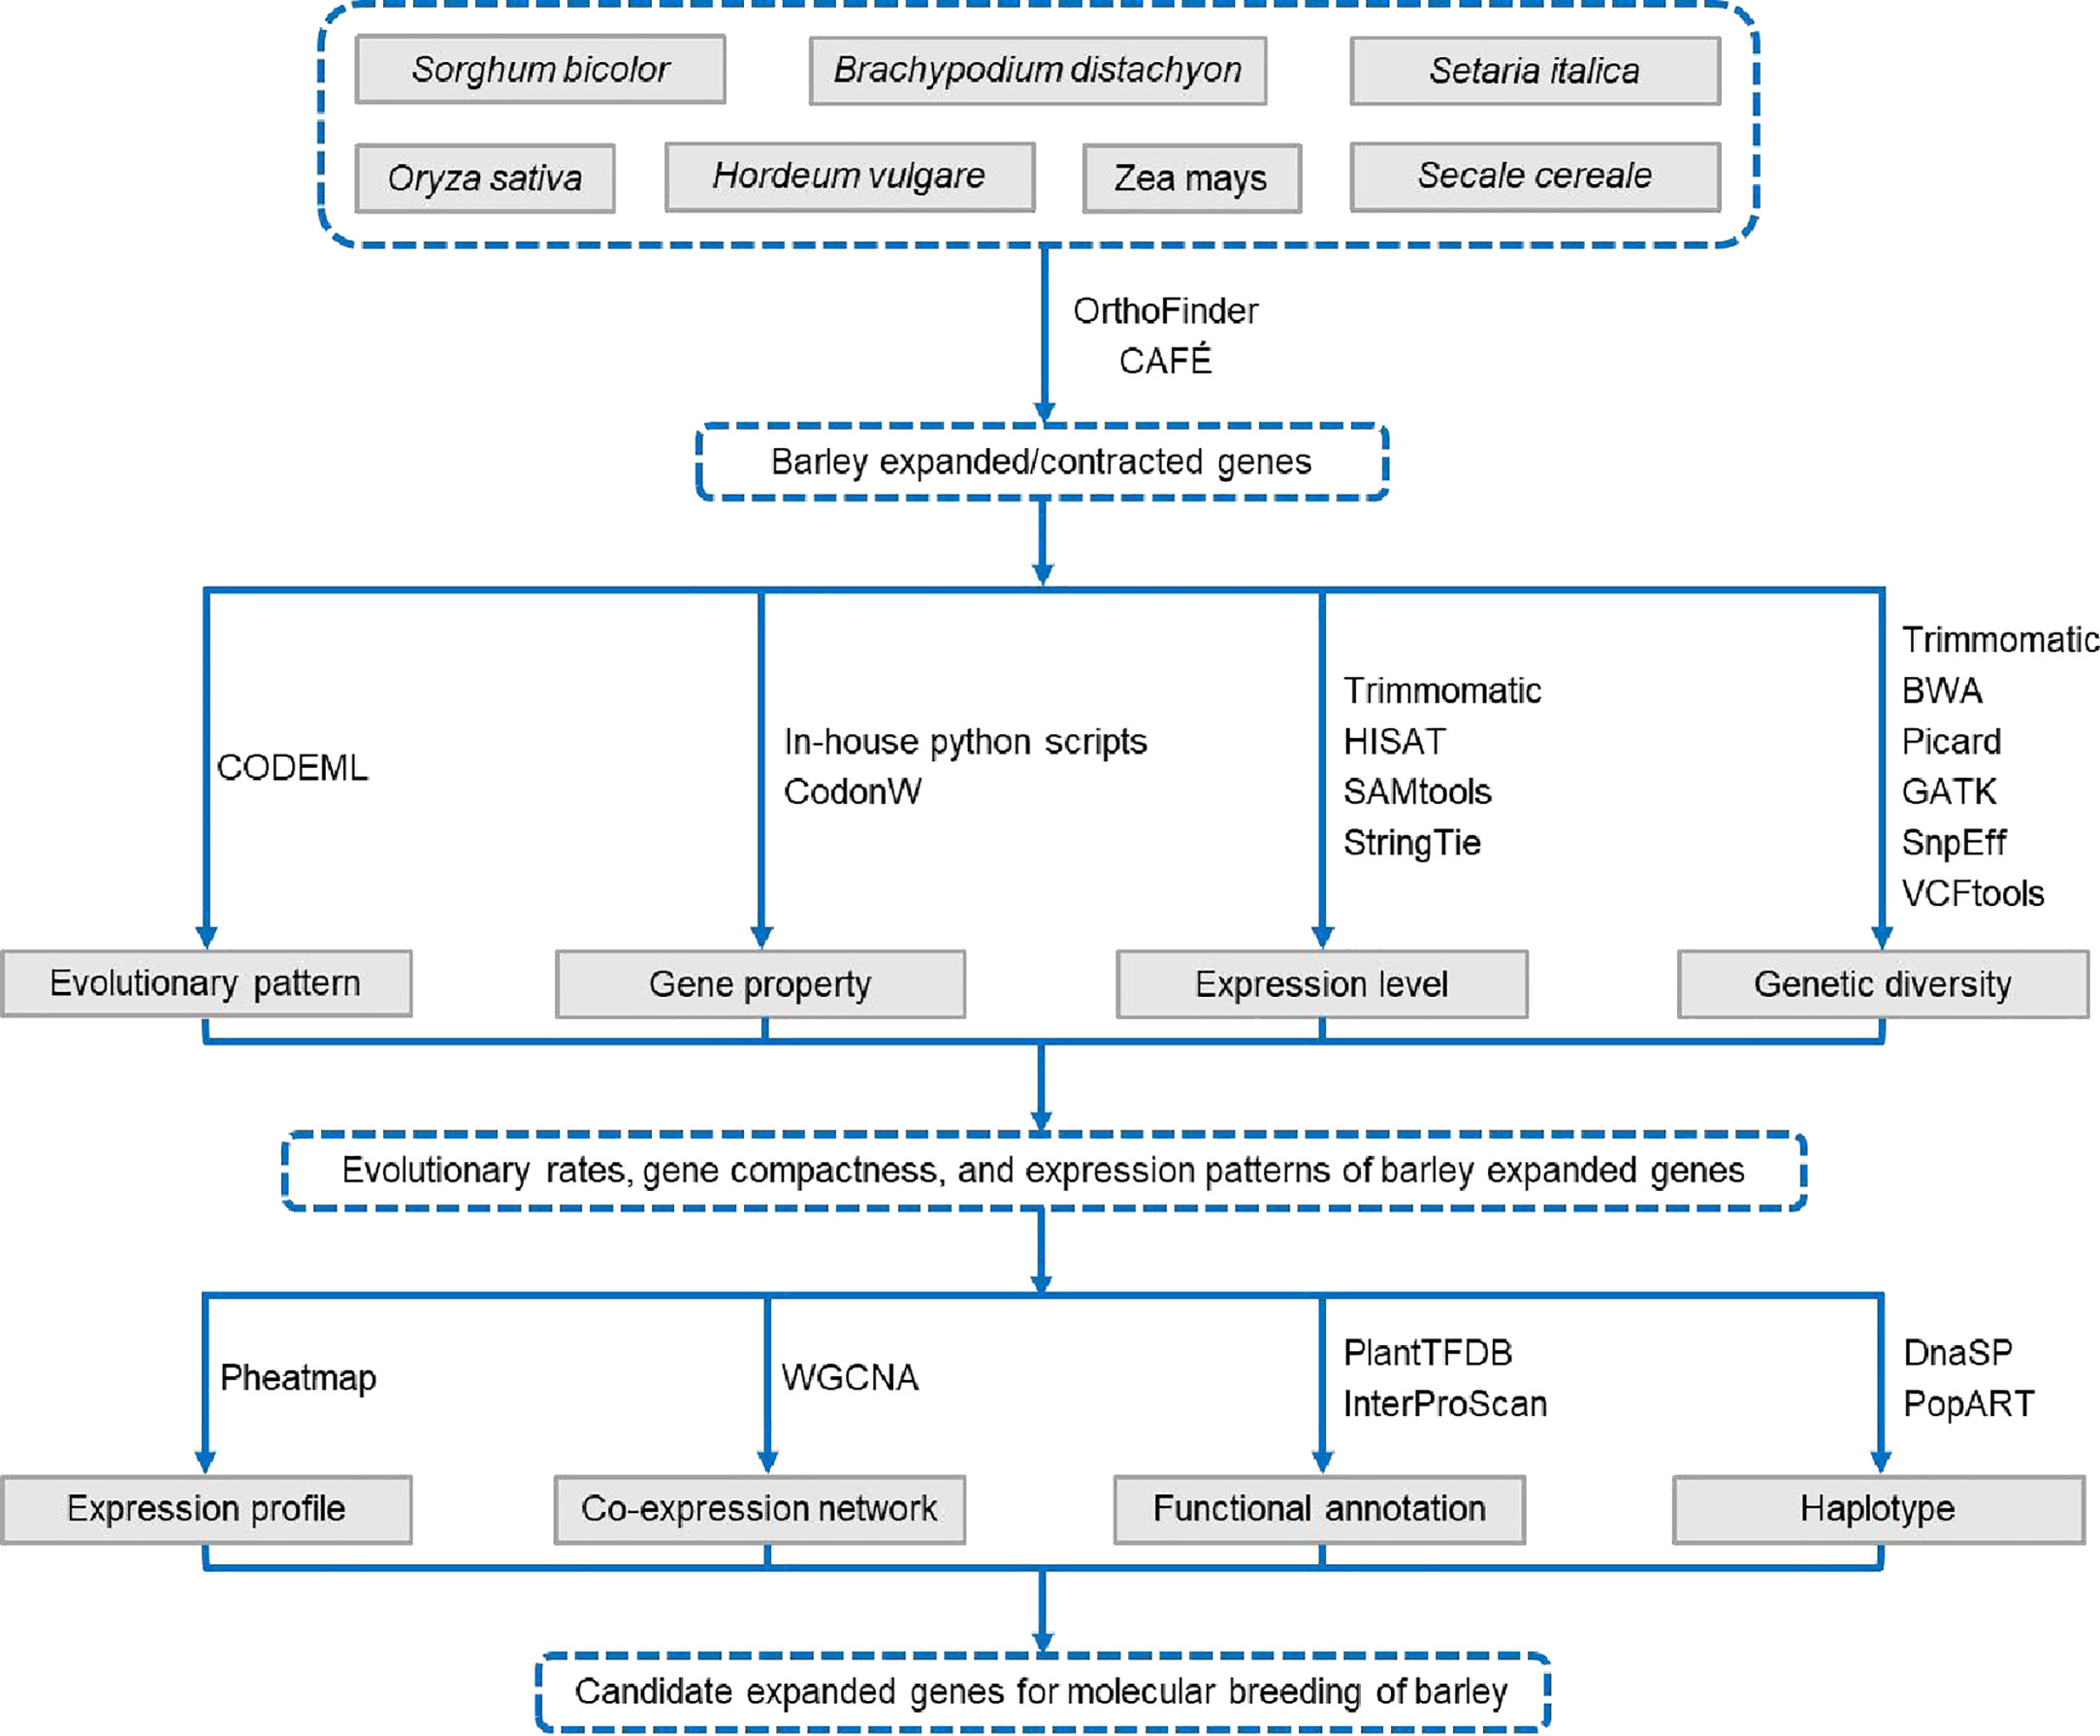
Figure 1 Workflow diagram.
A total of 217,329 proteins from seven related genomes were clustered into 27,438 orthogroups (Supplementary Tables S3, S4). The protein-coding genes of barley were assigned to 19,768 orthogroups with an average of 1.73 genes per group, and 398 orthogroups were unique to barley (Supplementary Table S4). A phylogenetic tree was constructed using 5,635 single-copy orthologous genes from these seven species (Figure 2A). The fossil-calibrated phylogenetic tree revealed that barley was phylogenetically closely related to rye (10.90 Mya) and B. distachyon (25.79 Mya), and rice, an outgroup taxon, was phylogenetically distant from the other six species. Moreover, maize, sorghum, and foxtail millet were clustered into one clade, which was consistent with the results of a previous study (Li G. et al., 2021). Gene family expansion/contraction analysis revealed 214 expanded, 131 contracted, and 17,546 non-expanded orthogroups in barley (Figure 2B). We ultimately identified 3,496 expanded genes and 21,537 non-expanded genes in barley.
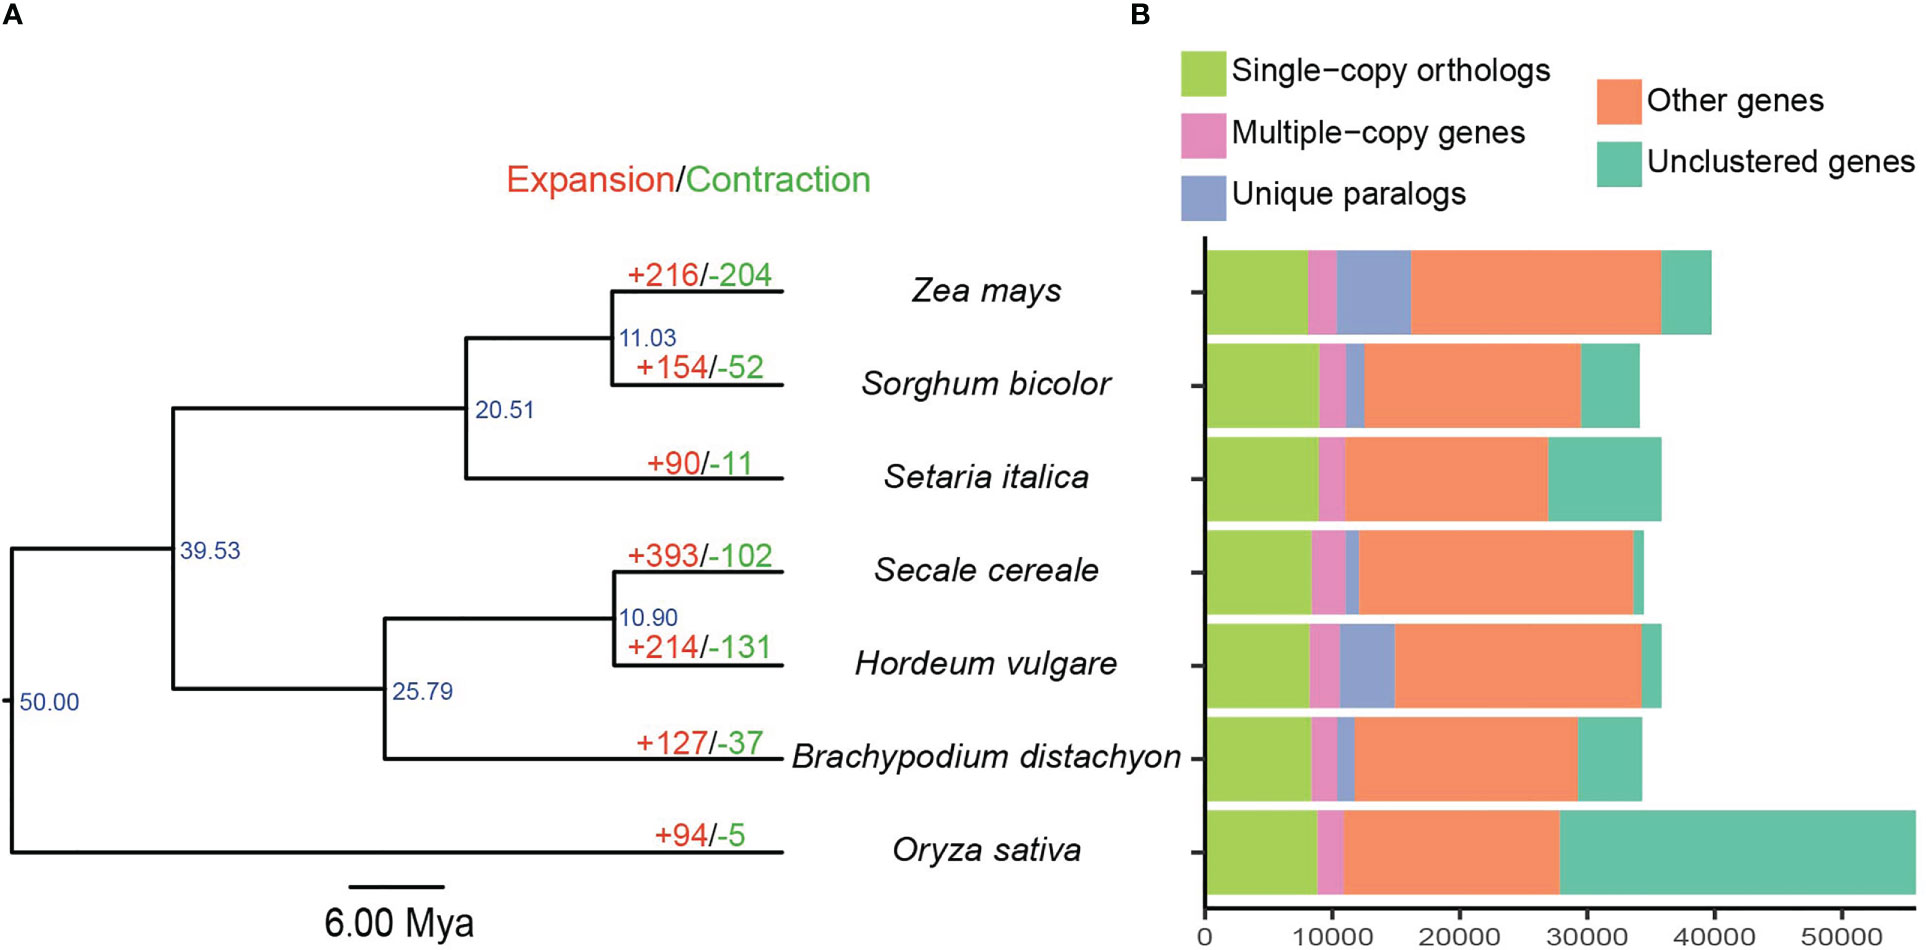
Figure 2 Gene clustering and species phylogenetic analysis. (A) Phylogenetic tree, divergence time, and gene family expansions/contractions among seven Poaceae species. Scale bar corresponds to 6 Mya. (B) Distribution of homologous genes.
Syntenic analysis was performed to elucidate the possible origin of the expanded genes. A total of 2,428 (69.45%), 295 (8.44%), 191 (5.46%), and 53 (1.52%) expanded genes were involved in dispersed, segmental, proximal, and tandem duplication, respectively. The remaining 529 expanded genes were identified as non-duplicated singletons (Supplementary Table S5). This phenomenon demonstrated that dispersed duplication contributed significantly to gene expansion in barley. TEs are repetitive mobile sequences scattered throughout the plant genome and have potential impact on the coding region (Schnable et al., 2009; Santana et al., 2012). Our results showed that 1,369 expanded genes were overlaped with 2,338 TEs, suggesting that these genes might be attributed to TE-mediated duplication (Supplementary Table S6).
To provide more comprehensive insights into the selection pressures on and the evolutionary fate of barley genes, we calculated Ka, Ks, and Ka/Ks values in rye and B. distachyon backgrounds. The Ka/Ks ratio in the rye background ranged from 0.0010 to 2.1117 with an average of 0.2237, and the average Ka and Ks values were 0.0769 (range, 0–1.3675) and 0.3825 (range, 0.0116–1.9887), respectively (Figures 3A–C and Supplementary Table S7). Similar results were observed between barley and B. distachyon (Supplementary Figures S1A–C and Supplementary Table S7).
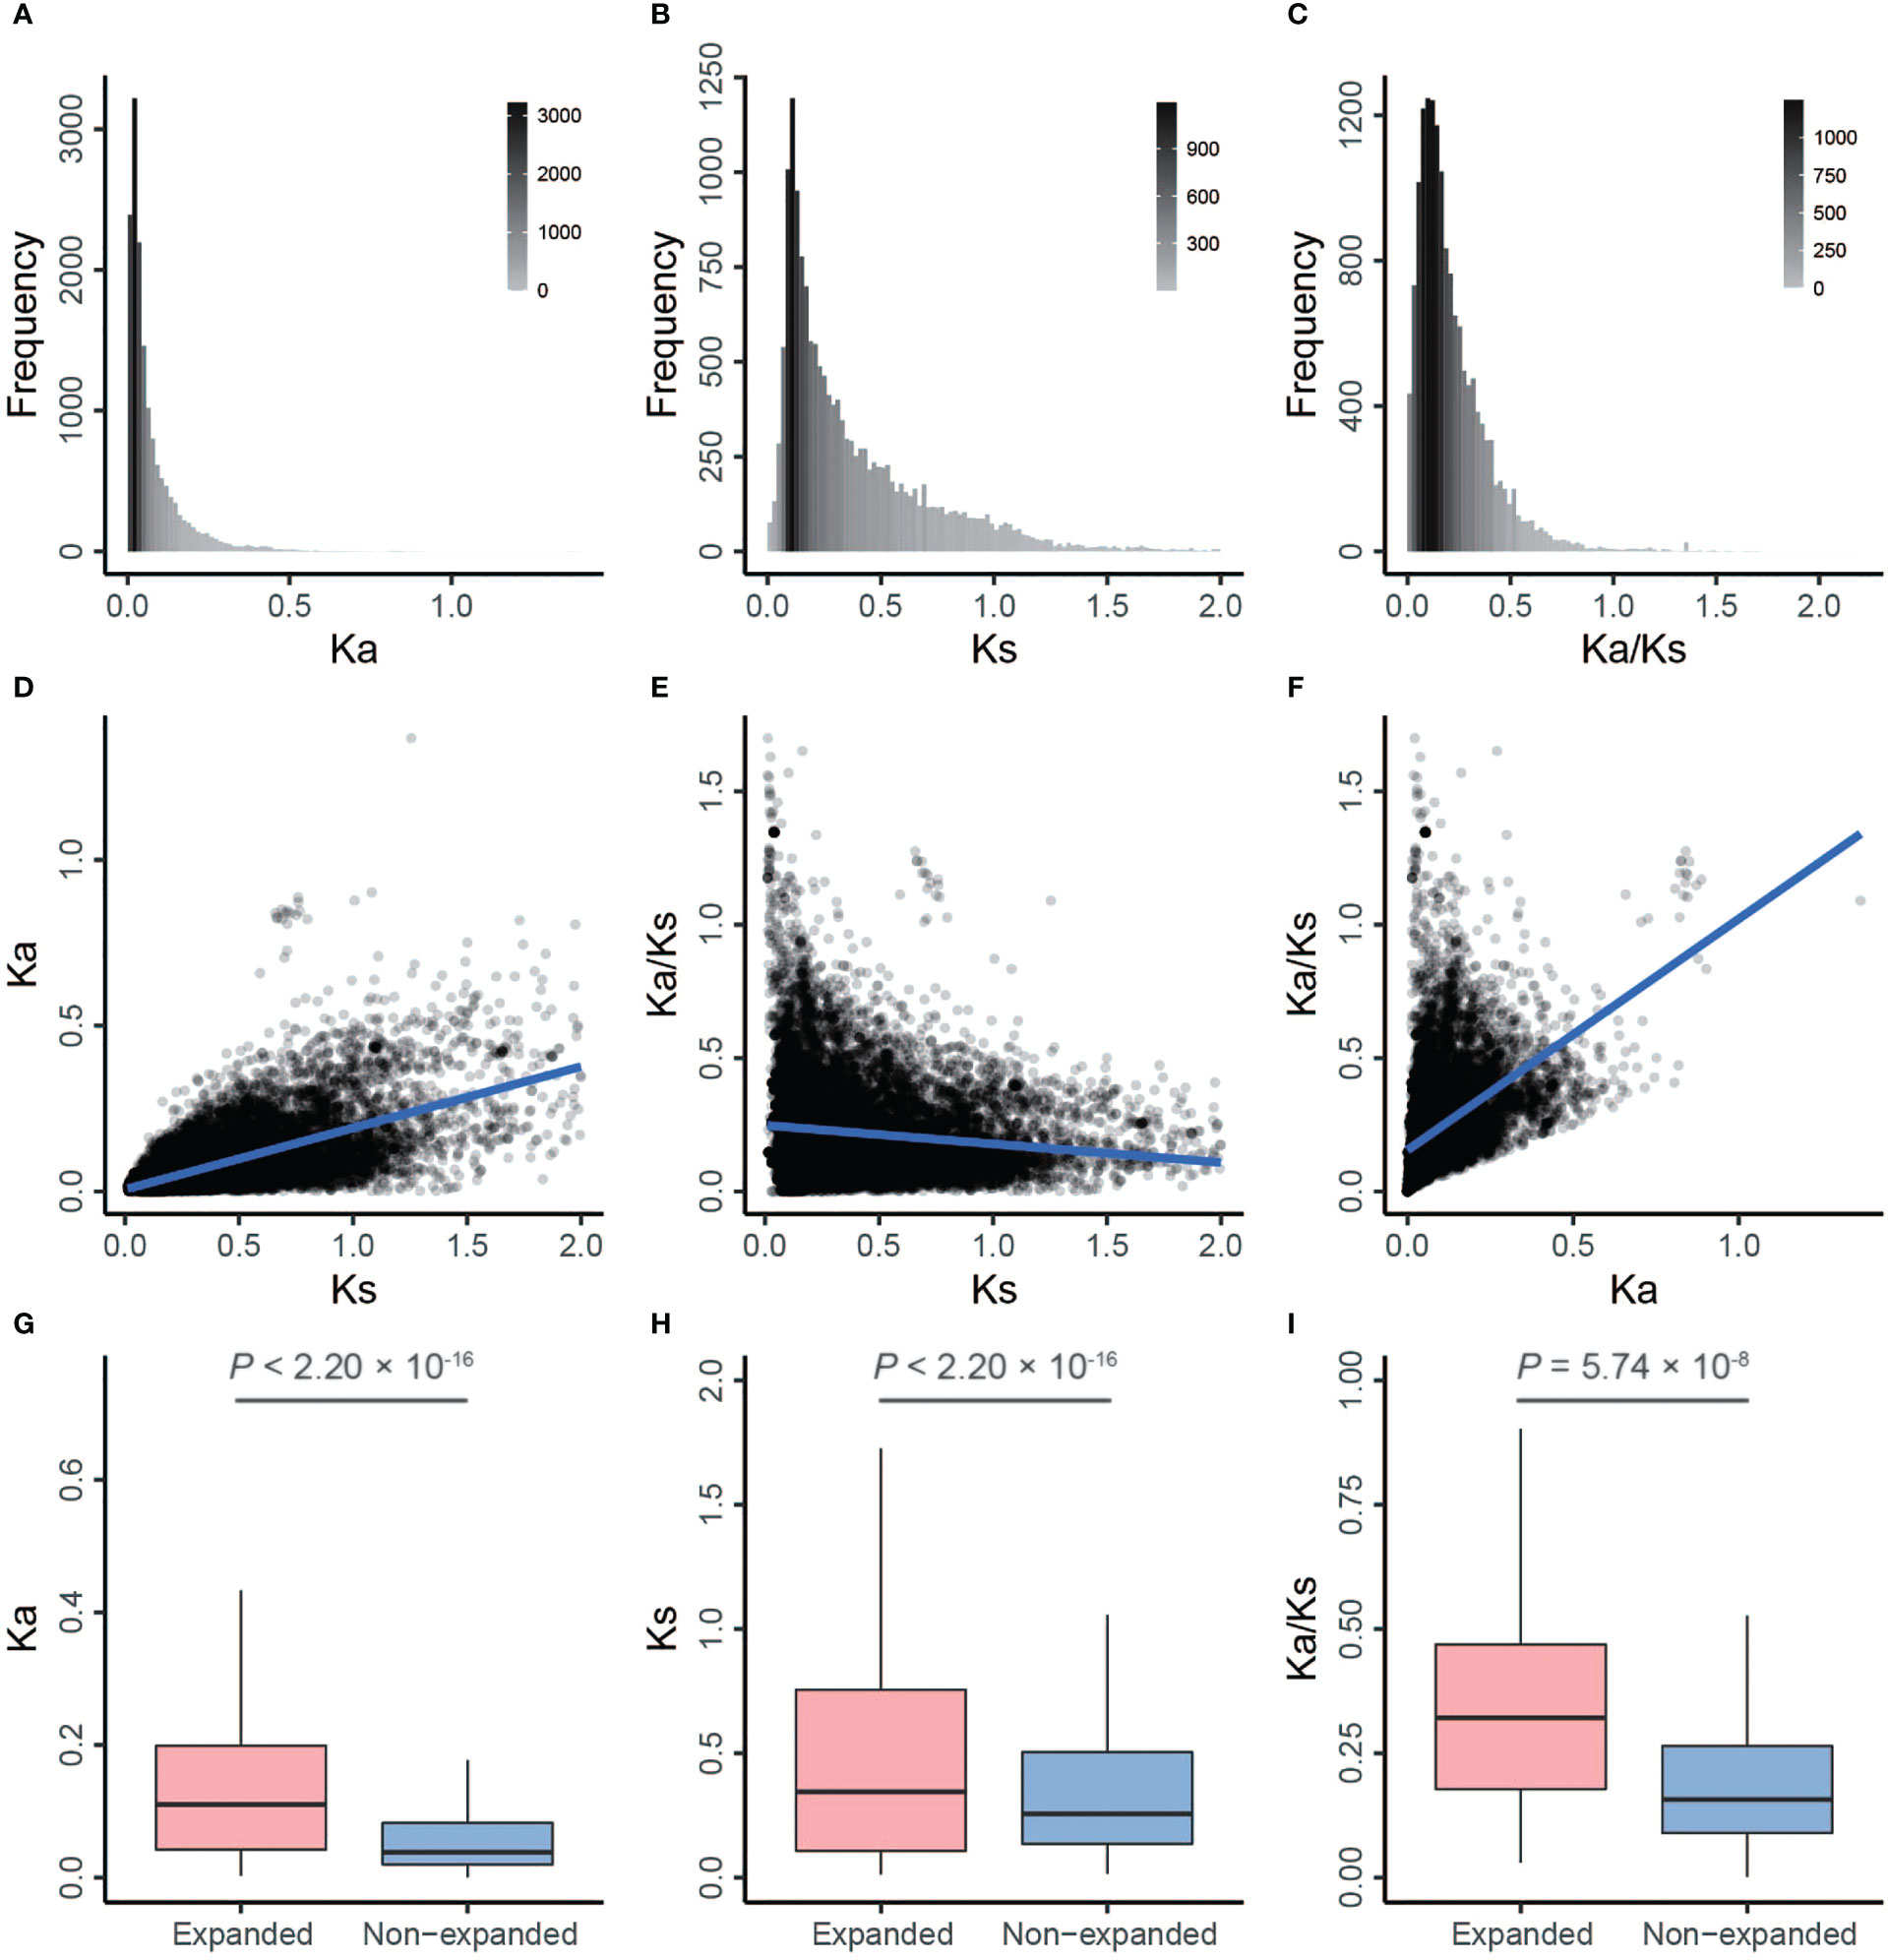
Figure 3 Distributions and correlation analysis of Ka, Ks, and Ka/Ks by comparing barley with rye. (A–C) The frequency distribution of Ka, Ks, and Ka/Ks, respectively. (D) The correlation between Ks (x-axis) and Ka. (E) The correlation between Ks (x-axis) and Ka/Ks. (F) The correlation between Ka (x-axis) and Ka/Ks. (G–I) The box plots of Ka, Ks, and Ka/Ks between expanded and non-expanded genes, respectively. The line in the box is the median value, and the lines at the bottom and top of each box are the first (lower) and third (higher) quartiles.
We performed two-sided Spearman’s rank correlation tests to detect correlations between these substitution rates. Ka and Ks values were positively correlated (barley vs. rye: ρ = 0.67, p < 2.20 × 10⁻¹⁶; barley vs. B. distachyon: ρ = 0.53, p < 2.20 × 10⁻¹⁶; Figures 3D, 4; Supplementary Figures S1D, S2; Supplementary Tables S8, S9), which was consistent with previous studies of Pyrus (ρ = 0.75) (Cao et al., 2019), soybean (ρ = 0.22) (Du et al., 2012), and A. thaliana (ρ = 0.21) (Yang and Gaut, 2011). Additionally, the Ka/Ks values were positively correlated with Ka values and negatively correlated with Ks values (Figures 3E, F, 4; Supplementary Figures S1E, F, S2; Supplementary Tables S8 and S9).
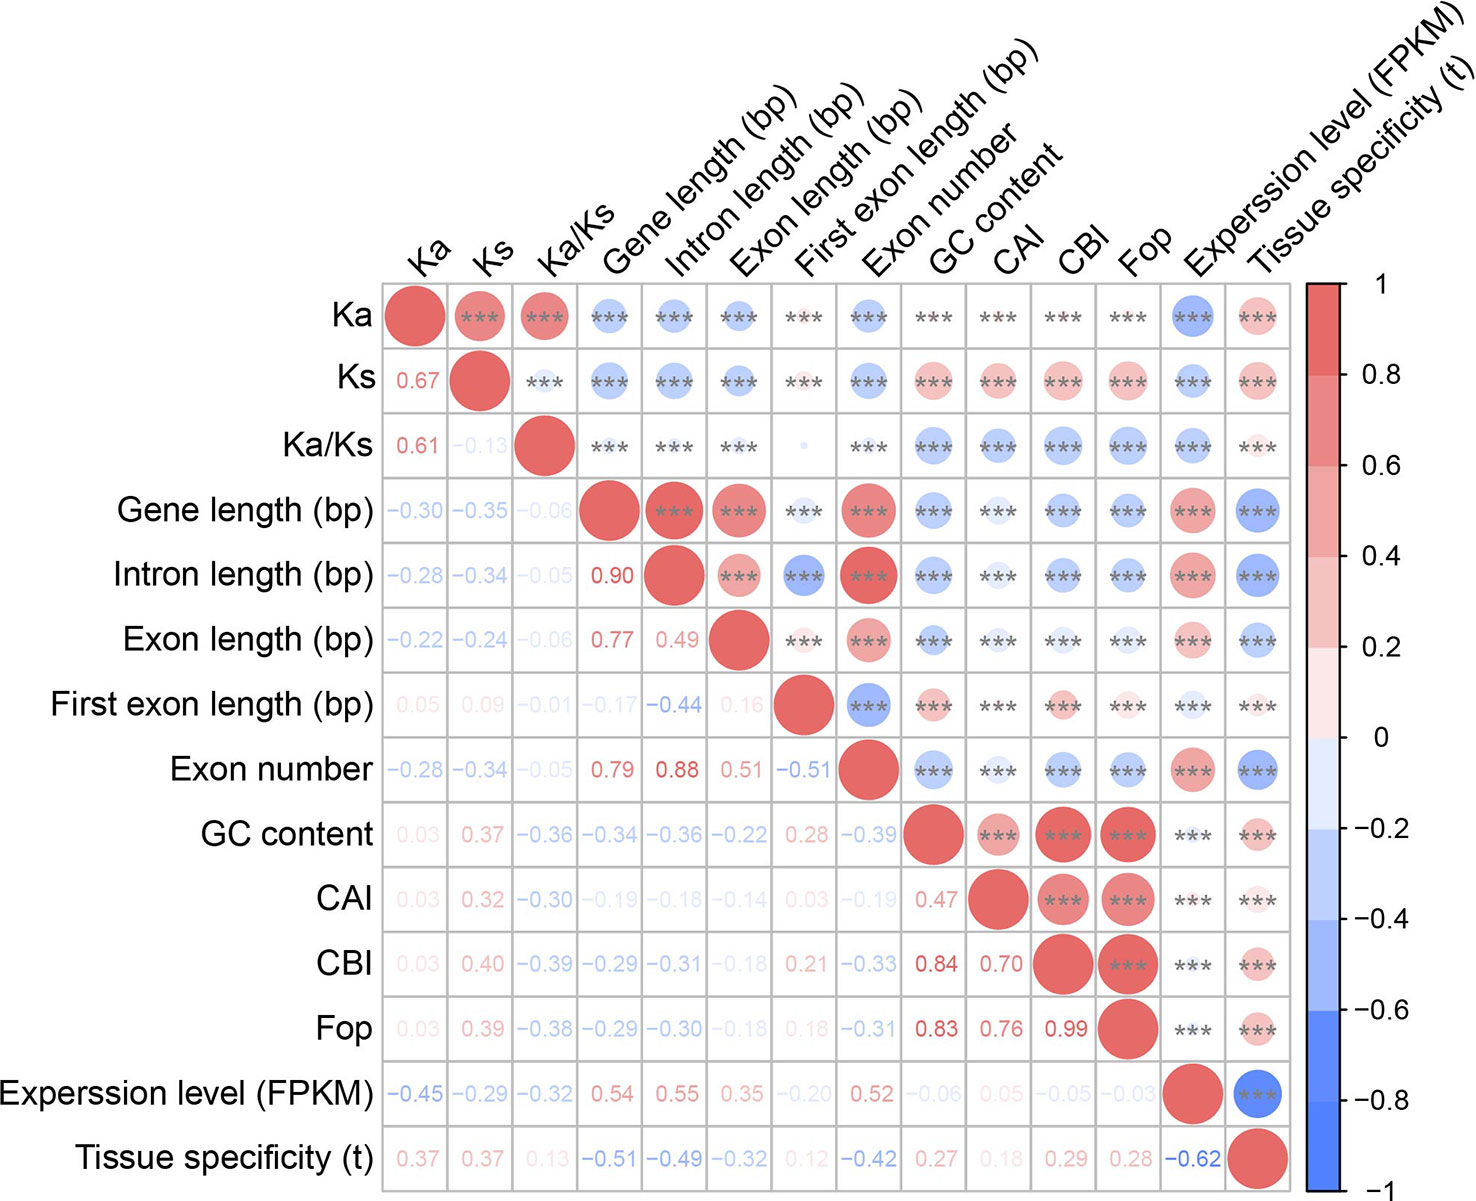
Figure 4 Correlations among substitution rates, gene features, codon usage bias, and expression patterns. The Ka, Ks, and Ka/Ks values were calculated between barley and rye. Upper right: the size of the circle represents the magnitude of the correlation coefficient, red indicates positive correlation, and blue indicates negative correlation. Three asterisks (***) indicate 0.001 significant difference level. Bottom left: correlation coefficients are presented as two-sided Spearman’s rank correlation test ρ.
In general, Ka/Ks > 1, Ka/Ks < 1, and Ka/Ks = 1 indicate that proteins have experienced positive, negative (also known as purifying), and neutral selection (Hurst, 2002). Positive and negative selections are denoted as the fixation of adaptive mutations and loss of deleterious mutations, respectively (Echave et al., 2016). The average values of Ka and Ks were significantly higher for expanded genes than for non-expanded genes, but Ka/Ks was significantly higher for expanded genes than for non-expanded genes (one-sided Mann–Whitney U test, p < 0.01; Figures 3G–I; Supplementary Figures S1G–I and Supplementary Table S7). This suggests that expanded genes have evolved more rapidly and have experienced lower negative selection. In addition, a total of 102 (2.92%) positively selected and 1,917 (54.83%) negatively selected expanded genes were identified (Supplementary Table S10).
To determine whether gene family size affects the divergence of evolutionary rates between expanded and non-expanded genes, we classified the orthologous genes into four groups: single copy, 2–4 copies, 5–19 copies, and more than 20 copies. For single-copy orthologs, evolutionary rates of non-expanded genes were lower, and they have experienced stronger selection, indicating that they are functionally conserved (Supplementary Figures S3, S4 and Supplementary Table S11). For multiple-copy orthologs (e.g., 2–4 and 5–19 copies), the average Ka and Ka/Ks of expanded genes were higher than those of non-expanded genes, and the opposite pattern was observed for Ks values (Supplementary Figures S3, S4 and Supplementary Table S11). These findings demonstrate that the strength of selection on expanded genes decreases with gene family size.
The Ka, Ks, and Ka/Ks values of the expanded genes on the distal chromosome arm were higher than those of the expanded genes in the pericentromeric region (Figures 5A–C; Supplementary Figures S5A–C). The distribution of substitution rates and selection pressures on chromosomes was relatively undifferentiated for non-expanded genes (Figures 5D–F; Supplementary Figures S5D–F). One possible explanation is that gene duplications tended to occur on the distal chromosomal arms, and the recombination rate increased from the centromeric region to the chromosomal arm, which induced mutations in expanded genes (Gaut et al., 2007; Du et al., 2012; International Barley Genome Sequencing et al., 2012).
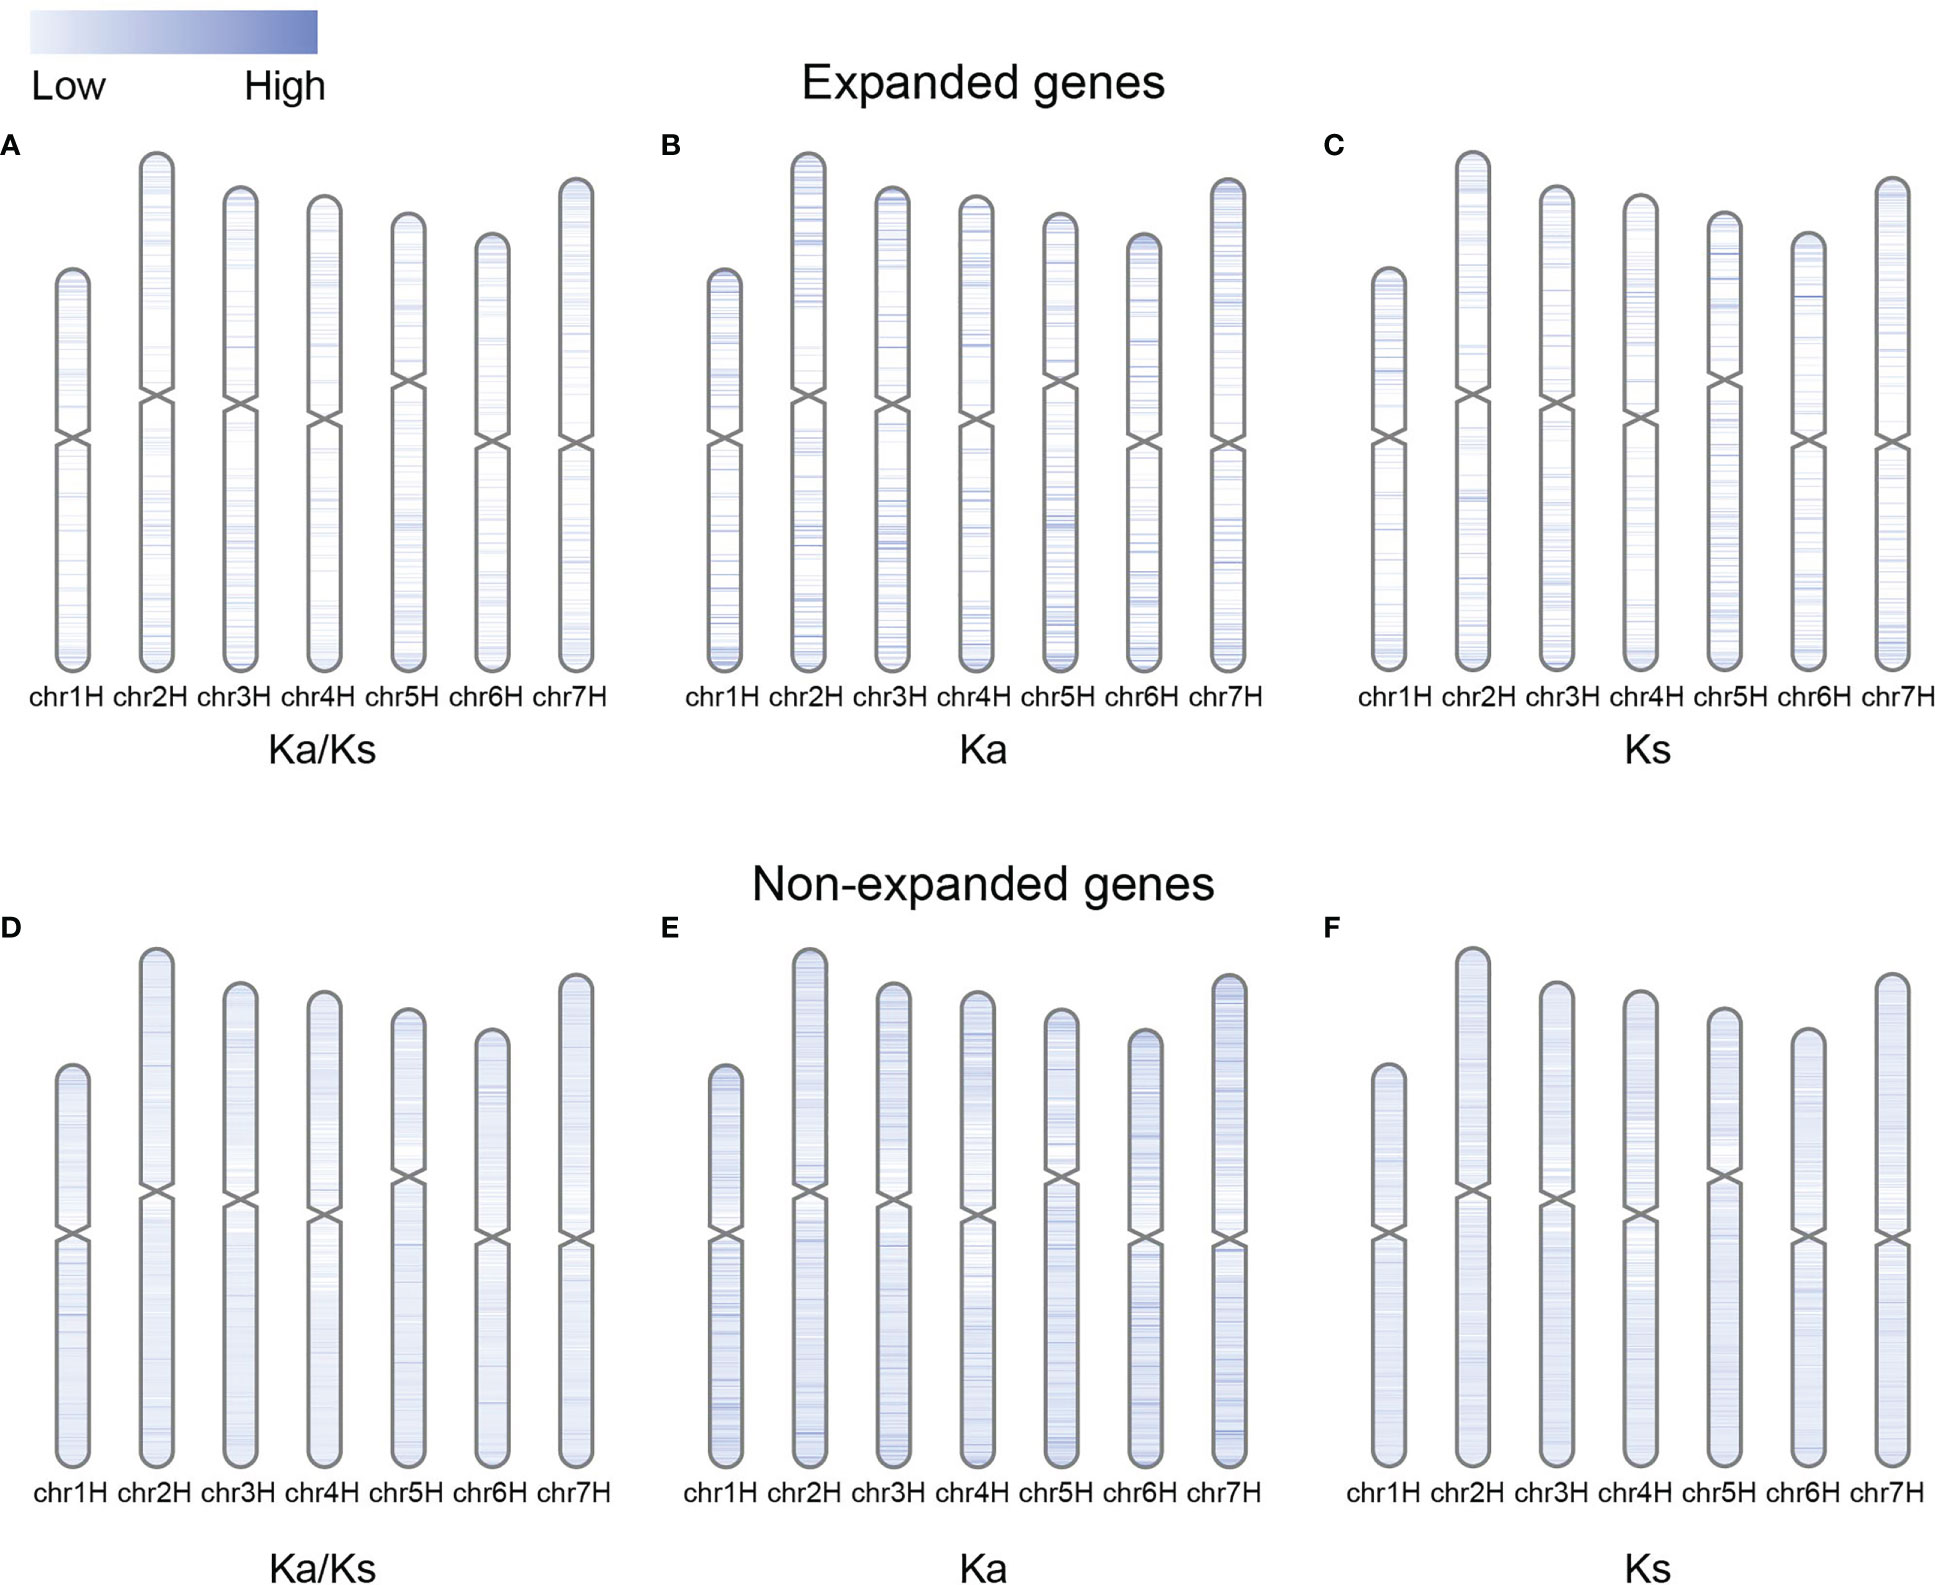
Figure 5 Distributions of Ka/Ks, Ka, and Ks values for expanded and non-expanded genes alongside the chromosome by comparing barley with rye. (A–C) Ka/Ks, Ka, and Ks values for expanded genes. (D–F) Ka/Ks, Ka, and Ks values for non-expanded genes.
To investigate how selection shapes gene structure, we compared the features of expanded and non-expanded genes. Expanded genes, including their exons and introns, were significantly shorter than non-expanded genes; however, their first exons were longer (genes: 1,415.26 vs. 4,229.32 bp; exons: 939.75 vs. 1662.06 bp; introns: 414.83 vs. 2567.26 bp; and first exons: 636.09 vs. 581.79 bp). Expanded genes also had fewer exons than non-expanded genes, and their GC content was lower (1.89 vs. 5.51 and 0.4805 vs. 0.5792, respectively) (one-sided Mann–Whitney U test, p-value < 0.001; Figures 6A–F and Supplementary Table S12). Single-copy genes had the longest genes, exons, and introns, suggesting that the size of the genes progressively shortened as the copy number of family members increased (Supplementary Figures S6A–C and Supplementary Table S11).
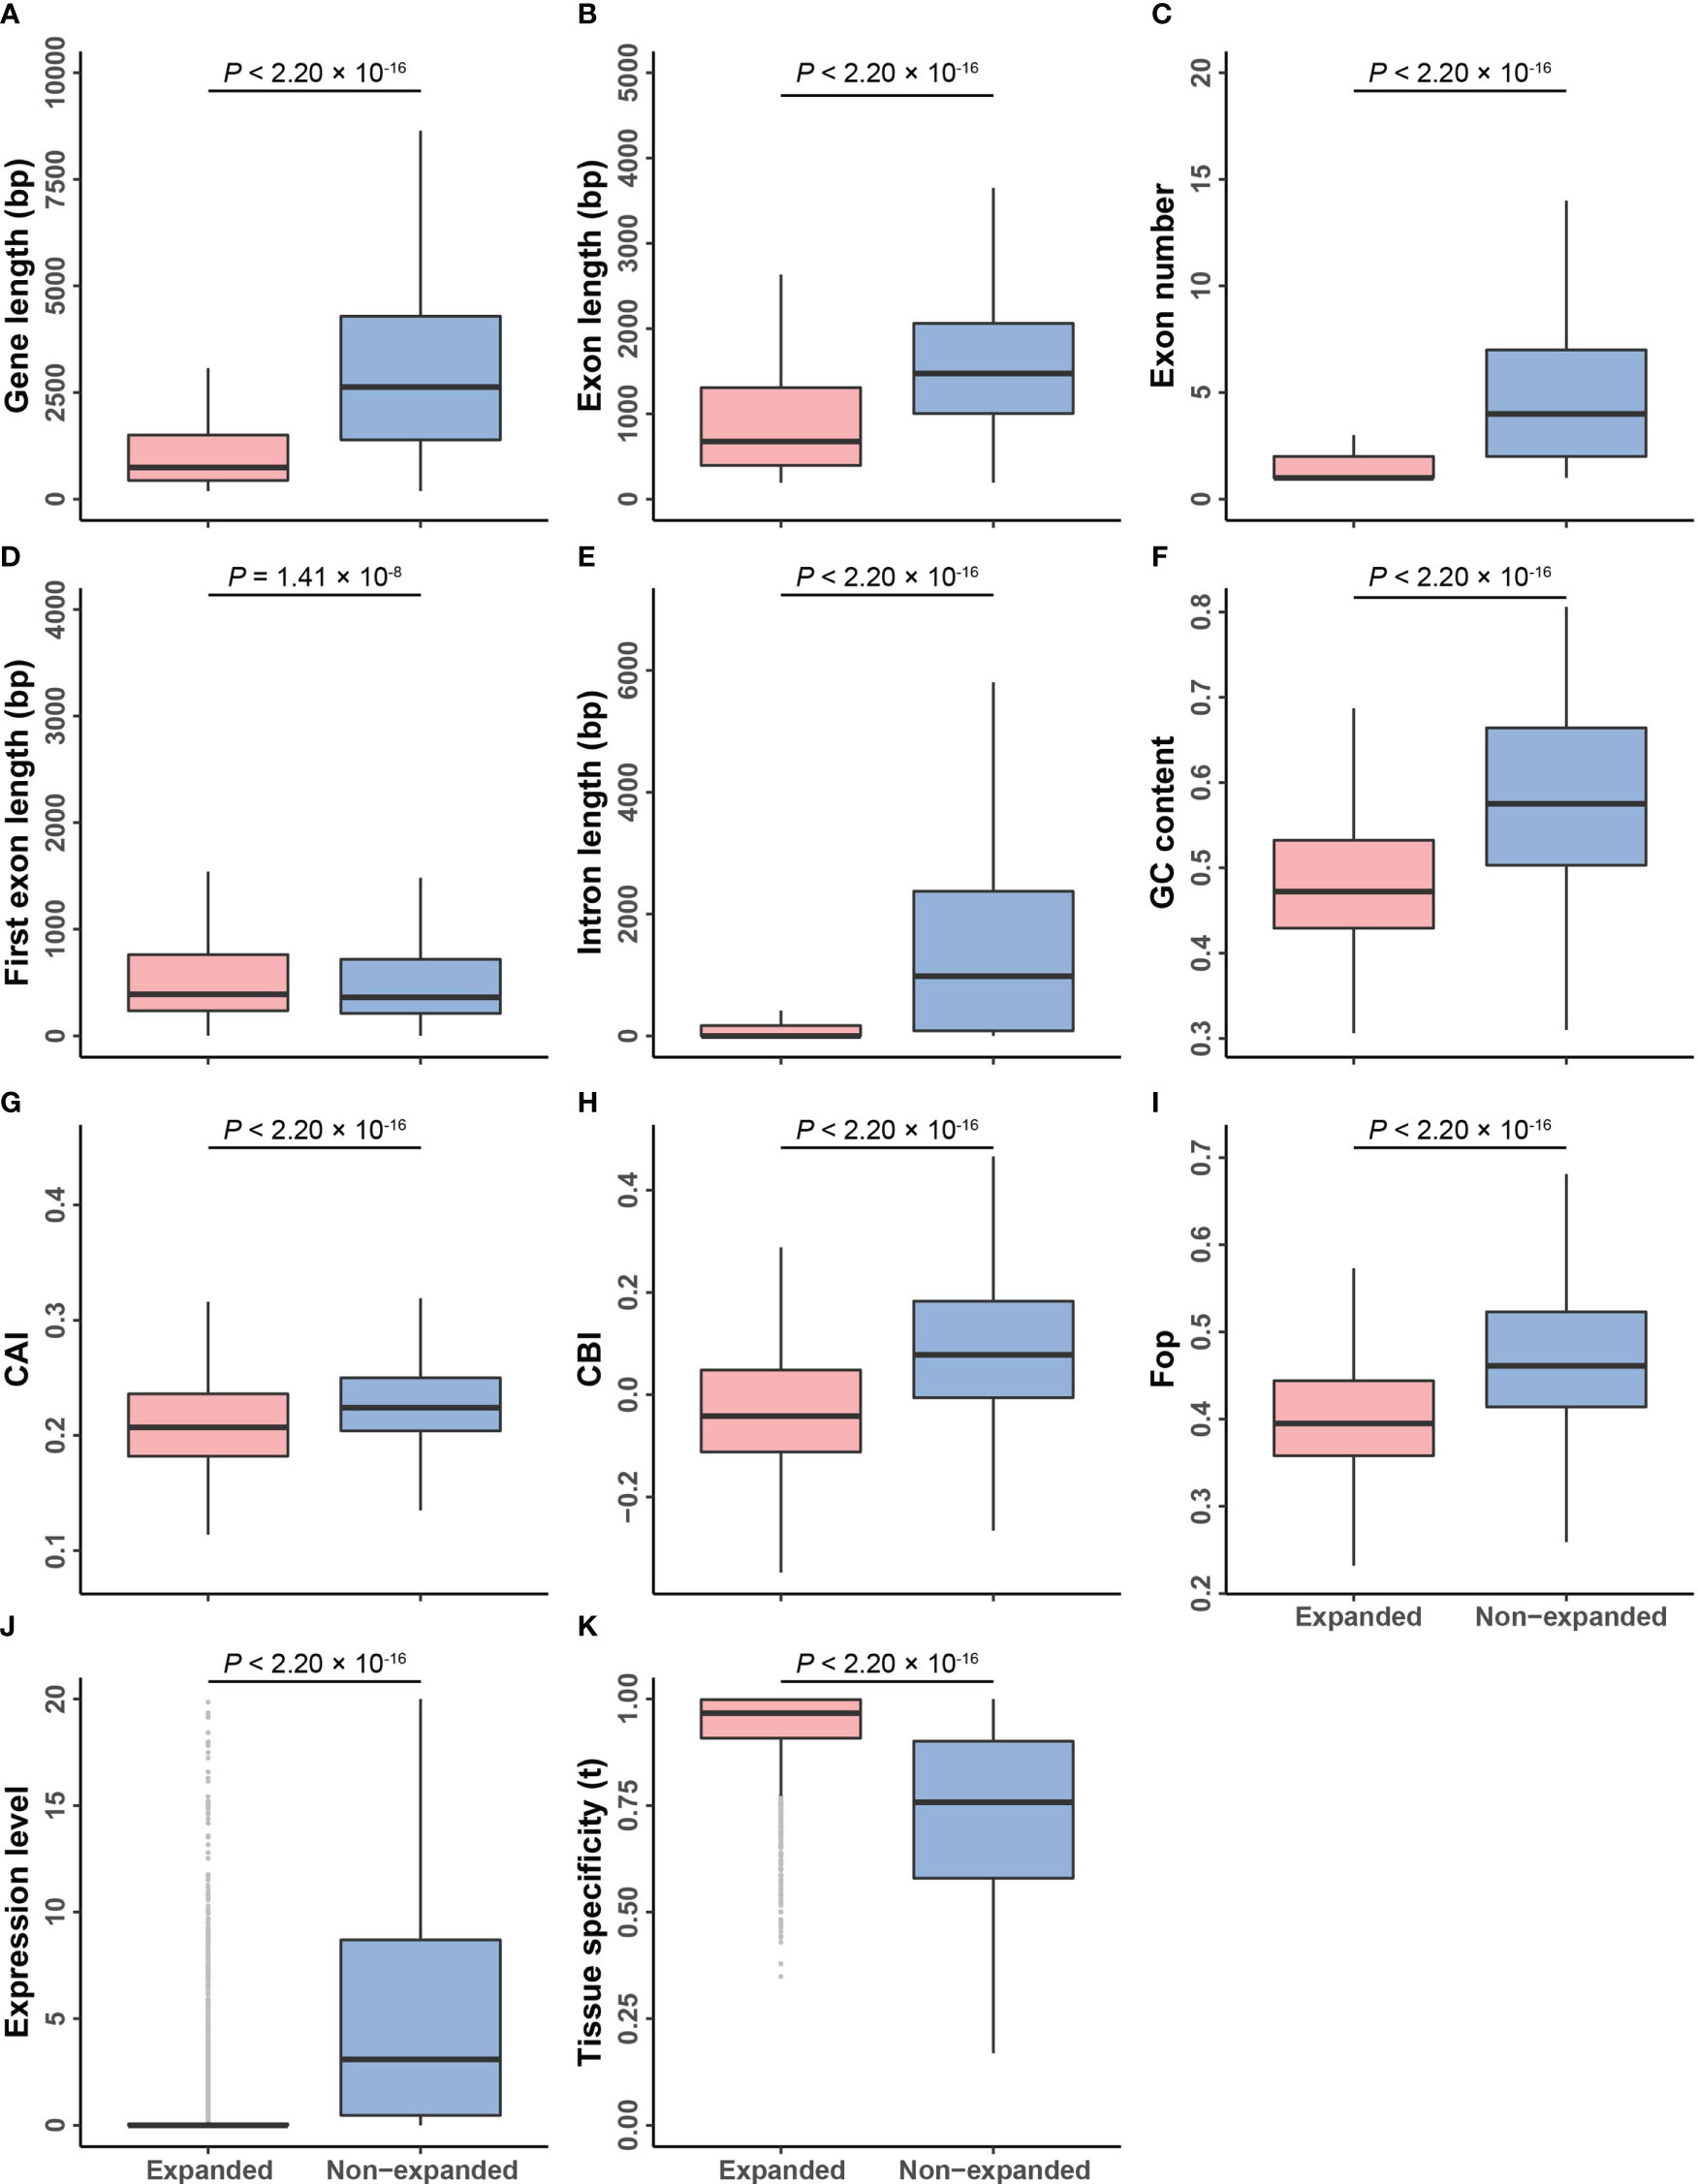
Figure 6 Comparisons of genomic features between expanded and non-expanded genes. (A–K) The box plots of gene length, exon length, exon number, first exon length, intron length, GC content, CAI, CBI, Fop, expression level, and tissue specificity between expanded and non-expanded genes. The line in the box is the median value, and the lines at the bottom and top of each box are the first (lower) and third (higher) quartiles.
Next, we performed a correlation analysis between evolutionary rate and gene properties. Both Ka and Ks values were significantly negatively correlated with gene and exon and intron lengths but positively correlated with the first exon length and GC content, indicating that the evolutionary rate might affect the structure of genes in barley (two-sided Spearman’s rank correlation test, p-value < 0.05, Figure 4; Supplementary Figure S2; Supplementary Tables S8, S9). However, there was no strong correlation between Ka/Ks values and gene properties.
The expression levels of expanded genes were lower than those of non-expanded genes (2.19 vs. 17.20; one-sided Mann–Whitney U test, p-value < 2.20 × 10⁻¹⁶; Figure 6J and Supplementary Table S12). Expression pattern analysis showed that 0.74% of the expanded genes were highly expressed (FPKM ≥ 50), but 92.51% of them were weakly expressed (FPKM ≤ 3) (Supplementary Table S13). In contrast, the expression of 6.52% of non-expanded genes was high, and the expression of 39.33% of these genes was low. These results suggest that the expression patterns of expanded and non-expanded genes have diverged (one-sided Fisher’s exact test, p-value < 2.20 × 10⁻¹⁶).
We analyzed whether the expanded genes showed tissue-specific expression. Categorical and overall tissue-specific genes comprised 9.55% and 90.45% of the expanded genes, respectively (Supplementary Table S13). Categorical tissue-specific genes and overall tissue-specific genes comprised 3.43% and 96.57% of non-expanded genes, respectively. The tissue specificity (τ) of expanded genes was significantly higher than that of non-expanded genes (one-sided Fisher’s exact test, p-value < 2.20 × 10⁻¹⁶, Figure 6K and Supplementary Table S13). Similar to previous studies, we found that gene expression levels decreased as the copy number and tissue specificity of expression increased (Supplementary Figures S6J, K and Supplementary Table S11) (De La Torre et al., 2015).
Furthermore, we examined the correlation between selection pressures and gene expression patterns. There was a significant negative correlation between the Ka/Ks ratio and expression levels (two-sided Spearman’s rank correlation test, ρ = –0.32, p-value < 2.20 × 10⁻¹⁶; Figure 4 and Supplementary Table S8). The Ka/Ks ratio was positively correlated with tissue specificity (two-sided Spearman’s rank correlation test, ρ = 0.13, p-value < 2.20 × 10⁻¹⁶; Figure 4 and Supplementary Table S8).
Due to the degeneracy of the genetic code, most of the amino acids are coded by several synonymous codons. The preferential usage of codons is a phenomenon in which synonymous codons are used more frequently than others, and the usage preference in plant genomes has been shaped by natural selection to mediate adaptation to the environment (Morton, 2003; Behura and Severson, 2013; Li Y. et al., 2021). The CAI, CBI, and Fop for each gene were calculated to determine whether selection pressure, gene structure, and expression patterns affect codon usage bias. The average CAI, CBI, and Fop were all significantly higher for non-expanded genes than for expanded genes (one-sided Mann–Whitney U test, p-value < 2.20 × 10⁻¹⁶; Figures 6G–I and Supplementary Table S12). As copy number increased, these three codon bias indicators for expanded genes gradually decreased; similar results have been obtained in yeast, where codon usage bias was lower for more rapidly evolving genes (Supplementary Figures S6G–I and Supplementary Table S11) (Bu et al., 2011).
Correlation analysis revealed that these three indicators were significantly positively correlated with Ks rather than Ka and negatively correlated with Ka/Ks (one-sided Mann–Whitney U test, p-value < 2.20 × 10⁻¹⁶; Figure 4; Supplementary Figure S2 and Supplementary Tables S8, S9). Additionally, these indicators were negatively correlated with gene length, exon length, number of exons, and intron length but positively correlated with first exon length and the tissue specificity of expression (one-sided Mann–Whitney U test, p-value < 0.001; Figure 4 and Supplementary Table S8).
To characterize the landscape of genetic variation, a total of 215 publicly available resequenced samples of barley were used. We obtained 14,959 and 572,331 SNPs in expanded and non-expanded genes, respectively (Figure 7A and Supplementary Table S14). For expanded genes, the most prominent variants were non-synonymous variants (46.67%), synonymous variants (29.61%), and intron variants (17.86%). In contrast, the dominant variant in non-expanded genes was intron variants (54.52%), followed by synonymous variants (18.08%) and non-synonymous variants (13.90%). These results suggest that a large number of non-synonymous mutants have been retained in expanded genes and that these loci were likely associated with the adaptive evolution of the barley genome.
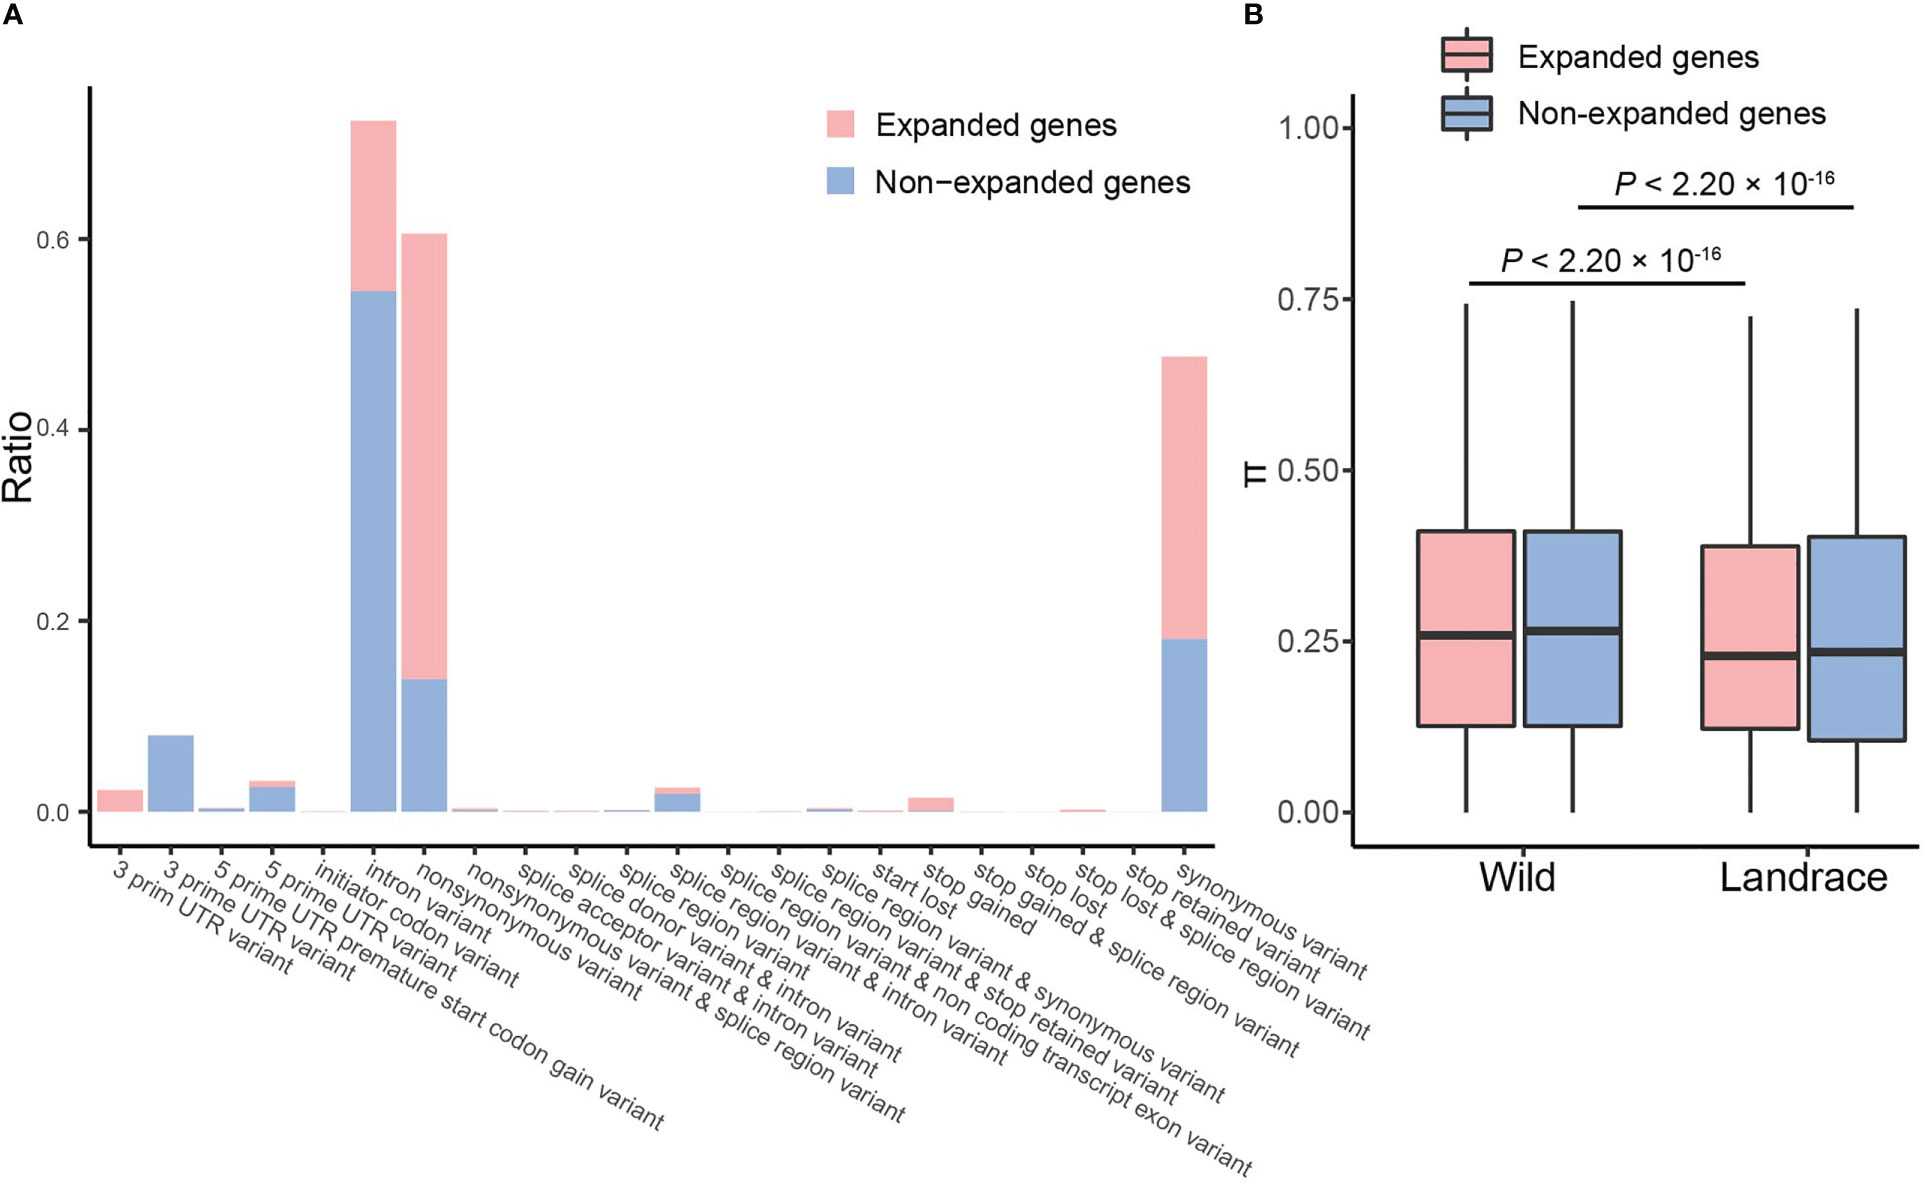
Figure 7 Nucleotide diversity analysis for expanded and non-expanded genes. (A) Frequency distributions of various variants. Pink and blue columns represent expanded and non-expanded genes, respectively. (B) The box plots of nucleotide diversity.
We further elucidated the evolutionary trajectory of expanded and non-expanded genes during barley domestication. In the PCA, the first principal component, which was predominantly correlated with the divergence between wild and landrace barley, explained 6.66% of the total genetic variance in expanded genes. The geographical origins were correlated with the second and third eigenvectors, which explained 3.11% and 2.76% of the variance, respectively (Figures 8A, B and Supplementary Table S15). The phylogenetic tree further supported the observations of the PCA and provided more robust insights into the relationships among accessions (Figure 8C). When the putative number of populations was set to 2, divergence was observed between wild and landrace barley (Figure 8D). No significant difference was observed in population structure according to non-expanded genes (Supplementary Figure S7 and Supplementary Table S15).
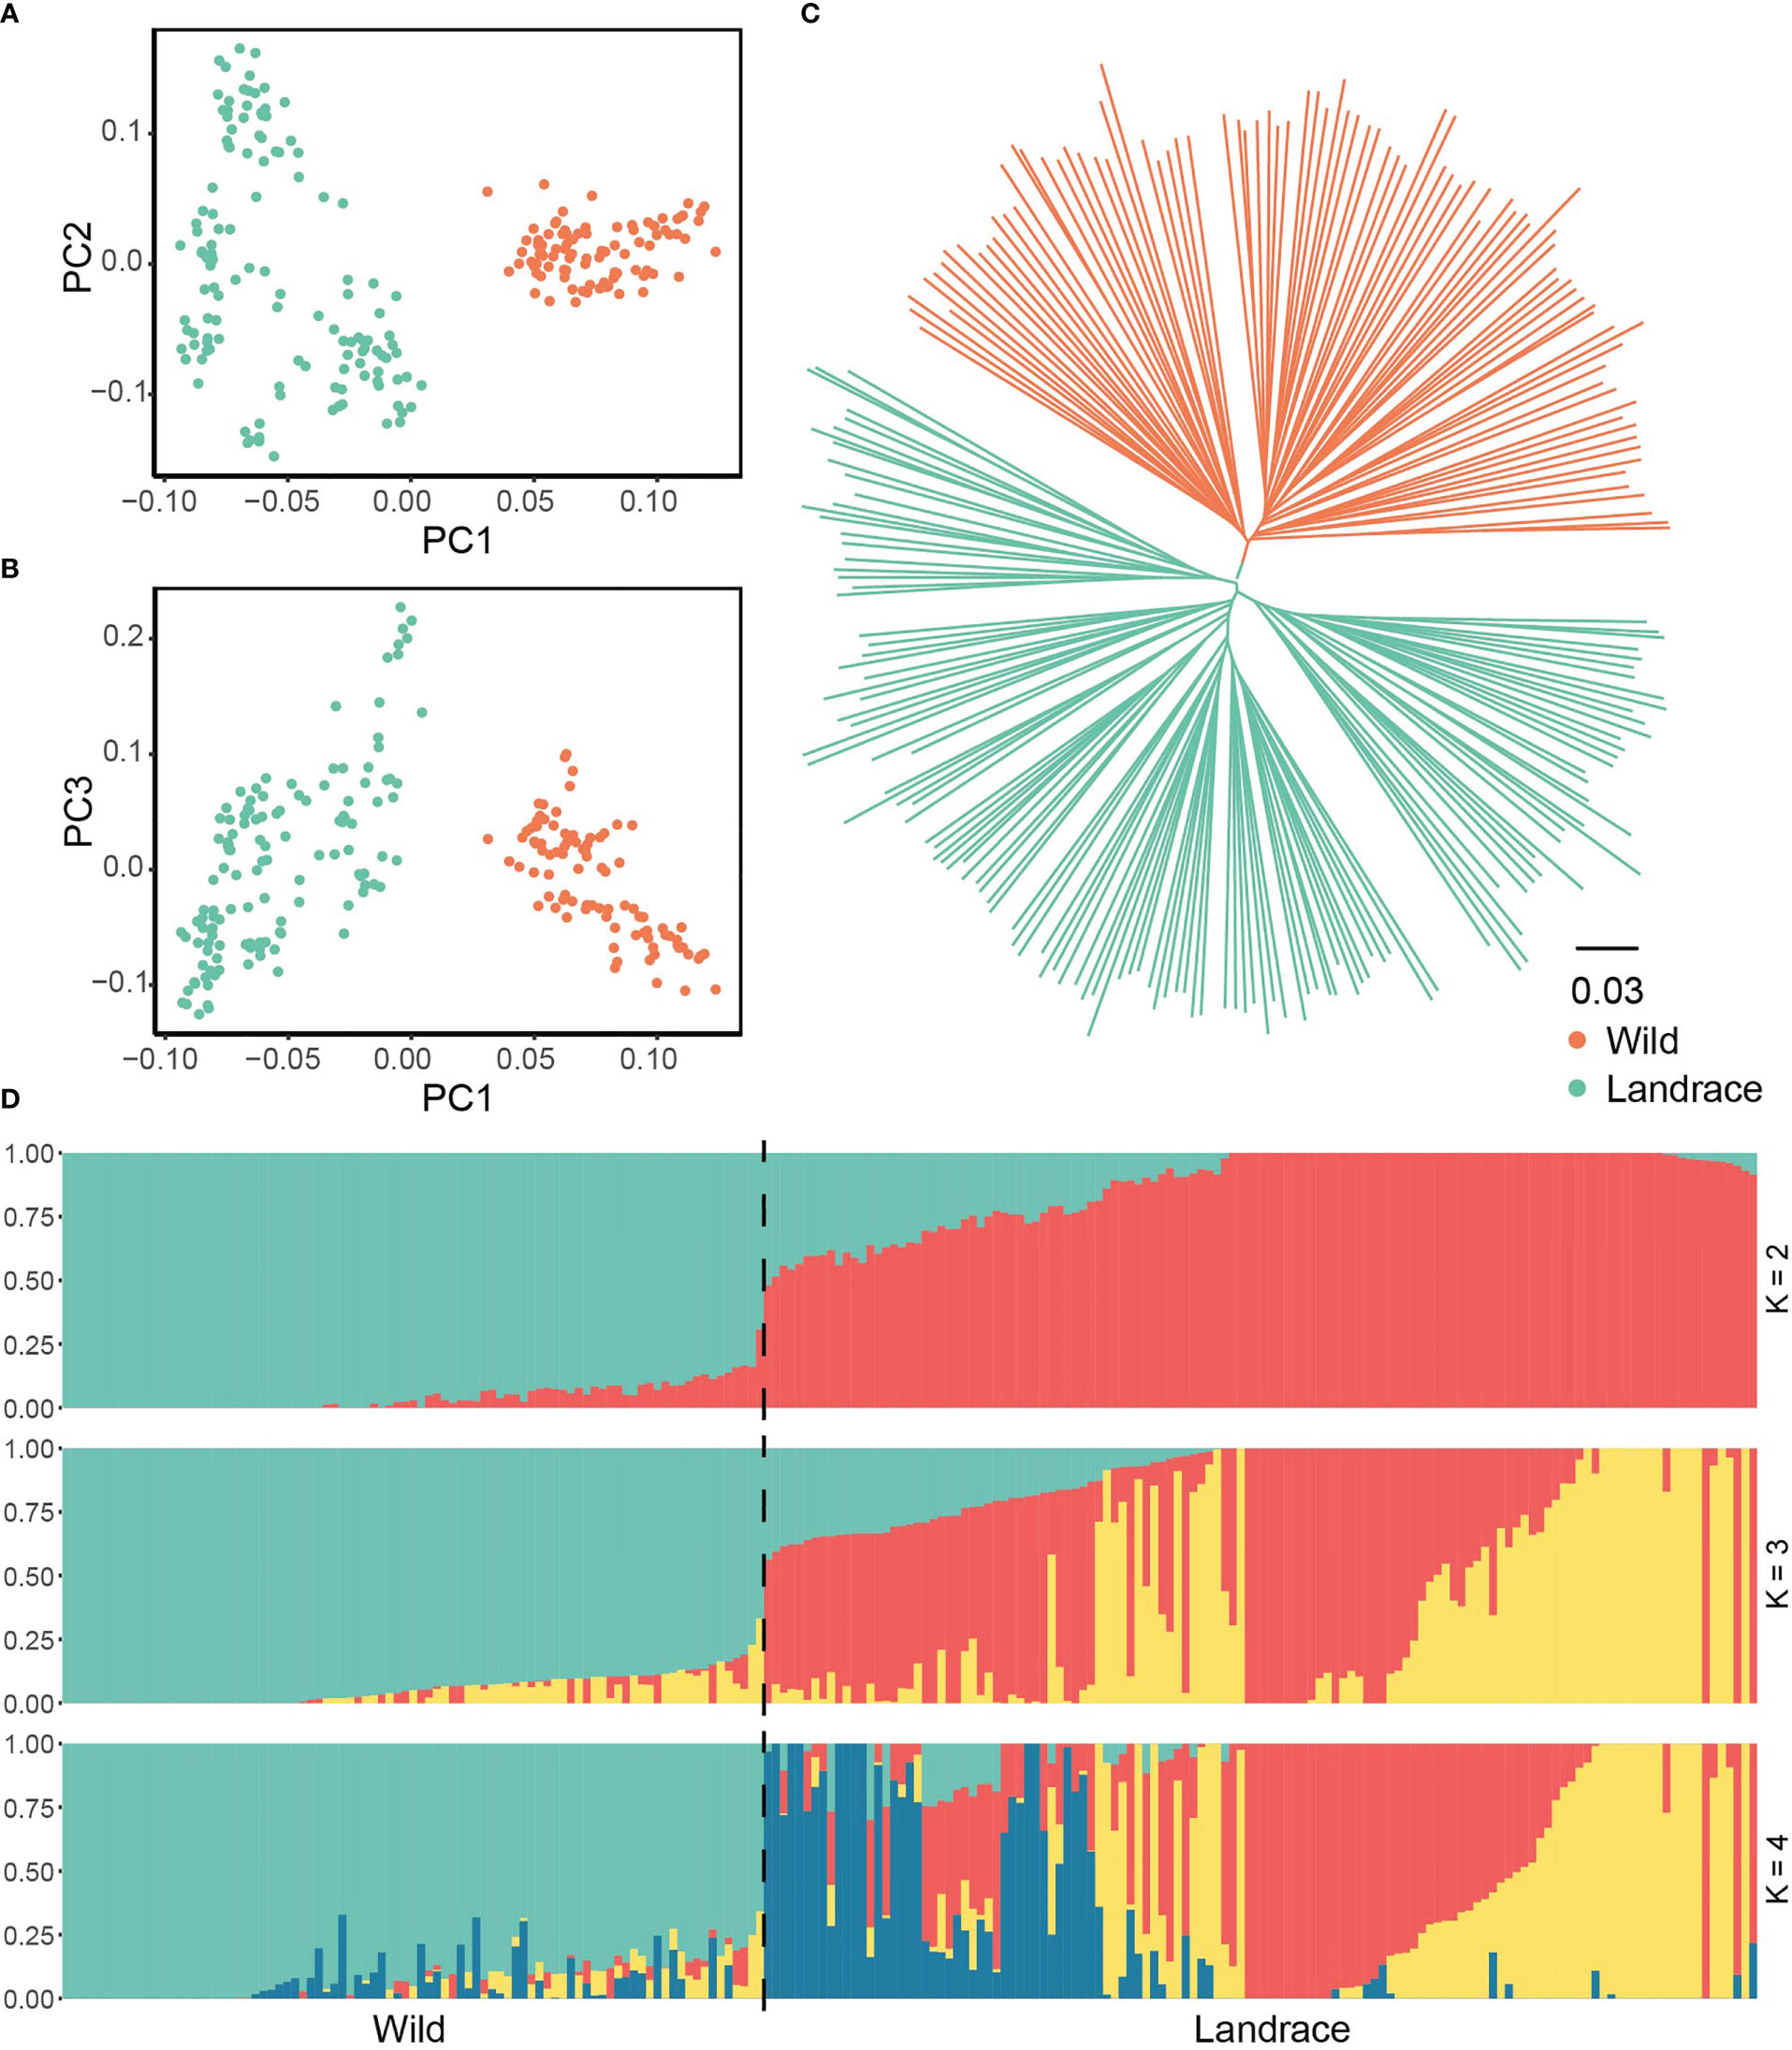
Figure 8 Population structure between wild barley and landrace based on SNPs in expanded genes. (A) Principal component analysis PC1 vs. PC2. (B) Principal component analysis PC1 vs. PC3. (C) The NJ phylogenetic tree. (D) Population structure with K ranging from 2 to 4.
Estimates of genetic diversity are important for evolutionary and genetic research in plants (Mao et al., 2019). Nucleotide diversity of expanded and non-expanded genes significantly decreased (~5.46%) from wild barley (0.2636) to landrace barley (0.2492) (Figure 7B and Supplementary Table S16). Specifically, decreases in nucleotide diversity were significantly more pronounced in expanded genes than non-expanded genes, which suggests that expanded genes have undergone more severe genetic bottlenecks than non-expanded genes during barley domestication (~6.00% vs. ~5.4%; Figure 7B and Supplementary Table S16).
To reveal the potential biological functions of expanded and non-expanded genes, we performed GO, KEGG, and PO enrichment analyses. For expanded genes, a total of 185, 49, and 84 GO terms were significantly enriched in the biological process (BP), cellular component (CC), and molecular function (MF) categories, respectively (Supplementary Table S17). A large number of terms were enriched in response to stimulus (GO:0050896), signal transduction (GO:0007165), defense response (GO:0006952), catalytic activity (GO:0003824), and kinase activity (GO:0016301) (Supplementary Figure S8). KEGG analysis revealed that expanded genes were enriched in oxidative phosphorylation, photosynthesis, and DNA repair (Supplementary Figure S9 and Supplementary Table S18). PO enrichment analysis revealed that expanded genes were enriched in mesophyll cell (PO:0004006), leaf (PO:0025034), lateral root (PO:0020121), and embryo sac central cell (PO:0020090) (Supplementary Figure S10 and Supplementary Table S19). For non-expanded genes, a total of 194, 79, and 51 GO terms were enriched in BP, CC, and MF, such as primary metabolic process (GO:0044238), regulation of biological process (GO:0050789), binding (GO:0005488), and transcription regulator activity (GO:0140110) (Supplementary Figure S11 and Supplementary Table S20). Moreover, non-expanded genes were highly enriched in translation, transcription, and various metabolism KEGG pathways (Supplementary Figure S12 and Supplementary Table S21). PO enrichment analysis showed that non-expanded genes were significantly enriched in pollen tube cells (PO:0025195), plant sperm cells (PO:0000084), and seed germination stage (PO:0007057) (Supplementary Figure S13 and Supplementary Table S22). These results indicate that these non-expanded genes were involved in basic metabolic and reproductive development processes and that expanded genes play key roles in the response to stresses.
Expression profiles provide insights into the potential functions of genes in plant species (Yang et al., 2022). The expression of the expanded gene HORVU.MOREX.r3.1HG0003780 was upregulated under drought treatment (Supplementary Figure S14B and Supplementary Table S24). The expression of four expanded genes in OG0000152 (HORVU.MOREX.r3.7HG0738450, HORVU.MOREX.r3.7HG0738520, HORVU.MOREX.r3.7HG0738470, and HORVU.MOREX.r3.7HG0738490) was upregulated in the roots under water-deficit conditions (Supplementary Figure S14 and Supplementary Table S24). The expression of HORVU.MOREX.r3.7HG0738470 and HORVU.MOREX.r3.7HG0738490 was induced by salt treatment. These results demonstrate that the functionally divergent OG0000152 family genes might play essential roles in the response to adverse stresses.
TFs activate or repress the expression of target genes by binding to specific DNA sequences during various biological processes (Ibarra et al., 2020). In this study, a total of 83 expanded genes (11 orthogroups) were identified as TFs (Supplementary Table S25). To explore their potential biological functions and regulatory networks, we constructed co-expression networks with TFs as central nodes. According to pairwise correlations of gene expression across samples, co-expression networks were constructed to characterize regulatory changes in gene expression (Langfelder and Horvath, 2008). WGCNA revealed 18 TF-type expanded genes that were central hubs in the co-expression networks and we further explored their expression profiles, variant sites, and haplotypes. (Figures 9A–F and Supplementary Table S25). Two central hub TFs, HORVU.MOREX.r3.7HG0698380 (homologous to AT1G72570, encoded AP2 TF) and HORVU.MOREX.r3.6HG0547700 (homologous to NAC032, encoded NAC TF), were co-expressed with 135 and 118 genes, respectively, which formed a network composed of 253 connections (Figure 10A and Supplementary Table S26). Another co-expression network with HORVU.MOREX.r3.7HG0698380 (homologous to AT1G72570, encoded AP2 TF) and HORVU.MOREX.r3.6HG0547700 (homologous to NAC032, encoded NAC TF) as central nodes contained 100 connections, and these two central genes were linked with 78 and 22 genes, respectively (Figure 10B and Supplementary Table S27).
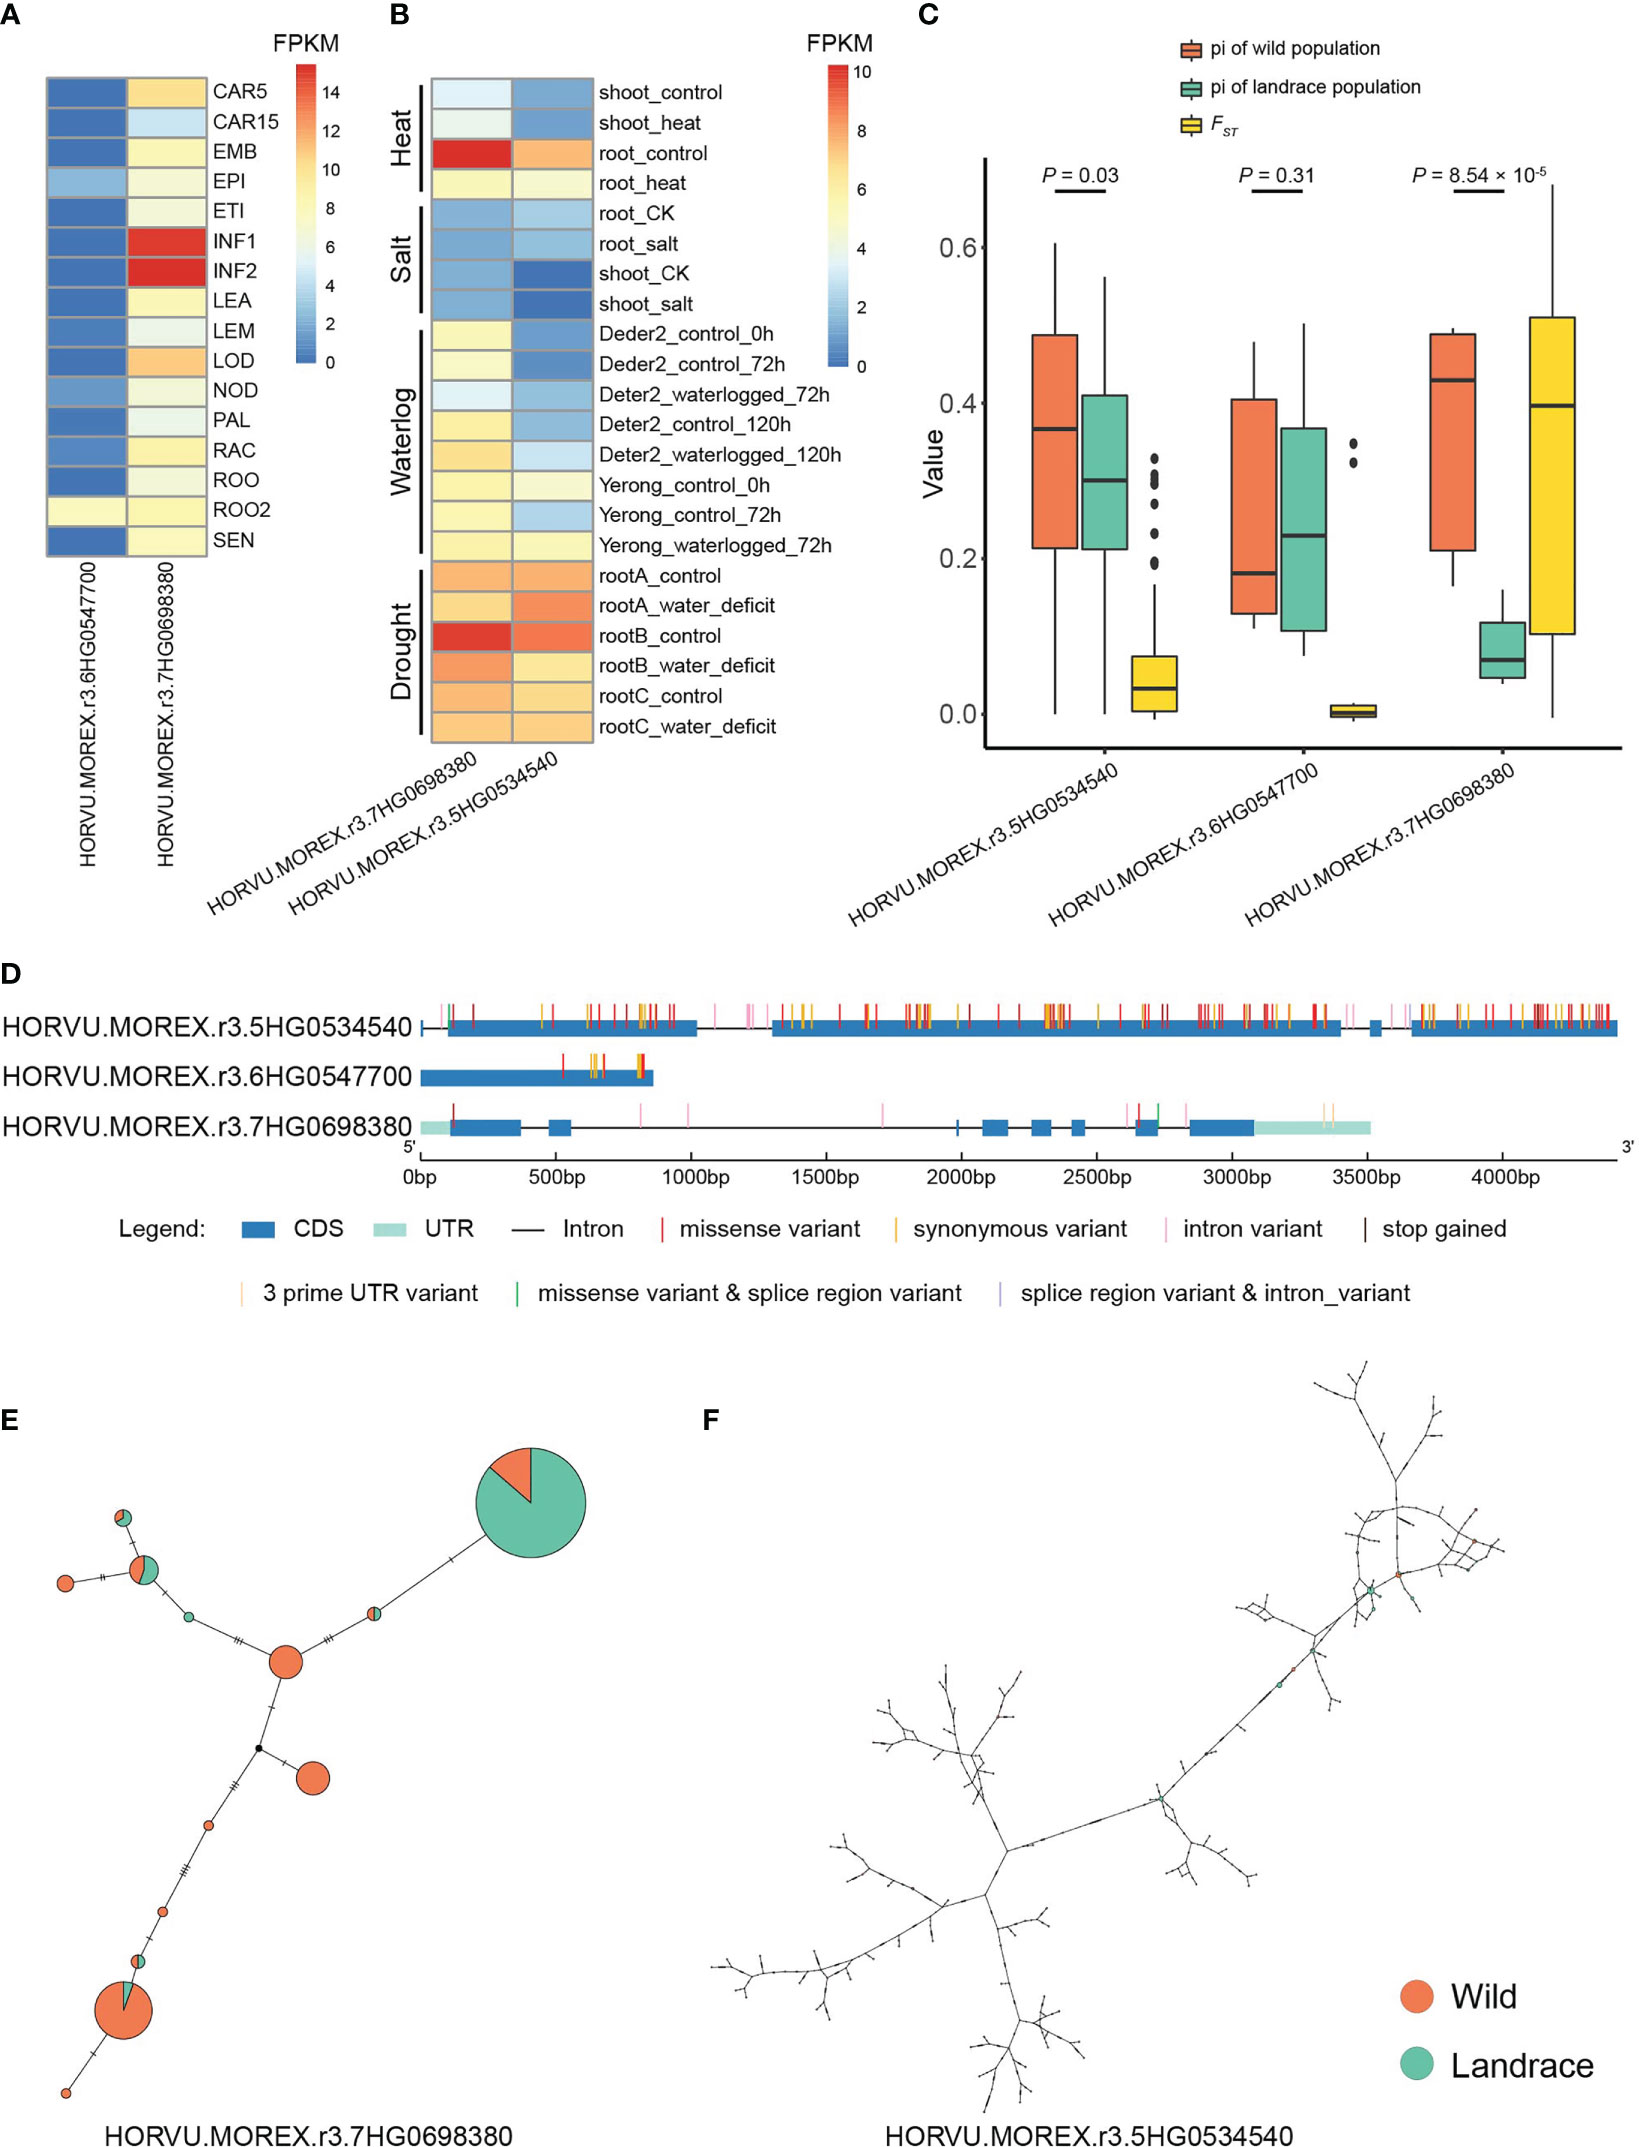
Figure 9 Expression pattern and median-joining haplotype networks of TF-type expanded genes. (A) Expression pattern of candidate genes in different tissues/stages. CAR15, bracts removed grains at 15DPA; CAR5, bracts removed grains at 5DPA; EMB, embryos dissected from 4-day-old germinating grains; EPI, epidermis with 4 weeks old; ETI, etiolated from 10-day-old seedling; INF1, young inflorescences with 5 mm; INF2, young inflorescences with 1–1.5 cm; LEA, shoot with the size of 10 cm from the seedlings; LEM, lemma with 6 weeks after anthesis; LOD, lodicule with 6 weeks after anthesis; NOD, developing tillers at six-leaf stage; PAL, inflorescences, palea (6 weeks after pollination); RAC, inflorescences, rachis (5 weeks after pollination); ROO, roots from the seedlings with 17 and 28 days old after planting; ROO2, roots (4 weeks after pollination); SEN, senescing leaf. (B) Expression pattern of candidate genes under different stresses. (C) The boxplots of pi and FST values for candidate genes. (D) Distribution of nucleotide variants within the candidate genes. (E, F) Median-Joining haplotype networks of candidate genes in wild barley and landrace populations. The circle size represents the number of accessions holding a particular haplotype. The orange and green circles refer to wild barley and landrace accessions, respectively.
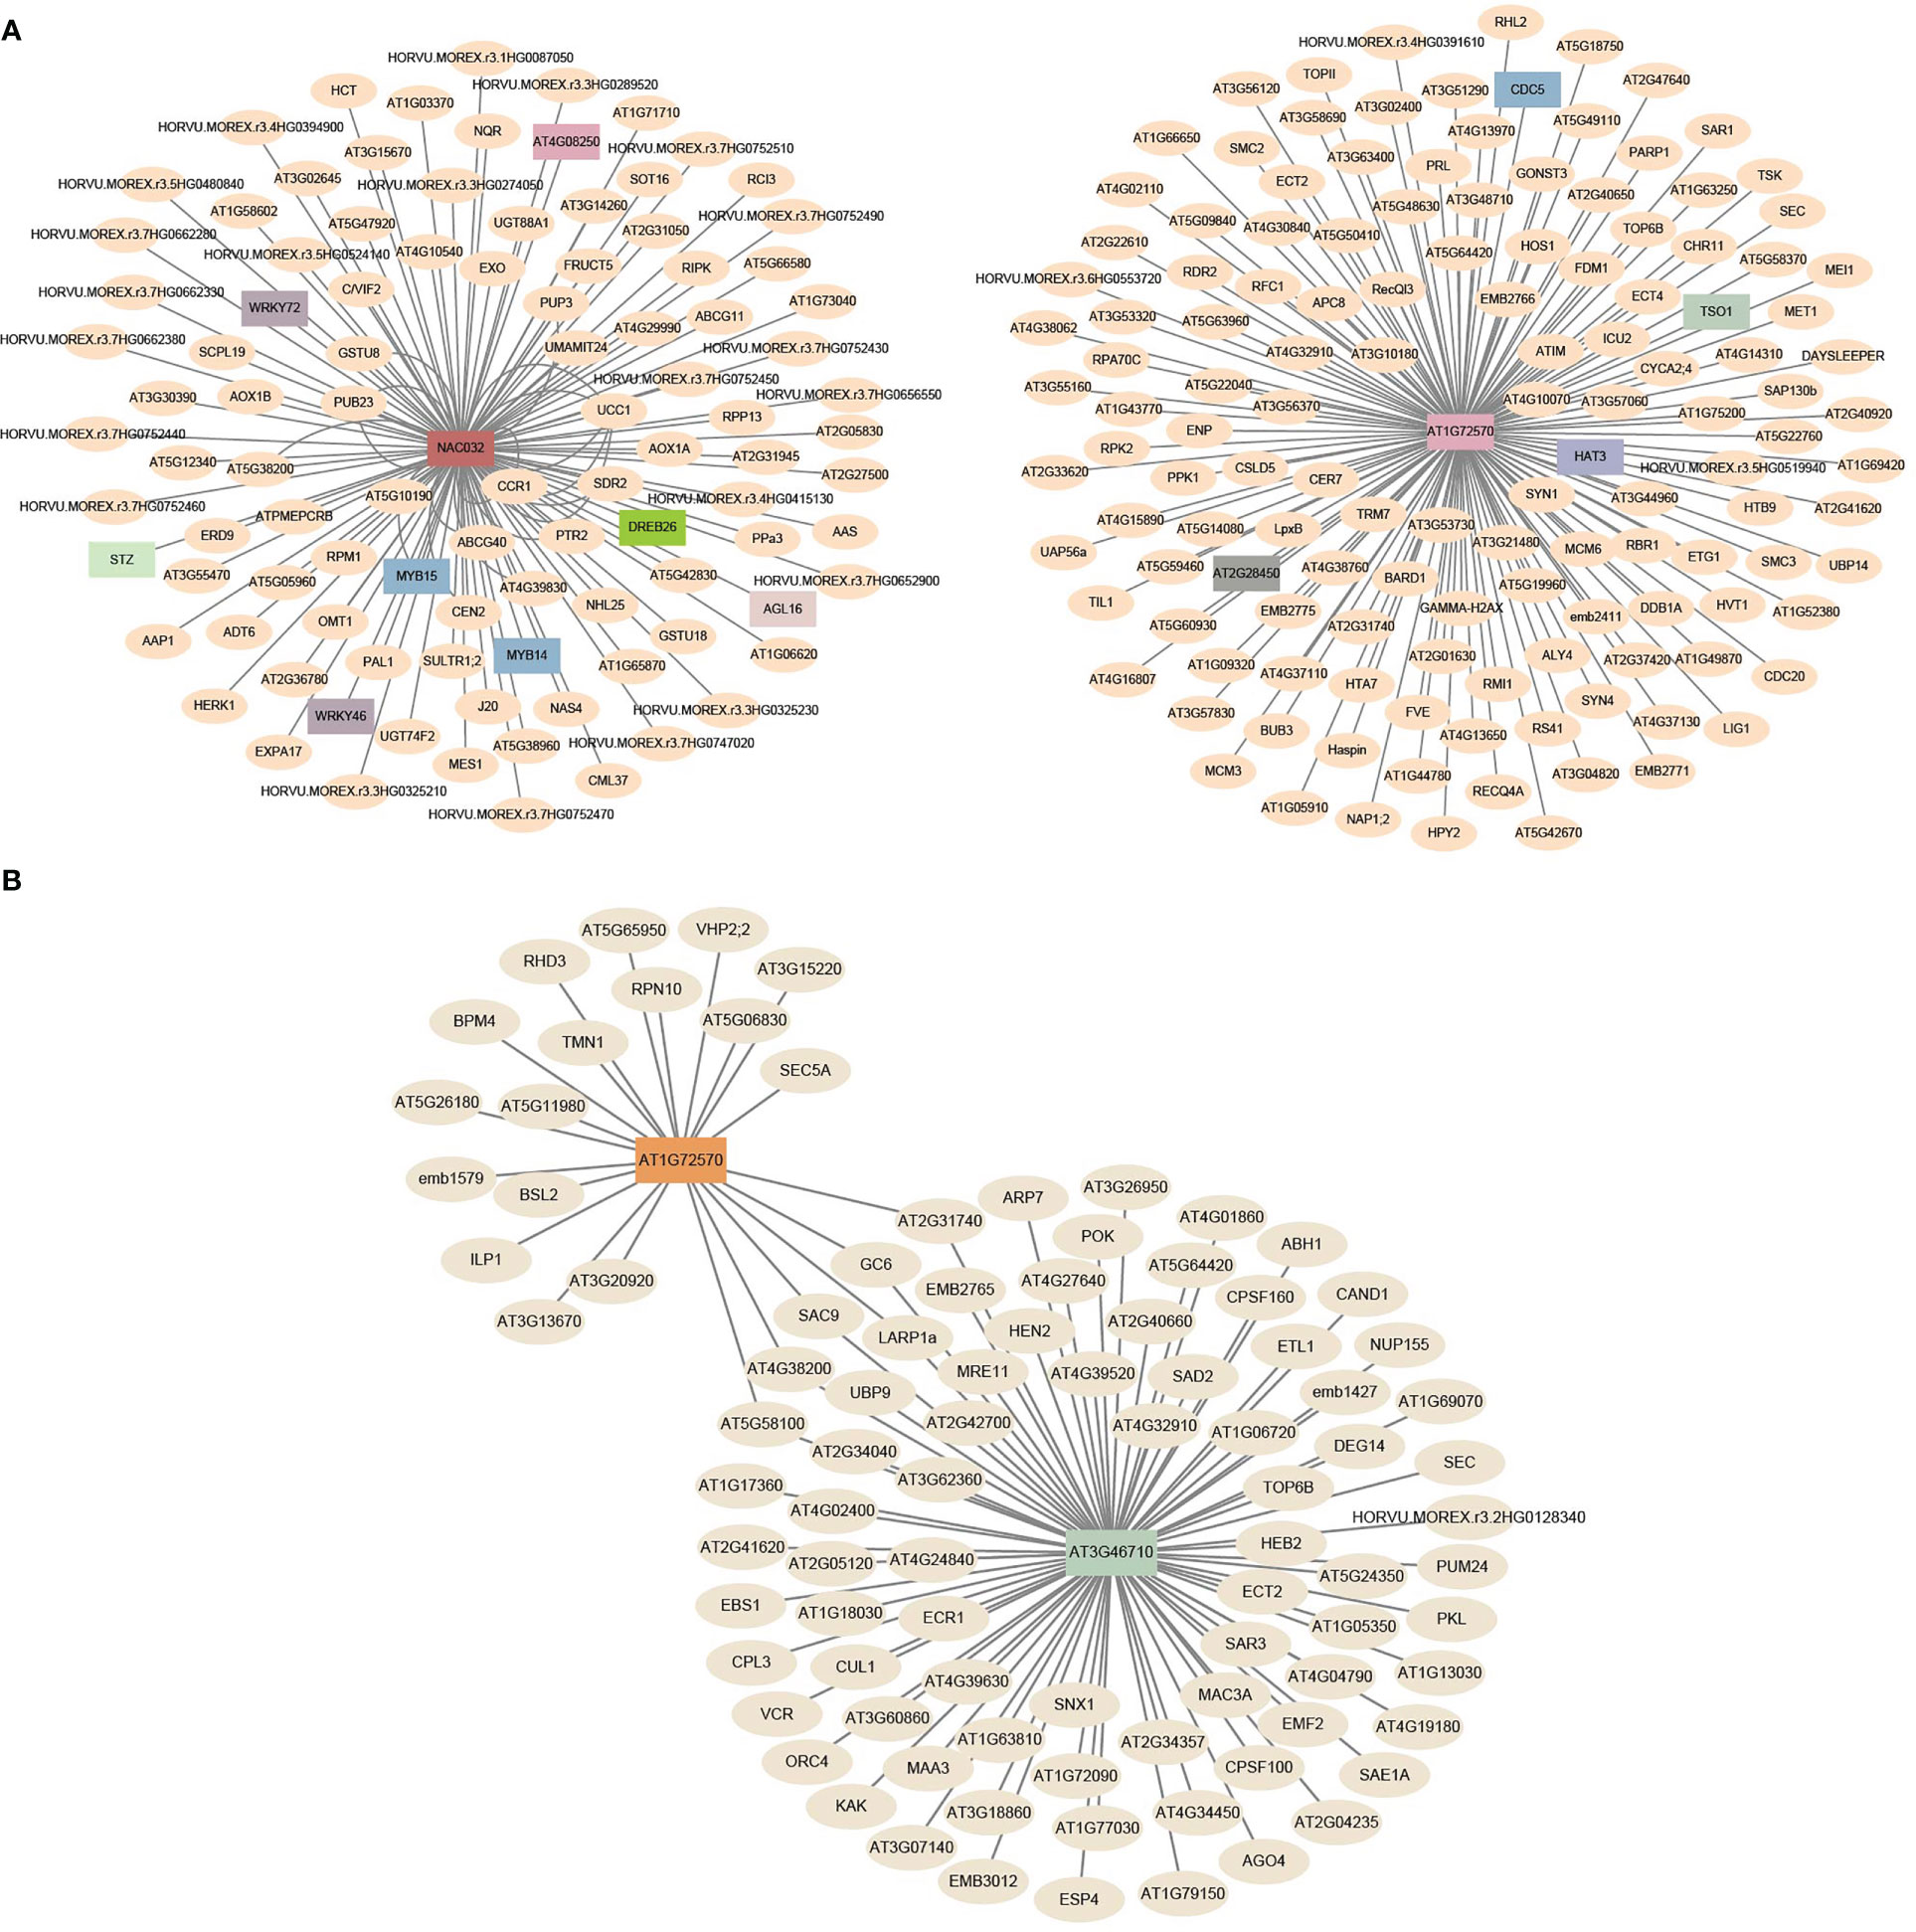
Figure 10 The co-expression network of expanded genes with other TF-type genes. (A) Co-expression network in different tissues/stages. (B) Co-expression network under different stresses. The barley genes were annotated with homologs of A. thaliana.
The expression patterns for these hub genes were further explored using data from 16 different development tissues/stages and under four types of stress (Figures 9A, B and Supplementary Figures S15-S17). The expression patterns of these genes displayed high tissue specificity, with an average τ-value of 0.7675, ranging from 0.4295 to 0.9907 (Supplementary Table S25). HORVU.MOREX.r3.7HG0698380 was preferentially expressed in inflorescences and was differentially expressed under heat, waterlogging, and drought stress (Figures 9A, B and Supplementary Table S25). In addition, HORVU.MOREX.r3.6HG0547700 was primarily expressed in the roots, and the expression of HORVU.MOREX.r3.5HG0534540 was induced by heat, waterlogging, and drought stress.
The nucleotide diversity of HORVU.MOREX.r3.7HG0698380 and HORVU.MOREX.r3.5HG0534540 was significantly higher in wild barley than in landrace accessions (one-sided Mann–Whitney U test, p-value < 0.05) (Figure 9C and Supplementary Table S25). Specially, a total of 133, 12, and 8 SNPs were identified in HORVU.MOREX.r3.5HG0534540, HORVU.MOREX.r3.6HG0547700, and HORVU.MOREX.r3.7HG0698380, respectively (Figure 9D and Supplementary Table S25). A relatively high FST index (0.3454) between wild and landrace accessions was observed in HORVU.MOREX.r3.7HG0698380, indicating differentiation during domestication (Figure 9C and Supplementary Table S25). HORVU.MOREX.r3.7HG0698380 possessed 13 haplotypes, six of which were specific to the wild population (Figure 9E and Supplementary Table S25). By contrast, HORVU.MOREX.r3.5HG0534540 possessed 162 haplotypes (Figure 9F and Supplementary Table S25).
The selection pressure on expanded genes determines their evolutionary fates after duplication events (Jacquemin et al., 2014). However, the roles of selection in shaping the evolutionary history of barley-expanded genes remain unclear. In this study, we obtained 27,438 orthogroups from the protein-coding genes of seven Poaceae species. A total of 3,496 expanded and 21,537 non-expanded genes were identified. To estimate their evolutionary rates, we calculated the Ka, Ks, and Ka/Ks values for each homologous gene pair. The average values of Ka and Ks for expanded genes were greater than those for non-expanded genes, which indicated that expanded genes evolved much faster. These results were similar to those of previous studies showing that duplicated genes had higher evolutionary rates than single-copy genes (Pegueroles et al., 2013; O'Toole et al., 2018; Vance et al., 2022).
A reliable model has been proposed to explain the evolutionary fate of duplicated genes. In this model, gene copies are retained under negative selection due to short-term gene dosage advantage in the early phase after duplication; in the later stage of duplication, a few copies experience positive selection and acquire new functions (Lynch and Conery, 2000; Pegueroles et al., 2013; Gout and Lynch, 2015). Our analysis revealed that the average Ka/Ks value of expanded genes was approximately twice as large as that of non-expanded genes, and this ratio gradually increased as the copy number increased. These observations suggest that there were numerous copies of expanded genes under relaxed negative selection, but non-expanded genes evolved more slowly than multi-copy expanded genes owing to functional constraints and stronger negative selection. We also found that a large proportion of expanded genes experienced negative selection rather than positive selection. Similar findings have been made in previous studies (Lynch and Conery, 2000). Therefore, we hypothesized that most of the expanded genes have been subfunctionalized or pseudogenized in the barley genome. Expanded genes are unlikely to undergo neofunctionalization because most non-synonymous mutations are deleterious (Jacquemin et al., 2014; de Oliveira et al., 2019).
An increasing number of studies have shown that the evolutionary rate of proteins is affected by multiple factors, such as gene structure, codon usage bias, and expression levels (Drummond et al., 2005; Zhang and Yang, 2015; Echave et al., 2016). The potential factors shaping the evolutionary rate of expanded and non-expanded genes were further explored. Gene expression has been reported to affect both the fate of duplicated genes and evolutionary rates (Zhang and Yang, 2015; Panchy et al., 2016). In this study, we found that expanded genes, including their exons and introns, were shorter, but they had longer first exons and lower expression levels. Correlation analysis showed that Ka and Ks values were negatively correlated with gene length, intron length, exon length, and the number of exons. Several studies support these observations; for example, duplicate genes with shorter CDS lengths have also been detected in primates, suggesting that the expansion of longer genes might be more costly (O'Toole et al., 2018). The shorter first exons of non-expanded genes act as position-dependent transcriptional enhancers by activating histone modifications, including H3K4me3 and H3K9ac, to increase expression levels (Bieberstein et al., 2012; Aljohani et al., 2020).
Highly expressed proteins are usually encoded by genes with stronger codon usage bias (Yang et al., 2019). Our results revealed that the expression levels of expanded genes were lower; however, the tissue specificity of the expression of expanded genes was higher, and the codon usage bias of these genes was weaker. We also noticed that Ks, rather than Ka, was positively correlated with codon usage bias, which indicated that synonymous substitutions affect the formation of codon usage bias in barley. The Ka/Ks ratio was negatively correlated with the expression level of expanded genes but positively correlated with the tissue specificity of the expression of expanded genes. This indicates that the lower selection on expanded genes was responsible for their lower expression level and indicates that the neofunctionalization of expanded genes is rare. As gene family size increased, gene expression levels decreased, and the tissue specificity of the expression of genes increased, which can be explained by the fact that functional redundancy after gene duplication may be altered by decreases in expression levels. This suggests that single-copy genes tend to be expressed at a high level compared with multi-copy expanded genes (De Smet et al., 2013; De La Torre et al., 2015).
Crop domestication refers to the process in which wild ancestors experience long-term artificial selection to acquire traits that facilitate harvest or increase yields in landraces and cultivars (Yu and Li, 2022). Crop domestication has resulted in the loss of genetic diversity in modern cultivars compared with their wild ancestors, a phenomenon that is often referred to as the “domestication bottleneck” (Zhang et al., 2021). The nucleotide diversity of landrace accessions was decreased by 27% across the whole genome compared with wild barley (Russell et al., 2016). However, little is known regarding changes in expanded and non-expanded genes during barley domestication.
Analysis of 587,290 SNPs revealed a significant decrease in average nucleotide diversity of ~6.00% and ~5.4% for expanded and non-expanded genes, respectively, from wild accessions to landraces. The non-synonymous variant (46.67%) accounted for most of the expanded genes, but the intron variant was the most common variant type among non-expanded genes. We thus inferred that the divergent variant types might have led to differences in genetic diversity and evolutionary rates in expanded and non-expanded genes. Because non-expanded genes tend to be housekeeping genes, multiple non-synonymous variants might be detrimental to the survival of barley. However, beneficial non-synonymous variants might have been retained in several expanded genes during barley domestication because they enhance adaptation to the environment or confer excellent agronomic traits.
WGCNA is a systems biology method for the identification of association patterns, functional modules, and hub genes (Langfelder and Horvath, 2008). TFs are the key regulators involved in transcriptional regulation (Ibarra et al., 2020). Our analysis yielded co-expression networks with TF-type expanded genes as the central nodes. The hub genes HORVU.MOREX.r3.6HG0547700, HORVU.MOREX.r3.7HG0698380, and HORVU.MOREX.r3.5HG0534540 encoded NAC, AP2, and B3 TFs, respectively. The homologous gene of HORVU.MOREX.r3.6HG0547700 in A. thaliana was ANAC032, which regulates root growth in response to reactive oxygen species signaling (Maki et al., 2019). In rice, overexpression of its homolog OsNAC9 altered root architecture and increased drought resistance and grain yield (Redillas et al., 2012). HORVU.MOREX.r3.7HG0698380 was highly expressed in inflorescences and was differentially expressed under different types of stress (Supplementary Figure S17 and Supplementary Table S25). The expression pattern of its homologous gene AIL1 in A. thaliana was similar (Nole-Wilson et al., 2005). Furthermore, the differentiation of haplotypes under strong selection pressure suggests that these candidates have potentially played an important role in the domestication process in barley (Figure 9C and Supplementary Table S25).
B3 superfamily genes contain at least one conserved B3 DNA-binding domain that interacts directly with cis-acting elements, and they are involved in plant growth, hormone signaling, and the response to biotic/abiotic stresses (Swaminathan et al., 2008; Fu et al., 2014; Chen et al., 2015). The B3 gene family has undergone a significant expansion, and this has been mainly mediated by tandem duplication. These genes were clustered into the orthogroups OG0001472 (only containing HORVU.MOREX.r3.5HG0534540) and OG0000195 (containing 41 genes) (Supplementary Figure S18 and Supplementary Table S24). Expression analysis revealed that the genes in OG0000195 might have undergone pseudogenization, as they were not highly expressed in any tissue/stage or under any stress; by contrast, HORVU.MOREX.r3.5HG0534540 in OG0001472 was highly expressed under heat stress. In A. thaliana, the homologous gene of HORVU.MOREX.r3.5HG0534540 shows sequence and functional diversity in pathogen recognition (Rose et al., 2004), suggesting that neofunctionalization or subfunctionalization has driven the origin of this gene.
Other candidate expanded genes were obtained aside from TF-type expanded genes. Plants have evolved disease resistance (R) genes to specifically recognize and confer resistance to pathogens and insects (Zhang et al., 2016; Kourelis and van der Hoorn, 2018). R genes can be classified according to their protein domains and structures. The vast majority of R genes are NBS–LRRs (Marone et al., 2013). A total of 44 out of 411 NBS-LRRs were associated with expansion in the barley genome (Supplementary Table S28). The expanded NBS-LRRs were clustered into seven orthogroups and mainly located on chromosomes 7 and 1 through tandem duplications (Supplementary Figure S19). Among the expanded NBS-LRR genes, HORVU.MOREX.r3.5HG0495560 has undergone a domestication bottleneck, including a severe loss of genetic diversity (Supplementary Table S25).
In addition, five expanded genes were found to be differentially expressed under various types of stress, suggesting that they could be used for the molecular breeding of plants with enhanced stress resistance (Supplementary Figure S14B and Supplementary Table S24). The expression of another hub gene, HORVU.MOREX.r3.3HG0272100, was upregulated in response to heat and drought (Supplementary Figure S17B and Supplementary Table S25). A significant reduction in nucleotide diversity was observed in HORVU.MOREX.r3.3HG0272100. These domestication-related genes provide valuable genetic resources that could be used to enhance the agronomic traits of crops.
The original contributions presented in the study are included in the article/Supplementary Material. Further inquiries can be directed to the corresponding author.
WT: formal analysis, visualization. RL: formal analysis. TL: methodology. ZL: supervision. YL: investigation, writing—original draft. LC: data curation, writing—original draft, supervision. All authors contributed to the article and approved the submitted version.
This research was funded by the National Natural Science Foundation of China (Grant No. 32060458 and 32160219), the Postdoctoral Foundation of China (Grant No. 2022M713430). The funders had no role in the study design, data collection, analysis, decision to publish, or preparation of the manuscript.
We thank the High-Performance Computing platform of Northwest A&F University.
The authors declare that the research was conducted in the absence of any commercial or financial relationships that could be construed as a potential conflict of interest.
All claims expressed in this article are solely those of the authors and do not necessarily represent those of their affiliated organizations, or those of the publisher, the editors and the reviewers. Any product that may be evaluated in this article, or claim that may be made by its manufacturer, is not guaranteed or endorsed by the publisher.
The Supplementary Material for this article can be found online at: https://www.frontiersin.org/articles/10.3389/fpls.2023.1168124/full#supplementary-material
Supplementary Figure 1 | Distributions and correlation analysis of Ka, Ks, and Ka/Ks by comparing barley with B. distachyon. (A-C) The frequency distribution of Ka, Ks, and Ka/Ks, respectively. (D) The correlation between Ks (x-axis) and Ka. (E) The correlation between Ks (x-axis) and Ka/Ks. (F) The correlation between Ka (x-axis) and Ka/Ks. (G-I) The box plots of Ka, Ks, and Ka/Ks between expanded and non-expanded genes, respectively. The line in the box is the median value, and the lines at the bottom and top of each box are the first (lower) and third (higher) quartiles.
Supplementary Figure 2 | Correlations among substitution rates, gene features, codon usage bias, and expression patterns. The Ka, Ks, and Ka/Ks values were calculated between barley and B. distachyon. Upper Right: the size of the circle represents the magnitude of the correlation coefficient, red indicates positive correlation, and blue indicates negative correlation. Three asterisks (***) indicate 0.001 significant difference level. Bottom Left: correlation coefficients are presented as two-sided Spearman’s rank correlation test ρ.
Supplementary Figure 3 | Group boxplots of Ka (A), Ks (B), and Ka/Ks (C) by comparing barley with rye. The line in the box is the median value, and the lines at the bottom and top of each box are the first (lower) and third (higher) quartiles. Multiple comparison was performed by LSD test.
Supplementary Figure 4 | Group boxplots of Ka (A), Ks (B), and Ka/Ks (C) by comparing barley with B. distachyon. The line in the box is the median value, and the lines at the bottom and top of each box are the first (lower) and third (higher) quartiles. Multiple comparison was performed by LSD test.
Supplementary Figure 5 | Distributions of Ka, Ks, and Ka/Ks values for expanded and non-expanded genes alongside the chromosome by comparing barley with B. distachyon.
Supplementary Figure 6 | Comparisons of genomic features between expanded and non-expanded genes grouped by copy number. The line in the box is the median value, and the lines at the bottom and top of each box are the first (lower) and third (higher) quartiles. Multiple comparison was performed by LSD test.
Supplementary Figure 7 | Population structure between wild barley and landrace based on SNPs in non-expanded genes. (A) Principal component analysis PC1 vs. PC2. (B) Principal component analysis PC1 vs. PC3. (C) The NJ phylogenetic tree. (D) Population structure with K ranging from 2 to 4.
Supplementary Figure 8 | GO enrichment analysis of expanded genes. The top 10 GO enrichment terms are displayed for each category.
Supplementary Figure 9 | KEGG pathway enrichment analysis of expanded genes.
Supplementary Figure 10 | PO enrichment analysis of expanded genes.
Supplementary Figure 11 | GO enrichment analysis of non-expanded genes. The top 10 GO enrichment terms are displayed for each category.
Supplementary Figure 12 | KEGG pathway enrichment analysis of non-expanded genes.
Supplementary Figure 13 | PO enrichment analysis of non-expanded genes.
Supplementary Figure 14 | Expression pattern of differentially expressed expanded genes. Detailed annotation of tissues/stages is the same as.
Supplementary Figure 15 | Expression pattern of NBS-LRRs in different tissues/stages. Detailed annotation of tissues/stages is the same as.
Supplementary Figure 16 | Expression pattern of NBS-LRRs under different stresses.
Supplementary Figure 17 | Expression pattern of top 10 hub genes in tissue/stage (A) and stress (B) co-expression networks. Detailed annotation of tissues/stages is the same as.
Supplementary Figure 18 | Distribution of the B3 genes on barley chromosomes. Chromosome numbers are shown at the top of each chromosome. The scale (Mb) notes on the left. The genes marked in red are expanded genes in barley.
Supplementary Figure 19 | Distribution of NBS-LRRs on barley chromosomes. Chromosome numbers are shown at the top of each chromosome. The scale (Mb) notes on the left. The genes marked in red are expanded genes in barley.
Alexander, D. H., Novembre, J., Lange, K. (2009). Fast model-based estimation of ancestry in unrelated individuals. Genome Res. 19 (9), 1655–1664. doi: 10.1101/gr.094052.109
Aljohani, M. D., El Mouridi, S., Priyadarshini, M., Vargas-Velazquez, A. M., Frokjaer-Jensen, C. (2020). Engineering rules that minimize germline silencing of transgenes in simple extrachromosomal arrays in c. elegans. Nat. Commun. 11 (1). doi: 10.1038/s41467-020-19898-0
Assis, R., Bachtrog, D. (2013). Neofunctionalization of young duplicate genes in drosophila. Proc. Natl. Acad. Sci. U.S.A. 110 (43), 17409–17414. doi: 10.1073/pnas.1313759110
Bandelt, H. J., Forster, P., Rohl, A. (1999). Median-joining networks for inferring intraspecific phylogenies. Mol. Biol. Evol. 16 (1), 37–48. doi: 10.1093/oxfordjournals.molbev.a026036
Behura, S. K., Severson, D. W. (2013). Codon usage bias: causative factors, quantification methods and genome-wide patterns: with emphasis on insect genomes. Biol. Rev. Camb. Philos. Soc. 88 (1), 49–61. doi: 10.1111/j.1469-185X.2012.00242.x
Bieberstein, N. I., Oesterreich, F. C., Straube, K., Neugebauer, K. M. (2012). First exon length controls active chromatin signatures and transcription. Cell Rep. 2 (1), 62–68. doi: 10.1016/j.celrep.2012.05.019
Blanc, G., Wolfe, K. H. (2004). Functional divergence of duplicated genes formed by polyploidy during arabidopsis evolution. Plant Cell 16 (7), 1679–1691. doi: 10.1105/tpc.021410
Blum, M., Chang, H. Y., Chuguransky, S., Grego, T., Kandasaamy, S., Mitchell, A., et al. (2021). The InterPro protein families and domains database: 20 years on. Nucleic Acids Res. 49 (D1), D344–D354. doi: 10.1093/nar/gkaa977
Bolger, A. M., Lohse, M., Usadel, B. (2014). Trimmomatic: a flexible trimmer for illumina sequence data. Bioinformatics 30 (15), 2114–2120. doi: 10.1093/bioinformatics/btu170
Bu, L., Bergthorsson, U., Katju, V. (2011). Local synteny and codon usage contribute to asymmetric sequence divergence of Saccharomyces cerevisiae gene duplicates. BMC Evol. Biol. 11, 279. doi: 10.1186/1471-2148-11-279
Cantalapiedra, C. P., Hernández-Plaza, A., Letunic, I., Bork, P., Huerta-Cepas, J. (2021). eggNOG-mapper v2: functional annotation, orthology assignments, and domain prediction at the metagenomic scale. Mol. Biol. Evol. 38 (12), 5825–5829. doi: 10.1093/molbev/msab293
Cao, Y., Jiang, L., Wang, L., Cai, Y. (2019). Evolutionary rate heterogeneity and functional divergence of orthologous genes in Pyrus. Biomolecules 9 (9). doi: 10.3390/biom9090490
Chen, C., Chen, H., Zhang, Y., Thomas, H. R., Frank, M. H., He, Y., et al. (2020). TBtools: an integrative toolkit developed for interactive analyses of big biological data. Mol. Plant 13 (8), 1194–1202. doi: 10.1016/j.molp.2020.06.009
Chen, W. H., Li, P. F., Chen, M. K., Lee, Y. I., Yang, C. H. (2015). FOREVER YOUNG FLOWER negatively regulates ethylene response DNA-binding factors by activating an ethylene-responsive factor to control arabidopsis floral organ senescence and abscission. Plant Physiol. 168 (4), 1666–1683. doi: 10.1104/pp.15.00433
Chen, X., Zhu, W., Azam, S., Li, H., Zhu, F., Li, H., et al. (2013). Deep sequencing analysis of the transcriptomes of peanut aerial and subterranean young pods identifies candidate genes related to early embryo abortion. Plant Biotechnol. J. 11 (1), 115–127. doi: 10.1111/pbi.12018
Cingolani, P., Platts, A., Wang le, L., Coon, M., Nguyen, T., Wang, L., et al. (2012). A program for annotating and predicting the effects of single nucleotide polymorphisms, SnpEff: SNPs in the genome of drosophila melanogaster strain w1118; iso-2; iso-3. Fly (Austin) 6 (2), 80–92. doi: 10.4161/fly.19695
Danecek, P., Auton, A., Abecasis, G., Albers, C. A., Banks, E., DePristo, M. A., et al. (2011). The variant call format and VCFtools. Bioinformatics 27 (15), 2156–2158. doi: 10.1093/bioinformatics/btr330
De Bie, T., Cristianini, N., Demuth, J. P., Hahn, M. W. (2006). CAFE: a computational tool for the study of gene family evolution. Bioinformatics 22 (10), 1269–1271. doi: 10.1093/bioinformatics/btl097
De La Torre, A. R., Lin, Y. C., Van de Peer, Y., Ingvarsson, P. K. (2015). Genome-wide analysis reveals diverged patterns of codon bias, gene expression, and rates of sequence evolution in Picea gene families. Genome Biol. Evol. 7 (4), 1002–1015. doi: 10.1093/gbe/evv044
de Oliveira, J. L., Morales, A. C., Stewart, B., Gruenheit, N., Engelmoer, J., Brown, S. B., et al. (2019). Conditional expression explains molecular evolution of social genes in a microbe. Nat. Commun. 10, 3284 (1). doi: 10.1038/s41467-019-11237-2
Des Marais, D. L., Rausher, M. D. (2008). Escape from adaptive conflict after duplication in an anthocyanin pathway gene. Nature 454 (7205), 762–765. doi: 10.1038/nature07092
De Smet, R., Adams, K. L., Vandepoele, K., Van Montagu, M. C., Maere, S., Van de Peer, Y. (2013). Convergent gene loss following gene and genome duplications creates single-copy families in flowering plants. Proc. Natl. Acad. Sci. U.S.A. 110 (8), 2898–2903. doi: 10.1073/pnas.1300127110
Drummond, D. A., Bloom, J. D., Adami, C., Wilke, C. O., Arnold, F. H. (2005). Why highly expressed proteins evolve slowly. Proc. Natl. Acad. Sci. U.S.A. 102 (40), 14338–14343. doi: 10.1073/pnas.0504070102
Du, J., Tian, Z., Sui, Y., Zhao, M., Song, Q., Cannon, S. B., et al. (2012). Pericentromeric effects shape the patterns of divergence, retention, and expression of duplicated genes in the paleopolyploid soybean. Plant Cell 24 (1), 21–32. doi: 10.1105/tpc.111.092759
Echave, J., Spielman, S. J., Wilke, C. O. (2016). Causes of evolutionary rate variation among protein sites. Nat. Rev. Genet. 17 (2), 109–121. doi: 10.1038/nrg.2015.18
Emms, D. M., Kelly, S. (2019). OrthoFinder: phylogenetic orthology inference for comparative genomics. Genome Biol. 20 (1), 238. doi: 10.1186/s13059-019-1832-y
Freeling, M. (2009). Bias in plant gene content following different sorts of duplication: tandem, whole-genome, segmental, or by transposition. Annu. Rev. Plant Biol. 60, 433–453. doi: 10.1146/annurev.arplant.043008.092122
Fu, M., Kang, H. K., Son, S. H., Kim, S. K., Nam, K. H. (2014). A subset of arabidopsis RAV transcription factors modulates drought and salt stress responses independent of ABA. Plant Cell Physiol. 55 (11), 1892–1904. doi: 10.1093/pcp/pcu118
Gaut, B. S., d'Ennequin, M. L., Peek, A. S., Sawkins, M. C. (2000). Maize as a model for the evolution of plant nuclear genomes. Proc. Natl. Acad. Sci. U. States America 97 (13), 7008–7015. doi: 10.1073/pnas.97.13.7008
Gaut, B. S., Wright, S. I., Rizzon, C., Dvorak, J., Anderson, L. K. (2007). Recombination: an underappreciated factor in the evolution of plant genomes. Nat. Rev. Genet. 8 (1), 77–84. doi: 10.1038/nrg1970
Glover, N. M., Daron, J., Pingault, L., Vandepoele, K., Paux, E., Feuillet, C., et al. (2015). Small-scale gene duplications played a major role in the recent evolution of wheat chromosome 3B. Genome Biol. 16 (1), 188. doi: 10.1186/s13059-015-0754-6
Gout, J. F., Lynch, M. (2015). Maintenance and loss of duplicated genes by dosage subfunctionalization. Mol. Biol. Evol. 32 (8), 2141–2148. doi: 10.1093/molbev/msv095
Guo, Y., Liu, J., Zhang, J., Liu, S., Du, J. (2017). Selective modes determine evolutionary rates, gene compactness and expression patterns in Brassica. Plant J. 91 (1), 34–44. doi: 10.1111/tpj.13541
Higgins, D. G., Sharp, P. M. (1988). CLUSTAL: a package for performing multiple sequence alignment on a microcomputer. Gene 73 (1), 237–244. doi: 10.1016/0378-1119(88)90330-7
Hu, B., Jin, J., Guo, A. Y., Zhang, H., Luo, J., Gao, G. (2015). GSDS 2.0: an upgraded gene feature visualization server. Bioinformatics 31 (8), 1296–1297. doi: 10.1093/bioinformatics/btu817
Huerta-Cepas, J., Szklarczyk, D., Heller, D., Hernández-Plaza, A., Forslund, S. K., Cook, H., et al. (2018). eggNOG 5.0: a hierarchical, functionally and phylogenetically annotated orthology resource based on 5090 organisms and 2502 viruses. Nucleic Acids Res. 47 (D1), D309–D314. doi: 10.1093/nar/gky1085
Hurst, L. D. (2002). The Ka/Ks ratio: diagnosing the form of sequence evolution. Trends Genet. 18 (9), 486. doi: 10.1016/s0168-9525(02)02722-1
Ibarra, I. L., Hollmann, N. M., Klaus, B., Augsten, S., Velten, B., Hennig, J., et al. (2020). Mechanistic insights into transcription factor cooperativity and its impact on protein-phenotype interactions. Nat. Commun. 11 (1). doi: 10.1038/s41467-019-13888-7
International Barley Genome Sequencing, C, Mayer, K. F., Waugh, R., Brown, J. W., Schulman, A., Langridge, P., et al. (2012). A physical, genetic and functional sequence assembly of the barley genome. Nature 491 (7426), 711–716. doi: 10.1038/nature11543
Jacquemin, J., Ammiraju, J. S., Haberer, G., Billheimer, D. D., Yu, Y., Liu, L. C., et al. (2014). Fifteen million years of evolution in the oryza genus shows extensive gene family expansion. Mol. Plant 7 (4), 642–656. doi: 10.1093/mp/sst149
Kim, D., Langmead, B., Salzberg, S. L. (2015). HISAT: a fast spliced aligner with low memory requirements. Nat. Methods 12 (4), 357–360. doi: 10.1038/nmeth.3317
Kimura, M., Ohta, T. (1974). On some principles governing molecular evolution. Proc. Natl. Acad. Sci. U.S.A. 71 (7), 2848–2852. doi: 10.1073/pnas.71.7.2848
Kourelis, J., van der Hoorn, R. A. L. (2018). Defended to the nines: 25 years of resistance gene cloning identifies nine mechanisms for r protein function. Plant Cell 30 (2), 285–299. doi: 10.1105/tpc.17.00579
Kumar, S., Stecher, G., Suleski, M., Hedges, S. B. (2017). TimeTree: a resource for timelines, timetrees, and divergence times. Mol. Biol. Evol. 34 (7), 1812–1819. doi: 10.1093/molbev/msx116
Langfelder, P., Horvath, S. (2008). WGCNA: an r package for weighted correlation network analysis. BMC Bioinf. 9, 559. doi: 10.1186/1471-2105-9-559
Leigh, J. W., Bryant, D. (2015). PopART: full-feature software for haplotype network construction. Methods Ecol. Evol. 6 (9), 1110–1116. doi: 10.1111/2041-210X.12410
Li, Y., Cao, K., Li, N., Zhu, G., Fang, W., Chen, C., et al. (2021). Genomic analyses provide insights into peach local adaptation and responses to climate change. Genome Res. 31 (4), 592–606. doi: 10.1101/gr.261032.120
Li, F. G., Fan, G. Y., Lu, C. R., Xiao, G. H., Zou, C. S., Kohel, R. J., et al. (2015). Genome sequence of cultivated upland cotton (Gossypium hirsutum TM-1) provides insights into genome evolution. Nat. Biotechnol. 33 (5), 524–530. doi: 10.1038/nbt.3208
Li, H., Handsaker, B., Wysoker, A., Fennell, T., Ruan, J., Homer, N., et al. (2009). The sequence Alignment/Map format and SAMtools. Bioinformatics 25 (16), 2078–2079. doi: 10.1093/bioinformatics/btp352
Li, G., Wang, L., Yang, J., He, H., Jin, H., Li, X., et al. (2021). A high-quality genome assembly highlights rye genomic characteristics and agronomically important genes. Nat. Genet. 53 (4), 574–584. doi: 10.1038/s41588-021-00808-z
Lin, X., Feng, C., Lin, T., Harris, A. J., Li, Y., Kang, M. (2022). Jackfruit genome and population genomics provide insights into fruit evolution and domestication history in China. Hortic. Res. 9, uhac173. doi: 10.1093/hr/uhac173
Lin, J., Zhang, W., Zhang, X., Ma, X., Zhang, S., Chen, S., et al. (2022). Signatures of selection in recently domesticated macadamia. Nat. Commun. 13 (1), 242. doi: 10.1038/s41467-021-27937-7
Lynch, M., Conery, J. S. (2000). The evolutionary fate and consequences of duplicate genes. Science 290 (5494), 1151–1155. doi: 10.1126/science.290.5494.1151
Lynch, M., Force, A. (2000). The probability of duplicate gene preservation by subfunctionalization. Genetics 154 (1), 459–473. doi: 10.1093/genetics/154.1.459
Ma, Y., Wang, J., Zhong, Y., Geng, F., Cramer, G. R., Cheng, Z. M. (2015). Subfunctionalization of cation/proton antiporter 1 genes in grapevine in response to salt stress in different organs. Hortic. Res. 2, 15031. doi: 10.1038/hortres.2015.31
Maki, H., Sakaoka, S., Itaya, T., Suzuki, T., Mabuchi, K., Amabe, T., et al. (2019). ANAC032 regulates root growth through the MYB30 gene regulatory network. Sci. Rep. 9 (1), 11358. doi: 10.1038/s41598-019-47822-0
Mao, Y., Botella, J. R., Liu, Y., Zhu, J. K. (2019). Gene editing in plants: progress and challenges. Natl. Sci. Rev. 6 (3), 421–437. doi: 10.1093/nsr/nwz005
Marone, D., Russo, M. A., Laido, G., De Leonardis, A. M., Mastrangelo, A. M. (2013). Plant nucleotide binding site-leucine-rich repeat (NBS-LRR) genes: active guardians in host defense responses. Int. J. Mol. Sci. 14 (4), 7302–7326. doi: 10.3390/ijms14047302
Mascher, M., Wicker, T., Jenkins, J., Plott, C., Lux, T., Koh, C. S., et al. (2021). Long-read sequence assembly: a technical evaluation in barley. Plant Cell 33 (6), 1888–1906. doi: 10.1093/plcell/koab077
Morton, B. R. (2003). The role of context-dependent mutations in generating compositional and codon usage bias in grass chloroplast DNA. J. Mol. Evol. 56 (5), 616–629. doi: 10.1007/s00239-002-2430-1
Nevo, E., Fu, Y. B., Pavlicek, T., Khalifa, S., Tavasi, M., Beiles, A. (2012). Evolution of wild cereals during 28 years of global warming in Israel. Proc. Natl. Acad. Sci. U.S.A. 109 (9), 3412–3415. doi: 10.1073/pnas.1121411109
Nole-Wilson, S., Tranby, T. L., Krizek, B. A. (2005). AINTEGUMENTA-like (AIL) genes are expressed in young tissues and may specify meristematic or division-competent states. Plant Mol. Biol. 57 (5), 613–628. doi: 10.1007/s11103-005-0955-6
O'Toole, A. N., Hurst, L. D., McLysaght, A. (2018). Faster evolving primate genes are more likely to duplicate. Mol. Biol. Evol. 35 (1), 107–118. doi: 10.1093/molbev/msx270
Panchy, N., Lehti-Shiu, M., Shiu, S. H. (2016). Evolution of gene duplication in plants. Plant Physiol. 171 (4), 2294–2316. doi: 10.1104/pp.16.00523
Pegueroles, C., Laurie, S., Alba, M. M. (2013). Accelerated evolution after gene duplication: a time-dependent process affecting just one copy. Mol. Biol. Evol. 30 (8), 1830–1842. doi: 10.1093/molbev/mst083
Pertea, M., Pertea, G. M., Antonescu, C. M., Chang, T. C., Mendell, J. T., Salzberg, S. L. (2015). StringTie enables improved reconstruction of a transcriptome from RNA-seq reads. Nat. Biotechnol. 33 (3), 290–295. doi: 10.1038/nbt.3122
Price, A. L., Patterson, N. J., Plenge, R. M., Weinblatt, M. E., Shadick, N. A., Reich, D. (2006). Principal components analysis corrects for stratification in genome-wide association studies. Nat. Genet. 38 (8), 904–909. doi: 10.1038/ng1847
Redillas, M. C. F. R., Jeong, J. S., Kim, Y. S., Jung, H., Bang, S. W., Choi, Y. D., et al. (2012). The overexpression of OsNAC9 alters the root architecture of rice plants enhancing drought resistance and grain yield under field conditions. Plant Biotechnol. J. 10 (7), 792–805. doi: 10.1111/j.1467-7652.2012.00697.x
Rose, L. E., Bittner-Eddy, P. D., Langley, C. H., Holub, E. B., Michelmore, R. W., Beynon, J. L. (2004). The maintenance of extreme amino acid diversity at the disease resistance gene, RPP13, in arabidopsis thaliana. Genetics 166 (3), 1517–1527. doi: 10.1534/genetics.166.3.1517
Rozas, J., Ferrer-Mata, A., Sanchez-DelBarrio, J. C., Guirao-Rico, S., Librado, P., Ramos-Onsins, S. E., et al. (2017). DnaSP 6: DNA sequence polymorphism analysis of Large data sets. Mol. Biol. Evol. 34 (12), 3299–3302. doi: 10.1093/molbev/msx248
Russell, J., Mascher, M., Dawson, I. K., Kyriakidis, S., Calixto, C., Freund, F., et al. (2016). Exome sequencing of geographically diverse barley landraces and wild relatives gives insights into environmental adaptation. Nat. Genet. 48 (9), 1024–1030. doi: 10.1038/ng.3612
Salman-Minkov, A., Sabath, N., Mayrose, I. (2016). Whole-genome duplication as a key factor in crop domestication. Nat. Plants 2, 16115. doi: 10.1038/nplants.2016.115
Sanderson, M. J. (2003). r8s: inferring absolute rates of molecular evolution and divergence times in the absence of a molecular clock. Bioinformatics 19 (2), 301–302. doi: 10.1093/bioinformatics/19.2.301
Santana, M. F., Silva, J. C., Batista, A. D., Ribeiro, L. E., da Silva, G. F., de Araujo, E. F., et al. (2012). Abundance, distribution and potential impact of transposable elements in the genome of Mycosphaerella fijiensis. BMC Genomics 13, 720. doi: 10.1186/1471-2164-13-720
Schnable, P. S., Ware, D., Fulton, R. S., Stein, J. C., Wei, F., Pasternak, S., et al. (2009). The B73 maize genome: complexity, diversity, and dynamics. Science 326 (5956), 1112–1115. doi: 10.1126/science.1178534
Schug, J., Schuller, W. P., Kappen, C., Salbaum, J. M., Bucan, M., Stoeckert, C. J., Jr. (2005). Promoter features related to tissue specificity as measured by Shannon entropy. Genome Biol. 6 (4), R33. doi: 10.1186/gb-2005-6-4-r33
Shannon, P., Markiel, A., Ozier, O., Baliga, N. S., Wang, J. T., Ramage, D., et al. (2003). Cytoscape: a software environment for integrated models of biomolecular interaction networks. Genome Res. 13 (11), 2498–2504. doi: 10.1101/gr.1239303
Suyama, M., Torrents, D., Bork, P. (2006). PAL2NAL: robust conversion of protein sequence alignments into the corresponding codon alignments. Nucleic Acids Res. 34, W609–W612. doi: 10.1093/nar/gkl315
Swaminathan, K., Peterson, K., Jack, T. (2008). The plant B3 superfamily. Trends Plant Sci. 13 (12), 647–655. doi: 10.1016/j.tplants.2008.09.006
Tatusov, R. L., Koonin, E. V., Lipman, D. J. (1997). A genomic perspective on protein families. Science 278 (5338), 631–637. doi: 10.1126/science.278.5338.631
Tylewicz, S., Tsuji, H., Miskolczi, P., Petterle, A., Azeez, A., Jonsson, K., et al. (2015). Dual role of tree florigen activation complex component FD in photoperiodic growth control and adaptive response pathways. Proc. Natl. Acad. Sci. U.S.A. 112 (10), 3140–3145. doi: 10.1073/pnas.1423440112
Vance, Z., Niezabitowski, L., Hurst, L. D., McLysaght, A. (2022). Evidence from drosophila supports higher duplicability of faster evolving genes. Genome Biol. Evol. 14 (1). doi: 10.1093/gbe/evac003
Vilella, A. J., Severin, J., Ureta-Vidal, A., Heng, L., Durbin, R., Birney, E. (2009). EnsemblCompara GeneTrees: complete, duplication-aware phylogenetic trees in vertebrates. Genome Res. 19 (2), 327–335. doi: 10.1101/gr.073585.107
Villanueva-Cañas, J. L., Laurie, S., Albà, M. M. (2013). Improving genome-wide scans of positive selection by using protein isoforms of similar length. Genome Biol. Evol. 5 (2), 457–467. doi: 10.1093/gbe/evt017
Voorrips, R. E. (2002). MapChart: software for the graphical presentation of linkage maps and QTLs. J. Hered. 93 (1), 77–78. doi: 10.1093/jhered/93.1.77
Walsh, J. B. (1995). How often do duplicated genes evolve new functions? Genetics 139 (1), 421–428. doi: 10.1093/genetics/139.1.421
Wang, M., Li, J., Qi, Z., Long, Y., Pei, L., Huang, X., et al. (2022). Genomic innovation and regulatory rewiring during evolution of the cotton genus Gossypium. Nat. Genet. 54 (12), 1959-1971. doi: 10.1038/s41588-022-01237-2
Wang, P., Luo, Y., Huang, J., Gao, S., Zhu, G., Dang, Z., et al. (2020). The genome evolution and domestication of tropical fruit mango. Genome Biol. 21 (1), 60. doi: 10.1186/s13059-020-01959-8
Wang, Y., Tang, H., Debarry, J. D., Tan, X., Li, J., Wang, X., et al. (2012). MCScanX: a toolkit for detection and evolutionary analysis of gene synteny and collinearity. Nucleic Acids Res. 40 (7), e49. doi: 10.1093/nar/gkr1293
Wu, T., Hu, E., Xu, S., Chen, M., Guo, P., Dai, Z., et al. (2021). clusterProfiler 4.0: a universal enrichment tool for interpreting omics data. Innovation (Camb.) 2 (3), 100141. doi: 10.1016/j.xinn.2021.100141
Yanai, I., Benjamin, H., Shmoish, M., Chalifa-Caspi, V., Shklar, M., Ophir, R., et al. (2004). Genome-wide midrange transcription profiles reveal expression level relationships in human tissue specification. Bioinformatics 21 (5), 650–659. doi: 10.1093/bioinformatics/bti042
Yang, Z. (2007). PAML 4: phylogenetic analysis by maximum likelihood. Mol. Biol. Evol. 24 (8), 1586–1591. doi: 10.1093/molbev/msm088
Yang, L., Gaut, B. S. (2011). Factors that contribute to variation in evolutionary rate among Arabidopsis genes. Mol. Biol. Evol. 28 (8), 2359–2369. doi: 10.1093/molbev/msr058
Yang, Q., Yu, C. H., Zhao, F. Z., Dang, Y. K., Wu, C., Xie, P. C., et al. (2019). eRF1 mediates codon usage effects on mRNA translation efficiency through premature termination at rare codons. Nucleic Acids Res. 47 (17), 9243–9258. doi: 10.1093/nar/gkz710
Yang, G., Zhang, Y., Wei, X., Cui, L., Nie, X. (2022). Genetic diversity of transcription factor genes in Triticum and mining for promising haplotypes for beneficial agronomic traits. Front. Plant Sci. 13. doi: 10.3389/fpls.2022.899292
Yu, H., Li, J. Y. (2022). Breeding future crops to feed the world through de novo domestication. Nat. Commun. 13 (1). doi: 10.1038/s41467-022-28732-8
Yu, J., Wang, J., Lin, W., Li, S., Li, H., Zhou, J., et al. (2005). The genomes of oryza sativa: a history of duplications. PloS Biol. 3 (2), e38. doi: 10.1371/journal.pbio.0030038
Zeng, Y., Pu, X., Yang, J., Du, J., Yang, X., Li, X., et al. (2018). Preventive and therapeutic role of functional ingredients of barley grass for chronic diseases in human beings. Oxid. Med. Cell Longev. 2018, 3232080. doi: 10.1155/2018/3232080
Zhang, Y. M., Shao, Z. Q., Wang, Q., Hang, Y. Y., Xue, J. Y., Wang, B., et al. (2016). Uncovering the dynamic evolution of nucleotide-binding site-leucine-rich repeat (NBS-LRR) genes in brassicaceae. J. Integr. Plant Biol. 58 (2), 165–177. doi: 10.1111/jipb.12365
Zhang, S., Xia, Z., Li, C., Wang, X., Lu, X., Zhang, W., et al. (2022). Chromosome-scale genome assembly provides insights into speciation of allotetraploid and massive biomass accumulation of elephant grass (Pennisetum purpureum schum.). Mol. Ecol. Resour. 22 (6), 2363–2378. doi: 10.1111/1755-0998.13612
Zhang, J., Yang, J. R. (2015). Determinants of the rate of protein sequence evolution. Nat. Rev. Genet. 16 (7), 409–420. doi: 10.1038/nrg3950
Keywords: barley, gene family expansion, gene duplication, evolutionary rate, expression pattern, genetic diversity
Citation: Tao W, Li R, Li T, Li Z, Li Y and Cui L (2023) The evolutionary patterns, expression profiles, and genetic diversity of expanded genes in barley. Front. Plant Sci. 14:1168124. doi: 10.3389/fpls.2023.1168124
Received: 17 February 2023; Accepted: 28 March 2023;
Published: 26 April 2023.
Edited by:
Jemaa Essemine, Partner Institute for Computational Biology, ChinaReviewed by:
Sathiyamoorthy Subramaniyam, Insilicogen Inc, Republic of KoreaCopyright © 2023 Tao, Li, Li, Li, Li and Cui. This is an open-access article distributed under the terms of the Creative Commons Attribution License (CC BY). The use, distribution or reproduction in other forums is permitted, provided the original author(s) and the copyright owner(s) are credited and that the original publication in this journal is cited, in accordance with accepted academic practice. No use, distribution or reproduction is permitted which does not comply with these terms.
*Correspondence: Yihan Li, bGl5aWhhbkBqeGF1LmVkdS5jbg==; Licao Cui, Y3VpbGljYW9AanhhdS5lZHUuY24=
†These authors have contributed equally to this work
Disclaimer: All claims expressed in this article are solely those of the authors and do not necessarily represent those of their affiliated organizations, or those of the publisher, the editors and the reviewers. Any product that may be evaluated in this article or claim that may be made by its manufacturer is not guaranteed or endorsed by the publisher.
Research integrity at Frontiers
Learn more about the work of our research integrity team to safeguard the quality of each article we publish.