 Adrian L. Cabral1
 Yuefeng Ruan1*
 Richard D. Cuthbert1*
 Lin Li1
 Wentao Zhang2
 Kerry Boyle2
 Samia Berraies1
 Maria Antonia Henriquez3
 Andrew Burt4Santosh Kumar5
 Pierre Fobert6
 Isabelle Piche1
 Firdissa E. Bokore1
 Brad Meyer1
 Jatinder Sangha1
 Ron E. Knox1
- 1Swift Current Research and Development Centre, Agriculture and Agri-Food Canada, Swift Current, SK, Canada
- 2Aquatic and Crop Resource Development Research Centre, National Research Council of Canada, Saskatoon, SK, Canada
- 3Morden Research and Development Centre, Agriculture and Agri-Food Canada, Morden, MB, Canada
- 4Ottawa Research and Development Centre, Agriculture and Agri-Food Canada, Ottawa, ON, Canada
- 5Brandon Research and Development Centre, Agriculture and Agri-Food Canada, Brandon, MB, Canada
- 6Aquatic and Crop Resource Development Research Centre, National Research Council of Canada, Ottawa, ON, Canada
Fusarium head blight (FHB) is a highly destructive fungal disease of wheat to which host resistance is quantitatively inherited and largely influenced by the environment. Resistance to FHB has been associated with taller height and later maturity; however, a further understanding of these relationships is needed. An association mapping panel (AMP) of 192 predominantly Canadian spring wheat was genotyped with the wheat 90K single-nucleotide polymorphism (SNP) array. The AMP was assessed for FHB incidence (INC), severity (SEV) and index (IND), days to anthesis (DTA), and plant height (PLHT) between 2015 and 2017 at three Canadian FHB-inoculated nurseries. Seven multi-environment trial (MET) datasets were deployed in a genome-wide association study (GWAS) using a single-locus mixed linear model (MLM) and a multi-locus random SNP-effect mixed linear model (mrMLM). MLM detected four quantitative trait nucleotides (QTNs) for INC on chromosomes 2D and 3D and for SEV and IND on chromosome 3B. Further, mrMLM identified 291 QTNs: 50 (INC), 72 (SEV), 90 (IND), 41 (DTA), and 38 (PLHT). At two or more environments, 17 QTNs for FHB, DTA, and PLHT were detected. Of these 17, 12 QTNs were pleiotropic for FHB traits, DTA, and PLHT on chromosomes 1A, 1D, 2D, 3B, 5A, 6B, 7A, and 7B; two QTNs for DTA were detected on chromosomes 1B and 7A; and three PLHT QTNs were located on chromosomes 4B and 6B. The 1B DTA QTN and the three pleiotropic QTNs on chromosomes 1A, 3B, and 6B are potentially identical to corresponding quantitative trait loci (QTLs) in durum wheat. Further, the 3B pleiotropic QTN for FHB INC, SEV, and IND co-locates with TraesCS3B02G024900 within the Fhb1 region on chromosome 3B and is ~3 Mb from a cloned Fhb1 candidate gene TaHRC. While the PLHT QTN on chromosome 6B is putatively novel, the 1B DTA QTN co-locates with a disease resistance protein located ~10 Mb from a Flowering Locus T1-like gene TaFT3-B1, and the 7A DTA QTN is ~5 Mb away from a maturity QTL QMat.dms-7A.3 of another study. GWAS and QTN candidate genes enabled the characterization of FHB resistance in relation to DTA and PLHT. This approach should eventually generate additional and reliable trait-specific markers for breeding selection, in addition to providing useful information for FHB trait discovery.
Introduction
Bread wheat (Triticum aestivum L.) is a hexaploid species (2n = 6x = 42; AABBDD) with a 17-gigabase-pair genome (Brenchley et al., 2012) and accounts for approximately 95% of the wheat grown worldwide (Dubcovsky and Dvorak, 2007; Shewry, 2009). Fusarium head blight (FHB) or scab of wheat is a yield- and quality-limiting disease caused primarily by the fungus Fusarium graminearum Schwabe [teleomorph Gibberella zeae (Schwein.) Petch]. Globally, FHB ranks second only to leaf rust as a disease responsible for the largest yield losses in wheat (Savary et al., 2019). FHB symptoms include premature bleached spikelets, discolored rachises, and white or pink Fusarium-damaged kernels (FDK), which weigh less than healthy kernels (McCartney et al., 2007). Fusarium-infected kernels contain a mycotoxin deoxynivalenol (DON), which is a contaminant in commercial foods and cattle feed and is toxic to humans and animals (Desjardins and Hohn, 1997; Gilbert and Tekauz, 2000; Fung and Clark, 2004).
Resistance to FHB has been classified into three main types: Type I (resistance to initial infection), Type II (resistance to spread within the spike), and Type III resistance to the accumulation of DON in infected kernels (Schroeder and Christensen, 1963; Mesterhazy, 1995; Parry et al., 1995). FHB severity (SEV) or Type II resistance quantitative trait loci (QTLs) on chromosome arms 3BS and 6BS were detected in the Chinese wheat cultivar Sumai 3 (Waldron et al., 1999; Anderson et al., 2001). Molecular markers for the 3BS QTL designated as Fhb1 (Bai et al., 1999; Waldron et al., 1999; Anderson et al., 2001; Zhou et al., 2002; Guo et al., 2003; Liu and Anderson, 2003a; Liu and Anderson, 2003b; Yang et al., 2003; Cuthbert et al., 2006; Liu et al., 2006; Pumphrey et al., 2007; Bernardo et al., 2012; Randhawa et al., 2013) and the 6BS QTL or Fhb2 (Cuthbert et al., 2007; Zhao et al., 2018) have been widely deployed toward the development of new FHB-tolerant cultivars in global wheat breeding programs. Further, Fhb4 (Xue et al., 2010) and Sumai 3-derived Fhb5 on chromosome 5AS (Xue et al., 2011) are two of the well-studied loci for FHB incidence (INC) or Type I resistance. Of the above four loci, Fhb1 is a major, stable locus estimated to confer an average reduction of 27% in FDK of spring wheat (Pumphrey et al., 2007). However, on its own, Fhb1 does not provide effective resistance to FHB (McMullen et al., 2012). Thus far, two candidate genes at the Fhb1 locus have been cloned: a pore-forming toxin-like (PFT) gene (Rawat et al., 2016) and a haplotype Clark histidine-rich calcium-binding (TaHRC) protein gene (Su et al., 2019).
Inverse correlations of FHB Type I and II resistances with plant height (PLHT) have been reported (Paillard et al., 2004; Schmolke et al., 2005). Further, increased FHB symptoms have been observed in genotypes carrying the reduced plant height genes, Rht1 (Rht-B1) on chromosome 4B (Gale et al., 1975), Rht2 (Rht-D1) on chromosome 4D (Gale and Marshall, 1976), or Rht8 on chromosome 2D (Hilton et al., 1999; Steiner et al., 2004; Miedaner and Voss, 2008; Srinivasachary et al., 2008; Srinivasachary et al., 2009; Mao et al., 2010). Regarding days to anthesis (DTA), McCartney et al. (2007) found that FHB resistance QTLs do not have major effects on anthesis date and suggested that improvements in FHB resistance could be achieved without adverse changes in DTA. Further, evaluation studies of FHB Type II resistance under field conditions have been undertaken using point inoculations, and back-pack and tractor-mounted sprays (Buerstmayr et al., 2002; Buerstmayr et al., 2003), mainly taking into consideration the environmental conditions around anthesis and rarely the effect of DTA per se. A recent study by Franco et al. (2021) used DTA as a covariate or source of variation in a prediction model for spring wheat FHB Type II resistance in several field environments and found DTA to explain 26% of the total phenotypic variation in FHB severity or Type II resistance.
Among approaches to identify FHB resistances, enhance breeding selection, and eventually limit losses, marker-assisted selection (MAS) is widely used (Bai and Shaner, 2004; Anderson, 2007; Miedaner and Korzun, 2012). Genome-wide association studies (GWASs) of FHB resistance (Buerstmayr et al., 2020), PLHT, and DTA can help detect trait-specific loci for the characterization of FHB in relation to PLHT and DTA (Sari et al., 2018; Sari et al., 2020). An understanding of the types of association (i.e., linkage or pleiotropy) between loci for FHB resistance and the said traits is essential in designing predictive markers for MAS (Sari et al., 2020). Quantitative trait nucleotides (QTNs) (Long and Langley, 1999) are polymorphic sites in genes corresponding to the QTLs and are responsible for variation in the trait phenotype (Mackay, 2001). When compared to linkage studies, GWAS has a greater power to detect associations between a QTN and the trait phenotype, even after correcting for multiple tests for association (Risch and Merikangas, 1996; Mackay, 2001). Multi-locus GWAS models (Wang et al., 2016a, Wang et al., 2016b) quantify the effects of multiple loci and are hence better suited for the analyses of quantitative traits when compared to single-locus models, which might often fail to detect small-effect loci influencing complex traits (Lan et al., 2020; Fernandes et al., 2022). The objectives of this study were to perform multi-locus GWAS analyses of a bread wheat association mapping panel (AMP) in order to a) detect QTNs that would help characterize FHB resistance, in relation to DTA and PLHT, and b) provide detail on physical locations of identified QTNs and their corresponding high-confidence candidate genes, as well as other proximal disease resistance, maturity, and PLHT genes.
Materials and methods
Plant material and multi-environment trials
An AMP comprising 192 predominantly Canadian spring wheat cultivars was assessed for FHB INC and SEV in multi-environment trials (METs) conducted between 2015 and 2017 at the three Agriculture and Agri-Food Canada (AAFC) FHB-inoculated nurseries near Morden (MDN) and Brandon (BDN) in Manitoba, and Ottawa (OWA) in Ontario, Canada. The panel comprised cultivar Sumai 3 with superior FHB resistance and its Canadian derivatives (AAC Brandon, AAC Elie, Cardale, and AC Carberry), derived from parents Alsen and ND744 (Zhu et al., 2019). However, both parents Alsen and ND744 are not part of the AMP. Further, the panel also comprised Brazilian cultivar Frontana, its derivative Neepawa, and Neepawa derivatives Stettler, Katepwa, and AC Barrie, in addition to 75 lines taken from registration trial collections of Canadian Western and Central Bread Wheat, Parkland, General Purpose, Hard White, and High Yielding Wheat (Supplementary Material 1). At all nursery sites, entries were replicated twice in a randomized complete block design (RCBD). A single dataset on INC, SEV, DTA, and PLHT was generated for each of the six environments (MDN 2015, MDN 2016, MDN 2017, BDN 2015, BDN 2016, and OWA 2017), with the exception of the MDN 2015 environment, which had two datasets. Hence, a total of seven MET datasets from six environments were utilized for the GWAS analyses. These included four datasets from MDN (MDN15-1, MDN15-2, MDN16, and MDN17), two from BDN (BDN15 and BDN16), and one from OWA (OWA17). The two MDN 2015 environment datasets (MDN15-1 and MDN15-2) on FHB INC and SEV were recorded a few days apart.
FHB inoculum and disease assessment
To facilitate the development of FHB disease symptoms, artificial inoculation with F. graminearum isolates was carried out at the MET nursery sites, as described in Ruan et al. (2020). Briefly, 2–3 weeks prior to heading or when early lines were at the four- to five-leaf stage, corn spawn inoculum containing a mixture of four F. graminearum isolates [HSW-15-39 (3-ADON), HSW-15-87 (3-ADON), and HSW-15-27 (15-ADON), and HSW-15-57 (15-ADON)] from Dr. Henriquez’s FHB culture collection was applied at AAFC’s Morden and Brandon FHB nurseries; the inoculum mixture was spread (8 g/m row) twice, 1 week apart. Plots were irrigated thrice a week using Cadman Irrigation travellers with Briggs booms at Morden and with an overhead irrigator system at Brandon. At the Ottawa nursery, F. graminearum inoculum was prepared at a 1:1 ratio mixture of corn and barley kernels inoculated with three isolates [DAOMC178148 (15-ADON chemotype), DAOMC212678 (15-ADON chemotype), and DAOMC232369 (3-ADON chemotype)] obtained from the Canadian Collection of Fungal Cultures at the Ottawa Research and Development Centre. The three isolates collected locally were chosen for their high DON-producing capacity. Inoculation with 12 g of fresh inoculum was performed twice, with the first application occurring when the earliest lines started stem elongation, before flag leaf emergence (approx. Zadoks stage 31–36), and again 2 weeks later. Plots were irrigated daily applying approximately 1.5 cm of rain equivalent with wedge drive impact sprinklers. At approximately 21 days post-anthesis, the proportion of infected spikes per row (INC) and the average infected spikelets per head (SEV) were assessed visually and recorded as a percentage on a 0–100 scale (Stack and McMullen, 1985). The FHB disease index (IND) value for a given genotype was deduced from its INC and SEV ratings using the formula INC × SEV/100 and expressed as a percentage. The MDN 2015 environment had two datasets (MDN15-1 and MDN15-2), each with INC and SEV ratings recorded a few days apart. PLHT and DTA were recorded only for the MDN 2015, 2016, and 2017 environments.
Statistical data analyses
Statistical analyses of FHB datasets were performed separately for each of the three trial locations at BDN, MDN, and OWA. With the use of the lme4 package (Bates et al., 2015) in R version 4.2.1 (R Development Core Team, 2019), best linear unbiased prediction (BLUP) values for INC, SEV, IND, DTA, and PLHT belonging to a single location, across multiple years, were fitted with a mixed linear model (M1) via the equation Yij = µ + Gi + Ej + GEij + eij, where Yij is the phenotypic trait values of genotype i in environment j, µ is the population mean, Gi is the effect of genotype i, Ej is the effect of environment (location-year) j, GEij is the G × E interaction between genotype i and environment j, and eij is the residual effect associated with genotype i in environment j. The restricted maximum likelihood (REML) method was used to determine variance components (VCs). VCs were used to obtain broad sense heritability (H2) estimates for individual traits in a given environment, where replication is nested within the environment, using the formula H2 = σ2G/(σ2G + σ2GY/y + σ2GL/l + σ2GYL/yl + σ2e/ply), where σ2G is the genetic variance; σ2GY is the variance of the Genotype × Year interaction; σ2GL and σ2GYL are the interaction variances of the Genotype × Location, and Genotype × Year × Location, respectively; and σ2e is the error variance. Further, y is the number of years in which trials were conducted, l is the number of trial locations, and p is the total number of replications per location. Three-year (2015–2017) data on PLHT and DTA from MDN were averaged separately and deployed in a correlation analysis with FHB traits for BDN and OWA environments. An analysis of variance (ANOVA) for FHB traits across environments was performed using the aov function of the dplyr package in R to determine the effects of genotype (G), environment (E), and genotype-by-environment (G × E) variances on FHB INC, SEV, and IND.
DNA extraction, genotyping, and data processing
Genomic DNA (gDNA) extraction from freeze-dried seedling leaves of the 192 cultivars was performed using a cetyltrimethylammonium bromide (CTAB)-based method. An automated AutoGen DNA isolation system (AutoGen, Holliston, MA, USA) and a Quant-iT™ PicoGreen dsDNA Assay Kit (Thermo Fisher Scientific Inc., Bartlesville, OK, USA) were deployed to obtain final gDNA sample concentrations of 50 ng/μl for genotyping. The AMP was genotyped with the wheat 90K single-nucleotide polymorphism (SNP) Infinium® Beadchip (Wang et al., 2014). SNP call raw data were curated and imported into Genome Studio Software to filter SNP markers with greater than 20% missing data and minor allele frequency (MAF) of less than 5%. After filtering, an initial 9,084 SNPs were obtained, of which a total of 5,441 SNPs with corresponding International Wheat Genome Sequencing Consortium (IWGSC) RefSeq v1.0 physical map locations were used in this study.
Population structure, LD, kinship, and principal components
To infer the population genetic structure of the AMP, Structure® software (Pritchard et al., 2000) was deployed to determine the true number of clusters (K) or sub-populations within the AMP, using the Evanno method (Evanno et al., 2005). Run-parameters included length of burn-in iterations and Markov chain Monte Carlo (MCMC) simulations of 10,000 each, for K = 2–9 clusters, with 10 replications per value of K. Output from Structure was processed with the Structure Harvester® (Earl and VonHoldt, 2012) program and visualized on its website (https://taylor0.biology.ucla.edu/structureHarvester/). Structure Harvester uses an algorithm to execute the Evanno method, with a minimum of three sequential values of K and three replicates, and produces three plots, one of which uses a Delta K statistic to determine the number of K groups. To visualize relatedness or similarity among genotypes, a dimensionless Constellation plot depicting the hierarchical clustering patterns of the AMP was generated in JMP® Version 17 (SAS Institute Inc., Cary, NC, USA). In TASSEL (Trait Analysis by aSSociation, Evolution, and Linkage) 5 (Bradbury et al., 2007), a genotypic file in the HapMap format, with physical map locations for 5,441 SNP markers and their corresponding calls on 192 lines, was uploaded. The HapMap file was masked and subject to a linkage disequilibrium K-number neighbor imputation (LDKNNi) algorithm (Money et al., 2015) to replace missing calls and improve the overall accuracy of the data. Next, the genotypic, genotypic-masked, and genotypic-masked LDKNNi files were combined and evaluated for imputation accuracy.
LD decay, principal component analyses (PCAs), and relatedness or kinship analyses were estimated in TASSEL 5. An LD statistics output file from TASSEL 5 was imported to R to generate a scatter plot using the ggplot2 function. The scatter plot helped visualize and determine LD decay on a whole-genome basis. To estimate kinship, the HapMap genotype data file was uploaded to TASSEL 5 and processed to output a.csv kinship (K-matrix) file. For PCA, the HapMap, phenotypic data file, and a population structure Q-matrix file (from the Structure run) were uploaded to TASSEL 5 to generate a.csv PCA output file. Both PCA and kinship.csv files were used as input for the GWAS analyses.
GWAS analyses
To identify loci associated with FHB traits, DTA, and PLHT, GWAS was performed separately for all six individual environments. Both single-locus mixed linear model (MLM) and multi-locus random SNP effect-mixed linear model (mrMLM) were deployed to compare and validate marker–trait associations. Further, to assess the consistency or reproducibility of QTNs detected from a multi-locus GWAS of individual environments, a combined multi-locus GWAS analysis using entry trait means based on all six environments was performed. With the use of the GAPIT (Genome Association and Prediction Integrated Tool) 3 package (Lipka et al., 2012; Tang et al., 2016; Wang and Zhang, 2021) in R, datasets were fitted with a single-locus MLM. Next, datasets were analyzed with an mrMLM (Wang et al., 2016a; Wang et al., 2016b), also performed in R with the mrMLM v4.0.2 software, which integrates six methods for QTN detection (Zhang et al., 2020). These six methods include mrMLM (Wang et al., 2016), FASTmrMLM (Tamba and Zhang, 2018), FASTmrEMMA (Wen et al., 2018), pLARmEB (Zhang et al., 2017), pKWmEB (Ren et al., 2018), and ISIS EM-BLASSO (Tamba et al., 2017). For both models, kinship (K-matrix) and PCA or Q-matrix.csv files, along with HapMap and phenotypic data files, were used as input for the GWAS analyses. In the mrMLM method, QTNs with a limit of detection (LOD) score greater than 3 and appearing in two or more environments were considered statistically significant. However, in the single-locus MLM method, QTNs were considered statistically significant if they exceeded a more stringent threshold of −log10(p) = 5, which is based on a critical p-value (α = 0.05) subject to a Bonferroni correction of 0.05/n, where n is the number of SNP markers (He et al., 2019).
QTN nomenclature, physical mapping, and candidate gene identification
Statistically significant QTNs detected across all environments by single-locus MLM and multi-locus mrMLM methods were numbered from 1 to 291. In most cases, the same SNP was associated with one or more traits per environment, or across environments. Hence, to refer to all QTNs associated with a given trait or traits, as a single entity, the chromosomal location followed by QTN numbers is given in the QTN name. For example, QTN4B_144-226 is the collective QTN name, which represents two PLHT QTNs (144_Tdurum_contig42229_113 and 226_Tdurum_contig42229_113) detected on chromosome 4B.
The IWGSC reference genome RefSeq v1.0 was used for the physical positioning of QTNs and candidate genes detected from the GWAS analyses. The RefSeq v1.0 was preferred over RefSeq v2.0 and the current RefSeq v2.1 since it provided all QTN-associated candidate gene annotations. However, for better context, the current/new physical locations of updated candidate gene IDs (as per RefSeq v2.1) have also been provided in all MET dataset tables. For candidate gene detection, 90K SNP nucleotide sequences were subject to a nucleotide-BLAST (BLASTn) basic search with an expected threshold of 0.0001 (maximum E-value 10−4) on the online IWGSC RefSeq v2.1 database (https://urgi.versailles.inrae.fr/blast_iwgsc). High-confidence Traes gene IDs (as per RefSeq v1.0) were each searched in Ensemble Plants (http://plants.ensembl.org/index.html) and UniProt (https://www.uniprot.org/) databases to obtain their corresponding gene functional descriptions.
Results
Variation in FHB, DTA, and PLHT trait phenotypes
Among the seven MET datasets from the Brandon, Morden, and Ottawa nurseries (Supplementary Material 1), OWA17 had the highest mean FHB INC rating of 85.1%, followed by overall mean ratings of 78.9% at BDN and 68.8% at MDN (Table 1). For FHB SEV, the highest overall mean rating of 56.1% was observed at BDN, followed by 42.4% at MDN and a mean SEV rating of 41.2% for the OWA 2017 environment. Overall mean ratings for FHB IND were the highest (47.8%) at BDN, followed by 30.3% at MDN and 36% at OWA. Broad-sense heritability for FHB measurements ranged from 55% to 82% for INC, 56% to 83% for SEV, and 58% to 83% for IND. For the MDN 2015 (MDN15-1 dataset), MDN 2016, and MDN 2017 environments, the overall means for DTA was 72 days (ranging from 47 to 72 days) and 89.7 cm for PLHT (ranging from 44 to 121 cm). Across environments, broad-sense heritability (H2) observed for PLHT was 92% and 87% for DTA (Table 1).
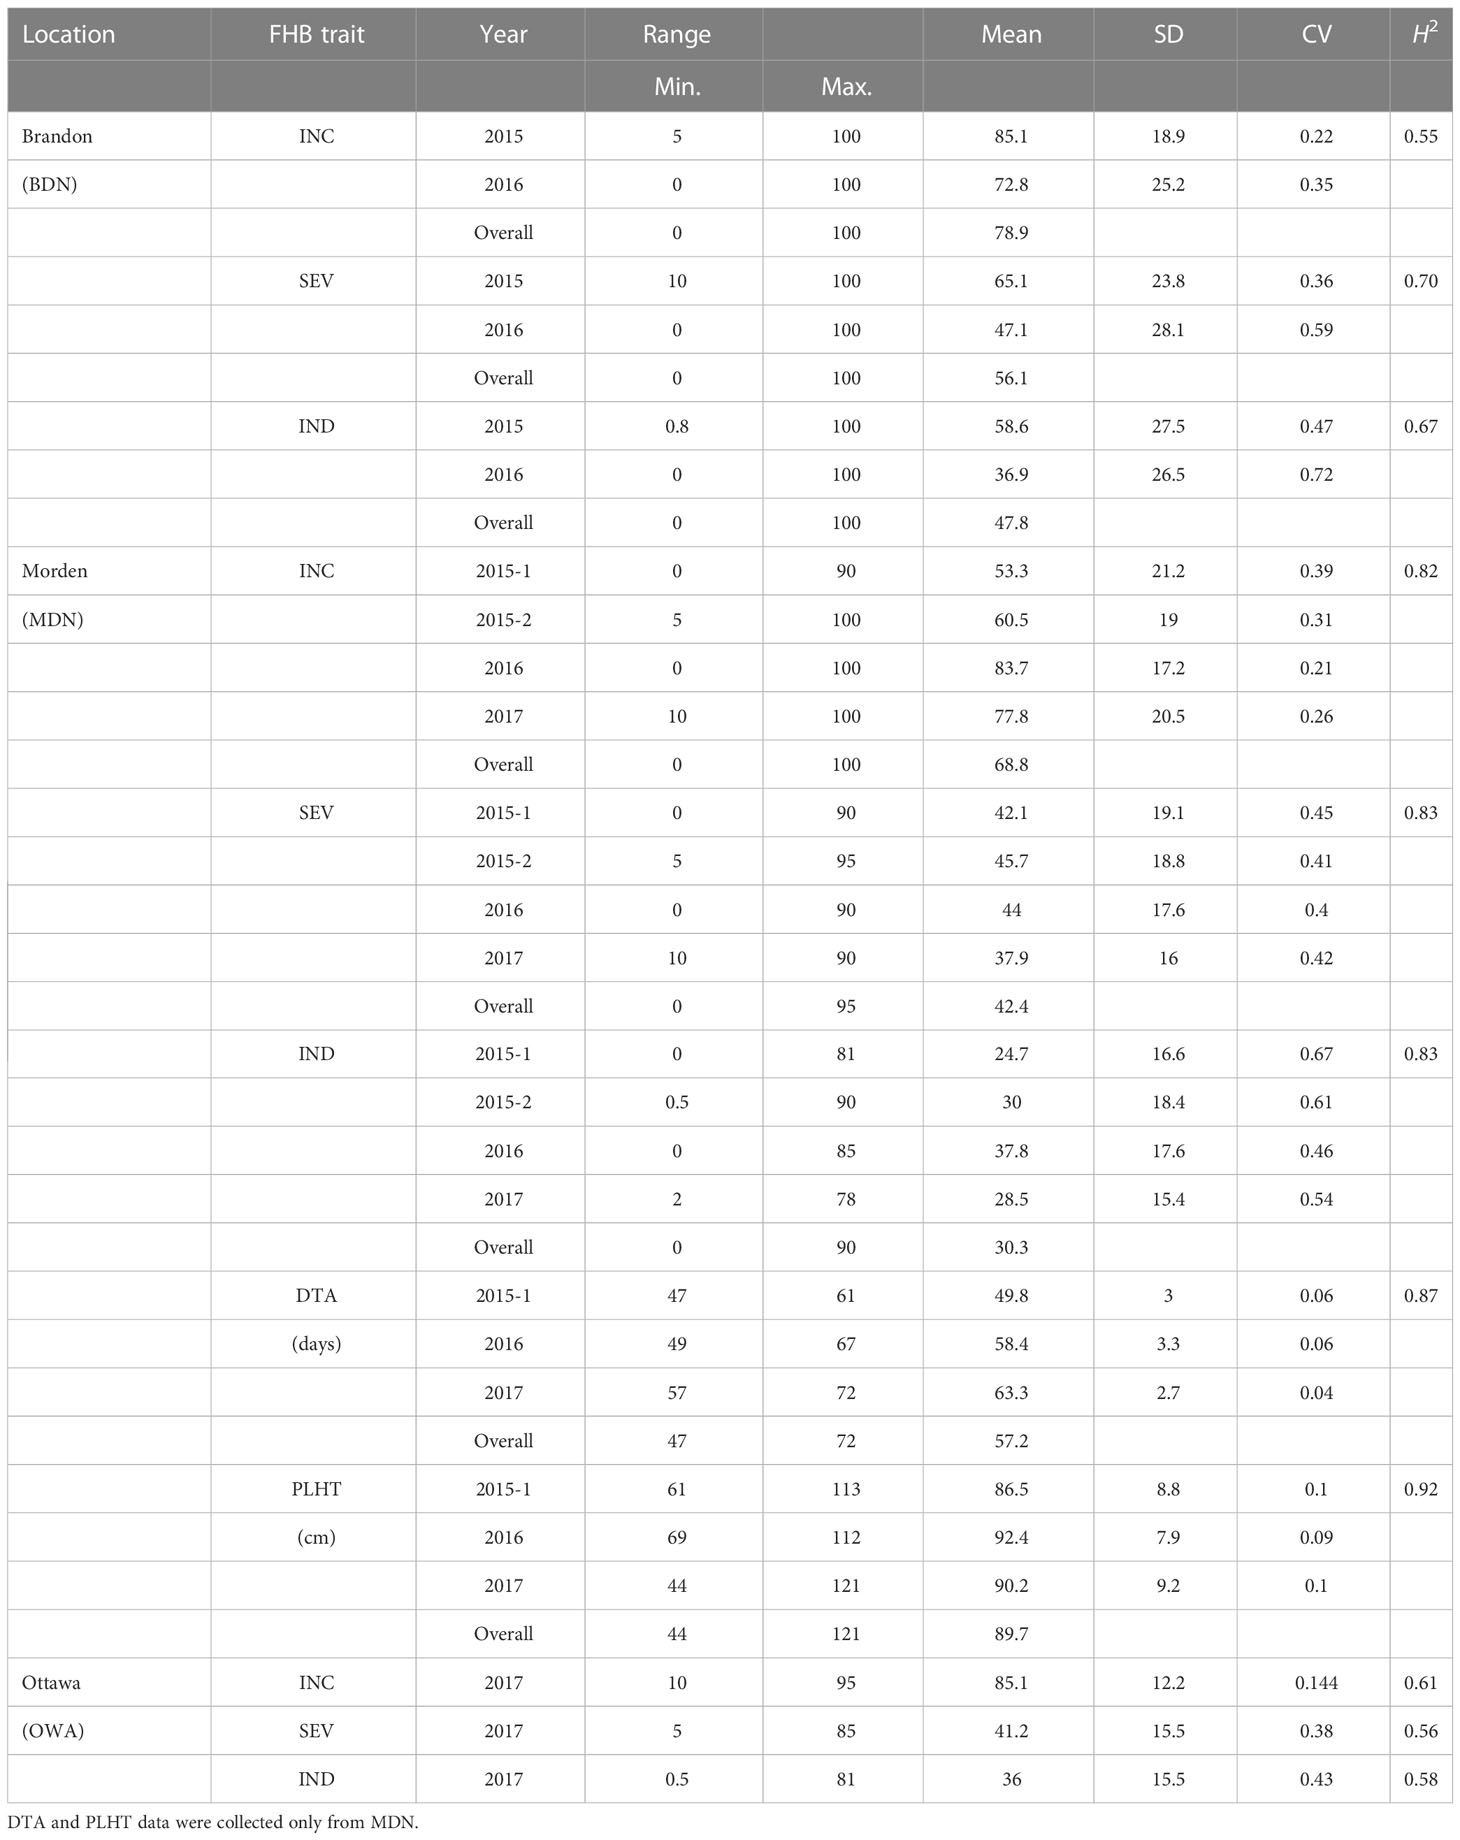
Table 1 Range, mean, standard deviation (SD), coefficient of variation (CV), and broad-sense heritability (H2) values for FHB incidence (INC), severity (SEV), index (IND), days to anthesis (DTA), and plant height (PLHT) from trial datasets of the AAFC nurseries at Ottawa (OWA), Brandon (BDN), and Morden (MDN) between 2015 and 2017.
In the three MDN environments (MDN 2015, 2016, and 2017), positive and highly significant correlations ranging from 0.24 to 0.97 were observed among FHB INC, SEV, and IND traits. Overall weak, inverse correlations were observed between INC and PLHT (−0.14 to −0.36), SEV and PLHT (−0.24), and IND and PLHT (−0.30). DTA had overall weak inverse correlations with INC and with IND (−0.23 to −0.43), as well as weak positive correlations (0.18 to 0.2) with SEV (Figure 1). For FHB traits at the two BDN environments (BDN 2015 and 2016), highly significant and strong correlations ranging between 0.75 and 0.98 were observed between IND, SEV, and IND. Overall, weak, inverse correlations were observed between IND and PLHT (−0.16), INC and DTA (−0.26 to −0.39), SEV and DTA (−0.27), and IND and DTA (−0.33). In the OWA 2017 environment, highly significant and moderate-to-strong correlations of 0.58–0.98 were observed between INC, SEV, and IND traits. Finally, weak inverse correlations were observed between INC and PLHT (−0.20), IND and PLHT (−0.15), INC and DTA (−0.20), SEV and DTA (−0.23), and IND and DTA (−0.23; Figure 1). An ANOVA performed across environments revealed significant effects of genotype (G), environment (E), and G × E interactions on FHB INC, SEV, and IND (Table 2).
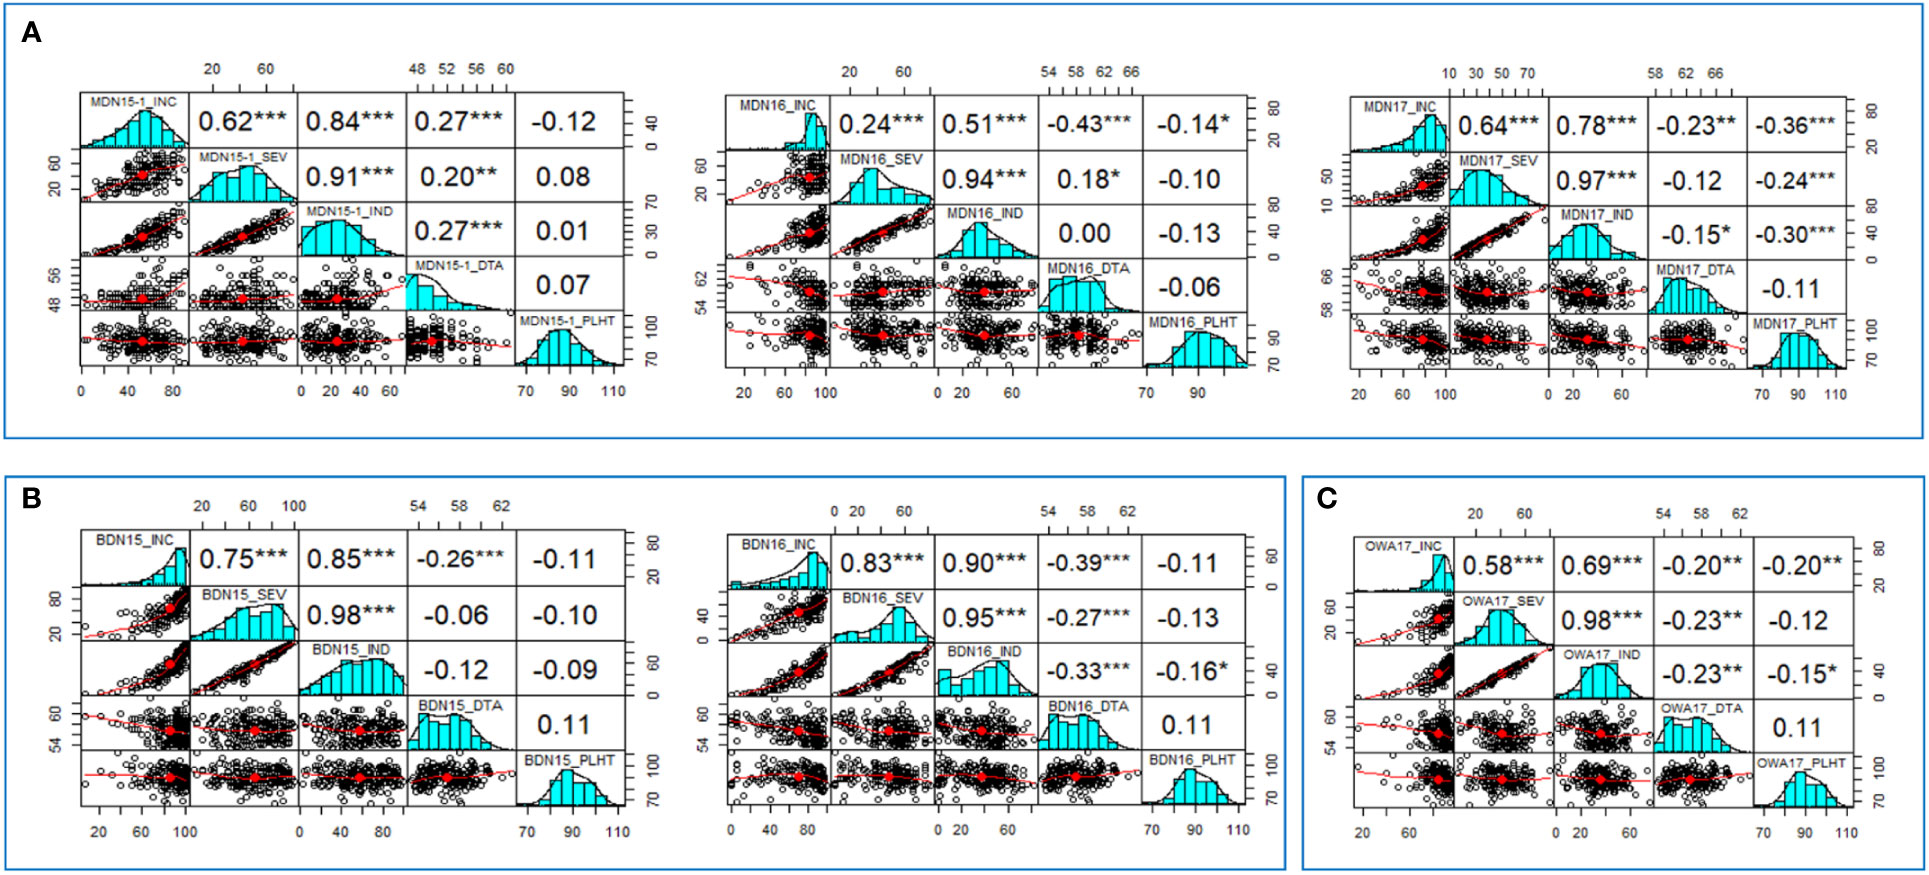
Figure 1 Correlation values and graphs generated from (A). Morden (MDN15-1, MDN16, MDN17); (B). Brandon (BDN15, BDN16) and (C). Ottawa (OWA17) datasets, depicting relationships between FHB incidence (INC), Severity (SEV), Index (IND), days to anthesis (DTA) and plant height (PLHT) traits recorded on 192 bread wheat genotypes of a GWAS panel.
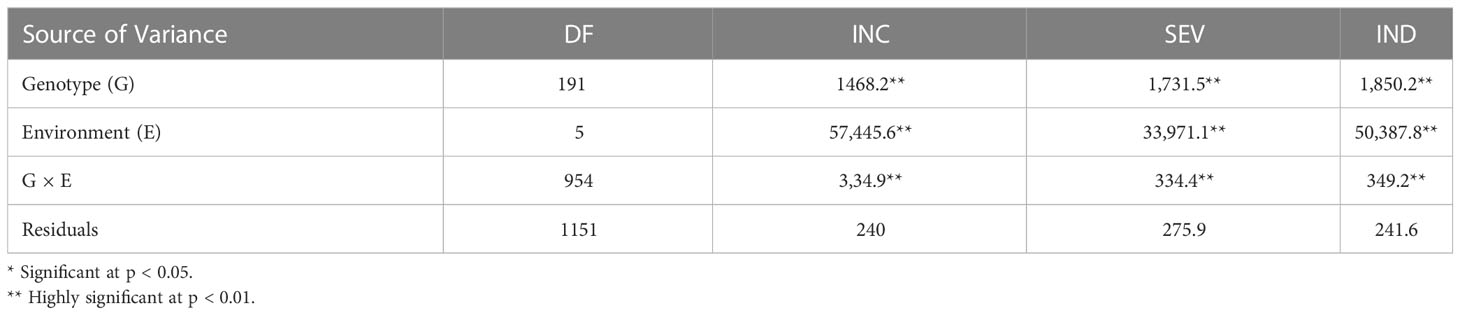
Table 2 An analysis of variance (ANOVA) for FHB incidence (INC), severity (SEV), and index (IND) traits across six environments of AAFC nurseries located at Morden (MDN) and Brandon (BDN) in Manitoba (MB) and Ottawa (OWA) in Ontario (ON) Canada, between 2015 and 2017.
SNP distribution, population structure, and LD decay
Imputation of missing calls in the HapMap genotypic data file with 5,441 SNP markers via the LDKNNi algorithm in TASSEL produced an imputation accuracy of approximately 93% (0.069 error rate). The largest number of SNP markers (2422) was distributed across the B genome, followed by the A genome with 1,978 and the D genome with 1,041. On a per-chromosome basis, the most number of SNP markers (551) was mapped to 2B, while 4D had the least number (43) of SNPs. The SNP marker distribution across 21 bread wheat chromosomes is given in an SNP density plot depicting the number of SNP markers within a 1-Mb window (Supplementary Figure 1).
A population genetic structure analysis with the Structure software revealed three clusters or sub-populations represented by red, blue, and green rectangular bars, among the 192 genotypes of the AMP, based on the highest Delta K value corresponding to K = 3 (Figure 2). This was validated by a dimensionless Constellation plot with three distinct clusters (red, blue, and green) generated in JMP® Version 17 (SAS Institute Inc., Cary, NC, USA) (Figure 3). LD is described here as the r2 of marker pairs versus the genetic distance in base pairs (bp) across the genome. In the association panel, LD decay below a threshold of 0.2 r2 was observed to occur at a physical distance of ~7.08 Mb (Supplementary Figure 2).
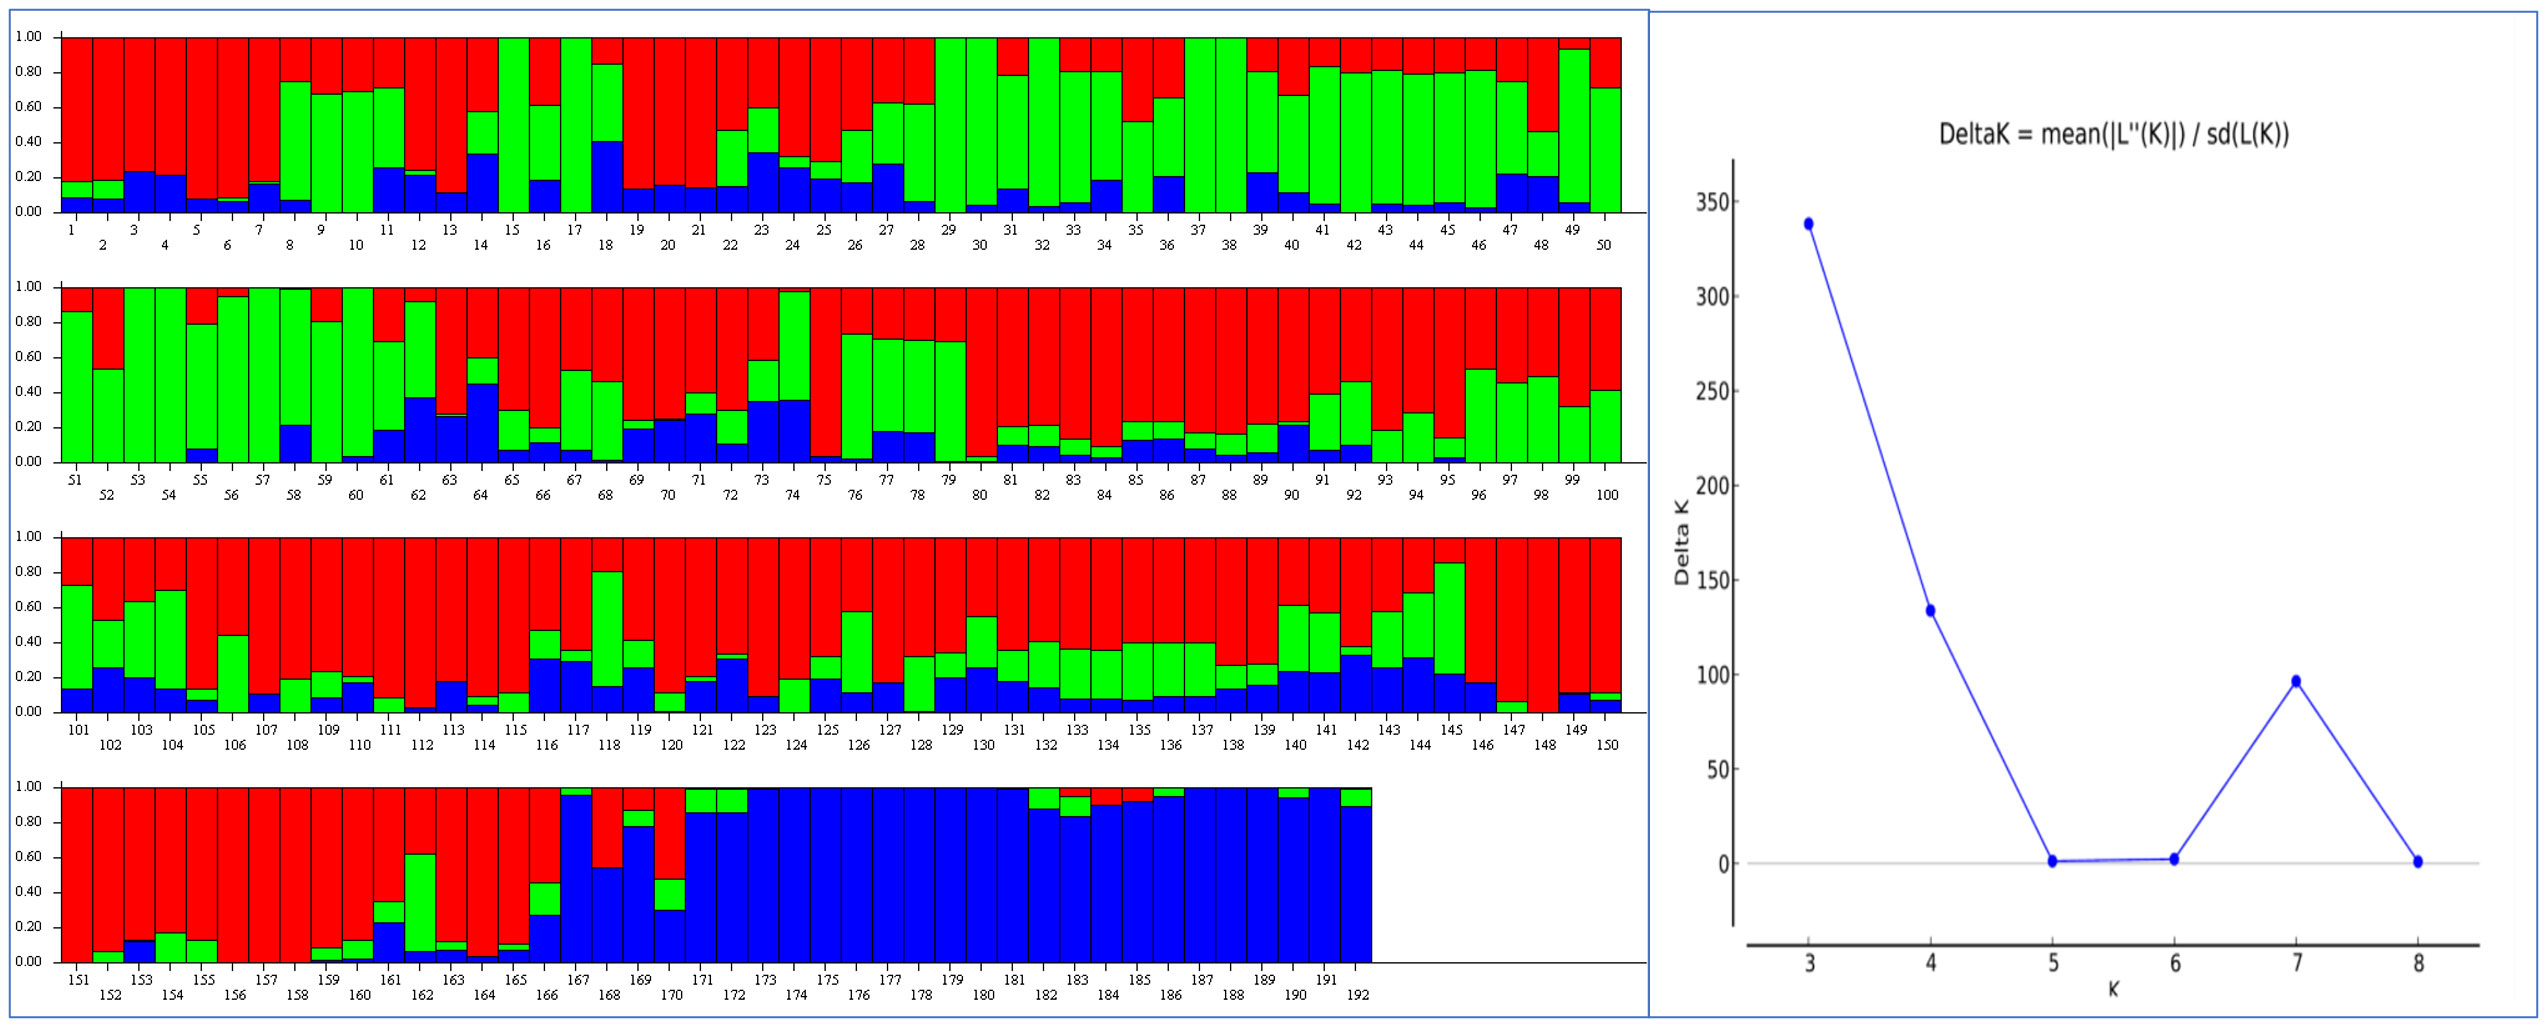
Figure 2 A population genetic structure analysis performed with the Structure® software detected three clusters (red, blue and green) or sub-populations (K=3) in an association mapping panel (AMP) comprising 192 predominantly Canadian spring wheat cultivars (Left), and an output graph visualized in Structure Harvester depicting the highest Delta K values obtained for K=3 (Right).
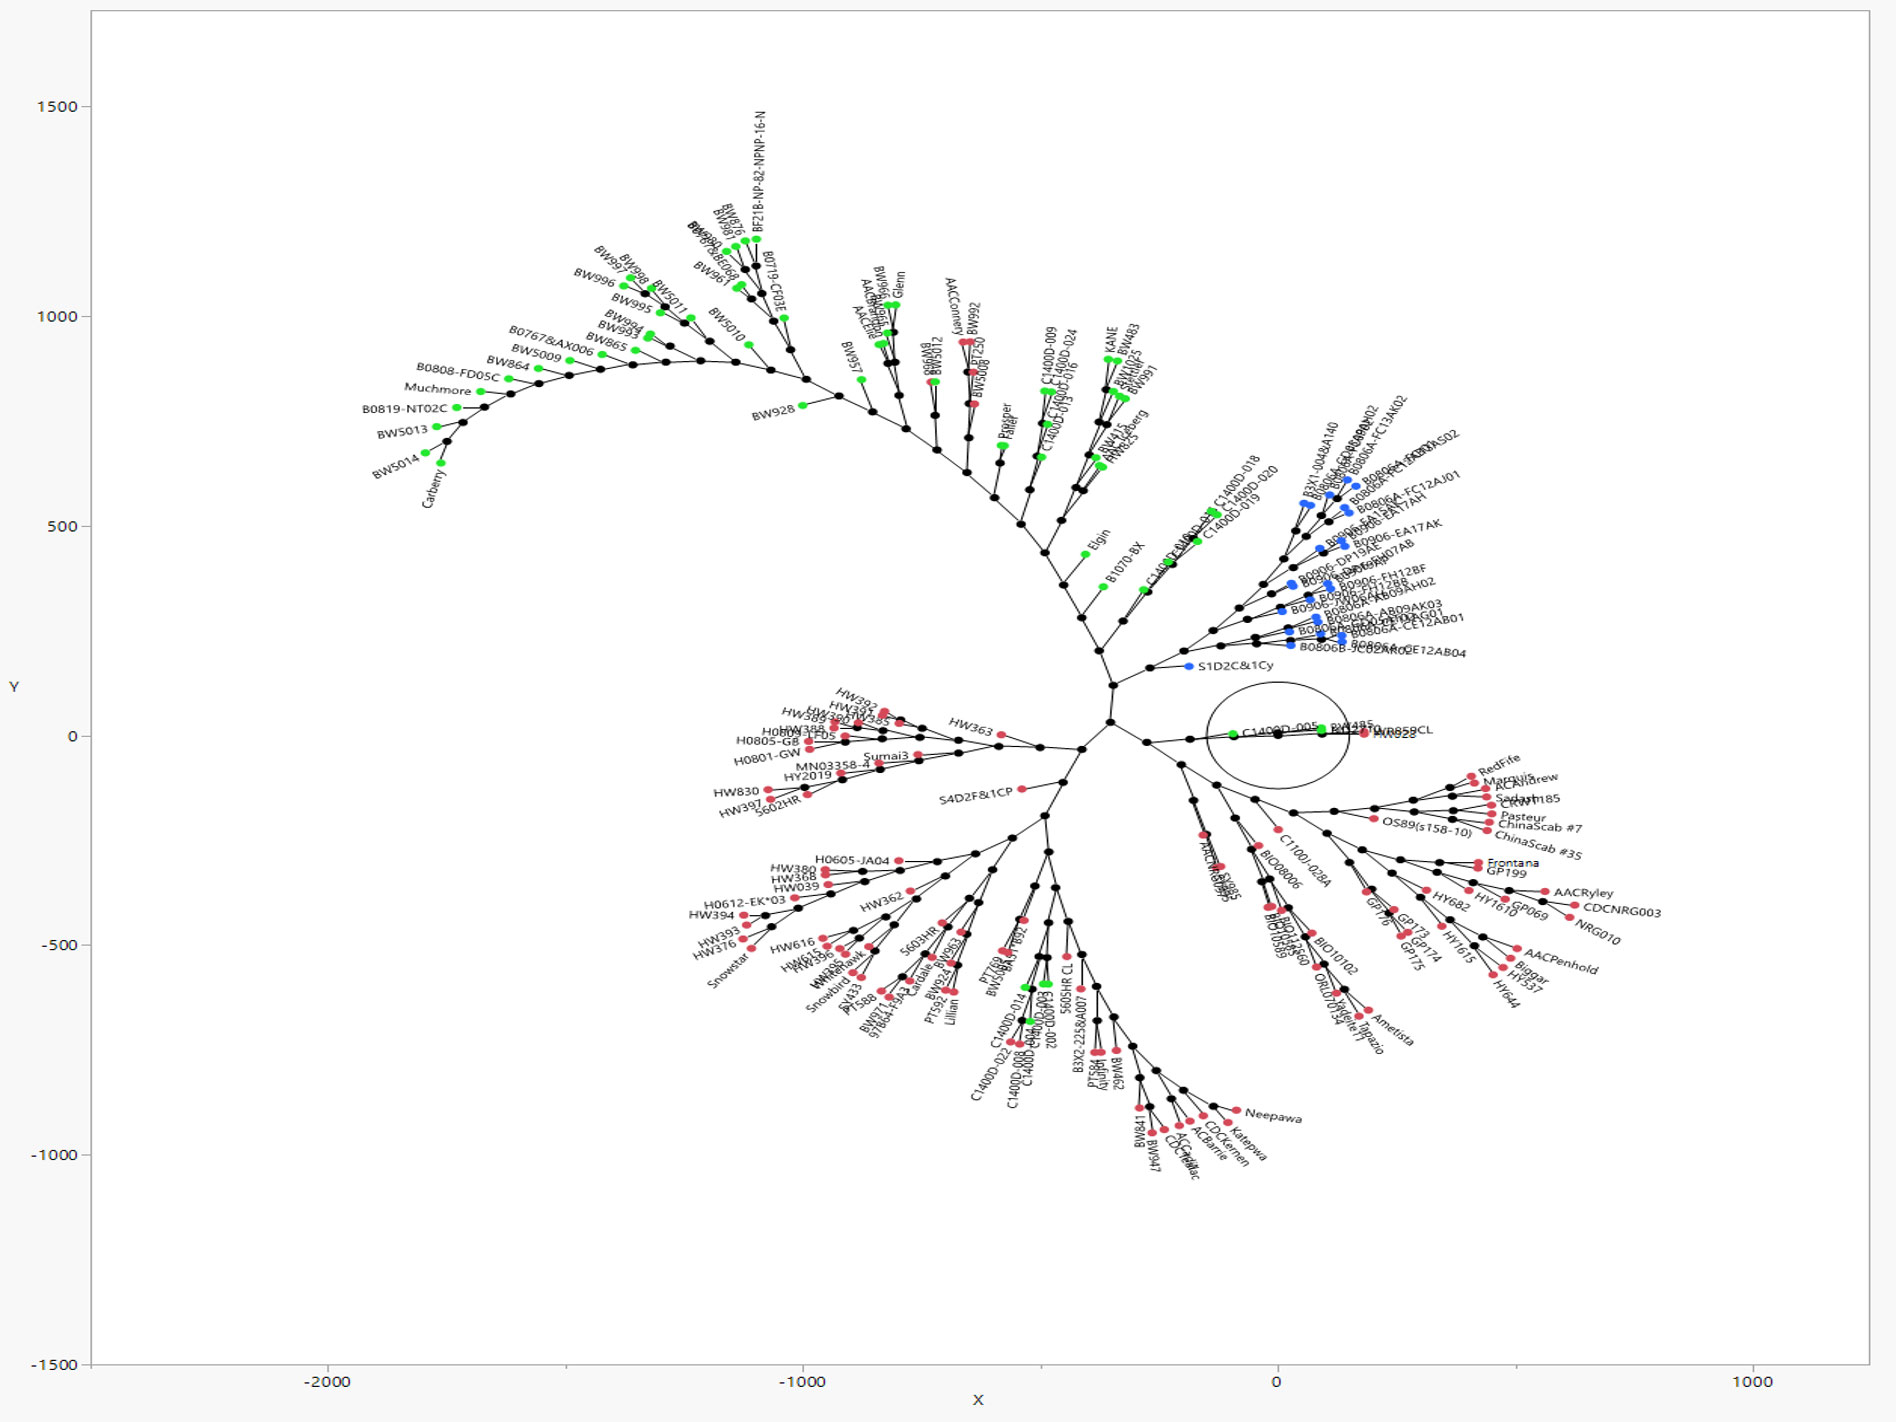
Figure 3 A dimensionless Constellation plot generated with JMP® Version 17 software, from hierarchical clustering of 192 predominantly Canadian spring wheats of an association mapping panel (AMP) genotyped with 5441 SNP markers. Three distinct clusters (red, blue, green) which correspond to the three sub-populations detected by Structure software (refer Figure 2), represent elite FHB tolerant cultivars of Asian and North American pedigree, in addition to Brazilian cultivar Frontana, its derivative Neepawa, and Neepawa derivatives Stettler, Katepwa, AC Barrie, besides 75 lines taken from Canadian Western Bread Wheat, Central Bread Wheat, Parkland Wheat, General Purpose Wheat, Hard White Wheat and High Yielding Wheat Registration trial collections.
GWAS analyses
Single-locus GWAS (MLM)
Single-locus MLM method revealed four statistically significant QTNs (−log10(p) > 5) for FHB INC on chromosomes 2D and 3D, and for SEV and IND on chromosome 3B, only from two MDN 2015 environment datasets (MDN15-1 and MDN15-2). The SEV and IND QTNs detected on chromosomes 3B in both datasets are identical and represented by SNP marker CAP7_c1576_371, which co-locates with TraesCS3B02G024900, which encodes a DEAD/DEAH box RNA helicase domain or TraesCS3B03G0056500 (3B:15817353..15827081) in RefSeq v2.1 (Figure 4). When all site years were considered, a total of 242 statistically significantly (p < 0.05) SNP markers explained 17%–26% of the phenotypic variance for INC, 264 SNPs explained 19%–35% of the variance for SEV, and 270 statistically significant SNP markers explained 23%–36% phenotypic variance for IND (Supplementary Material 2).
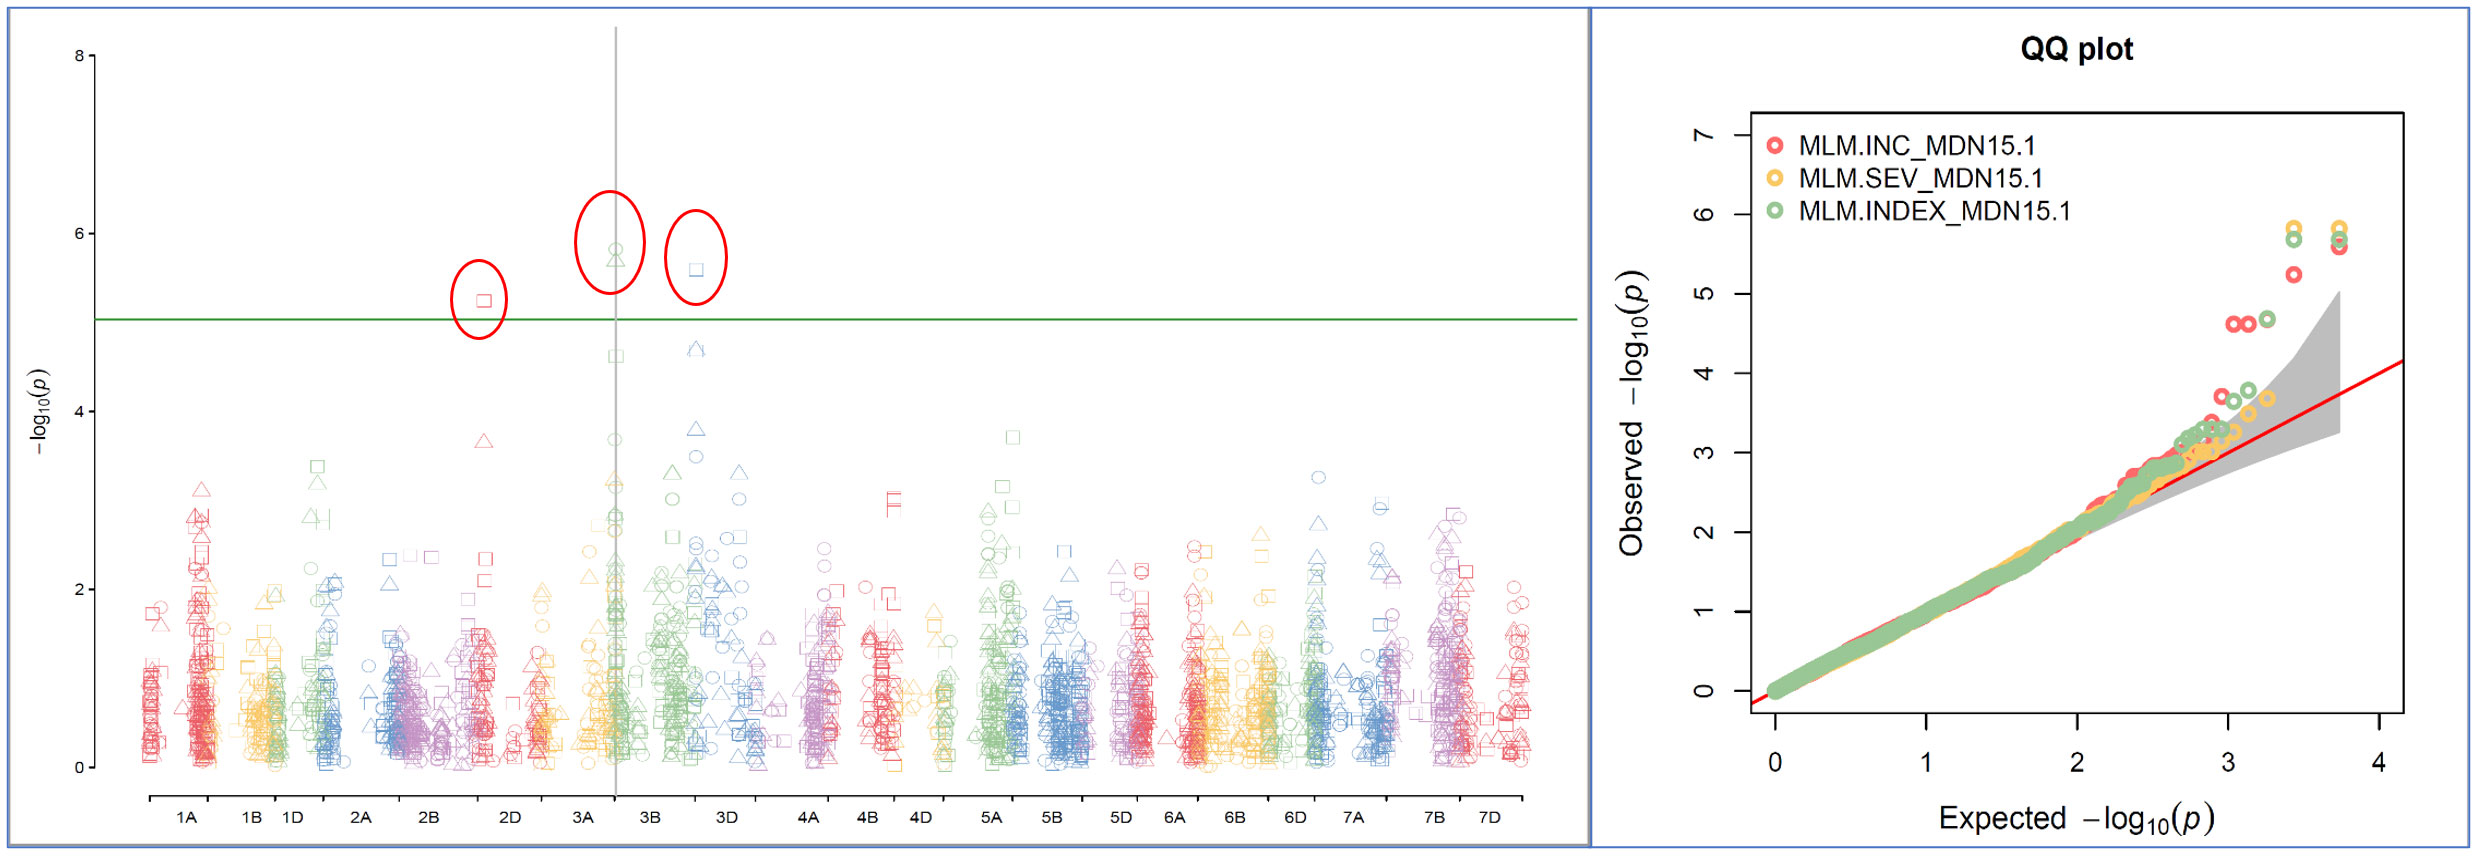
Figure 4 A multiple symphysic Manhattan plot generated from a MDN15.1 dataset (Morden 2015 environment) by the single-locus Mixed Linear Model (MLM) GWAS method depicts four significant Quantitative Trait Nucleotide (QTN; within three red ellipses) for FHB Incidence (INC) on chromosomes 2D and 3D, and for FHB Severity (SEV) and FHB Index (INDEX) on chromosome 3B (Left); and their corresponding probability distributions given in a symphysic Quantile-Quantile (Q-Q) plot (Right). The green horizontal line represents the significance threshold cutoff (-log10 (p) = 5). Note: The SEV and IND QTN on chromosome 3B are located within the Fhb1 region, and are represented by SNP marker CAP7_c1576_371 which co-locates with gene TraesCS3B02G024900 encoding a DEAD/DEAH box RNA helicase.
Multi-locus GWAS (mrMLM)
In seven MET datasets from six environments, mrMLM v4.0.2 software detected a total of 291 statistically significant QTNs (LOD score >3) for INC, SEV, DTA, and PLHT, across nearly all chromosomes. In the environment-wise distribution of the 291 QTNs, 50 were for INC, 72 for SEV, 90 for IND, 41 for DTA, and 38 for PLHT, as given in Table 3. Physical locations, high-confidence candidate genes (as per RefSeq 1.0 and 2.1), LOD scores, and p-values of all QTNs are given in Supplementary Material 3. Of these 291, 17 QTNs for FHB traits (INC, SEV, and IND), DTA, and PLHT were detected in two or more environments at MDN and BDN between 2015 and 2017. Twelve of these 17 QTNs were pleiotropic for a combination of traits, i.e., INC, SEV, IND, DTA, or PLHT (Table 4). Further, combined multi-locus GWAS analyses using entry trait means based on all six environments detected a total of 79 statistically significant QTNs for FHB traits, DTA, and PLHT (Supplementary Material 4), 15 of which were identical to 15 of the 17 statistically significant QTNs detected at two or more environments. Of the 15 combined analysis QTNs, three were for INC (on chromosomes 2D, 5A, and 7b), three for SEV (on chromosomes 3B, 5A, and 7B), five for IND (on chromosomes 3B, 5A, 6B, 7A, and 7B), one for DTA (on chromosome 1B), and three for PLHT (on chromosomes 4B, 6B, and 7B). Further, three of these 15 QTNs were pleiotropic for FHB INC, SEV, and IND on chromosome 5A; SEV and IND on chromosome 3B; and FHB INC, SEV, IND, and PLHT on chromosome 7B (Table 4).
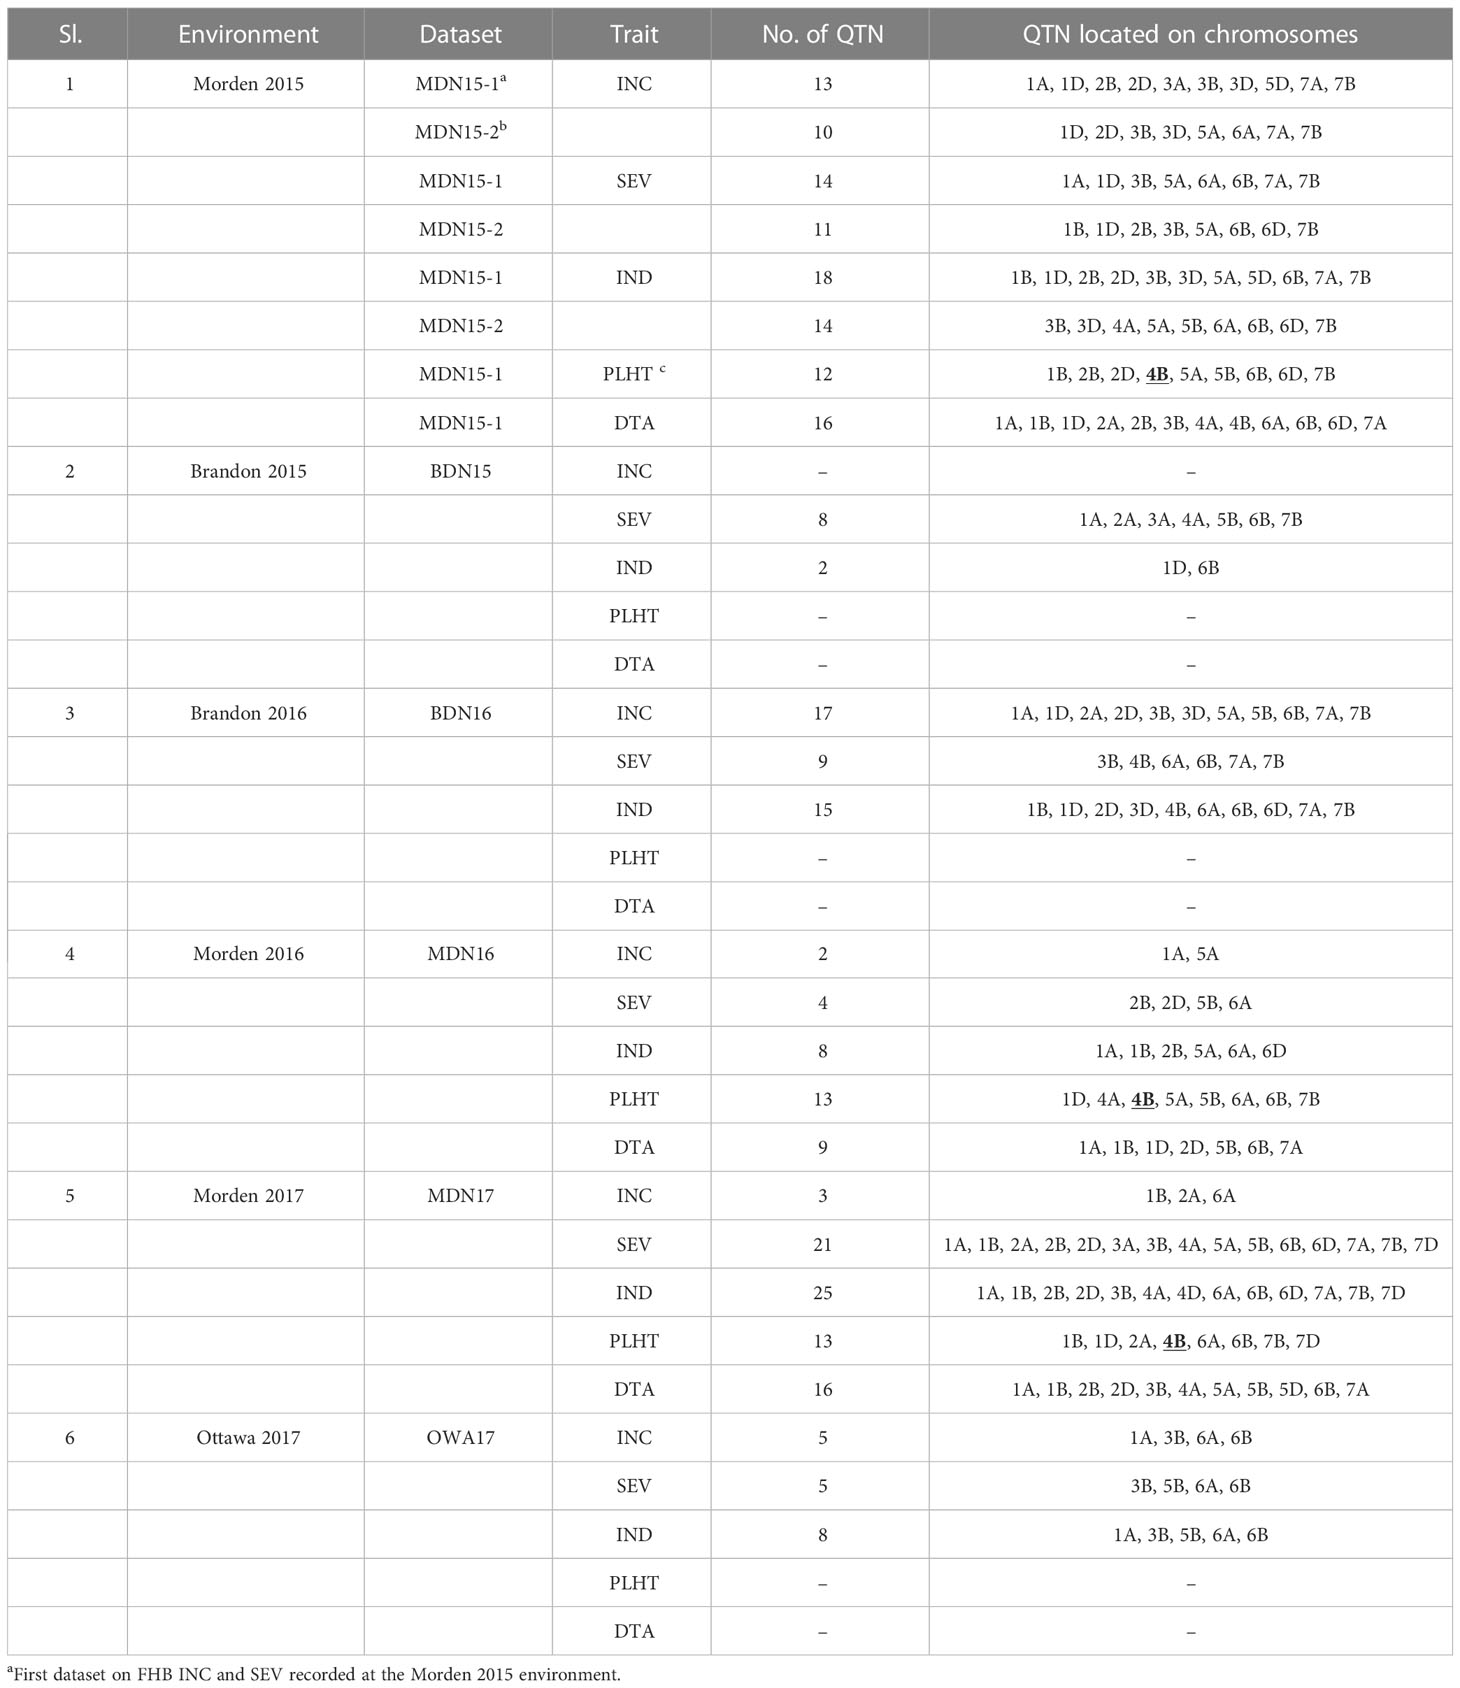
Table 3 Environment-wise distribution of 291 quantitative trait nucleotides (QTNs) for FHB incidence (INC), severity (SEV), index (IND), days to anthesis (DTA), and plant height (PLHT) detected by the multi-locus random single-nucleotide polymorphism (SNP)–effect mixed linear model (mrMLM) genome-wide association study (GWAS) method in an association mapping panel (AMP) of 192 predominantly Canadian bread wheat genotypes using trait-data from six environments (seven datasets): Morden 2015 (MDN15-1 and MDN15-2), Brandon 2015 (BDN15), Brandon 2016 (BDN16), Morden 2016 (MDN16), and Morden 2017 (MDN17) in Manitoba and Ottawa 2017 (OWA17) in Ontario Canada.
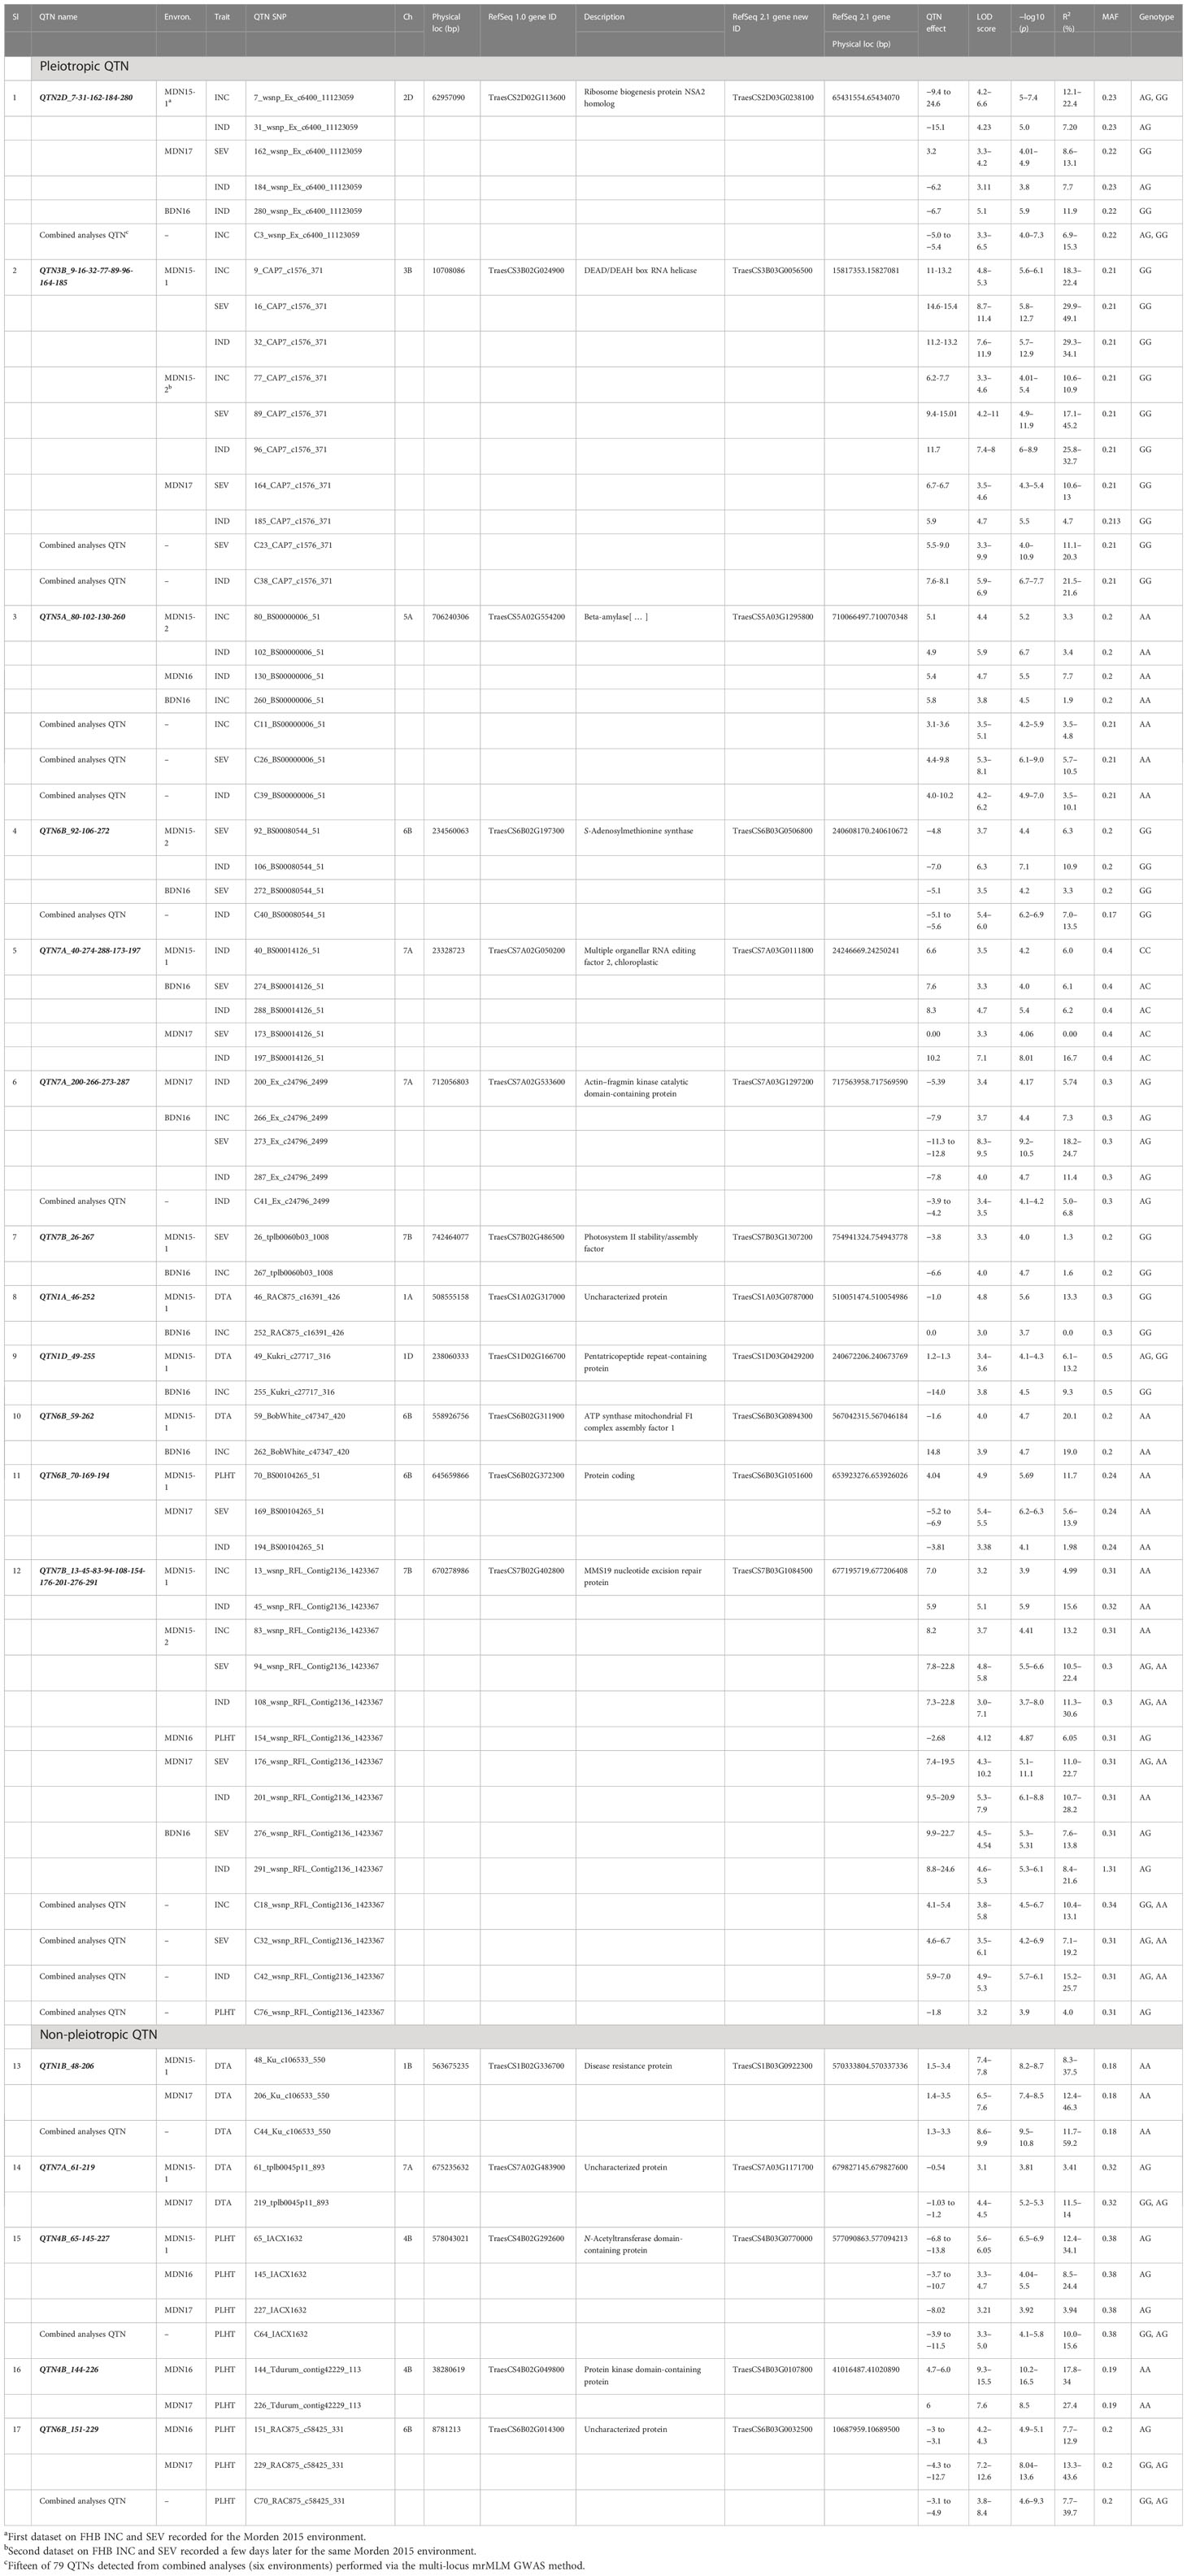
Table 4 Seventeen QTN for FHB incidence (INC), severity (SEV), index (IND), days to anthesis (DTA), and plant height (PLHT), their corresponding high-confidence candidate genes, physical locations (IWGSC RefSeq 1.0 and 2.1), limit of detection (LOD) scores, and explained percent phenotypic variances (R2) detected by single-locus mixed linear model (MLM) and multi-locus random single-nucleotide polymorphism (SNP)–effect mixed linear model (mrMLM) genome-wide association study (GWAS) methods with 2015-2017 multi-environment (MET) datasets from the FHB nurseries at Morden (MDN) and Brandon (BDN) in Manitoba (MB) Canada.
Pleiotropic QTN appearing in two or more environments
Of the 17 pleiotropic QTNs, 12 for INC, SEV, IND, DTA, or PLHT were detected in the MDN 2015, 2016, 2017, and BDN 2016 environments (Table 4). Seven of these 12 QTNs were pleiotropic for FHB INC, SEV, or IND; three were pleiotropic for INC and DTA; and two were pleiotropic for FHB traits (INC, SEV, or IND) and PLHT. Phenotypic variance (R2) for FHB traits of the seven pleiotropic QTNs ranged from 1.6% to 22.4% for INC, up to 49.1% for SEV, and from 3.4% to 34.1% for IND. The three pleiotropic QTNs for INC and DTA had R2 values ranging between 11.7% and 20.1% for DTA and up to 19% for INC. For the two QTNs pleiotropic for FHB traits and PLHT, R2 values ranged from 5.0% to 13.2% for INC, 5.6% to 22.7% for SEV, 2.0% to 30.6% for IND, and 6.1% to 11.7% for PLHT (Table 4).
Pleiotropic QTN co-located with high-confidence candidate genes
Of the 12 pleiotropic QTNs identified in this study, seven were detected for FHB traits, three for FHB INC and DTA, and two for FHB traits and PLHT. Candidate genes associated with each of these QTNs were obtained through a BLASTn search on the online IWGSC RefSeq v2.1 database. The physical locations of QTNs and their associated candidate genes, on all 21 wheat chromosomes, are depicted in Manhattan plots generated via the multi-locus mrMLM method (Figures 5–10 and Supplementary Figures 3-5).

Figure 5 Manhattan plots depicting a pleiotropic Quantitative Trait Nucleotide (QTN), QTN3B_9-16-32-77-89-96-164-185 for FHB Incidence (INC), Severity (SEV) and Index (IND) on chromosome 3B, represented by SNP marker CAP7_c1576_371, coinciding with a DEAD/DEAH box RNA helicase gene (TraesCS3B02G024900), detected from Morden 2015 (MDN15-1 & MDN15-2 datasets) (top six plots) and Morden 2017 (MDN17 datasets) environments (bottom two plots) by the multi-locus random SNP-effect Mixed Linear Model (MrMLM) method deployed on an association mapping panel of 192 predominantly Canadian bread wheats. The horizontal black dotted line denotes the significance threshold (LOD=3), while pink dots above the threshold line represent QTN detected by more than one of the six multi-locus methods.
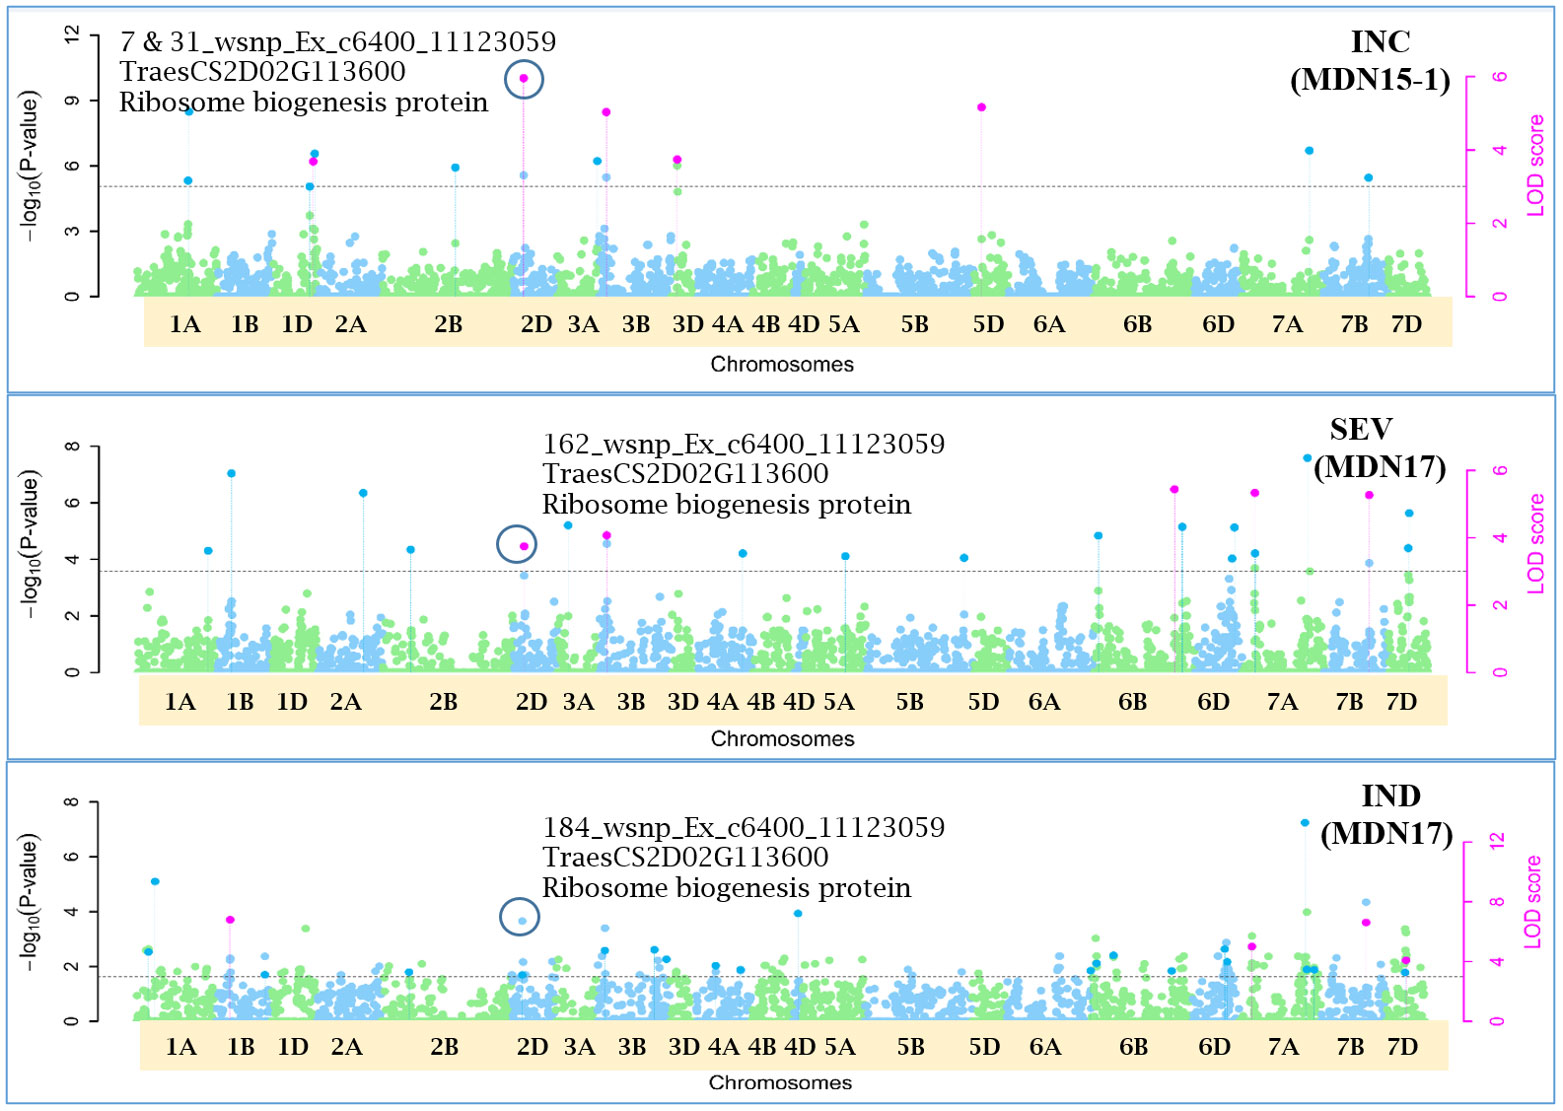
Figure 6 Manhattan plots depicting a pleiotropic Quantitative Trait Nucleotide (QTN), QTN2D_7-31-162-184 for FHB Incidence (INC), Severity (SEV) and Index (IND) on chromosome 2D, represented by SNP marker wsnp_Ex_c6400_11123059, coinciding with a Ribosome biogenesis protein (TraesCS2D02G113600), detected from Morden 2015 (MDN15-1 dataset) (top) and Morden 2017 (MDN17 datasets) environments (center and bottom) by the multi-locus random SNP-effect Mixed Linear Model (MrMLM) method deployed on an association mapping panel of 192 predominantly Canadian bread wheats. The horizontal black dotted line denotes the significance threshold (LOD=3), while pink dots above the threshold line represent QTN detected by more than one of the six multi-locus methods.
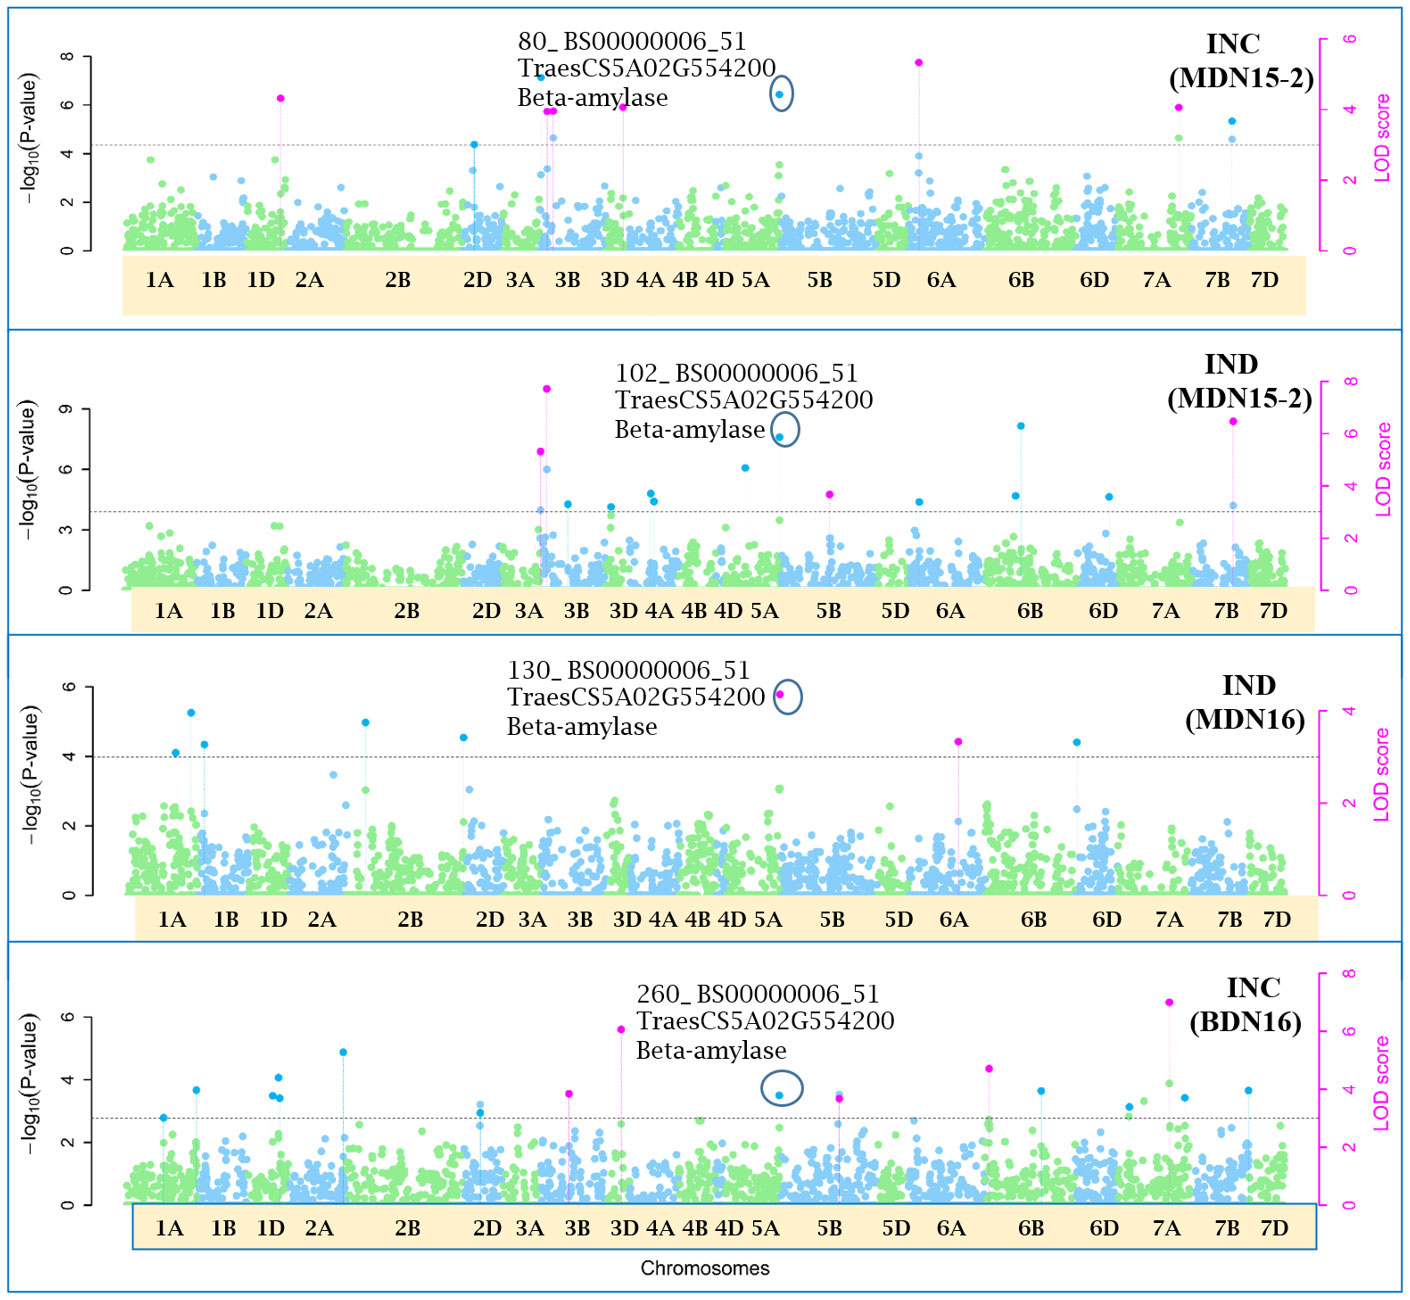
Figure 7 Manhattan plots depicting a pleiotropic Quantitative Trait Nucleotide (QTN) QTN5A_80-102-130-260 for FHB Incidence (INC) and Index (IND) on chromosome 5A, detected in MDN 2015 (MDN15-2 dataset), MDN 2016 and BDN 2016 environments by the multi-locus random SNP-effect Mixed Linear Model (mrMLM) method deployed on an association mapping panel of 192 predominantly Canadian bread wheats. QTN5A_80-102-130-260 is represented by SNP marker BS00000006_51 which co-locates with an Beta-amylase protein (TraesCS5A02G554200). The horizontal black dotted line denotes the significance threshold (LOD=3), while pink dots above the threshold line represent QTN detected by more than one of the six multi-locus methods.
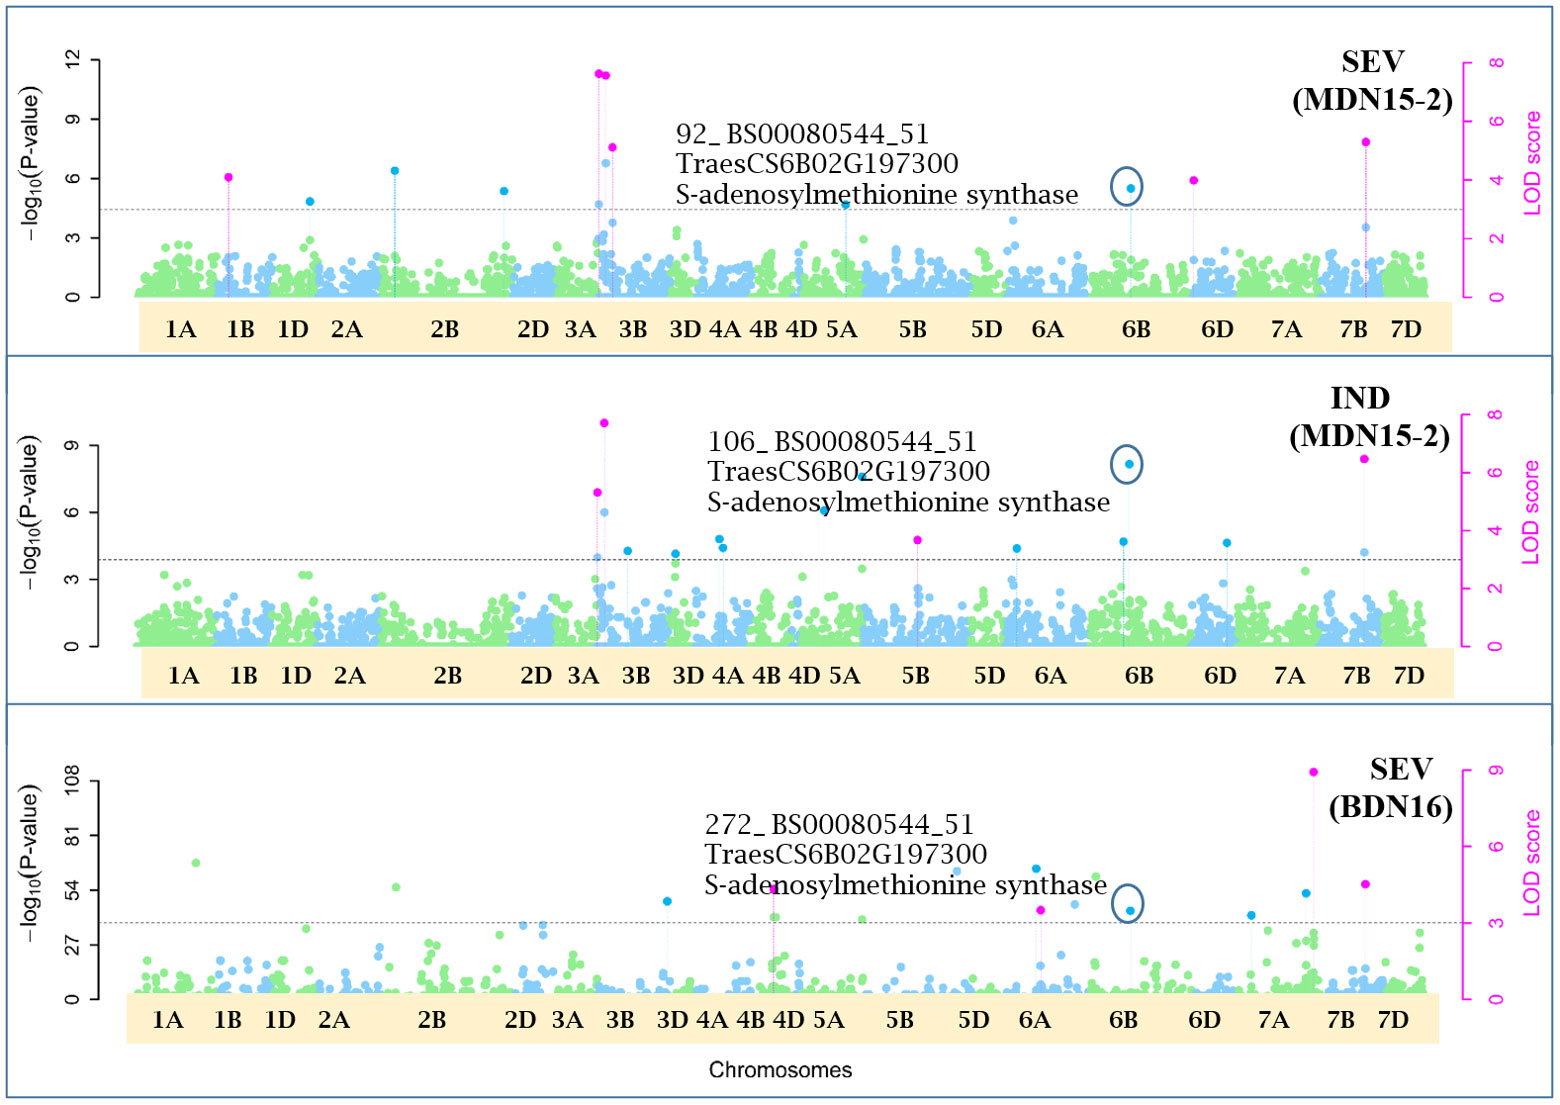
Figure 8 Manhattan plots depicting a pleiotropic Quantitative Trait Nucleotide (QTN) QTN6B_92-106-272 for FHB Severity (SEV) and Index (IND) on chromosome 6B, detected in MDN 2015 (MDN15-2 dataset) and BDN 2016 environments by the multi-locus random SNP-effect Mixed Linear Model (mrMLM) method deployed on an association mapping panel of 192 predominantly Canadian bread wheats. QTN6B_92-106-272 is represented by SNP marker BS00080544_51 which co-locates with an S-adenosylmethionine synthase protein (TraesCS6B02G197300). The horizontal black dotted line denotes the significance threshold (LOD=3), while pink dots above the threshold line represent QTN detected by more than one of the six multi-locus methods.
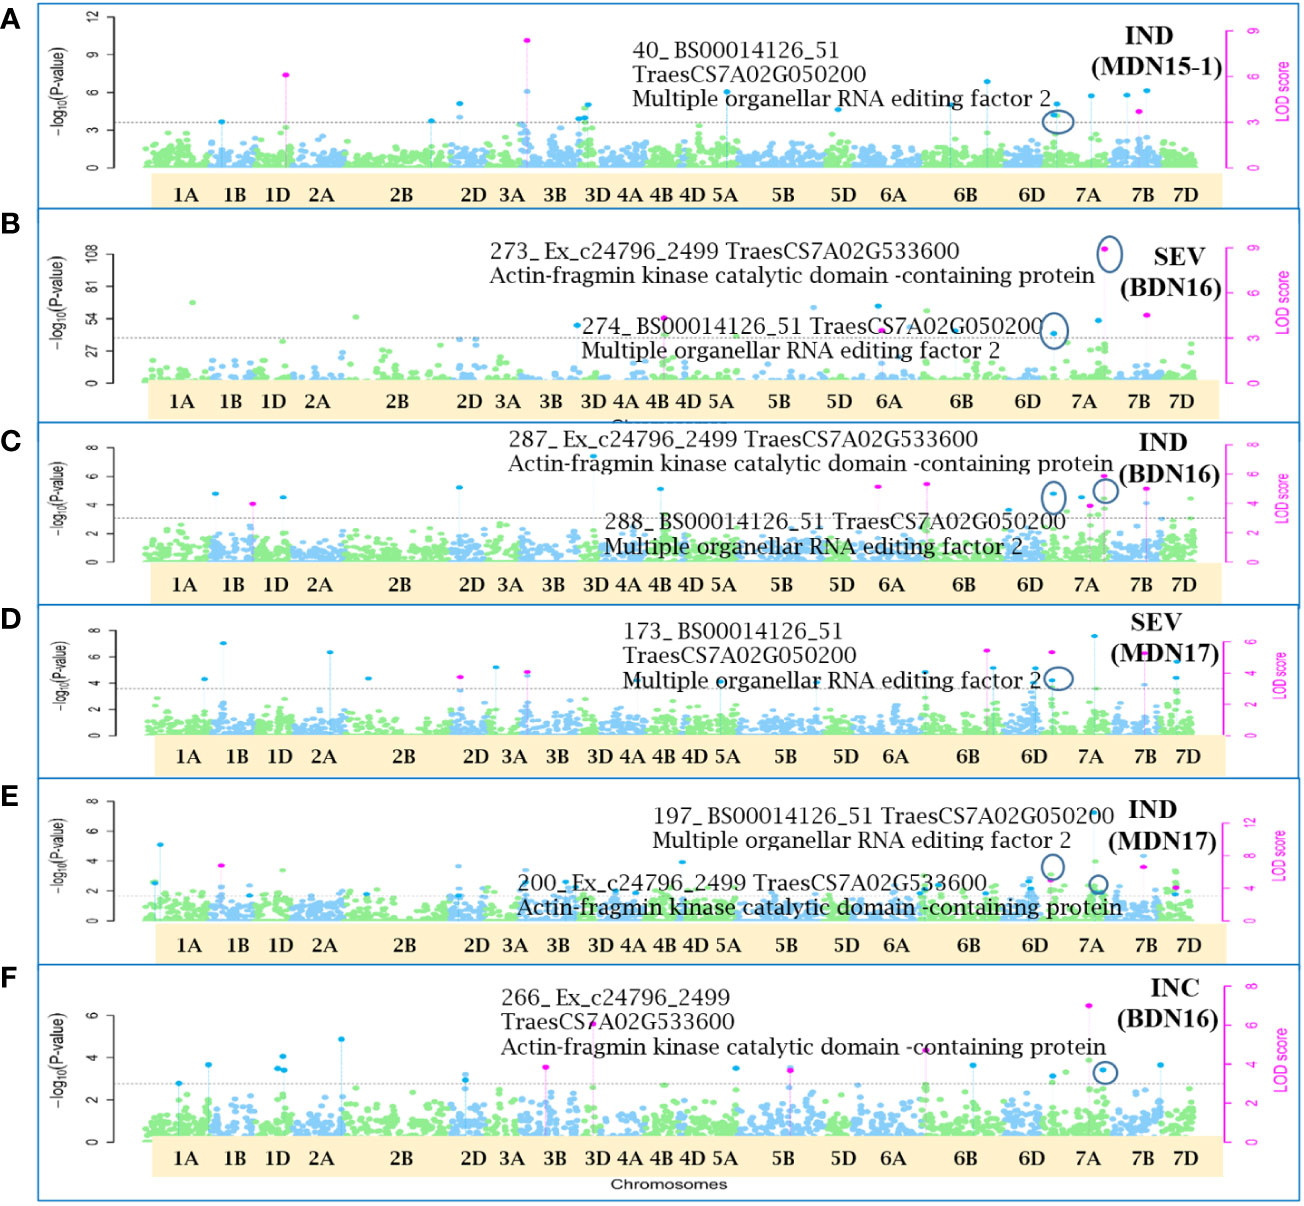
Figure 9 Manhattan plots depicting two pleiotropic Quantitative Trait Nucleotide (QTN) for FHB Incidence (INC), Severity (SEV) and Index (IND) on chromosome 7A, detected in MDN 2015 (MDN15-1 dataset), BDN 2016 and MDN 2017 environments by the multi-locus random SNP-effect Mixed Linear Model (mrMLM) method deployed on an association mapping panel of 192 predominantly Canadian bread wheats. Plots (A–E): QTN7A_40-274-288-173-197 for SEV and IND is represented by SNP marker BS00014126_51 which co-locates with an Multiple organellar RNA editing factor 2 (TraesCS7A02G050200). Plots (B, C, E, F): QTN7A_200-266-273-287 for INC, SEV and IND is represented by SNP marker Ex_c24796_2499 which co-locates with an Actin-fragmin kinase catalytic domain-containing protein (TraesCS7A02G533600). The horizontal black dotted line denotes the significance threshold (LOD=3), while pink dots above the threshold line represent QTN detected by more than one of the six multi-locus methods.
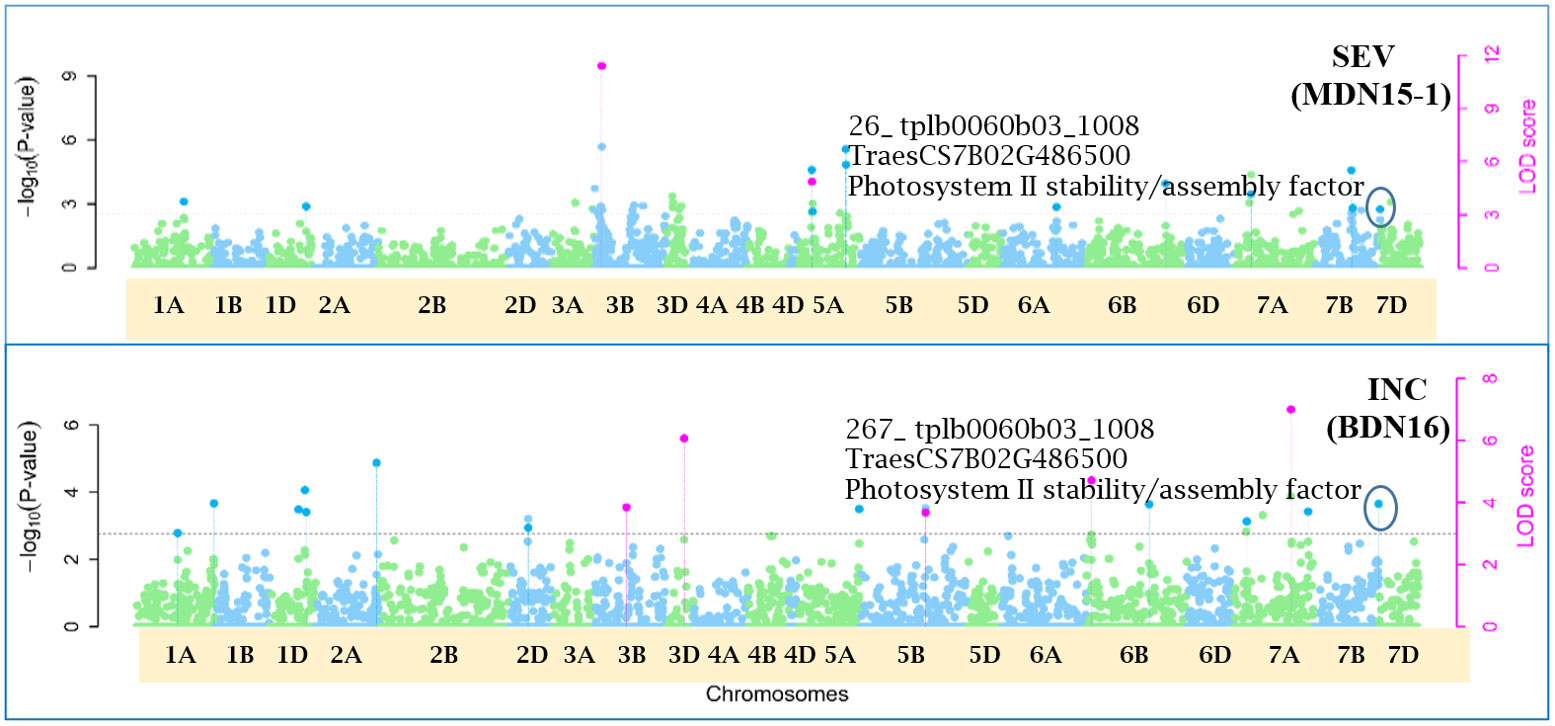
Figure 10 Manhattan plots depicting a pleiotropic Quantitative Trait Nucleotide (QTN) for FHB Incidence (INC) and Severity (SEV), QTN7B_26-267 on chromosome 7B, detected in MDN 2015 (MDN15-1 dataset) and BDN 2016 environments by the multi-locus random SNP-effect Mixed Linear Model (mrMLM) method deployed on an association mapping panel of 192 predominantly Canadian bread wheats. QTN7B_26-267 co-locates with a Photosystem II stability/assembly factor (TraesCS7B02G486500). The horizontal black dotted line denotes the significance threshold (LOD=3), while pink dots above the threshold line represent QTN detected by more than one of the six multi-locus methods.
Pleiotropic QTN for FHB traits
Seven of the 12 QTNs were pleiotropic for FHB INC, SEV, and IND (Figures 5–10). The first QTN, QTN3B_9-16-32-77-89-96-164-185, is located within the Fhb1 region on chromosome 3B, is associated with SNP marker CAP7_c1576_371 (positioned at 10.71 Mb), and co-locates with TraesCS3B02G024900, which encodes a DEAD/DEAH box RNA helicase domain (3B:15817353..15827081) in RefSeq v2.1 (Figure 5). The second pleiotropic QTN for FHB INC, SEV, and IND, QTN2D_7-31-162-184 is located at 62.96 Mb on chromosome 2D and co-locates with a ribosome biogenesis protein NSA2 homolog gene (2D:65431554..65434070) in RefSeq v2.1 (Figure 6). The third pleiotropic QTN (FHB INC, and IND) on chromosome 5A coincides with a beta-amylase protein gene (5A:710066497..710070348) in RefSeq v2.1 (Figure 7). The fourth pleiotropic QTN for FHB SEV and IND on chromosome 6BS, QTN6B_92-106-272, coincides with a S-adenosylmethionine synthase protein (6B:240608170..240610672) in RefSeq v2.1 (Figure 8). This QTN is located within the Fhb2 region (224.1–233.3 Mb; RefSeq v1.1) of chromosome 6B (Zhu et al., 2021). The fifth and sixth pleiotropic FHB trait QTNs on chromosome 7A correspond to a multiple organellar RNA editing factor 2 gene (7A:24246669..24250241; RefSeq v2.1) and an actin–fragmin kinase catalytic domain-containing protein gene (7A:717563958..717569590) in RefSeq v2.1 (Figure 9). Lastly, the seventh pleiotropic QTN (FHB SEV and IND) on chromosome 7B, QTN7B_26-267, co-locates with a Photosystem II stability/assembly factor (7B:754941324..754943778) in RefSeq v2.1 (Figure 10).
Pleiotropic QTN for FHB INC and DTA
Three QTNs were pleiotropic for FHB INC and DTA. The first on chromosome 1A, QTN1A_46-252, co-locates with an uncharacterized protein gene (1A:510051474..510054986) in RefSeq v2.1. The second, QTN1D_49-255, on chromosome 1D co-locates with a pentatricopeptide repeat-containing protein (1D:240672206..240673769) in RefSeq v2.1. The third FHB INC and DTA QTN on chromosome 6B, QTN6B_59-262, co-locates with an ATP synthase mitochondrial F1 complex assembly factor 1 (6B:567042315..567046184) in RefSeq v2.1 (Supplementary Figure 3).
Pleiotropic QTN for FHB traits and PLHT
Two pleiotropic QTNs for FHB traits and PLHT were detected. The first for FHB SEV, IND, and PLHT, QTN6B_70-169-194, located on chromosome 6B, is represented by SNP marker BS00104265_51 (645.66 Mb) and co-locates with a protein-coding gene (6B:653923276..653926026) in RefSeq v2.0 (Supplementary Figure 4). The second QTN for FHB INC, SEV, IND, and PLHT, QTN7B_13-45-83-94-108-154-176-201-276-291, on chromosome 7B coincides with MMS19 nucleotide excision repair protein (7B:677195719..677206408) in RefSeq v2.0 (Supplementary Figure 5).
Non-pleiotropic QTN appearing in two or more environments
Non-pleiotropic QTN for DTA
Two QTNs for DTA were detected from the MDN 2015 and 2017 environments. The first DTA QTN on chromosome 1B, QTN1B_48-206 (located at 563.67 Mb), explained 8.28%–46.28% of the phenotypic variance in DTA and co-locates with a disease resistance protein (1B:570333804..570337336) in RefSeq v2.1. The second QTN, QTN7A_61-219, on chromosome 7A (located at 675.23 Mb) explained 3.41%–13.96% of the phenotypic variance for DTA and co-locates with an uncharacterized protein (7A:679827145..679827600) in RefSeq v2.1 (Supplementary Figure 6).
Non-pleiotropic QTN for PLHT
For PLHT, three QTNs were detected in three environments (MDN 2015, MDN 2016, and MDN 2017), two of which were located on chromosome 4B and one on chromosome 6B. The first PLHT QTN on chromosome 4B, QTN4B_144-226, is located at 38.28 Mb and accounts for 17.8%–33.9% of the phenotypic variance in PLHT. This QTN is associated with a protein kinase domain-containing protein (4B:41016487..41020890) in RefSeq v2.1. The second 4B QTN, QTN4B_65-145-227, (located at 578.04 Mb), explained 3.94%–34.1% of the phenotypic variance and co-locates with a N-acetyltransferase domain-containing protein (4B:577090863..577094213) in RefSeq v2.1. The third PLHT QTN on chromosome 6B, QTN6B_151-229 (located at 8.78 Mb), accounted for 7.66%–43.58% of the phenotypic variance for PLHT and co-locates with an uncharacterized protein (6B:10687959..10689500) in RefSeq v2.1 (Supplementary Figure 7).
Discussion
This study detected pleiotropic QTNs for FHB resistance traits, DTA, and PLHT, as well as single-trait QTN (DTA and PLHT), for the characterization of FHB traits in relation to DTA and PLHT. Overall, highly significant and moderate-to-strong correlations were observed among FHB traits, which however shared weak inverse correlations with PLHT and with DTA. Broad-sense heritability (H2) values were lower for FHB traits when compared to PLHT and DTA. Multi-locus mrMLM detected a total of 291 statistically significant QTNs, 17 of which were detected at two or more environments of MDN and BDN. Twelve of these 17 QTNs were pleiotropic for INC, SEV, IND, DTA, or PLHT; two QTNs corresponded to DTA and three to PLHT. Consistency of the above results was backed by a separate combined six-environment multi-locus GWAS analyses. Among notable findings of this study are the detection of a pleiotropic QTN within the Fhb1 region on chromosome 3B, which is ~3 Mb from a cloned Fhb1 candidate gene TaHRC; a putatively novel PLHT QTN on chromosome 6B; a 1B DTA QTN located ~10 Mb from a Flowering Locus T1-like gene TaFT3-B1; and a DTA QTN on chromosome 7A, which is ~5 Mb from a maturity QTL QMat.dms-7A.3 of another study. Further, four of the 12 pleiotropic QTNs on chromosomes 1A, 1B, 3B, and 6B are potentially identical to corresponding QTLs in durum wheat. Upon validation of the above QTNs, their suitability for the downstream development of trait-specific markers for breeding selection will be assessed.
The identification of reliable and closely linked markers for MAS of quantitative traits like FHB (Steiner et al., 2017; Sari et al., 2020) is an important step in the development of FHB-resistant wheat cultivars. Several previous studies have deployed MAS for the detection, introgression, and stacking of FHB resistances, for example, the detection of a Qfhs.ifa-5A QTL on chromosome 5A (Buerstmayr et al., 2003), and introgression and stacking of FHB resistance QTL (Somers et al., 2005; Miedaner et al., 2006). Studies such as these have led to the development of diagnostic markers like UMN10 for Fhb1 (Liu et al., 2008; Schweiger et al., 2016). The following paragraphs discuss the significance of the identified FHB, DTA, and PLHT QTNs and their corresponding candidate genes in relation to pertinent findings from previous studies.
Pleiotropic QTN for FHB traits
Of the 12 pleiotropic QTNs detected in our study, seven were pleiotropic for FHB INC, SEV, and IND. The first of seven, QTN3B_9-16-32-77-89-96-164-185, for FHB INC, SEV, and IND, located at 10.71 Mb and within the Fhb1 region (7.6–13.9 Mb; Wu et al., 2019) on chromosome 3B, is positioned ~1 Mb away from a 3B.2 QTL (9.8 Mb) identified in a durum wheat GWAS by Ruan et al. (2020). This QTN coincides with a DEAD/DEAH box RNA helicase domain (Lasko et al., 1989) and is ~3 Mb away from a cloned Fhb1 candidate gene TaHRC (T. aestivum haplotype Clark histidine-rich calcium-binding protein; Su et al., 2019). The DEAD/DEAH box RNA helicase is involved in biotic and abiotic stress responses in wheat (Zhang et al., 2014; Hu et al., 2020), rice (Macovei et al., 2012), Arabidopsis (Kim et al., 2008), and tomato (Pandey et al., 2019). Zhang et al. (2014) cloned the wheat DEAD/DEAH box RNA helicase gene TaRH1 and reported it to be a positive regulator during the defense response to the stripe rust fungus Puccinia striiformis f. sp. tritici (Pst). Further, in a protein–protein interaction study, the DEAD/DEAH box RNA helicase protein PRH75, also located on chromosome 5BL, was identified as a key hub protein that is induced in response to the powdery mildew fungus Blumeria graminis f. sp. tritici (Bgt). Given its co-location with FHB trait QTN3B_9-16-32-77-89-96-164-185 and proximity to TaHRC gene (Su et al., 2019) within the Fhb1 region on chromosome 3B, TraesCS3B02G024900, which encodes a DEAD/DEAH box RNA helicase domain, could potentially be a candidate for the Fhb1 locus. The second pleiotropic QTN2D_7-31-162-184 for FHB INC, SEV, and IND, represented by SNP marker wsnp_Ex_c6400_11123059 (located at 62.96 Mb) on chromosome 2D, co-locates with a ribosome biogenesis protein NSA2 homolog (TraesCS2D02G113600). In a consensus genetic map by Bokore et al. (2020), SNP marker wsnp_Ex_c6400_11123059 representing the above QTN is located ~6 cM from SSR marker Xgwm484, which, along with marker Xgwm261, flanks the photoperiod sensitive gene Ppd-D1 on chromosome 2D (Gasperini et al., 2012). This genomic region on chromosome 2D also coincides with an anthesis date QTL QAnth.crc-2D mapped at ~37.1 cM in a Kenyon/86ISMN recombinant inbred line (RIL) population, which is likely the effect of Ppd-D1 (McCartney et al., 2016), and QLr.spa-2D.2, a QTL associated with leaf rust resistance in Canada and New Zealand, detected in a Stettler/Red Fife spring wheat population (Bokore et al., 2020).
The third pleiotropic QTN5A_80-102-130-260 for FHB INC and IND on chromosome 5A coincides with a beta-amylase protein gene. Beta-amylase activity is said to increase 10 days after anthesis (LaBerge and Marchylo, 1986). Its expression was reported to be upregulated in response to Fusarium culmorum and F. graminearum infection of emmer wheat grains (Eggert et al., 2011). The fourth QTN6B_92-106-272 for FHB SEV and IND co-locates with a S-adenosylmethionine (SAM) synthase protein located (224.1–233.3 Mb) within the Fhb2 region on chromosome 6B (Zhu et al., 2021). In response to inoculation with F. graminearum, the SAM protein was upregulated in resistant near-isogenic lines (NILs) carrying the Fhb1 locus and derived from an HC374/98B69*L47 cross (Gunnaiah et al., 2012). Further, a related SAM-dependent methyltransferase (TaSAM) protein was differentially expressed in microarray analyses comparing transcript accumulation in DON treated versus untreated lines derived from a CM82036/Remus cross, segregating for Fhb1 (Walter et al., 2008).
The fifth (QTN7A_40-274-288-173-197) pleiotropic FHB trait QTN on chromosome 7A corresponds to a multiple organellar RNA editing factor (MORF) 2 gene. MORF family proteins are involved in RNA editing (Benne et al., 1986) in the organelles of flowering plants (Takenaka et al., 2012). The first study of RNA editing or RNA/DNA difference (RDDs) in wheat, in response to F. graminearum infection, was carried out by Yang et al. (2022), using publicly available RNA-seq samples of four wheat genotypes, Nyubai, Wuhan 1, HC374, and Shaw. The sixth (QTN7A_200-266-273-287) pleiotropic FHB trait QTN, also on chromosome 7A, co-locates with an actin–fragmin kinase (AFK) catalytic domain-containing protein. AFK, an actin-binding protein kinase (Eichinger et al., 1996), along with actins and microtubules, is associated with the plant cytoskeleton (Staiger and Schliwa, 1987; Etienne-Manneville, 2004) and is most likely involved in biotic resistance mechanisms (Kobayashi et al., 1992; Takemoto et al., 2003; Takemoto and Hardham, 2004; Hardham, 2013).
Lastly, the seventh pleiotropic QTN (FHB SEV and IND) on chromosome 7B, QTN7B_26-267, co-locates with a Photosystem II (PSII) stability/assembly factor. PSII is bound by oxygen-evolving enhancer proteins (OEEs; Sugihara et al., 2000), which are essential for its oxygen-evolving activity and stability (Mizobuchi and Yamamoto, 1989) during abiotic and/or biotic stresses. Two of these proteins (OEE1 and OEE2) were upregulated in response to FHB inoculation of FHB-resistant wheat cultivar Wangshuibai and an FHB-resistant NIL derived from a Ning 7840/Clark backcross (Wang et al., 2005; Zhang et al., 2013).
Pleiotropic QTN for FHB INC and DTA
Three QTNs were pleiotropic for FHB INC and DTA. The first on chromosome 1A, QTN1A_46-252 (508.5 Mb), co-locates with an uncharacterized protein; in addition, it coincides with a durum wheat INC and SEV 1A.3 QTL interval (503–580 Mb) identified by Ruan et al. (2020). The second, QTN1D_49-255, on chromosome 1D co-locates with a pentatricopeptide repeat (PPR)-containing protein. PPR proteins (Aubourg et al., 2000; Small and Peeters, 2000) are required for the expression of several organellar genes mainly in the mitochondria or chloroplasts, where they modulate gene expression at the RNA level (Colcombet et al., 2013; Barkan and Small, 2014; Manna, 2015).
Further, the third, QTN6B_59-262 for FHB INC and DTA QTN on chromosome 6B, co-locates with an ATP synthase mitochondrial F1 complex assembly factor 1 protein, which most likely plays a role in the regulation of oxidative stress. Oxidative stress is reported to be induced in response to F. graminearum infection in wheat (Zhou et al., 2005; Golkari et al., 2007). Wheat mitochondrial phosphate transporter (MPT) encoding genes catalyze the oxidative phosphorylation of ADP to ATP (Takabatake et al., 1999) and are involved in the modulation of reactive oxygen species (ROS) and regulation of oxidative stress responses (Walter et al., 2008).
Pleiotropic QTN for FHB traits and PLHT
Among the two QTNs pleiotropic for FHB traits and PLHT, QTN6B_70-169-194 for SEV, IND, and PLHT on chromosome 6B co-locates with a protein-coding gene, inside a 585–707-Mb interval of a 6B.1 QTL for FHB resistance detected by Ruan et al. (2020) in a durum wheat panel. The second QTN for INC, SEV, IND, and PLHT, QTN7B_13-45-83-94-108-154-176-201-277-292 (670.3 Mb) on chromosome 7B, coincides with an MMS19 nucleotide excision repair protein. MMS proteins, among other genes, are involved in the excision repair of DNA damaged by ultraviolet (UV) light in plants (Witkin, 1969; Prakash and Prakash, 1977). As all of the above 12 pleiotropic QTN loci for FHB traits, DTA, and PLHT were detected in a globally diverse bread wheat panel, they could potentially be suitable for introgression into elite commercial lines with low FHB resistance, later maturity, or taller PLHT.
Non-pleiotropic QTN for DTA
Two QTNs for DTA were detected on chromosomes 1B and 7A from the MDN15 and MDN17 datasets. The QTN on chromosome 1B, QTN1B_48-206 (located at 563.67 Mb), co-locates with a disease resistance protein (570.33–570.337 Mb). It is ~8 Mb from a wheat FLOWERING LOCUS T 1-like gene (TaFT3-B1; Zikhali et al., 2017) positioned at 581.4 Mb (Luján Basile et al., 2019; Zhang et al., 2022) and falls within a 1B.1 QTL interval (544–581 Mb) region influencing DTA, PLHT, and FHB traits in durum wheat (Ruan et al., 2020). The second QTN on chromosome 7A, QTN7A_61-219 (675.23 Mb), co-locates with an uncharacterized protein located ~0.85 Mb (as per RefSeq v2.1) away from a maturity QTL QMat.dms-7A.3 (680.67–717.91 Mb in RefSeq v2.1) identified in a RIL population of a ‘Peace’ × ‘CDC Stanley’ cross (Semagn et al., 2021). The two DTA QTNs of our study are independent of those detected for FHB resistance traits. For example, the breeder could consider combining the identified FHB QTN loci with DTA loci, in a configuration that provides FHB resistance with desired maturity.
Non-pleiotropic QTN for PLHT
For PLHT, none of the QTNs detected in our study co-located with any of the commonly deployed reduced height (Rht) genes Rht-B1, Rht-D1, and Rht-8. Of the three QTN detected for PLHT, two were located on chromosome 4B, and one was located on chromosome 6B. The first on chromosome 4B, QTN4B_144-226 (located at 38.28 Mb), is associated with a protein kinase domain-containing protein, located at 10.15 Mb from the Rht-B1 the gene TraesCS4B02G043100 (4B:30861268..30863723 bp in RefSeq v2.1) represented by SNP Tdurum_contig27834_923 (30.86 Mb). Plant protein kinases catalyze the phosphorylation of proteins, some of which are associated with plant growth and development, disease resistance, and abiotic stresses (Tena et al., 2001; Nakagami et al., 2005). For example, in rice, OsMAPKKK5, a mitogen-activated protein kinase is reported to be a positive regulator of plant height and yield (Liu et al., 2019).
The second 4B QTN, QTN4B_65-145-227 (578.04 Mb), is associated with a N-acetyltransferase (NAT) domain-containing protein located within a ~30 Mb genomic region (569.2–599.6 Mb in RefSeq v2.1), which harbors genes regulating maturity and flower development (Semagn et al., 2021). NAT proteins are involved in the biosynthesis of melanin, which regulates plant growth and development (Murch et al., 2001; Murch and Saxena, 2002; Arnao and Hernández-Ruiz, 2014).
The third PLHT QTN on chromosome 6BS, QTN6B_151-229 (located at 8.78 Mb), is associated with an uncharacterized protein. High R2 values and LOD scores observed for QTN4B_65-145-227 (R2 = 17.8–33.96; LOD = 7.58–15.5) and QTN6B_151-229 (R2 = 7.6–43.58; LOD = 4.18–12.6) suggest that both QTNs could have a significant influence on PLHT. Several GWAS and QTL studies have reported physical locations of various PLHT QTLs and SNP markers on chromosome 6B (Li et al., 2018; Liu et al., 2018; Li et al., 2019; Luján Basile et al., 2019; Malik et al., 2019; Muhammad et al., 2021; Liu et al., 2022). The fact that the physical location of PLHT QTN6B_151-229 (8.78 Mb) on chromosome 6B of our study does not coincide with the physical locations of 6B QTL loci reported in the above studies suggests the novelty of the QTN6B_151-229 locus. Therefore, similar to FHB and DTA, breeders might consider recombining the above PLHT QTN and FHB QTN loci in elite lines that lack desirable FHB and PLHT traits and select for FHB-resistant lines with desired plant height and maturity suited to their respective geographical regions. For example, in Canada, recombining FHB resistance with PLHT and DTA would be most desirable in terms of developing FHB-resistant cultivars that are early maturing and semi-dwarf/short stature, making them less prone to lodging and hence beneficial from a yield standpoint. Taller lines have the added advantage of some level of escape from soil residue-borne FHB infection or Type I resistance (Mesterhazy, 1995; Miedaner, 1997; Hilton et al., 1999; Ma et al., 2000; Kolb et al., 2001; Steiner et al., 2004; Srinivasachary et al., 2008; Srinivasachary et al., 2009; Mao et al., 2010; Buerstmayr and Buerstmayr, 2015 and Buerstmayr and Buerstmayr, 2016). However, given the artificial soil inoculation with F. graminearum isolates at our nurseries, it would be necessary to determine if the identified pleiotropic (FHB and PLHT) and PLHT QTN are the results of true FHB resistance or disease escape/passive resistance of the taller lines (Mesterhazy, 1995; Klahr et al., 2007).
The detection of Fhb1 and Fhb2 would be expected given the presence of Sumai 3 in the AMP, alongside its Canadian derivatives (AAC Brandon, AAC Elie, Cardale, and AC Carberry), all originating from crosses of bridging parents Alsen and/or ND744 (Zhu et al., 2019). In addition to the statistically significant QTNs on chromosomes 1A, 1D, 2D, 3B, 5A, 6B, 7A, and 7B, detected from two or more environments, several single-environment QTNs explaining high phenotypic variances (i.e., R2 up to 36%) in INC, SEV, IND, DTA, or PLHT traits were detected. For example, 18 statistically significant QTNs for FHB traits were detected only in the OWA 2017 environment and not in the other two environments of MDN or BDN (Supplementary Material 3). All of these single-location QTNs have not been discussed here due to a lack of association with the main 17 QTNs of this study. However, genomic information on these QTNs will be useful for comparative mapping in other bread and durum wheat GWAS, in addition to bi-parental segregating population studies involving parental genotypes, which comprise our AMP.
Another interesting finding of this study might suggest the presence of potentially similar or identical QTLs for FHB, DTA, and/or other traits, in bread and durum wheat, given their proximal or near-identical genomic locations. Based on the results of a durum GWAS by Ruan et al. (2020), each of the four QTNs on chromosomes 1A, 1B, 3B, and 6B of this study shares a common location with their corresponding QTLs in durum wheat. These include QTN1A_46-252 (508.5 Mb) for INC and DTA on chromosome 1A, whose location coincides with an INC and SEV 1A.3 QTL interval (503–580 Mb) on chromosome 1A of durum wheat. The second, QTN1B_48-206 (563.67 Mb), for DTA falls within a 1B.1 QTL interval (544–581 Mb) influencing DTA, PLHT, and FHB traits in durum wheat and is located ~8 Mb from a wheat FLOWERING LOCUS T 1-like gene (TaFT3-B1). The third, QTN3B_9-16-32-77-89-96-164-185 (10.71 Mb), for FHB (INC, SEV, and IND), which was detected within the Fhb1 region on chromosome 3B, is located in close proximity to a 3B.2 (9.8 Mb) QTL of durum wheat. Finally, the fourth pleiotropic QTN6B_70-169-194 for SEV, IND, and PLHT on chromosome 6B of this study is located within a 585–707-Mb interval of a 6B.1 QTL for FHB resistance in durum wheat.
Conclusion
Given that FHB is a yield and quality-limiting disease of wheat, there is a constant need for reliable SNP markers to identify FHB-resistant genotypes. The 17 QTNs detected in this study are potentially significant from a breeding and cultivar improvement perspective. Among notable ones are the 3B QTN within the Fhb1 region, a 1B DTA QTN close to a Flowering Locus T1-like gene TaFT3-B1, a putatively novel 6B PLHT QTN, a 7A DTA QTN close to a maturity QTL QMat.dms-7A.3 of another study, and four pleiotropic QTNs, all potentially identical to their counterparts in durum wheat. Further assessment and validation of the identified QTNs are merited, for example, in bi-parental segregating or doubled-haploid populations tested across multiple environments. Once validated, the above QTN-derived KASP markers would provide breeders with options to deploy pleiotropic loci for FHB resistance and PLHT or recombine FHB resistance with PLHT and/or with DTA loci and select for FHB-resistant lines with desired maturity and height.
Data availability statement
The original contributions presented in the study are included in the article/Supplementary Material. Further inquiries can be directed to the corresponding authors.
Author contributions
RK, YR, and RC conceived, designed, and provided oversight on the study. RC and RK constructed the bread association mapping (AM) population. RC, RK, and YR contributed to the bread germplasm development and seed increase in the AM population. MH, SK, AB, SB, FB, IP, YR, RC, and RK performed field trials and disease evaluation at FHB nurseries located in Morden and Brandon, Manitoba, and Ottawa, Ontario. WZ, KB, and PF contributed to the genotyping. BM, WZ, and LL generated an initial genetic map. AC performed all statistical analyses as part of the GWAS for QTNs and candidate detection and prepared the original draft. AC, RK, YR, and RC analyzed the data and interpreted the results. AC, RK, and YR edited the original draft. All authors contributed to the article and approved the submitted version.
Funding
Financial support was received from the Saskatchewan Agriculture Development and SeCan. The work was also supported by the National Wheat Improvement Program and the Canadian Agricultural Partnership with support from Agriculture and Agri-Food Canada, Western Grains Research Foundation, Alberta Wheat Commission, Saskatchewan Wheat Development Commission, and Manitoba Crop Alliance.
Acknowledgments
We gratefully acknowledge the support of Saskatchewan Agriculture Development Fund, SeCan, Agriculture and Agri-food Canada (AAFC), Western Grain Research Foundation, and National Research Council Canada (NRC) in carrying out this study. The technical and field support of AAFC’s Swift Current, Morden, Brandon, and Ottawa Research and Development Centers is greatly appreciated.
Conflict of interest
The authors declare that the research was conducted in the absence of any commercial or financial relationships that could be construed as a potential conflict of interest.
Publisher’s note
All claims expressed in this article are solely those of the authors and do not necessarily represent those of their affiliated organizations, or those of the publisher, the editors and the reviewers. Any product that may be evaluated in this article, or claim that may be made by its manufacturer, is not guaranteed or endorsed by the publisher.
Supplementary material
The Supplementary Material for this article can be found online at: https://www.frontiersin.org/articles/10.3389/fpls.2023.1166282/full#supplementary-material
References
Anderson, J. A. (2007). Marker-assisted selection for fusarium head blight resistance in wheat. Int. J. Food. Microbiol. 119 (1-2), 51–53. doi: 10.1016/j.ijfoodmicro.2007.07.025
Anderson, J. A., Stack, R. W., Liu, S., Waldron, B. L., Fjeld, A. D., Coyne, C., et al. (2001). DNA Markers for fusarium head blight resistance QTLs in two wheat populations. Theor. Appl. Genet. 102, 1164–1168. doi: 10.1007/s001220000509
Arnao, M. B., Hernández-Ruiz, J. (2014). Melatonin: plant growth regulator and/or biostimulator during stress? Trends Plant Sci. 19 (12), 789–797. doi: 10.1016/j.tplants.2014.07.006
Aubourg, S., Boudet, N., Kreis, M., Lecharny, A. (2000). In arabidopsis thaliana, 1% of the genome codes for a novel protein family unique to plants. Plant Mol. Biol. 42 (4), 603. doi: 10.1023/A:1006352315928
Bai, G., Kolb, F. L., Shaner, G., Domier, L. L. (1999). Amplified fragment length polymorphism markers linked to a major quantitative trait locus controlling scab resistance in wheat. Phytopathology 89 (4), 343–348. doi: 10.1094/PHYTO.1999.89.4.343
Bai, G., Shaner, G. (2004). Management and resistance in wheat and barley to fusarium head blight. Annu. Rev. Phytopathol. 42, 135–161. doi: 10.1146/annurev.phyto.42.040803.140340
Barkan, A., Small, I. (2014). Pentatricopeptide repeat proteins in plants. Annu. Rev. Plant Biol. 65, 415–442. doi: 10.1146/annurev-arplant-050213-040159
Bates, D., Mächler, M., Bolker, B., Walker, S. (2015). Fitting linear mixed effects models using lme4. J. Stat. Softw. 67, 1–48. doi: 10.18637/jss.v067.i01
Benne, R., Van Den Burg, J., Brakenhoff, J. P., Sloof, P., Van Boom, J. H., Tromp, M. C. (1986). Major transcript of the frameshifted coxll gene from trypanosome mitochondria contains four nucleotides that are not encoded in the DNA. Cell 46 (6), 819–826. doi: 10.1016/0092-8674(86)90063-2
Bernardo, A. N., Ma, H., Zhang, D., Bai, G. (2012). Single nucleotide polymorphism in wheat chromosome region harboring Fhb1 for fusarium head blight resistance. Mol. Breed. 29, 477–488. doi: 10.1007/s11032-011-9565-y
Bokore, F. E., Knox, R. E., Cuthbert, R. D., Pozniak, C. J., McCallum, B. D., N’Diaye, A., et al. (2020). Mapping quantitative trait loci associated with leaf rust resistance in five spring wheat populations using single nucleotide polymorphism markers. PloS One 15 (4), e0230855. doi: 10.1371/journal.pone.0230855
Bradbury, P. J., Zhang, Z., Kroon, D. E., Casstevens, T. M., Ramdoss, Y., Buckler, E. S. (2007). TASSEL: software for association mapping of complex traits in diverse samples. Bioinformatics 23 (19), 2633–2635. doi: 10.1093/bioinformatics/btm308
Brenchley, R., Spannagl, M., Pfeifer, M., Barker, G. L., D’Amore, R., Allen, A. M., et al. (2012). Analysis of the bread wheat genome using whole-genome shotgun sequencing. Nature 491 (7426), 705–710. doi: 10.1038/nature11650
Buerstmayr, M., Buerstmayr, H. (2015). Comparative mapping of quantitative trait loci for fusarium head blight resistance and anther retention in the winter wheat population capo× arina. Theor. Appl. Genet. 128, 1519–1530. doi: 10.1007/s00122-015-2527-8
Buerstmayr, M., Buerstmayr, H. (2016). The semidwarfing alleles rht-D1b and rht-B1b show marked differences in their associations with anther-retention in wheat heads and with fusarium head blight susceptibility. Phytopathol 106 (12), 1544–1552. doi: 10.1094/PHYTO-05-16-0200-R
Buerstmayr, H., Lemmens, M., Hartl, L., Doldi, L., Steiner, B., Stierschneider, M., et al. (2002). Molecular mapping of QTLs for fusarium head blight resistance in spring wheat. i. resistance to fungal spread (Type II resistance). Theor. Appl. Genet. 104 (1), 84–91. doi: 10.1007/s001220200009
Buerstmayr, M., Steiner, B., Buerstmayr, H. (2020). Breeding for fusarium head blight resistance in wheat–progress and challenges. Plant Breed. 139 (3), 429–454. doi: 10.1111/pbr.12797
Buerstmayr, H., Steiner, B., Hartl, L., Griesser, M., Angerer, N., Lengauer, D., et al. (2003). Molecular mapping of QTLs for fusarium head blight resistance in spring wheat. II. resistance to fungal penetration and spread. Theor. Appl. Genet. 107 (3), 503–508. doi: 10.1007/s00122-003-1272-6
Colcombet, J., Lopez-Obando, M., Heurtevin, L., Bernard, C., Martin, K., Berthomé, R., et al. (2013). Systematic study of subcellular localization of arabidopsis PPR proteins confirms a massive targeting to organelles. RNA Biol. 10 (9), 1557–1575. doi: 10.4161/rna.26128
Cuthbert, P. A., Somers, D. J., Brûlé-Babel, A. (2007). Mapping of Fhb2 on chromosome 6BS: a gene controlling fusarium head blight field resistance in bread wheat (Triticum aestivum l.). Theor. Appl. Genet. 114 (3), 429–437. doi: 10.1007/s00122-006-0439-3
Cuthbert, P. A., Somers, D. J., Thomas, J., Cloutier, S., Brûlé-Babel, A. (2006). Fine mapping Fhb1, a major gene controlling fusarium head blight resistance in bread wheat (Triticum aestivum l.). Theor. Appl. Genet. 112, 1465–1472. doi: 10.1007/s00122-006-0249-7
Desjardins, A. E., Hohn, T. M. (1997). Mycotoxins in plant pathogenesis. Mol. Plant-Microbe Interact. 10, 147–152. doi: 10.1094/MPMI.1997.10.2.147
Dubcovsky, J., Dvorak, J. (2007). Genome plasticity a key factor in the success of polyploid wheat under domestication. Science 316 (5833), 1862–1866. doi: 10.1126/science.1143986
Earl, D. A., VonHoldt, B. M. (2012). STRUCTURE HARVESTER: a website and program for visualizing STRUCTURE output and implementing the evanno method. Conserv. Genet. Resours. 4 (2), 359–361. doi: 10.1007/s12686-011-9548-7
Eggert, K., Zörb, C., Mühling, K. H., Pawelzik, E. (2011). Proteome analysis of fusarium infection in emmer grains (Triticum dicoccum). Plant Pathol. 60 (5), 918–928. doi: 10.1111/j.1365-3059.2011.02442.x
Eichinger, L., Bomblies, L., Vandekerckhove, J., Schleicher, M., Gettemans, J. (1996). A novel type of protein kinase phosphorylates actin in the actin-fragmin complex. EMBO J. 15 (20), 5547–5556. doi: 10.1002/j.1460-2075.1996.tb00939.x
Etienne-Manneville, S. (2004). Actin and microtubules in cell motility: which one is in control? Traffic 5 (7), 470–477. doi: 10.1111/j.1600-0854.2004.00196.x
Evanno, G., Regnaut, S., Goudet, J. (2005). Detecting the number of clusters of individuals using the software STRUCTURE: a simulation study. Mol. Ecol. 14 (8), 2611–2620. doi: 10.1111/j.1365-294X.2005.02553.x
Fernandes, S. B., Casstevens, T. M., Bradbury, P. J., Lipka, A. E. (2022). A multi-trait multi-locus stepwise approach for conducting GWAS on correlated traits. Plant Genome 15 (2), 20200. doi: 10.1002/tpg2.20200
Franco, M. F., Lori, G. A., Cendoya, M. G., Panelo, J. S., Alonso, M. P., Mirabella, N. E., et al. (2021). Using anthesis date as a covariate to accurately assessing type II resistance to fusarium head blight in field-grown bread wheat. Crop Prot. 142, 105504. doi: 10.1016/j.cropro.2020.105504
Fung, F., Clark, R. F. (2004). Health effects of mycotoxins: a toxicological overview. J. Toxicol. Clin. Toxicol. 42 (2), 217–234. doi: 10.1081/CLT-120030947
Gale, M. D., Law, C. N., Worland, A. J. (1975). The chromosomal location of a major dwarfing gene from norin 10 in new British semi-dwarf wheats. Heredity 35 (3), 417–421. doi: 10.1038/hdy.1975.112
Gale, M. D., Marshall, G. A. (1976). The chromosomal location of gai 1 and rht 1, genes for gibberellin insensitivity and semidwarfism, in a derivative of norin 10 wheat. Heredity 37 (2), 283–289. doi: 10.1038/hdy.1976.88
Gasperini, D., Greenland, A., Hedden, P., Dreos, R., Harwood, W., Griffiths, S. (2012). Genetic and physiological analysis of Rht8 in bread wheat: an alternative source of semi-dwarfism with a reduced sensitivity to brassinosteroids. J. Exp. Bot. 63 (12), 4419. doi: 10.1093/jxb/ers138
Gilbert, J., Tekauz, A. (2000). Review: recent developments in research on fusarium head blight of wheat in Canada. Can. J. Plant Pathol. 22 (1), 1–8. doi: 10.1080/07060660009501155
Golkari, S., Gilbert, J., Prashar, S., Procunier, J. D. (2007). Microarray analysis of fusarium graminearum-induced wheat genes: identification of organ-specific and differentially expressed genes. Plant Biotechnol. J. 5 (1), 38–49. doi: 10.1111/j.1467-7652.2006.00213.x
Gunnaiah, R., Kushalappa, A. C., Duggavathi, R., Fox, S., Somers, D. J. (2012). Integrated metabolo-proteomic approach to decipher the mechanisms by which wheat QTL (Fhb1) contributes to resistance against fusarium graminearum. PloS One 7 (7), e40695. doi: 10.1371/journal.pone.0040695
Guo, P. G., Bai, G. H., Shaner, G. E. (2003). AFLP and STS tagging of a major QTL for fusarium head blight resistance in wheat. Theor. Appl. Genet. 106, 1011–1017. doi: 10.1007/s00122-002-1129-4
Hardham, A. R. (2013). Microtubules and biotic interactions. Plant J. 75 (2), 278–289. doi: 10.1111/tpj.12171
He, L., Xiao, J., Rashid, K. Y., Yao, Z., Li, P., Jia, G., et al. (2019). Genome-wide association studies for pasmo resistance in flax (Linum usitatissimum l.). Front. Plant Sci. 9. doi: 10.3389/fpls.2018.01982
Hilton, A. J., Jenkinson, P., Hollins, T. W., Parry, D. W. (1999). Relationship between cultivar height and severity of fusarium ear blight in wheat. Plant Pathol. 48, 202–208. doi: 10.1046/j.1365-3059.1999.00339.x
Hu, W., Wang, Q., Wang, S., Wang, M., Wang, C., Tian, Z., et al. (2020). Gene co-expression network analysis provides a novel insight into the dynamic response of wheat to powdery mildew stress. J. Genet. 99 (1), 1–12. doi: 10.1007/s12041-020-01206-w
Kim, J. S., Kim, K. A., Oh, T. R., Park, C. M., Kang, H. (2008). Functional characterization of DEAD-box RNA helicases in arabidopsis thaliana under abiotic stress conditions. Plant Cell Physiol. 49 (10), 1563–1571. doi: 10.1093/pcp/pcn125
Klahr, A., Zimmermann, G., Wenzel, G., Mohler, V. (2007). Effects of environment, disease progress, plant height and heading date on the detection of QTLs for resistance to fusarium head blight in a European winter wheat cross. Euphytica 154, 17–28. doi: 10.1007/s10681-006-9264-7
Kobayashi, I., Kobayashi, Y., Yamaoka, N., Kunoh, H. (1992). Recognition of a pathogen and a nonpathogen by barley coleoptile cells. III. responses of microtubules and actin filaments in barley coleoptile cells to penetration attempts. Can. J. Bot. 70 (9), 1815–1823. doi: 10.1139/b92-225
Kolb, F. L., Bai, G. H., Muehlbauer, G. J., Anderson, J. A., Smith, K. P., Fedak, G. (2001). Host and plant resistance genes for fusarium head blight: mapping and manipulation with molecular markers. Crop Sci. 41, 611–619. doi: 10.2135/cropsci2001.413611x
LaBerge, D. E., Marchylo, B. A. (1986). Changes in beta-amylase enzymes during kernel development of barley and the effect of papain as an extractant. J. Am. Soc Brew. Chem. 44 (1), 16–19. doi: 10.1094/ASBCJ-44-0016
Lan, S., Zheng, C., Hauck, K., McCausland, M., Duguid, S. D., Booker, H. M., et al. (2020). Genomic prediction accuracy of seven breeding selection traits improved by QTL identification in flax. Int. J. Mol. Sci. 21 (5), 1577. doi: 10.3390/ijms21051577
Lasko, P. F., Linder, P., Leroy, P., Nielsen, P. J., Nishi, K., Schnier, J., et al. (1989). Birth of the DEAD box. Nature 337, 121–122. doi: 10.1038/337121a0
Li, F., Wen, W., He, Z., Liu, J., Jin, H., Cao, S., et al. (2018). Genome-wide linkage mapping of yield-related traits in three Chinese bread wheat populations using high-density SNP markers. Theor. Appl. Genet. 131 (9), 1903–1924. doi: 10.1007/s00122-018-3122-6
Li, F., Wen, W., Liu, J., Zhang, Y., Cao, S., He, Z., et al. (2019). Genetic architecture of grain yield in bread wheat based on genome-wide association studies. BMC Plant Biol. 19, 168. doi: 10.1186/s12870-019-1781-3
Lipka, A. E., Tian, F., Wang, Q., Peiffer, J., Li, M., Bradbury, P. J., et al. (2012). GAPIT: genome association and prediction integrated tool. Bioinformatics 28 (18), 2397–2399. doi: 10.1093/bioinformatics/bts444
Liu, S., Anderson, J. A. (2003a). Marker assisted evaluation of fusarium head blight resistant wheat germplasm. Crop Sci. 43, 760–766. doi: 10.2135/cropsci2003.7600
Liu, S., Anderson, J. A. (2003b). Targeted molecular mapping of a major wheat QTL for fusarium head blight resistance using wheat ESTs and synteny with rice. Genome 46, 817–823. doi: 10.1139/g03-066
Liu, J., Feng, B., Xu, Z., Fan, X., Jiang, F., Jin, X., et al. (2018). A genomewide association study of wheat yield and quality-related traits in southwest China. Mol. Breed. 38, 1. doi: 10.1007/s11032-017-0759-9
Liu, S., Pumphrey, M., Gill, B., Trick, H., Zhang, J., Dolezel, J., et al. (2008). Toward positional cloning of Fhb1, a major QTL for fusarium head blight resistance in wheat. Cereal Res. Commun. 36 (Supplement-6), 195–201. doi: 10.1556/crc.36.2008.suppl.b.15
Liu, H., Shi, Z., Ma, F., Xu, Y., Han, G., Zhang, J., et al. (2022). Identification and validation of plant height, spike length and spike compactness loci in common wheat (Triticum aestivum l.). BMC Plant Biol. 22 (1), 1–17. doi: 10.1186/s12870-022-03968-0
Liu, S., Zhang, X., Pumphrey, M. O., Stack, R. W., Gill, B. S., Anderson, J. A. (2006). Complex microcolinearity among wheat, rice, and barley revealed by fine mapping of the genomic region harboring a major QTL for resistance to fusarium head blight in wheat. Funct. Integr. Genomics 6 (2), 83–89. doi: 10.1007/s10142-005-0007-y
Liu, Y., Zhu, Y., Xu, X., Sun, F., Yang, J., Cao, L., et al. (2019). OstMAPKKK5, a truncated mitogen-activated protein kinase kinase kinase 5, positively regulates plant height and yield in rice. Crop J. 7 (5), 707–714. doi: 10.1016/j.cj.2019.03.001
Long, A. D., Langley, C. H. (1999). The power of association studies to detect the contribution of candidate genetic loci to variation in complex traits. Genome Res. 9 (8), 720–731. doi: 10.1101/gr.9.8.720
Luján Basile, S. M., Ramírez, I. A., Crescente, J. M., Conde, M. B., Demichelis, M., Abbate, P., et al. (2019). Haplotype block analysis of an argentinean hexaploid wheat collection and GWAS for yield components and adaptation. BMC Plant Biol. 19 (1), 1–16. doi: 10.1186/s12870-019-2015-4
Ma, Z., Steffenson, B. J., Prom, L. K., Lapitan, N. L. (2000). Mapping of quantitative trait loci for fusarium head blight resistance in barley. Phytopathol 90 (10), 1079–1088. doi: 10.1094/PHYTO.2000.90.10.1079
Mackay, T. F. (2001). The genetic architecture of quantitative traits. Annu. Rev. Genet. 35, 303–339. doi: 10.1146/annurev.genet.35.102401.090633
Macovei, A., Vaid, N., Tula, S., Tuteja, N. (2012). A new DEAD-box helicase ATP-binding protein (OsABP) from rice is responsive to abiotic stress. Plant Signal. Behav. 7 (9), 1138–1143. doi: 10.4161/psb.21343
Malik, P. L., Janss, L., Nielsen, L. K., Borum, F., Jørgensen, H., Eriksen, B., et al. (2019). Breeding for dual-purpose wheat varieties using marker–trait associations for biomass yield and quality traits. Theor. Appl. Genet. 132 (12), 3375–3398. doi: 10.1007/s00122-019-03431-z
Manna, S. (2015). An overview of pentatricopeptide repeat proteins and their applications. Biochimie 113, 93–99. doi: 10.1016/j.biochi.2015.04.004
Mao, S. L., Wei, Y. M., Cao, W., Lan, X. J., Yu, M., Chen, Z. M., et al. (2010). Confirmation of the relationship between plant height and fusarium head blight resistance in wheat (Triticum aestivum l.) by QTL meta-analysis. Euphytica 174 (3), 343–356. doi: 10.1007/s10681-010-0128-9
McCartney, C. A., Brûlé-Babel, A. L., Fedak, G., Martin, R. A., McCallum, B. D., Gilbert, J., et al. (2016). Fusarium head blight resistance QTL in the spring wheat cross Kenyon/86ISMN 2137. Front. Microbiol. 7. doi: 10.3389/fmicb.2016.01542
McCartney, C. A., Somers, D. J., Fedak, G., DePauw, R. M., Thomas, J., Fox, S. L., et al. (2007). The evaluation of FHB resistance QTLs introgressed into elite Canadian spring wheat germplasm. Mol. Breed. 20, 209–221. doi: 10.1007/s11032-007-9084-z
McMullen, M., Bergstrom, G., De Wolf, E., Dill-Macky, R., Hershman, D., Shaner, G., et al. (2012). A unified effort to fight an enemy of wheat and barley: fusarium head blight. Plant Dis. 96 (12), 1712–1728. doi: 10.1094/PDIS-03-12-0291-FE
Mesterhazy, A. (1995). Types and components of resistance to fusarium head blight of wheat. Plant Breed. 114, 377–386. doi: 10.1111/j.1439-0523.1995.tb00816.x
Miedaner, T. (1997). Breeding wheat and rye for resistance to fusarium diseases. Plant Breed. 116, 201–220. doi: 10.1111/j.1439-0523.1997.tb00985.x
Miedaner, T., Korzun, V. (2012). Marker-assisted selection for disease resistance in wheat and barley breeding. Phytopathology 102 (6), 560–566. doi: 10.1094/PHYTO-05-11-0157
Miedaner, T., Voss, H. H. (2008). Effect of dwarfing rht genes on fusarium head blight resistance in two sets of near-isogenic lines of wheat and check cultivars. Crop Sci. 48, 2115–2122. doi: 10.2135/cropsci2008.02.0107
Miedaner, T., Wilde, F., Steiner, B., Buerstmayr, H., Korzun, V., Ebmeyer, E. (2006). Stacking quantitative trait loci (QTL) for fusarium head blight resistance from non-adapted sources in an European elite spring wheat background and assessing their effects on deoxynivalenol (DON) content and disease severity. Theor. Appl. Genet. 112, 562–569. doi: 10.1007/s00122-005-0163-4
Mizobuchi, A., Yamamoto, Y. (1989). Assembly of photosystem II polypeptides and expression of oxygen evolution activity in the chloroplasts of euglena gracilis z during the dark-light transition. BBA-Bioenergetics 977 (1), 26–32. doi: 10.1016/S0005-2728(89)80005-2
Money, D., Gardner, K., Migicovsky, Z., Schwaninger, H., Zhong, G. Y., Myles, S. (2015). LinkImpute: fast and accurate genotype imputation for nonmodel organisms. G3-Genes Genom. Genet. 5 (11), 2383–2390. doi: 10.1534/g3.115.021667
Muhammad, A., Li, J., Hu, W., Yu, J., Khan, S. U., Khan, M. H. U., et al. (2021). Uncovering genomic regions controlling plant architectural traits in hexaploid wheat using different GWAS models. Sci. Rep. 11, 6767. doi: 10.1038/s41598-021-86127-z
Murch, S. J., Campbell, S. S., Saxena, P. K. (2001). The role of serotonin and melatonin in plant morphogenesis: regulation of auxin-induced root organogenesis in in vitro-cultured explants of st. john's wort (Hypericum perforatum l.). In Vitro Cell. Dev. Biol. Plant 37, 786–793. doi: 10.1007/s11627-001-0130-y
Murch, S. J., Saxena, P. K. (2002). Melatonin: a potential regulator of plant growth and development? In Vitro Cell. Dev. Biol. Plant 38, 531–536. doi: 10.1079/IVP2002333
Nakagami, H., Pitzschke, A., Hirt, H. (2005). Emerging MAP kinase pathways in plant stress signalling. Trends Plant Sci. 10 (7), 339–346. doi: 10.1016/j.tplants.2005.05.009
Paillard, S., Schnurbusch, T., Tiwari, R., Messmer, M., Winzeler, M., Keller, B., et al. (2004). QTL analysis of resistance to fusarium head blight in Swiss winter wheat (Triticum aestivum l.). Theor. Appl. Genet. 109, 323–332. doi: 10.1007/s00122-004-1628-6
Pandey, S., Muthamilarasan, M., Sharma, N., Chaudhry, V., Dulani, P., Shweta, S., et al. (2019). Characterization of DEAD-box family of RNA helicases in tomato provides insights into their roles in biotic and abiotic stresses. Environ. Exp. Bot. 158, 107–116. doi: 10.1016/j.envexpbot.2018.11.018
Parry, D. W., Jenkinson, P., McLeod, L. (1995). Fusarium ear blight (scab) in small grain cereals–a review. Plant Pathol. 44 (2), 207–238. doi: 10.1111/j.1365-3059.1995.tb02773.x
Prakash, L., Prakash, S. (1977). Isolation and characterization of MMS-sensitive mutants of saccharomyces cerevisiae. Genetics 86 (1), 33–55. doi: 10.1093/genetics/86.1.33
Pritchard, J. K., Stephens, M., Donnelly, P. (2000). Inference of population structure using multilocus genotype data. Genetics 155, 945–959. doi: 10.1093/genetics/155.2.945
Pumphrey, M. O., Bernardo, R., Anderson, J. A. (2007). Validating the Fhb1 QTL for fusarium head blight resistance in near-isogenic wheat lines developed from breeding populations. Crop Sci. 47, 200–206. doi: 10.2135/cropsci2006.03.0206
Randhawa, H. S., Asif, M., Pozniak, C., Clarke, J. M., Graf, R. J., Fox, S. L., et al. (2013). Application of molecular markers to wheat breeding in Canada. Plant Breed. 132 (5), 458–471. doi: 10.1111/pbr.12057
R Development Core Team (2019). R: a language and environment for statistical computing (Vienna, Austria: R Foundation for Statistical Computing). Available at: https://www.R-project.org.
Rawat, N., Pumphrey, M. O., Liu, S., Zhang, X., Tiwari, V. K., Ando, K., et al. (2016). Wheat Fhb1 encodes a chimeric lectin with agglutinin domains and a pore-forming toxin-like domain conferring resistance to Fusarium head blight. Nat. Genet. 48, 1576–1580. doi: 10.1038/ng.3706
Ren, W. L., Wen, Y. J., Dunwell, J. M., Zhang, Y. M. (2018). pKWmEB: integration of kruskal–Wallis test with empirical bayes under polygenic background control for multi-locus genome-wide association study. Heredity 120 (3), 208–218. doi: 10.1038/s41437-017-0007-4
Risch, N., Merikangas, K. (1996). The future of genetic studies of complex human diseases. Science 273, 1516–1517. doi: 10.1126/science.273.5281.1516
Ruan, Y., Zhang, W., Knox, R. E., Berraies, S., Campbell, H. L., Ragupathy, R., et al. (2020). Characterization of the genetic architecture for fusarium head blight resistance in durum wheat: the complex association of resistance, flowering time, and height genes. Front. Plant Sci. 11. doi: 10.3389/fpls.2020.592064
Sari, E., Berraies, S., Knox, R. E., Singh, A. K., Ruan, Y., Cuthbert, R. D., et al. (2018). High density genetic mapping of fusarium head blight resistance QTL in tetraploid wheat. PLoS One 13 (10), e0204362. doi: 10.1371/journal.pone.0204362
Sari, E., Knox, R. E., Ruan, Y., Henriquez, M. A., Kumar, S., Burt, A. J., et al. (2020). Historic recombination in a durum wheat breeding panel enables high-resolution mapping of fusarium head blight resistance quantitative trait loci. Sci. Rep. 10 (1), 7567. doi: 10.1038/s41598-020-64399-1
Savary, S., Willocquet, L., Pethybridge, S. J., Esker, P., McRoberts, N., Nelson, A. (2019). The global burden of pathogens and pests on major food crops. Nat. Ecol. Evol. 3 (3), 430–439. doi: 10.1038/s41559-018-0793-y
Schmolke, M., Zimmermann, G., Buerstmayr, H., Schweizer, G., Miedaner, T., Korzun, V., et al. (2005). Molecular mapping of fusarium head blight resistance in the winter wheat population Dream/Lynx. Theor. Appl. Genet. 111, 747–756. doi: 10.1007/s00122-005-2060-2
Schroeder, H. W., Christensen, J. J. (1963). Factors affecting resistance of wheat to scab caused by gibberella zeae. Phytopathology 53, 831–838.
Schweiger, W., Steiner, B., Vautrin, S., Nussbaumer, T., Siegwart, G., Zamini, M., et al. (2016). Suppressed recombination and unique candidate genes in the divergent haplotype encoding Fhb1, a major fusarium head blight resistance locus in wheat. Theor. Appl. Genet. 129, 1607–1623. doi: 10.1007/s00122-016-2727-x
Semagn, K., Iqbal, M., Chen, H., Perez-Lara, E., Bemister, D. H., Xiang, R., et al. (2021). Physical mapping of QTL in four spring wheat populations under conventional and organic management systems. i. earliness. Plants 10 (5), 853. doi: 10.3390/plants10050853
Small, I. D., Peeters, N. (2000). The PPR motif–a TPR-related motif prevalent in plant organellar proteins. Trends Biochem. Sci. 25 (2), 45–47. doi: 10.1016/S0968-0004(99)01520-0
Somers, D. J., Thomas, J., DePauw, R., Fox, S., Humphreys, G., Fedak, G. (2005). Assembling complex genotypes to resist fusarium in wheat (Triticum aestivum l.). Theor. Appl. Genet. 111, 1623–1631. doi: 10.1007/s00122-005-0094-0
Srinivasachary, Gosman, N., Steed, A., Hollins, T. W., Bayles, R., Jennings, P., et al. (2009). Semi-dwarfing rht-B1 and rht-D1 loci of wheat differ significantly in their influence on resistance to fusarium head blight. Theor. Appl. Genet. 118, 695–702. doi: 10.1007/s00122-008-0930-0
Srinivasachary, Gosman, N., Steed, A., Simmonds, J., Leverington-Waite, M., Wang, Y., et al. (2008). Susceptibility to fusarium head blight is associated with the rht-D1b semi-dwarfing allele in wheat. Theor. Appl. Genet. 116, 1145–1153. doi: 10.1007/s00122-008-0742-2
Stack, R. W., McMullen, M. P. (1985). Head blighting potential of fusarium species associated with spring wheat heads. Can. J. Plant Pathol. 7, 79–82. doi: 10.1080/07060668509501519
Staiger, C. J., Schliwa, M. (1987). Actin localization and function in higher plants. Protoplasma 141, 1–12. doi: 10.1007/BF01276783
Steiner, B., Buerstmayr, M., Michel, S., Schweiger, W., Lemmens, M., Buerstmayr, H. (2017). Breeding strategies and advances in line selection for fusarium head blight resistance in wheat. Trop. Plant Pathol. 42, 165–174. doi: 10.1007/s40858-017-0127-7
Steiner, B., Lemmens, M., Griesser, M., Scholz, U., Schondelmaier, J., Buerstmayr, H. (2004). Molecular mapping of resistance to fusarium head blight in the spring wheat cultivar frontana. Theor. Appl. Genet. 109, 215–224. doi: 10.1007/s00122-004-1620-1
Su, Z., Bernardo, A., Tian, B., Chen, H., Wang, S., Ma, H., et al. (2019). A deletion mutation in TaHRC confers Fhb1 resistance to fusarium head blight in wheat. Nat. Genet. 51 (7), 1099–1105. doi: 10.1038/s41588-019-0425-8
Sugihara, K., Hanagata, N., Dubinsky, Z., Baba, S., Karube, I. (2000). Molecular characterization of cDNA encoding oxygen evolving enhancer protein 1 increased by salt treatment in the mangrove bruguiera gymnorrhiza. Plant Cell Physiol. 41 (11), 1279–1285. doi: 10.1093/pcp/pcd061
Takabatake, R., Hata, S., Taniguchi, M., Kouchi, H., Sugiyama, T., Izui, K. (1999). Isolation and characterization of cDNAs encoding mitochondrial phosphate transporters in soybean, maize, rice, and arabidopsis. Plant Mol. Biol. 40, 479–486. doi: 10.1023/A:1006285009435
Takemoto, D., Hardham, A. R. (2004). The cytoskeleton as a regulator and target of biotic interactions in plants. Plant Physiol. 136 (4), 3864–3876. doi: 10.1104/pp.104.052159
Takemoto, D., Jones, D. A., Hardham, A. R. (2003). GFP-tagging of cell components reveals the dynamics of subcellular re-organization in response to infection of arabidopsis by oomycete pathogens. Plant J. 33, 775–792. doi: 10.1046/j.1365-313X.2003.01673.x
Takenaka, M., Zehrmann, A., Verbitskiy, D., Kugelmann, M., Härtel, B., Brennicke, A. (2012). Multiple organellar RNA editing factor (MORF) family proteins are required for RNA editing in mitochondria and plastids of plants. Proc. Natl. Acad. Sci. 109 (13), 5104–5109. doi: 10.1073/pnas.1202452109
Tamba, C. L., Ni, Y. L., Zhang, Y. M. (2017). Iterative sure independence screening EM-Bayesian LASSO algorithm for multi-locus genome-wide association studies. PLoS Comput. Biol. 13 (1), e1005357. doi: 10.1371/journal.pcbi.1005357
Tamba, C. L., Zhang, Y. M. (2018). A fast mrMLM algorithm for multi-locus genome-wide association studies. biorxiv. 341784. doi: 10.1101/341784
Tang, Y., Liu, X., Wang, J., Li, M., Wang, Q., Tian, F., et al. (2016). GAPIT version 2: an enhanced integrated tool for genomic association and prediction. Plant Genome 9 (2), plantgenome2015–11. doi: 10.3835/plantgenome2015.11.0120
Tena, G., Asai, T., Chiu, W. L., Sheen, J. (2001). Plant mitogen-activated protein kinase signaling cascades. Curr. Opin. Plant Biol. 4 (5), 392–400. doi: 10.1016/S1369-5266(00)00191-6
Waldron, B. L., Moreno-Sevilla, B., Anderson, J. A., Stack, R. W., Frohberg, R. C. (1999). RFLP mapping of QTL for fusarium head blight resistance in wheat. Crop Sci. 39, 805–811. doi: 10.2135/cropsci1999.0011183X003900030032x
Walter, S., Brennan, J. M., Arunachalam, C., Ansari, K. I., Hu, X., Khan, M. R., et al. (2008). Components of the gene network associated with genotype-dependent response of wheat to the fusarium mycotoxin deoxynivalenol. Funct. Integr. Genomics 8, 421–427. doi: 10.1007/s10142-008-0089-4
Wang, S. B., Feng, J. Y., Ren, W. L., Huang, B., Zhou, L., Wen, Y. J., et al. (2016a). Improving power and accuracy of genome-wide association studies via a multi-locus mixed linear model methodology. Sci. Rep. 6 (1), 1–10. doi: 10.1038/srep19444
Wang, S. B., Wen, Y. J., Ren, W. L., Ni, Y. L., Zhang, J., Feng, J. Y., et al. (2016b). Mapping small-effect and linked quantitative trait loci for complex traits in backcross or DH populations via a multi-locus GWAS methodology. Sci. Rep. 6 (1), 29951. doi: 10.1038/srep29951
Wang, S., Wong, D., Forrest, K., Allen, A., Chao, S., Huang, B. E., et al. (2014). Characterization of polyploid wheat genomic diversity using a high-density 90,000 single nucleotide polymorphism array. Plant Biotechnol. J. 12 (6), 787–796. doi: 10.1111/pbi.12183
Wang, Y., Yang, L., Xu, H., Li, Q., Ma, Z., Chu, C. (2005). Differential proteomic analysis of proteins in wheat spikes induced by fusarium graminearum. Proteomics 5 (17), 4496–4503. doi: 10.1002/pmic.200401317
Wang, J., Zhang, Z. (2021). GAPIT version 3: boosting power and accuracy for genomic association and prediction. Genom. Proteom. Bioinform. 19 (4), 629–640. doi: 10.1016/j.gpb.2021.08.005
Wen, Y. J., Zhang, H., Ni, Y. L., Huang, B., Zhang, J., Feng, J. Y., et al. (2018). Methodological implementation of mixed linear models in multi-locus genome-wide association studies. Brief. Bioinform. 19 (4), 700–712. doi: 10.1093/bib/bbw145
Witkin, E. M. (1969). Ultraviolet-induced mutation and DNA repair. Annu. Rev. Genet. 3 (1), 525–552.
Wu, L., Zhang, Y., He, Y., Jiang, P., Zhang, X., Ma, H. (2019). Genome-wide association mapping of resistance to fusarium head blight spread and deoxynivalenol accumulation in Chinese elite wheat germplasm. Phytopathology 109 (7), 1208–1216. doi: 10.1094/PHYTO-12-18-0484-R
Xue, S., Li, G., Jia, H., Xu, F., Lin, F., Tang, M., et al. (2010). Fine mapping Fhb4, a major QTL conditioning resistance to fusarium infection in bread wheat (Triticum aestivum l.). Theor. Appl. Genet. 121, 147–156. doi: 10.1007/s00122-010-1298-5
Xue, S., Xu, F., Tang, M., Zhou, Y., Li, G., An, X., et al. (2011). Precise mapping Fhb5, a major QTL conditioning resistance to fusarium infection in bread wheat (Triticum aestivum l.). Theor. Appl. Genet. 123 (6), 1055–1063. doi: 10.1007/s00122-011-1647-z
Yang, Z. P., Gilbert, J., Somers, D. J., Fedak, G., Procunier, J. D., McKenzie, I. H. (2003). Marker assisted selection of fusarium head blight resistance genes in two doubled haploid populations of wheat. Mol. Breed. 12, 309–317. doi: 10.1023/B:MOLB.0000006834.44201.48
Yang, G., Pan, Y., Zhao, Q., Huang, J., Pan, W., Cui, L., et al. (2022). Genome-wide identification and characterization of RNA/DNA differences associated with fusarium graminearum infection in wheat. Int. J. Mol. Sci. 23 (14), 7982. doi: 10.3390/ijms23147982
Zhang, J., Feng, J. Y., Ni, Y. L., Wen, Y. J., Niu, Y., Tamba, C. L., et al. (2017). pLARmEB: integration of least angle regression with empirical bayes for multilocus genome-wide association studies. Heredity 118 (6), 517–524. doi: 10.1038/hdy.2017.8
Zhang, X., Fu, J., Hiromasa, Y., Pan, H., Bai, G. (2013). Differentially expressed proteins associated with fusarium head blight resistance in wheat. PLoS One 8 (12), e82079. doi: 10.1371/journal.pone.0082079
Zhang, J., Islam, M. S., Zhao, Y., Anwar, M., Alhabbar, Z., She, M., et al. (2022). Non-escaping frost tolerant QTL linked genetic loci at reproductive stage in six wheat DH populations. Crop J. 10 (1), 147–165. doi: 10.1016/j.cj.2021.02.015
Zhang, Y. W., Tamba, C. L., Wen, Y. J., Li, P., Ren, W. L., Ni, Y. L., et al. (2020). mrMLM v4.0.2: an r platform for multi-locus genome-wide association studies. Genom. Proteom. Bioinform. 18 (4), 481–487. doi: 10.1016/j.gpb.2020.06.006
Zhang, X. M., Zhao, X. Q., Feng, C. X., Liu, N., Feng, H., Wang, X. J., et al. (2014). The cloning and characterization of a DEAD-box RNA helicase from stress-responsive wheat. Physiol. Mol. Plant Pathol. 88, 36–42. doi: 10.1016/j.pmpp.2014.07.004
Zhao, M., Wang, G., Leng, Y., Wanjugi, H., Xi, P., Grosz, M. D., et al. (2018). Molecular mapping of fusarium head blight resistance in the spring wheat line ND2710. Phytopathology 108 (8), 972–979. doi: 10.1094/PHYTO-12-17-0392-R
Zhou, W., Kolb, F. L., Bai, G., Shaner, G., Domier, L. L. (2002). Genetic analysis of scab resistance QTL in wheat with microsatellite and AFLP markers. Genome 45 (4), 719–727. doi: 10.1139/g02-034
Zhou, W., Kolb, F. L., Riechers, D. E. (2005). Identification of proteins induced or upregulated by fusarium head blight infection in the spikes of hexaploid wheat (Triticum aestivum). Genome 48 (5), 770–780. doi: 10.1139/g05-041
Zhu, Z., Hao, Y., Mergoum, M., Bai, G., Humphreys, G., Cloutier, S., et al. (2019). Breeding wheat for resistance to fusarium head blight in the global north: China, USA, and Canada. Crop J. 7 (6), 730–738. doi: 10.1016/j.cj.2019.06.003
Zhu, Z., Xu, X., Fu, L., Wang, F., Dong, Y., Fang, Z., et al. (2021). Molecular mapping of quantitative trait loci for fusarium head blight resistance in a doubled haploid population of Chinese bread wheat. Plant Dis. 105 (05), 1339–1345. doi: 10.1094/PDIS-06-20-1186-RE
Zikhali, M., Wingen, L. U., Leverington-Waite, M., Specel, S., Griffiths, S. (2017). The identification of new candidate genes triticum aestivum FLOWERING LOCUS T3-B1 (TaFT3-B1) and TARGET OF EAT1 (TaTOE1- B1) controlling the short-day photoperiod response in bread wheat. Plant Cell Environ. 40, 2678–2690. doi: 10.1111/pce.13018
Keywords: Fusarium head blight, spring wheat, QTN, GWAS, plant height, days to anthesis
Citation: Cabral AL, Ruan Y, Cuthbert RD, Li L, Zhang W, Boyle K, Berraies S, Henriquez MA, Burt A, Kumar S, Fobert P, Piche I, Bokore FE, Meyer B, Sangha J and Knox RE (2023) Multi-locus genome-wide association study of fusarium head blight in relation to days to anthesis and plant height in a spring wheat association panel. Front. Plant Sci. 14:1166282. doi: 10.3389/fpls.2023.1166282
Received: 15 February 2023; Accepted: 03 May 2023;
Published: 29 June 2023.
Edited by:
Carolina Ballen-Taborda, Clemson University, United StatesReviewed by:
Dinakaran Elango, Iowa State University, United StatesThomas Miedaner, University of Hohenheim, Germany
Uday Chand Jha, Indian Institute of Pulses Research (ICAR), India
Copyright © 2023 Wentao Zhang, Kerry Boyle, Pierre Fobert and His Majesty the King in Right of Canada, as represented by the Minister of Agriculture and Agri-Food Canada for the contribution of Adrian L. Cabral, Yuefeng Ruan, Richard D. Cuthbert, Lin Li, Samia Berraies, Maria A. Henriquez, Andrew Burt, Santosh Kumar, Isabelle Piche, Firdissa E. Bokore, Brad Meyer, Jatinder Sangha, Ron E. Knox. This is an open-access article distributed under the terms of the Creative Commons Attribution License (CC BY). The use, distribution or reproduction in other forums is permitted, provided the original author(s) and the copyright owner(s) are credited and that the original publication in this journal is cited, in accordance with accepted academic practice. No use, distribution or reproduction is permitted which does not comply with these terms.
*Correspondence: Yuefeng Ruan, eXVlZmVuZy5ydWFuQGFnci5nYy5jYQ==; Richard D. Cuthbert, cmljaGFyZC5jdXRoYmVydEBhZ3IuZ2MuY2E=