- 1Dryland Farming Institute, Hebei Academy of Agricultural and Forestry Sciences/Hebei Key Laboratory of Crops Drought Resistance, Hengshui, China
- 2Engineering Research Centre of Cotton, Ministry of Education/College of Agriculture, Xinjiang Agricultural University, Urumqi, China
- 3Cash Crop Research Institute of Jiangxi Province, Jiujiang, Jiangxi, China
Introduction: Starch metabolism is involved in the stress response. Starch synthase (SS) is the key enzyme in plant starch synthesis, which plays an indispensable role in the conversion of pyrophosphoric acid to starch. However, the SS gene family in cotton has not been comprehensively identified and systematically analyzed.
Result: In our study, a total of 76 SS genes were identified from four cotton genomes and divided into five subfamilies through phylogenetic analysis. Genetic structure analysis proved that SS genes from the same subfamily had similar genetic structure and conserved sequences. A cis-element analysis of the SS gene promoter showed that it mainly contains light response elements, plant hormone response elements, and abiotic stress elements, which indicated that the SS gene played key roles not only in starch synthesis but also in abiotic stress response. Furthermore, we also conducted a gene interaction network for SS proteins. Silencing GhSS9 expression decreased the resistance of cotton to drought stress. These findings suggested that SS genes could be related to drought stress in cotton, which provided theoretical support for further research on the regulation mechanism of SS genes on abiotic starch synthesis and sugar levels.
Introduction
As the products of photosynthesis, plant starches are the main food for humans (Deschamps et al., 2008; Abdelgawad et al., 2020). Starches fall into two main categories. One kind of starch is made in the leaves of plants and temporarily stored as temporary starch, and the other is found in the fruits, seeds, and rhizomes of plants such as cereals and potatoes, which provide nutrients and energy for the development of offspring (Zeeman SC and Rees, 2010; Santelia and Zeeman, 2011). Both temporary starch and storage starch exist in the form of starch granules (Smith et al., 1997). Starches are glucose polymers connected by α-1,4 glycosidic and α-1,6 glycosidic bonds and are divided into amylose and amylopectin according to their structure (Gidley and Bociek, 1988; Buléon et al., 1998). Amylose has a small molecular weight and few α-1,6 glycosidic bond branches. Amylopectin has a higher polymerization degree, a higher molecular weight, and more α-1,6 glycosidic bond branches (Miles et al., 1985). Starch biosynthesis in maize seedlings contributes to the maintenance of leaf growth under drought stress and facilitates enhanced carbon acquisition upon recovery (Abdelgawad et al., 2020). Under drought stress, the transient starch in Arabidopsis thaliana is degraded to the carbon skeleton of sucrose and proline, or starches are broken down into soluble sugars that act as osmotic protectants to counteract osmotic pressure and oxidative damage (Zeeman et al., 2010; Zanella et al., 2016). The above pieces of evidence show that starches play an important role in plants’ resistance to drought stress.
Starches are synthesized with the participation of various enzymes related to starch synthesis. It is generally believed that the following key enzymes are required for starch synthesis: starch synthase (SS), ADP-glucose pyrophosphorylase (AGPase), starch branching enzyme (SBE), and starch debranching enzyme (DBE) (Dian et al., 2005). Among these enzymes, the SS gene family plays an important role in material storage and energy reserve (He et al., 2022). SSs can be divided into two categories according to their degree of binding to starch granules, enzymatic characteristics, and gene structure. One is granule-bound starch synthase (GBSS), and the other is soluble starch synthase (SS) (Dian et al., 2005). Dian et al. identified that amylose in rice leaves was synthesized by GBSS II (Dian et al., 2003; Zhang et al., 2021). GBSS II was also isolated from the non-storage organs of pea and wheat, which were used in the synthesis of temporary starch (Denyer et al., 1993; Yasunori, 2002). Soluble starch synthase can be divided into SSI, SSII, SSIII, and SSIV according to its amino acid structure (Mu-Forster, 1996). The activity ratios of various starch synthases in different plants or different tissues of the same plant are different (Smith et al., 1997).
The level of sugar in higher plants regulates the whole growth and development process from germination to flowering to senescence (Ding, 1998). Sugar is not only used for energy metabolism in plants but also plays an important role in plant growth and development, metabolic regulation, and stress resistance (Zhao, 2006). Glucose 1-phosphate is produced by glucose-phosphorylase and converted to starch by starch synthase. Inhibiting starch synthesis can result in pollen abortion, organ atrophy, and delayed development or aging (Dorion and Saini, 1996). The increase in sugar levels in plants will promote the synthesis and accumulation of starch (Matt et al., 1998). Starch is not only a storage compound but also a regulator under stress conditions. When carbohydrate assimilation is impaired under stress, starch metabolism can buffer the adverse effects of stress-induced carbon depletion (Kaplan and Guy, 2004; Wim et al., 2014). Under drought stress, the starch in broad bean leaves was depleted, but it accumulated in the pods (Hernández et al., 2012). The activity of SS family genes and the accumulation rate of starch decreased in wheat under drought stress (Hou et al., 2017).
Based on the role of SSs in starch synthesis, SS genes may be a good target for crop improvement and abiotic stress resistance. As an important cash crop, cotton’s growth and development are affected by biological and abiotic factors. Otherwise, the SS family in cotton has not been studied. In our study, we used bioinformatics to synthesize the whole genomes of the SS families of G. arboreum, G. raimondii, G. hirsutum, and G. barbadense. Our results lay the foundation for further research into the mechanism by which SS genes regulate starch synthesis and sugar levels during plant development and their response to abiotic stress.
Materials and methods
Identification of SS family in cotton
To obtain SS family members in cotton, we downloaded the reference sequence file of A. thaliana from The Arabidopsis Information Resource online database (TAIR 10.1) (https://www.arabidopsis.org/). The newly updated version of the four cotton genome files, G. arboretum (BGI), G. raimondii (BGI), G. hirsutum (ZJU), and G. barbadense (ZJU), was downloaded from COTTONGEN (https://www.cottongen.org/). The reference sequence file of A. thaliana SSs was used as a query target to search against the genome file of four cotton species using local software Blast 2.13. Thus, candidate gene members of the SS family in four cotton genomes were obtained. The Hidden Markov Model (HMM) profile of PF08323 was downloaded from Pfam (https://pfam.xfam.org/). These genes were further screened using Pfam (https://pfam.xfam.org/) and SMART (http://SMART.emblheidelberg.de/). We only retained genes from the Glyco_transf_5 domain. We also analyzed theoretical isoelectric point (pI), molecular weight (MW), and subcellular location predictions for these SS proteins. We used several web sites, such as Cell-PLoc 2.0 (http://www.csbio.sjtu.edu.cn/bioinf/plant-multi/), to predict the subcellular location of the SSs. Expasy (https://web.expasy.org/compute_pi/) predicted the MW and pI of SSs.
Phylogenetic analysis
We aligned the amino acid sequences of A. thaliana and Oryza sativa L. and four cotton species by ClustalX v1.83 (Larkin et al., 2007) with default parameters. We used MEGA 7.0 (Kumar, 2016) to find the best model and build the developmental tree. The SS protein sequences of the four cotton genomes were entered into MEGA 7.0 software. Muscle was used for multiple sequence alignment, and the neighbor method was used to construct the intra-species evolutionary tree.
Analysis of the conserved motifs and gene structure of SS genes
We used the MEME (http://meme-suite.org/) website to predict the conserved motif of the SS proteins. The GFF files of the four genomes were merged using cmd instructions. Figures of the SS phylogenetic tree, conserved motifs, and introns and exons were drawn with TBtools software using nwk profiles (Chen et al., 2018), MAST profiles, and GFF profiles.
Chromosomal location analysis
Download the gene annotation files (GFF) for the four cotton genomes from COTTONGENE (https://www.cottongen.org/). The genes displayed on the chromosome were obtained by TBtools software using the GFF file.
Collinearity analysis
To investigate the collinearity of SS genes in four cotton genomes, we used MCScanX (Wang et al., 2012) software to analyze the synchronous relationships between duplicate gene pairs in four cotton genomes. Graphical results were displayed by TBtools software (Chen et al., 2018).
Calculation of Ka/Ks
The cds sequences of SS genes from four cotton genomes were downloaded from COTTONGENE. We calculated the nonsynonymous (Ka) and synonymous (Ks) substitution rates and Ka/Ks ratio with the KaKs Calculator 2.0 program using the homologous gene pairs of four cotton genomes obtained during collinearity analysis (Dapeng et al., 2010).
Analysis of the cis−elements of SS genes
We used TBtools software to obtain 1,000-bp DNA sequences upstream of SS genes in four cotton genomes. The cis element in the promoter was predicted by the PlantCARE website (http://bioinformatics.psb.ugent.be/webtools/plantcare/html/). We selected cis elements that respond to plant hormones, light, and other stresses for further analysis.
Interaction network of GhSS proteins
To analyze the interaction networks of GhSS proteins, we performed this analysis using the STRING database (https://STRING-db.org/).
Virus−induced gene silencing and drought treatment
A total of 403 bp of GhSS9 was inserted into the pYL156 vector (which was cut with the restriction enzymes XbaI and BamHI). We constructed pYL156:GhSS9, the positive control pYL156:PDS, and the negative control pYL156. The primers for the GhSS9 silencing fragment were as follows: the forward primer, ‘5-GTGAGTAAGGTTACCGAATTCTATTATCTTTGTGGGAGCTGAGGTT-3’ and the reverse primer, ‘5-CGTGAGCTCGGTACCGGATCCTTGCTGCTATTTAAATTCAGAACTCTT-3.’ When plants reached the three-leaf stage, the control group was irrigated with pure water as required, while the experimental group was controlled in soil drought stress by no watering. After 3 days of treatment, we collected the true leaves of the plants to analyze the relative expression level of GhSS9.
Results
Identification of SS genes
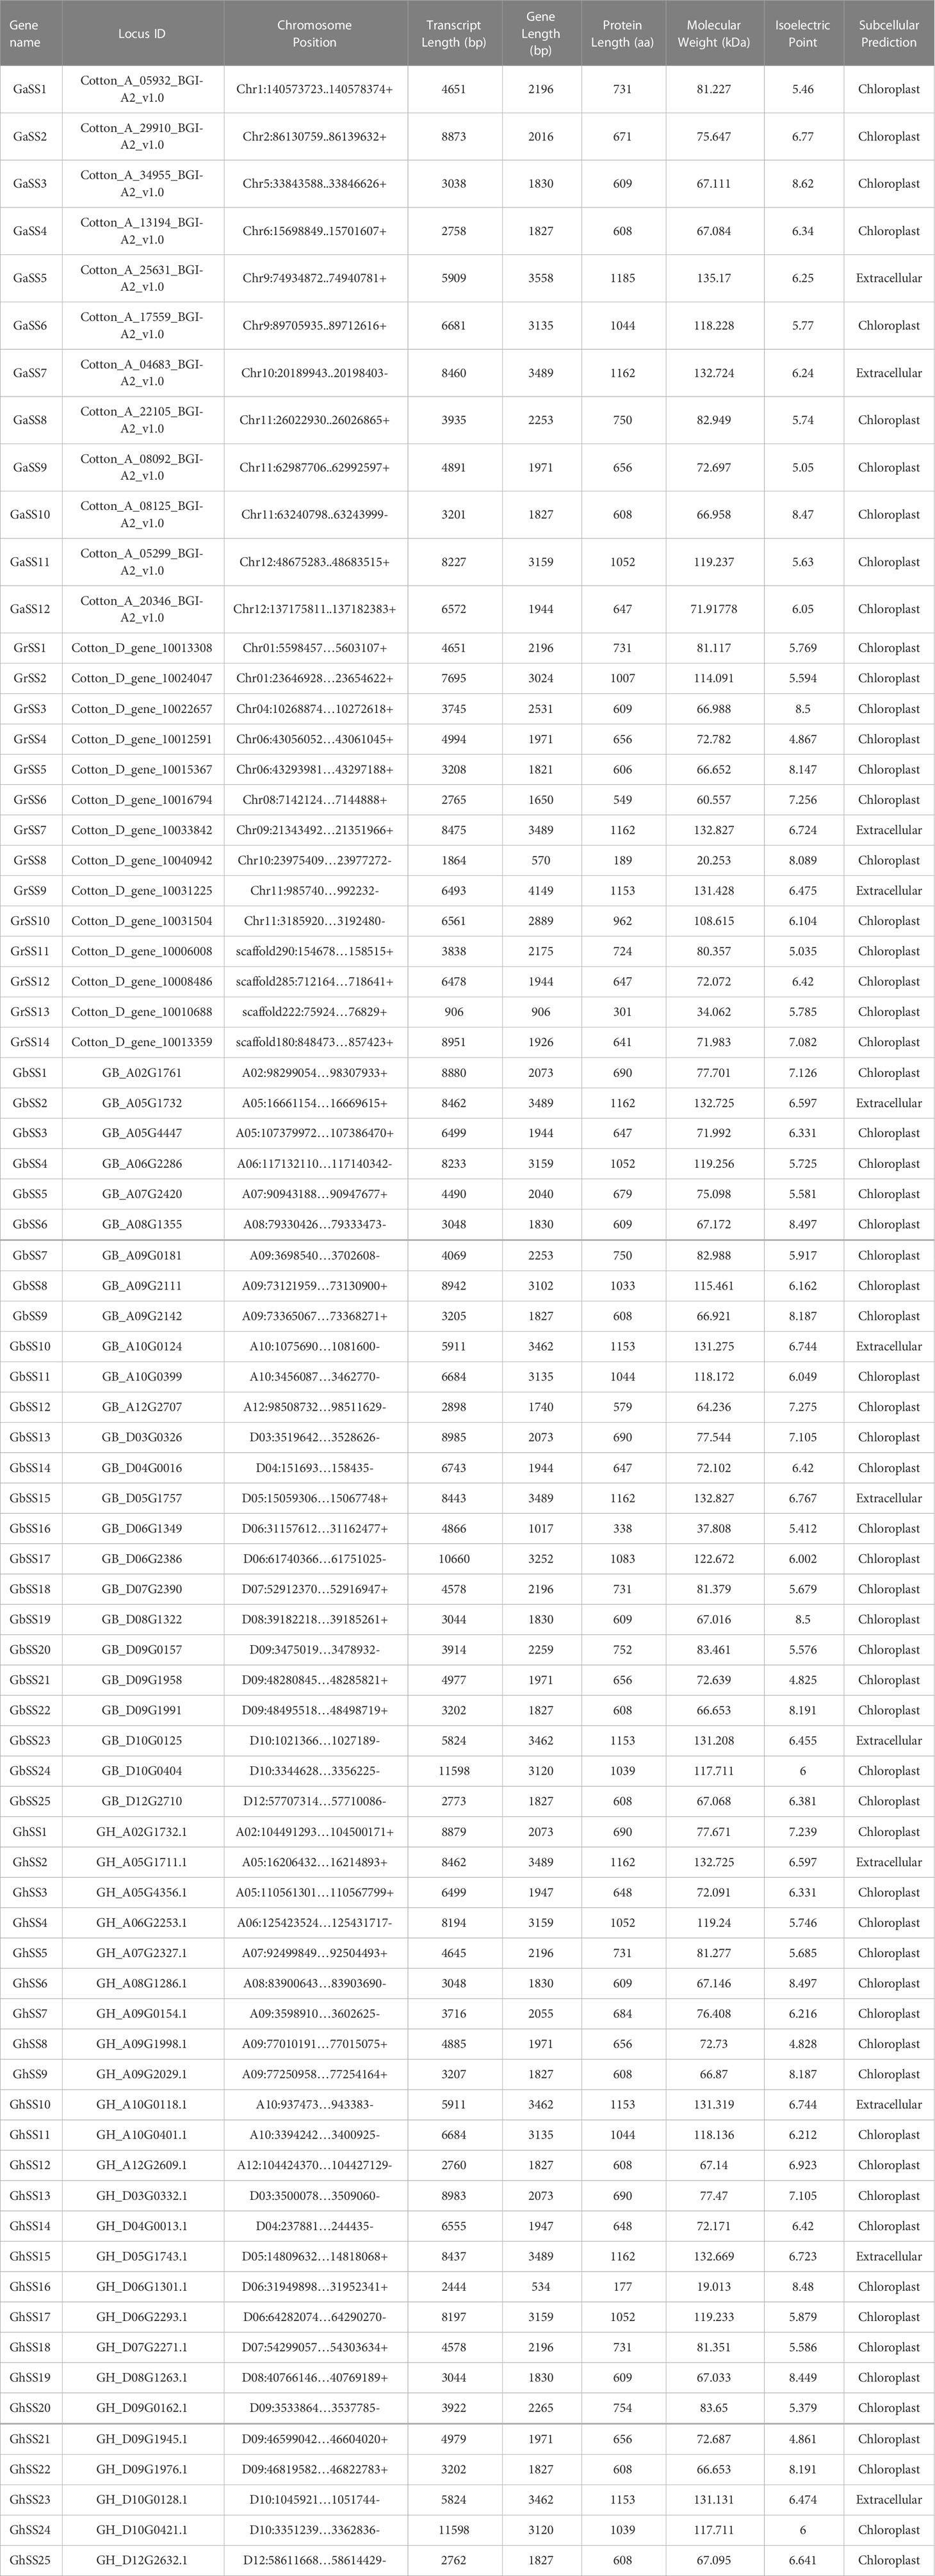
We identified 12, 14, 25, and 25 SS members from G. arboreum, G. raimondii, G. hirsutum, and G. barbadense. According to the position of the gene on the chromosome, we renamed 76 SS members. We further analyzed SS family members’ length, molecular weight, theoretical isoelectric point, and subcellular localization prediction. The length of the SS protein sequence was different in cotton, but the physicochemical properties were similar. All 76 genes encode proteins ranging from 177 (GhSS16) to 1,185 (GaSS5) amino acids, with pIs varying from 4.25 (GbSS21) to 8.62 (GaSS3) and MWs varying from 135.17 (GaSS5) kDa to 19.013 (GhSS16) kDa (Table 1). For the prediction of the subcellular localization of SS proteins, we found that most of the SS proteins were localized to chloroplasts, and only 12 proteins were localized to the extracellular domain.
Phylogenetic analysis of the SS family
In order to study the evolutionary relationships of the SS family genes in O. sativa L., A. thaliana, and cotton, we constructed phylogenetic trees using protein sequences of SS family members (Figure 1). The results showed that the SS family was divided into five subfamilies; each subfamily had 25, 16, 14, 16, and 20 members in cotton, respectively. The total number of G. hirsutum (AD1) and G. barbadense (AD2) SS was the same in each subfamily. The total number of SS members of G. arboreum (A) and G. raimondii (D) was the same as the number of SS members of allotetraploid cotton (G. hirsutum (AD1) or G. barbadense (AD2) in the I, II, III, and V subfamilies. This was consistent with the hypothesis of the origin and history of allotetraploid cotton (Brubaker et al., 1999). The I subfamily has 25 members, making it the largest subfamily. We speculate that the I subfamily member may play an active role in starch synthesis in cotton and A. thaliana.
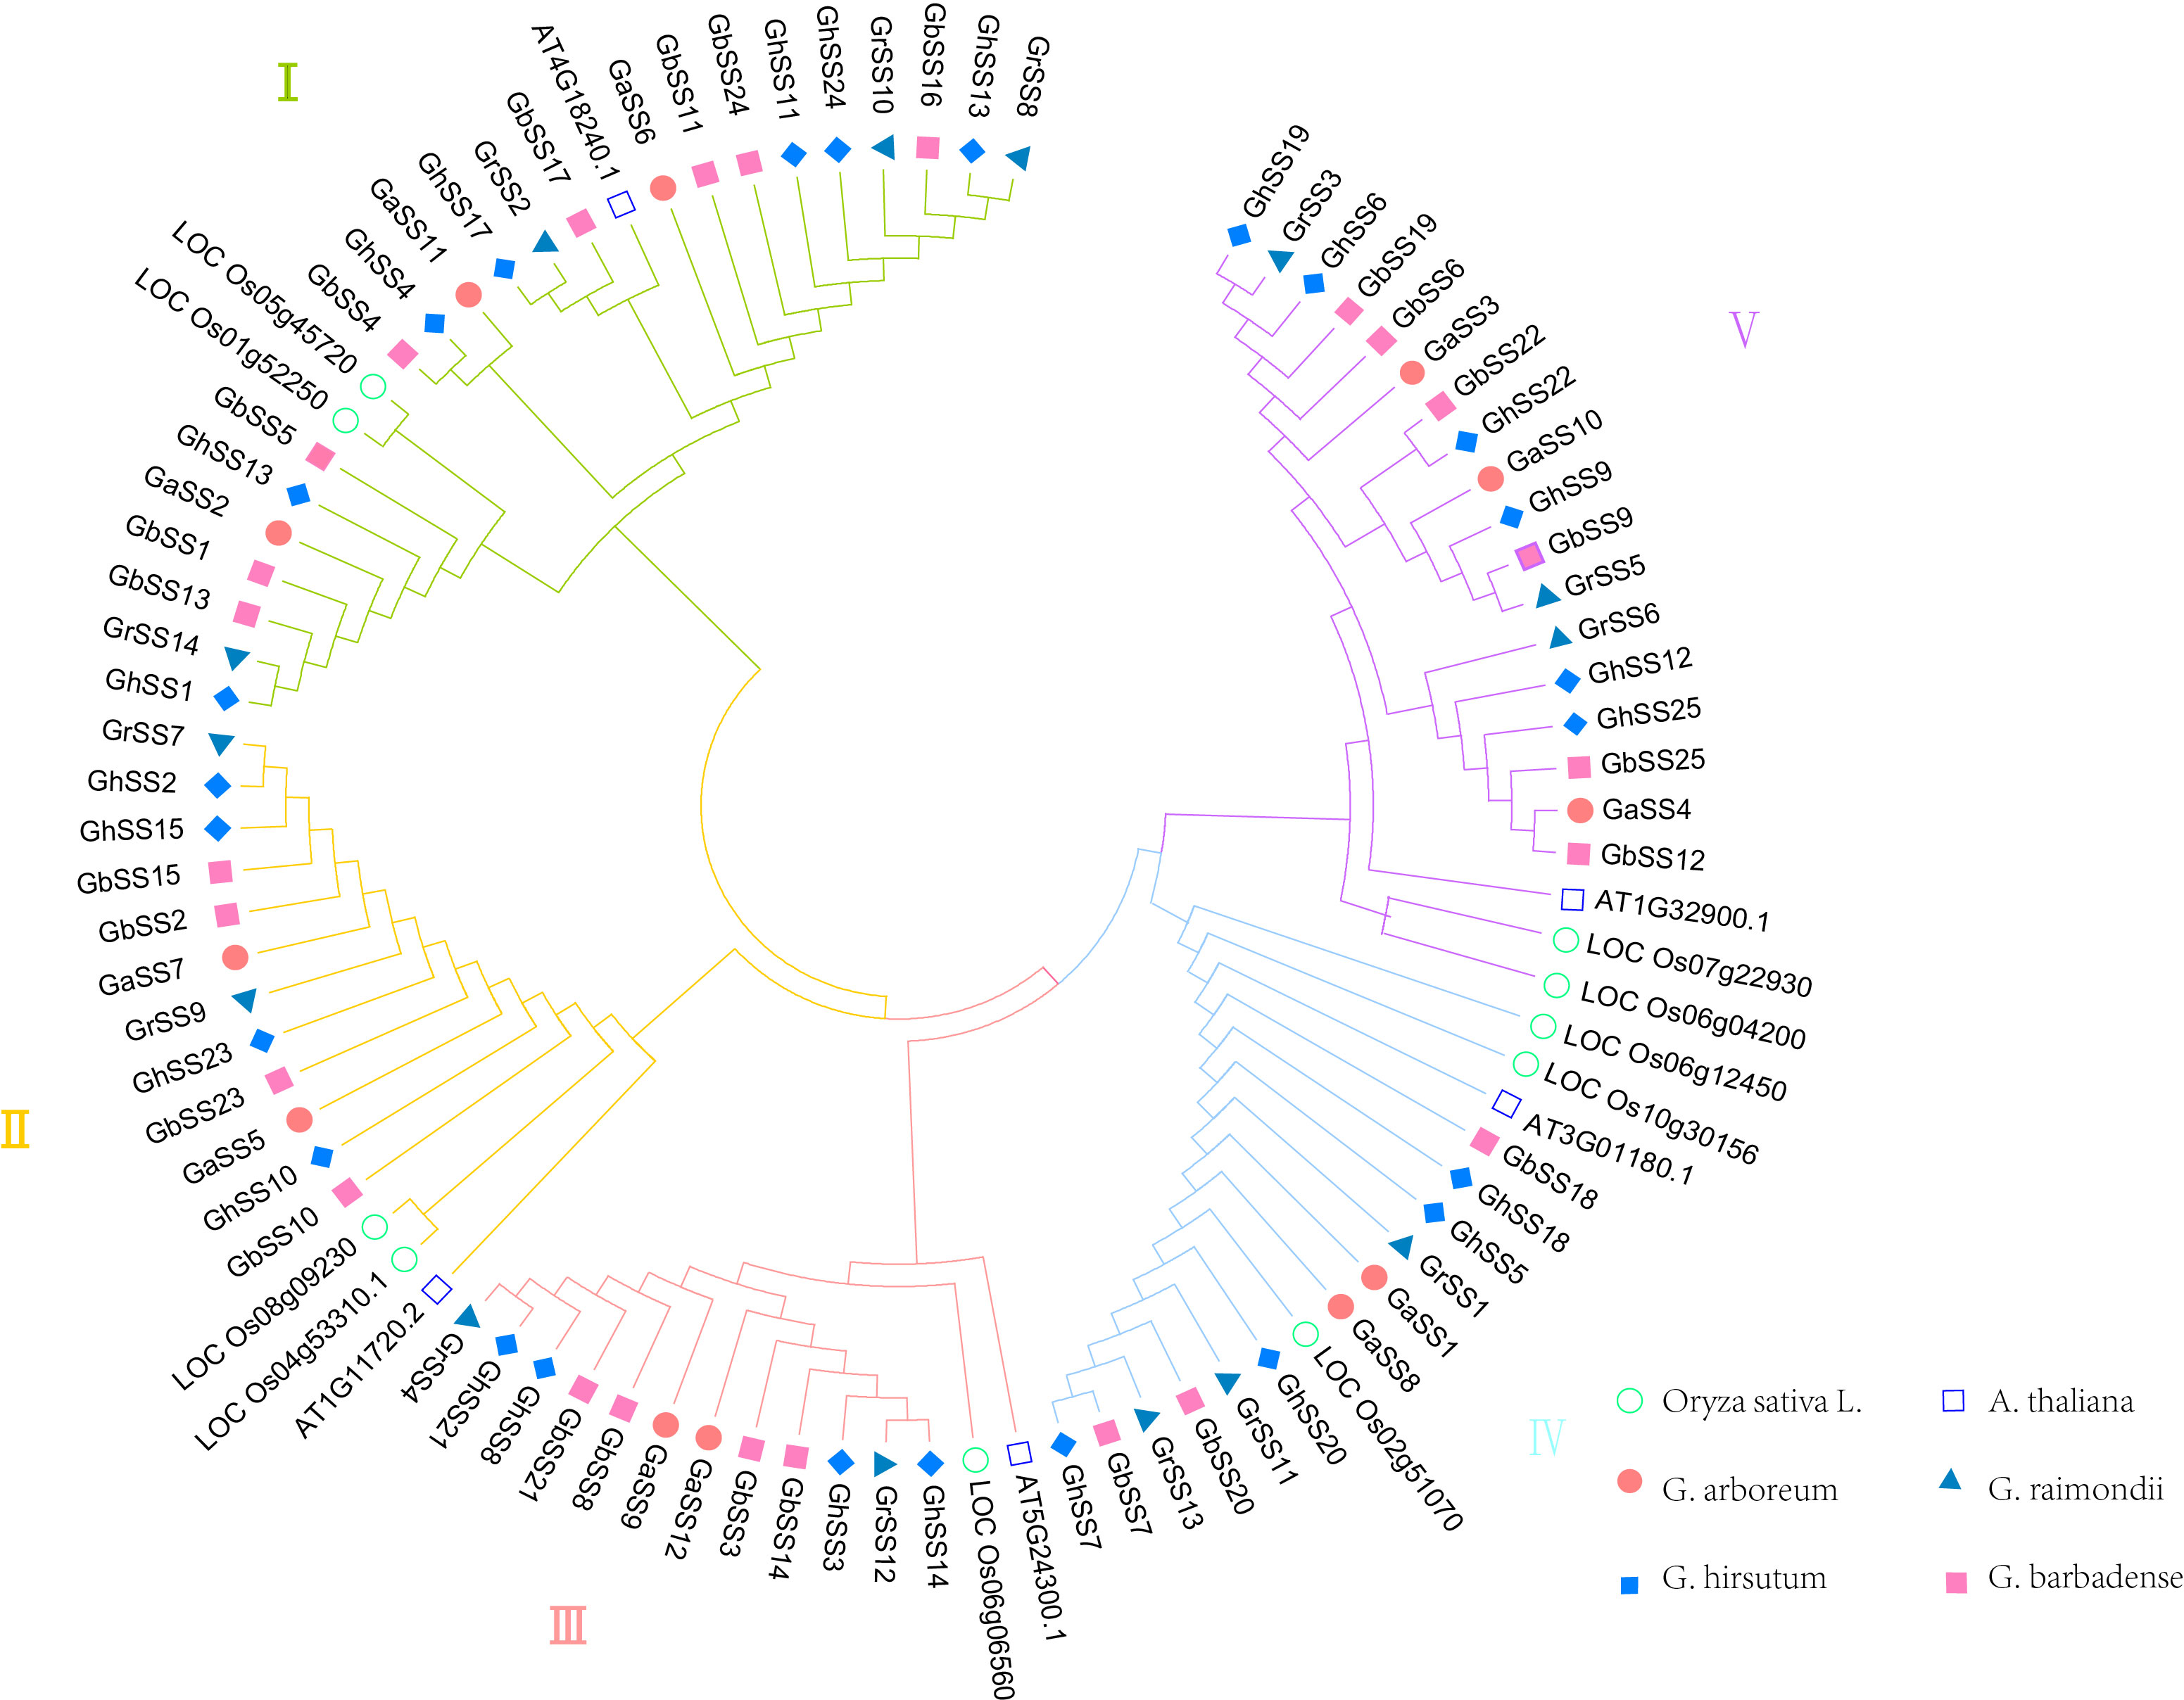
Figure 1 Phylogenetic analysis of SS protein from Oryza sativa L., Arabidopsis thaliana, and cotton.
Structure of SS genes and conserved motifs
We analyzed the exon-intron structure and conserved motifs of the SS genes as shown in Figure 2. Ten motifs (1–10) were defined in SS members using MEME. All SS proteins contained motifs 3 and 4. We inferred that motifs 3 and 4 were important components of SS proteins. Genes in the same subfamily had similar gene structures and conserved motifs, and genes were specific between different subfamilies, indicating that SS families were more conserved during evolution and played multiple functions (Xwa et al., 2020). For example, subfamily III contained motifs 1–9. The members of subfamily V all contained motifs 1–4, 6–9. The number of exons in each SS family varied from 1 to 26. The number of exons was different in different subfamilies, and most genes in the same subfamily had the same number of exons.
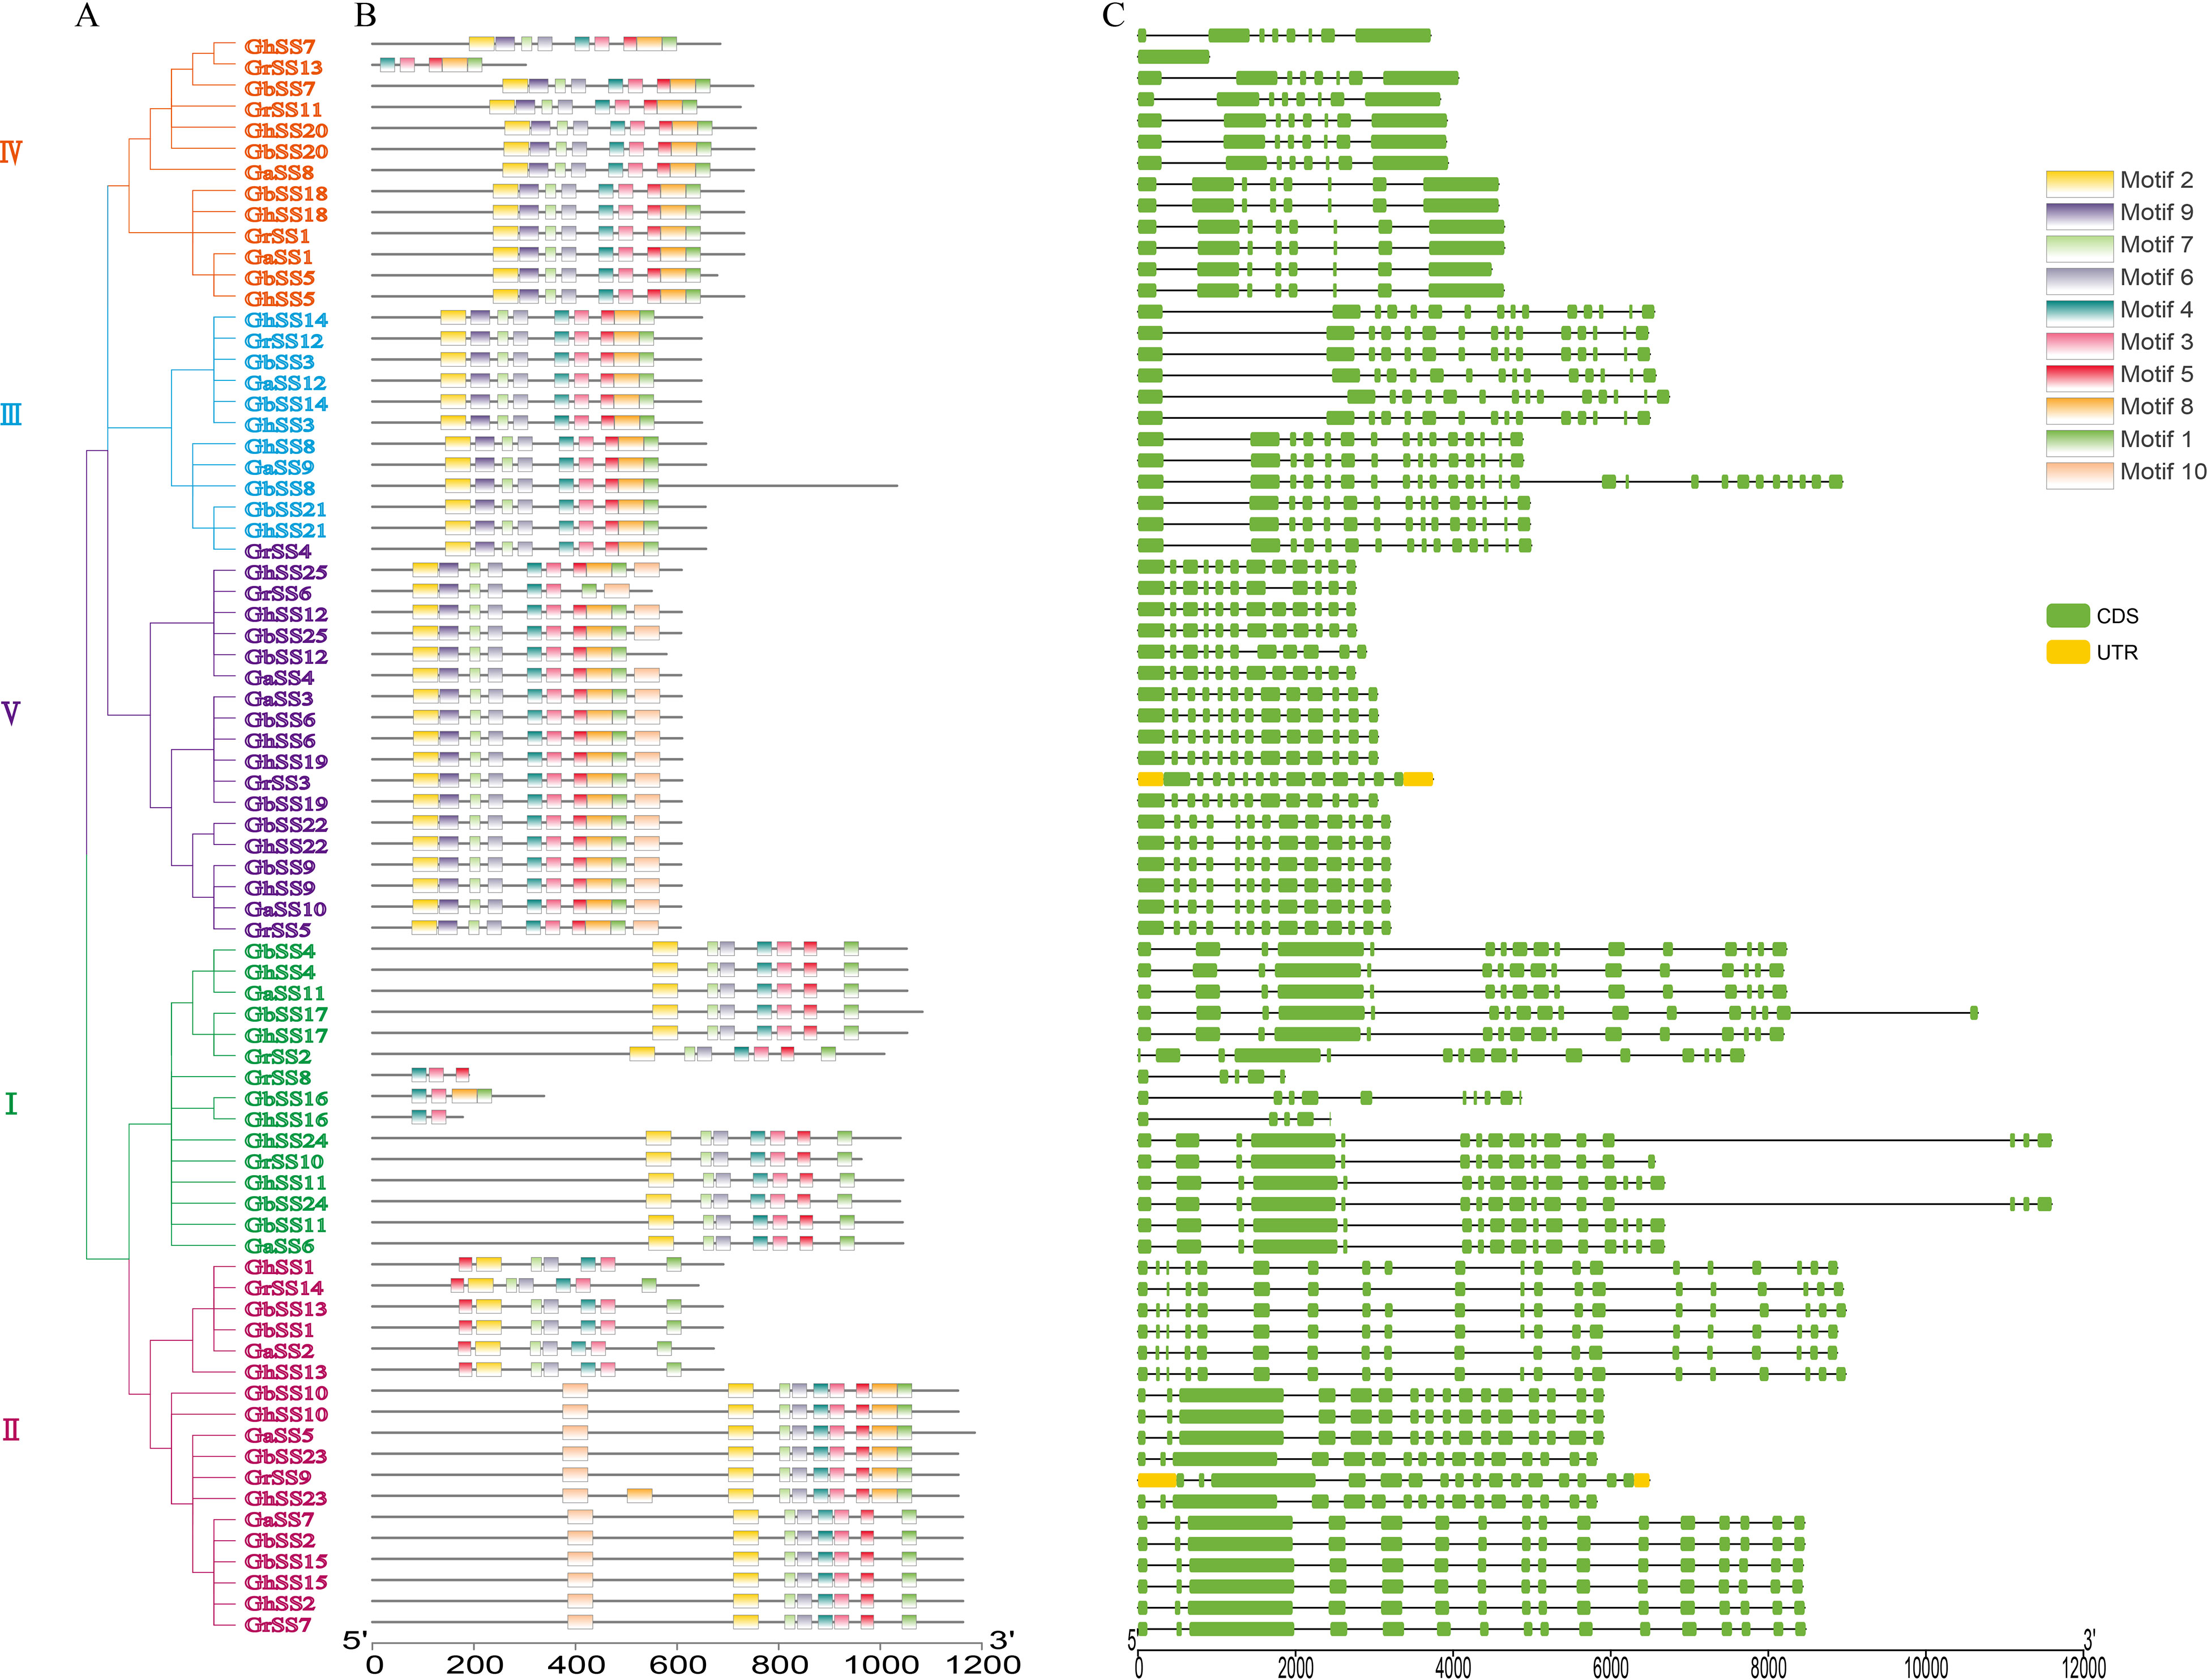
Figure 2 Conserved motifs and exon-intron structure of SS genes in G arboreum, G raimondii, G hirsutum, and G barbadense. (A) Phylogenetic tree of SS genes. (B) Conserved motifs of SS proteins. (C) The exon–intron structure of SS genes.
Chromosomal distribution
To further study the chromosomal distribution and inheritance of SS family members, we mapped all SS genes to the corresponding chromosomes. As shown in Figure 3, 72 of 76 SS genes were mapped to chromosomes. For the GaSS genes from G. arboreum, 12 GaSSs were located on eight chromosomes (CA_chr1, CA_chr2, CA_chr5, CA_chr6, CA_chr9, CA_chr10, CA_chr11, and CA_chr12). For the GrSS genes from G. raimondii, 10 of 14 GrSSs were mapped to seven chromosomes (Chr1, Chr4, Chr6, Chr8, Chr9, Chr10, and Chr11), and four GrSSs were mapped to scaffolds. For the GhSS and GbSS gene families, they shared a similar chromosomal distribution pattern, with 25 genes assigned to chromosome 17, respectively. Twelve genes were assigned to eight chromosomes (A02, A05, A06, A07, A08, A09, A10, and A12) in group A, and 13 genes to nine chromosomes (D03, D04, D05, D06, D07, D08, D09, D10, and D12) in group D.
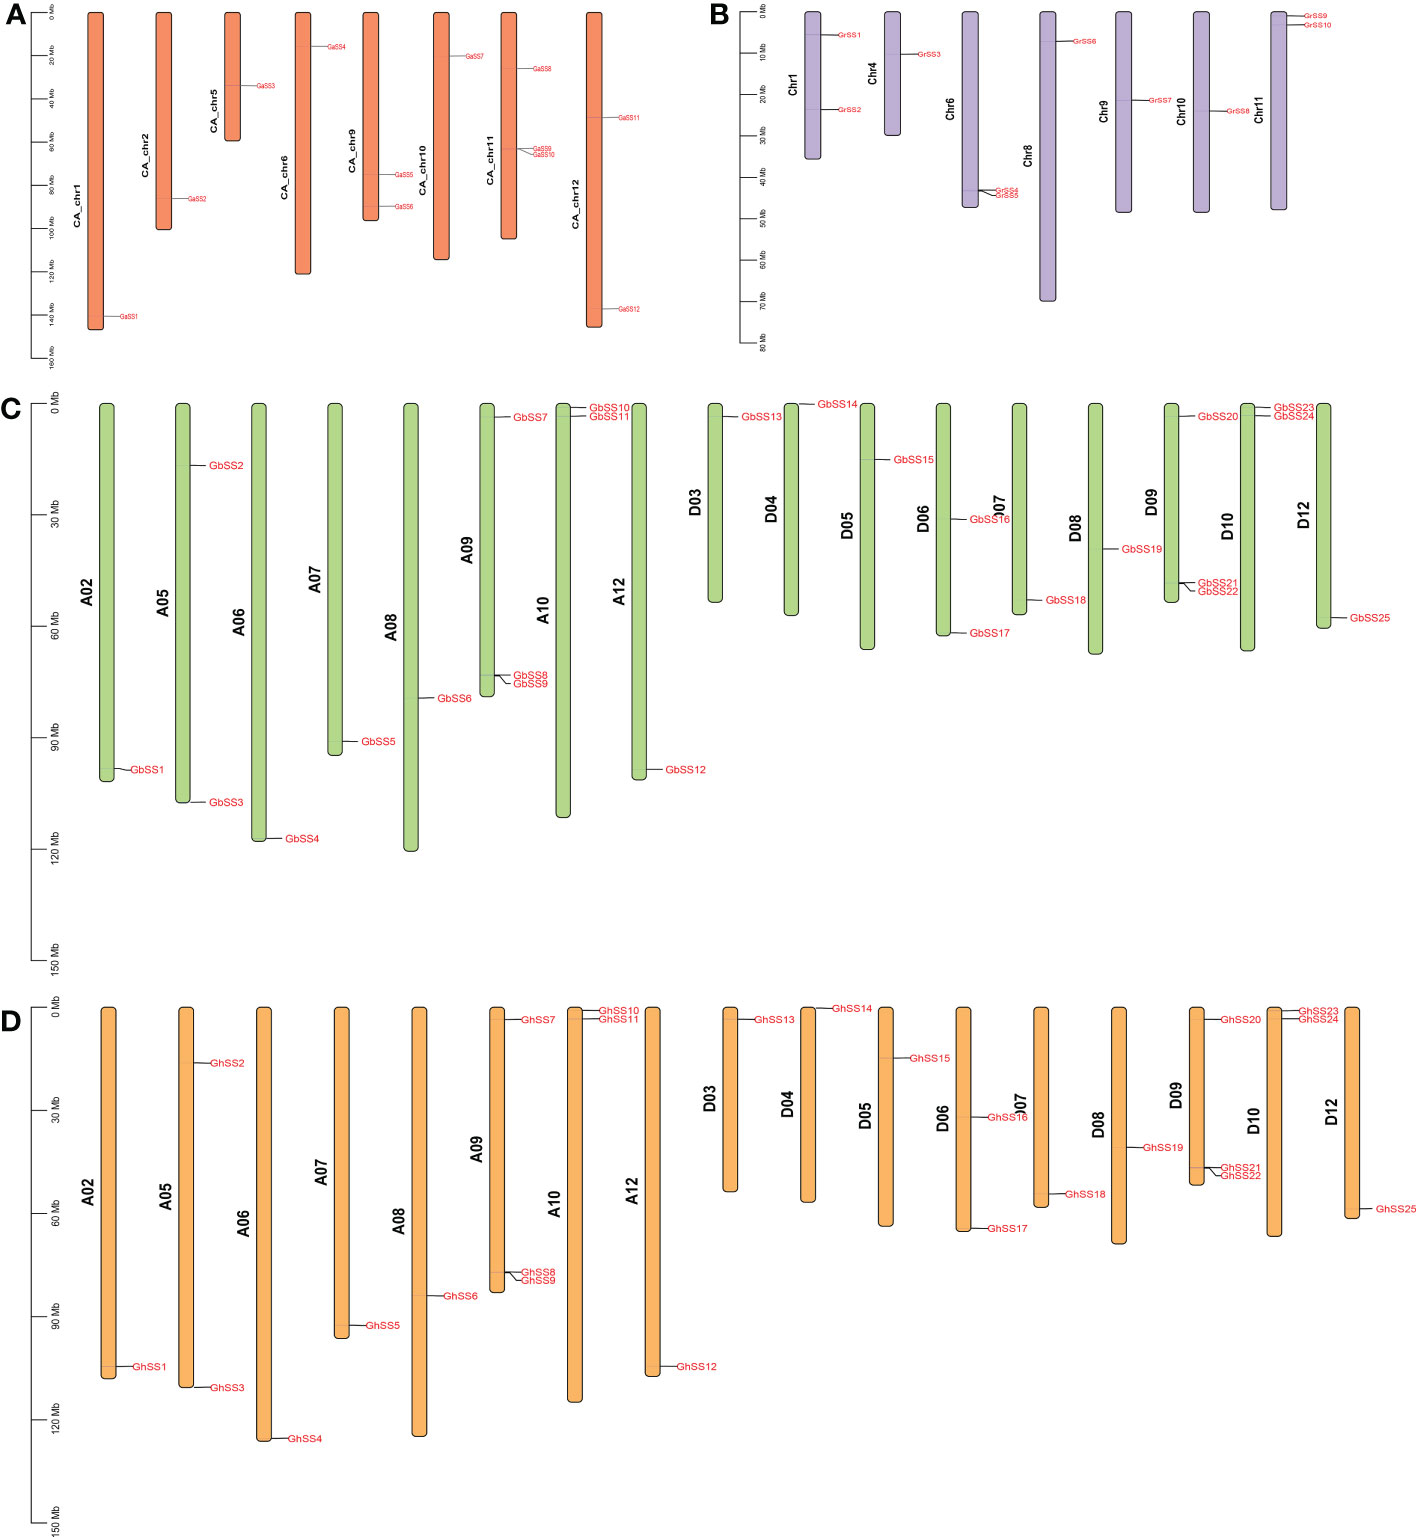
Figure 3 Chromosomal locations of SS genes in G arboreum, G raimondii, G hirsutum, and G barbadense. (A) G arboretum, (B) G raimondii, (C) G barbadense, and (D) G hirsutum.
Collinearity analysis
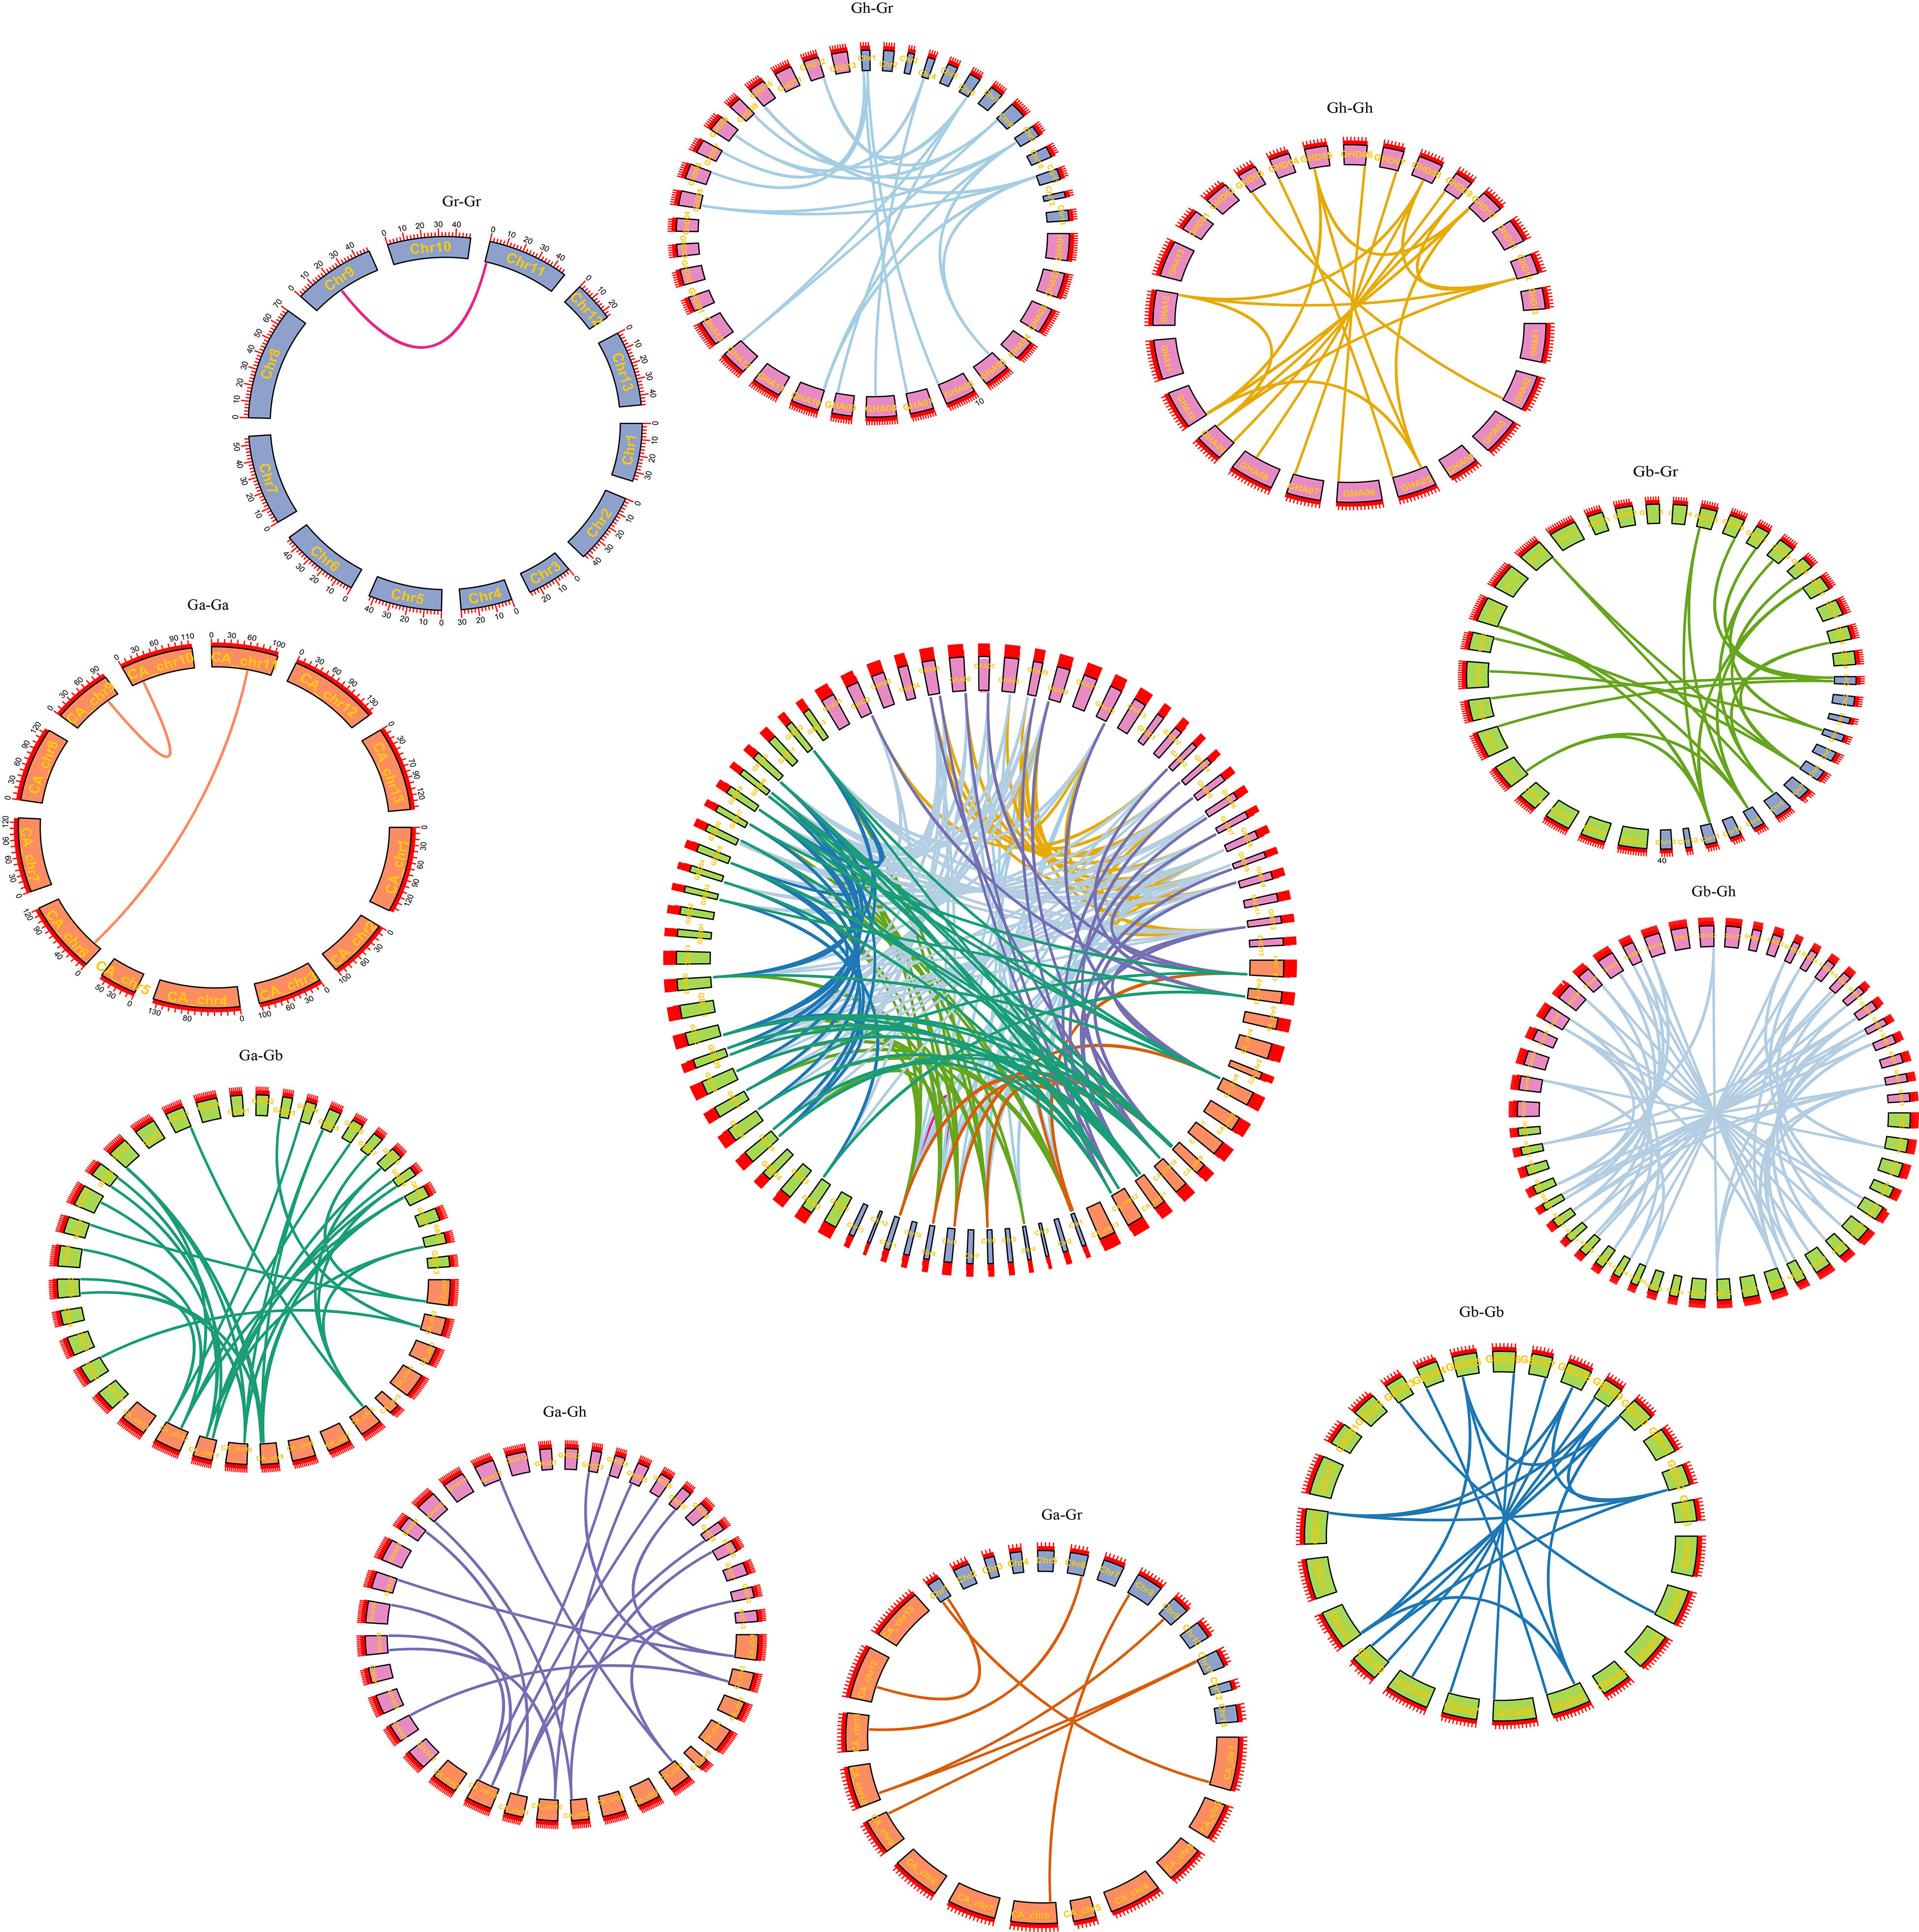
Through homology analysis of SS genes in G. arboreum, G. raimondii, G. hirsutum, and G. barbadense, we mapped the relationship between SS genes from the four cotton varieties (Figure 4). By comparing the genomes of Ga-Ga, Ga-Gb, Ga-Gh, Gb-Gb, Gb-Gr, Gb-Gh, Gr-Gh, Gr-Gh, Gr-Gr, and Gh-Gh, we identified a total of 217 linear/similar gene pairs. Among them, 45 duplicate genes were cloned into fragments, and 172 duplicate genes were cloned into the whole genome. Among them, Ga-Ga, Gb-Gb, Gh-Gh, and Gr-Gr had 2, 21, 21 and 1 pair of co-linear gene segments, respectively. Ga-Gh, Ga-Gb, Ga-Gr, Gb-Gh, Gb-Gr, and Gh-Gr replicated 33, 19, 9, 57, 27, and 27 linear/similar gene pairs, respectively. Therefore, we conjecture that the main driving force behind the evolution of SS family genes is genome-wide replication, followed by fragment replication.
Selection pressure analysis
To study the phylogeny of SS gene pairs, we performed selective stress analysis. Ratios of nonsynonymous substitution rate (Ka) and synonymous substitution rate (Ks) were calculated for 217 gene pairs (Figure 5A). The results showed that the Ka/Ks values of 213 gene pairs were less than 1, the Ka/Ks values of 178 genes were between 0 and 0.5, and the Ka/Ks values of 26 genes were between 0.5 and 0.99 (Figure 5B). That is to say, these genes had a negative selection effect, which indicated that they had experienced purification selection pressure after gene duplication events. Since the Ka/Ks ratios of GbSS23-GhSS23, GbSS8-GhSS8, GrSS2-GhSS17, and GbSS8-GaSS9 were greater than 1, it was considered that these genes had positive selection effects in the process of evolution.

Figure 5 Analysis of the non-synonymous (Ka) to synonymous (Ks) ratio. (A) Nonsynonymous (Ka) and synonymous (Ks) divergence values for Ga–Ga, Ga-Gb, Ga-Gr, Ga-Gh, Gb-Gb, Gb-Gr, Gb-Gh, Gr-Gr, Gr-Gh, and Gh-Gh are shown in the circular chart. (B) Prediction number of the duplicate gene pairs involved in different combinations of four cotton species.
Promoters and conservative domain analysis of SS genes
To better investigate the mechanisms of gene regulation, we utilized PlantCARE (Figure 6B) to identify several cis-regulatory elements in the promoter regions of each SS gene, which could be divided into three categories. The first was the light response element, which include Box 4, TCT-motif, MRE, i-Box, Box II, ae-Box, ATCT-motif, Sp1,3-AF1 binding site, GATA-motif, LAMP-element, Ace, for a total of 12 elements, which were located upstream of 51, 40, 25, 16, 11, 10, 9, 8, 7, 7, and 6 genes, respectively. The second type was the stress response element, including ARE, CAT-box, MBS, TC-rich repeats, and LTR, with a total of five elements located upstream of 53, 34, 28, 26, and 21 genes, respectively. The third class was the phytohormone response element, including TCA, TGACG-motif, CGTCA-motif, O2-site, TGA-element, P-box, TATC-box, with a total of seven elements, which were located upstream of 71, 38, 35, 24, 13, 12, and 8 genes, respectively.
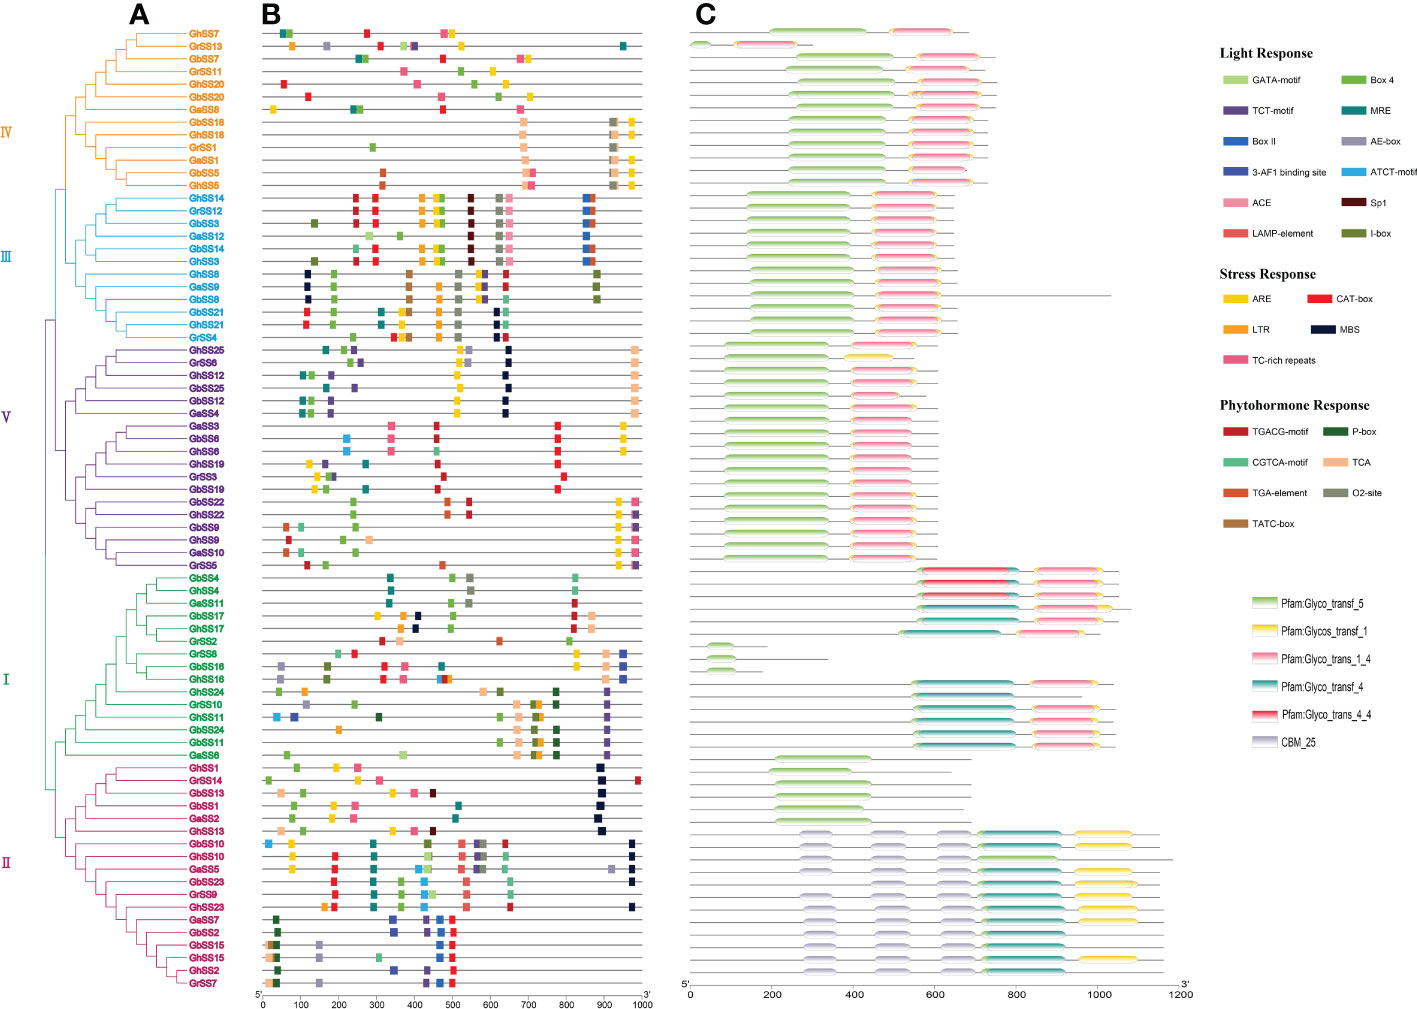
Figure 6 Promoters and conservative domains of SS genes in G arboreum, G raimondii, G hirsutum, and G barbadense. (A) Phylogenetic tree of SS genes. (B) Promoters of SS proteins. (C) The conservative domain of SS genes.
To study the protein domains of SS genes, we used HMMER (https://www.ebi.ac.uk/tools/HMMER/search/phmmer) to analyze the conserved domains of SS genes. As shown in Figure 6C, each gene contained a Glyco_transf_5 domain. Different subfamilies had different domains, but the same subfamily had similar domains. Subfamily I genes all contained Glyco_transf_5, Glycos_transf_1, Glyco_trans_1_4 and Glyco_transf_4 domains except for GrSS8, GbSS16, and GhSS16 genes. Subfamily II contains two types of domains. One type only contained the Glyco_transf_5 domain, however, the other type contained the Glyco_transf_5, Glycos_transf_1 and Glyco_trans_4 domains. Subfamily III, IV, and V genes all contained Glyco_transf_5, Glycos_transf_1 and Glyco_trans_1_4 domains, except for GrSS6 (Figure 6A).
Interaction network of GhSS proteins
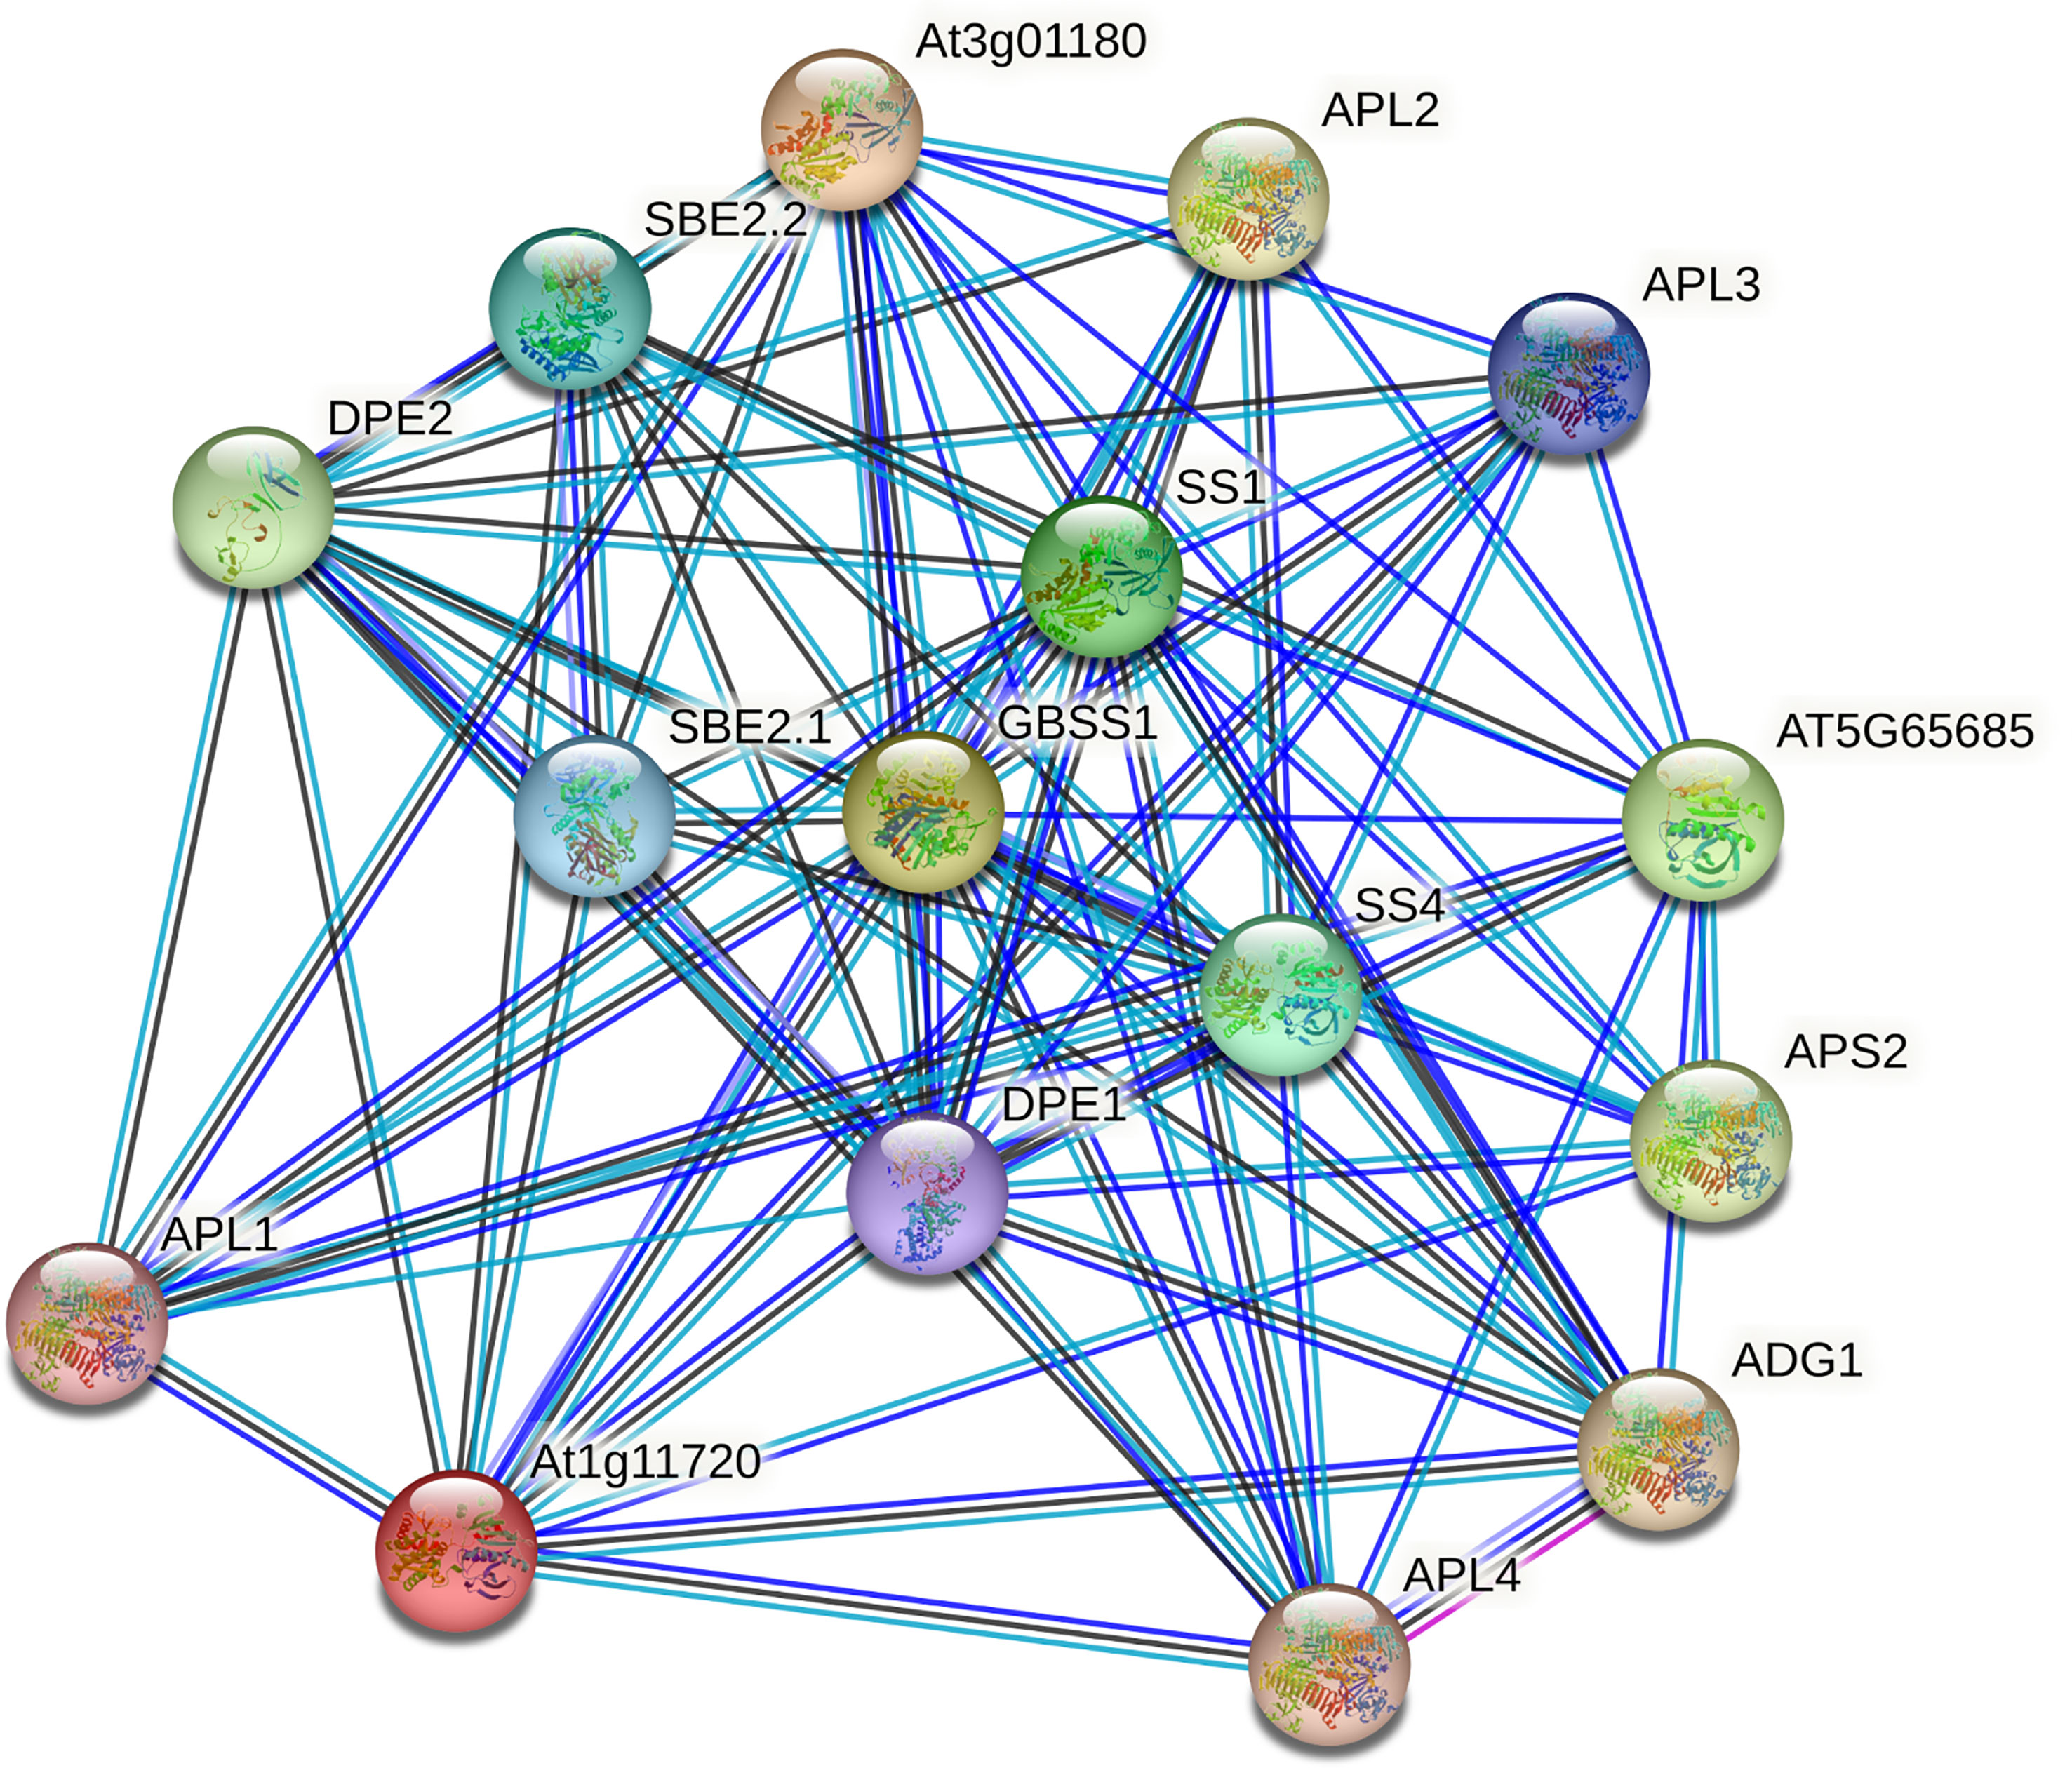
To further investigate the function of the GhSS protein, we used STRING data (https://STRING-db.org/) for interaction network analysis. We compared GhSS proteins with A. thaliana proteins to obtain A. thaliana homologs and searched for them using multiple sequences (Figure 7). Results showed that sugar levels not only regulate gene expression, metabolism, growth in bacteria, yeast, and animals but also influence signal cell growth and development. In vascular plants, it also serves as a signal regulating multiple metabolic pathways and development processes. There are two main processes in the protein–protein interaction network. One was the synthesis of starch, and the other was the degradation of starch. SS family (GBSS1, SS1, and SS2), GlgB subfamily genes (EMB2729 (1,4-alpha-glucan-branching enzyme), SBE (1,4-alpha-glucan-branching enzyme), APL (glucose-1-phosphate adenylyltransferase large subunit), and SPL genes were involved in starch synthesis. The SS family gene DPE2(4-alpha-glucanotransferase) is involved in starch hydrolysis (Takaha et al., 1993). We hypothesized that cotton regulates metabolism, growth, and development by regulating starch synthesis, hydrolysis, and sugar levels.
Expression and silencing analysis of GhSS9 under drought stress in cotton
To understand the potential role of the SS gene family in cotton stress, we selected the GhSS9 gene for the VIGS experiment. Expression levels of GhSS9 were significantly reduced in the leaves of V-GhSS9 plants after VIGS compared with pYL:156 plants (Figure 8B), indicating strong and specific silencing of GhSS9. To understand the potential role of the SS gene family in cotton stress, we selected the GhSS9 gene for the VIGS experiment. Expression levels of GhSS9 were significantly reduced in the leaves of V-GhSS9 plants after VIGS compared with pYL:156 plants (Figure 8B), indicating strong and specific silencing of GhSS9. After drought stress, the cotyledons of V-GhSS9 plants turned yellow, the true leaves lost water, and the whole plant seriously wilted. However, the cotyledons of pYL:156 plants showed mild yellowing symptoms, and plant morphology was basically normal after drought stress. V-GhSS9 plants were more sensitive to drought stress than pYL:156 plants, implying that this gene contributes to drought tolerance in cotton (Figure 8A). V-GhSS9 plants were more sensitive to drought stress than pYL:156 plants, implying that this gene contributes to drought tolerance in cotton (Figure 8A).
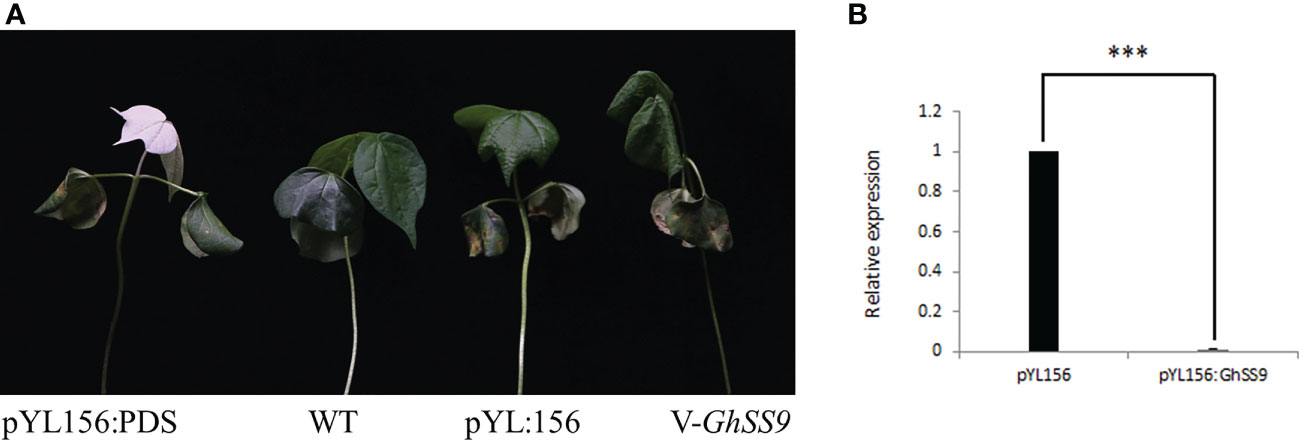
Figure 8 Function verification of GhSS9. (A) Phenotypic comparison of GhSS9-silenced plants under drought stress. (B) Detection of GhSS9 silencing efficiency (***p <0.001).
Discussion
Sugar is a direct product of plant photosynthesis, transported out of photosynthetic cells in the form of sucrose or stored in the form of starch (Stitt, 1991). Sugar levels (sugar feast or sugar starvation) have a significant impact on plant metabolism and development. As a signaling substance, sugar levels regulate gene expression, metabolic pathways, growth, and development in plants (Gupta and Kaur, 2005). Starch is one of the main polysaccharides in plant cells, which affects the sugar level of plants. Starch synthetase is the key enzyme in starch synthesis in plants. Several SS have been identified in O. sativa L. (Zhang et al., 2021), maize (Harn et al., 1998), and wheat (Tan et al., 2010). However, it was still lacking any type of study about SS in cotton. In our study, we identified the SS gene family in G. arboreum, G. raimondii, G. hirsutum, and G. barbadense, with the aim of understanding the roles of the SS family in cotton.
Based on the published cotton genomics information (Lin et al., 2010), 76 SS genes were identified by the blastP technique using the SS family genes of A. thaliana as target sequences. The proteins encoded by these genes contained 117–1,181 amino acids with a molecular weight of 19.013–135.17 kDa and an isoelectric point of 4.825–8.62 with an average of 6.541, indicating that these proteins were weakly acidic. The SS family has different physical chemistry and functions. By constructing phylogenetic trees of SS genes in A. thaliana, O. sativa, and cotton, these genes were divided into five branches, and each branch contained SS genes from six species. This means that the SS family differentiated earlier than monocotyledons and dicotyledons. Furthermore, collinearity analysis found fewer repeats between Ga(A)-Ga(A) and Gr(D)-Gr(D), but more repeats between Ga(A)-Gh(AD1), Ga(A)-Gb(AD2), Gr(D)-Gh (AD1), and Gr(D)-Gb(AD2). This further verified that G. hirsutum (AD2) and G. barbadense (AD1) come from interspecific hybridization between the cotton with the A genome and the cotton with the D genome. During the evolution of cotton, the SS family genes can be preserved, which indicates that the SS family plays an important role in the growth and development of cotton.
The structure of a gene determines its function (Richard et al., 1998). The C-terminal amino acid sequence of SS proteins is highly conserved, but the N-terminal of SS protein is variable, and the conservation is very poor. The genes of the SS family all contain motifs and 4. All SS families contain Glyco_transf_5. We speculate that Glyco_transf_5 may be an important domain of the SS family, mainly composed of motifs 3 and 4. The same subfamily of SS genes has very strong conservation, such as the subfamily III genes, which were composed of motifs 1–9, all of whom contained Glyco_transf_5, Glycos_transf_1, and Glyco_trans_1_4 conserved domains. We hypothesized that different subfamilies of SS have specific roles in starch synthesis.
Three types of response elements were identified in the SS promoter region. The first type was the light response element, with the SS promoter region containing the most cis elements. This was consistent with the conclusion that SS family genes play an important role in starch synthesis during photosynthesis. The second type identified in the SS promoter was the hormone responsiveness element, with 71 SS genes all containing a cis-acting element involved in defense and stress responsiveness (tca-element). Salicylic acid (SA) is a hormone produced by plants and plays an important role in plant growth and stress resistance. It is suggested that the SS gene may be involved in hormone signaling pathways in plants. A third type of stress response element was identified in the SS promoter, suggesting that SS genes may play a key role in response to abiotic stresses.
In our study, we found that some glucose-1-phosphate adenylyltransferase large subunit (APL) genes interact with GhSS genes, such as APL1, APL2, APL3, and APL4. Previous studies have shown that the APL family, which encodes the large subunit of the ADP-glucose caramel phosphorylase, catalyzes the first rate-limiting step in starch biosynthesis. GhSSs interact with SBE family genes such as SBE2.1 and SBE2.2. SBE is a key enzyme involved in amylopectin structure formation. Interestingly, both APL and SBE are involved in starch synthesis, which suggests that key enzymes in starch synthesis may interact to promote starch formation (Huang-Lung et al., 2009). Furthermore, GhSSs interact not only with starch synthesis-related enzymes but also with starch hydrolysis-related enzymes (DPE1, DPE2) (Ceusters et al., 2019). We hypothesized that GhSSs were involved both in starch synthesis and in starch hydrolysis. Starch, as an important storage sugar, can be decomposed to produce soluble sugar under drought stress. The accumulation of soluble sugar under drought stress can be used as an osmotic protective agent to maintain osmotic stability, and it can also act as a ROS scavenger (Krasensky and Jonak, 2012). The rapid gluconeogenic conversion of malate into starch prevents an increase in the volume of the protoplasts, whereas the degradation of starch to malate is accompanied by a swelling of the protoplasts. The mutual transformation of starch and malate constructs the osmotic driving force of stomatal movement, and the gluconeogenesis of malate transforms it into starch. This also supports stomatal closure and mitigates drought stress (Ogawa, 1981; Schnabl, 1980).
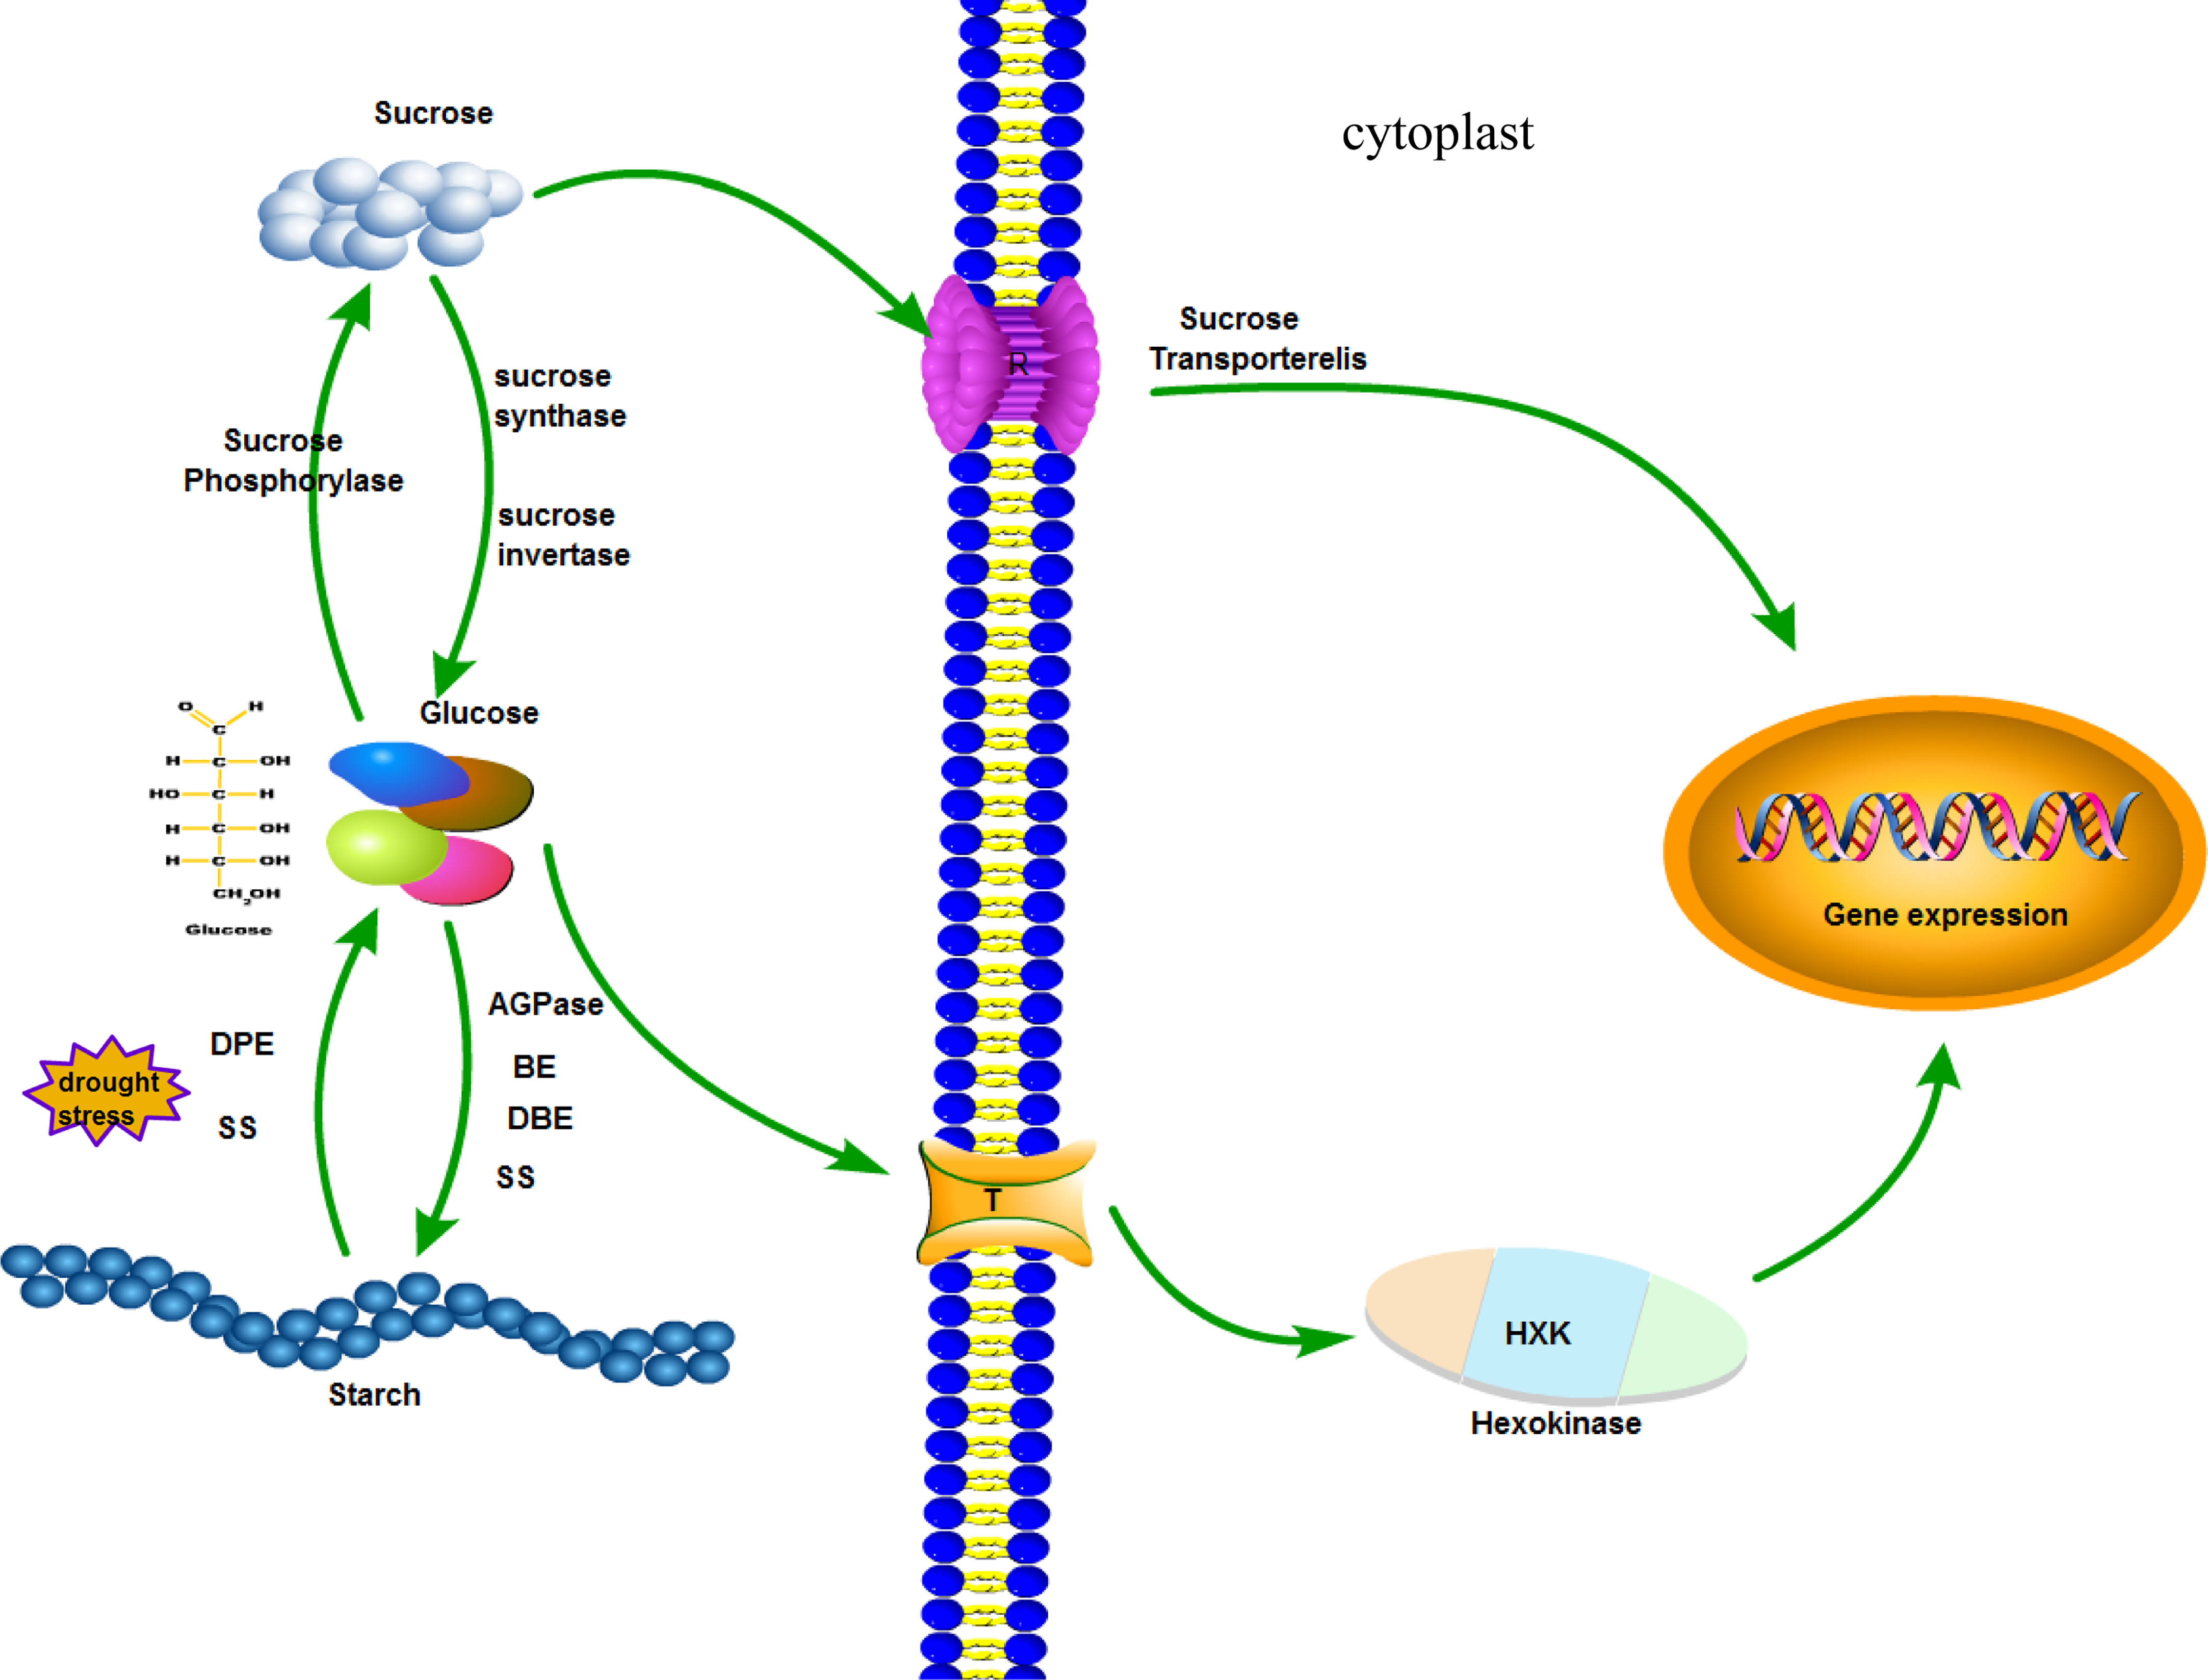
The biosynthesis of vascular plant starch takes place in the plastid, and the substrate is sucrose (Ugalde and Jenner, 1990). Sucrose is converted to glucose by sucrose invertase or sucrose synthase (Echeverria and Humphreys, 1984; Moriguchi et al., 1992). Starch is then synthesized by AGPase, SS, SBE, and DBE (Lloyd et al., 1999; Kharabian-Masouleh et al., 2011). There is an interaction between starch synthase and dismutase in the protein interaction network. Starch is degraded to glucose by the actions of dismutase and starch synthetase. Glucose can be converted to sucrose by phosphorylase. The sugar level in the plant has a great influence on the metabolism and growth of the plant (Berger et al., 2010). There are mainly sucrose transporter pathways and glucose receptor pathways (Kühn et al., 2010). The sucrose transporter pathway states that sucrose levels regulate the expression of related genes (Jang et al., 1997; Sheen et al., 1999). As a glucose receptor, hexokinase (HXK) mediates the expression of glucose-related genes (Rolland et al., 2006). When cotton is subjected to drought stress, SS family genes affect the sugar level in the plant by regulating starch synthesis and hydrolysis and regulate gene expression in response to stress (Figure 9).
Conclusion
According to the gene structure, conserved domain, phylogeny, collinearity, chromosome location, and cis-element analysis of the SS family, the characteristics of the SS family in four cotton genomes were studied. In addition, we constructed the gene interaction network of the GhSS protein, and GhSS9 responds to drought stress by regulating starch synthesis and decomposition. These results lay the foundation for further study of the response of SS genes to abiotic stress.
Data availability statement
The original contributions presented in the study are included in the article/Supplementary Material. Further inquiries can be directed to the corresponding authors.
Author contributions
QC and ZB designed the project. MD conducted the experiments. XY performed the bioinformatics analysis. MD and XY wrote the manuscript. ZB and QC was responsible for revising the manuscript. All authors contributed to the article and approved the submitted version.
Funding
This study was supported by the Key Research and Development Program of Hebei Province (21326314D), and the HAAFS Agriculture Science and Technology Innovation Project (KJCXZX-HZS-7).
Conflict of interest
The authors declare that the research was conducted in the absence of any commercial or financial relationships that could be construed as a potential conflict of interest.
Publisher’s note
All claims expressed in this article are solely those of the authors and do not necessarily represent those of their affiliated organizations, or those of the publisher, the editors and the reviewers. Any product that may be evaluated in this article, or claim that may be made by its manufacturer, is not guaranteed or endorsed by the publisher.
Supplementary material
The Supplementary Material for this article can be found online at: https://www.frontiersin.org/articles/10.3389/fpls.2023.1163041/full#supplementary-material
Supplementary Table 1 | Analysis of Ka/Ks ratios of SS genes in four cotton species.
Supplementary Table 2 | Four cotton SS gene collinear gene pairs
References
Abdelgawad, H., Avramova, V., Baggerman, G, Raemdonck, GV, Beemster, GTS (2020). Starch biosynthesis contributes to the maintenance of photosynthesis and leaf growth under drought stress in maize. Plant Cell Environ. 13813, 1–63. doi: 10.1111/pce.13813
Berger, S., Papadopoulos, M., Schreiber, U., Kaiser, W., Roitsch, T. (2010). Complex regulation of gene expression, photosynthesis and sugar levels by pathogen infection in tomato. Physiologia Plantarum 122, 419–428. doi: 10.1016/S0141-8130(98)00040-3
Brubaker, C. L., Paterson, A. H., Wendel, J. F. (1999). Comparative genetic mapping of allotetraploid cotton and its diploid progenitors. Genome 42, 184–203. doi: 10.1139/gen-42-2-184
Buléon, A., Colonna, P., Planchot, V., Ball, S. (1998). Starch granules: structure and biosynthesis. Int. J. Biol. Macromolecules 23, 85–112. doi: 10.1016/S0141-8130(98)00040-3
Ceusters, N., Frans, M., Ende, W. V. D., Ceusters, J. (2019). Maltose processing and not β-amylase activity curtails hydrolytic starch degradation in the CAM orchid phalaenopsis. Front. Plant Sci. 10. doi: 10.3389/fpls.2019.01386
Chen, C., Rui, X., Hao, C., He, Y. (2018). TBtools, a toolkit for biologists integrating various HTS-data handling tools with a user-friendly interface. Cold Spring Harbor Lab. 27, 1–7. doi: 10.1101/289660
Denyer, K., Sidebottom, C., Hylton, C. M., Smith, A. M. (1993). Soluble isoforms of starch synthase and starch-branching enzyme also occur within starch granules in developing pea embryos. Plant J. 4, 191–198. doi: 10.1046/j.1365-313x.1993.04010191.x
Deschamps, P., Moreau, H., Worden, A. Z., Dauvillee, D., Ball, S. G. Early gene duplication within chloroplastida and its correspondence with relocation of starch metabolism to chloroplasts. Genetics 178, 2373–2387. doi: 10.1534/genetics.108.087205
Dian, W., Jiang, H., Chen, Q., Liu, F., Wu, P. (2003). Cloning and characterization of the granule-bound starch synthase II gene in rice: Gene expression is regulated by the nitrogen level, sugar and circadian rhythm. Planta 218, 261–268. doi: 10.1007/s00425-003-1101-9
Dian, W., Jiang, H., Wu, P. (2005). Evolution and expression analysis of starch synthase III and IV in rice. J. Exp. Bot. 56, 623–632. doi: 10.1093/jxb/eri065
Dorion, S., Saini, L. (1996). Induction of Male sterility in wheat by meiotic-stage water deficit is preceded by a decline in invertase activity and changes in carbohydrate metabolism in anthers. Plant Physiol. 111, 137–145. doi: 10.1104/pp/111/1/137
Echeverria, E., Humphreys, T. (1984). Involvement of sucrose synthase in sucrose catabolism. Phytochemistry 23, 2173–2178. doi: 10.1016/S0031-9422(00)80514-2
Gidley, M. J., Bociek, S. M. (1988). 13C CP/MAS NMR studies of amylose inclusion complexes, cyclodextrins, and the amorphous phase of starch granules: Relationships between glycosidic linkage conformation and solid-state 13C chemical shifts. Cheminform 110, 3820–3829. doi: 10.1021/ja00220a016
Gupta, A. K., Kaur, N. (2005). Sugar signalling and gene expression in relation to carbohydrate metabolism under abiotic stresses in plants. J. Biosci. 30, 761–776. doi: 10.1007/bf02703574
Harn, C., Knight, M., Ramakrishnan, A., Guan, H., Keeling, P. L., Wasserman, B. P. (1998). Isolation and characterization of the zSSIIa and zSSIIb starch synthase cDNA clones from maize endosperm. Plant Mol. Biol. 37, 639–649. doi: 10.1023/a:1006079009072
He, S., Hao, X., Wang, S., Zhou, W., Ma, Q., Lu, X., et al. (2022). Starch synthase II plays a crucial role in starch biosynthesis and the formation of multienzyme complexes in cassava storage roots. J. Exp. Bot. 73, 2540–2557. doi: 10.1093/jxb/erac022
Hernández, V., Carrillo, M., Varela, A. S., Alvarado, A. D., Téllez, L. (2012). Changes in carbohydrate concentration in leaves, PODS and seeds of dry bean plants under drought stress. Interciencia 37, 168–175. doi: 10.1080/01904160903351606
Hou, J., Huang, X., Hou, G., Wang, C., Xie, Y., Guo, T., et al. (2017). Relationship between non-structural carbohydrate accumulation and drought resistance and grain yield of wheat. Acta Agriculturae Boreali-occidentalis Sin. 26, 1590–1597. doi: 10.7606/j.issn.1004-1389.2017.11.002
Huang-Lung, T., Lue, W.-L., Lu, K.-J., Hsieh, M.-H., Wang, S.-M., Chen, J. (2009). Starch synthesis in arabidopsis is achieved by spatial cotranscription of core starch metabolism genes. Plant Physiol. 151, 1582–1595. doi: 10.1104/pp.109.144196
Jang, J. C., León, P., Li, Z. (1997). Hexokinase as a sugar sensor in higher plants. THE Plant Cell Online 9, 5–19. doi: 10.2307/3870367
Kaplan, F., Guy, C. L. (2004). Beta-amylase induction and the protective role of maltose during temperature shock. Plant Physiol. 135, 1674–1684. doi: 10.1104/pp.104.040808
Kharabian-Masouleh, A., Waters, D. L. E., Reinke, R. F., Henry, R. J. (2011). Discovery of polymorphisms in starch-related genes in rice germplasm by amplification of pooled DNA and deeply parallel sequencing. Plant Biotechnol. J. 9, 1074–1085. doi: 10.1111/j.1467-7652.2011.00629.x
Krasensky, J., Jonak, C. (2012) Drought, salt, and temperature stress-induced metabolic rearrangements and regulatory networks. J. Exp. Bot. 63, 1593–1608. doi: 10.1093/jxb/err460
Kühn, C., Quick, W. P., Schulz, A., Riesmeier, J. W., Sonnewald, U., Frommer, W. B., et al. (2010). Companion cell-specific inhibition of the potato sucrose transporter SUT1. Plant Cell Environ. 19, 1115–1123. doi: 10.1111/j.1365-3040.1996.tb00426.x
Kumar, G. (2016). MEGA7: Molecular evolutionary genetics analysis version 7.0 for bigger datasets. Mol. Biol. Evol. 33, 1870–1874. doi: 10.1093/molbev/msw054
Larkin, M. A., Blackshields, G., Brown, N. P., Chenna, R., Mcgettigan, P. A., Mcwilliam, H., et al. (2007). Clustal W and clustal X version 2.0. Bioinformatics 2947–2948 23. doi: 10.1093/bioinformatics/btm404
Lin, L., Pierce, G. J., Bowers, J. E., Estill, J. C., Compton, R. O., Rainville, L. K., et al. (2010). A draft physical map of a d-genome cotton species (Gossypium raimondii). BMC Genomics 11, 395. doi: 10.1186/1471-2164-11-395
Lloyd, J. R., Springer, F., Buléon, A., Müller-Röber, B., Willmitzer, L., Kossmann, J. (1999). The influence of alterations in ADP-glucose pyrophosphorylase activities on starch structure and composition in potato tubers. Planta 209, 230–238. doi: 10.1007/s004250050627
Matt, P., Schurr, U., Klein, D., Krapp, A., Stitt, M. (1998). Growth of tobacco in short-day conditions leads to high starch, low sugars, altered diurnal changes in the nia transcript and low nitrate reductase activity, and inhibition of amino acid synthesis. Planta 207, 27–41. doi: 10.1007/s004250050452
Miles, M. J., Morris, V. J., Ring, S. G. (1985). Gelation of amylose. Carbohydr. Res. 135, 257–269. doi: 10.1016/S0008-6215(00)90777-8
Moriguchi, T., Abe, K., Sanada, T., Yamaki, S. (1992). Levels and role of sucrose synthase, sucrose-phosphate synthase, and acid invertase in sucrose accumulation in fruit of Asian pear. Jamersochort 117, 274–278. doi: 10.1016/S0304-4238(05)80019-6
Mu-Forster (1996). Physical association of starch biosynthetic enzymes with starch granules of maize endosperm (Granule-associated forms of starch synthase I and starch branching enzyme II). Plant Physiol. 111, 821–829. doi: 10.1104/pp.111.3.821
Ogawa, T. (1981). Blue light response of stomata with starch-containing (Vicia faba) and starch-deficient (Allium cepa) guard cells under background illumination with red light. Plant Sci. Lett. 22, 103–108. doi: 10.1016/0304-4211(81)90131-0
Richard, R. S., Christopher, E. P., Vladimir, N. P., David, W. U. (1988). DNA Structure and function. Advances in Genome Biology 5, 1–141. doi: 10.1016/S1067-5701(98)80019-3
Rolland, F., Baena-Gonzalez, E., Sheen, J. (2006). SUGAR sensing and signaling in plants: conserved and novel mechanisms. Annu. Rev. Plant Biol. 57, 675–709. doi: 10.1146/annurev.arplant.57.032905.105441
Santelia, D., Zeeman, S. C. (2011). Progress in arabidopsis starch research and potential biotechnological applications. Curr. Opin. Biotechnol. 22, 271–280. doi: 10.1016/j.copbio.2010.11.014
Schnabl, H. (1980). CO2 and malate metabolism in starch-containing and starch-lacking guard-cell protoplasts. Planta 149, 52–58. doi: 10.1007/BF00386227
Sheen, J., et al. (1999). Sugars as signaling molecules. Curr. Opin. Plant Biol. 5, 410–419. doi: 10.1016/S1369-5266(99)00014-X
Smith, A. M., Denyer, A. K., Martin, C. (1997). The synthesis of the starch granule. Annu. Rev. Plant Physiol. Plant Mol. Biol. 48, 367–385. doi: 10.1097/00010694-195411000-00010
Stitt, M. (1991). Rising CO2 levels and their potential significance for carbon flow in photosynthetic cells. Plant Cell Environ. 14, 741–762. doi: 10.1111/j.1365-3040.1991.tb01440.x
Takaha, T., Yanase, M., Okada, S., Smith, S. M. (1993). Disproportionating enzyme (4-alpha-glucanotransferase; EC 2.4.1.25) of potato. purification, molecular cloning, and potential role in starch metabolism. J. Biol. Chem. 268, 1391–1396. doi: 10.1016/S0021-9258(18)54088-6
Tan, C. X., Feng, C. N., Guo, W. S., Zhu, X. K., Chun-Yan, L. I., Peng, Y. X., et al. (2010). The relationship among starch synthase gene expression,the corresponding synthase activity and starch accumulation. J. Jinling Institute Technol. 26, 47–53. doi: 10.16515/j.cnki.32-1722/n.2010.01.011
Ugalde, T. D., Jenner, C. F. (1990). Substrate gradients and regional patterns of dry matter deposition within developing wheat endosperm. i. carbohydrates. Funct. Plant Biol. 17, 377–394. doi: 10.1071/PP9900377
Wang, D., Zhang, Y., Zhang, Z., Zhu, J., Yu, J. (2010). KaKs_Calculator 2.0: A toolkit incorporating gamma-series methods and sliding window strategies. Genomics Proteomics Bioinf. 1, 77–80. doi: 10.1016/S1672-0229(10)60008-3
Wang, Y., Tang, H, Debarry, JD, Tan, X, Li, J, Wang, X, et al. (2012). MCScanX: a toolkit for detection and evolutionary analysis of gene synteny and collinearity. Nucleic Acids Res. 40, e49–e49. doi: 10.1093/nar/gkr1293
Wim, Skirycz, A., Inzé, D. (2014). Abscisic acid, ethylene and gibberellic acid act at different developmental stages to instruct the adaptation of young leaves to stress. Plant Signaling Behav. 5, 226–244. doi: 10.4161/psb.5.4.11421
Xwa, B., Xl, A., Wam, A., Xc, A., Jw, A., Dw, A., et al. (2020). Differentially expressed bZIP transcription factors confer multi-tolerances in gossypium hirsutum l. Int. J. Biol. Macromolecules 146, 569–578. doi: 10.1016/j.ijbiomac.2020.01.013
Yasunori, N. (2002). Towards a better understanding of the metabolic system for amylopectin biosynthesis in plants: Rice endosperm as a model tissue. Plant Cell Physiol. 32, 718–725. doi: 10.1093/pcp/pcf091
Zanella, M., Borghi, G. L., Pirone, C., Thalmann, M., Pazmino, D., Costa, A., et al. (2016). β-amylase 1 (BAM1) degrades transitory starch to sustain proline biosynthesis during drought stress. J. Exp. Bot. 26, 1–8. doi: 10.1093/jxb/erv572
Zeeman, Zeeman, S. C., Kossmann, J., Smith, A. M. (2010). Starch : Its metabolism, evolution, and biotechnological modification in plants. Annu. Rev. Plant Biol. 61, 209–234. doi: 10.1146/annurev-arplant-042809-112301
Zeeman, S. C., Rees, T. A. (2010). Changes in carbohydrate metabolism and assimilate export in starch-excess mutants of arabidopsis. Plant Cell Environ. 22, 1445–1453. doi: 10.1046/j.1365-3040.1999.00503.x
Zhang, H., Jang, S. G., Lar, S. M., Lee, A. R., Kwon, S. W. (2021). Genome-wide identification and genetic variations of the starch synthase gene family in rice. Plants 10, 1154–1169. doi: 10.3390/plants10061154
Keywords: starch synthase, cotton, GhSS9, drought stress, gene network, VIGS
Citation: Dai M, Yang X, Chen Q and Bai Z (2023) Comprehensive genomic identification of cotton starch synthase genes reveals that GhSS9 regulates drought tolerance. Front. Plant Sci. 14:1163041. doi: 10.3389/fpls.2023.1163041
Received: 10 February 2023; Accepted: 17 March 2023;
Published: 05 April 2023.
Edited by:
Xuke Lu, Institute of Cotton Research (CAAS), ChinaReviewed by:
Guoyuan Liu, Nantong University, ChinaXu Dongdong, Shandong Academy of Agricultural Sciences, China
Copyright © 2023 Dai, Yang, Chen and Bai. This is an open-access article distributed under the terms of the Creative Commons Attribution License (CC BY). The use, distribution or reproduction in other forums is permitted, provided the original author(s) and the copyright owner(s) are credited and that the original publication in this journal is cited, in accordance with accepted academic practice. No use, distribution or reproduction is permitted which does not comply with these terms.
*Correspondence: Quanjia Chen, Y2hxamlhQDEyNi5jb20=; Zhigang Bai, YmFpemdfMTk4OUAxNjMuY29t
†These authors have contributed equally to this work
‡These authors share first authorship
 Maohua Dai
 Xiaomin Yang1,3†‡
 Quanjia Chen