 Tianyang Wen
 Xiao Xu1†
 Ge Zhao
 Jiahe Wu
95% of researchers rate our articles as excellent or good
Learn more about the work of our research integrity team to safeguard the quality of each article we publish.
Find out more
ORIGINAL RESEARCH article
Front. Plant Sci. , 26 April 2023
Sec. Plant Bioinformatics
Volume 14 - 2023 | https://doi.org/10.3389/fpls.2023.1162237
Plant terpenoid synthase (TPS) family genes participate in metabolite synthesis, hormones, gossypol, etc. Here, we genome-widely identified TPS family genes in 12 land plant species. Four hundred and thirty TPS-related genes were divided into seven subfamilies. The TPS-c in Bryophytes was suggested to be the earliest subfamily, followed by the TPS-e/f and TPS-h presence in ferns. TPS-a, the largest number of genes, was derived from monocotyledonous and dicotyledonous plants. Collinearity analysis showed that 38 out of the 76 TPS genes in G. hirsutum were collinear within G. arboreum and G. raimondii. Twenty-one GhTPS-a genes belong to the cadinene synthase (GhCDN) subfamily and were divided into five groups, A, B, C, D, and E. The special cis-elements in the promoters of 12 GhCDN-A genes suggested that the JA and ethylene signaling pathways may be involved in their expression regulation. When 12 GhCDN-A genes were simultaneously silenced through virus-induced gene silencing, the glandular color of GhCDN-A-silenced plants was lighter than that of the control, supported by a gossypol content decrease based on HPLC testing, suggesting that GhCDN-A subgroup genes participate in gossypol synthesis. According to RNA-seq analysis, gossypol synthesis-related genes and disease-resistant genes in the glandular variety exhibited upregulated expression compared to the glandless variety, whereas hormone signaling-related genes were downregulated. All in all, these results revealed plant TPS gene evolution rules and dissected the TPS subfamily, GhCDN-A, function in gossypol synthesis in cotton.
When plants are attacked, a large amount of volatile terpenoids is released. Terpenoids are a class of natural products with extremely rich structures. More than 80,000 kinds of natural terpenoids and derivatives have been found in bacteria, fungi, insects, and plants (Yamada et al., 2012; Schmidt-Dannert, 2015; Tholl, 2015; Beran et al., 2016; Christianson, 2017). Terpenoids are the most abundant type of metabolites synthesized by plants and can be divided into primary metabolites and secondary metabolites in different plants according to their physiological functions. A small number of terpenoids play physiological roles as primary metabolites required for plant growth and development, such as gibberellin, abscisic acid, carotenoids, and chlorophyll (Tetali, 2019). Most terpenoids are secondary metabolites of plants and play an important role in life processes such as plant adaptation to the environment, transmission of information, and chemical defense. For example, some volatile terpenoids are the main substances produced by floral fragrance, which can attract pollinators. Some terpenoids can be used as plant toxins to defend against herbivores, pest insects, and pathogenic microorganisms. Some terpenoids also have ecological functions that mediate the interaction between plants and surrounding biotic and abiotic factors (Keeling and Bohlmann, 2006; Vaughan et al., 2013; Yang et al., 2013).
The formation of structural diversity in terpenoids mainly depends on terpenoid synthase (TPS) (Chen et al., 2011), which is a key enzyme in the synthesis of terpenoids in secondary metabolism. Almost all plants contain TPS genes (Chen et al., 2011). Currently, multiple TPS families have been identified in many species, such as Arabidopsis thaliana, Vitis vinifera, and Glycine max (Aubourg et al., 2002; Martin et al., 2010; Falara et al., 2011; Nieuwenhuizen et al., 2013; Chen et al., 2014; Irmisch et al., 2014; Liu et al., 2014; Keilwagen et al., 2017; Yu et al., 2020; Zhou et al., 2020). The TPS enzyme in plants can transform GPP (geranyl diphosphate), NPP (neryl diphosphate), FPP (farnesyl diphosphate), and GGPP (geranylgeranyl diphosphate), which are synthesized from IPP (isopentenyl diphosphate) and DMAPP (dimethylallyl diphosphate), which are generated by the MVA (mevalonate) or MEP (methylerythritol phosphate) pathway, into multiple sesquiterpenes, monoterpenes, and diterpenes (Lichtenthaler and Hartmut, 1999; Takahashi and Koyama, 2006; Sapir-Mir et al., 2008).
Gossypol is a sesquiterpene polyphenolic substance that can combine with proteins and phospholipids in cells of the body and affect normal body functions, so it has great toxicity (Qian and Wang, 1984). The synthesis of gossypol begins with acetyl-CoA from the MVA pathway in plants. FPS (farnesyl diphosphate synthase) catalyzes IPP to produce FPP (Liu et al., 2000), and cadinene synthase (CDN) catalyzes the formation of cadinene (CAD) from FPP (Chen et al., 1995; Meng et al., 1999; Tan et al., 2000). Then cadinene-7-hydroxylase catalyzes CAD and NADPH to produce 7-hydroxycadinene (Luo et al., 2010), which undergoes a series of reactions to form hemi-gossypol. The hemi-gossypol is modified to form the sesquiterpenoid gossypol (Zhao et al., 2019). In addition to the above enzymes, the cytochrome P450 enzyme, DH1 (dehydrogenase), and 2-odd-1 ferric (II)-dependent dioxygenase also take part in the regulation of gossypol synthesis (Tian et al., 2018).
CDN is the first step and the most critical rate-limiting step in the synthesis of gossypol. Previous reports showed that a large reduction in the content of gossypol can be detected in CDN-silencing diploid cotton plants, Gossypium arboreum and G. raimondii. However, in tetraploid cotton, G. hirsutum, some reports showed that silencing some CDN genes did not cause a large decrease in the content of gossypol, while their overexpression could increase the content of gossypol. Therefore, it was speculated that gene redundancy may be caused by other CDN subfamily members in tetraploid cotton (Chen et al., 1995; Davis et al., 1996; Xiao-Ya et al., 1996; Meng et al., 1999; Tan et al., 2000; Townsend et al., 2005).
The literature shows that the CDN family belongs to a large gene family and is mainly divided into four subfamilies: A, B, C, and D (Sun et al., 2010; Cheng et al., 2016). CDN-A and C subfamilies have a larger number of genes, which have a higher degree of sequence similarity, but their expression patterns are different: CDN-A is mainly expressed in seeds and roots, whereas CDN-C is mainly expressed in various tissues of cotton. Conversely, there are few studies on the members of the CDN-B and D subfamilies, suggesting that most of the members of these two subfamilies may be pseudogenes (Sun et al., 2010). Recently, the literature has documented that the CDN gene family can also be divided into five subfamilies, including A, B, C, D, and E, according to evolutionary time (Liu et al., 2015). At present, the classification and naming of the CDN gene family in cotton are confusing, which remains a completely and systematically explored study.
Cotton is an important cash crop in the world, producing natural fiber and oil, and its fiber plays an important role in the textile industry. Cotton production is limited by biotic stress, including pest insect and pathogen infection. This biotic stress in turn is partially overcome by the accumulated large amounts of gossypol and its related sesquiterpene aldehydes distributed in the epidermis of roots and the glands of the aerial part of the tissues (Coyle et al., 1994; Jan et al., 2000; Coutinho, 2002; Liu et al., 2002; Puckhaber et al., 2002; Lopez et al., 2005; Ye et al., 2005; Stipanovic et al., 2006; Wolter et al., 2006; Kline et al., 2008). A number of reports document that these secondary metabolites act as phytochemicals to protect cotton against pathogen infection and animal feeding (Cai et al., 2010). Additionally, gossypol in cottonseed is harmful to humans and animals (Paré and Tumlinson, 1997; Nagegowda, 2010; Tholl, 2015), because consumption of cottonseed oil or cake containing gossypol can lead to serious damage to the heart, liver, kidney, and reproductive system.
Given that TPS is a direct catalyst for the synthesis of terpenoids, with the in-depth exploration of the efficacy of terpenoids and the continuous development of molecular biological methods, the functional dissection of TPS genes has become a hotspot in plant terpenoid metabolic engineering. In this study, we focused on integrating genome-wide data and proteomic data to perform the genome-wide analysis of the terpenoid synthase genes in cotton through a combination of bioinformatic and molecular biology methods, involving the identification of the TPS gene family, conserved motif analysis, and tissue expression pattern. More importantly, we conducted evolution analysis on the CDN branch family of rate-limiting enzymes in gossypol synthesis and screened out the key genes to determine their function in gossypol synthesis through gene silencing, tissue expression analysis, and other experiments. The results shed light on the molecular mechanism of cotton terpenoid biosynthesis, which helps generate special cotton germplasm with no or less gossypol in seed.
Gossypium hirsutum L. cv. ‘CCRI24’ were grown in mixed soil under glasshouse conditions (14 h light (28–30 °C)/10 h dark (25–28 °C), 150 μmol/m2 s). To analyze organ- and tissue-specific gene-expression patterns in ‘CCRI24,’ plants were grown under field conditions at the Cotton Institute of the Chinese Academy of Agricultural Sciences, Zhengzhou, Henan, China. Tissues including root, stem, leaf, petal, stamen, pistil, calycle, ovules, and fiber at 5, 10, 15, 20, and 25 d were harvested for RNA extraction. To determine expression patterns, seedlings were grown in Hoagland’s solution for about 3 weeks, and 50 μM MeJA and 50 μM ethephon were added to Hoagland’s solution. The 2.5% alcohol solution and H2O were added to Hoagland’s solution as the corresponding mocks. Root, stem, and leaf samples were collected at 0, 0.5, 1, 3, 6, 12, 24, and 48 h, respectively, after treatment. Three samples were collected from each treatment, and each treatment included at least three biological replicates. All collected samples were immediately frozen in liquid nitrogen and stored at −80 °C for RNA or DNA extraction and subsequent analysis.
The website (https://phytozome-next.jgi.doe.gov/) was used to download the protein databases of 12 species, including G. hirsutum, G. arboreum, G. barbadense, G. raimondii, Zea mays, Picea asperata, A. thaliana, Theobroma cacao, Oryza sativa, Populus trichocarpa, Sphagnum recurvum, and Selaginella moellendorffii. The TPS gene family has the conserved PF01397 and PF03936 motifs, based on the published paper (Liu et al., 2014; Zhou et al., 2020; Jia et al., 2022). To identify all members of the TPS family genes, the PF01397 and PF03936 seed files were downloaded from the PFAM database (http://pfam.xfam.org/). The hidden Markov models of PF01397 and PF03936 were constructed with HMMER 3.0 (http://hmmer.org/). The sequences containing the protein motifs PF01397 and PF03936 were screened, and the obtained protein sequences were further verified by PFAM and the SMART database (https://smart.embl-heidelberg.de/). After manual correction, non-full-length sequences were removed to obtain candidate TPS family genes with a full-length open reading frame (ORF). Multi-sequence alignment of the TPS gene family within 12 species was performed with MEGA 7 with default parameters. An unrooted neighbor-joining as well as minimum-evolution tree was constructed with the P-distance model method and 1,000 bootstrap replications using the same alignment file. EvolView (https://evolgenius.info//evolview-v2) was used to beautify the phylogenetic tree.
TBtools was used to extract the location information and chromosome length information of TPS family genes from the G. hirsutum genome. MapChart 1.0 was used to construct the visual map. One Step MCScanX in TBtools was used to complete the collinearity analysis in G. hirsutum, G. arboretum, and G. raimondii. The sequences with sequence similarity ≥70% among TPS family genes were screened out to calculate the dN/dS values by the simple Ka/Ks calculator in TBtools.
ProtParam (https://web.expasy.org/protparam/) predicted molecular weight, isoelectric point, average hydrophilicity, and instability index of GhTPS family genes. The Plant-mPLoc website (http://www.csbio.sjtu.edu.cn/bioinf/plant-multi/) was used to predict the subcellular localization of the GhTPS protein family.
The conserved motif of TPS-a subfamily genes in G. hirsutum was analyzed using the MEME website (https://meme-suite.org/meme/). Gene structure analysis was analyzed by the GSDS database (http://gsds.gao-lab.org/). TBtools was used to visualize output files from MEME and GSDS. The TPS-a subfamily genes of G. hirsutum were visualized in Excel, and then the motifs were marked and beautified in Adobe Illustrator.
TBtools was used to extract a 2,500-bp sequence upstream of the CDN-A subfamily gene sequence as the promoter sequence. The Cotton FGD website (https://cottonfgd.net/) was used to confirm that it was indeed the promoter sequence of CDN subfamily genes and not the sequence of other genes. The PlantCARE website (http://bioinformatics.psb.ugent.be/webtools/plantcare/html/) was used for promoter element analysis, and TBtools was used to visualize the output image.
To obtain all gene silencing strains of the GhCDN-A subfamily, three conserved fragments were screened out except the conserved RR(P)X8W, RXR, DDXXD, and NSE/DTE motifs. A fragment of 534 bp was obtained by overlapping PCR, and TRV::GhCDN-A was constructed by VIGS. Agrobacterium containing recombinant plasmids was cultured in resistant medium containing kanamycin (50 mg/ml) and rifampicin (50 mg/ml) at 28 °C for one day (OD600 = 1.5–1.8). Agrobacterium was collected and re-suspended in the resuspension solution (10 mM MgCl2, 10 mM MES, and 200 μM acetosyringone) to an OD600 = 1.2. TRV::GhCDN-A, TRV::00, and TRV::PDS were mixed with the helper plasmid TRV::192 in a ratio of 1:1. Cotton leaves with completely flat cotyledons but without true leaves were selected for injection (about 7 days after planting). The injected cotton was treated in a dark environment for 24 h and transferred to a normal environment for 10–14 days until the bleaching phenotype appeared. The leaves of TRV::GhCDN-A were used for silencing efficiency detection, and TRV::00 was used as a negative control. Plants with silencing efficiencies below 50% were screened out for phenotype observation and photographed with cameras. At the same time, the content of gossypol was determined by 0.5 g of leaf tissue.
Approximately 0.1 g of plant leaf was added to 1 ml of 70% acetone homogenate, extracted by ultrasound for 60 min, centrifuged at 8,000g for 10 min, and the supernatant was taken and filtered through a pinhead filter to be measured. Then the content of gossypol was determined by HPLC. HPLC liquid conditions: Rigol L3000 high-performance liquid chromatography; Sepax-C18 reverse phase column (250 mm ∗ 4.6 mm, 5 μm). The mobile phase preparation: A was 1% phosphoric acid aqueous solution, and the preparation method was to take 150 ml of filtered, ultra-pure water, add 1.5 mL of H3PO4, and mix it well. B was methanol. A: B = 15: 85. The sample size was 10 μl, the flow rate was 1.0 ml/min, the column temperature was 30 °C, the sample removal time was 40 min, and the UV wavelength was 235 nm.
The material plants CCRI24 with and without gossypol were planted under culture conditions based on the Hoagland solution (Tocquin et al., 2003) with minor modifications. Cultures were kept under a 16-hour light/8-hour dark cycle with a relative humidity of 60%. The roots at the three- to four-leaf stage were collected for RNA extraction. Samples were obtained from three individual plants. A total of 3 μg RNA per sample was used for the RNA sample preparation. Sequencing libraries were generated using the NEBNext Ultra™ RNA Library Prep Kit for Illumina (NEB, USA) following the manufacturer’s recommendations, and index codes were added to attribute sequences to each sample. The fragments per million mapped reads per kilobase (FPKM) for each gene was calculated using HTSeq v0.6.1 (Trapnell et al., 2012), which was used to map to upland cotton transcripts with the aid of the G. hirsutum genome annotation.
Differential expression analysis of the two materials was performed using the DESeq R package (1.18.0) (Wang and Cairns, 2014). Genes with an adjusted P-value of <0.05 found by DESeq were assigned differentially expressed genes (DEGs). Gene Ontology (GO) enrichment analysis of DEGs was implemented in the GO-Seq R package (Wang and Cairns, 2014). GO terms with a corrected P-value less than 0.05 were considered significantly enriched by DEGs. KOBAS software (Mao et al., 2005) was used to test the statistical enrichment of DEGs in KEGG pathways (http://www.genome.jp/kegg/). The RNA-seq data were provided by the BioMarker (BMK) company (http://www.biomarker.com.cn/).
The data for eight high gossypol materials (SRS1691460, SRS1660920, SRS1660924, SRS1661035, SRS1691433, SRS1691495, SRS1660917, and SRS1691615) and two low gossypol materials (SRR10306147 and SRS1691645) were downloaded from NCBI. The FPKM values were analyzed by hisat2 (v2.2.1), samtools (v1.16.1), and stringtie (v2.2.1) to obtain the absolute expression levels of different expression genes.
RNA-seq data, including gene accession numbers, were available in the NCBI SRA under accession number PRJNA936998.
Protocols to isolate RNA and quantitative real-time PCR were followed as described previously (Zhao et al., 2016). We analyzed the dissociation curves for each reaction and used the 2−ΔΔCT method to calculate the expression level of each target gene (Zhao et al., 2016). All reactions were conducted with at least three biological replicates. The relevant gene-specific primers in the experiments are listed in Table S1.
Student’s t-test and Tukey’s ANOVA test were used to perform all statistical analyses and generate a P-value. The data represent the mean ± SD of n ≥3 independent experiments. All tests were two-tailed. The data were normalized, and all samples were normally distributed with homogeneity of variance.
To find out the evolution mode of the TPS gene and various evolutions during the evolution process, the whole genome data of 12 land plant species were screened to analyze the evolution of the TPS family. With PF01397 and PF03936 as indexes according to the PFAM database, 528 sequences were screened out initially (Table S2), 430 of which were longer than the 500 amino acids (aa) that had been reported that can encode complete proteins (Chen et al., 2011). Based on previously reported TPS genes/proteins as markers (Aubourg et al., 2002), 430 TPS genes could be divided into eight subfamilies, namely TPS-a to TPS-h. However, other pieces of literatures combined TPS-e and TPS-f into a subgroup (Martin et al., 2004). Thereby, we also divided the 430 sequences into seven subfamilies (Figure 1), showing 217, 99, 28, 21, 45, 14, and 6 members in TPS-a, -b, -c, -d, -e/f, -g, and -h, respectively (Figure 2). Bryophytes, S. recurvum, had only three TPS-c genes, indicating that the TPS-c subfamily may be the earliest subfamily in land plant species, which was kept in 12 land plant species possibly for performing basic functions. Two TPS-e/f and six TPS-h are present in ferns, S. moellendorffii, of which the TPS-e/f subfamily is shared by gymnosperms and angiosperms while the TPS-h subfamily is absent in higher land plant species. Interestingly, 21 TPS-d were present in gymnosperms (P. asperata) but were lost in angiosperms, indicating that lots of TPS-d genes were required for gymnosperm plant growth and development. The loss of TPS-d and TPS-h subgroups in angiosperms reflected the historical records that gymnosperms had undergone many major changes in the geology and climate since their emergence. In angiosperms, the TPS-a, TPS-b, and TPS-g subfamilies were derived. The TPS-b subfamily genes were reported to distribute in dicotyledons, excluding an example of TPS-b presence in the monocotyledonous plant sorghum (Chen et al., 2011). Overall, seven subfamilies of TPSs had diverged over a long evolutionary history with the lineage-specific expansion of certain subfamilies. TPS-a had the largest number of TPS genes in monocotyledonous and dicotyledonous plants, so it was worthy of exploration.
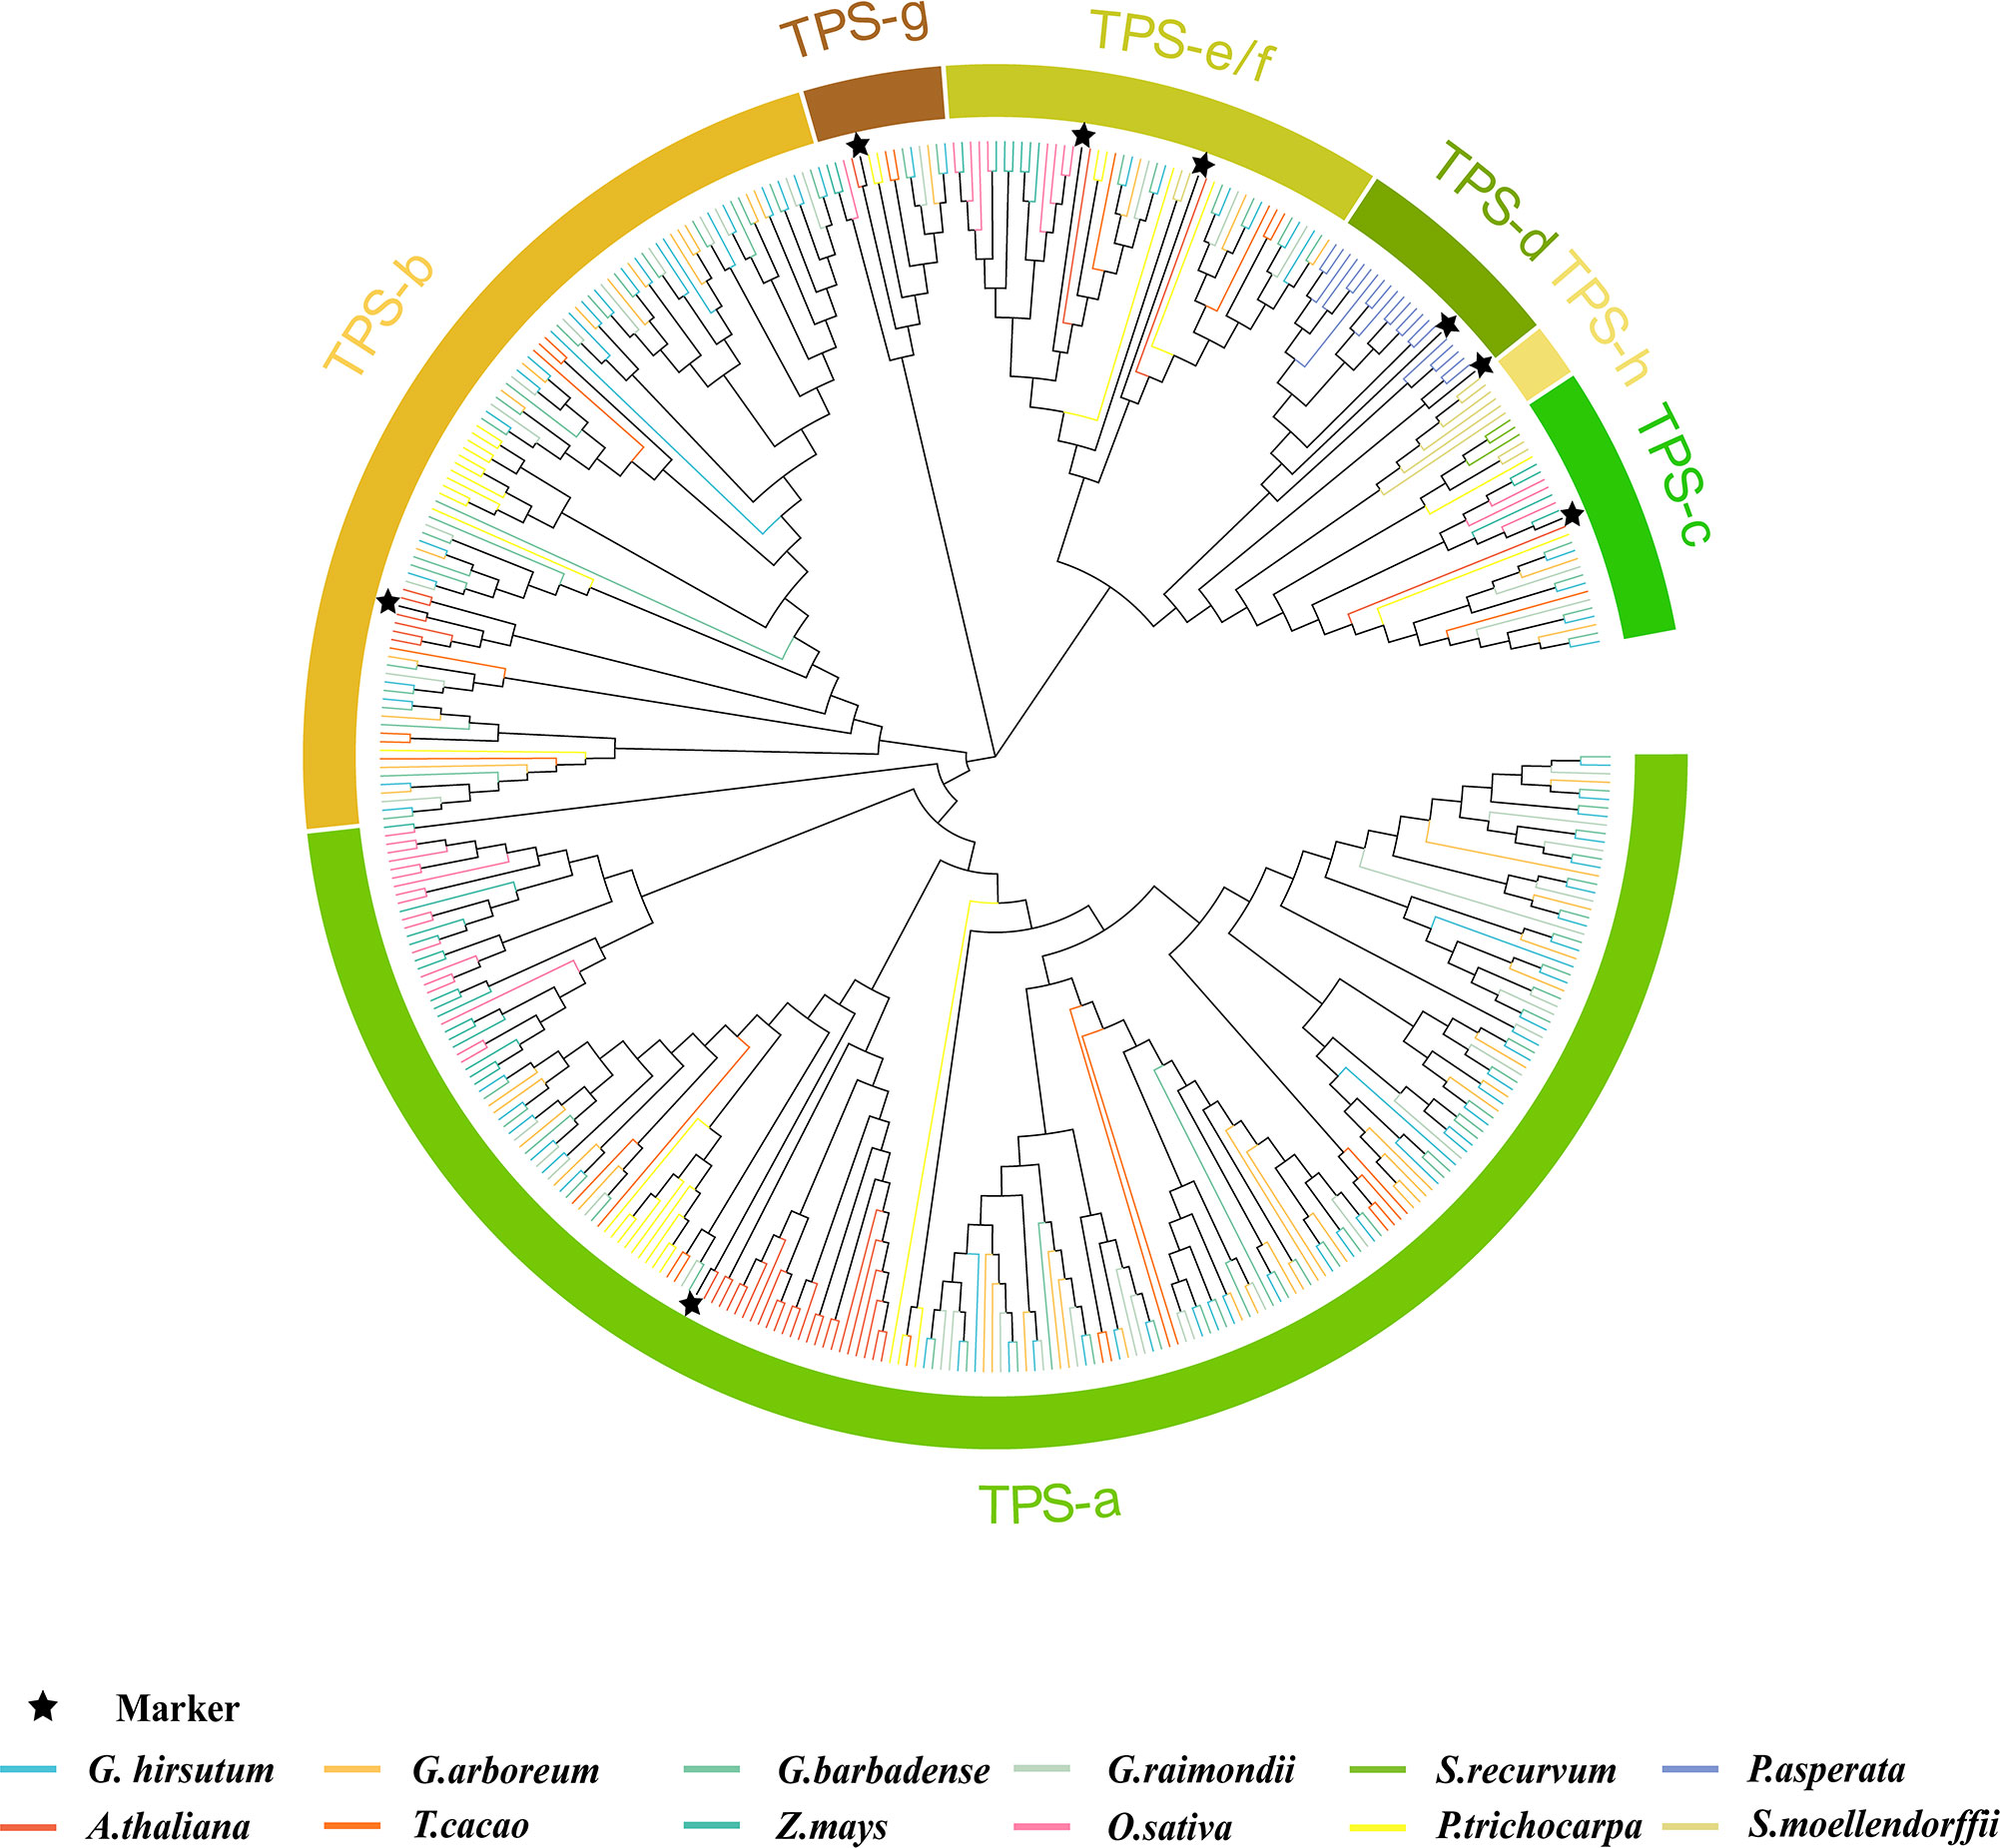
Figure 1 Phylogenetic analysis of the TPS gene family. MEGA7.0 was used to analyse the phylogenetic analysis of 430 sequences of 12 species: Gossypium hirsutum, G. arboreum, G. barbadense, G. raimondii, Zea mays, Picea asperata, Arabidopsis thaliana, Theobroma cacao, Oryza sativa, Populus trichocarpa, Sphagnum recurvum, and Selaginella moellendorffii. The TPS gene/protein in the published literature was used as control and labeled ★. The colors of different branches of the phylogenetic tree represented different species, the same color represented the same species, and different colors in the outer circle represented different subfamily classifications, which were divided into seven categories, namely TPS-a, TPS-b, TPS-c, TPS-d, TPS-e/f, TPS-g, and TPS-h.
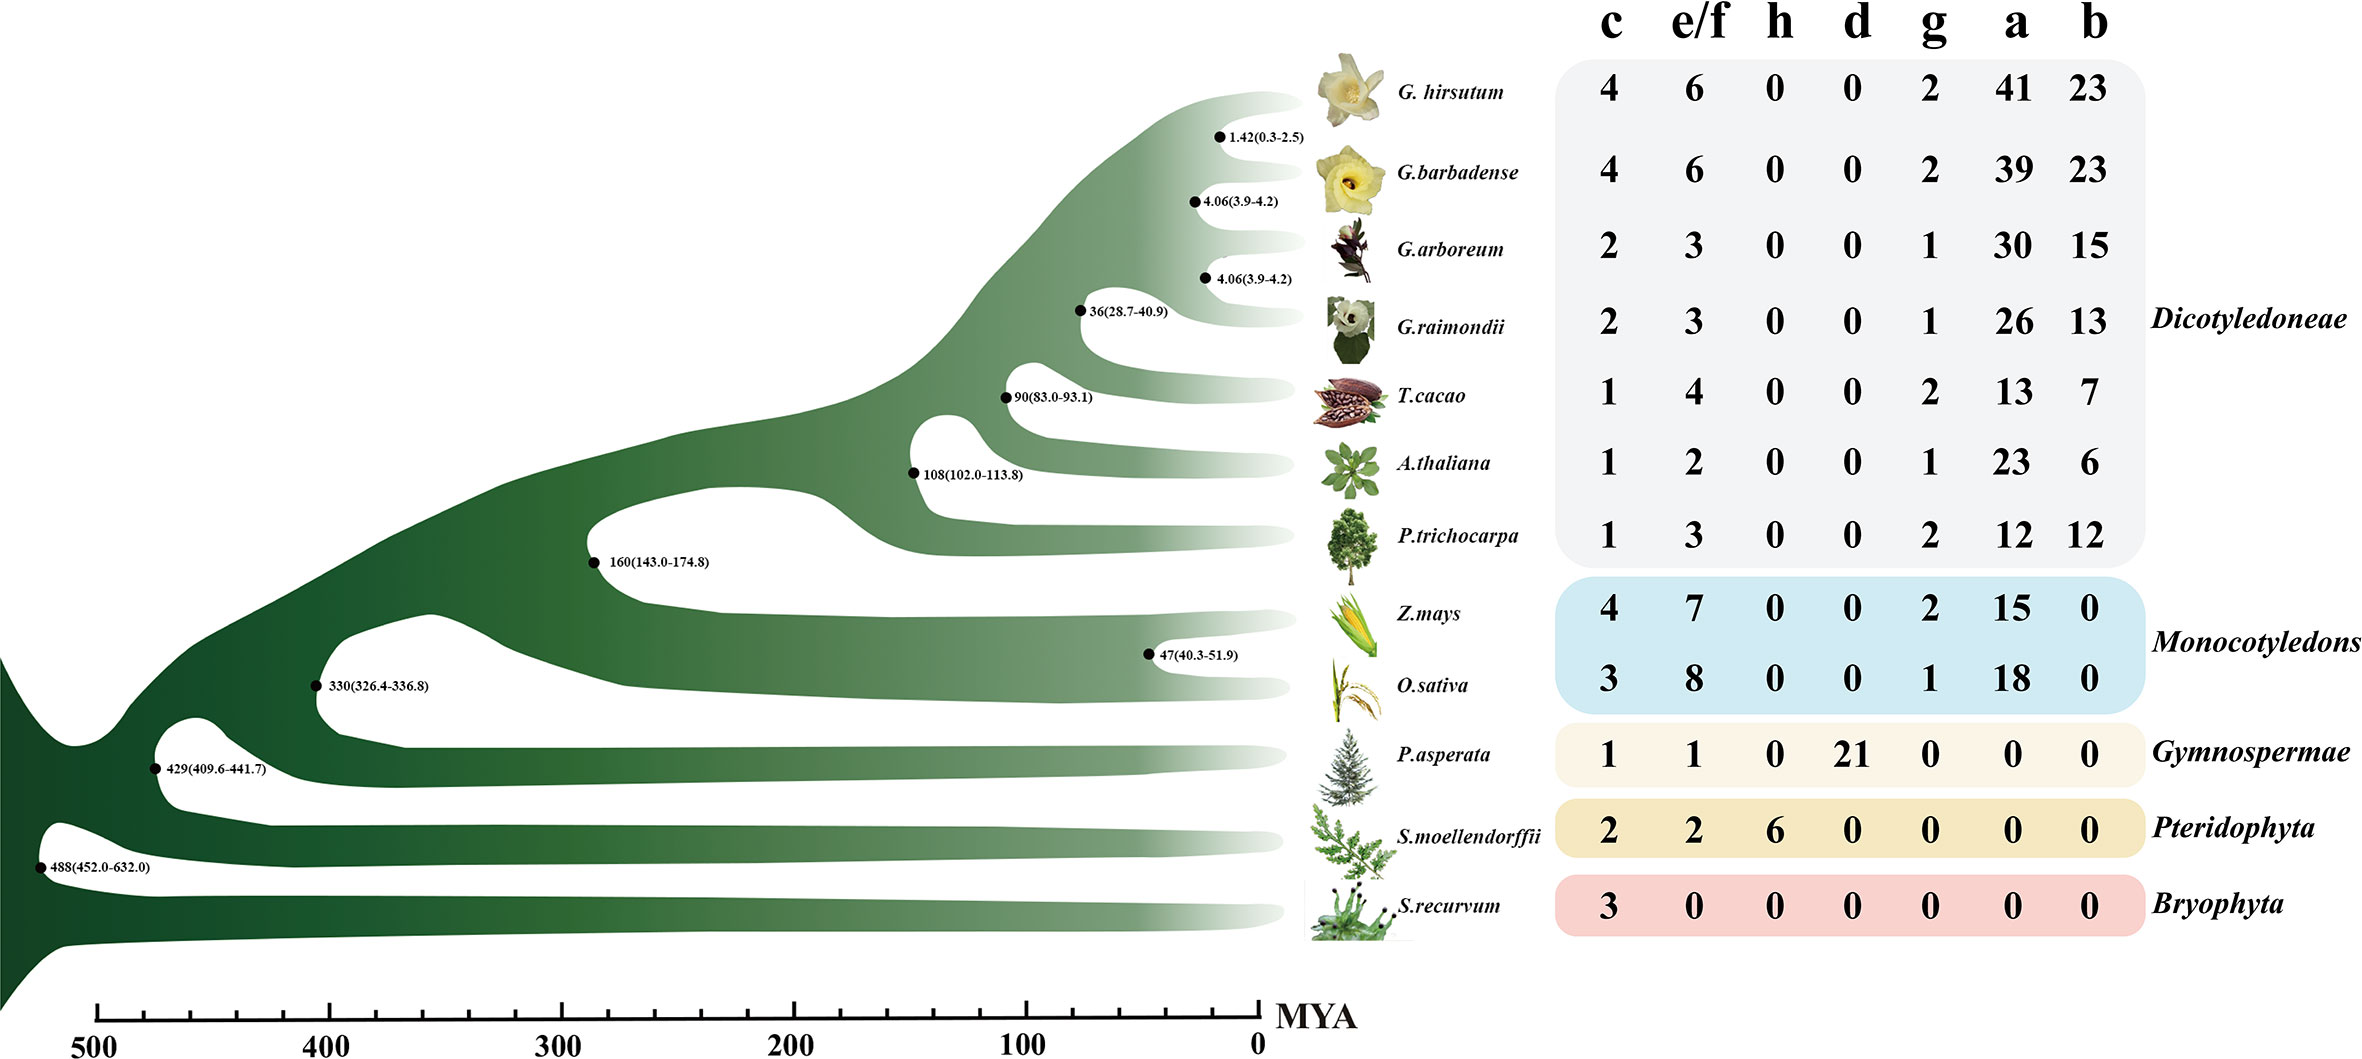
Figure 2 The numbers of the TPS gene family of 12 species. The bar value below indicated the time of species divergence. On the right side were species name, species, number of genes in different TPS subfamilies and species classification. Different colored squares indicated different species classifications. The phylogenetic drawing was based on timetree. MYA, A million years ago.
In three cotton species, the TPS family genes contained five subfamilies: TPS-a, TPS-b, TPS-c, TPS-e/f, and TPS-g, of which the TPS-a and TPS-b subgroups contained the most members (Figure 2). The tetraploid G. hirsutum was reported to derive from the doubling of diploid G. raimondii and G. arboreum 1.5 million years ago (Hu et al., 2019). Therefore, the number of these five TPS subfamilies in G. hirsutum should theoretically be the sum of the G. raimondii and G. arboreum members. Conversely, only the TPS-c, TPS-e/f, and TPS-g subfamilies conformed to this rule, indicating that the three subfamilies were highly conserved among the three cotton species. The TPS-a and TPS-b subfamilies did not conform to this rule, which preliminarily suggested that large numbers of duplications and loss cases might have occurred during their evolution.
To reveal whether replication and loss have occurred, we performed a colinear analysis of all TPS genes in diploid G. arboreum and G. raimondii and tetraploid G. hirsutum (Figure 3). When PF01397 and PF03936 were used as indexes to scan the whole genome for identification of TPS family genes, it was found that there were 75 TPS genes in G. arboreum, 60 in G. raimondii, and only 91 in G. hirsutum without any filtration (Huang et al., 2018; Cui et al., 2023). Collinearity analysis showed that 22 sequences showed collinearity between G. arboreum and G. hirsutum, and 20 sequences showed collinearity between G. raimondii and G. hirsutum. According to the longer than 500 aa standard, 51, 45, and 76 TPS genes were screened out in G. arboreum, G. raimondii, and G. hirsutum, respectively, indicating that other genes’ functions might have been lost in the process of evolution to adapt to environmental changes. Therefore, 22 longer TPS genes were collinear within G. arboreum and G. hirsutum, and 20 TPS genes were collinear within G. raimondii and G. hirsutum, indicating that the contributions of G. arboreum and G. raimondii seemed to be similar in the TPS genes of G. hirsutum. The data also indicated that most of the TPS family genes with collinearity were above 500 aa. Many TPS genes, including subfamilies TPS-a and TPS-b, showed no collinearity among the three cotton species (Table S3), possibly resulting from adaptation to the different environmental pressures.
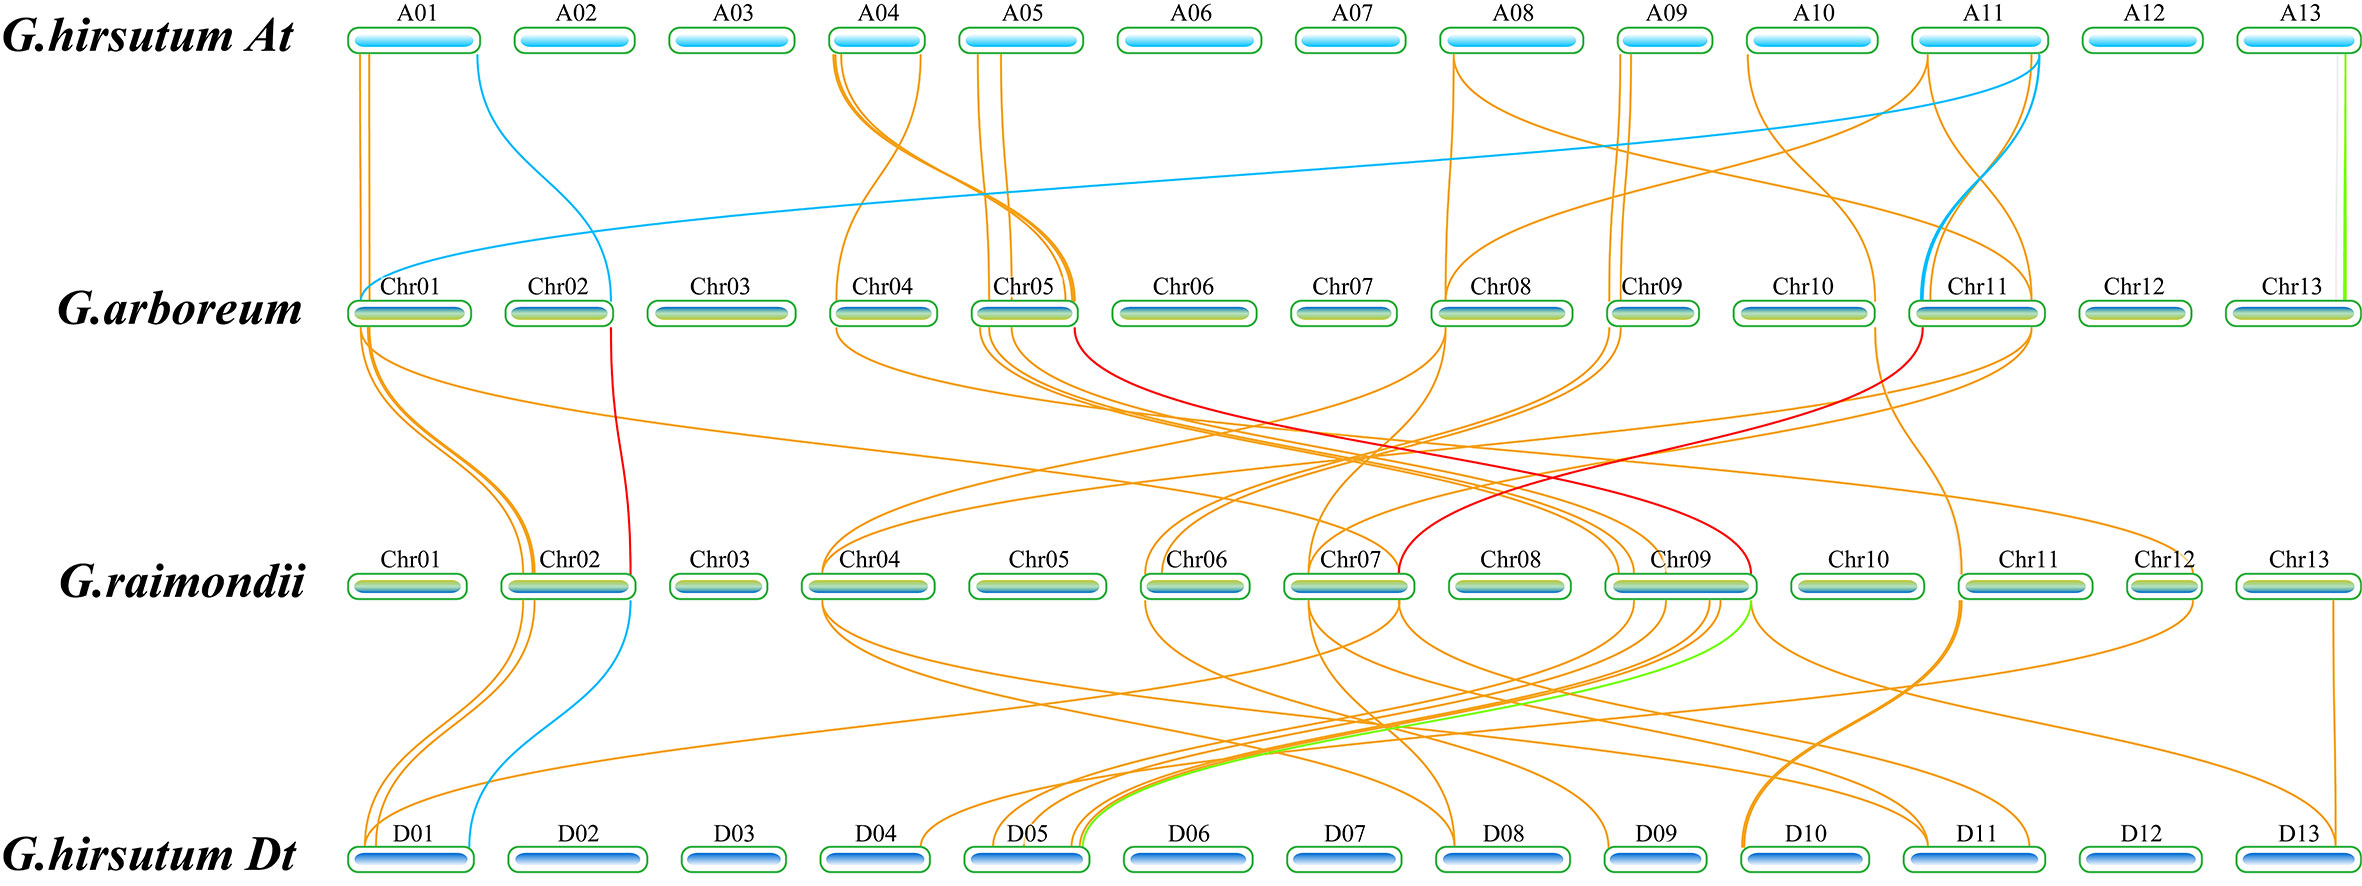
Figure 3 Schematic diagram of collinear analysis of the TPS family genes of G. hirsutum A/D subgroup and G. arboreum and G. raimondii, respectively. The blue squares represented the chromosome of G. hirsutum, the At subgroup of G. hirsutum was at the top, and the Dt subgroup of G. hirsutum was at the bottom. In the figure, the green squares represented the chromosomes of G. arboreum and G. raimondii, and the length represents the length of the chromosome. The name of the chromosome was labeled above each chromosome. The lines in the figure represented collinear relationships between species. The yellow lines represented collinear relationships between G. hirsutum and both G. arboreum and G. raimondii, the red lines represented collinear relationships of GhCDNs between G. arboreum and G. raimondii, the blue lines represented collinear relationships of 12 GhCDN-A between G. hirsutum and both G.arboreum and G. raimondii, the green lines represented collinear relationships of other GhCDNs between G. hirsutum and both G.arboreum and G. raimondii, and the positions of the lines on chromosomes represented the relative positions of genes on chromosomes.
Among the 22 collinear genes between G. hirsutum and G. arboreum, 10 TPSs belong to the TPS-a subfamily, and six TPSs belong to the TPS-b subfamily. Among the 20 collinear genes between G. hirsutum and G. raimondii, eight TPSs belong to the TPS-a subfamily, and six TPSs belong to the TPS-b subfamily. However, there were only 38 TPS genes in G. hirsutum that were collinear with G. arboreum or G. raimondii, including 15 TPS-a genes and 13 TPS-b genes (Table S3). The results suggested that a large number of duplications and losses occurred in the TPS-a subfamily, whereas the TPS-b subfamily genes had better integrity in the evolution process of G. hirsutum.
Tandem and segmental duplications significantly promoted the expansion and the expression differentiation of TPS gene families in G. hirsutum, as shown in Figure S1. Then we employed TBtools to calculate dS (synonymous substitutions) and dN (non-synonymous substitutions) values (Table S4). The dN/dS ratio of all duplicate gene pairs was less than 1, indicating that the duplicate gene pairs had undergone a purification and selection process (Goldman and Yang, 1994).
Given that many duplications, losses, and selections occurred in the GhTPS-a subfamily during evolution, further research was mainly focused on the GhTPS-a subfamily genes. Previous reports showed that TPS-a could be divided into two branches, a1 and a2, and the a1 branch was composed of dicotyledonous plants, while a2 was composed of monocotyledonous plants (Chen et al., 2011). Therefore, TPS-a genes of dicotyledonous plants, including cotton and monocotyledonous plants were constructed into the phylogenetic tree. The results confirmed this notion that GhTPS-a genes belong to the a1 branch (Figure S2).
Based on analysis of the conserved motif, the GhTPS-a1 gene subfamily contains a conservative RR(P)X8W motif (PF01397) at the N-terminus and a conservative DDXXD and NSE/DTE motif (PF03936) at the C-terminus, similar to the previous report (Degenhardt et al., 2009). The RR(P)X8W motif (PF01397) mainly had a role in the cyclization of terpenoids, and loss of this motif results in acyclic volatile terpenoids. The DDXXD motif was a metal-binding motif that could bind metals, which is enhanced by the NSE/DTE structure with metal ligands. In addition, a RXR motif was found in the GhTPS-a1 subfamily (Figure 4) and was reported to be related to the di-salt complexation reaction after substrate ionization (Starks et al., 1997).
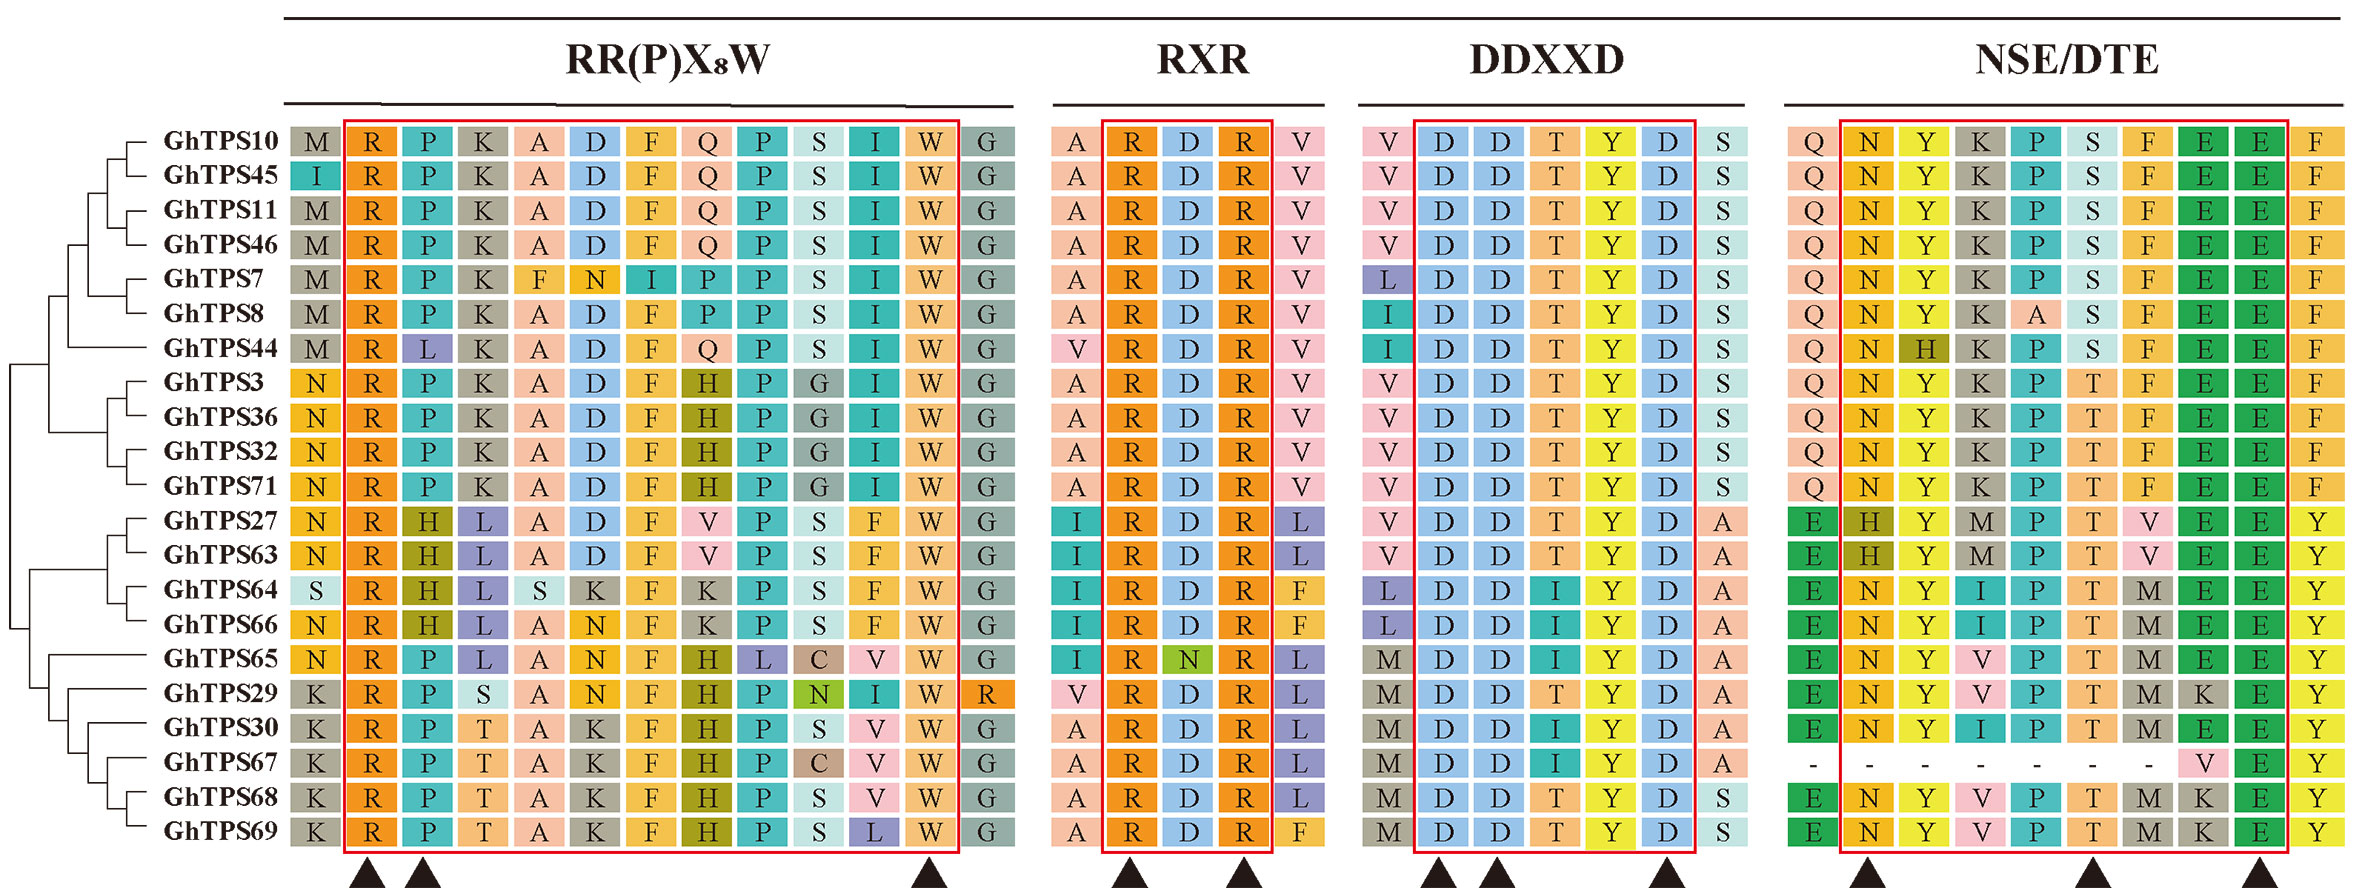
Figure 4 Schematic diagram of GhTPS-a conservative motif in G. hirsutum. On the left was GhTPS-a phylogenetic tree analysis of G. hirsutum. The red line was the conserved motif, the name of the conserved motif was indicated above, and ▲ was the conserved amino acid site.
By functional annotation of GhTPS-a1 subfamily genes, 21 of the 41 GhTPS-a1 genes belong to the GhCDN (cadinene synthase) gene subfamily supported by the phylogenetic tree (Figure S2, Table S5). According to evolutionary analysis, these CDN family genes were divided into five subfamilies, A, B, C, D, and E, among which the CDN-B and CDN-D subfamilies were reported to be almost pseudogenes (Sun et al., 2010; Cheng et al., 2016), and the CDN-C subfamily had the most members (Townsend et al., 2005). There are 12, 1, 5, 1, and 2 members in the GhCDN-A, B, C, D, and E subfamilies, respectively. The collinearity analysis showed that six of the 21 GhCDNs had collinearity with G. arboreum or G. raimondii, of which four GhCDN-A genes were collinear and all had tandem duplications or segmental duplications. Therefore, we will further focus on research on the GhCDN-A subgroup genes.
To evaluate the GhCDN-A characterization in cotton, we performed an analysis of chromosomal location. Twelve GhCDN-A genes were mainly distributed on chromosome 1 (two genes) and chromosome 11 (10 genes) (Table 1), which is different from the chromosome distribution of the 76 TPS genes (Karaca and Ince, 2023) (Figure S3; Table S6). The length of GhCDN-A amino acids ranged from 505 to 1,027, the molecular weight ranged from 58.51 kDa to 117.35 kDa, the isoelectric points ranged from 4.91 to 6.65, and the hydrophilicity ranged from −0.481 to −0.163. The instability index of GhCDN-A proteins was high, and they could be mainly located in the cytoplasm. Structural analysis revealed that the GhCDN-A genes had six introns and seven exons (Figure S4), whose encoding proteins contained four conserved motifs: RR (P)X8W, RXR, DDXXD, and NSE/DTE (Figure 4).
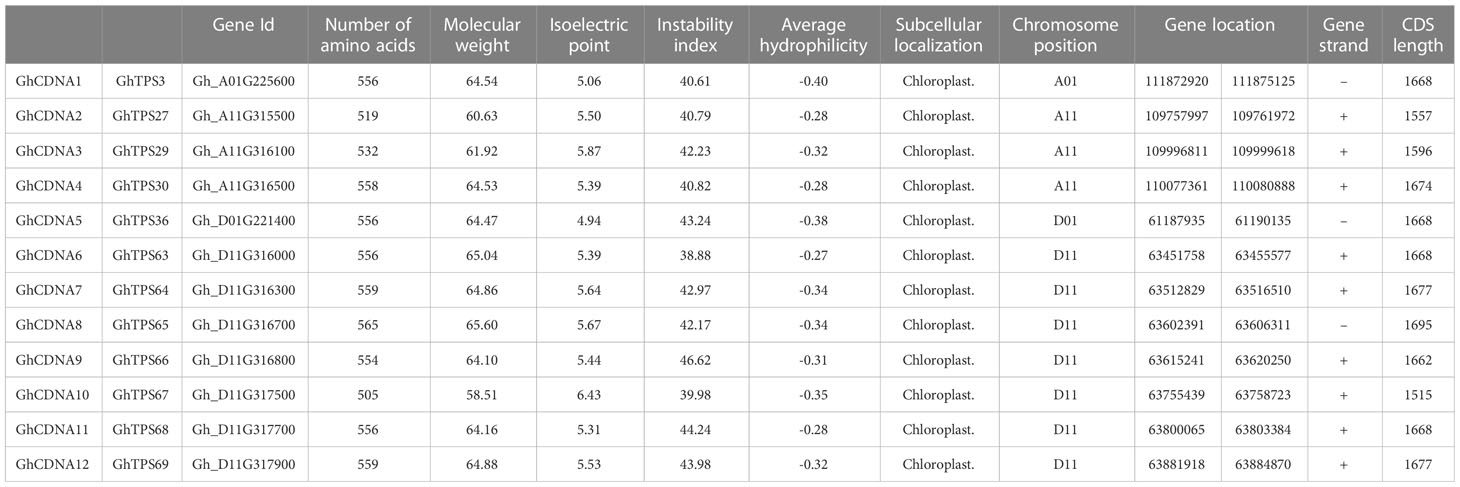
Table 1 Bioinformatics analysis of the GhCDNA gene family in G. hirsutum.
According to the qRT-PCR analysis, GhCDN-A genes had high expression levels in seeds, roots, hypocotyls, and stems (Figure 5A), a consistent trend with the published transcriptome data with slight differences in various tissues and organs (Figure S5) (Zhang et al., 2015).
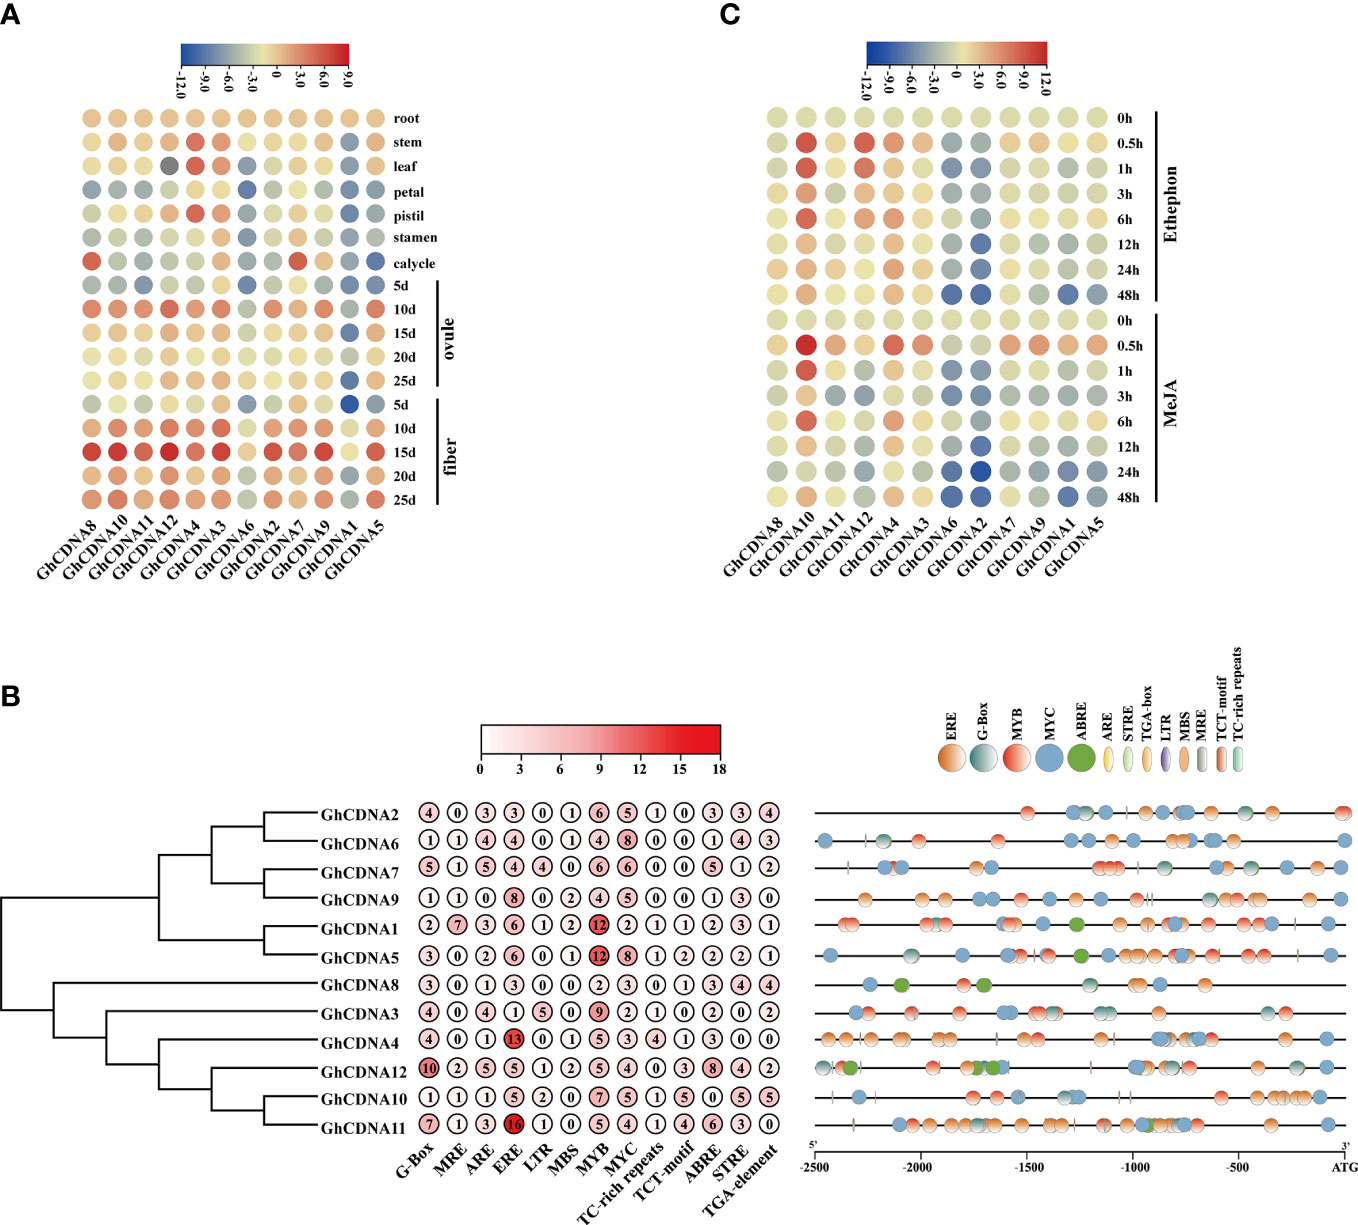
Figure 5 The promoter analysis and expression analysis of GhCDN-A gene family. (A) Heatmap of the quantitative real-time PCR of 12 GhCDN-A genes in 17 tissues. (B) The analysis of 2.5 kb promoter of 12 GhCDN-A genes, which successively shows the phylogenetic tree of GhCDN-A genes, the number of cis-regulatory elements, and the number of cis-regulatory elements. (C) Heatmap of the expression level of GhCDN-A genes in roots after treating with 50 μM MeJA and 50 μM ethephon.
To investigate the regulation of expression of GhCDN-A genes, the 2.5kb promoter region was identified by cis-regulatory element analysis. By screening the cis-regulatory elements appearing in more than four genes, the promoter region of GhCDN-A genes contained light cycle-related elements, defense and stress-related elements, hormonal responses-related elements, growth and development-related elements, etc. (Figure 5B). The defense and stress-related elements, including G-box and MYC elements, play an important role in the JA signaling pathway. ERE, as an ethylene-induced cis-regulatory element and MYB transcription factor binding elements were present in the promoters of all GhCDN-A genes. The special cis-elements in the promoters of GhCDN-A genes suggested that the JA and ethylene signaling pathways may be involved in gossypol synthesis as well as the MYB transcription factor. According to the map of the location and quantity of cis-regulatory elements, the promoters of 12 GhCDN-A genes contain different cis-elements, indicating that GhCDN-A genes have different expression profiles.
To verify whether GhCDN-A genes were induced by MeJA and ethephon, their expression levels were tested under the application of exogenous hormones. The results showed that three GhCDN-A genes, GhCDNA4, GhCDNA10, and GhCDNA12, were upregulated by ethephon, whereas GhCDNA1, GhCDNA2, GhCDNA5, GhCDNA6, and GhCDNA9 were downregulated. Under MeJA treatment, GhCDNA4 and GhCDNA10 were upregulated, while GhCDNA1, GhCDNA2, GhCDNA5, GhCDNA6, and GhCDNA9 were downregulated (Figure 5C). This result indicated that several key GhCDN-A genes were induced by ethephon and MeJA to possibly participate in plant defense.
To investigate the relationship between the GhCDN-A subfamily genes and gossypol content, the expression levels of the GhCDN-A subfamily genes were analyzed in eight high-gossypol and two low-gossypol varieties based on the published article (Wang et al., 2017). Interestingly, there were comparable expression levels in GhCDN-A subfamily genes among high/low gossypol varieties (Figure S6A), indicating that they participate in gossypol synthesis and are not due to a single major gene.
To further evaluate the GhCDN-A function in gossypol synthesis, we employed two key genes, GhCDN-A1 and GhCDN-A5, to separately knock them down via the tobacco rattle virus (TRV)-induced gene silencing (VIGS) method. Gene-specific fragments were inserted into the p156 vector to construct TRV: GhCDN-A silencing vectors. The 7-day-old cotton seedlings were agroinfiltrated with a needleless syringe and a corresponding gene silencing vector with the help of the p192 vector. The GhPDS-silencing plants were used as positive controls, while plants infected with empty vectors were regarded as negative controls. After 14 d post infection (dpi), the GhPDS-silencing plants (a positive control) showed a bleaching phenotype (Figure 6A), while silencing efficiency in GhCDN-A gene-silencing plants was tested by qPCR analysis. The corresponding target expression levels of GhCDN-A gene-silencing plants significantly decreased compared to the control treated with an empty vector (Figure S6B). Compared to the control, the density of glands and the gossypol contents in two GhCDN-A gene-silencing leaves did not significantly change (Figures S6C, D). Then, we divided all 12 GhCDN-A genes into three groups to develop multi-gene-silencing plants; there was also no significant change in the density of glands or the gossypol content between these gene-silencing leaves and the control (Figures S6E–G). Finally, we developed all 12 GhCDN-A-silencing plants (Figure S7). The plants with total silencing efficiency below 20% were screened to evaluate glands and gossypol accumulation (Figure 6B). As shown in Figure 6, there was no significant change in the density of glands in three 12 GhCDN-A gene-silencing leaves L3, L8, and L13, compared to the control, but the glands became lighter in color. In line with the results, the gossypol content in the TRV::GhCDN-A plants decreased by 70% compared to the control, according to HPLC analysis. The results showed that GhCDN-A participated in the gossypol synthesis with functional redundancy or quantitative effect.
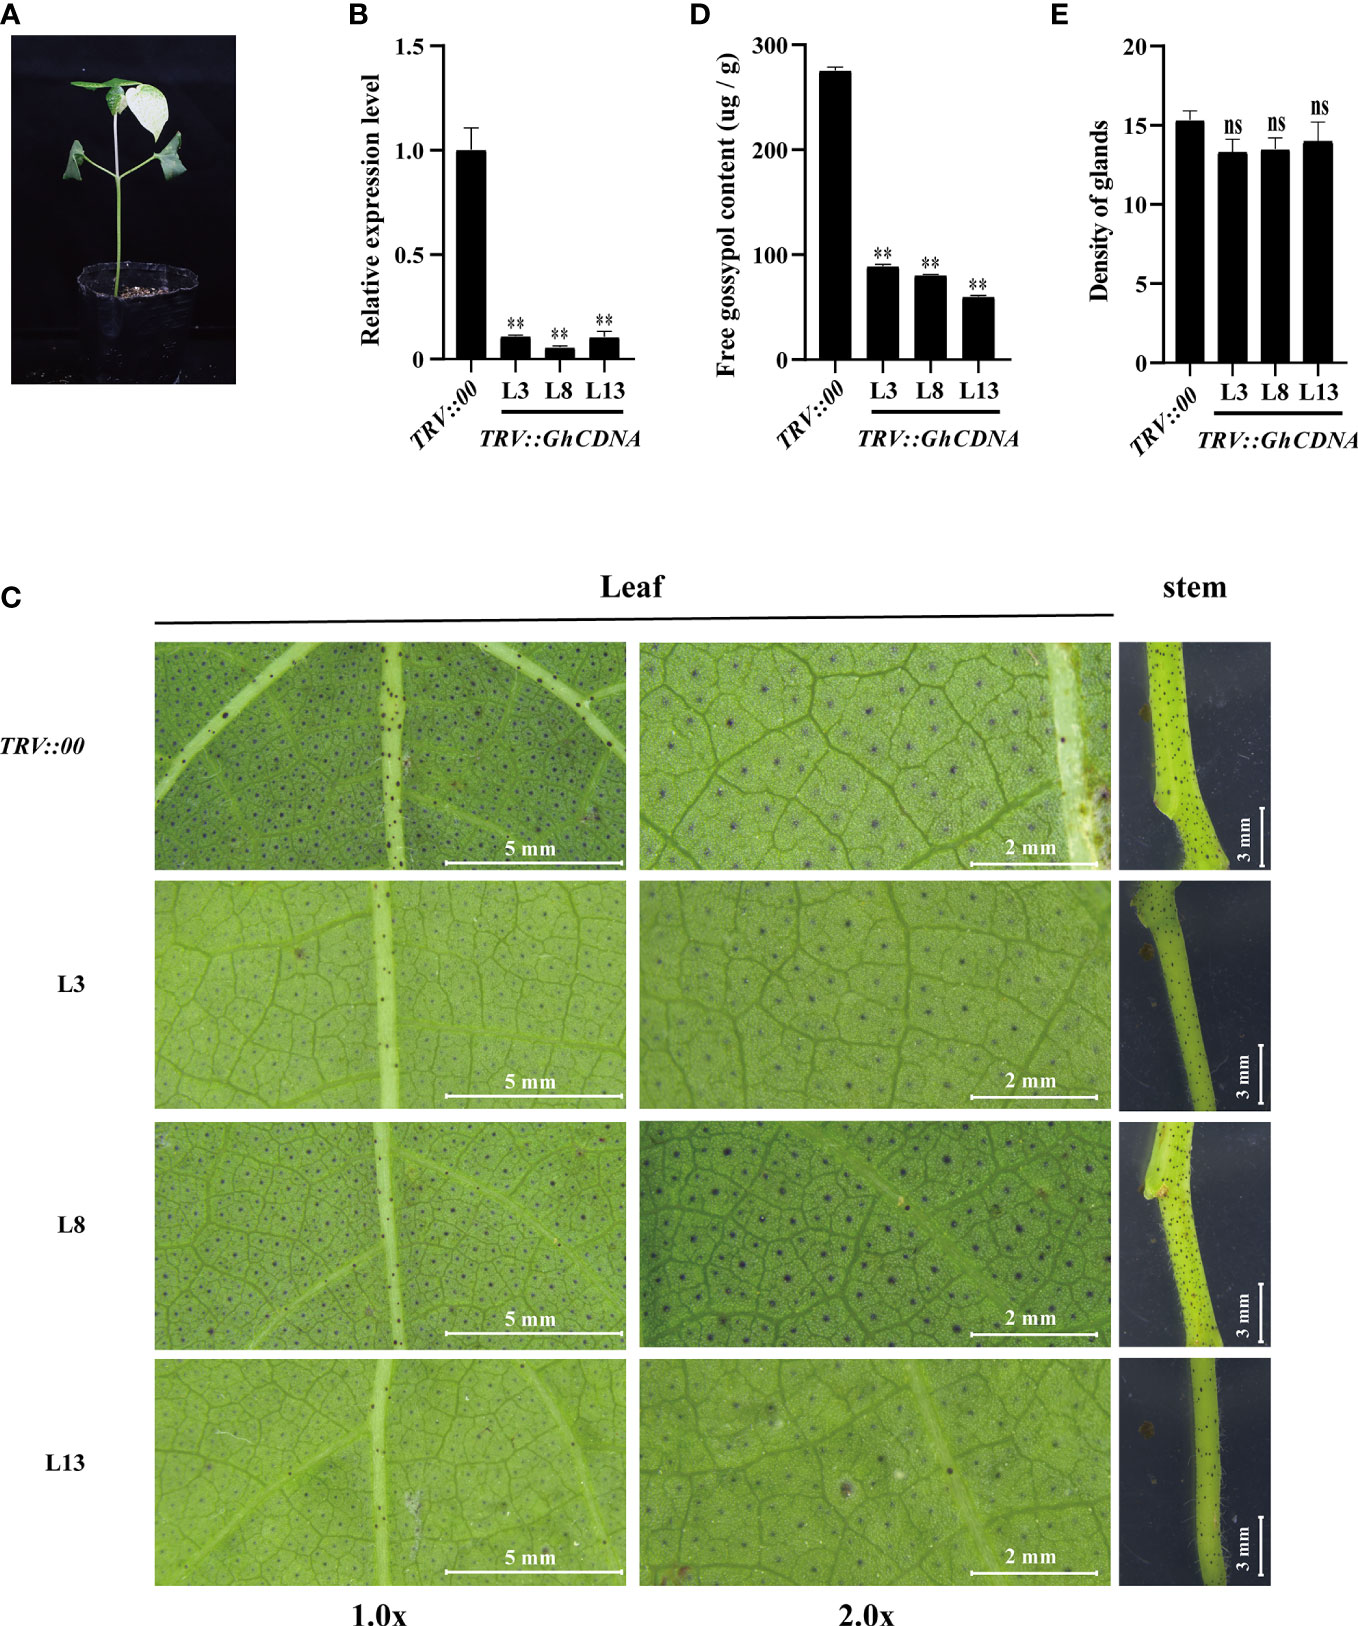
Figure 6 Knockdown of the GhCDNA subfamily genes reduced the gossypol content. (A) The phenotypes of TRV::PDS. (B) The silencing efficiency of the GhCDNA subfamily genes in TRV::00 and TRV::GhCDNA plants. L3, L8, and L13 represented three different strains of TRV::GhCDNA plants. (C) The phenotypes of TRV::00 and TRV::GhCDNA plants. From left to right, the main vein area of cotton leaves was shown, the cotton leaves magnified twice was shown, and the upper node area of cotton stem was shown, with the relative bar value in the lower right corner. (D) The gossypol content in TRV::00 and TRV::GhCDNA plants. (E) The density of glands TRV::00 and TRV::GhCDNA plants. Bars represent SDs (standard deviation) of three independent biological replicates. The single asterisk indicates statistical significance at P <0.05. The double asterisk indicates statistical significance at P <0.01.
To further elucidate the mechanism underlying regulation of GhCDN-A subfamily genes in gossypol synthesis, two extreme varieties with and without gossypol in glands (thereafter glandular (G) and glandless (GL)) were used for transcriptome analysis at three repeats. The correlations of the transcript data from six samples were all above 0.99, indicating good repeatability and high reliability (Figure S8A). Under the conditions of FDR ≤0.01 and log2|FC|≥1, 1,193 differentially expressed genes (DEGs) were screened (Figure S8B). Enriching these DEGs, we found that most of the DEGs were enriched in plant–pathogen interaction, plant defense, and secondary metabolite synthesis (Figures S8C, D).
As shown in Figure 7A on the gossypol synthesis total process, one HMGS-coding gene (Gh_A03G022700), one MVK gene (Gh_D11G341800), and one MVD gene (Gh_D06G048100) at the beginning of the gossypol synthesis pathway (MVA pathway) were significantly upregulated in expression levels in the glandular cotton variety compared to the glandless variety. Then, a key gene, GhCDN2 (Gh_A11G315500), and three CYP706B1-coding genes (Gh_A08G197600, Gh_A12G290200, and Gh_A12G290100) in the gossypol synthesis pathway were also upregulated in the glandular variety. Conversely, from 7-Hydroxy-(+)-δ-cadinene to deoxy-hemi-gossypol, three DH1 coding genes (Gh_D01G223900, Gh_D01G223600, and Gh_A01G229000), eight CYP82D113 genes (Gh_D06G013700, Gh_D05G262600, Gh_A06G013800, Gh_A06G014300, Gh_D06G012700, Gh_D06G013300, Gh_A06G014400, and Gh_D06G012800), one CYP71BE79 gene (Gh_A04G055900), two SPG genes (Gh_A05G283000 and Gh_D03G155900), four 2-ODD-1 coding genes (Gh_D13G236000, Gh_D13G235600, Gh_D13G236000, and Gh_A13G232800) were upregulated to different degrees in glandless cotton variety. It is interesting why these late gossypol synthesis genes are upregulated in the glandless variety compared to the glandular variety, which is worthy of further exploration in the future.
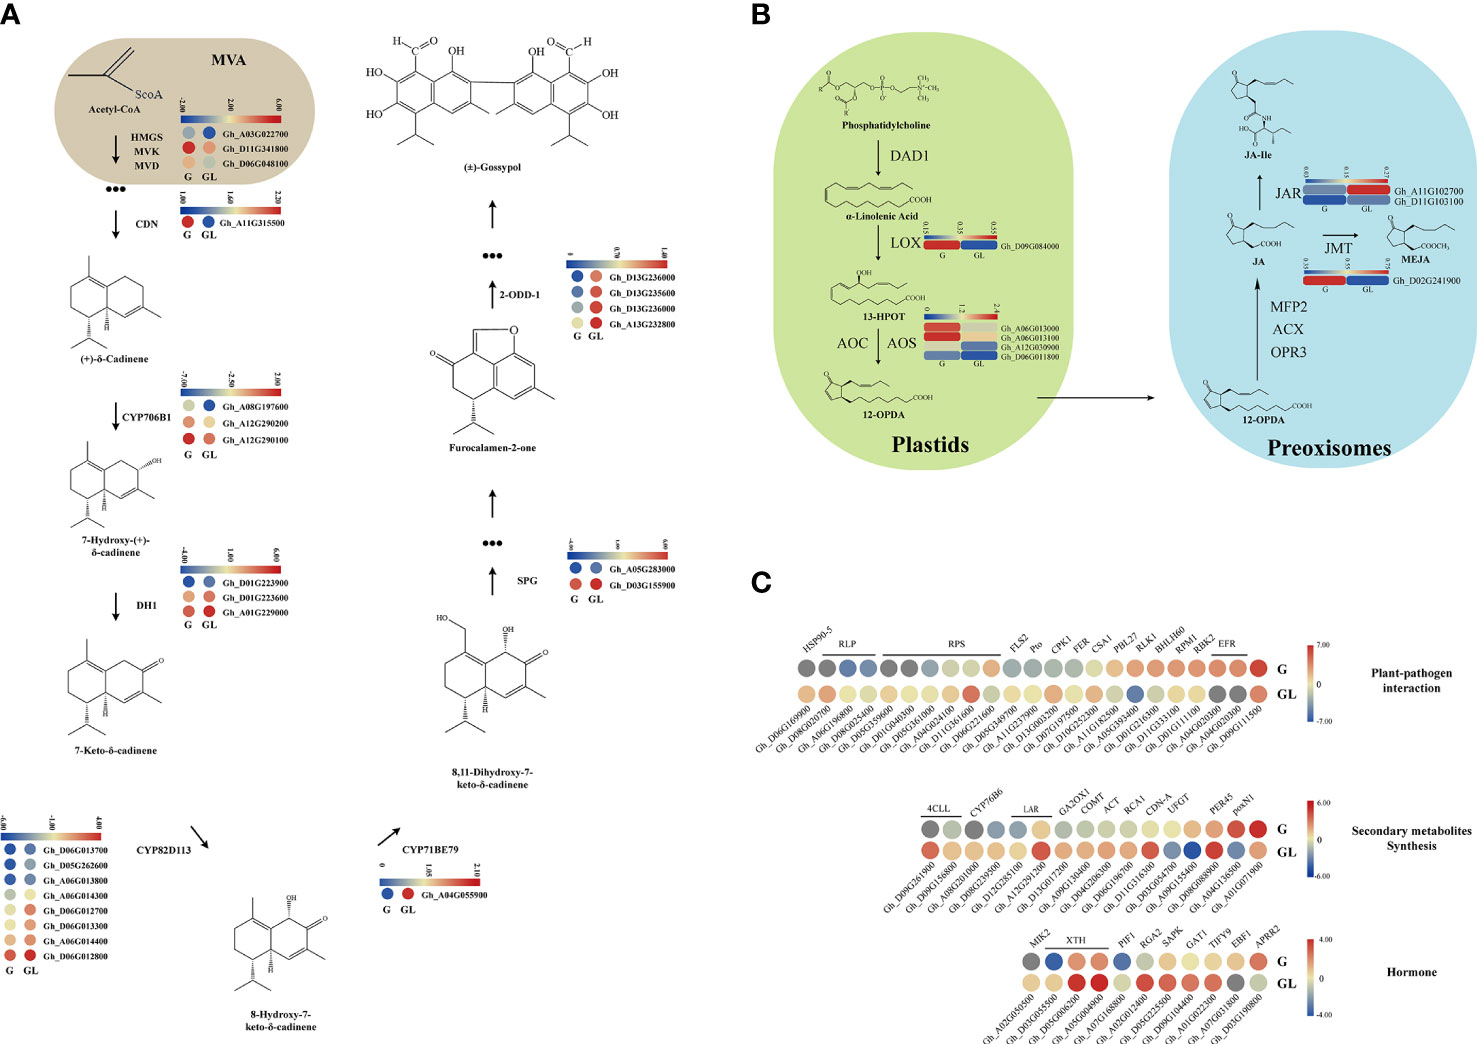
Figure 7 Heatmap of the differentially expressed genes assigned to gossypol biosynthetic and jasmonic acid biosynthetic pathways. (A) The gray part was MVA pathway, the other part was the gossypol biosynthetic pathway. (B) The jasmonic acid biosynthetic pathway, which were in the plastid and deoxyridisome, respectively. (C) The differentially expressed genes were involved in plant pathogen interaction, secondary metabolic synthesis and hormone synthesis. Only the differentially expressed genes in gossypol and non-gossypol materials were shown in the figure. The genes in the red box were upregulated without treatment, and the blue solid line were downregulated. G, glandular cotton; GL, glandless cotton; HMGS, hydroxymethylglutaryl-CoA synthase; MVD, mevalonate 5-diphosphate decarboxylase; MVK, mevalonate kinase; CDN, (+)-δ-cadinene synthase; DH, short-chain alcohol dehydrogenase; SPG, specialized glyoxalase; 2-ODD, 2-oxoglutarate/Fe (II)-dependent dioxygenase.
Some pieces of literatures have demonstrated that Gossypium PIGMENT GLAND FORMATION GENE (GoPGF) (as a regulator) feedbacks on the gossypol biosynthesis pathway through regulating the expression of JAZ, WRKYs, or other genes, which are induced by exogenous signals including JA (Chen et al., 1995; Xiao-Ya et al., 1996). Based on the RNA-Seq data, the LOX encoding genes (Gh_D09G084000) in the JA synthesis pathway and the AOS encoding genes (Gh_A06G013000, Gh_A06G013100, Gh_A12G030900, and Gh_D06G011800) were significantly downregulated in the glandless variety, indicating that JA had a positive effect on the gossypol synthesis pathway (Figure 7B).
It had been reported that gossypol was mainly involved in plant resistance and insect resistance (Puckhaber et al., 2002; Townsend et al., 2005; Stipanovic et al., 2006; Turco et al., 2007; Mellon et al., 2012; Gao et al., 2013). The results of enrichment analysis also indicated that gossypol appears to play an important role in plant resistance. Many star genes in the plant defense response, including FLS2, RLP, RPS, CPK1, RBK2, EFR, BHLH60, etc., showed differential expression between glandular and glandless varieties. Most RLP, RPS, and FLS2-encoding genes showed downregulated expression in the glandular variety, whereas other genes showed upregulated expression (Figure 7C). Therefore, these data confirm that gossypol participates in plant defense.
In the glandless variety, other secondary metabolism synthesis-related genes, including COMT, ACT, PRE45, etc., showed an upward trend compared to the glandular variety, indicating that other secondary metabolites synthesis may be promoted in glandless cotton. In this data, we found that most phytohormone signaling-related genes, including the JA pathway (TIFY9) and ethylene (EBF1), showed an upward trend in glandless cotton (Figure 7C). Our previous transcriptome data on the comparison of JAZ1/TIFY10A-overexpression plants and wild-type plants showed that several GhCDN-A genes were upregulated (Figure S9), further indicating that JA may participate in the synthesis of gossypol, which is consistent with the previous report (Li et al., 2014).
As one of the most diverse compounds in plant secondary metabolism, terpenoids have been widely used in spices, medicine, disease resistance, and other fields (Yamada et al., 2012; Schmidt-Dannert, 2015; Tholl, 2015; Beran et al., 2016; Christianson, 2017). The TPS family is highly conserved in structures, motifs, and functions in reported plants, including almond (Nawade et al., 2019), tomato (Falara et al., 2011), poplar (Irmisch et al., 2014), Arabidopsis (Aubourg et al., 2002), grape (Martin et al., 2010), and rice (Chen et al., 2014), while it is not in algae (Hernandez-Garcia et al., 2021). There is only TPS-c in bryophytes, indicating that this subgroup is one of the earliest. The derivation of bryophytes reveals the gradual transition from aquatic plants to terrestrial plants, during which TPS-c is conserved, indicating that it may be involved in the synthesis of ancient gibberellin (Hernandez-Garcia et al., 2021). Besides the TPS-c subgroup, the TPS-h subgroup was also derived from S. moellendorffii and was suggested to be involved in its emergence (Chen et al., 2011). The terpenoid synthase derives the d and e/f subfamilies in gymnosperms, while the TPS-h subfamily in pteridophytes was lost, which may be related to the appearance and evolution of gymnosperms after several major changes in the geological climate since gymnosperms came into being (Wan et al., 2022). In angiosperms, the TPS-d subfamily derived from gymnosperms disappeared, leaving the unique TPS-a, TPS-b, and TPS-g subfamilies. At present, no species that can contain seven TPS subfamilies have been found, indicating that there has been differentiation of TPS subfamilies in a long evolutionary history. Some species exhibit lineage-specific dilatation in certain subfamilies, with large family dilatation occurring mainly in dicotyledon and monocotyledon plants (Figures 1, 2).
According to the latest genomic data (Yang et al., 2019), we found that G. hirsutum contains 76 full-length GhTPSs, which can be divided into five subfamilies: TPS-a, TPS-b, TPS-c, TPS-e/f, and TPS-g (Figure 2). Among them, TPS-c, TPS-e/f, and TPS-g subfamily genes in cotton could be collinear with G. arboreum and G. raimondii (Figure 3). However, the TPS-a and TPS-b subfamilies have been replicated and lost in large quantities, which is mainly due to the expansion of genes by tandem and fragment replication and the screening of genes to adapt to changes in the environment by purification selection (Figures S2, S3). It also indicated the high conservation and diversity of TPS-a/b during the formation of TPS family members.
The GhCDN gene was a key enzyme involved in the gossypol synthesis pathway. As a branch of the GhTPS-a1 subfamily, the GhCDN gene family also replicates through fragment duplications and tandem duplications. In the process of replication, some parts of the gene were lost, resulting in the generation of non-functional pseudogenes, such as the GhCDN-B subfamily genes. A relatively complete copy of most of the genes was produced to produce functional genes, such as GhCDN-A, C, D, and E. It was reported that there was one member of the CDN-A subfamily in Arabidopsis (Aubourg et al., 2002), but 12 members had been identified in G. hirsutum, indicating that a large number of gene replications occurred in this subfamily (Figure 4). Therefore, our research focus was mainly on GhCDN-A.
GhCDN-A may be induced by MeJA and ethephon (Figures 5B, C), which is consistent with previous reports (Li et al., 2014). The VIGS experiment proved that all 12 GhCDN-A gene plants showed significantly lower content of gossypol compared to the control, but the density of glands did not change (Figure 6), which indicated that the GhCDN-A family genes possess functional redundancy or quantitative effects. This preliminary result showed that the synthesis of gossypol had no obvious influence on the formation of glands, indicating independence, while the loss of glands had a certain degree of influence on the synthesis of gossypol, indicating that there is a certain relationship between them (Ma et al., 2016).
The transcriptome analysis of two extreme materials (with/without gossypol) for transcriptomic analysis showed that the DEGs were mainly enriched in plant–pathogen interaction, plant defense, and secondary metabolite synthesis, which was consistent with previous reports that gossypol was mainly involved in plant disease resistance, insect resistance, and other stress defenses (Puckhaber et al., 2002; Townsend et al., 2005; Stipanovic et al., 2006; Turco et al., 2007; Mellon et al., 2012; Gao et al., 2013). Additionally, the analysis of promoter elements indicated that JA may be involved in the regulation of gossypol formation, and TIFY9 in the JA signaling pathway was significantly different between gossypol and gossypol-free materials, and GhCDN-A was upregulated in JAZ1 (TIFY10A) overexpression materials previously reported (Figure S9). Therefore, we speculate that JA participates in the synthesis of gossypol. The results provided a meaningful reference for gossypol research in G. hirsutum and showed that GhCDN-A subfamily genes play an important role in gossypol synthesis.
TPS proteins in plants are mainly involved in secondary metabolites and hormone synthesis, while in cotton, TPS is also involved in the synthesis of gossypol. Based on an evolutionary perspective, from mosses to ferns, gymnosperms, and angiosperms, TPS genes not only display conservative types but also evolve into new subfamilies through gene replication and loss. The TPS family can be divided into seven subfamilies, and TPS-a has the most members. 21 out of the 41 TPS-a genes in G. hirsutum belong to the GhCDN (cadinene synthase) gene subfamily and were divided into five subfamilies, A, B, C, D, and E. The special cis-elements in the promoters of 12 GhCDN-A genes suggested that the JA and ethylene signaling pathways may be involved in their expression regulation. Only silencing all genes of the GhCDN-A subfamily, the gossypol content in the plant was significantly reduced. All in all, these results reveal plant TPS gene evolution rules and assure that the TPS subfamily, GhCDNA, functions in gossypol synthesis in cotton.
The data presented in the study are deposited in the NCBI repository, accession number PRJNA936998.
TW, JW, and GZ conceived and designed the experiments. TW, XX, and AR performed the experiments. TW and GZ analyzed the data. TW, GZ, and JW wrote the paper. GZ and JW revised the paper. All authors contributed to the article and approved the submitted version.
We thank the Major Program of the National Natural Science Foundation of China (No. 32001511) for funding this project.
The authors declare that the research was conducted in the absence of any commercial or financial relationships that could be construed as a potential conflict of interest.
All claims expressed in this article are solely those of the authors and do not necessarily represent those of their affiliated organizations, or those of the publisher, the editors and the reviewers. Any product that may be evaluated in this article, or claim that may be made by its manufacturer, is not guaranteed or endorsed by the publisher.
The Supplementary Material for this article can be found online at: https://www.frontiersin.org/articles/10.3389/fpls.2023.1162237/full#supplementary-material
Supplementary Figure 1 | Diagram of GhTPSs gene replication. The figure showed the result of collinear analysis of genes in G. hirsutum. The squares on the ring edge represent chromosomes, the names of chromosomes were marked on the top of chromosomes, the length of small squares represents the relative length of chromosomes, and the length was marked on the chromosomes, and the grey lines represented collinear relationship between all the GhTPSs, the blue lines represented collinear relationships between GhCDNs.
Supplementary Figure 2 | Phylogenetic analysis of TPS-a subfamily genes. The branches with purple and pink background were TPS-a1, namely dicotyledonous plants, The branch with green background was TPS-a2, the monocotyledons. The branch with purple background was CDN gene. Different coloured dots represent different species, and species names are indicated below.
Supplementary Figure 3 | Chromosome distribution of GhTPS gene family members in G.hirsutum. The chromosomal position was marked above each chromosome, the length of the short rod represented the length of the chromosome, the relative position of the gene was marked on the right side of the chromosome, the red line represented collinear between the two genes.
Supplementary Figure 4 | The gene structure of GhCDN-A. The left was the GhCDN-A gene phylogenetic tree, the right was the gene structure, the green was the exon, the line was the intron, the blue was the untranslated region (UTR) and the length was the relative length of the gene.
Supplementary Figure 5 | Heatmap of the expression level of GhCDNs in different tissue. The relative expression of GhCDNs in allotetraploid cotton (Gossypium hirsutum L. acc. TM-1) based on a previous report.
Supplementary Figure 6 | Knockdown several key genes/cluster of GhCDN-A subfamily. Heat map of FPKM of 12 GhCDNA genes in eight high gossypol and two low gossypol varieties. (A) The silencing efficiency of GhCDNA1 or GhCDNA5 genes silencing plants. (B) The density of glands of leaves on GhCDNA1 or GhCDNA5 genes silencing plants. (C) The phenotypes of GhCDNA1 or GhCDNA5 genes silencing plants. (D) The silencing efficiency of three GhCDN-A gene clusters. The group I gene cluster contained GhCDNA3, GhCDNA4, GhCDNA11, GhCDNA10, GhCDNA8, GhCDNA12. The group II contained GhCDNA1, GhCDNA5. The group III contained GhCDNA2, GhCDNA6, GhCDNA7, and GhCDNA9. (E) The density of glands of leaves on three GhCDN-A gene clusters silencing plants. (F) The phenotypes of leaves on three GhCDN-A gene clusters silencing plants. Bars represent SDs (standard deviation) of three independent biological replicates. The single asterisk indicates statistical significance at P < 0.05. The double asterisk indicates statistical significance at P < 0.01.
Supplementary Figure 7 | Multiple sequence alignment of GhCDN-A gene. DNAMAN8 was used to analyse the multiple sequence alignment of GhCDN-A gene. The conserved motif was marked by the black box, the sequence used for VIGS experiment was marked with red box.
Supplementary Figure 8 | Gene profiles in glandular and glandless materials. (A) Pearson correlation between the glandular and glandless plants. (B) Volcano plot showed the overlap of differentially expressed genes, FDR ≤ 0.01 and log2|FC| ≥1. (C) The KEGG classification of up-regulated genes. (D) The KEGG classification of down-regulated genes.
Supplementary Figure 9 | The relative expression of key gene. (A) The relative expression of TIFY9 gene in gossypol and gossypol-free materials. (B) The relative expression of GhCDNA gene in gossypol and gossypol-free materials. (C) The relative expression of GhCDNA in GhJAZ1 overexpressed gene materials.
Aubourg, S., Lecharny, A., Bohlmann, J. (2002). Genomic analysis of the terpenoid synthase ( AtTPS ) gene family of Arabidopsis thaliana. Mol. Genet. Genomics 267 (6), 730–745. doi: 10.1007/s00438-002-0709-y
Beran, F., Rahfeld, P., Luck, K., Nagel, R., Vogel, H., Wielsch, N., et al. (2016). Novel family of terpene synthases evolved from trans-isoprenyl diphosphate synthases in a flea beetle. Proc. Natl. Acad. Sci. U.S.A. 113 (11), 2922–2927. doi: 10.1073/pnas.1523468113
Cai, Y., Xie, Y., Liu, J. (2010). Glandless seed and glanded plant research in cotton. AGRONSUSTAIN Dev. 30 (1), 181–190. doi: 10.1051/agro/2008024
Chen, H., Li, G., Köllner, T. G., Jia, Q., Gershenzon, J., Chen, F. (2014). Positive Darwinian selection is a driving force for the diversification of terpenoid biosynthesis in the genus Oryza. BMC Plant Biol. 14 (1), 239. doi: 10.1186/s12870-014-0239-x
Chen, F., Tholl, D., Bohlmann, J., Pichersky, E. (2011). The family of terpene synthases in plants: a mid-size family of genes for specialized metabolism that is highly diversified throughout the kingdom. Plant J. 66 (1), 212–229. doi: 10.1111/j.1365-313X.2011.04520.x
Chen, X. Y., Yuan, C., Heinstein, P., Da Visson, V. J. (1995). Cloning, expression, and characterization of (+)-delta-cadinene synthase: a catalyst for cotton phytoalexin biosynthesis. Arch. Biochem. Biophys. 324 (2), 255. doi: 10.1006/abbi.1995.0038
Cheng, H., Lu, C., Yu, J. Z., Zou, C., Zhang, Y., Wang, Q., et al. (2016). Fine mapping and candidate gene analysis of the dominant glandless gene Gl2e in cotton (Gossypium spp.). Theor. Appl. Genet. 129 (7), 1347–1355. doi: 10.1007/s00122-016-2707-1
Christianson, D. W. (2017). Structural and chemical biology of terpenoid cyclases. Chem. Rev. 117 (17), 11570–11648. doi: 10.1021/acs.chemrev.7b00287
Coutinho, E. M. (2002). Gossypol: a contraceptive for men. Contraception 65 (4), 259–263. doi: 10.1016/S0010-7824(02)00294-9
Coyle, T., Levante, S., Shetler, M., Winfield, J. (1994). In vitro and in vivo cytotoxicity of gossypol against central nervous system tumor cell lines. J. Neurooncol. 19 (1), 25–35. doi: 10.1007/BF01051046
Cui, A., Jin, Y., Li, Y., Nie, T., Sun, L. (2023). Systematic identification of TPS genes in Gossypium and their characteristics in response to flooding stress. Front. Plant Sci. 14. doi: 10.3389/fpls.2023.1126884
Davis, E. M., Tsuji, J., Davis, G. D., Pierce, M. L., Essenberg, M. (1996). Purification of (+)-δ-cadinene synthase, a sesquiterpene cyclase from bacteria-inoculated cotton foliar tissue. Phytochemistry 41 (4), 1047–1055. doi: 10.1016/0031-9422(95)00771-7
Degenhardt, J., Kllner, T. G., Gershenzon, J. (2009). Monoterpene and sesquiterpene synthases and the origin of terpene skeletal diversity in plants. Phytochemistry 69 (15–16), 1621–1637. doi: 10.1016/j.phytochem.2009.07.030
Falara, V., Akhtar, T. A., Nguyen, T. T., Spyropoulou, E. A., Bleeker, P. M., Schauvinhold, I., et al. (2011). The tomato terpene synthase gene family. Plant Physiol. 157 (2), 770–789. doi: 10.1104/pp.111.179648
Gao, W., Long, L., Zhu, L. F., Xu, L., Gao, W. H., Sun, L. Q., et al. (2013). Proteomic and virus-induced gene silencing (VIGS) analyses reveal that gossypol, brassinosteroids, and jasmonic acid contribute to the resistance of cotton to Verticillium dahliae. Mol. Cell PROTEOMICS. 12 (12), 3690–3703. doi: 10.1074/mcp.M113.031013
Goldman, N., Yang, Z. (1994). A codon-based model of nucleotide substitution for protein-coding DNA sequences. Mol. Biol. Evol. 11 (5), 725–736. doi: 10.1093/oxfordjournals.molbev.a040153
Hernandez-Garcia, J., Briones-Moreno, A., Blazquez, M. A. (2021). Origin and evolution of gibberellin signaling and metabolism in plants. Semin. Cell Dev. Biol. 109, 46–54. doi: 10.1016/j.semcdb.2020.04.009
Hu, Y., Chen, J., Fang, L., Zhang, Z., Ma, W., Niu, Y., et al. (2019). Gossypium barbadense and Gossypium hirsutum genomes provide insights into the origin and evolution of allotetraploid cotton. Nat. Genet. 51 (4), 739–748. doi: 10.1038/s41588-019-0371-5
Huang, X.-Z., Xiao, Y.-T., Köllner, T. G., Jing, W.-X., Kou, J.-F., Chen, J.-Y., et al. (2018). The terpene synthase gene family in Gossypium hirsutum harbors a linalool synthase GhTPS12 implicated in direct defence responses against herbivores. Plant Cell Environ. 41 (1), 261–274. doi: 10.1111/pce.13088
Irmisch, S., Jiang, Y., Chen, F., Gershenzon, J., Köllner, T. G. (2014). Terpene synthases and their contribution to herbivore-induced volatile emission in western balsam poplar (Populus trichocarpa). BMC Plant Biol. 14 (1), 270. doi: 10.1186/s12870-014-0270-y
Jan, C.-R., Lin, M.-C., Chou, K.-J., Huang, J.-K. (2000). Novel effects of gossypol, a chemical contraceptive in man: mobilization of internal Ca2+ and activation of external Ca2+ entry in intact cells. BBA-MOL. Cell Res. 1496 (2), 270–276. doi: 10.1016/S0167-4889(00)00033-1
Jia, Q., Brown, R., Köllner, T. G., Fu, J., Chen, X., Wong, G. K., et al. (2022). Origin and early evolution of the plant terpene synthase family. Proc. Natl. Acad. Sci. U.S.A. 119 (15), e2100361119. doi: 10.1073/pnas.2100361119
Karaca, M., Ince, A. G. (2023). Grafting-induced seed gossypol levels by demethylation of (+)-delta-cadinene synthase genes in upland cotton. Plant Breed. 142 (1), 97–108. doi: 10.1111/pbr.13066
Keeling, C., Bohlmann, J. (2006). Diterpene resin acids in conifers. Phytochemistry 67 (22), 2415–2423. doi: 10.1016/j.phytochem.2006.08.019
Keilwagen, J., Lehnert, H., Berner, T., Budahn, H., Nothnagel, T., Ulrich, D., et al. (2017). The terpene synthase gene family of carrot (Daucus carota l.): Identification of QTLs and candidate genes associated with terpenoid volatile compounds. Front. Plant Sci. 8. doi: 10.3389/fpls.2017.01930
Kline, M. P., Rajkumar, S. V., Timm, M. M., Kimlinger, T. K., Haug, J. L., Lust, J. A., et al. (2008). R-(-) gossypol (AT-101) activates programmed cell death in multiple myeloma cells. Exp. Hematol. 36 (5), 568–576. doi: 10.1016/j.exphem.2008.01.003
Li, C., He, X., Luo, X., Xu, L., Liu, L., Min, L., et al. (2014). Cotton WRKY1 mediates the plant defense-to-development transition during infection of cotton by Verticillium dahliae by activating JASMONATE ZIM-DOMAIN1 expression. Plant Physiol. 166 (4), 2179–2194. doi: 10.1104/pp.114.246694
Lichtenthaler, Hartmut, K. (1999). The 1-deoxy-d-xylulose-5-phosphate pathway of isoprenoid biosynthesis in plants. Annu. Rev. Plant Physiol. Plant Mol. Biol 50, 47–65. doi: 10.1146/annurev.arplant.50.1.47
Liu, C. J., Heinstein, P., Chen, X. Y. (2000). Expression pattern of genes encoding farnesyl diphosphate synthase and sesquiterpene cyclase in cotton suspension-cultured cells treated with fungal elicitors. Mol. Plant Microbe IN. 12 (12), 1095–1104. doi: 10.1094/MPMI.1999.12.12.1095
Liu, J., Huang, F., Wang, X., Zhang, M., Zheng, R., Wang, J., et al. (2014). Genome-wide analysis of terpene synthases in soybean: functional characterization of GmTPS3. Gene 544 (1), 83–92. doi: 10.1016/j.gene.2014.04.046
Liu, S., Kulp, S. K., Sugimoto, Y., Jiang, J., Lin, Y. C. (2002). The (-)-enantiomer of gossypol possesses higher anticancer potency than racemic gossypol in human breast cancer. Anticancer Res. 22 (1A), 33–38. doi: 10.1097/00001813-200201000-00012
Liu, X., Zhao, B., Zheng, H. J., Hu, Y., Lu, G., Yang, C. Q., et al. (2015). Gossypium barbadense genome sequence provides insight into the evolution of extra-long staple fiber and specialized metabolites. Sci. Rep. 5, 14139. doi: 10.1038/srep14139
Lopez, L. M., Grimes, D. A., Schulz, K. F. (2005). Nonhormonal drugs for contraception in men: a systematic review. Obstet Gynecol Surv. 60 (11), 746–752. doi: 10.1097/01.ogx.0000182905.71077.13
Luo, P., Wang, Y. H., Wang, G. D., Essenberg, M., Chen, X. Y. (2010). Molecular cloning and functional identification of (+)-delta-cadinene-8-hydroxylase, a cytochrome P450 mono-oxygenase (CYP706B1) of cotton sesquiterpene biosynthesis. Plant J. 28 (1), 95–104. doi: 10.1046/j.1365-313x.2001.01133.x
Ma, D., Hu, Y., Yang, C., Liu, B., Fang, L., Wan, Q., et al. (2016). Genetic basis for glandular trichome formation in cotton. Nat. Commun. 7, 10456. doi: 10.1038/ncomms10456
Mao, X. Z., Cai, T., Olyarchuk, J. G., Wei, L. P. (2005). Automated genome annotation and pathway identification using the KEGG orthology (KO) as a controlled vocabulary. Bioinformatics 21 (19), 3787–3793. doi: 10.1093/bioinformatics/bti430
Martin, D. M., Aubourg, S., Schouwey, M. B., Daviet, L., Schalk, M., Toub, O., et al. (2010). Functional annotation, genome organization and phylogeny of the grapevine ( Vitis vinifera ) terpene synthase gene family based on genome assembly, FLcDNA cloning, and enzyme assays. BMC Plant Biol. 10, 226. doi: 10.1186/1471-2229-10-226
Martin, D. M., Faldt, J., Bohlmann, J. (2004). Functional characterization of nine Norway spruce TPS genes and evolution of gymnosperm terpene synthases of the TPS-d subfamily. Plant Physiol. 135 (4), 1908–1927. doi: 10.1104/pp.104.042028
Mellon, J. E., Zelaya, C. A., Dowd, M. K., Beltz, S. B., Klich, M. A. (2012). Inhibitory effects of gossypol, gossypolone, and apogossypolone on a collection of economically important filamentous fungi. J. Agric. Food Chem. 60 (10), 2740–2745. doi: 10.1021/jf2044394
Meng, Y. L., Jia, J. W., Liu, C. J., Liang, W. Q., Heinstein, P., Chen, X. Y. (1999). Coordinated accumulation of (+)-delta-cadinene synthase mRNAs and gossypol in developing seeds of Gossypium hirsutum and a new member of the cad1 family from G. arboreum. J. Nat. Prod. 62 (2), 248–252. doi: 10.1021/np980314o
Nagegowda, D. A. (2010). Plant volatile terpenoid metabolism: Biosynthetic genes, transcriptional regulation and subcellular compartmentation. Febs. Lett. 584 (14), 2965–2973. doi: 10.1016/j.febslet.2010.05.045
Nawade, B., Yahyaa, M., Reuveny, H., Shaltiel-Harpaz, L., Eisenbach, O., Faigenboim, A., et al. (2019). Profiling of volatile terpenes from almond (Prunus dulcis) young fruits and characterization of seven terpene synthase genes. Plant Sci. 287, 110187. doi: 10.1016/j.plantsci.2019.110187
Nieuwenhuizen, N. J., Green, S. A., Chen, X., Bailleul, E. J., Matich, A. J., Wang, M. Y., et al. (2013). Functional genomics reveals that a compact terpene synthase gene family can account for terpene volatile production in apple. Plant Physiol. 161 (2), 787–804. doi: 10.1104/pp.112.208249
Paré, P., Tumlinson, J. H. (1997). Induced synthesis of plant volatiles. Nature 385 (6611), 30–31. doi: 10.1038/385030a0
Puckhaber, L. S., Dowd, M. K., Stipanovic, R. D., Howell, C. R. (2002). Toxicity of (+)- and (-)-gossypol to the plant pathogen, Rhizoctonia solani. J. Agric. Food Chem. 50 (24), 7017–7021. doi: 10.1021/jf0207225
Qian, S. Z., Wang, Z. G. (1984). Gossypol: a potential antifertility agent for males. Annu. Rev. Pharmacol. Toxicol. 24 (1), 329–360. doi: 10.1146/annurev.pa.24.040184.001553
Sapir-Mir, M., Mett, A., Belausov, E., Tal-Meshulam, S., Frydman, A., Gidoni, D., et al. (2008). Peroxisomal localization of Arabidopsis isopentenyl diphosphate isomerases suggests that part of the plant isoprenoid mevalonic acid pathway is compartmentalized to peroxisomes. Plant Physiol. 148 (3), 1219–1228. doi: 10.1104/pp.108.127951
Schmidt-Dannert, C. (2015). Biosynthesis of terpenoid natural products in fungi. Adv. Biochem. Eng. Biotechnol. 148, 19–61. doi: 10.1007/10_2014_283
Starks, C. M., Back, K., Chappell, J., Noel, J. P. (1997). Structural basis for cyclic terpene biosynthesis by tobacco 5-epi-aristolochene synthase. Science 277 (5333), 1815–1820. doi: 10.1126/science.277.5333.1815
Stipanovic, R. D., Lopez, J. D., Dowd, M. K., Puckhaber, L. S., Duke, S. E. (2006). Effect of racemic and (+) - and (–) - gossypol on the survival and development of helicoverpa zea larvae. J. Chem. Ecol. 32 (5), 959–968. doi: 10.1007/s10886-006-9052-9
Sun, Q., Cai, Y., Xie, Y., Mo, J., Yuan, Y., Shi, Y., et al. (2010). Gene expression profiling during gland morphogenesis of a mutant and a glandless upland cotton. Mol. Biol. Rep. 37 (7), 3319–3325. doi: 10.1007/s11033-009-9918-3
Takahashi, S., Koyama, T. (2006). Structure and function of cis-prenyl chain elongating enzymes. Chem. Rec. 6 (4), 194–205. doi: 10.1002/tcr.20083
Tan, X.-P., Liang, W.-Q., Liu, C.-J., Luo, P., Heinstein, P., Chen, X.-Y. (2000). Expression pattern of (+)-δ-cadinene synthase genes and biosynthesis of sesquiterpene aldehydes in plants of. Gossypium arboreum L. Planta 210 (4), 644–651. doi: 10.1007/s004250050055
Tetali, S. (2019). Terpenes and isoprenoids: a wealth of compounds for global use. Planta 249 (1), 1–8. doi: 10.1007/s00425-018-3056-x
Tholl, D. (2015). Biosynthesis and biological functions of terpenoids in plants. Adv. Biochem. Eng. Biotechnol. 148, 63–106. doi: 10.1007/10_2014_295
Tian, X., Ruan, J. X., Huang, J. Q., Yang, C. Q., Fang, X., Chen, Z. W., et al. (2018). Characterization of gossypol biosynthetic pathway. Proc. Natl. Acad. Sci. U.S.A. 115 (23), E5410–e5418. doi: 10.1073/pnas.1805085115
Tocquin, P., Corbesier, L., Havelange, A., Pieltain, A., Kurtem, E., Bernier, G., et al. (2003). A novel high efficiency, low maintenance, hydroponic system for synchronous growth and flowering of Arabidopsis thaliana. BMC Plant Biol. 3 (1), 2. doi: 10.1186/1471-2229-3-2
Townsend, B. J., Poole, A., Blake, C. J., Llewellyn, D. J. (2005). Antisense suppression of a (+)-delta-cadinene synthase gene in cotton prevents the induction of this defense response gene during bacterial blight infection but not its constitutive expression. Plant Physiol. 138 (1), 516–528. doi: 10.1104/pp.104.056010
Trapnell, C., Roberts, A., Goff, L., Pertea, G., Kim, D., Kelley, D. R., et al. (2012). Differential gene and transcript expression analysis of RNA-seq experiments with TopHat and cufflinks. Nat. Protoc. 7 (3), 562–578. doi: 10.1038/nprot.2012.016
Turco, E., Vizzuso, C., Franceschini, S., Ragazzi, A., Stefanini, F. M. (2007). The in vitro effect of gossypol and its interaction with salts on conidial germination and viability of Fusarium oxysporum sp. vasinfectum isolates. J. Appl. Microbiol. 103 (6), 2370–2381. doi: 10.1111/j.1365-2672.2007.03503.x
Vaughan, M. M., Wang, Q., Webster, F. X., Kiemle, D., Hong, Y. J., Tantillo, D. J., et al. (2013). Formation of the unusual semivolatile diterpene rhizathalene by the Arabidopsis class I terpene synthase TPS08 in the root stele is involved in defense against belowground herbivory. Plant Cell 25 (3), 1108–1125. doi: 10.1105/tpc.112.100057
Wan, T., Gong, Y., Liu, Z., Zhou, Y., Dai, C., Wang, Q. (2022). Evolution of complex genome architecture in gymnosperms. Gigascience 11, giac078. doi: 10.1093/gigascience/giac078
Wang, X., Cairns, M. J. (2014). SeqGSEA: A bioconductor package for gene set enrichment analysis of RNA-seq data integrating differential expression and splicing. Bioinformatics 30 (12), 1777–1779. doi: 10.1093/bioinformatics/btu090
Wang, M., Tu, L., Lin, M., Lin, Z., Wang, P., Yang, Q., et al. (2017). Asymmetric subgenome selection and cis-regulatory divergence during cotton domestication. Nat. Genet. 49 (4), 579–587. doi: 10.1038/ng.3807
Wolter, K. G., Wang, S. J., Henson, B. S., Wang, S., D'Silva, N. J. (2006). (-)-gossypol inhibits growth and promotes apoptosis of human head and neck squamous cell carcinoma in vivo. Neoplasia (New York N.Y.) 8 (3), 163–172. doi: 10.1593/neo.05691
Xiao-Ya, C., Wang, M., Chen, Y., Davisson, VJ., Heinstein, P. (1996). Cloning and heterologous expression of a second (+)-δ-cadinene synthase from Gossypium arboreum. J. Nat. Prod. 59 (10), 944–951. doi: 10.1021/np960344w
Yamada, Y., Cane, D. E., Ikeda, H. (2012). Diversity and analysis of bacterial terpene synthases. Methods Enzymol. 515, 123–162. doi: 10.1016/b978-0-12-394290-6.00007-0
Yang, Z., Ge, X., Yang, Z., Qin, W., Sun, G., Wang, Z., et al. (2019). Extensive intraspecific gene order and gene structural variations in upland cotton cultivars. Nat. Commun. 10 (1), 2989. doi: 10.1038/s41467-019-10820-x
Yang, C. Q., Wu, X. M., Ruan, J. X., Hu, W. L., Mao, Y. B., Chen, X. Y., et al. (2013). Isolation and characterization of terpene synthases in cotton (Gossypium hirsutum). Phytochemistry 96, 46–56. doi: 10.1016/j.phytochem.2013.09.009
Ye, W., Chang, H.-L., Wang, L.-S., Huang, Y.-W., Shu, S., Deiuliis, J. A., et al. (2005). Modulation of multi-drug resistant gene expression in human breast cancer cells by dietary gossypol. Cancer Res. 65 (9_Supplement), 126–126.
Yu, Z., Zhao, C., Zhang, G., Teixeira da Silva, J. A., Duan, J. (2020). Genome-wide identification and expression profile of TPS gene family in dendrobium officinale and the role of DoTPS10 in linalool biosynthesis. Int. J. Mol. Sci. 21 (15), 5419. doi: 10.3390/ijms21155419
Zhang, T., Hu, Y., Jiang, W., Fang, L., Guan, X., Chen, J., et al. (2015). Sequencing of allotetraploid cotton (Gossypium hirsutum l. acc. TM-1) provides a resource for fiber improvement. Nat. Biotechnol. 33 (5), 531–537. doi: 10.1038/nbt.3207
Zhao, T., Li, C., Li, C., Zhang, F., Zhu, S. (2019). Genome-wide analysis of genetic variations between dominant and recessive NILs of glanded and glandless cottons. Sci. Rep. 9 (1), 9226. doi: 10.1038/s41598-019-45454-y
Zhao, G., Song, Y., Wang, C., Butt, H. I., Wang, Q., Zhang, C., et al. (2016). Genome-wide identification and functional analysis of the TIFY gene family in response to drought in cotton. Mol. Genet. Genomics 291 (6), 2173–2187. doi: 10.1007/s00438-016-1248-2
Keywords: gossypol, phylogenetic analysis, cadinene synthase, Gossypium hirsutum, terpenoid synthase
Citation: Wen T, Xu X, Ren A, Zhao G and Wu J (2023) Genome-wide identification of terpenoid synthase family genes in Gossypium hirsutum and functional dissection of its subfamily cadinene synthase A in gossypol synthesis. Front. Plant Sci. 14:1162237. doi: 10.3389/fpls.2023.1162237
Received: 09 February 2023; Accepted: 24 March 2023;
Published: 26 April 2023.
Edited by:
Daojun Yuan, Huazhong Agricultural University, ChinaCopyright © 2023 Wen, Xu, Ren, Zhao and Wu. This is an open-access article distributed under the terms of the Creative Commons Attribution License (CC BY). The use, distribution or reproduction in other forums is permitted, provided the original author(s) and the copyright owner(s) are credited and that the original publication in this journal is cited, in accordance with accepted academic practice. No use, distribution or reproduction is permitted which does not comply with these terms.
*Correspondence: Ge Zhao, emhhbzEyM2FiY2RlLm9rQDE2My5jb20=; Jiahe Wu, d3VqaWFoZUBpbS5hYy5jbg==
†These authors have contributed equally to this work
Disclaimer: All claims expressed in this article are solely those of the authors and do not necessarily represent those of their affiliated organizations, or those of the publisher, the editors and the reviewers. Any product that may be evaluated in this article or claim that may be made by its manufacturer is not guaranteed or endorsed by the publisher.
Research integrity at Frontiers
Learn more about the work of our research integrity team to safeguard the quality of each article we publish.