
95% of researchers rate our articles as excellent or good
Learn more about the work of our research integrity team to safeguard the quality of each article we publish.
Find out more
ORIGINAL RESEARCH article
Front. Plant Sci. , 30 May 2023
Sec. Crop and Product Physiology
Volume 14 - 2023 | https://doi.org/10.3389/fpls.2023.1158329
This article is part of the Research Topic Advances in Environmental Stress Biology and Important Agronomic Traits Improvement in Non-staple Crops View all 11 articles
 Wenqing Zuo1Baojian Wu1Yuxuan Wang1Shouzhen Xu1Jingshan Tian1Xingli Jiu2Hengyi Dong2
 Wangfeng Zhang1*
Objective: It is of great importance to explore agronomic management measures for water conservation and cotton yield in arid areas.
Methods: A four–year field experiment was conducted to evaluate cotton yield and soil water consumption under four row spacing configurations (high/low density with 66+10 cm wide, narrow row spacing, RS66+10H and RS66+10L; high/low density with 76 cm equal row spacing, RS76H and RS76L) and two irrigation amounts (CI:conventional drip irrigation; LI:limited drip irrigation) during the growing seasons in Shihezi, Xinjiang.
Results: A quadratic relationship was observed between the maximum LAI (LAImax) and seed yield. Canopy apparent transpiration rate(CAT), daily water consumption intensity (DWCI) and crop evapotranspiration (ETC) were positively and linearly correlated with LAI. The seed yields, lint yields, and ETC under CI were 6.6–18.3%,7.1–20.8% and 22.9–32.6%higher than those observed under LI, respectively. The RS66+10H under CI had the highest seed and lint yields. RS76L had an optimum LAImax range, which ensured a higher canopy apparent photosynthesis and daily dry matter accumulation and reached the same yield level as RS66+10H; however, soil water consumption in RS76L was reduced ETC by 51–60 mm at a depth of 20–60 cm at a radius of 19–38 cm from the cotton row,and water use efficiency increased by 5.6–8.3%compared to RS66+10H under CI.
Conclusion: A 5.0<LAImax<5.5 is optimum for cotton production in northern Xinjiang, and RS76L under CI is recommended for high yield and can further reduce water consumption. Under LI, the seed and lint yield of RS66+10H were 3.7–6.0% and 4.6–6.9% higher than those of RS76L, respectively. In addition, high-density planting can exploit the potential of soil water to increase cotton yields under water shortage conditions.
Cotton (Gossypium hirsutum L.) is the most widely cultivated and vital fiber crop worldwide (Dai and Dong, 2014). It is mainly planted in the arid areas of China, the United States, Australia, Pakistan, and India (Tian et al., 2017; Tabashnik and Carrière, 2019; Anwar et al., 2020). Insufficiency or deficit irrigation is the main obstacle to the sustainable development of cotton in arid regions (Forouzani and Karami, 2011; Wei et al., 2022). However, agricultural irrigation water accounts for more than 60% of total land water consumption (Qin et al., 2016; Rafiee and Kalhor, 2016). The increasing demand for crop yield resulting from population growth further exacerbates water shortages in arid areas (Neumann et al., 2011). Therefore, it is crucial to ensure that agricultural development measures in arid areas consider the regulation of field management, appropriate irrigation methods to improve the rational use of water resources, and high crop yield.
Augmenting planting density is an important cultivation practice for increasing crop yield (Zhang et al., 2004; Feng et al., 2017), because it can increase leaf area index (LAI) and the interception of light energy, resulting in higher canopy photosynthetic capacity (Zhang et al., 2004; Liao et al., 2022). As the largest cotton-producing region in China, Xinjiang has a favorable ecological environment for producing high quality and yield cotton, due to abundant sunshine, a dry climate, and large diurnal temperature differences (Li et al., 2017). The widespread application of mulch drip irrigation technology since the late 1990s has effectively improved the water resource efficiency of crop production in arid and semi–arid regions in northern China (Dai and Dong, 2014; Guo et al., 2021). In recent years, cotton planting density in Xinjiang has been stable at around 22.5×10⁴ plant hm–2 (Hu et al., 2021) due to the breeding of new varieties (Wang et al., 2021a) and the rational use of growth regulators (Shi et al., 2022). A higher LAI combined with sufficient light in Xinjiang improved the effective interception of photosynthetic radiation (Feng et al., 2017; Wu et al., 2017), canopy photosynthesis, and biomass accumulation, reduces the number of bolls per plant, increases the number of bolls per population (Zhang et al., 2004), thus increasing cotton yield (Dong et al., 2006; Araus et al., 2021). Therefore, increasing planting density to improve above–ground LAI is an important measure to obtain high crop yield. However, a higher LAI may lead to mutual shading within the cotton canopy, thus affecting population photosynthetic productivity (Hu et al., 2021; Paul et al., 2021). Appropriate planting density can also improve cotton yield by improving dry matter accumulation and potassium fertilizer absorption (Khan et al., 2017a; Khan et al., 2017b). Studies on cotton LAI in the Americas and other major cotton–growing countries in Asia have shown that the optimum LAI for a higher cotton yield is between 4.0 and 5.0 (Kerby et al., 1990; Heitholt, 1994; Bilal et al., 2019). However, there is still no definite conclusion regarding the optimum cotton LAI range after machine–harvested planting was implemented in Xinjiang.
A high crop yield in arid areas should be accompanied by efficient utilization of water resources. Crop evapotranspiration (ETC), which includes soil evaporation and crop transpiration, is a key component of water consumption in agricultural fields, accounting for more than 90% of agricultural water use (Hou et al., 2022). Moreover, a high planting density significantly increases the ETC (Cui et al., 2018; Wang et al., 2021b). Therefore, higher irrigation volumes are required to meet the demand for higher yields under high-density planting (Kodur, 2017; Wu et al., 2017; Hernandez et al., 2021). Some studies have also shown that ETC is related to leaf area, but a larger LAI did not lead to higher soil water consumption because of shading between leaves, although more bare land areas were covered (Rahman et al., 2018; Di et al., 2019). Therefore, it is necessary to adjust the planting density and irrigation amount to regulate the aboveground LAI in a suitable range to improve the photosynthetic rate and increase the dry population accumulation (Yao et al., 2017; Chen et al., 2019). The adoption of new irrigation practices, such as sub–membrane drip irrigation (Zou et al., 2020), deficit irrigation (Paul et al., 2021) and limited irrigation (Chen et al., 2019) are common irrigation practices for improving water use efficiency (WUE) in arid areas. Many scholars have shown that, proper irrigation kept the crop root system in the irrigated wet zone (Chen et al., 2018), improves root morphology and physiological activity (Luo et al., 2014), and facilitates rapid water uptake by the root system for upward transport through the main stem to supply upper ground growth (Chen et al., 2019).
The combination of mulch drip irrigation and high-density planting is an important technical measure for high cotton yields in Xinjiang (Sui et al., 2018; Guo et al., 2021). However, the increasing shortage and unbalanced distribution of water have severely restricted cotton production in this area (Li et al., 2021). Therefore, it is important to explore water saving strategies and high cotton yields by conducting research on agronomic technical measures based on drip irrigation projects. We hypothesize that under water deficit conditions, increasing planting density could maintain the photosynthetic productivity of cotton populations by maximizing the use of soil water and increasing the population LAI to ensure high cotton yields. While under water-sufficient conditions, low-density planting has the potential to optimize canopy LAI to achieve high photosynthetic productivity while reducing soil water consumption. We hypothesized that there would be an optimal planting pattern under different water supply conditions to achieve a combination of water savings and cotton yield. The objectives of this study were (a) to determine the effects of irrigation amount and row spacing configuration on LAI dynamics and population photosynthesis capacity during the cotton reproductive period, and (b) to clarify the population transpiration water consumption and soil water consumption and provide suitable field management measures for high yields and water conservation in arid areas.
A four–year field experiment was conducted at the 13th Company (45°12′N, 86°05′E, 380m a. s. l.) and 11th Company of the 149th Regimental Farm of Sihezi (45°12′N, 86°06′E, 380m, a. s. l.) and the experimental sites of Shihezi University (45°19′N, 86°03′E, 482m a. s. l.) and Wulanwusu Agrometeorological Experiment Station of Shihezi (44°17′N, 85°49′E, 520m a. s. l.) during the 2016–2019 growing seasons, respectively. The four test sites are typical of temperate continental climates. The locations in which this trial was conducted were in accordance with conventional tillage. Weather data for the sites were obtained from the nearest meteorological station. Daily maximum temperature, minimum temperature, and rainfall from planting until harvest (April to October) for 4 years are shown in Figure 1. The soil texture, soil moisture content, soil bulk density, and soil nutrient content of the test area before sowing are shown in Table 1.
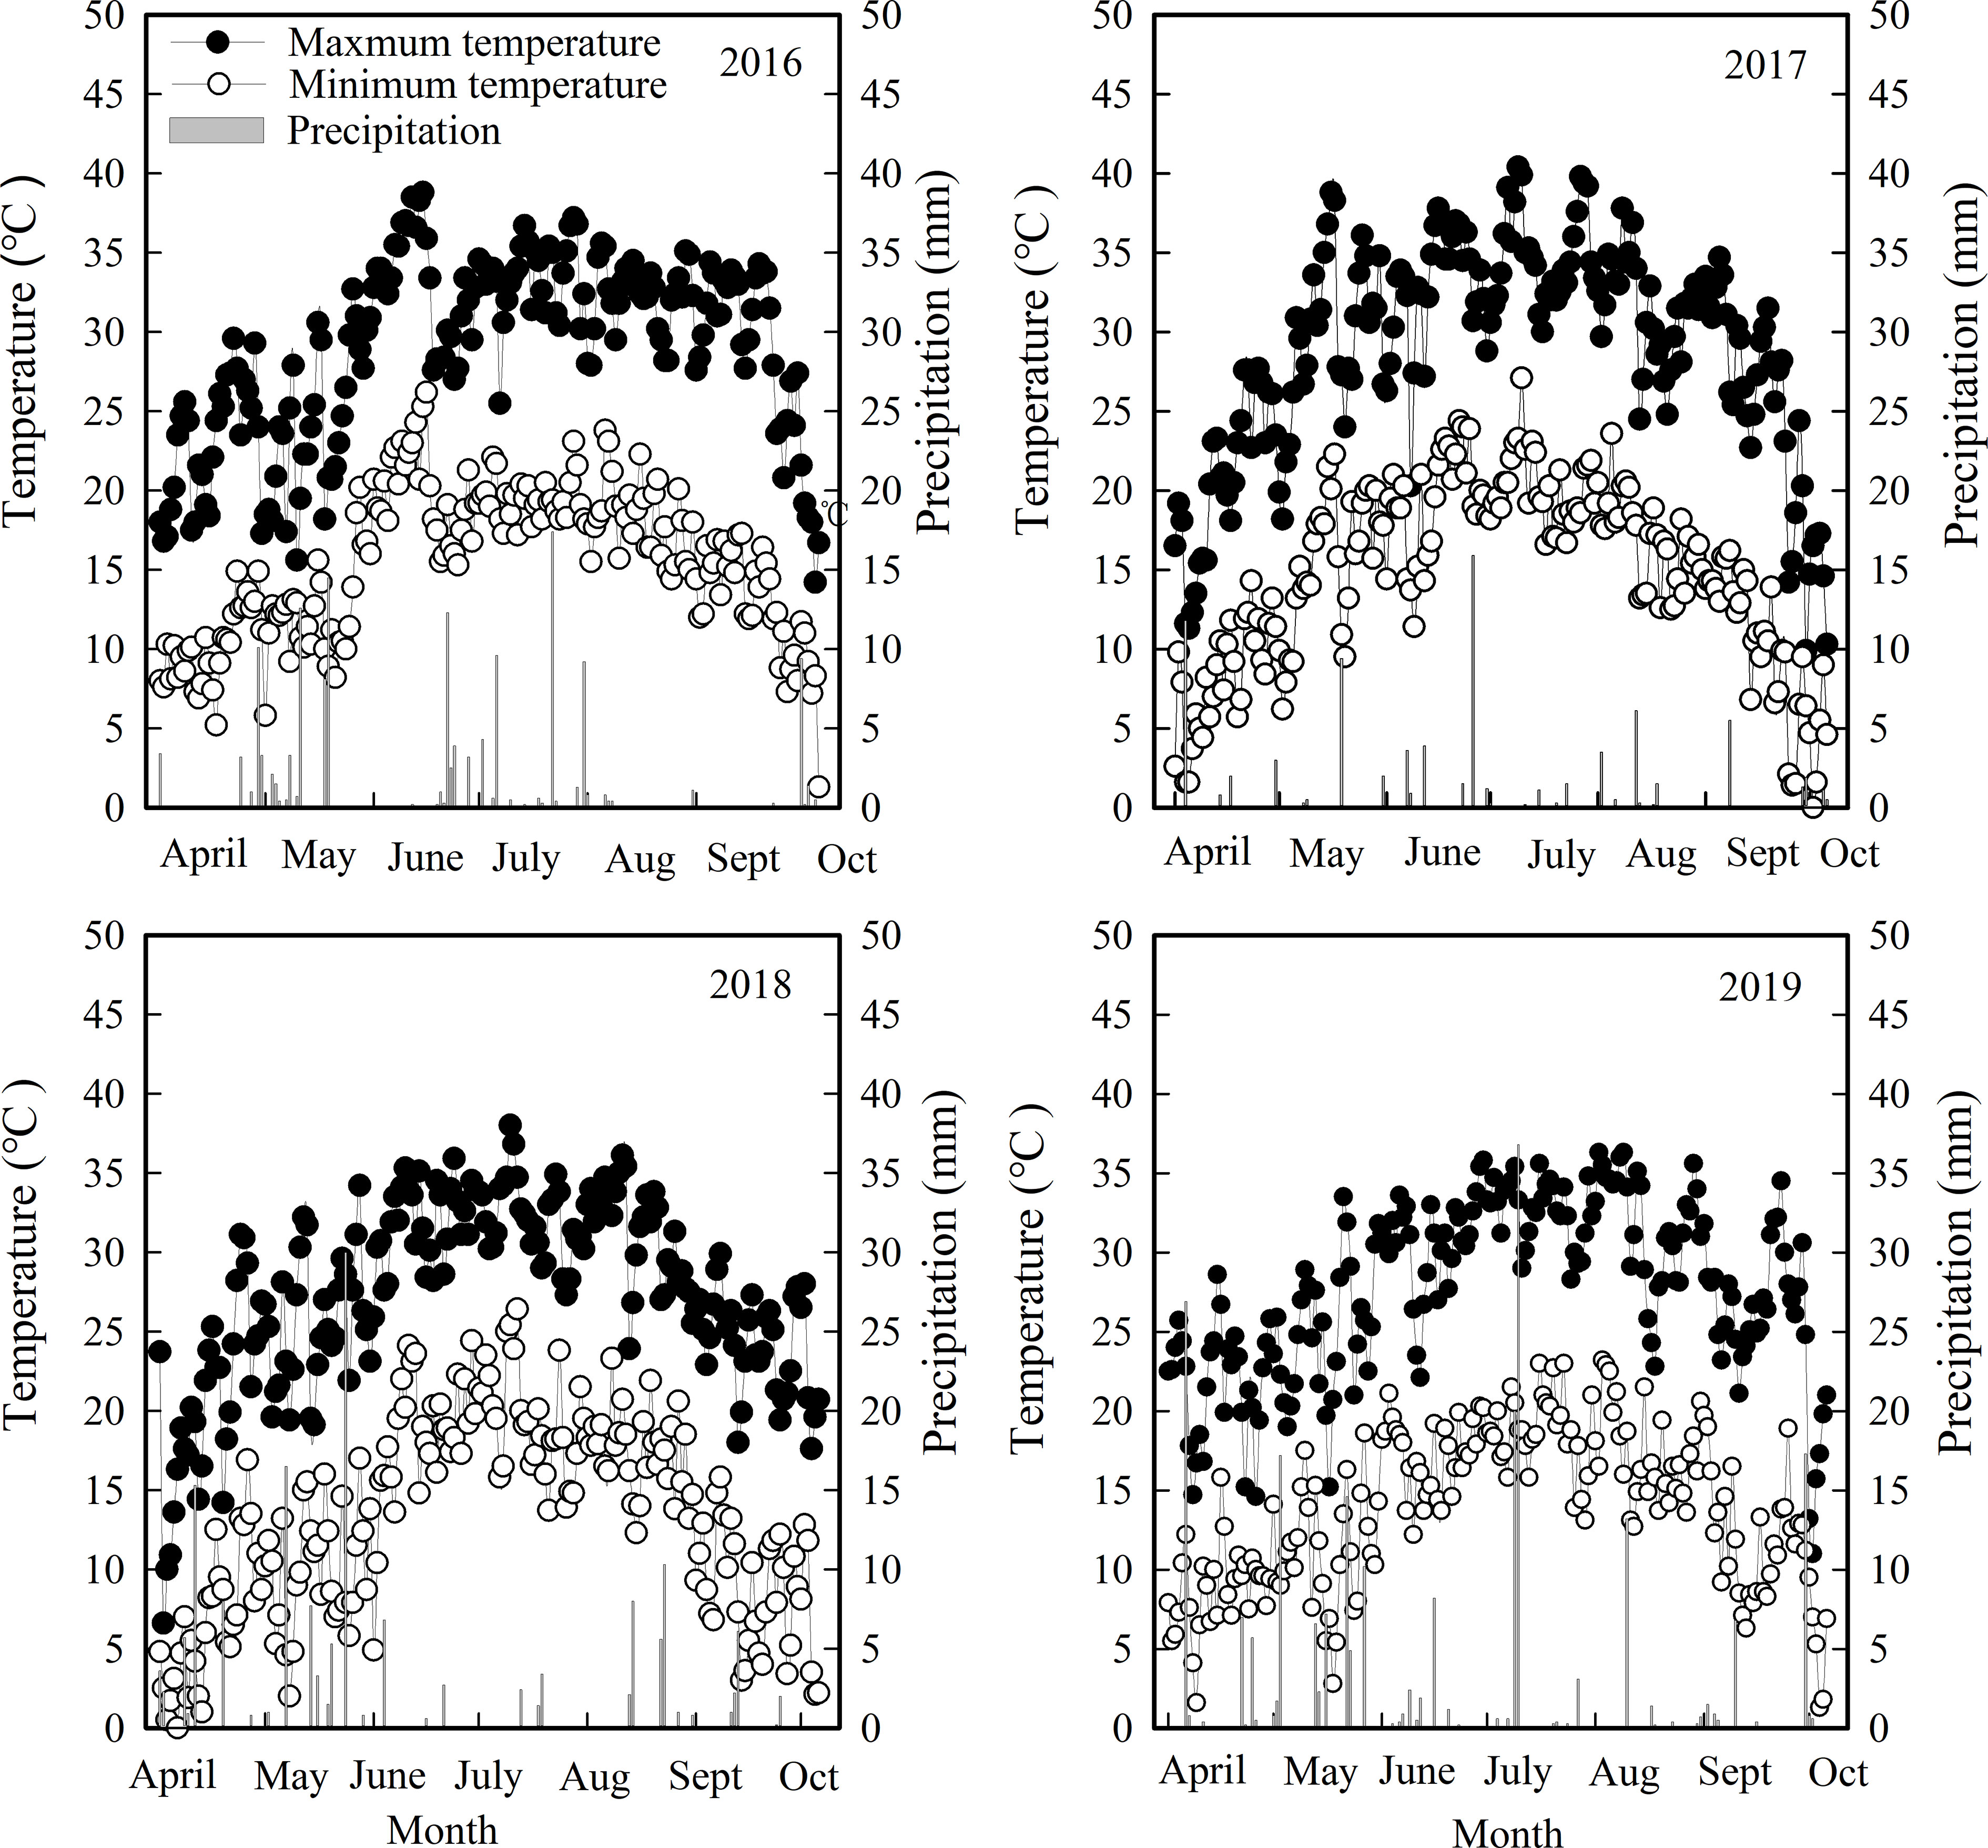
Figure 1 Daily maximum temperature, minimum temperature, and rainfall from planting until harvest (April to October) in 2016, 2017, 2018, and 2019.
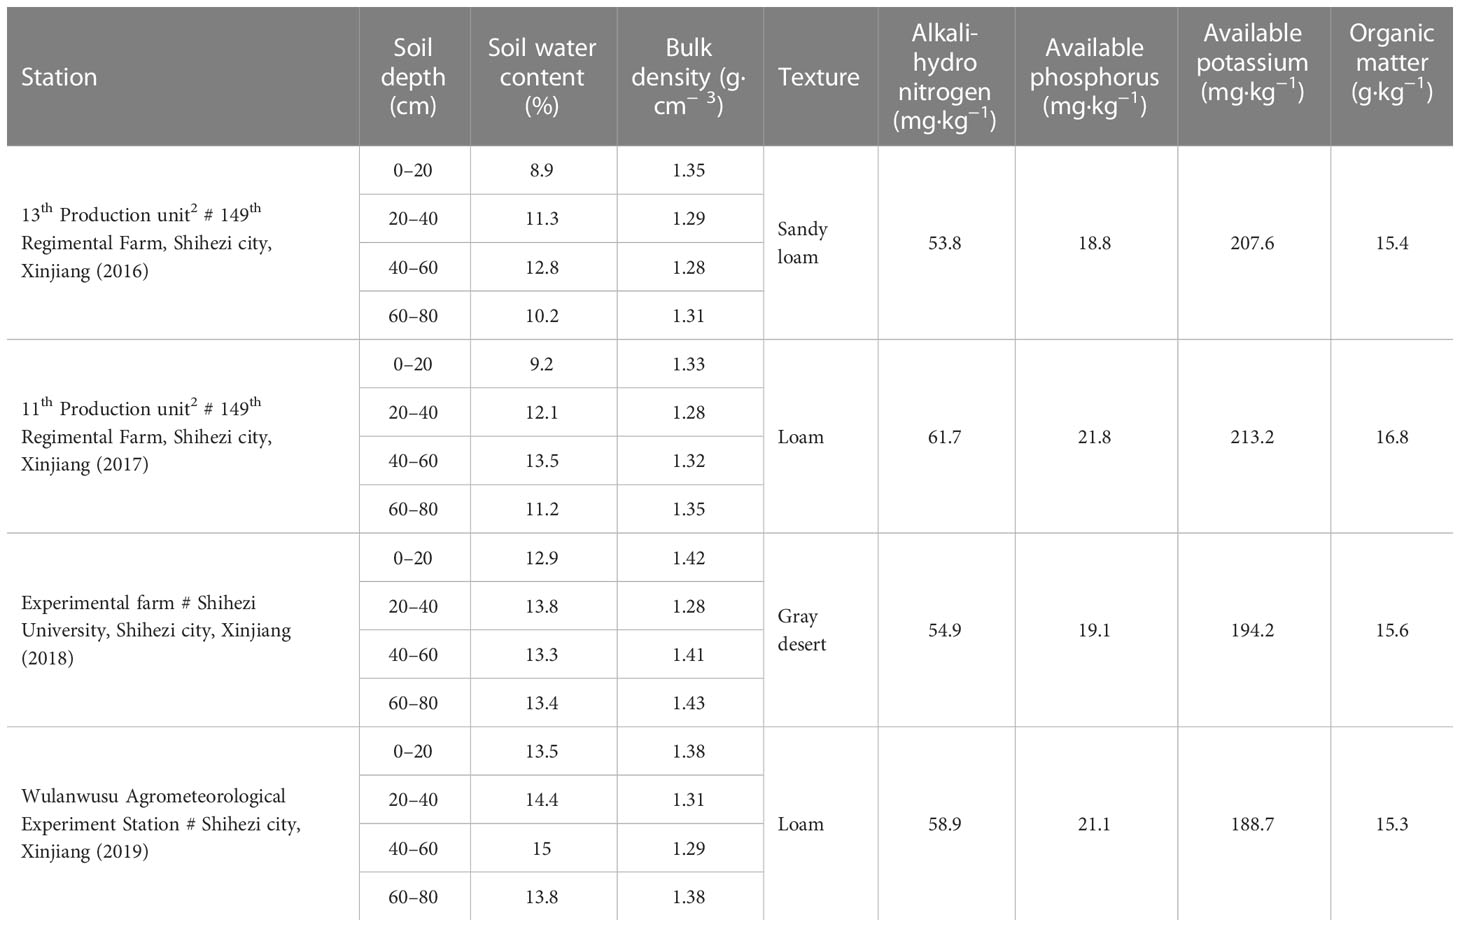
Table 1 Soil texture and soil water content before sowing at different test sites used for evaluating the optimal planting pattern of cotton (Gossypium hirsutum) regulated by water amount under mulch drip irrigation in Xinjiang, China.
The experiment (two irrigation amount and four row spacing configurations) was arranged in a randomized complete block design with four replicates. Two irrigation amounts were applied to the main plots: the local conventional irrigation amount (CI) ranging from 510 to 600 mm adopting one film with three drip tapes, and limited irrigation (LI) adopting one film with two drip tapes (70% of the CI amount). This design was selected because large–scale drip irrigation cotton fields in Xinjiang adopt a rotation irrigation system, and the arrangement of one film with three-tapes as irrigation method has a greater water output per unit time, saving irrigation time and shortening the rotation cycle. The four row spacing configurations combined with planting density and row spacing were as follows: RS66 + 10H (66 + 10 cm row spacing with 26 plants m−2; high density), RS76H (76 cm row spacing with 26 plants m−2; high density), RS76L (76 cm row spacing with 13 plants m−2; low density), and RS66 + 10L (66 + 10 cm row spacing with 13 plants m−2; low density). Each subplot consisted of 12 (66 + 10 cm row spacing configuration) or 6 (76 cm row spacing configuration) ×10 m cotton plant rows with two 2.28 m – wide sheets of transparent plastic film (Figure 2). The diameter of the labyrinth drip irrigation tape was 12.5 mm; dripper flow rate was 2.2 m3 h−1, and dripper spacing was 20 cm.
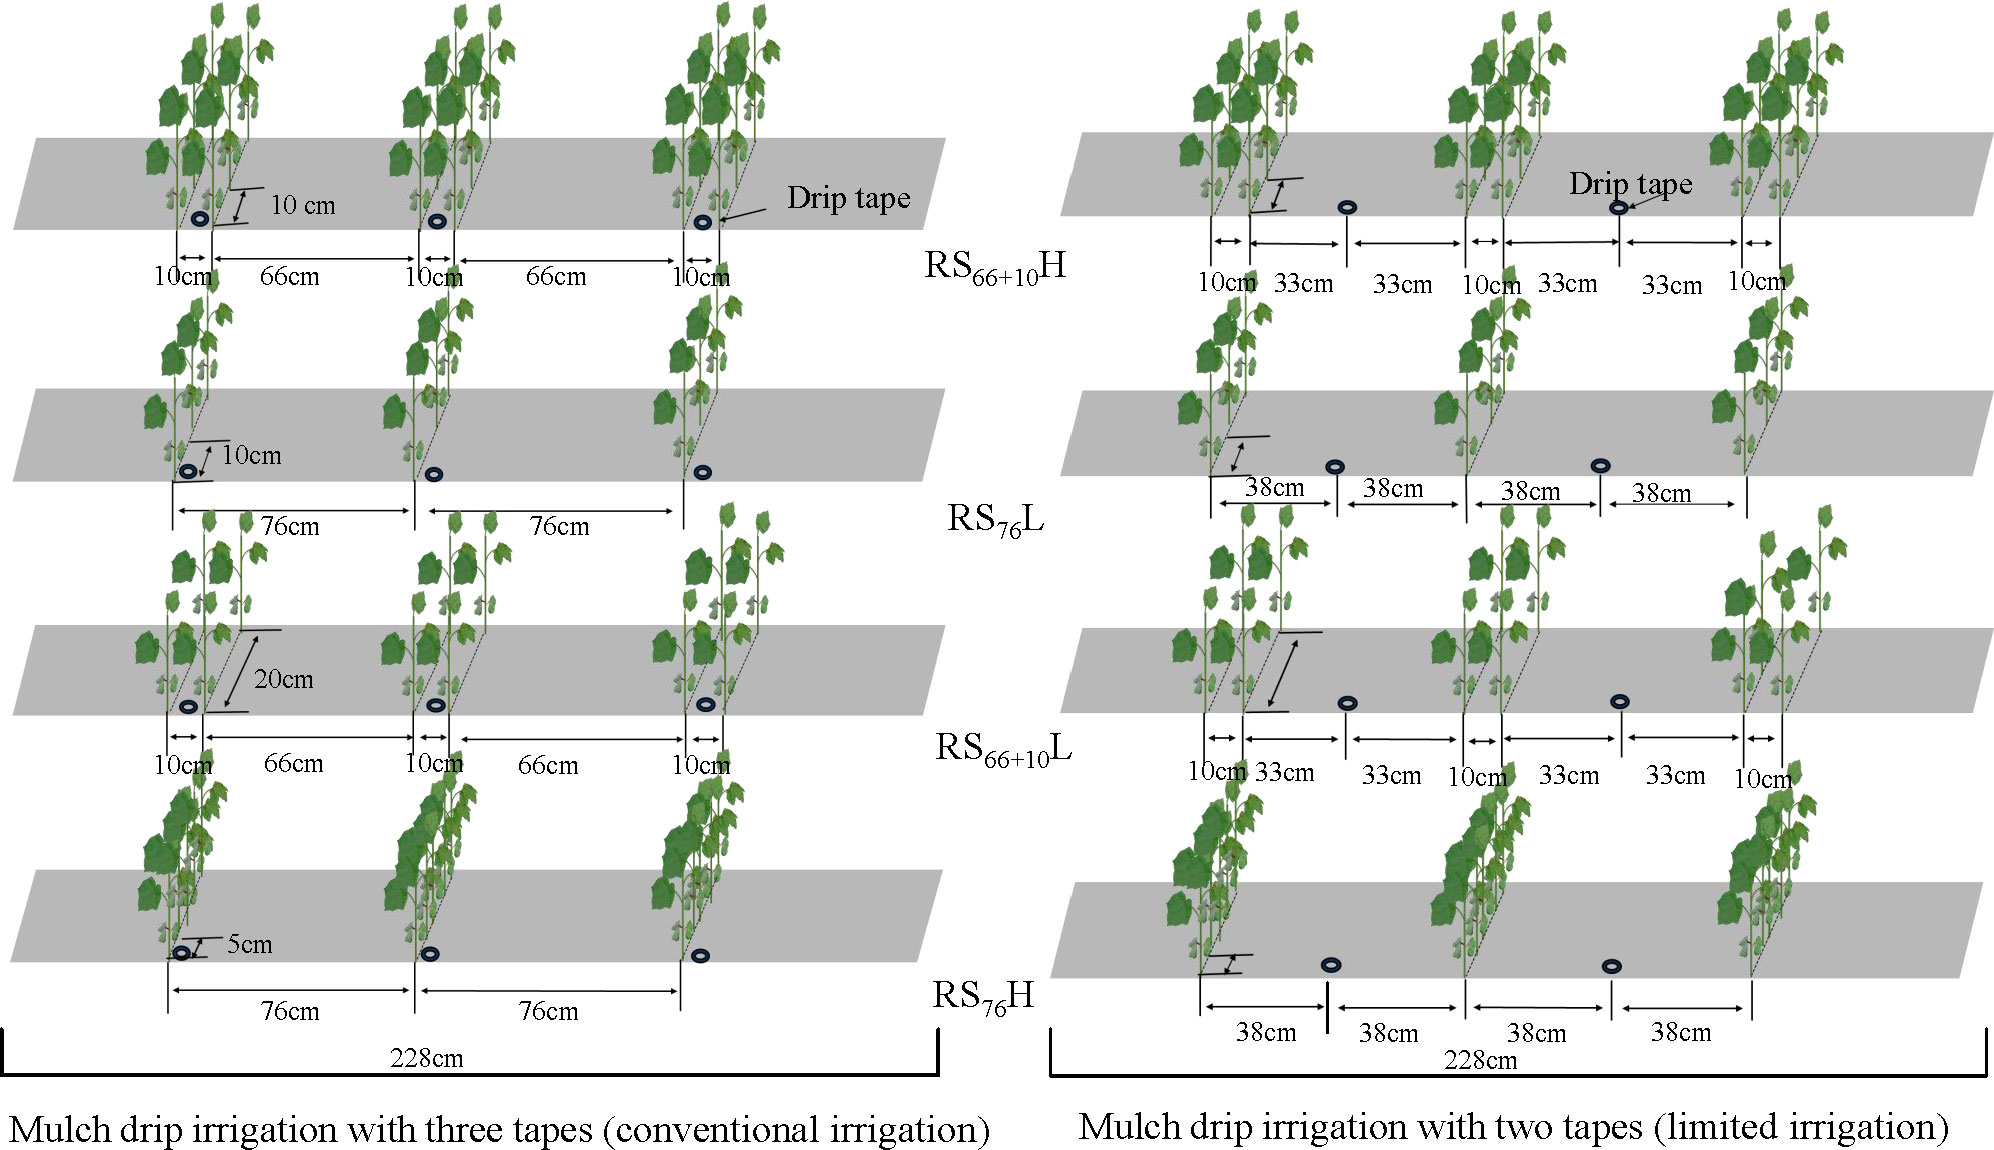
Figure 2 Schematic of four different planting densities of cotton (Gossypium hirsutum) evaluated during this study on cotton cultivation in Xinjiang, China. Where RS66+10H has 66+10 cm row spacing with 26 plants m-2 (high density), RS76H, where 76 cm row spacing with 26 plants m-2 (high density), RS76L has 76 cm row spacing with 13 plants m-2 (low density), and RS66+10L (66+10 cm row spacing with 13 plants m-2 (low density).
The test sites were set up in the fields of local farmers, and each treatment consisting of one film with two tapes had a fertilizer amount consistent with that of the treatment consisting of one film with three tapes by adding fertilization tanks. Except for uniform seedling watering, all other irrigation periods were applied following a rotational irrigation system. Drip irrigation was applied 8–10 times during the growth period (Table 2).
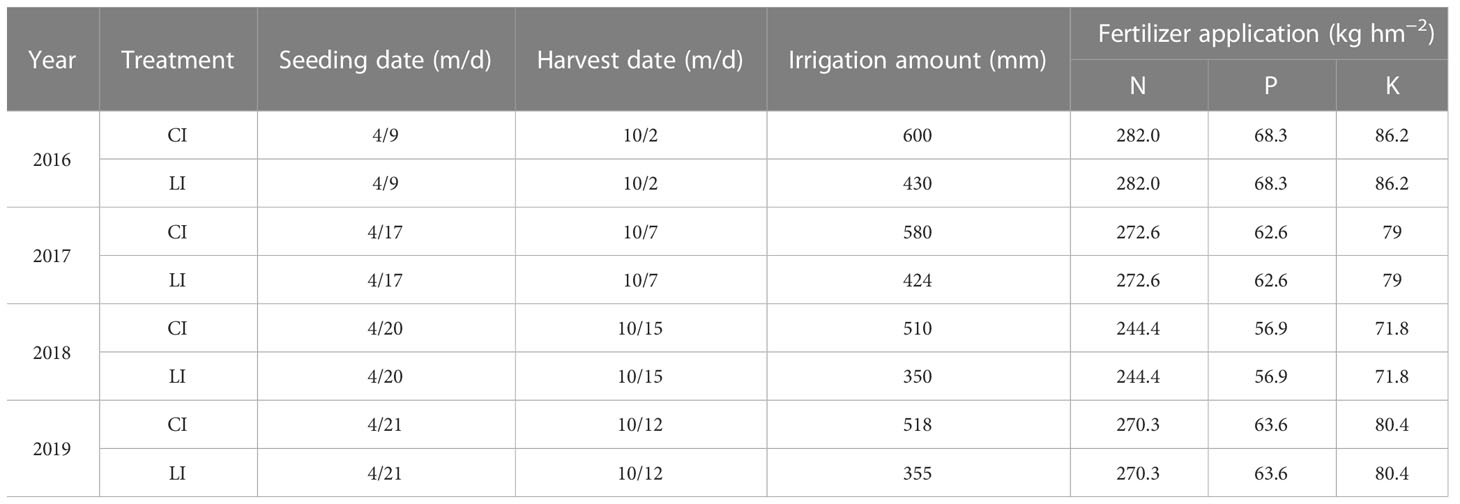
Table 2 Sowing date, harvest period, total irrigation amount, and fertilization amount for different drip tape configurations in 2016, 2017, 2018, and 2019.
Soil sample were excavated at 20 cm intervals (up to 80 cm deep soil profiles) by using a soil corer for the soil water content (SWC) measurement (n = 3) in each experimental plot. The measurements were executed with a horizontal distance of 0, 19, and 38 cm from the cotton row at 1 d before sowing, 1 d before irrigation, 2 d after irrigation, and maturity. The samples were immediately weighed and then baked at 80°C in an oven to determine the soil moisture content (SMC). The specific calculation formula for the soil accumulation water consumption (SAWC, mm) for different soil layers as follows:
SWCi+1 and SWCi means the soil water storage of one day before next irrigation and two days after irrigation respectively, in an irrigation cycle. H (mm) means the thickness of the soil layer; P (g·cm–3) means the soil bulk density. M0 and M1means the wet weight of soil sample and the dried weight of soil sample, respectively.
The daily water consumption intensity (DWCI, mm d−1) was determined by using Eq. (3) according to Wang et al. (2021b), which was used to identify the water consumption in different stages of cotton growth as follows:
where ET is the phase water consumption (mm) during a given growth period, and ΔT is the duration (d) of a given growth period.
Total crop water consumption, namely the actual evapotranspiration (ETc, mm), was calculated during the growing season as follows:
where ETc is the crop evapotranspiration; where ETc (mm), R (mm), I (mm), F, and Q are the crop evapotranspiration, precipitation, irrigation amount, surface runoff, and capillary rise, respectively; ΔW is the change in SWC (mm). Q is the capillary rising to root zone, which is negligible due to the groundwater table of over 8 m at the experimental site. F could also be ignored at the experimental site.
The canopy apparent photosynthesis (CAP) and canopy apparent transpiration rates (CAT) were simultaneously measured using the assimilation chamber method (Reddy et al., 1995; Xie et al., 2010). The CO2 and H2O concentrations in the chamber were measured using a Li–840A Soil CO2 Flux System (LI–COR Inc., Lincoln, NE, USA). The measurements were made between 11:00 and 14:00 h on clear days immediately after determining PAR. The assimilation chamber (85 cm long × 75 cm wide × 125 cm high) was covered with acrylic film that transmitted more than 95% of the solar radiation. Two fans were installed inside the chamber to mix the air. Gas exchange rates in each plot were measured during at least three 60 s intervals. We began to record the values when the CO2 concentrations inside the chamber began to drop steadily. Measurements were repeated three times for each treatment. The CAP and CAT calculation formula is as follows:
where ΔC1 represents net photosynthetic assimilation CO2 concentration in a given time interval (s); ΔC2 represents net photosynthetic assimilation H2O concentration in a given time interval (s); V is the assimilation chamber volume (m3); Δm is the measured time interval; T is the air temperature (°C); and L is the land area of the measured cotton canopy population.
The leaf area index (LAI) was measured using the LAI–2200C canopy analyzer (Li–COR Inc., Lincoln, NE, USA) at 7–10 d intervals starting from early July, which referring to the method of Malone et al. (2002). Four to six readings were made in each plot. One measurement was made above the canopy, and then four measurements were made perpendicular to the cotton rows at the soil surface.
For individual plant measurements, cotton plants were randomly selected in each plot at the initial flowering stage, full flowering stage, boll stage, and boll opening stage. On each sample date, four plants at each plot were randomly selected to obtain an average value. Plants were divided into various organs including stems, leaves, buds, and bolls. These segments were subsequently placed in paper bags, dried at 80 °C in an oven until constant weight, and the dry weight was measured. Daily dry matter accumulation was calculated as follows:
where DMAi+1 is the dried matter accumulation taken in the next growth period (g·m−2·d−1), and ΔT is the interval time for selecting dry matter accumulation. Seed cotton was hand harvested at 3 × 2.28 m2 area (n=4) in each plot at maturity. All mature cotton bolls in the 2.28*3 area are collected before harvest to facilitate data veracity. Seed cotton yield (kg hm−2) was determined for each plot after sun–drying for fifteen days, and then weighed after ginning to obtain the lint yield (kg hm−2).
Random block analysis of variance (ANOVA) was used to assess the effects of irrigation amount and row spacing configurations on LAI, CAP, CAT, ETC, DDMA, DWCI and seed/lint yield. Duncan’s multiple range tests were used to separate the treatment means at P< 0.05. Correlation analysis was conducted among LAI and CAP, CAT, DWCI, ETC, seed yield; DDMA and seed yield. Figures were constructed using the “lme4” and “ggplot2” packages in R 4.0.5 software (R Core Team 2021) and Sigmaplot 12.0 (Aspire Software Intl., Ashburn, USA).
The irrigation amount and row spacing configuration significantly affected daily dry matter accumulation (DDMA), seed yield, ETC, and WUE of cotton (P< 0.05; Tables 3; 4). The DDMA under CI was 9.0–51.4% [before full flowering (BFF) – full flowering (FF)], 10.5–50.0% [FF – full boll stage (FB)] and 19.1–49.1% [FB –boll opening stage (BO)] greater than that of the same treatment under LI (P< 0.05). The seed yields, lint yields, and ETC under CI were 6.6–18.3%, 7.8–14.3% and 22.9–32.6% higher, respectively, but the WUE was 6.2–19.0% lower than that of the same treatment under LI. The seed and lint yields of RS66 + 10H were 3.7–6.0% and 4.6–6.9% higher than those of RS76L under LI, respectively, while there was no significant difference in WUE (P > 0.05). Notably, under CI, the seed and lint yields of RS76L were not different from those of RS66 + 10H (P > 0.05), but ETC was reduced by 51–60 mm and WUE was increased by 5.6–8.3% compared to RS66 + 10H
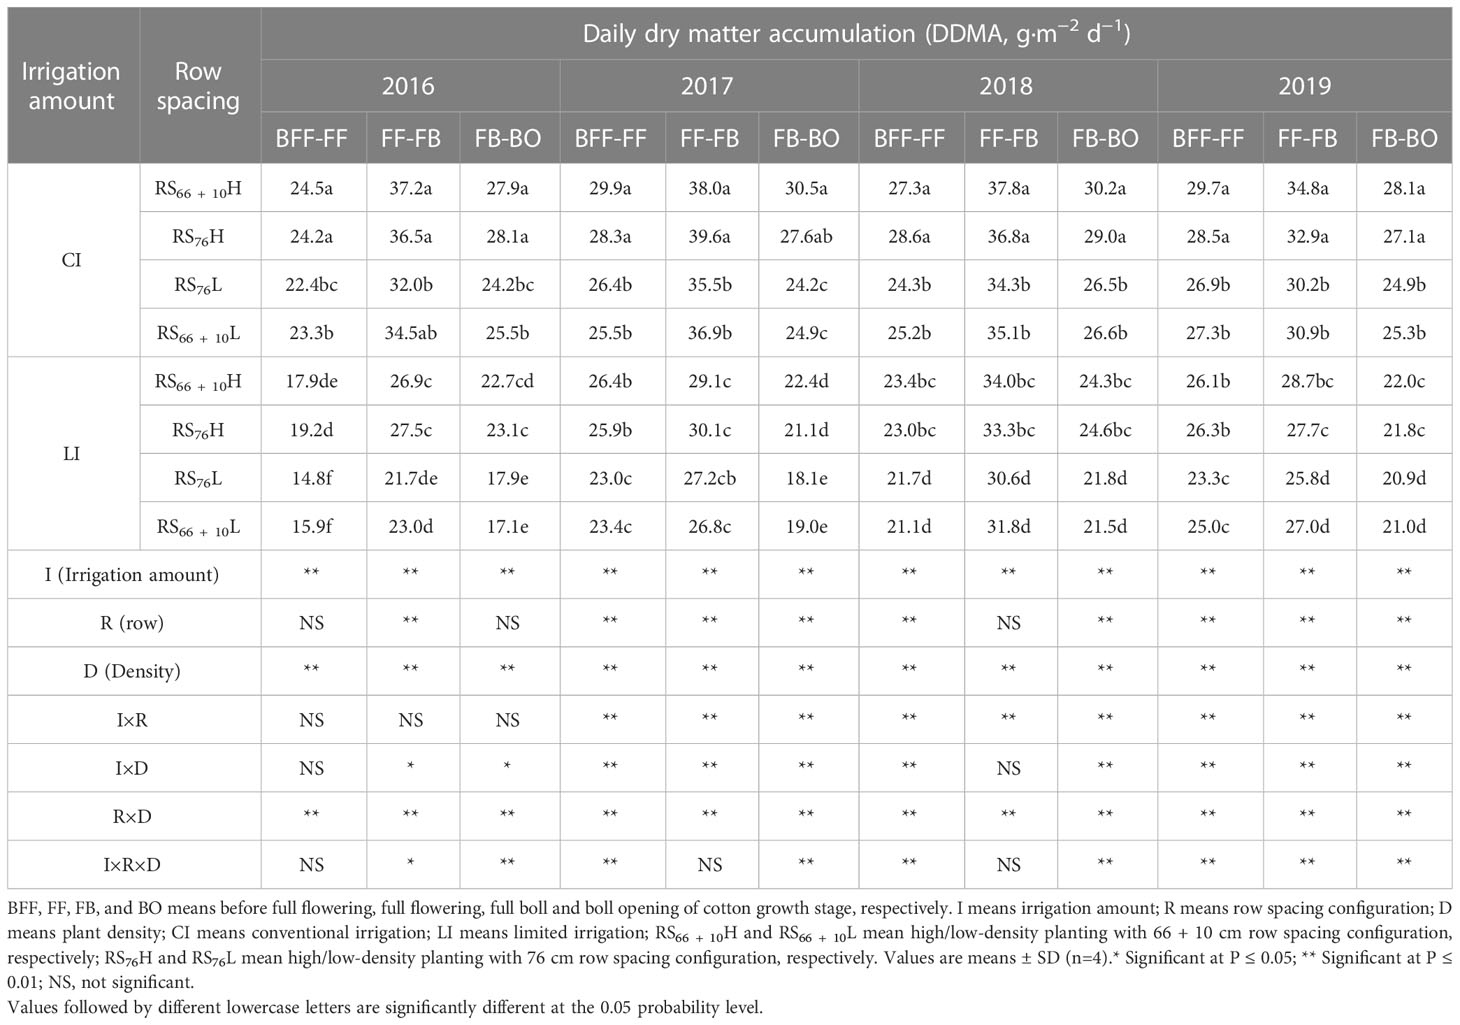
Table 3 Daily dry matter accumulation (DDMA) characteristics as affected by the combination of irrigation amount and row spacing configuration of cotton under mulch drip irrigation.
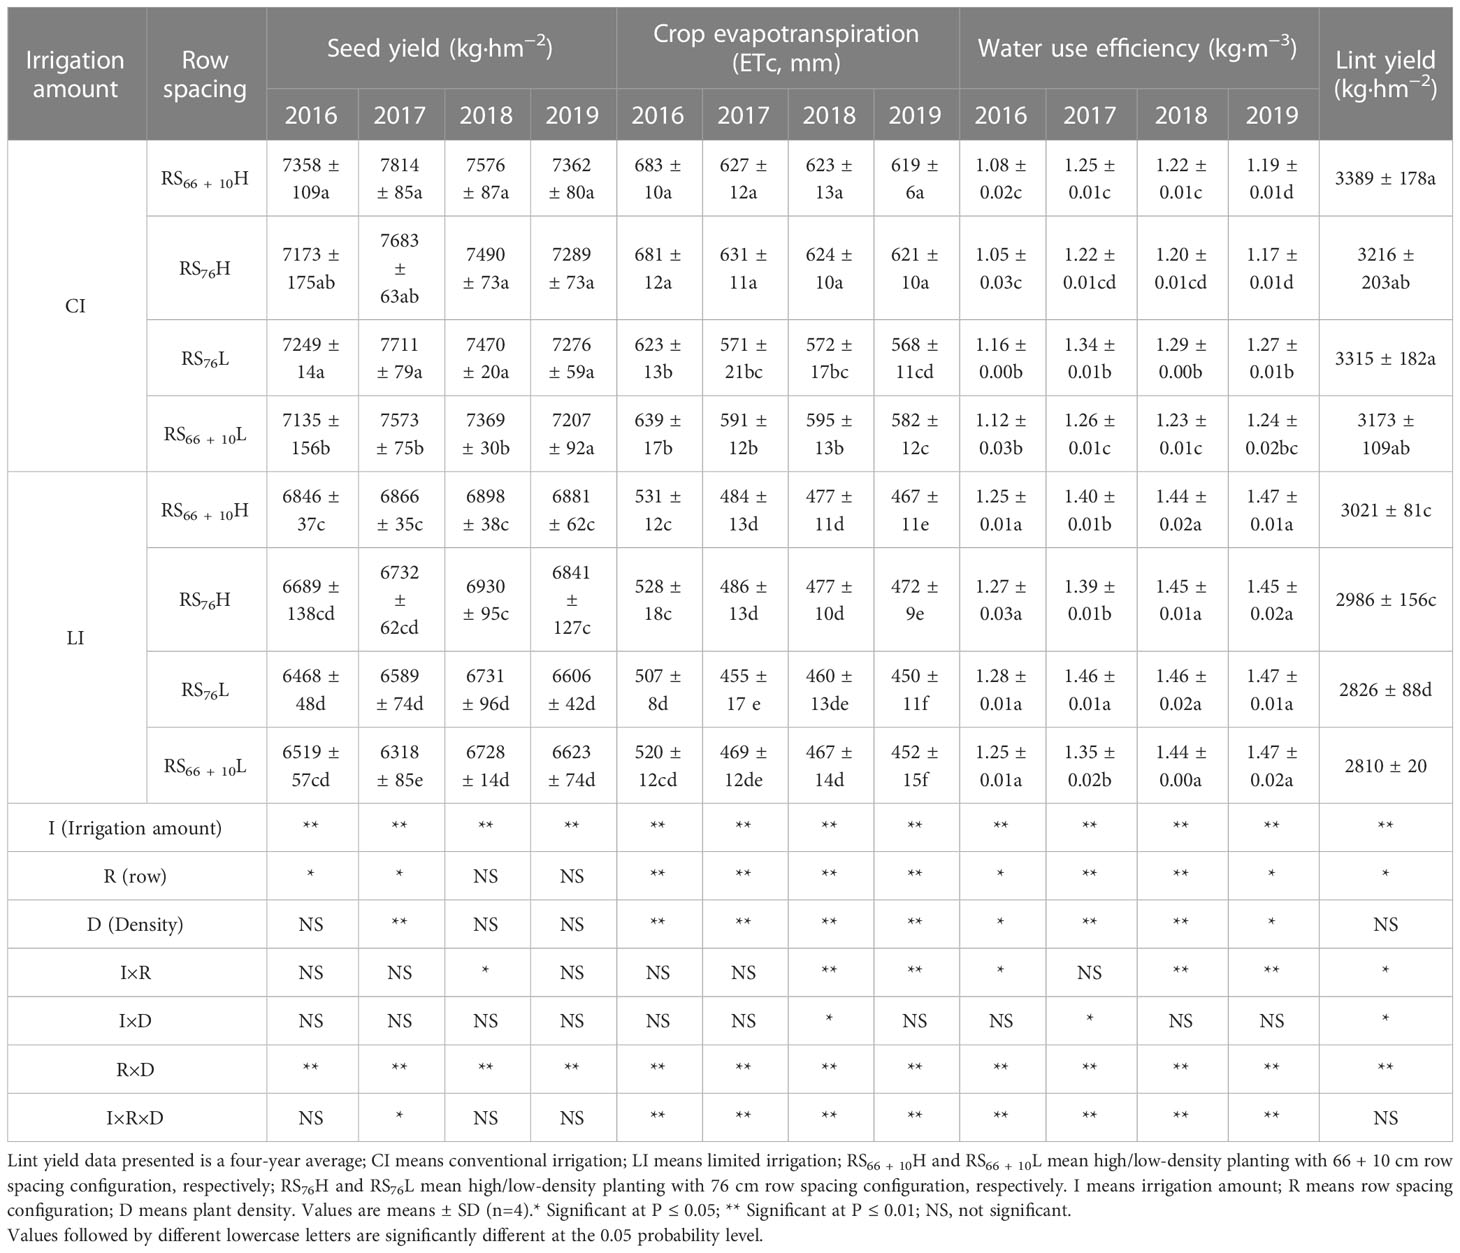
Table 4 Seed yield, lint yield, crop evapotranspiration, and water use sufficiency as affected by the combination of irrigation amount and row spacing configuration of cotton under mulch drip irrigation.
Under CI (Figure 3), the drip tapes were placed close to the cotton rows, and the trend of SAWC variation in each soil layer at a horizontal distance of 0–38 cm from the cotton row was in the following order:0 cm > 19 cm> 38 cm. Under LI, the trend variation of SAWC in each soil layer at 0–38 cm horizontal distance from the cotton rows was19 cm > 0 cm > 38 cm because the drip tapes were placed in the middle of the wide rows. The SAWC of the 0 –60 cm soil layer within 0, 19, and 38 cm radius from the horizontal distance of cotton rows under CI increased by 40.7–45.4%, 15.2–18.1% and 27.5–32.7% when compared to the same row spacing configuration under LI (P< 0.05). The highest SAWC was found in each soil layer in RS66 + 10H under the same irrigation amount (no difference between RS66 + 10H and RS76H). Under LI, the SAWC of RS66 + 10H was 4.2–6.9% and 6.8–11.4% greater than that of RS76L in the 20 – 40 cm and 40 – 60 cm soils at 19 cm from the horizontal distance of the cotton rows, respectively, and 10.6–11.1% and 13.1–13.2% greater than RS76L in the 20–40 cm and 40–60 cm soil layers at 38 cm from the horizontal distance of the cotton rows, respectively. Under CI, the SAWC of RS76L was 9.8–12.4% and 10.8–15.7% lower than RS66 + 10H in the 20–40 cm and 40–60 cm soil layers at a horizontal distance of 19 cm from the cotton rows, respectively: 7.7–16.8% and 9.1%–14.8% lower than RS66 + 10H in the 20–40 cm and 40–60 cm soil layers at a horizontal distance of 38 cm from the cotton rows, respectively.
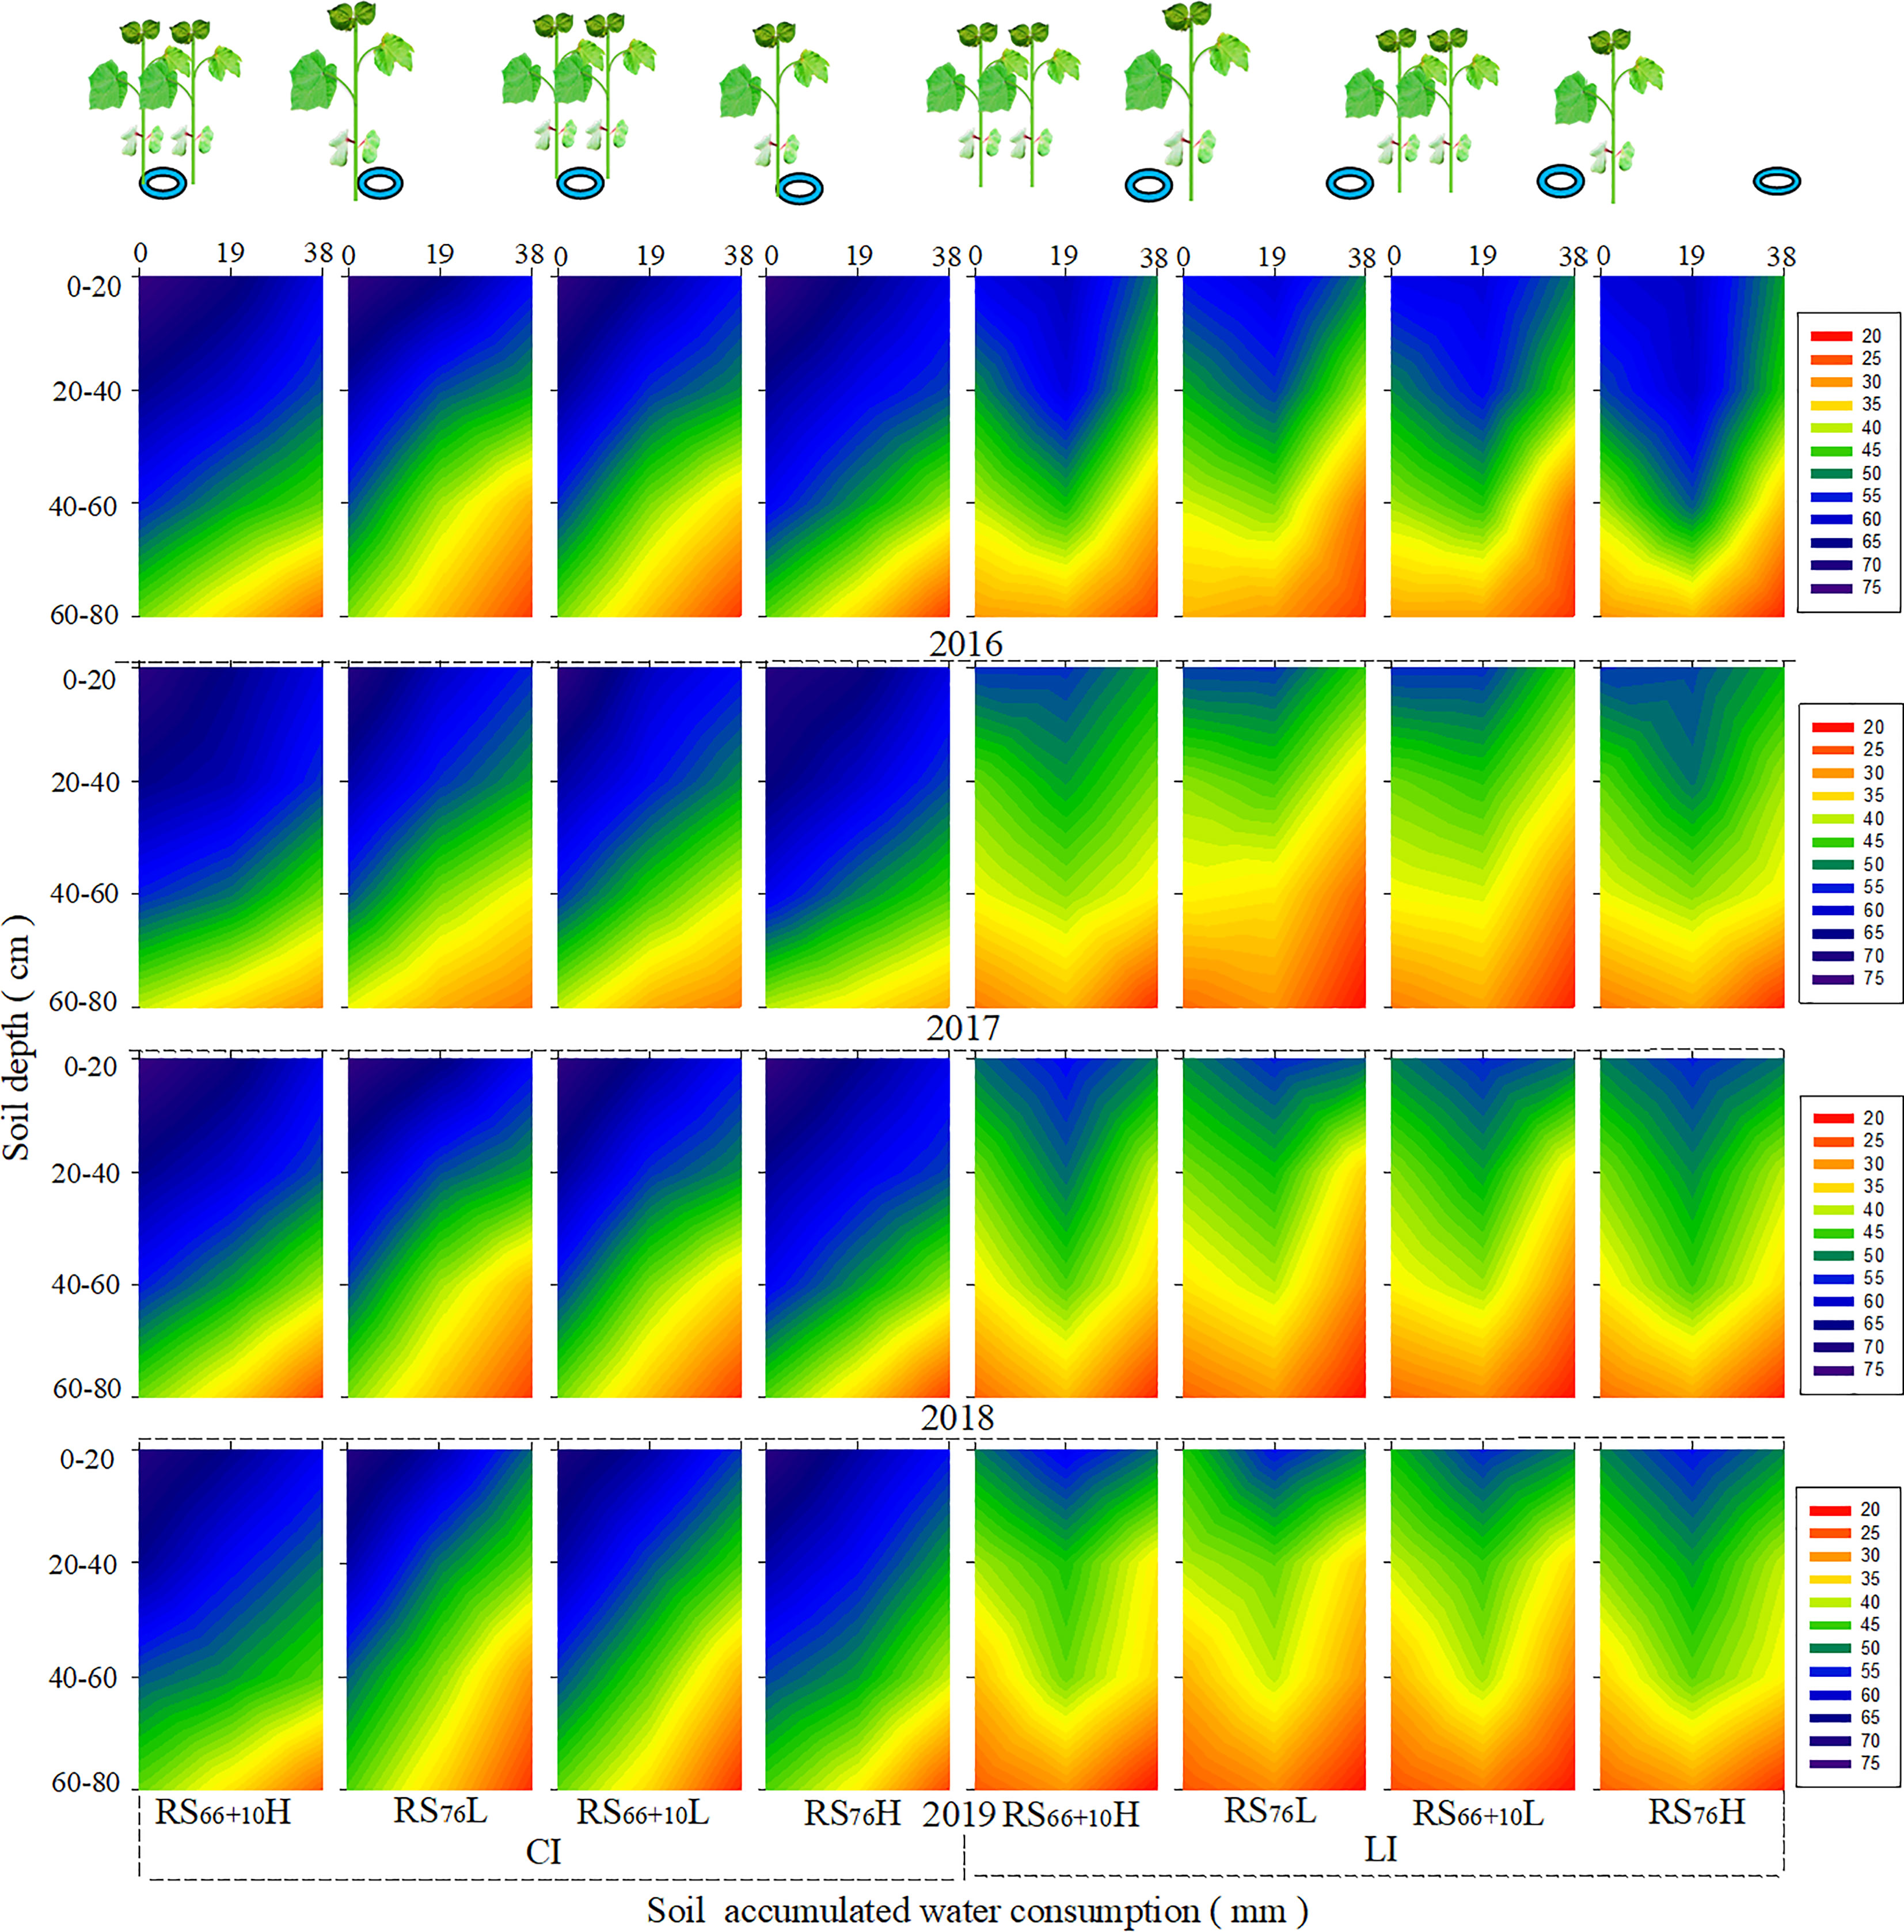
Figure 3 Soil accumulated water consumption (SAWC) in different soil layers under a combination of irrigation amount and row spacing configuration. The color changes from red to dark blue indicate a gradual increase in water consumption.
The DWCI of cotton was significantly affected by the irrigation amount and row spacing configuration (Table 5, P< 0.05). The DWCI under CI was 11.5–30.2% (FF), 6.1–50.1%(FB) and 56.0–106.1%(BO) higher than that of the same row spacing under LI. The DWCI of RS76L was significantly lower than that of RS66 + 10H and RS76H under the same irrigation level, especially the largest difference during BO, where RS76L was 6.5–20.5% and 3.1–12.6% lower than RS76H and RS66 + 10H, respectively.
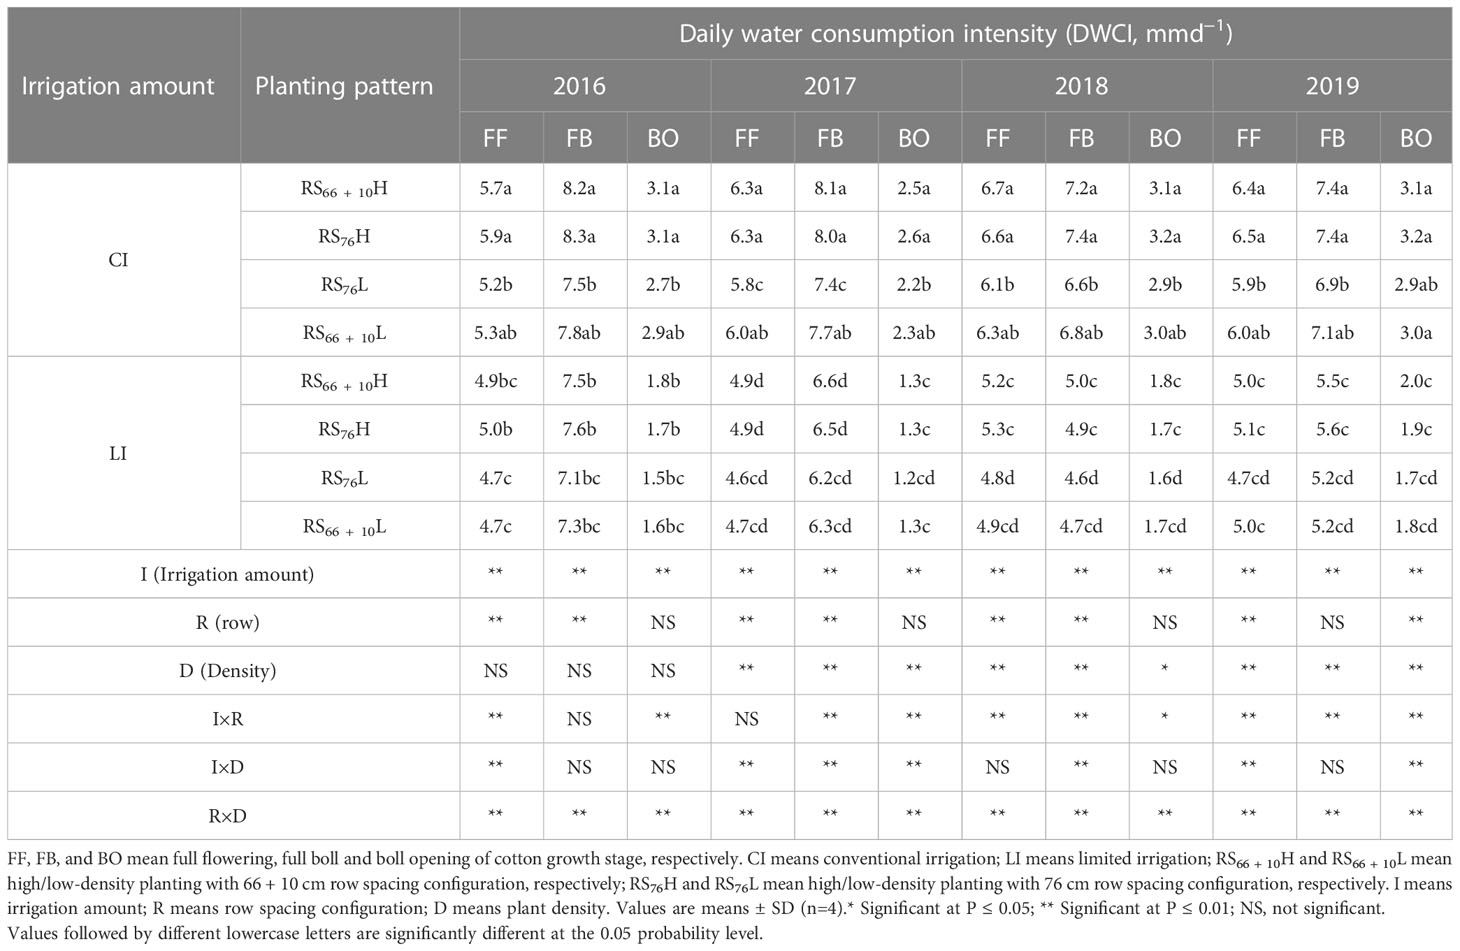
Table 5 Daily water consumption intensity as affected by the combination of irrigation amount and row spacing configuration of cotton under mulch drip irrigation.
The CAT of cotton under CI was significantly higher (P< 0.05; Figure 4) than that of cotton with the same row spacing configuration under LI, especially 11.9–33.9% higher in FB. RS76L had the lowest CAT activity in all fertility periods under the same irrigation amount. Under LI, the CAT of RS66 + 10H was 9.2–23.5% and 3.8–22.3% higher than that of RS76L. Under CI, The CAT of RS76L was 10.1–30.6% and 3.9–22.2% lower than that of RS66 + 10H and RS76H, respectively, throughout the critical reproductive period.
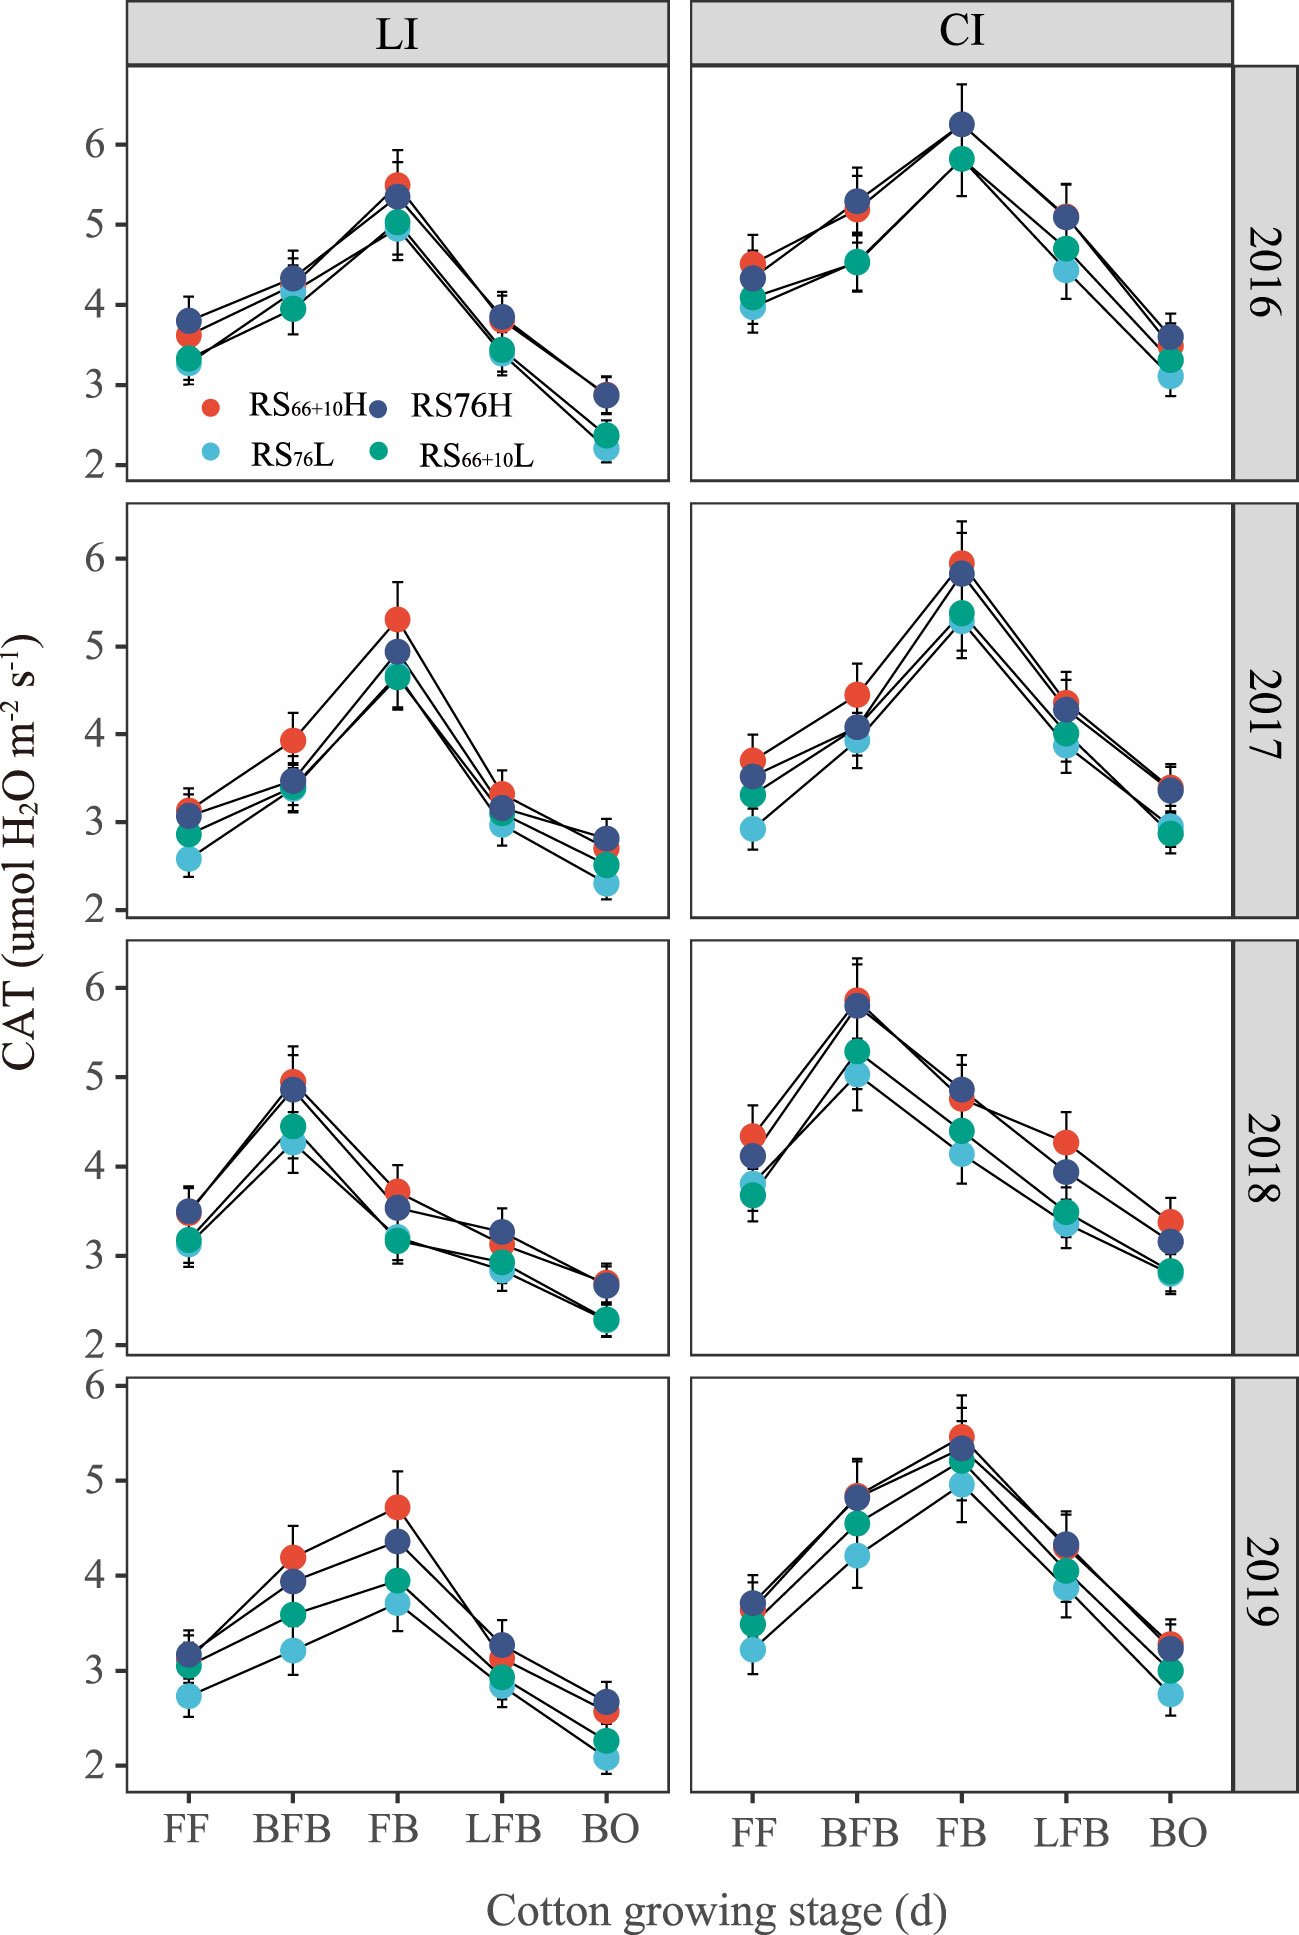
Figure 4 Canopy apparent transpiration rate (CAT) affected by the combination of irrigation amount and row spacing configuration. FF, BFB, FB, LFB and BO means full flowering, before full boll, full boll, later full boll and boll opening stage, respectively. Vertical bars represent the standard error. Mean values ± SE are from four replicates.
The irrigation amount was found to significantly affect cotton CAP (P< 0.05; Table 6). The CAP under CI was 5.2–16.7%(FF), 8.8–23.4%(FB), and 20.7–71.6% (BO) higher than that under LI. RS66 + 10H had the largest CAP from FF to BO under the same irrigation amount. Under LI, RS66 + 10H had 2.8–5.1% and 19.8–45.7% higher CAP than RS76L in FB and BO, respectively. However, the CAP of RS76L was not significantly different from that of RS66 + 10H under CI (P > 0.05).
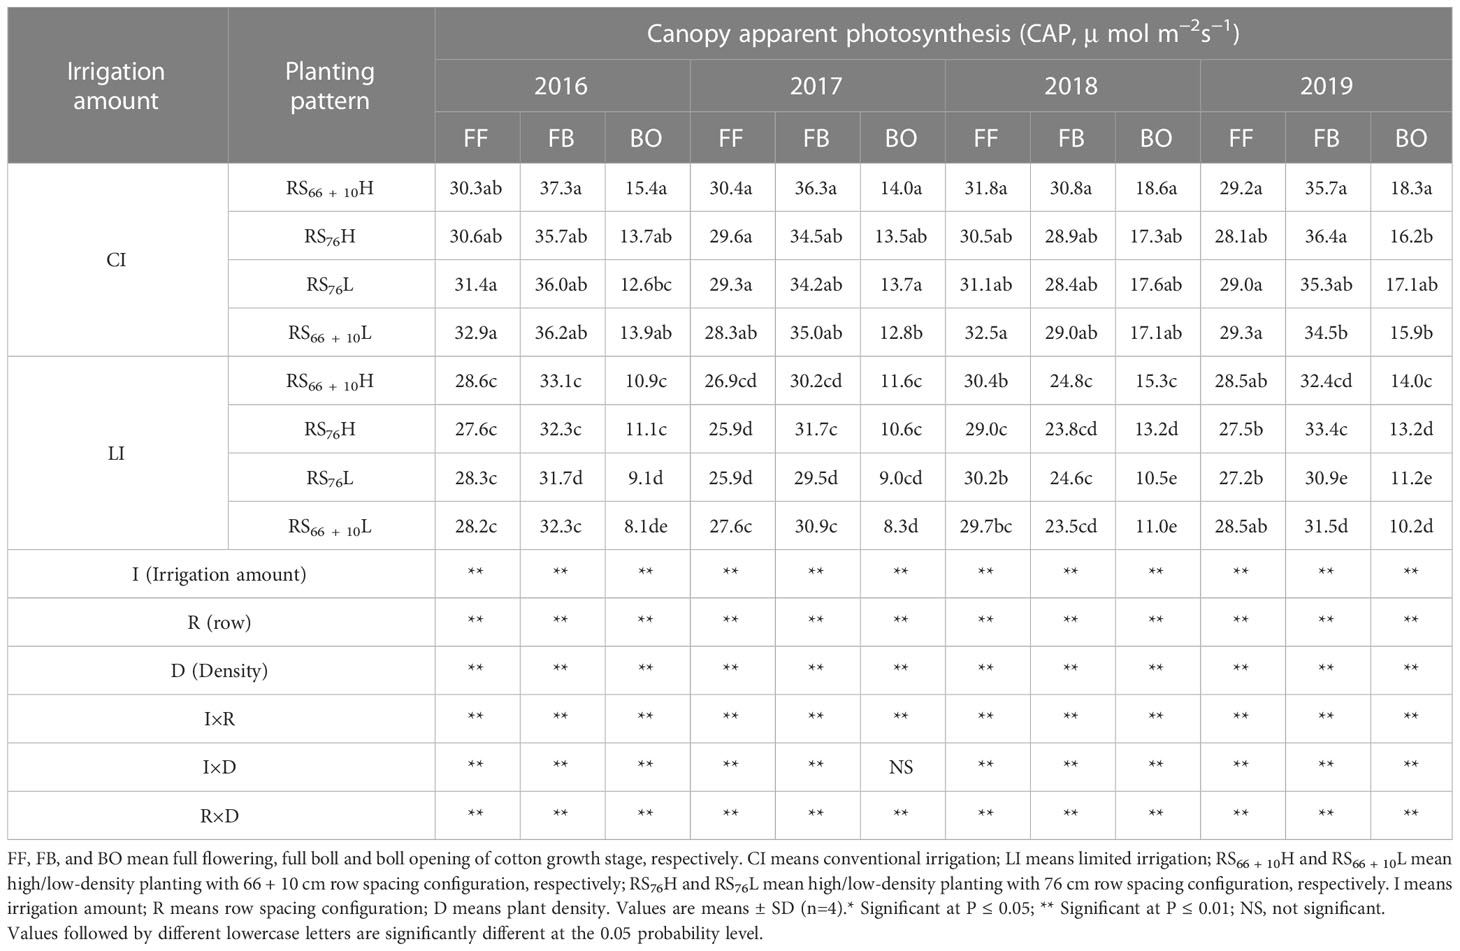
Table 6 Canopy apparent photosynthesis as affected by the combination of irrigation amount and row spacing configuration of cotton under mulch drip irrigation.
The LAI under CI was significantly greater than that under LI and was 9.5–22.2% greater at the FB (Figure 5). Under the same irrigation level, the trend variation of cotton LAI was RS66 + 10H, RS76H > RS66 + 10L > RS76L. The LAI of RS66 + 10H under LI was 5.1–25.8% and 7.8–32.3% higher than that of RS76L throughout the critical reproductive period. Under CI, RS76L was 6.0–17.1% and 7.3–16.8% lower than RS66 + 10H and RS76H, respectively, throughout the critical reproductive period from four replicates.
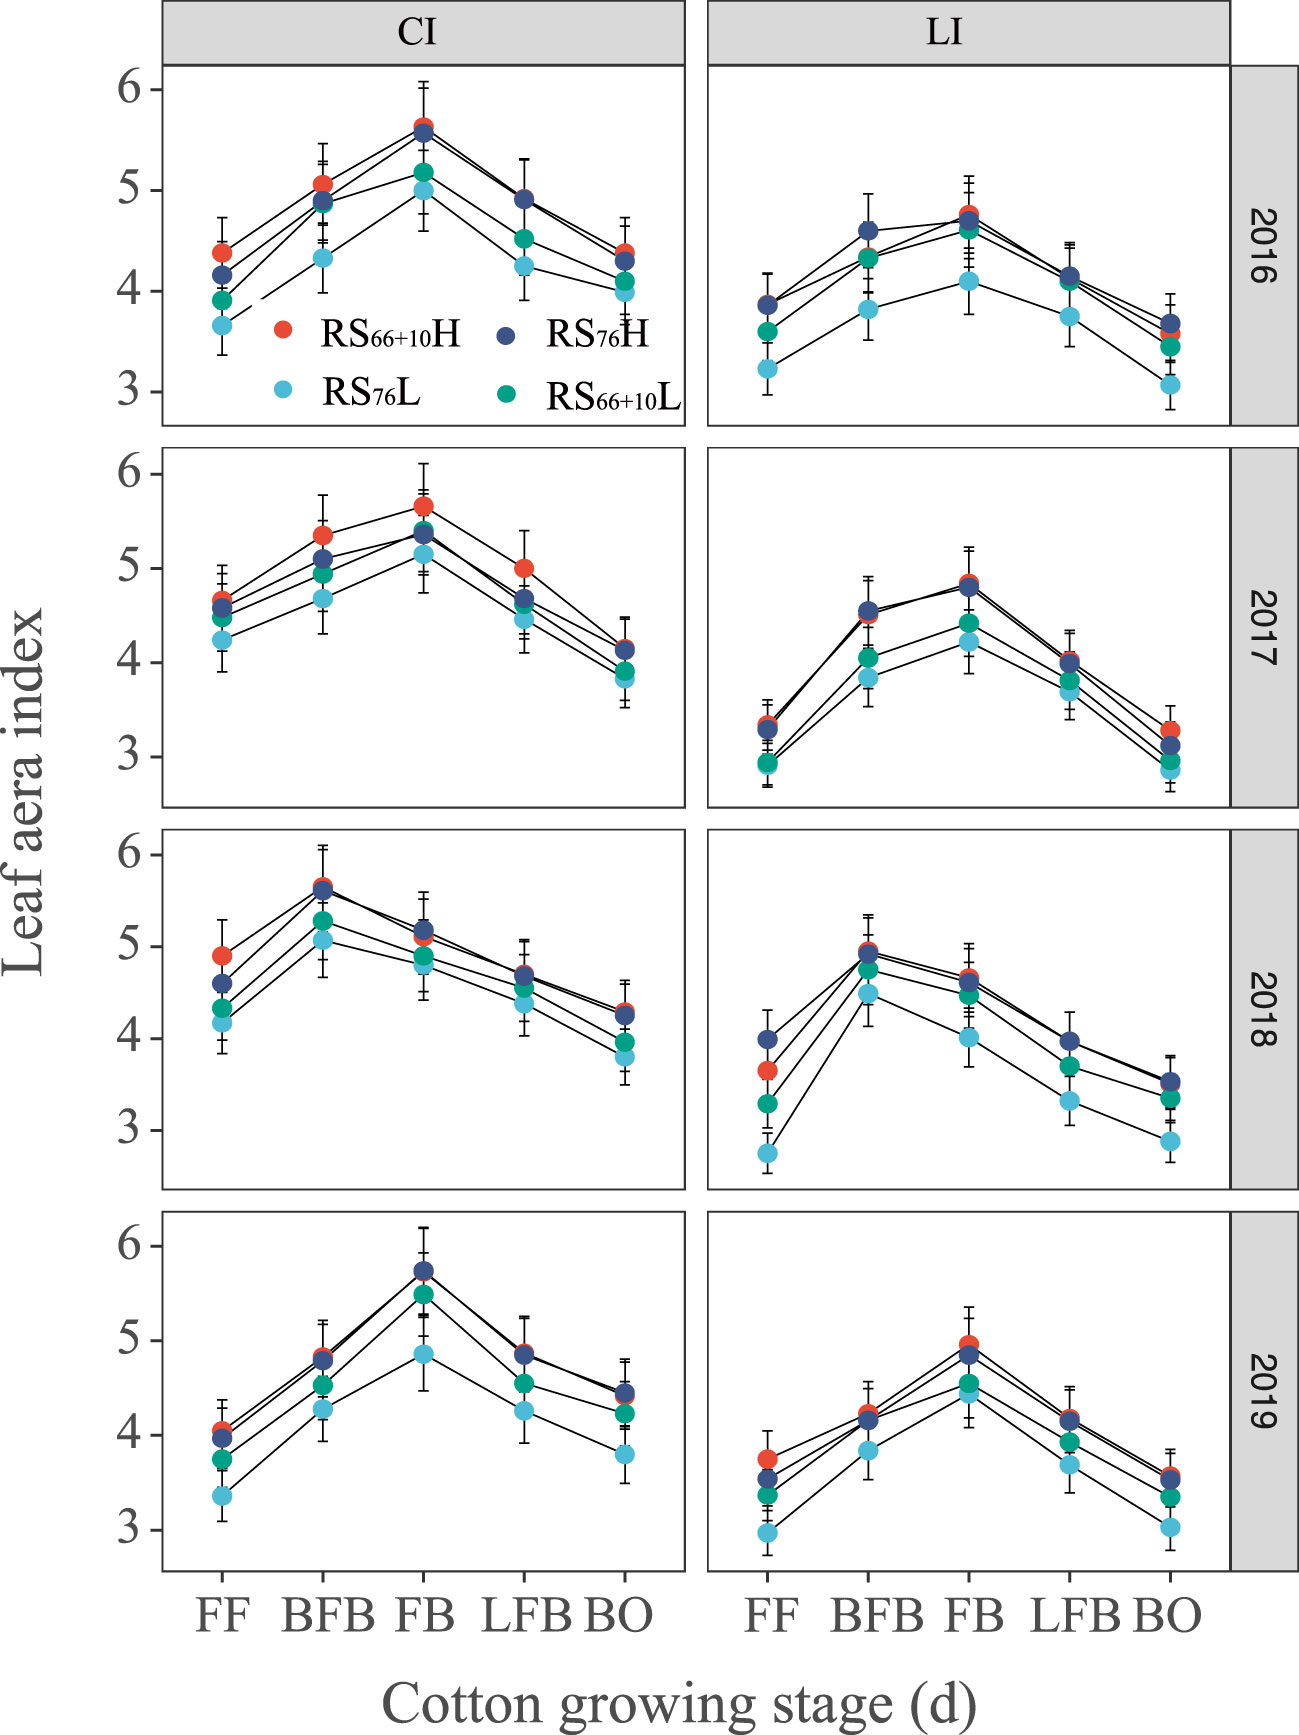
Figure 5 Leaf are index (LAI) of cotton in cotton (Gossypium hirsutum) affected by the combination of irrigation amount and row spacing configuration when evaluated in Xinjiang, China. FF, BFB, FB, LFB and BO means full flowering, before full boll, full boll, later full boll, and boll opening stage, respectively. Vertical bars represent the standard error. Mean values ± SE are from four replicates.
The relationship between LAImax and seed yield was fitted to a quadratic function (P< 0.01; Figure 6), and the maximum cotton seed yield (7366 kg hm–2) was obtained when LAImax was approximately 5.5. However, based on the correlation between LAI and CAP, after LAImax reached 5, further increases in LAI did not significantly increase CAP, which indicated that a higher LAI (peak >5) did not significantly increase cotton CAP and seed yields. There was a highly significant positive correlation between CAT, DWCI, ETc, and LAI (P< 0.01). This indicates that the LAI is a principal factor affecting cotton transpiration water consumption under mulch drip irrigation. Therefore, combine maintaining cotton high yields and water conservation, the optimal cotton LAImax range should be between 5.0 and 5.5 (Figures 6C, F).
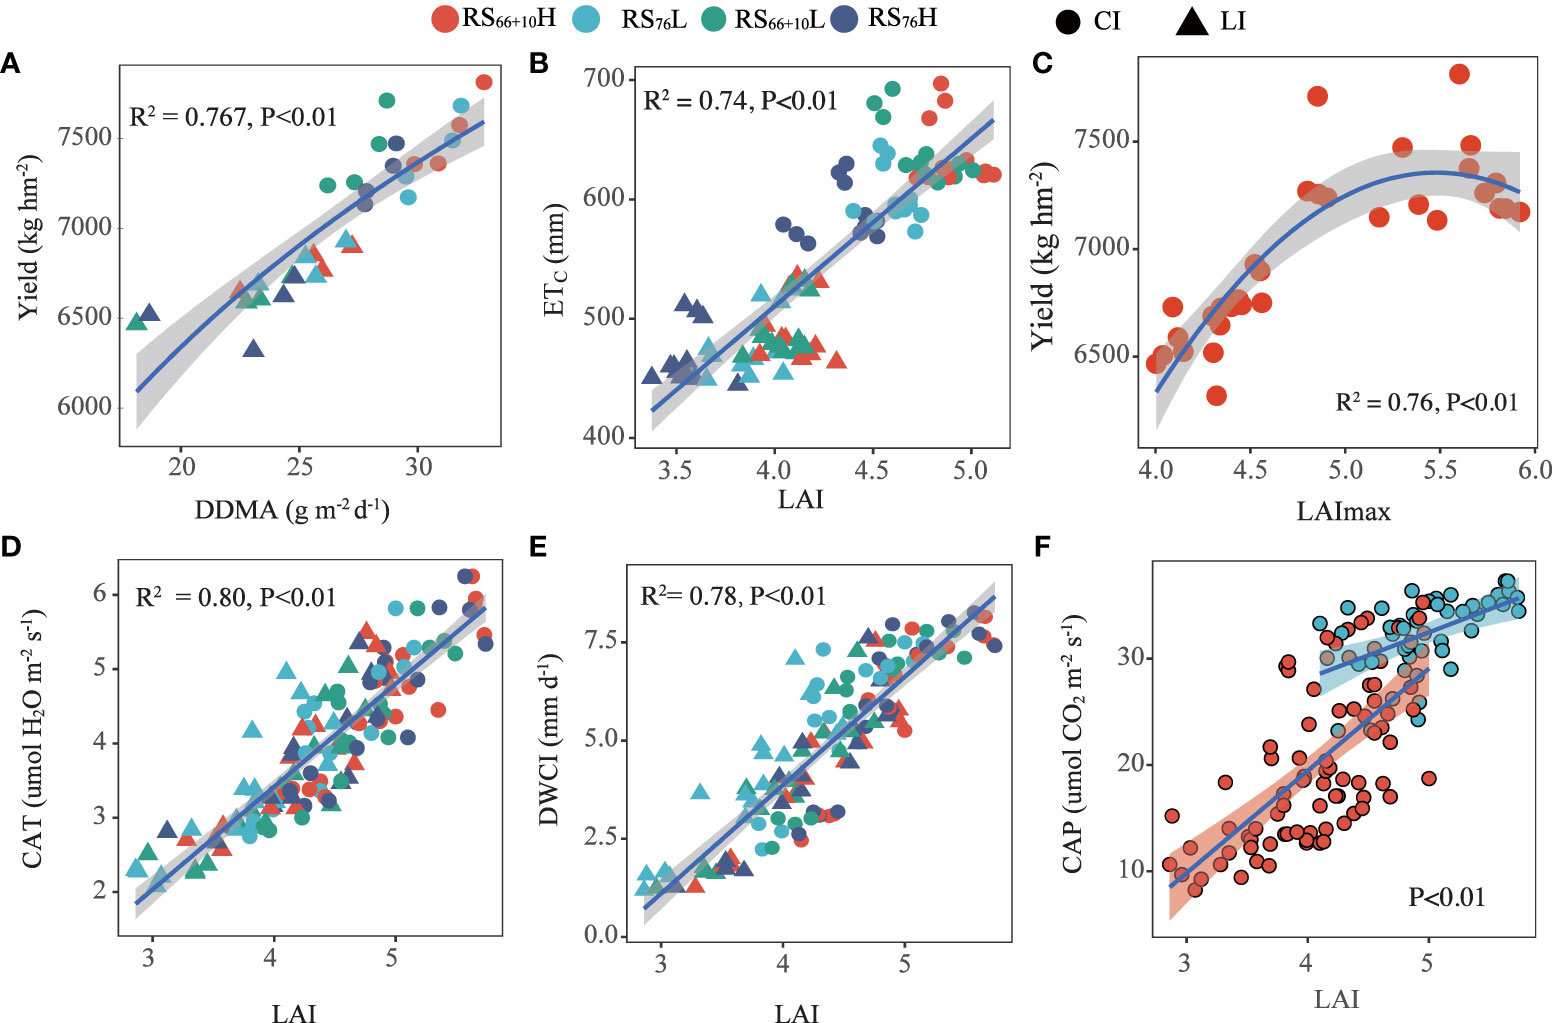
Figure 6 Correlation between leaf area index (LAI) and canopy apparent transpiration rate (CAT), daily water consumption intensity (DWCI), canopy apparent photosynthesis (CAP), crop evapotranspiration (ETC), and Yield, and the correlation between daily dry matter accumulation (DDMA) and Yield. DDMA (A), ETC (B) and LAI (E, F) were the mean values from full flowering to the boll opening stage; LAImax (C) is the maxmum LAI value in critical growth period. CAP (F), CAT (D), and DWCI (E) were the mean values of each growth period (full flowering stage, full boll stage, and boll opening stage) corresponding to LAI. CI (conventional irrigation); LI (limited irrigation); RS66+10H and RS66+10L (high/low-density planting with 66+10cm row spacing configuration); RS76H and RS76L (high/low-density planting with 76 cm row spacing configuration).
The first objective of this study was to evaluate the effect of irrigation amount and row spacing configuration on LAI, photosynthesis, dry matter accumulation rate, and yield. Adjusting the planting density and row spacing configuration is an important agronomic measure for achieving high and stable cotton yields (Zhang et al., 2004; Brodrick et al., 2010; Chen et al., 2019). An important condition for achieving high cotton yields in cotton production areas with short frost–free periods and limited light and heat resources is to achieve a high rate of dry matter accumulation per unit area. This study showed that cotton DDMA was higher under CI than under the same row spacing configuration with LI (Table 3), indicating that higher dry matter accumulation rates and higher yields were obtained under CI conditions during shorter reproductive periods (Figure 6A). A suitable LAI range is essential for the rapid growth of cotton dry matter accumulation (Srinivasan et al., 2017). Hu et al. (2021) concluded that a larger LAI caused canopy shading between leaves, resulting in lower CAP and lower cotton yield levels. This study showed a highly significant quadratic relationship between cotton LAImax and seed yield (Figure 6C). It had the highest yield when LAImax reached approximately 5.4 (Figure 5). Analysis of the relationship between LAI and CAP (Figure 6F) showed that CAP increased significantly when 0< LAImax< 5. However, when LAImax > 5, CAP did not increase significantly, which may be related to mutual shading between the groups. In combination with the CAP of treatments under CI, the cotton population maintained a relatively stable and high CAP when LAImax between 5.0 and 6.0. This may be attributed to the adoption of densely tolerant cotton varieties in Xinjiang and the optimization of canopy structure through chemical regulation to shape compact plants (Wang et al., 2021a; Shi et al., 2022). However, RS76L under CI reached the same yield level as RS66 + 10H, however its LAImax was between 5.0 and 5.5, which was significantly smaller than RS66 + 10H and RS76H. Combining LAImax, CAP, and cotton yield, the appropriate LAImax for achieving a high cotton yield in Xinjiang was between 5.0 and 5.5.
The cotton regions of the Yellow River Basin and Yangtze River Basin in China have a long cotton fertility period. The suitable planting density was 50000–60000 plants hm−2 and the largest cotton seed yield was 3700–4500 kg hm−2 in the Yellow River basin (Li et al., 2020); The optimum density was 19500–37500 plants hm−2 and the largest seed yield was 3800–4200 kg hm−2 in the Yangtze River basin (Lv et al., 2021). Based on the literature, our analysis of the relationship between cotton LAI and CAP in the Yangtze and Yellow River basins revealed a quadratic relationship (Figure S1) and the optimum LAImax was between 3.5 and 4.0. Therefore, in cotton areas with a short reproductive period, higher cotton population photosynthetic capacity and higher yield could be achieved by using a combination of adequate irrigation with appropriate low-density row spacing, or with high density to improve LAI under limited drip irrigation.
The second objective of the study was to integrate yield and soil water consumption to optimize the row spacing configuration under different irrigation conditions. The analysis showed that LAI was linearly and positively correlated with CAT, DWCI, and ETC (Figures 6D, E, B), and we concluded that LAI was a key factor affecting the soil evaporation and transpiration of cotton. The cotton yields under CI were significantly higher than those under LI, but the ETC increased by 22.9–32.6% under CI compared to those observed under LI, mainly because of the higher LAI. Therefore, CI is recommended to achieve higher yields in areas with sufficient water. Under CI, RS76L reduced CAT and DWCI because of lower LAI and overall reduced cotton ETC and significantly increased WUE (Table 4, P< 0.05) relative to RS66 + 10H and RS76H under adequate irrigation. Both CAT and DWCI were significantly lower in RS76L than in RS66 + 10H and RS76H under the same irrigation amount (Figure 4; Table 5).
Planting density is also an important factor affecting crop ETC, and related studies have shown that an increased planting density of maize significantly increases ETC (Guo et al., 2021). Deep soil water consumption is significantly elevated owing to the high planting density (Magaia et al., 2017; Meng et al., 2020). RS76L under CI significantly reduced SAWC in the 20–60 cm soil layer within a horizontal distance of 19–38 cm from the cotton row radius compared with RS66 + 10H and RS76H (Figure 3). High-density planting, such as RS66 + 10H, did not result in significant drought stress relative to RS76L under adequate irrigation. However, the ETC of RS76L under CI decreased by 51–60 mm, but the WUE increased by 5.6–8.3% compared to RS66 + 10H, which indicated that RS76L could further reduce irrigation to improve water use efficiency under CI. In conjunction with the development of machine harvesting cotton in China, RS76L under adequate irrigation is more conducive to cotton defoliation than RS66 + 10H and RS76H because of the larger row spacing and lower LAI in late reproduction (Li et al., 2016; Hu et al., 2021), which reduced cotton seed inclusion and improved cotton quality after mechanical harvesting. Moreover, RS76L saved seed cost and cotton labor topping cost compared to RS66 + 10H, owing to half of the seeding volume. In summary, the combination of low-density equal row spacing with CI could reduce soil water consumption in the 20–60 cm soil layer while maintaining high cotton yields and has the potential to further reduce irrigation. Therefore, RS76L under CI is also conducive to improving the machine–harvested quality of cotton and reducing management costs and is an optimum cotton planting pattern for mulch drip irrigation in arid areas.
Under LI, RS66 + 10H had the highest cotton yield, but the WUE did not differ from that of RS76L and RS66 + 10L (P > 0.05). High-density planting of cotton under LI can make full use of deep soil water by increasing root length and root surface area, inducing root growth in the deep and lateral soil layers, and promoting water uptake and transport for normal aboveground growth and development (Dong et al., 2010; Chen et al., 2018). Our results showed that RS66 + 10H significantly increased soil water consumption in the 20–60 cm soil layer at a horizontal distance of 19 –38 cm from the cotton row compared with RS76L under LI. Because of the use of mulch drip irrigation, soil water and roots are mainly distributed in the 0–60 cm soil layer range (Wang et al., 2014; Chen et al., 2022). The distribution of cotton roots under high-density planting coincided with the water supply in the 20–60 cm soil layer, which was fully utilized. Therefore, in cotton production areas where water resources are scarce, high-density planting can be used to tap the soil water production potential to achieve high and stable cotton yields.
This study proposed the most suitable planting pattern based on different irrigation conditions. This research showed that a maximum LAI (LAImax) maintained between 5.0 and 5.5 was most conducive to high yield and higher WUE. Under sufficient water, optimize low density row spacing configuration (RS76L) could reach the same yield level as high-density planting, whereas suitable LAImax reduced CAT, DWCI, and soil water consumption of 20-60 cm soil layers. Under water restriction condition, high-density planting (RS66 + 10H) could fully exploit the soil water potential of 20-60 cm soil layers to improve cotton yields. Our results suggest that in northern of Xinjiang’s moisture-rich areas, RS76L has the advantage of receiving high cotton yield while improving cotton benefits and further reducing the irrigation amount to improve WUE. However, moisture-limited areas are more suitable for high-density planting to increase yields.
The original contributions presented in the study are included in the article/Supplementary Material, further inquiries can be directed to the corresponding author.
WQZ, BW and YW conceptualized the study. WQZ, WFZ and JT involved in methodology. WQZ and BW involved in formal analysis and writing— original draft. WQZ, XJ and HD investigated the study. WQZ and SX involved in writing—review and editing. WFZ supervised the study. All authors contributed to the article and approved the submitted version.
This experimental work was supported by the National Key Research and Development Program of China (2020YFD1001001).
The authors declare that the research was conducted in the absence of any commercial or financial relationships that could be construed as a potential conflict of interest.
The reviewer ZW declared a shared affiliation with the authors WQZ, BW, YW, SX, JT, WFZ to the handling editor at the time of review.
All claims expressed in this article are solely those of the authors and do not necessarily represent those of their affiliated organizations, or those of the publisher, the editors and the reviewers. Any product that may be evaluated in this article, or claim that may be made by its manufacturer, is not guaranteed or endorsed by the publisher.
The Supplementary Material for this article can be found online at: https://www.frontiersin.org/articles/10.3389/fpls.2023.1158329/full#supplementary-material
Anwar, M. R., Wang, B., Li Liu, D., Waters, C. (2020). Late planting has great potential to mitigate the effects of future climate change on Australian rainfed cotton. Sci. Total Environ. 714, 136806.
Araus, J. L., Sanchez-Bragado, R., Vicente, R. (2021). Improving crop yield and resilience through optimization of photosynthesis: panacea or pipe dream? J. Exp. Bot. 72, 3936–3955.
Bilal, A., Ahmad, A., Rasul, F., Murtaza, G. (2019). Optimization of the sowing time for bt-cotton production in punjab, pakistan. Pak. J. Biol. Agric. Sci. 56, 95–100.
Brodrick, R., Bange, M. P., Milroy, S. P., Hammer, G. L. (2010). Yield and maturity of ultra-narrow row cotton in high input production systems. Agron. J. 102 (3), 843–848.
Chen, W., Chen, F., Lai, S., Jin, M., Xu, S., Liu, Y., et al. (2022). Spatial distribution and dynamics of cotton fine root under film-mulched drip irrigation. Ind. Crops Prod. 179, 114693.
Chen, Z., Niu, Y., Zhao, R., Han, C., Han, H., Luo, H. (2019). The combination of limited irrigation and high plant density optimizes canopy structure and improves the water use efficiency of cotton. Agric. Water Manage. 218, 139–148.
Chen, Z., Tao, X., Khan, A., Tan, D. K., Luo, H. (2018). Biomass accumulation, photo-synthetic traits and root development of cotton as affected by irrigation and nitrogen-fertilization. Front. Plant Sci. 9, 173–187.
Cui, Z., Zhang, H., Chen, X., Zhang, C., Ma, W., Huang, C., et al. (2018). Pursuing sustainable productivity with millions of smallholder farmers. Nature. 555, 363–366.
Dai, J., Dong, H. (2014). Intensive cotton farming technologies in China: achievements, challenges and countermeasures. Field Crops Res. 155, 99–110.
Di, N., Wang, Y., Clothier, B., Liu, Y., Jia, L., Xi, B., et al. (2019). Modeling soil evaporation and the response of the crop coefficient to leaf area index in mature populus tomentosa plantations growing under different soil water availabilities. Agric. For. Meteorol. 264, 125–137.
Dong, H., Kong, X., Luo, Z., Li, W., Xin, C. (2010). Unequal salt distribution in the root zone increases growth and yield of cotton. Eur. J. Agron. 33, 285–292.
Dong, H., Li, W., Tang, W., Li, Z., Zhang, D., Niu, Y. (2006). Yield, quality and leaf senescence of cotton grown at varying planting dates and plant densities in the yellow river valley of China. Field Crops Res. 98, 106–115.
Feng, L., Dai, J., Tian, L., Zhang, H., Li, W., Dong, H. (2017). Review of the technology for high-yielding and efficient cotton cultivation in northwest inland cotton-growing region of China. Field Crops Res. 208, 18–26.
Forouzani, M., Karami, E. (2011). Agricultural water poverty index and sustainability. Agron. Sustain. Dev. 31, 415–431.
Guo, Q., Huang, G., Guo, Y., Zhang, M., Zhou, Y., Duan, L. (2021). Optimizing irrigation and planting density of spring maize under mulch drip irrigation system in the arid region of Northwest China. Field Crops Res. 266, 108141.
Heitholt, J. J. (1994). Canopy characteristics associated with deficient and excessive cotton plant population densities. Crop Sci. 34, 1291–1297.
Hernandez, M. D., Alfonso, C., Echarte, M. M., Cerrudo, A., Echarte, L. (2021). Maize transpiration efficiency increases with n supply or higher plant densities. Agric. Water Manage. 250, 106816.
Hou, X., Fan, J., Zhang, F., Hu, W., Yan, F., Xiao, C., et al. (2022). Determining water use and crop coefficients of drip-irrigated cotton in south xinjiang of China under various irrigation amounts. Ind. Crops Prod. 176, 114376.
Hu, L., Pan, X., Wang, X., Hu, Q., Wang, X., Zhang, H., et al. (2021). Cotton photosynthetic productivity enhancement through uniform row-spacing with optimal plant density in xinjiang, China. Crop Sci. 61, 2745–2758.
Kerby, T. A., Cassman, K. G., Keeley, M. (1990). Genotypes and plant densities for narrow-row cotton systems. II. leaf area and dry-matter partitioning. Crop Sci. 30, 649–653.
Khan, A., Najeeb, U., Wang, L., Tan, D. K. Y., Yang, G., Munsif, F., et al. (2017b). Planting density and sowing date strongly influence growth and lint yield of cotton crops. Field Crops Res. 209, 129–135.
Khan, A., Wang, L., Ali, S., Tung, S. A., Hafeez, A., Yang, G. (2017a). Optimal planting density and sowing date can improve cotton yield by maintaining reproductive organ biomass and enhancing potassium uptake. Field Crops Res. 214, 164–174.
Kodur, S. (2017). Improving the prediction of soil evaporation for different soil types under dryland cropping. Agric. Water Manag 193, 131–141.
Li, J. F., Liang, F. B., Chen, H. C., Zhang, W. F., Kang, P. (2016). Effect of row spacing configuration on agronomic traits and yield of cotton under machine-harvested pattern. Xinjiang Agric. Sci. 08), 1390–1396.
Li, H., Wan, H. L., Tian, L. W., Liu, L. T., Zhang, Y. J., Bai, Z. Y., et al. (2020). The effects of increased-density on canopy apparent photosynthesis, dry matter accumulation and distribution of cotton under late-sown condition. Cotton Sci. 32, 339–347.
Li, C., Wu, P. T., Li, X. L., Zhou, T. W., Sun, S. K., Wang, Y. B., et al. (2017). Spatial and temporal evolution of climatic factors and its impacts on potential evapotranspiration in loess plateau of northern shaanxi, China. Sci. Total Environ. 589, 165–172.
Li, H., Zhu, Y. F., Cai, D. L. (2021). Study on the characteristics of water use in agriculture and major crops in xinjiang. Agric. Technol. 41 (21), 40–43.
Liao, Z., Zeng, H., Fan, J., Lai, Z., Zhang, C., Zhang, F., et al. (2022). Effects of plant density, nitrogen rate and supplemental irrigation on photosynthesis, root growth, seed yield and water-nitrogen use efficiency of soybean under ridge-furrow plastic mulching. Agric. Water Manage. 268, 107688.
Luo, H. H., Zhang, H. Z., Han, H. Y., Zhang, Y. L., Zhang, W. F. (2014). Effects of water sto-rage in deeper soil layers on growth, yield, and water productivity of cotton (Gossypium hirsutum l.) in arid areas of northwestern China. Irrig. Drain. 63, 59–70.
Lv, X., Wang, Z., Ma, L., Cao, N., Meng, Y., Zhou, Z. (2021). Crop residue incorporation combined with potassium fertilizer increased cotton canopy apparent photosynthesis and seed cotton yield in barley-cotton rotation system. Arch. Agron. Soil Sci. 67, 300–312.
Magaia, E., Famba, S., Wesström, I., Brito, R., Joel, A. (2017). Modelling maize yield response to plant density and water and nitrogen supply in a semi-arid region. Field Crop Res. 205, 170–181.
Malone, S., Herbert, D. A., Holshouser, D. L. (2002). Evaluation of the LAI-2000 plant canopy analyzer to estimate leaf area in manually defoliated soybean. Agron. J. 94, 1012–1019.
Meng, X., Lian, Y., Liu, Q., Zhang, P., Jia, Z., Han, Q. (2020). Optimizing the planting density under the ridge and furrow rainwater harvesting system to improve crop water productivity for foxtail millet in semiarid areas. Agric. Water Manage. 238, 106220.
Neumann, K., Stehfest, E., Verburg, P. H., Siebert, S., Müller, C., Veldkamp, T. (2011). Exploring global irrigation patterns: a multilevel modelling approach. Agr. Syst. 104, 703–713.
Paul, M., Rajib, A., Negahban-Azar, M., Shirmohammadi, A., Srivastava, P. (2021). Improved agricultural water management in data-scarce semi-arid watersheds: value of integrating remotely sensed leaf area index in hydrological modeling. Sci. Total Environ. 791, 148177.
Qin, S., Li, S., Kang, S., Du, T., Tong, L., Ding, R. (2016). Can the drip irrigation under film mulch reduce crop evapotranspiration and save water under the sufficient irrigation condition? Agric. Water Manage. 177, 128–137.
Rafiee, M., Kalhor, M. (2016). Economic water use efficiency of corn (Zea mays l.) hybrids as affected by irrigation regimes: a case study in West Iran. Arch. Agron. Soil Sci. 62, 781–789.
Rahman, M. A., Moser, A., Gold, A., Rötzer, T., Pauleit, S. (2018). Vertical air temperature gradients under the shade of two contrasting urban tree species during different types of summer days. Sci. Total Environ. 633, 100–111.
Reddy, V., Reddy, K., Hodges, H. (1995). Carbon dioxide enrichment and temperature effects on cotton canopy photosynthesis transpiration, and water-use effciency. Field Crops Res. 41, 13–23.
Shi, F., Li, N. N., Khan, A., Lin, H. R., Tian, Y., Shi, X., et al. (2022). DPC can inhibit cotton apical dominance and increase seed yield by affecting apical part structure and hormone content. Field Crop Res. 282, 108509.
Srinivasan, V., Kumar, P., Long, S. P. (2017). Decreasing, not increasing, leaf area will raise crop yields under global atmospheric change. Glob. Change Biol. 23, 1626–1635.
Sui, J., Wang, J., Gong, S., Xu, D., Zhang, Y., Qin, Q. (2018). Assessment of maize yield-increasing potential and optimum n level under mulched drip irrigation in the northeast of China. Field Crop Res. 215, 132–139.
Tabashnik, B. E., Carrière, Y. (2019). Global patterns of resistance to bt crops highlighting pink bollworm in the united states, China, and India. J. Econ. Entomol. 112, 2513–2523.
Tian, J., Zhang, X., Yang, Y., Xu, S., Zuo, W., Zhang, W., et al. (2017). How to reduce cotton fiber damage in the xinjiang China. Ind. Crops Prod. 109, 803–811.
Wang, Y., Chen, M., Liang, F., Tian, J., Zhang, Y., Jiang, C., et al. (2021a). Photosynthates competition within the boll–leaf system is alleviated with the improvement of photosynthetic performance during the succession of xinjiang cotton cultivars. Ind. Crops Prod. 160, 113121.
Wang, F., Xiao, J., Ming, B., Xie, R., Wang, K., Hou, P., et al. (2021b). Grain yields and evapotranspiration dynamics of drip-irrigated maize under high plant density across arid to semi-humid climates. Agric. Water Manage. 247, 106726.
Wang, Z., Yang, P., Zheng, X., He, X., Zhang, J., Li, W. (2014). Soil salt dynamics in cotton fields with mulched drip irrigation under the existing irrigation system in xinjiang. Agric. Machinery 45, 149–159.
Wei, K., Zhang, J., Wang, Q., Guo, Y., Mu, W. (2022). Irrigation with ionized brackish water affects cotton yield and water use efficiency. Ind. Crops Prod. 175, 114244.
Wu, Y., Huang, F. Y., Jia, Z. K., Ren, X. L., Cai, T. (2017). Response of soil water, temperature, and maize (Zea may l.) production to different plastic film mulching patterns in semi-arid areas of northwest China. Soil Tillage Res. 166, 113–121.
Xie, T. T., Su, P. X., Gao, S. (2010). Photosynthetic rate, transpiration rate, and water use efficiency of cotton canopy in oasis edge of linze. J. Appl. Ecol. 21, 1425–1431.
Yao, H., Zhang, Y., Yi, X., Zuo, W., Lei, Z., Sui, L., et al. (2017). Characters in light-response curves of canopy photosynthetic use efficiency of light and n in responses to plant density in field-grown cotton. Field Crop Res. 203, 192–200.
Zhang, W., Wang, Z., Yu, S., Li, S., Fang, J., Tong, W. (2004). Effects of planting density on canopy photosynthesis, canopy structure and yield formation of high-yield cotton in xinjiang, China. Chin. J. Plant Ecol. 28, 164.
Keywords: mulch drip irrigation, row spacing configuration, cotton, leaf area index, soil water consumption
Citation: Zuo W, Wu B, Wang Y, Xu S, Tian J, Jiu X, Dong H and Zhang W (2023) Optimal planting pattern of cotton is regulated by irrigation amount under mulch drip irrigation. Front. Plant Sci. 14:1158329. doi: 10.3389/fpls.2023.1158329
Received: 03 February 2023; Accepted: 04 May 2023;
Published: 30 May 2023.
Edited by:
Kaixuan Zhang, Chinese Academy of Agricultural Sciences, ChinaReviewed by:
Aziz Khan Khan, Guangxi University, ChinaCopyright © 2023 Zuo, Wu, Wang, Xu, Tian, Jiu, Dong and Zhang. This is an open-access article distributed under the terms of the Creative Commons Attribution License (CC BY). The use, distribution or reproduction in other forums is permitted, provided the original author(s) and the copyright owner(s) are credited and that the original publication in this journal is cited, in accordance with accepted academic practice. No use, distribution or reproduction is permitted which does not comply with these terms.
*Correspondence: Wangfeng Zhang, emh3Zl9hZ3JAc2h6dS5lZHUuY24=
Disclaimer: All claims expressed in this article are solely those of the authors and do not necessarily represent those of their affiliated organizations, or those of the publisher, the editors and the reviewers. Any product that may be evaluated in this article or claim that may be made by its manufacturer is not guaranteed or endorsed by the publisher.
Research integrity at Frontiers
Learn more about the work of our research integrity team to safeguard the quality of each article we publish.