 Cuiping Zhang1†
 Ruolin Gong1†Hua Zhong2†
 Chunyan Dai1
 Ru Zhang1Jungang Dong1
 Yangsheng Li3
 Shuai Liu2*
 Jihong Hu1*
- 1State Key Laboratory of Crop Stress Biology for Arid Areas, College of Agronomy, Northwest A&F University, Yangling, China
- 2Cancer Epidemiology Division, Population Sciences in the Pacific Program, University of Hawaii at Manoa, Honolulu, HI, United States
- 3State Key Laboratory of Hybrid Rice, College of Life Sciences, Wuhan University, Wuhan, China
Rapeseed (Brassica napus L.), the third largest oil crop, is an important source of vegetable oil and biofuel for the world. Although the breeding and yield has been improved, rapeseed still has the lowest yield compared with other major crops. Thus, increasing rapeseed yield is essential for the high demand of vegetable oil and high-quality protein for live stocks. Silique number per plant (SN), seed per pod (SP), and 1000-seed weight (SW) are the three important factors for seed yield in rapeseed. Some yield-related traits, including plant height (PH), flowering time (FT), primary branch number (BN) and silique number per inflorescence (SI) also affect the yield per plant (YP). Using six multi-locus genome-wide association study (ML-GWAS) approaches, a total of 908 yield-related quantitative trait nucleotides (QTNs) were identified in a panel consisting of 403 rapeseed core accessions based on whole-genome sequencing. Integration of ML-GWAS with transcriptome analysis, 79 candidate genes, including BnaA09g39790D (RNA helicase), BnaA09g39950D (Lipase) and BnaC09g25980D (SWEET7), were further identified and twelve genes were validated by qRT-PCRs to affect the SW or SP in rapeseed. The distribution of superior alleles from nineteen stable QTNs in 20 elite rapeseed accessions suggested that the high-yielding accessions contained more superior alleles. These results would contribute to a further understanding of the genetic basis of yield-related traits and could be used for crop improvement in B. napus.
Introduction
Brassica napus (B. napus, AACC, 2n = 38) is one of the most important oilseed crops worldwide as vegetable oil, animal feed and biofuel (Lu et al., 2019; Song et al., 2020). However, the deteriorating environment and lack of arable land make the yield of rapeseed insufficient to support the demand. Therefore, increasing rapeseed yields is a research priority for rapeseed breeders to meet the future demand of oilseed rape production. The yield of rapeseed is a complex quantitative trait and mainly determined by three yield-component traits, including 1000-seed weight (SW), silique number per plant (SN) and seed per pod (SP) (Zhao et al., 2016; Lu et al., 2017). Seed yield is also influenced by yield-related traits such as plant height (PH), flowering time (FT), primary branch number (BN), length of main inflorescence, and silique number of main inflorescence (SI) in rapeseed (Shi et al., 2009; Zhao et al., 2016). There is a correlation among these yield traits, and they interact with each other to jointly determine the rapeseed yield. In addition, the relationships between these traits are intricate, for example, SW was positively correlated with yield per plant, plant height and length of main inflorescence, while it was negatively correlated with seed number per pod and flowering time. Seed size affects the SW and SP, which is of great value for crop improvement in rapeseed (Li et al., 2019a). Thus, dissecting the genetic basis and molecular mechanism of yield traits will facilitate and accelerate breeding programs for yield in rapeseed.
Rapeseed yield component and related traits are all complex quantitative traits governed by multiple genes. In previous studies, some loci or genes for yield traits in rapeseed were identified using quantitative trait locus (QTL) mapping and map-based cloning (Shi et al., 2009; Li et al., 2015; Liu et al., 2015; Li et al., 2019b; Shi et al., 2019; Wang et al., 2021a). Zhou et al. (2014) mapped 736 QTLs associated with the yield in the A and C subgenomes of B. napus, which were distributed over 19 chromosomes, mostly located on A03. Raboanatahiry et al. (2018) detected 972 QTLs associated with seed yield and yield-related traits in B. napus, identifying 147 potential candidate genes that could affect nine different traits. With the development of high-density customized single nucleotide polymorphism (SNPs), genome wide association study (GWAS) has become a powerful tool for deciphering the genetic architecture of complex quantitative traits (Lu et al., 2017; Zhong et al., 2021a). Based on 33,186 genomic SNPs from the 60 K Brassica Illumina Infinium SNP array, a new QTL was fine mapped onto chromosome C03 in B. napus and a gene controlling the branching number phenotype was identified (He et al., 2017). Integrated GWAS and transcriptome analysis, auxin-related genes were identified to associate with leaf petiole angle at the seedling stage in B. napus (Hu et al., 2021a). And stable QTLs localized on chromosomes A07, A09, and C08 were identified for silique length (SL) using GWAS combined with RNA-seq (Wang et al., 2021a). With the advance of next-generation sequencing (NGS) technology, mega-level SNPs or genetic variations via whole genome resequencing in population could detect more loci for the yield traits in crops (Zhang et al., 2022a). Using 10,658 high-quality SNP markers, a total of 497 SNPs were detected to associate with yield-related traits in B. napus (Zhang et al., 2022b). Based on high-quality 670,028 SNPs, GWASs were conducted using multi-locus random mixed linear model for 11 important traits in rapeseed (Lu et al., 2019). Using a nested association mapping population, SNP-GWAS, and presence and absence variation (PAV)-GWAS identified loci and structural variations for silique length, SW and FT (Song et al., 2020). Furthermore, 56 agronomically traits, including plant architecture and yield traits were examined using whole-genome resequencing in 403 diverse rapeseed accessions by GWAS and identified 26 loci associated with SW and silique length (Hu et al., 2022). Most of these GWAS studies used the single-locus GWAS (SL-GWAS) methods, such as the general linear model (GLM), the mixed linear model (MLM), efficient mixed-model association eXpedited (EMMAX), and factored spectrally transformed linear mixed models (FaST-LMM) (Zhong et al., 2021b). However, the SL-GWAS methods rule out many significant loci, including minor effect loci due to their highly stringent Bonferroni correction (Wang et al., 2016).
Recently, multi-locus GWAS (ML-GWAS) methodologies, including FASTmrEMMA, ISIS EM-BLASSO, mrMLM, FASTmrMLM, pLARmEB, pKWmEB, were developed as an effective approach for association analysis (Cui et al., 2018; Zhang et al., 2020). And various combinations of ML-GWAS methods have proven to be significantly effective in controlling false positive rates (Misra et al., 2017; Zhong et al., 2021c). Thus, ML-GWAS has been used to discover novel quantitative trait nucleotides (QTNs) in many crops. In wheat, five ML-GWAS models were utilized to successfully identify new QTL for yield-related traits in 272 local Chinese wheat landraces based on 172,711 SNPs (Lin et al., 2021). ML-GWAS of 144 maize inbred lines genotyped with 43,427 SNPs identified a large number of significant QTNs and 40 candidate genes associated with the regenerative capacity of the embryonic callus (Ma et al., 2018). In soybean, 129 significant QTNs related to protein content were identified by five ML-GWAS methods, and 8 candidate genes were predicted to be involved in protein synthesis and metabolism (Zhang et al., 2018). Using ML-GWAS, 74 significant QTN hotspots have been identified to associate with five yield-related traits in rice (Zhong et al., 2021c). However, ML-GWAS methods for yield-related traits in rapeseed have not yet been performed, especially based on the whole genome resequencing data. Given the efficiency and various models of ML-GWAS, more novel loci and candidate genes could be identified to associate with yield traits.
In the present study, we aimed to identify novel loci for seed yield and yield-related traits in rapeseed. Six ML-GWAS approaches were used to determine novel QTNs based on high-quality SNPs in 403 rapeseed accessions for eight yield traits in three environments. And we also analyzed the significant QTNs and pinpointed multiple candidate causal genes for the QTNs. The candidate genes and elite alleles identified with yield traits will provide an insight into further exploration of the genetic architecture of yield traits in rapeseed and genetic improvement of rapeseed.
Materials and methods
Plant materials and phenotype evaluation
A highly diverse natural population consisting of 403 core rapeseed germplasms were used as previous study (Hu et al., 2022). The set of rapeseed accessions includes spring (102), semi-winter (179) and winter (129) types from China, Germany, France, Canada, Japan, USA and other countries. And phenotyping of the 403 accessions were evaluated under three environments: E1, Yangluo (30.38° N, 114.50° E) in 2013, E2, Nanchang (28.37° N, 116.27° E) in 2014, and E3, Wuhan (30.58° N, 113.68° E) in 2016, which were download from https://www.cgris.net/rapedata/ or http://brassicanapusdata.cn/. The yield traits including SI, SN, SP, SW, and YP as well as three yield-related traits, such as PH, BN, and FT were measured according to the measurement standards (Chen et al., 2014; Li et al., 2016). The large seed size accession R01 and small seed size accession R56 were grown in a greenhouse (light/dark 16/8 h photoperiod and 25°C/20°C day/night temperature) in Northwest Agriculture and Forestry University, Yangling, Shaanxi, China.
Genotyping data processing
Whole genome resequencing was performed on the Illumina HiSeq 4000 platform with 150 bp paired-end and download from NCBI (PRJNA416679) (Hu et al., 2022). GATK (v.3.3) was used for SNP calling and then excluded SNP calling errors, retaining only high-quality SNPs (minor allele frequency ≥ 0.05, miss ≤ 0.2 and sequencing depth ≥ 6) for subsequent analysis (McKenna et al., 2010). These SNPs were processed by PLINK 1.9 with parameter –maf 0.05 –geno 0.05, –snps-only and imputed by Beagele 5.0 (Browning et al., 2018; Zhong et al., 2021c). Finally, a total of 7,531,945 high-quality SNPs were employed for GWAS analysis.
Multi locus-GWAS analysis
Six ML-GWAS methods, including the mrMLM, FASTmrMLM, FASTmrEMMA, pLARmEB, pKWmEB, and ISIS EM-BLASSO, were used to identify significant QTN. All six ML-GWAS approaches are implemented in R package “mrMLM” (https://cran.r-project.org/web/packages/mrMLM/index.html) (Wang et al., 2016). Default values were used for all parameters and a threshold of logarithm of odds (LOD ≥ 3 or P ≤ 0.0002) was chosen to examine the association between markers and yield-related traits (Zhang et al., 2019). Principal component analysis and kinship matrices were used in all methods. The R package CMplot (https://github.com/yinliLin/R-CMplot) was employed to visualize Manhattan and QQ plots of GWAS. Using the Tassel 5.2 tool (Bradbury et al., 2007), LDs between SNPs were estimated as the squared correlation coefficient (R2) of alleles, and R2 values were calculated within a 0 to 10 cM window. The phenotypic-effect value of allelic variation for each trait was calculated by the phenotypic data across the 403 accessions. The relative phenotypic data were visualized with box plots using the R 4.2.1 software.
Identification of candidate genes
The putative candidate loci were identified by at least two different GWAS methods. Candidate genes were predicted from the upstream or downstream 200 kb region of stable QTL loci using the ‘Darmor-bzh’ reference genome (https://www.genoscope.cns.fr/brassicanapus) (Chalhoub et al., 2014). Then the candidate genes were further annotated on NCBI (https://www.ncbi.nlm.nih.gov/) and annotated for Arabidopsis homologous genes by BLAST analysis (Hu et al., 2021a). Haplotype analysis of the QTN association regions across the 403 rapeseed accessions was conducted by Haploview v4.2 (Barrett et al., 2005).
Transcriptome analysis
Total RNA was extracted from developing siliques (include seeds) of two extremely SW accessions R01 (large seed) and R56 (small seed) for RNA-seq at two weeks after pollination (2 WAP), three weeks after pollination (3 WAP), and four weeks after pollination (4 WAP). Illumina’s NEBNext® UltraTM RNA Library Preparation Kit was used to construct libraries and quality control was checked by Agilent 2100 Bioanalyzer System. Clean reads after filtering the raw reads were mapped to the “Darmor-bzh” reference genome (https://www.genoscope.cns.fr/brassicanapus) using HISAT2 software (Chalhoub et al., 2014; Kim et al., 2015). Gene expression levels were normalized using the FPKM (fragments per kilobase per million reads) values by StringTie (Pertea et al., 2015). Differential expression analysis between the sample pairs in two rapeseed accessions was conducted by DESeq2 (Love et al., 2014). Differentially expressed genes (DEGs) were determined with false discovery rate (FDR) < 0.05 and |log2 (fold change)| ≥ 1. GO (Gene ontology) and KEGG (Kyoto Encyclopedia of Genes and Genomes) pathway enrichment analysis of the DEGs were performed using AgiGO 2.0 and KOBAS3.0, respectively (Tian et al., 2017; Bu et al., 2021).
Candidate gene expression analysis
Candidate genes were predicted based on the ML-GWAS and transcriptome analysis, and were further validated by quantitative real-time PCR (qRT-PCR). Briefly, 1μg of total RNA was used for RNA-seq and cDNA synthesis was performed using HiScript®Q RT SuperMix (Vazyme, China). Data collection was performed in QuantStudio™ real-time PCR software (Thermo Fisher Scientific, Waltham, MA, USA). All the primers are listed in Supplementary Table S1. Data were normalized by the internal control gene BnACTIN (BnaA03g55890D) and relative expression levels were calculated using a 2-ΔΔCT analysis method (Livak and Schmittgen, 2001).
Results
Phenotypic evaluation for yield traits
Phenotypic values for eight yield traits of rapeseed in three environments, including PH, FT, BN, SI, SN, SP, SW, and YP were used to determine whether significant phenotypic differences existed in these traits (Supplementary Figure S1). The phenotypic assessments revealed a wide range of variation between the different accessions, with the frequency distribution of all traits approximating a normal distribution (Figure 1). In addition, we noted that yield-related traits were differentially affected by environments, with SW and SP remaining relatively stable across environments, while PH and BN were more variable. Taken together, the extent of available variation for the different traits suggested that the set of rapeseed accessions are suitable for GWAS analysis.
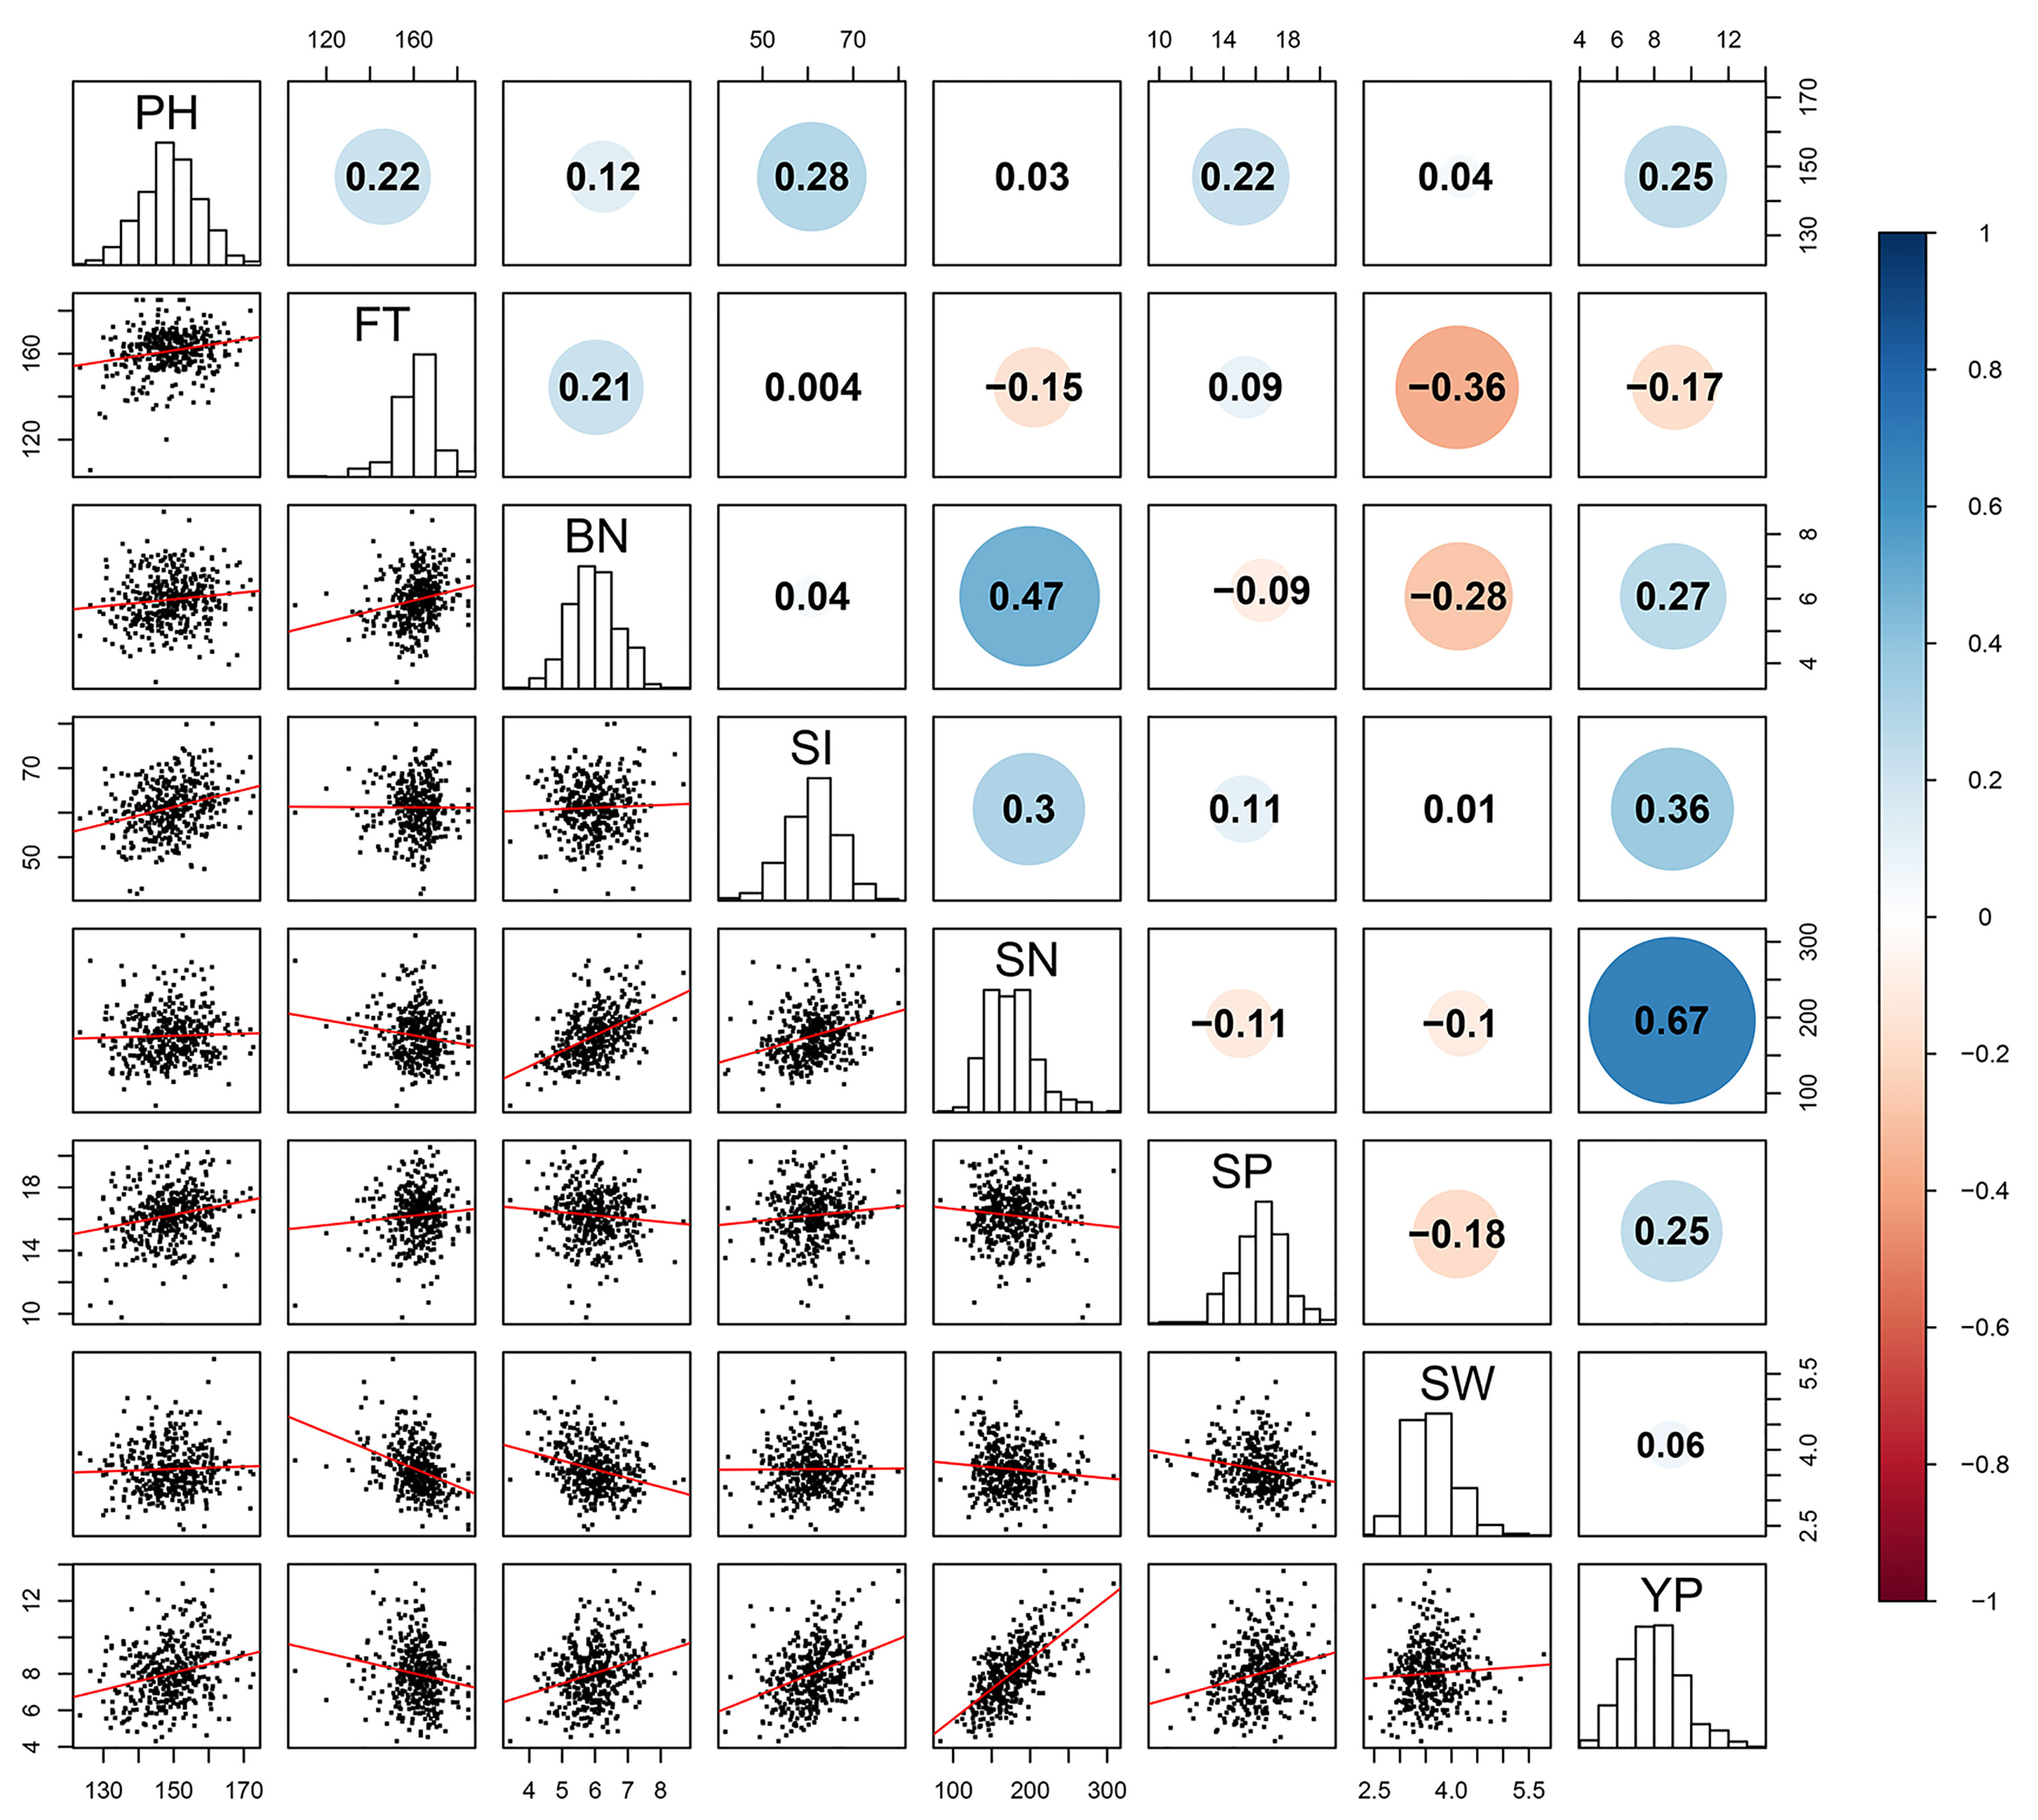
Figure 1 Pairwise Pearson correlation among the eight yield traits in B.napus. The upper diagonal represents the Pearson correlation coefficient (PCC) between every two traits (positive numbers represent positive correlation, negative numbers represent negative correlation). The diagonal histogram represents the distribution of each trait, and the lower diagonal represents the linear regression statistics between each two traits. Blue for positive correlation, red for negative correlation. The size of the circle represents the absolute magnitude of the PCC.
To uncover the relationships of the different yield traits, Pearson correlation coefficient (PCC) was used to assess correlations between pairs of traits in the eight yield-related traits (Figure 1). SN and YP were highly significantly and positively correlated (PCC=0.67), indicating that the YP was greatly determined by the SN. In addition, there were also significant positive correlations between BN and SN, SI and YP, and SI and SN, with their PCCs of 0.47, 0.36 and 0.3, respectively, while SW was negatively correlated with both FT (PCC = –0.36) and BN (PCC = –0.28). These results suggest that there is an intricate relationship between yield-related traits and they play important roles in regulating oilseed rape yield in a coordinated manner.
Genome-wide association mapping for yield traits
A total of 908 QTNs for eight yield traits were identified using at least two of the six ML-GWAS methods, namely FASTmrEMMA, FASTmrMLM, ISIS EM-BLASSO, mrMLM, pKWmEB, and pLARmEB (Supplementary Table S2). QTNs with LOD scores > 3.0 were considered significant trait-related QTNs. The highest number of QTNs for SN was identified to be 127, followed by SI with 126 and the remaining 118, 96, 110, 115, 106, and 110, were associated with PH, FT, BN, SP, SW, and YP, respectively (Supplementary Table S2). The number of QTNs detected by multiple methods varied between environments, with higher numbers found in WH16 and NC14, 435 and 431 respectively, compared to 404 in YL13 (Supplementary Figure S2). The most abundant QTNs for SI were found in both YL13 and WH16, with 76 and 84 each, while the greatest number of QTNs for SN were identified in NC15. FASTmrMLM identified the highest number of QTNs (320), while FASTmrEMMA found only 20, with other models identifying numbers in the range of 151 ~ 273 (Supplementary Figure S2). In addition, we found that the results identified by pKWEmEB and pLARmEB were consistent with each other.
We further analyzed the common QTNs that were co-identified in at least four ML-GWAS approaches (Figure 2). Through the combination of different methods, a total of 596 QTNs were identified, of which NC14 was the most, with 236 QTNs, while YL13 was only 154 QTNs. The QTNs associated with SI became the most numerous with 120, the rest being 65, 59, 103, 103, 81, 48, and 65, associated with PH, FT, BN, SN, SP, SW, and YP, respectively (Figure 2). These results showed the diversity of QTNs in different environments or traits, demonstrating the importance of identifying stable QTNs by integration of multiple methods.
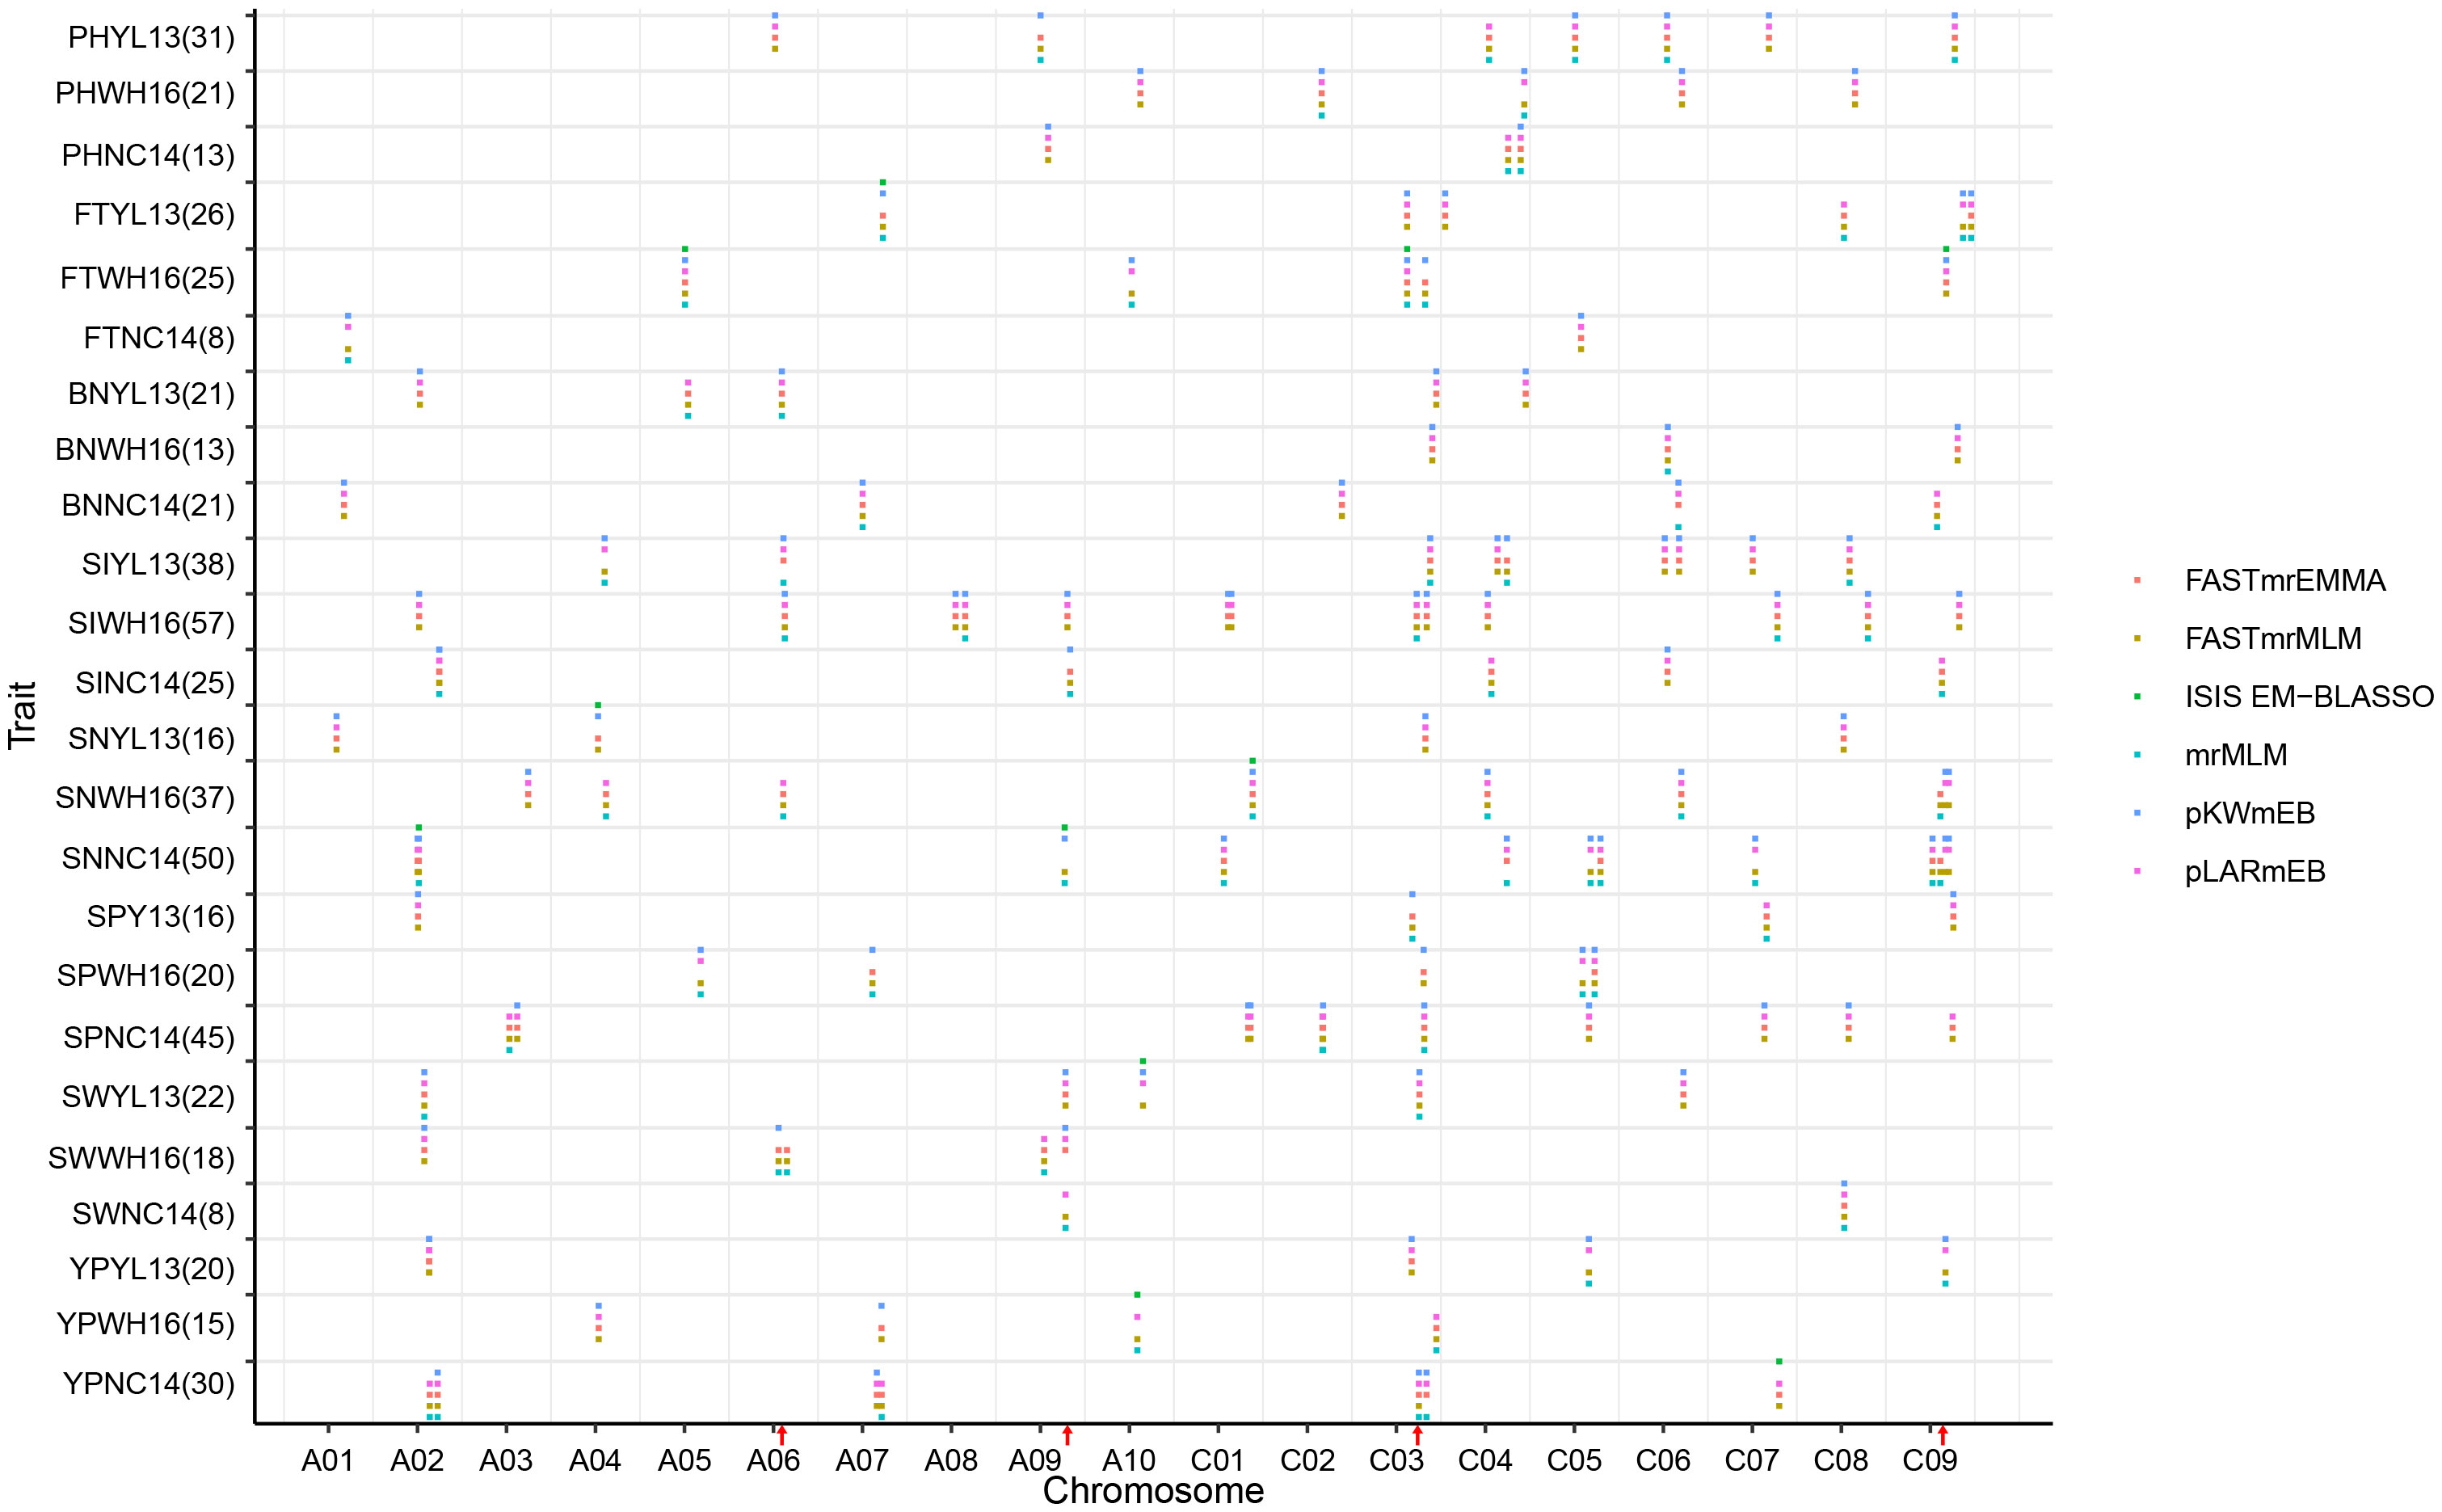
Figure 2 Chromosomal distribution of QTNs for eight yield traits identified by six ML-GWAS methods in the three environments. The horizontal axis indicates genomic locations in chromosomal order and plots significant QTNs according to genomic location. Each row represents a QTN identified by a different ML-GWAS methods. PH, plant height; FT, flowering time; BN, primary branch number; SI, Silique number of main inflorescence; SN, Silique number per plant; SP, seed per pod; SW, 1000-seed weight, YP, yield per plant. Three different environments, YL13, Yangluo 2013; NC14, Nanchang 2014; WH16, Wuhan 2016. The red arrows show the QTN hotspots.
Stable QTNs detected by multi-methods or across environments
In order to obtain reliable results, we further analyzed QTNs shared by at least two models in different environments within the 1 Mb region. A total of 75 significant stable QTNs (or QTN clusters) controlling eight yield-related traits were obtained (Table 1 and Supplementary Table S3). One QTN (C03: 12081167) associated with FT in WH16 was identified simultaneously in six models, explaining phenotypic variation of 0.35 ~ 3.79 and LOD scores ranging from 3.04 ~ 5.72, and near which locus, another QTN (C03: 12024986) was also detected in YL13 (Table 1). Six QTNs controlling different traits were detected simultaneously in the five models, with qSWYL13-A02-1 and qSWWH16-A02-1 for SW explaining the largest phenotypic variation range of 4.10 ~ 22.24. In addition, all QTNs explained the largest range of phenotypic variation of SW (3.05 ~ 27.33), followed by FT (1.78 ~ 16.40). The number of these QTNs varied considerably in the A and C subgenomes, 23 and 44 respectively, and were more numerous on chromosomes C03, C08, and C09, with 10, 7, and 8, respectively.
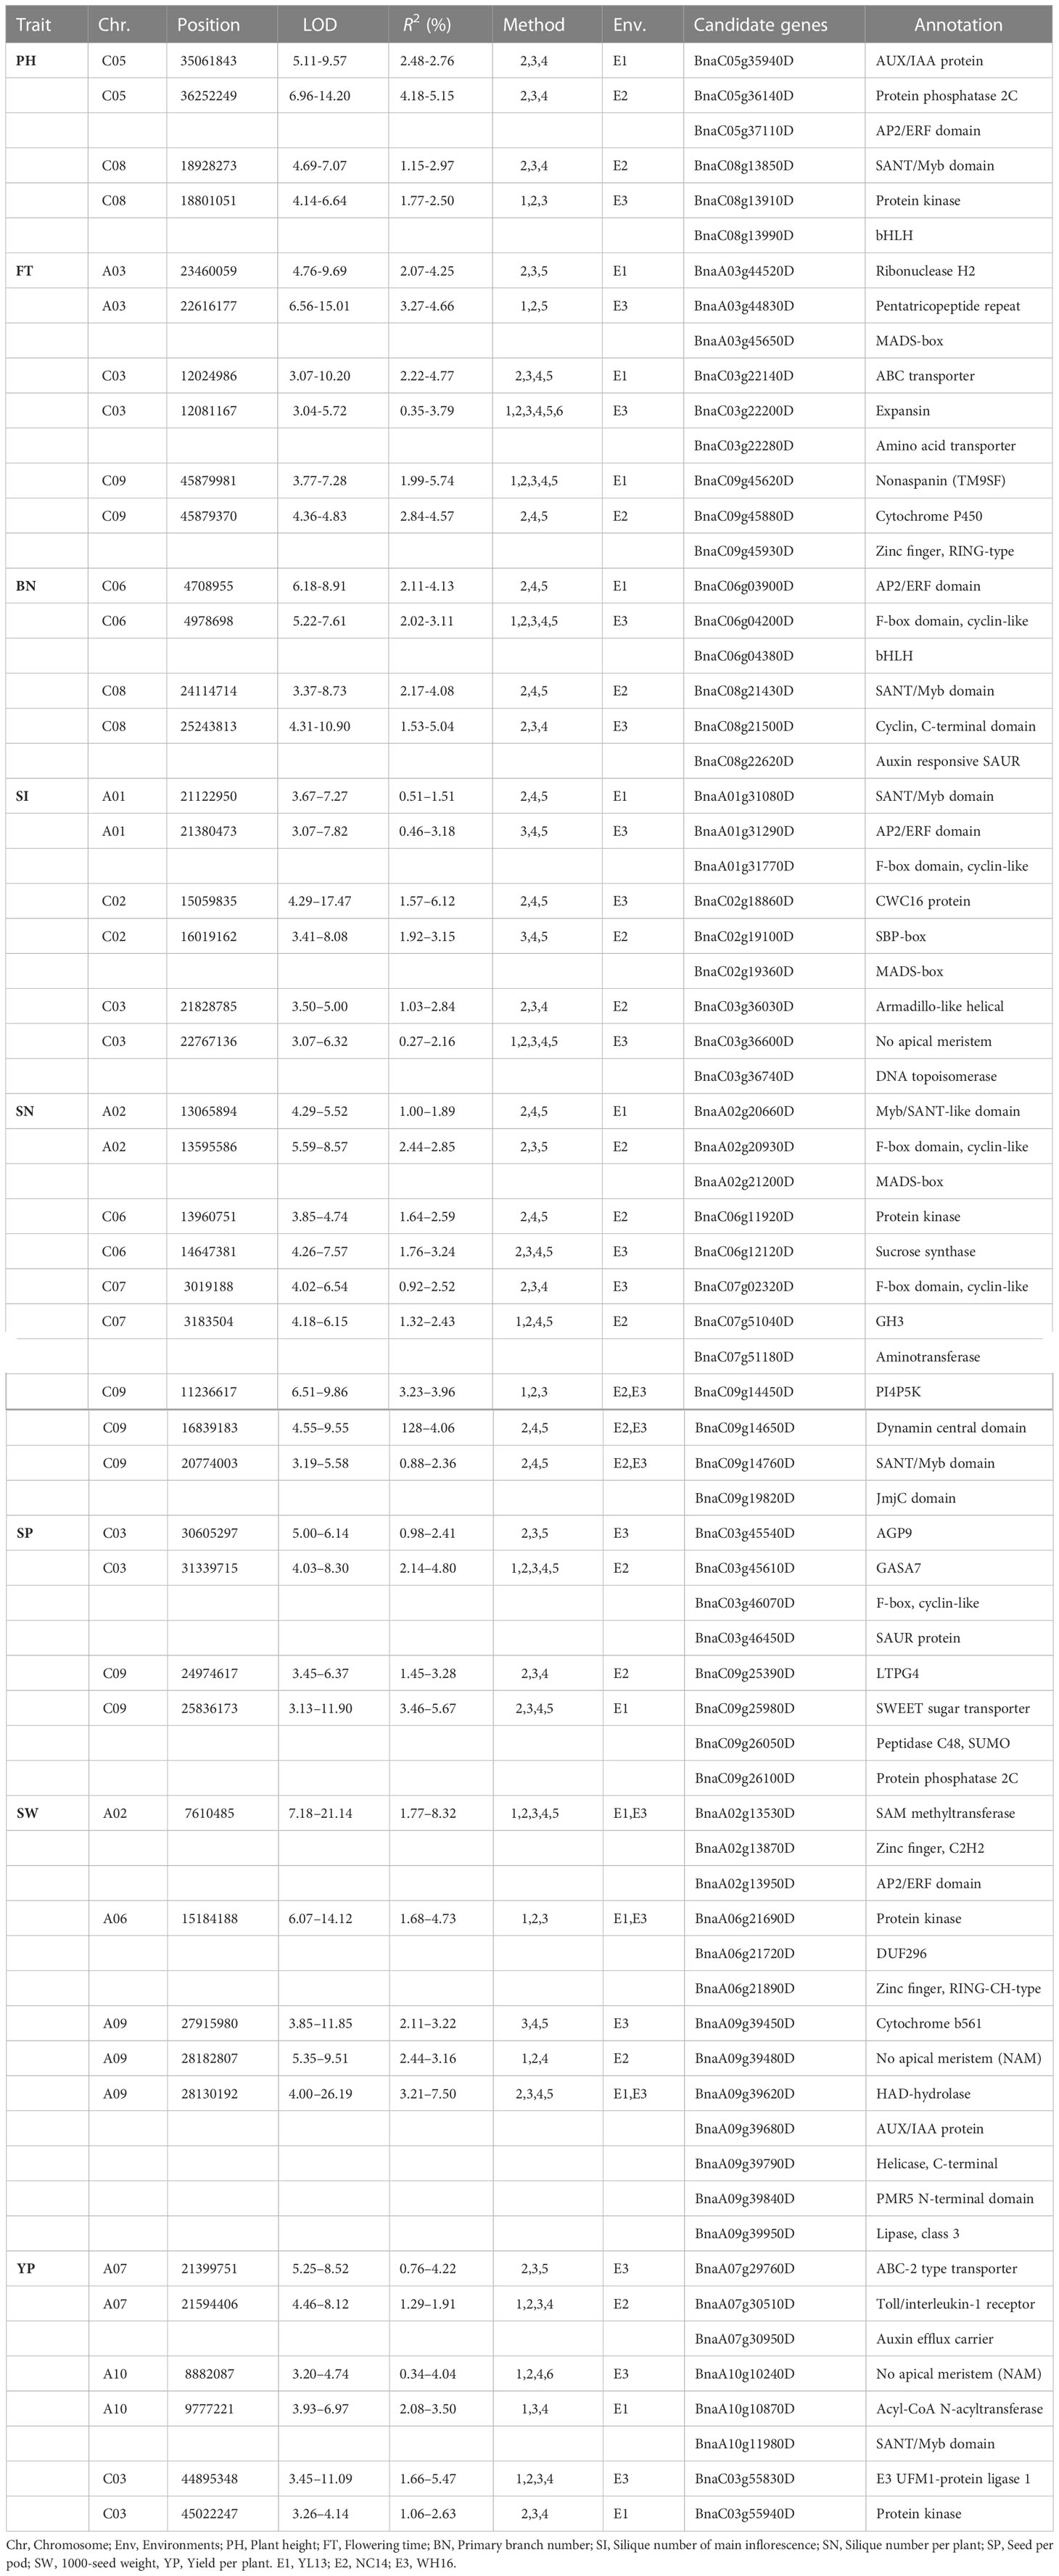
Table 1 Candidate genes associated with eight yield-related traits identified by multi loci-GWAS in different environments.
Forty QTNs shared by ML-GWAS and SL-GWAS within the 1 Mb region were found to associate with the eight yield traits, with the highest number of QTNs associated with SW (10) and the lowest with SI (2) (Supplementary Table S4) (Hu et al., 2022). Among the overlapped QTNs with SL-GWAS, 10 QTNs including A09: 28130192 and A09:2818207 associated with SW were simultaneously detected, and some of them were found in at least two environments, suggesting that these QTNs were more stable and reliable (Table 2 and Supplementary Table S4). Four QTNs were detected in all five ML-GWAS and SL-GWAS, and two of them, both associated with SW, were found repeatedly in two environments, explaining 4.10 ~ 22.24, 5.32 ~ 10.60 of the phenotypic variation, respectively (Supplementary Table S4). Notably, we detected two significant signal loci, A09:28182807 and C09:25836173, in three environments simultaneously, associated with SW and SP, respectively. The two loci have high LOD values and may be significant trait-associated QTNs with breeding potential (Supplementary Figure S3). Thus, a total of 24 and 15 stable significantly associated QTNs were detected by ML-GWAS for SW and SP, explaining 0.24 ~ 8.32 and 0.00 ~ 6.74 of phenotypic variation, respectively (Supplementary Table S5).
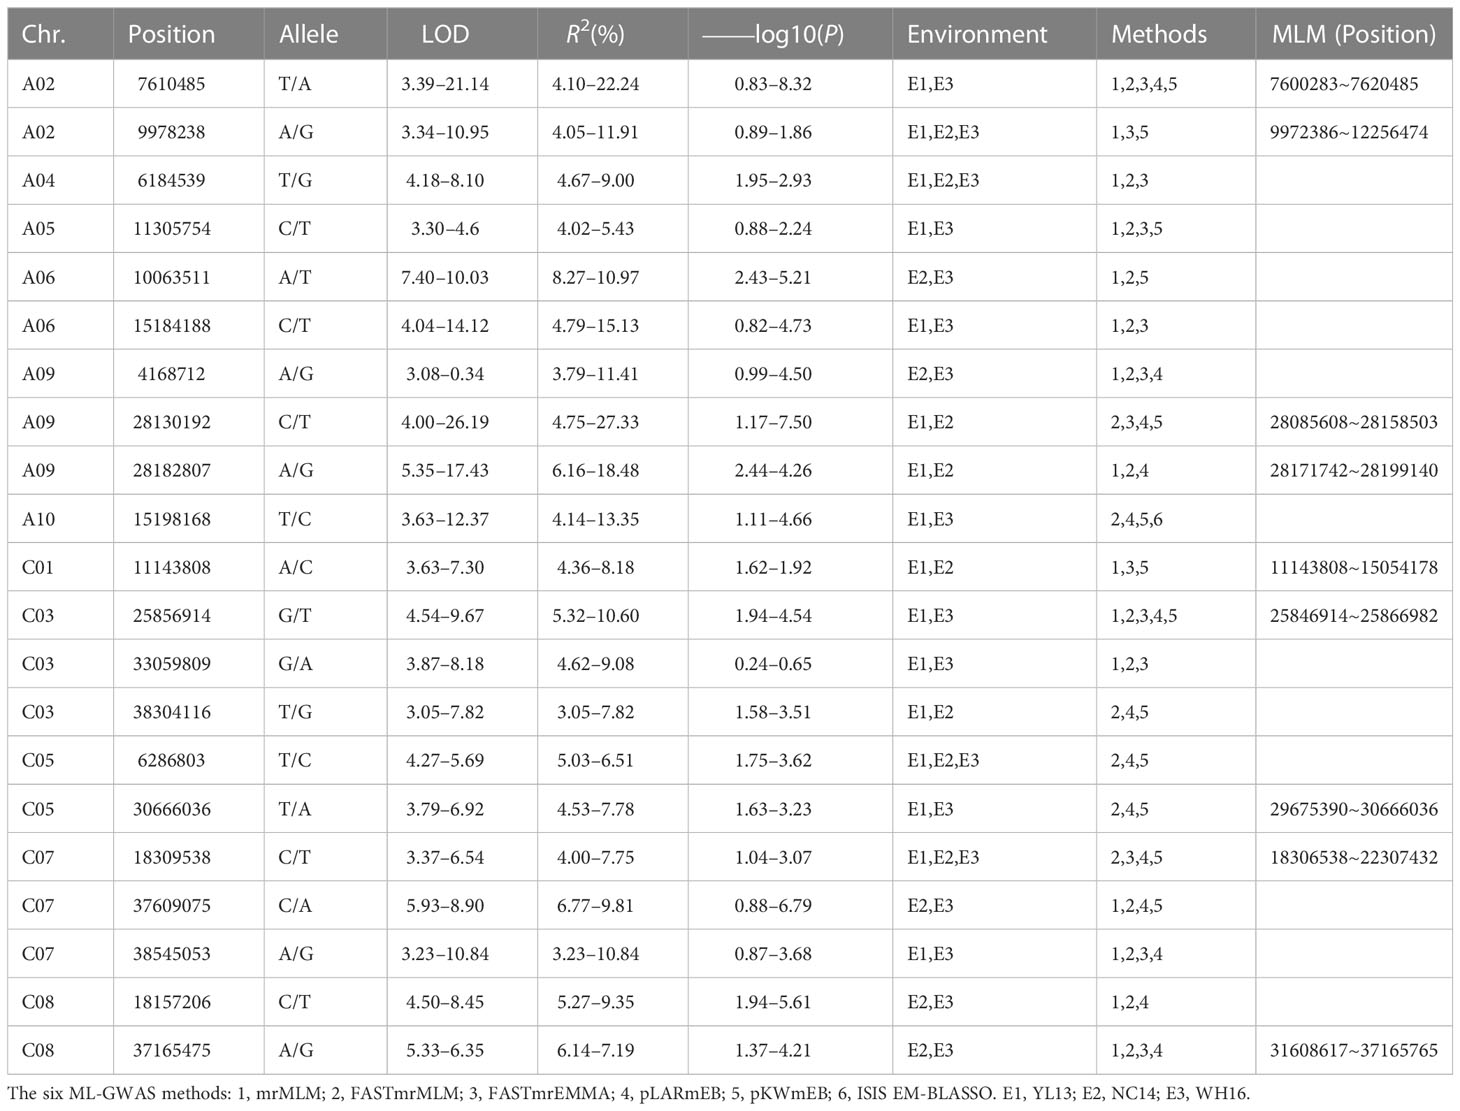
Table 2 Significant 1000-seed weight (SW) associated QTNs and candidate genes detected in at least two environments by multi loci-GWAS.
Since SW is the important component of yield traits, and is relatively stable in different environments in this study, we further analyzed the QTNs associated with SW. A total of 21 significant QTNs were identified simultaneously in at least 2 environments as well as in three models (Table 2). And nine of the 21 QTNs were also detected by SL-GWAS with MLM model (Table 2), indicating the reliability of ML-GWAS (Hu et al., 2022). A roughly similar number of QTNs was found in each environment, and the results were also similar for each model, except for pLARmEB, which identified only one. These QTNs were randomly distributed on different chromosomes and their LOD scores ranged from 3.05 ~ 26.19, explaining 3.05 ~ 27.33 of the phenotypic variation (Table 2).
Allelic effects of stable QTNs for yield traits
To identify the favorable alleles of QTNs for the eight yield traits in rapeseed, we analyzed the significant phenotypic differences between the elite and alternative alleles of 21 QTNs (Figure 3 and Supplementary Figure S4). We divided the population into two or three groups according to their allele types and compared the phenotypic values among the different groups. Generally, population with elite alleles had significantly larger values than those with unfavorable alleles. For example, accessions with the TT allele of C09:25836173 show more SP compared to those with the AA variant, indicating TT could be considered an elite allele. We focused on A09:28182807, a significant locus associated with SW, and the average SW values of GG individuals of A09:28182807 was significantly higher than that of AA and AG individuals. We further analyzed the haplotype blocks in the 772 bp region around the peak locus A09:28182807 and identified a strongly linked block (Figure 4A). Based on the genotypes of this block, the association population of rapeseed germplasms was divided into five major haplotype groups with two nonsynonymous SNPs (Figure 4B). Haplotype Hap 3 (n =19) had relatively large SW values and showed significant differences from Hap 1 (n = 41) and Hap 5 (n = 18) (Figure 4B). These results suggest that locus A09:28182807 significantly associated with SW and that the haplotype Hap 3 of BnaA09g39950D may increase seed weight.
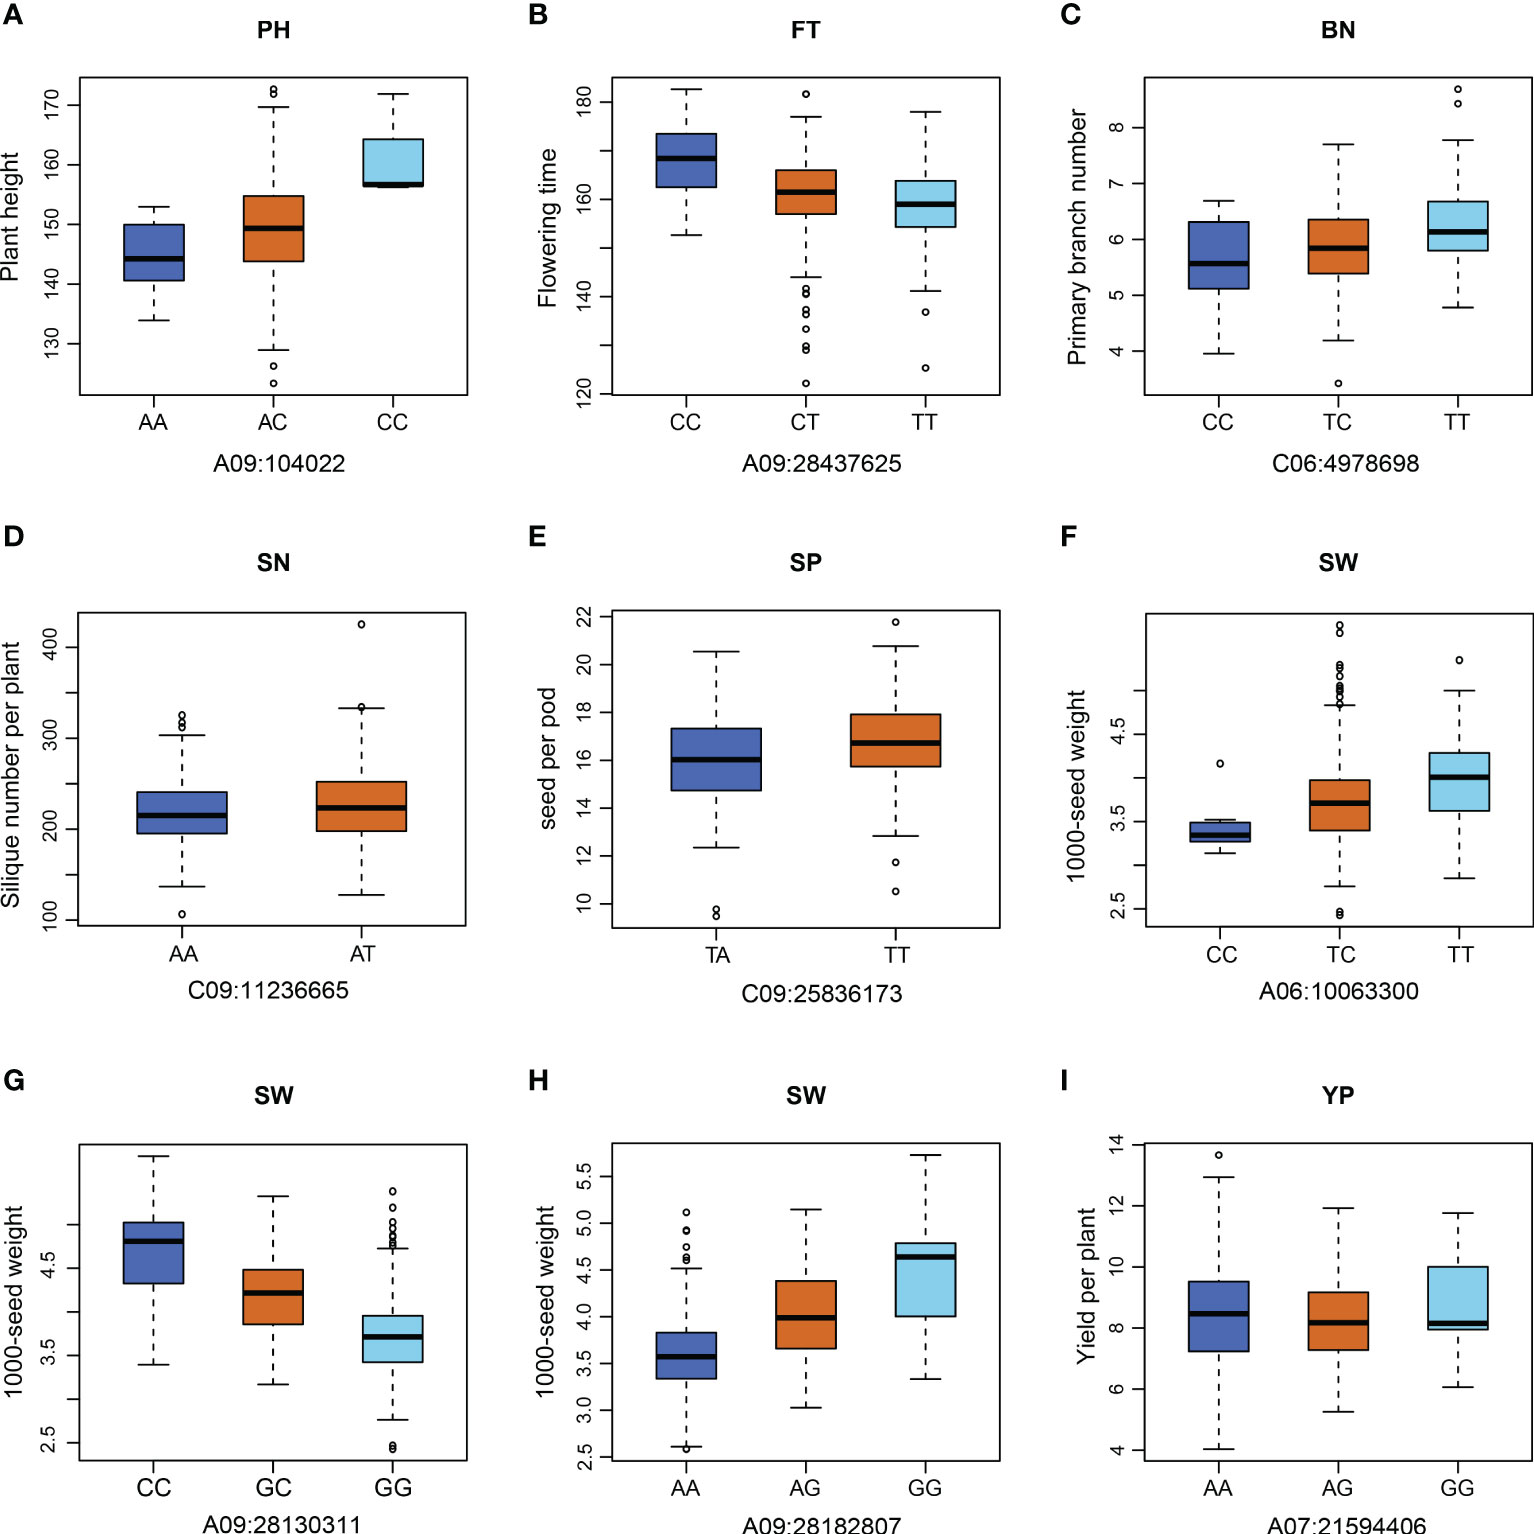
Figure 3 Phenotypic differences between two or three genotypes for each of the nine QTNs. (A-I) Phenotypic variations at different alleles of nine QTNs for the yield traits. PH, plant height; FT, flowering time; BN, primary branch number; SN, Silique number per plant; SP, seed per pod; SW, 1000-seed weight, YP, yield per plant.
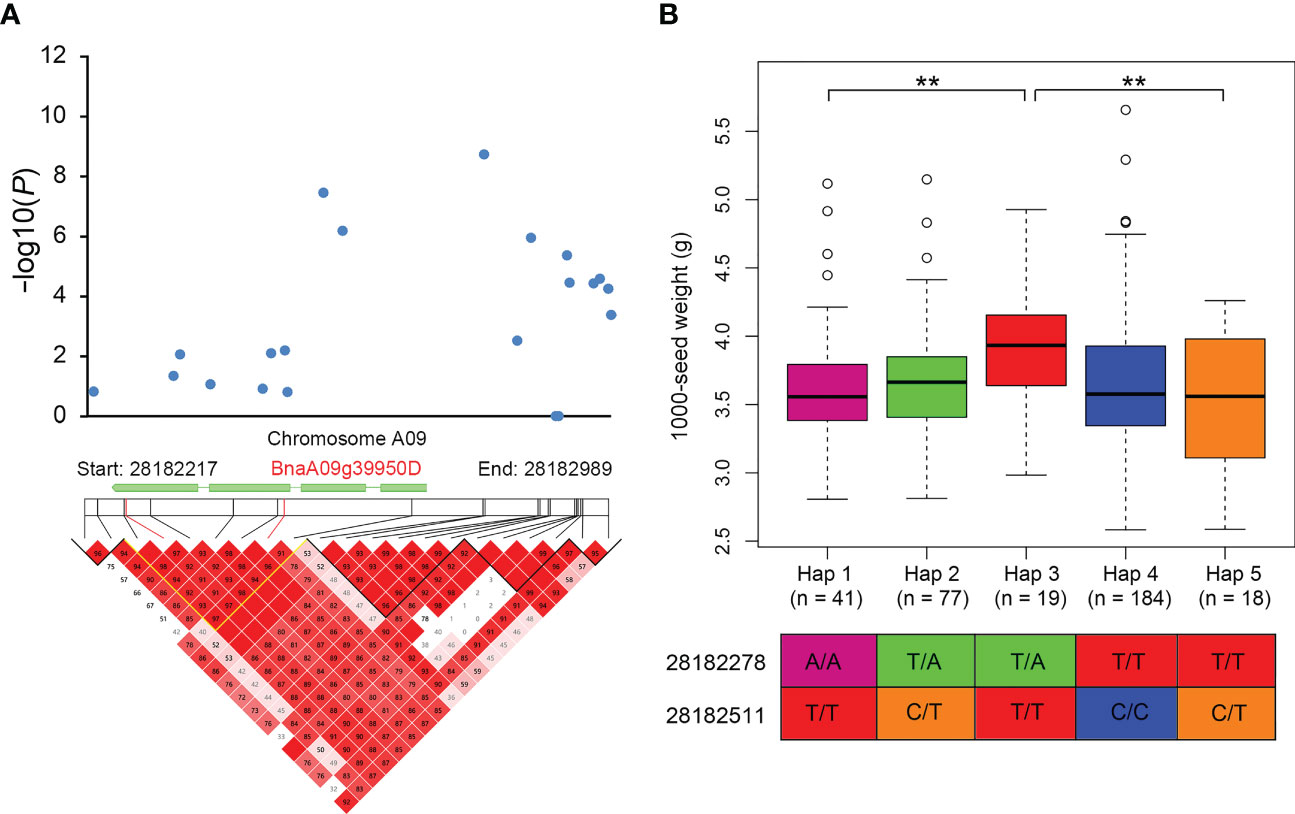
Figure 4 The QTN detected in at least two environments on chromosome A09 for 1000-seed weight (SW) with LD heatmap surrounding the QTN. (A) Manhattan plot of the A09 chromosomal region around the candidate gene BnaA09g39950D and LD heatmap with a peak SNP (A09: 28182807). (B) Haplotype analysis of BnaA09g39950D. Box plots show the distribution of each haplotype group, n denotes the number of genotypes belonging to each haplotype group and the genotypes less than ten are not shown. ** Significant differences between the haplotypes were evaluated by two-tailed t test (P < 0.01).
Twelve other QTNs associated with the seven yield-related traits PH, FT, SI, BN, SN, SW and YP were further analyzed, indicating some elite alleles improve the yield traits (Supplementary Figure S4). The favorable alleles obviously affected FT with the population with the AA elite allele at A03:22616177 having a mean FT of around 170 days, compared to around 160 days for the CC allele group (Supplementary Figure S4). These findings suggested that the accessions with elite alleles have clearly higher phenotypic values for yield-related traits compared to those with unfavorable allelic variations. Nineteen important QTNs shared by multiple environments and multiple methods regulate five important yield-related traits, including SW, FT, BN, SI, and SN. And these QTNs were used to assess the utilization of favorable alleles in 20 elite accessions during rapeseed breeding (Supplementary Figure S5). Among these elite accessions, the number of superior alleles in the QTNs ranged from 5 (26.3%, Shengliqinggeng) to 12 (63.2%, Zhongshuang 11), of which seven accessions had more than 10 (52.6%) superior alleles. In addition, we found that some superior alleles of the QTN loci were prevalent in these accessions, for example, the superior alleles of C09:11236665 and C09:11236689 were in almost all the accessions (19/20). These results suggest that some common elite alleles may have a particularly large impact on yield.
Identification of candidate genes based on stable QTNs and transcriptome analysis
Considering the LD decay distance of the rapeseed population, the regions within 200-kb on either side of the stable QTNs based on ML-GWAS were used to identify the candidate genes. Thus, 4796 genes were mined surrounding the 75 stable QTNs identified by ML-GWAS in different environments (Table 1 and Supplementary Tables S4, S5). There are many candidate genes involved in plant growth and development, such as BnaA07g30950D (Auxin efflux carrier), which is involved in maintaining the embryonic hormone gradient, and also involved in shoot and root development. The genes BnaA07g30180D (SAUR protein), BnaA09g39680D (AUX/IAA protein), BnaA09g40340D (F-box domain, cyclin-like) and BnaC03g46450D (SAUR protein) have all been implicated in the regulation of plant growth (Table 1). Furthermore, 1807 genes were found in the QTNs of SW and 942 genes were discovered in SP (Supplementary Figure S6 and Table S5). Haplotype analysis of the candidate genes BnaA06g17710D, BnaA09g39450D and BnaA09g39950D for SW showed that the different haplotypes had significant phenotypic difference (Supplementary Figure S7). In the significant QTN cluster (A09: 27915980 ~ 28130192 ~ 28182807) for SW, which was also detected by SL-GWAS, three candidate genes BnaA09g39450D (Cytochrome b561), BnaA09g39790D (RNA helicase), and BnaA09g39950D (Lipase) were identified to associate with SW (Figures 3, 4 and Supplementary Table S5).
To further determine the candidate genes associated with the two important traits SW and SP, we analyzed transcriptomic data from two accessions with extremely difference of seed size, R01 and R56. The accession R01 with larger seeds than that of R56, and has significant different seed number per pod (R01, n = 14.74 vs R56, n = 20.56) (Figure 5A) (Hu et al., 2022). We found a total of 2572 differentially expressed genes (DEGs) among three different stages in these two accessions (Supplementary Figure S6 and Table S6). Searching for commonly identified genes in the DEGs and the candidate genes for ML-GWAS results, we identified 79 reliable candidates with 50 and 29 of which regulate SW and SP, respectively (Supplementary Figures S6B, C and Tables S7, S8). GO enrichment analysis revealed that DEGs were enriched to fruit development terms (GO: 0010154) in biological processes (GO: 0008150) and identified 76 associated genes (Supplementary Figure S6). KEGG analysis indicated that a large number of DEGs were involved in the metabolic pathways and biosynthesis of secondary metabolism (Figure 5B). Moreover, the gene annotation of DEGs demonstrates considerable genes related to plant hormones, especially auxin, as well as an abundance of transcription factors (TFs).
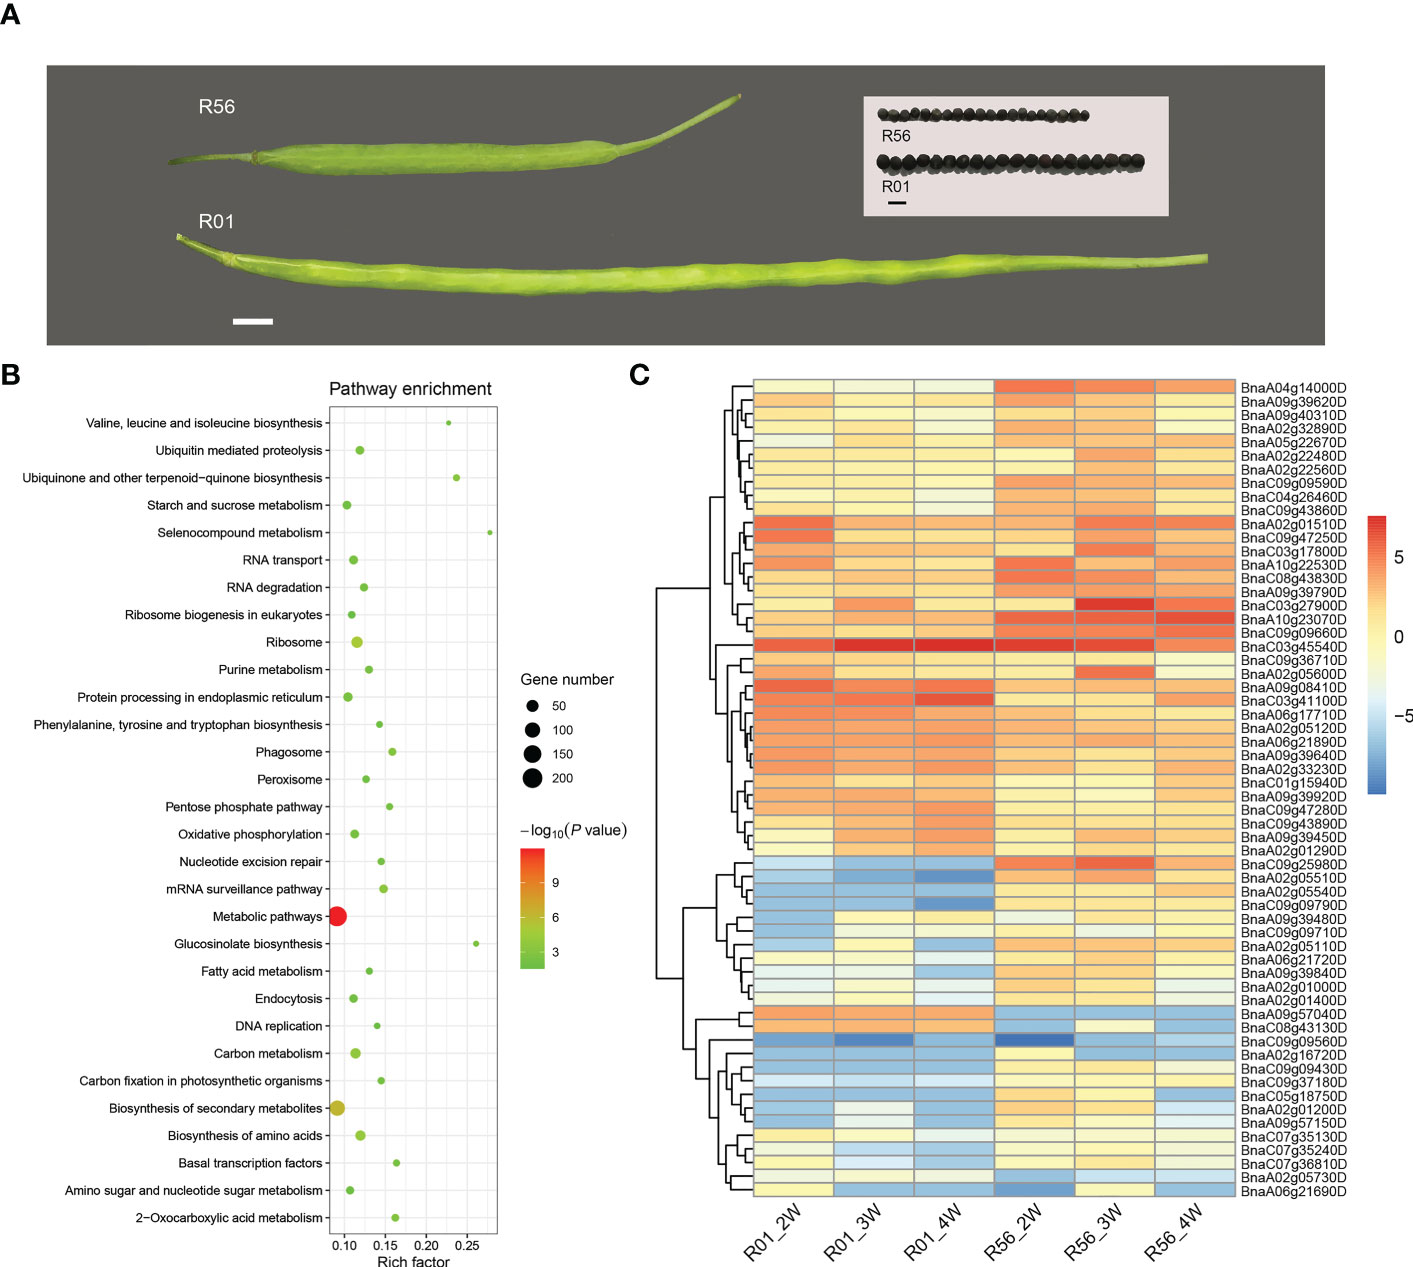
Figure 5 Transcriptome analysis of two rapeseed accessions with extremely seed size/seed weight. (A) Seeds and siliques of R01 (large seed) and R56 (small seed) showed considerable variations in seed weight. (B) The top 30 significantly enriched KEGG pathways of differentially expressed genes (DEGs) between R01 and R56 at three stages. (C) Heatmap of the expression patterns of the 60 genes in developing seeds of two rapeseed cultivars at three stages. The red indicates high expression, and the blue shows low expression. R01_2W, R01_3W, R01_4W, R56_2W, R56_3W and R56_4W represent the sampling time of R01 and R56 are two weeks after pollination, three weeks after pollination, and four weeks after pollination, respectively.
Analysis of candidate genes expression patterns
Expression pattern analysis was performed for 60 genes detected in both DEGs and ML-GWAS for SW and SP (Figure 5C). We identified a number of genes that were highly significantly differentially expressed in the two cultivars R01 and R56 (Figure 5C). BnaC09g25980D (SWEET7) is a candidate gene for SP, which is extremely highly expressed in R56 plants and lowly expressed in R01 (Figure 5C). In addition, BnaA02g05510D, BnaA02g05540D, and BnaC09g09790D also had similar expression patterns (Figure 5C). However, BnaA09g57040D and BnaC08g43130D had opposite expression profiles, both of which were highly up-regulated in R01 and lowly expressed in R56. There are also many genes to be up-regulated in both accessions, but they are more remarkable in R01 than in R56. The SW-related candidate gene BnaA09g39450D (Cytochrome b561) was more highly expressed in R01, and expression levels increased progressively with developmental time (Figure 5C).
We next investigated the expression profiles of genes related to different phytohormones, such as auxin, jasmonic acid (JA) and gibberellin (GA), cyclin-related genes, and TFs in the 2572 DEGs (Supplementary Figures S8A–E). Transcripts of seven auxin-related genes were up-regulated in R56 compared to R01, for example, BnaA05g00250D, BnaC04g00140D and BnaC09g00360D had higher expression levels in R56 (Supplementary Figure S8A). All three genes related to JA were extremely up-regulated in R56, but BnaA02g05120D was expressed at a higher level in R01 (Supplementary Figure S8B). Three genes related to, GAs especially BnaC03g11560D were also up-regulated in R56, but two cyclin genes, BnaC01g38940D, and BnaC02g02720D, were significantly higher expressed in R01 than in R56 (Supplementary Figures S8C, D). In addition, 36 TFs in 2572 DEGs were showed differentially expressed in R01 and R56 (Supplementary Figure S8E).
Validation of DEGs by qRT-PCRs
Twelve candidate genes were selected for qRT-PCR analysis based on the combined results of ML-GWAS and RNA-seq (Figure 6). Overall, the expression levels of these genes were diverse in the two accessions and varied across developmental periods. The expression profile of the candidate gene BnaC09g25980D for SP was consistent with RNA-seq, with both showing high expression levels of in R56 and lowly expression in R01. The qRT-PCR validation of the candidate gene BnaA09g39450D at the significant signal locus A09:28182807 for SW showed that it was expressed in both accessions, but transcripts were more abundant in R01 and increased progressively over time. Interestingly, the genes BnaC09g43860D and BnaC04g26460D were lowly expressed in R01 and expressed at high levels in R56, but gradually decreased in R56 over time. There are three genes, such as BnaA06g21890D, BnaC03g45540D and BnaA10g23070D, which are expressed in both accessions and their expression levels increase progressively with development in R01 but decrease progressively in R56. For gene BnaA02g05540D, it was extremely lowly expressed at different developmental periods in both R01 and R56, except for R01 at 4WAP. In addition, we found that most of these genes were significantly differentially expressed in both accessions, such as BnaA06g17710D, BnaA09g08410D, BnaC09g43890D, and BnaC09g47280D.
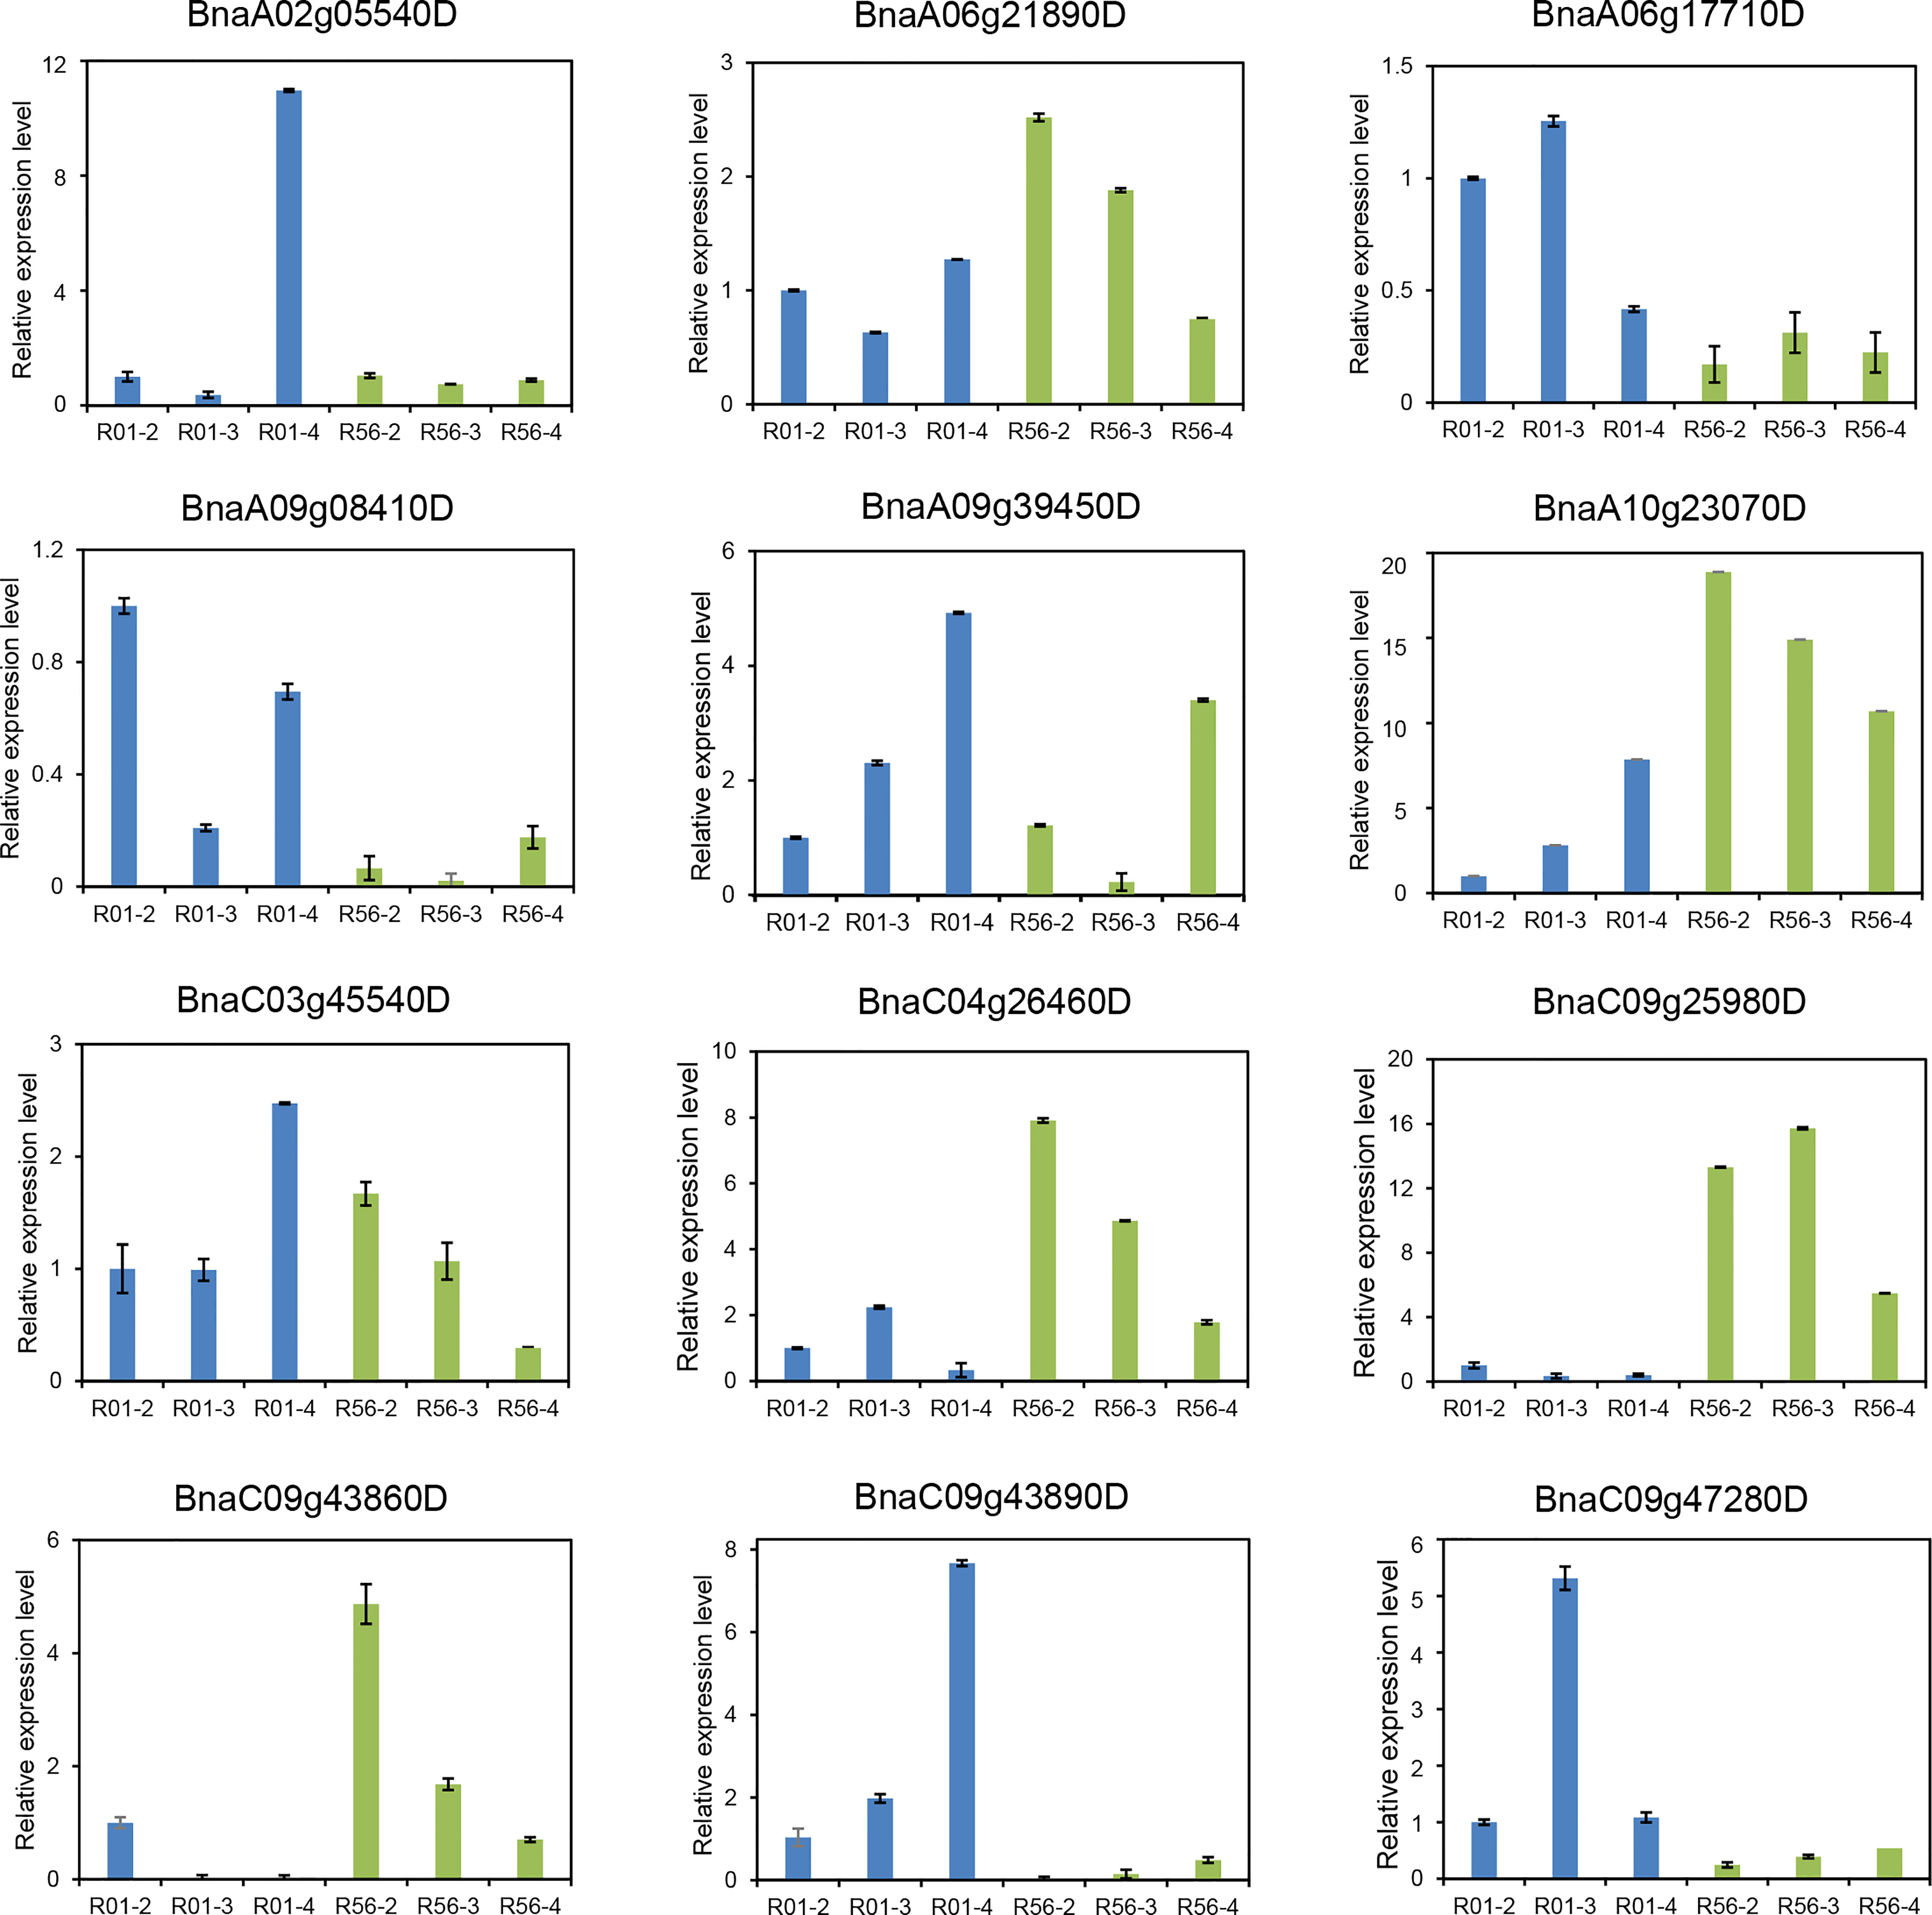
Figure 6 Quantitative RT-PCR (qRT-PCR) validation of differentially expressed genes (DEGs) for 1000-seed-weight (SW) between R01 and R56 from RNA-seq data. The transcript abundances were calculated from three replicates with BnACTIN7 (BnaA03g55890D) as internal control. Data are shown as means ± SE. R01-2, R01-3, R01-4, R56-2, R56-3 and R56-4 represent the sampling time of R01 and R56 are two weeks after pollination, three weeks after pollination, and four weeks after pollination, respectively.
Discussion
Seed yield is an important and complex quantitative trait in rapeseed. And developing high yield rapeseed varieties is the goal for breeders in many cases. Previous studies did not comprehensive analysis of the seed yield and yield-related traits in different environments at the same time using whole genome resequencing. In the present study, we not only examined the relationship among eight yield traits, but also detected novel QTNs for the yield traits in three environments. These findings would be helpful for breeders to develop rapeseed varieties by congregating superior alleles.
In rapeseed, lots of complex traits have been dissected via the GLM or MLM based on the single-locus using arrays or resequencing data (Lu et al., 2019; Song et al., 2020; Wang et al., 2021a; Hu et al., 2022). However, using one model for GWAS has limitations and may miss the small-effect loci (Ma et al., 2018). In this study, we use multi-locus methodologies, including mrMLM, FASTmrEMMA, pLARmEB and so on, to detect novel and more loci for seed yield and yield-related traits in rapeseed. Using ML-GWAS, a total of 908 QTNs were identified by at least two of six ML-GWAS methods and 596 QTNs of them were obtained for integrating multiple approaches (Figure 2 and Supplementary Table S2). And 40 loci were the same and near the loci which have been detected in rapeseed using SL-GWAS with MLM model as previous study (Hu et al., 2022). Furthermore, 75 of new QTNs have been identified in different environments and at least two models (Supplementary Table S3). Meanwhile, each method successfully detected some loci which other methods were not identified, indicating that it is worth using various methods for GWAS analysis (Liu et al., 2020). The stable QTNs identified in two or more environments or at least two methods increased the reliability of these loci. Using these methods, many novel loci were discovered for the seed yield and yield related traits of rapeseed (Supplementary Tables S2-S4). Thus, these ML-GWAS approaches would be effective alternative methods to dissect the genetic architecture for agronomic traits. In addition, integration of GWAS and transcriptomic analysis could reliably identify candidate genes for seed yield in rapeseed (Lu et al., 2017; Zhang et al., 2022a).
Seed size, an important agronomic trait determining crop yield, affects the SW and SP in rapeseed. In the significant QTN cluster on chromosome A09 for SW, three candidate genes BnaA09g39450D (Cytochrome b561), BnaA09g39790D (RNA helicase), and BnaA09g39950D (Lipase) were identified to affect seed size (Figures 3, 4 and Supplementary Table S4). Cytochrome b561, which plays an important role in plant growth and development has been also identified the QTL qGY8.1 for yield in rice (Balakrishnan et al., 2020). In our study, the expression level of BnaA09g39450D was validated to be higher in R01 than that in R56 (Figure 6). In Arabidopsis, RNA helicase has been reported to participate in coordination between cell cycle progression and cell size, which is required for ovule development and involved in seed size regulation (Yoine et al., 2006; Bush et al., 2015). Lipase is reported to involve in seed oil production in many plants (Eastmond, 2006; Wang et al., 2021b). In most cases, the seed oil content positively correlated with seed size in B. napus. For example, six nonspecific phospholipase C (NPC) genes have been identified to associate with SW or YP and the favorable haplotype of BnNPC6.C01 could increase seed oil content and seed yield (Cai et al., 2020). Patatin-related phospholipase pPLAIIIδ has been reported to affect organ size (silique) in Arabidopsis and B. napus (Dong et al., 2014). Therefore, these three candidate genes might be involved in the regulation of seed weight and seed yield in rapeseed. Seed size is also determined by the carbohydrate via the phloem to developing seeds during seed filling (Sosso et al., 2015). In soybean, both GmSWEET10a and GmSWEET10b were shown to transport sucrose and hexose, contributing to sugar allocation, which consequently simultaneous increases oil content and seed size in soybean (Wang et al., 2020). In our study, the candidate gene BnaC09g25980D (SWEET7) was validated to be highly expressed in R56 (Figure 6), indicating that SWEET7 might regulate the seed size in rapeseed.
Many plant hormones have been reported to be involved in the regulation of seed size, including auxin pathway, GA signaling and brassinosteroid (BR) signaling (Li et al., 2019c). In this study, using the extremely difference of seed size accessions R01 and R56 with significantly different seed number per pod, 2572 DEGs were identified by RNA-seq (Figure 5 and Supplementary Figure S6). And we identified 58 DEGs related to phytohormones, cell cycle and TFs including NAC, TCP, MYB and so on (Supplementary Figure S8 and Table S5). Auxin is known to regulate plant growth and development via cell division and cell elongation (Hu et al., 2021b). In previous studies, auxin signaling genes ARF18 and BnaA3.IAA7 have been reported to regulate seed weight and yield in B. napus (Liu et al., 2015; Li et al., 2019b). In our study, several candidate genes and ten DEGs were found to involve in auxin signaling pathway (Table 1, Supplementary Figure S8 and Table S6). The GASA family in Arabidopsis is regulated by GA, with the GASA4 mutant having smaller seeds than the wild type and increased grain weight after overexpression (Roxrud et al., 2007). A number of GA-related candidate genes, including GASA10 (BnaC03g11560D) was highly expressed in R56, which may affect the seed size (Supplementary Figure 8C). Hu et al. (2021c) revealed that JA signaling represses seed size and negatively regulates cell proliferation of integument during seed development. The JA signaling repressor jaz6 mutants in Arabidopsis exhibited small seed size, and overexpression of BnC08.JAZ1-1 in Arabidopsis resulted in enhanced seed weight (Hu et al., 2021c; Wang et al., 2022). In this study, JAZ12 (BnaA02g05120D) and JAZ 9 (BnaA07g28810D) were up-regulated in R01, while another candidate gene JAZ10 (BnaC09g43860D) was highly expressed in R56 (Figure 6, Supplementary Figure 8B and Table S6). These results suggested that auxin, GA, and JA signaling genes were involved in the control of seed size and seed number per pod in rapeseed. Furthermore, we observed that several cell cycle genes, including BnaC04g26460D (CDKB1;1) were up-regulated in R56 (Figure 6 and Supplementary Figure S8), indicating these DEGs play important roles in cell division and seed size (Qi et al., 2012; Hu et al., 2021c). In addition, one of the candidate gene BnaC09g43890D (NAC083) was validated highly expressed in R01 (Figure 6). In rice, three NAC genes NAC020, NAC026 and NAC023 have been reported to associate with seed size/weight (Mathew et al., 2016). And VvNAC26 was also demonstrated to regulate the seed size by interacting with VvMADS9 in grapevine (Zhang et al., 2021). Therefore, further functional studies of these genes associated with yield traits will help to elucidate the mechanism of high yield and apply to develop high-yielding rapeseed varieties.
Conclusion
In this study, a total of 908 QTNs were detected for eight yield traits using two or more ML-GWAS methods. Of them, 75 stable QTNs (or QTN clusters) controlling yield traits were obtained with a significant QTN cluster on chromosome A09 for SW, which was also identified by SL-GWAS. Twenty elite rapeseed accessions had a diverse distribution of superior alleles, and the high-yielding accessions contained more superior alleles. Integrated ML-GWAS with transcriptome analysis, 79 candidate genes were found to associate with SW or SP. Some genes related to plant hormones such as auxin, JA, and GA, were involved in the regulation of rapeseed yield. Thus, many robust QTLs with candidate genes were identified to regulate seed size and yield traits in rapeseed. This study made a beneficial attempt via a combinatory approach of ML-GWAS methods to facilitate the detection of yield-related QTNs in rapeseed. These findings will provide valuable information for understanding the mechanism underlying seed yield and yield-related traits and accelerate the crop improvement of rapeseed.
Data availability statement
The datasets presented in this study can be found in online repositories. The names of the repository/repositories and accession number(s) can be found in the article/Supplementary Material.
Author contributions
JH and SL designed and supervised the research. SL, HZ, JH, YL and CD performed multi-locus GWAS and bioinformatics analysis. CZ, RG, RZ, JD and JH performed the experiments and data analysis. CZ, RZ, JH and HZ wrote and revised the manuscript. All authors contributed to the article and approved the submitted version.
Funding
The work was supported by the National Natural Science Foundation of China (31901426) and the Key R&D Program of Shaanxi Province (2023-YBNY-031).
Conflict of interest
The authors declare that the research was conducted in the absence of any commercial or financial relationships that could be construed as a potential conflict of interest.
Publisher’s note
All claims expressed in this article are solely those of the authors and do not necessarily represent those of their affiliated organizations, or those of the publisher, the editors and the reviewers. Any product that may be evaluated in this article, or claim that may be made by its manufacturer, is not guaranteed or endorsed by the publisher.
Supplementary material
The Supplementary Material for this article can be found online at: https://www.frontiersin.org/articles/10.3389/fpls.2023.1153000/full#supplementary-material
References
Balakrishnan, D., Surapaneni, M., Yadavalli, V. R., Addanki, K. R., Mesapogu, S., Beerelli, K., et al. (2020). Detecting CSSLs and yield QTLs with additive, epistatic and QTL×environment interaction effects from Oryza sativa × O. nivara IRGC81832 cross. Sci. Rep. 10, 7766. doi: 10.1038/s41598-020-64300-0
Barrett, J. C., Fry, B., Maller, J., Daly, M. J. (2005). Haploview: analysis and visualization of LD and haplotype maps. Bioinformatics. 21, 263–265. doi: 10.1093/bioinformatics/bth457
Bradbury, P. J., Zhang, Z., Kroon, D. E., Casstevens, T. M., Ramdoss, Y., Buckler, E. S. (2007). TASSEL: software for association mapping of complex traits in diverse samples. Bioinformatics. 23 (19), 2633–2635. doi: 10.1093/bioinformatics/btm308
Browning, B. L., Zhou, Y., Browning, S. R. (2018). A One-Penny Imputed Genome from Next-Generation Reference Panels. Am J Hum Genet. 103, 338–348. doi: 10.1016/j.ajhg.2018.07.015
Bu, D., Luo, H., Huo, P., Wang, Z., Zhang, S., He, Z., et al. (2021). KOBAS-i: intelligent prioritization and exploratory visualization of biological functions for gene enrichment analysis. Nucleic Acids Res. 49, W317–W325. doi: 10.1093/nar/gkab447
Bush, M., Crowe, N., Zheng, T., Doonan, J. (2015). The RNA helicase, elF4A-1, is required for ovule development and cell size homeostasis in Aradidopsis. Plant J. 84, 989–1004. doi: 10.1111/tpj.13062
Cai, G., Fan, C., Liu, S., Yang, Q., Liu, D., Wu, J., et al. (2020). Nonspecific phospholipase C6 increase seed oil production in oilseed brassicaceae plants. New Phytol. 226, 1055–1073. doi: 10.1111/nph.16473
Chalhoub, B., Denoeud, F., Liu, S., Parkin, I. A. P., Tang, H., Wang, X., et al. (2014). Plant genetics. early allopolyploid evolution in the post-neolithic Brassica napus oilseed genome. Science. 345 (6199), 950–953. doi: 10.1126/science.1253435
Chen, B., Xu, K., Li, J., Li, F., Qiao, J., Li, H., et al. (2014). Evaluation of yield and agronomic traits and their genetic variation in 488 global collections of Brassica napus l. Genet. Resour Crop Evol. 61 (5), 979–999. doi: 10.1007/s10722-014-0091-8
Cui, Y., Zhang, F., Zhou, Y. (2018). The application of multi-locus GWAS for the detection of salt-tolerance loci in rice. Front. Plant Sci. 9. doi: 10.3389/fpls.2018.01464
Dong, Y., Li, M., Zhang, P., Wang, X., Fan, C., Zhou, Y. (2014). Patatin-related phospholipase pPLAIIIδ influences auxin-responsive cell morphology and organ size in Arabidopsis and Brassica napus. BMC Plant Biol. 14, 332. doi: 10.1186/s12870-014-0332-1
Eastmond, P. (2006). SUGAR-DEPENDENT1 encodes a patatin domain triacylglycerol lipase that initiates storage oil breakdown in germinating Arabidopsis seeds. Plant Cell. 18, 665–675. doi: 10.1105/tpc.105.040543
He, Y., Wu, D., Wei, D., Fu, Y., Cui, Y., Dong, H., et al. (2017). GWAS, QTL mapping and gene expression analyses in Brassica napus reveal genetic control of branching morphogenesis. Sci. Rep. 7 (5), 15971–15976. doi: 10.1038/s41598-017-15976-4
Hu, J. H., Chen, B. Y., Zhao, J., Zhang, F. G., Xie, T., Xu, K., et al. (2022). Genomic selection and genetic architecture of agronomic traits during modern rapeseed breeding. Nat. Genet. 54 (5), 694–704. doi: 10.1038/s41588-022-01055-6
Hu, J. H., Huang, L., Chen, G., Liu, H., Zhang, Y., Zhang, R., et al. (2021b). The elite alleles of OsSPL4 regulate grain size and increase grain yield in rice. Rice 14, 90. doi: 10.1186/s12284-021-00531-7
Hu, S., Yang, H., Gao, H., Yan, J., Xie, D. (2021c). Control of seed size by jasmonate. Sci. China Life Sci. 64, 1215–1226. doi: 10.1007/s11427-020-1899-8
Hu, J. H., Zhang, F. L. G., Gao, G. Z., Li, H., Wu, X. M. (2021a). Auxin-related genes associated with leaf petiole angle at the seedling stage are involved in adaptation to low temperature in Brassica napus. Environ. Exp. Bot. 182, 104308. doi: 10.1016/j.envexpbot.2020.104308
Kim, D., Langmead, B., Salzberg, S. L. (2015). HISAT: a fast spliced aligner with low memory requirements. Nat. Methods 12 (4), 357–360. doi: 10.1038/nmeth.3317
Li, F., Chen, B., Xu, K., Gao, G., Yan, G., Qiao, J., et al. (2016). A genome-wide association study of plant height and primary branch number in rapeseed (Brassica napus). Plant Sci. 242, 169–177. doi: 10.1016/j.plantsci.2015.05.012
Li, S., Chen, L., Zhang, L., Li, X., Liu, Y., Wu, Z., et al. (2015). BnaC9.SMG7b functions as a positive regulator of the number of seeds per silique in Brassica napus by regulating the formation of functional female gametophytes. Plant Physiol. 169 (4), 274–2760. doi: 10.1104/pp.15.01040
Li, H., Li, J., Song, J., Zhao, B., Guo, C., Wang, B., et al. (2019b). An auxin signaling gene BnaA3.IAA7 contributes to improved plant architecture and yield heterosis in rapeseed. New Phytol. 222 (2), 837–851. doi: 10.1111/nph.15632
Li, N., Song, D., Peng, W., Zhan, J., Shi, J., Wang, X., et al. (2019a). Maternal control of seed weight in rapeseed (Brassica napus l.): the causal link between the size of the pod (mother, source) and seed (offspring, sink). Plant Biotechnol. J. 17 (4), 736–749. doi: 10.1111/pbi.13011
Li, N., Xu, R., Li, Y. (2019c). Molecular networks of seed size control in plants. Ann. Rev. Plant Biol. 70, 435–463. doi: 10.1146/annurev-arplant-050718-095851
Lin, Y., Zhou, K., Hu, H., Jiang, X., Yu, S., Wang, Q., et al. (2021). Multi-locus genome-wide association study of four yield-related traits in Chinese wheat landraces. Front. Plant Sci. 12. doi: 10.3389/fpls.2021.665122
Liu, J., Hua, W., Hu, Z., Yang, H., Zhang, L., Li, R., et al. (2015). Natural variation in ARF18 gene simultaneously affects seed weight and silique length in polyploid rapeseed. Proc. Natl. Acad. Sci. U.S.A. 112, E5123–E5132. doi: 10.1073/pnas.1502160112
Liu, S., Zhong, H., Meng, X., Sun, T., Li, Y., Pinson, S., et al. (2020). Genome-wide association studies of ionomic and agronomic traits in USDA mini core collection of rice and comparative analyses of different mapping methods. BMC Plant Biol. 20 (1), 441. doi: 10.1186/s12870-020-02603-0
Livak, K. J., Schmittgen, T. D. (2001). Analysis of relative gene expression data using real-time quantitative PCR and the 2(T)(-delta delta c) method. Methods. 25 (4), 402–408. doi: 10.1006/METH.2001.1262
Love, M. I., Huber, W., Anders, S. (2014). Moderated estimation of fold change and dispersion for RNA-seq data with DESeq2. Genome Biol. 15, 550. doi: 10.1186/s13059-014-0550-8
Lu, K., Peng, L., Zhang, C., Lu, J., Yang, B., Xiao, Z., et al. (2017). Genome-wide association and transcriptome analyses reveal candidate genes underlying yield-determining traits in Brassica napus. Front. Plant Sci. 8. doi: 10.3389/fpls.2017.00206
Lu, K., Wei, L., Li, X., Wang, Y., Wu, J., Liu, M., et al. (2019). Whole-genome resequencing reveals Brassica napus origin and genetic loci involved in its improvement. Nat. Commun. 10 (1), 1154-1163. doi: 10.1038/s41467-019-09134-9
Ma, L., Liu, M., Yan, Y., Qing, C., Zhang, X., Zhang, Y., et al. (2018). Genetic dissection of maize embryonic callus regenerative capacity using multi-locus genome-w de association studies. Front. Plant Sci. 9. doi: 10.3389/fpls.2018.00561
Mathew, I., Das, S., Mahto, A., Agarwal, P. (2016). Three rice NAC transcription factors heteromerize and are associated with seed size. Front. Plant Sci. 7, 1638. doi: 10.3389/fpls.2016.01638
McKenna, A., Hanna, M., Banks, E., Sivachenko, A., Cibulskis, K., Kernytsky, A., et al. (2010). The genome analysis toolkit: a MapReduce framework for analyzing next-generation DNA sequencing data. Genome Res. 20 (9), 1297–1303. doi: 10.1101/gr.107524.110
Misra, G., Badoni, S., Anacleto, R., Graner, A., Alexandrov, N., Sreenivasulu, N. (2017). Whole genome sequencing-based association study to unravel genetic architecture of cooked grain width and length traits in rice. Sci. Rep. 7 (1), 12478. doi: 10.1038/s41598-017-12778-6
Pertea, M., Pertea, G. M., Antonescu, C. M., Chang, T.-C., Mendell, J. T., Salzberg, S. L. (2015). StringTie enables improved reconstruction of a transcriptome from RNA-seq reads. Nat. Biotechnol. 33, 290–295. doi: 10.1038/nbt.3122
Qi, P., Lin, Y., Song, X., Shen, J., Huang, W., Shan, J., et al. (2012). The novel quantitative trait locus GL3.1 controls rice grain size and yield by regulating cyclin-T1;3. Cell Res. 22, 1666–1680. doi: 10.1038/cr.2012.151
Raboanatahiry, N., Chao, H., Dalin, H., Pu, S., Yan, W., Yu, L., et al. (2018). Alignment for seed yield and yield related traits in Brassica napus. Front. Plant Sci. 9, 1127. doi: 10.3389/fpls.2018.01127
Roxrud, I., Lid, S. E., Fletcher, J. C., Schmidt, E. D., Opsahl-Sorteberg, H. G. (2007). GASA4, one of the 14-member Arabidopsis GASA family of small polypeptides, regulates flowering and seed development. Plant Cell Physiol. 48 (3), 471–483. doi: 10.1093/pcp/pcm016
Shi, J., Li, R., Qiu, D., Jiang, C., Long, Y., Morgan, C., et al. (2009). Unraveling the complex trait of crop yield with quantitative trait loci mapping in Brassica napus. Genetics. 182 (3), 851–861. doi: 10.1534/genetics.109.101642
Shi, L., Song, J., Guo, C., Wang, B., Guan, Z., Yang, P., et al. (2019). A CACTA-like transposable element in the upstream region of BnaA9.CYP78A9 acts as an enhancer to increase silique length and seed weight in rapeseed. Plant J. 98 (3), 524–539. doi: 10.1111/tpj.14236
Song, J., Guan, Z., Hu, J., Guo, C., Yang, Z., Wang, S., et al. (2020). Eight high-quality genomes reveal pan-genome architecture and WWecotype differentiation of Brassica napus. Nat. Plants 6 (1), 34–45. doi: 10.1038/s41477-019-0577-7
Sosso, D., Luo, D., Li, Q. B., Sasse, J., Yang, J., Gendrot, G., et al. (2015). Seed filling in domesticated maize and rice depends on SWEET-mediated hexose transport. Nat. Genet. 47, 1489–1493. doi: 10.1038/ng.3422
Tian, T., Liu, Y., Yan, H., You, Q., Yi, X., Du, Z., et al. (2017). agriGO v2.0: a GO analysis toolkit for the agricultural community 2017 update. Nucleic Acids Res. 45, W122–W129. doi: 10.1093/nar/gkx382
Wang, J., Fan, Y., Mao, L., Qu, C., Lu, K., Li, J., et al. (2021a). Genome-wide association study and transcriptome analysis dissect the genetic control of silique length in Brassica napus l. Biotechnol. Biofuels. 14 (1), 214. doi: 10.1186/s13068-021-02064-z
Wang, S. B., Feng, J. Y., Ren, W. L., Huang, B., Zhou, L., Wen, Y. J., et al. (2016). Improving power and accuracy of genome-wide association studies via a multi-locus mixed linear model methodology. Sci. Rep. 6, 19444. doi: 10.1038/srep19444
Wang, Y., Li, N., Zhan, J., Wang, X., Zhou, X., Shi, J., et al. (2022). Genome-wide analysis of the JAZ subfamily of transcription factors and functional verification of BnC08.JAZ1-1 in Brassica napus. Biotechnol. Biofuels Bioprod. 15, 93. doi: 10.1186/s13068-022-02192-0
Wang, S., Liu, S., Wang, J., Yokosho, K., Zhou, B., Yu, Y., et al. (2020). Simultaneous changes in seed size, oil content and protein content driven by selection of SWEET homologues during soybean domestication. Natl. Sci. Rev. 7 (11), 1776–1786. doi: 10.1093/nsr/nwaa110
Wang, H., Wang, Q., Pak, H., Yan, T., Chen, M., Chen, X., et al. (2021b). Genome-wide association study reveals a patatin-like lipase relating to the reduction of seed oil content in Brassica napus. BMC Plant Biol. 21, 6. doi: 10.1186/s12870-020-02774-w
Yoine, M., Nishii, T., Nakamura, K. (2006). Arabidopsis UPF1 RNA helicase for nonsense-mediated mRNA decay is involved in seed size control and is essential for growth. Plant Cell Physiol. 47 (5), 572–580. doi: 10.1093/pcp/pcj035
Zhang, S., Dong, R., Wang, Y., Li, X., Ji, M., Wang, X. (2021). NAC domain gene VvNAC26 interacts with VvMADS9 and influences seed and fruit development. Plant Physiol. Biochem. 164, 63–72. doi: 10.1016/j.plaphy.2021.04.031
Zhang, Y. M., Jia, Z., Dunwell, J. M. (2019). Editorial: The applications of new multi-locus GWAS methodologies in the genetic dissection of complex traits. Front. Plant Sci. 10. doi: 10.3389/fpls.2019.00100
Zhang, Y., Li, P., Zhang, J., Li, Y., Xu, A., Huang, Z. (2022b). Genome-wide association studies of salt tolerance at the seed germination stage and yield-related traits in Brassica napus l. Int. J. Mol. Sci. 23, 15892. doi: 10.3390/ijms232415892
Zhang, K., Liu, S., Li, W., Liu, S., Li, X., Fang, Y., et al. (2018). Identification of QTNs controlling seed protein content in soybean using multi-locus genome-wide association studies. Front. Plant Sci. 9. doi: 10.3389/fpls.2018.01690
Zhang, Y. W., Tamba, C. L., Wen, Y. J., Li, P., Ren, W. L., Ni, Y. L., et al. (2020). mrMLM v4.0.2: An r platform for multi-locus genome-wide association studies. Genomics Proteomics Bioinf. 18 (4), 481–487. doi: 10.1016/j.gpb.2020.06.006
Zhang, R., Zhang, C., Yu, C., Dong, J., Hu, J. H. (2022a). Integration of multi-omics technologies for crop improvement: Status and prospects. Front. Bioinform. 19. doi: 10.3389/fbinf.2022.1027457
Zhao, W., Wang, X., Wang, H., Tian, J., Li, B., Chen, L., et al. (2016). Genome-wide identification of QTL for seed yield and yield-related traits and construction of a high-density consensus map for QTL comparison in Brassica napus. Front. Plant Sci. 7. doi: 10.3389/fpls.2016.00017
Zhong, H., Liu, S., Meng, X., Sun, T., Deng, X., Peng, Z., et al. (2021b). Uncovering the genetic mechanisms regulating panicle architecture in rice with GPWAS and GWAS. BMC Genomics 22, 86. doi: 10.1186/s12864-021-07391-x
Zhong, H., Liu, S., Sun, T., Kong, W., Deng, X., Peng, Z., et al. (2021c). Mulit-locus genome-wide association studies for five yield-related traits in rice. BMC Plant Biol. 21, 364. doi: 10.1186/s12870-021-03146-8
Zhong, H., Liu, S., Zhao, G., Zhang, C., Peng, Z., Wang, Z., et al. (2021a). Genetic diversity relationship between grain quality and appearance in rice. Front. Plant Sci. 12. doi: 10.3389/fpls.2021.708996
Keywords: rapeseed, yield, seed weight, multi-locus GWAS, candidate gene, RNA-seq
Citation: Zhang C, Gong R, Zhong H, Dai C, Zhang R, Dong J, Li Y, Liu S and Hu J (2023) Integrated multi-locus genome-wide association studies and transcriptome analysis for seed yield and yield-related traits in Brassica napus. Front. Plant Sci. 14:1153000. doi: 10.3389/fpls.2023.1153000
Received: 28 January 2023; Accepted: 21 March 2023;
Published: 14 April 2023.
Edited by:
Xiangshu Dong, Yunnan University, ChinaReviewed by:
Kai Zhang, Southwest University, ChinaZhansheng Li, Institute of Vegetables and Flowers (CAAS), China
Xiaonan Li, Shenyang Agricultural University, China
Copyright © 2023 Zhang, Gong, Zhong, Dai, Zhang, Dong, Li, Liu and Hu. This is an open-access article distributed under the terms of the Creative Commons Attribution License (CC BY). The use, distribution or reproduction in other forums is permitted, provided the original author(s) and the copyright owner(s) are credited and that the original publication in this journal is cited, in accordance with accepted academic practice. No use, distribution or reproduction is permitted which does not comply with these terms.
*Correspondence: Jihong Hu, aHVqaDA1QG53YWZ1LmVkdS5jbg==; Shuai Liu, U0xpdUBjYy5oYXdhaWkuZWR1
†These authors have contributed equally to this work