
95% of researchers rate our articles as excellent or good
Learn more about the work of our research integrity team to safeguard the quality of each article we publish.
Find out more
ORIGINAL RESEARCH article
Front. Plant Sci. , 11 July 2023
Sec. Plant Nutrition
Volume 14 - 2023 | https://doi.org/10.3389/fpls.2023.1152817
This article is part of the Research Topic Efficient Nitrogen Fertilizer Management to Improve Crop Production View all 10 articles
 Chuanzong Li1†
 Oluwaseun Olayemi Aluko1,2†Sujuan Shi1,3Zhijie Mo1,4Tongjia Nong1Chuhan Shi1Zhihao Li1,4
 Qian Wang1*Haobao Liu1*
Inherently, ammonium (NH4+) is critical for plant growth; however, its toxicity suppresses potassium (K+) uptake and vice-versa. Hence, attaining a nutritional balance between these two ions (NH4+ and K+) becomes imperative for the growth of tobacco seedlings. Therefore, we conducted a 15-day experimental study on tobacco seedlings exposed to different concentrations (47 treatments) of NH4+/K+ at different corresponding 12 ratios simultaneously in a hydroponic system. Our study aimed at establishing the optimal NH4+-K+ concentration and the corresponding ratio required for optimal growth of different tobacco plant organs during the seedling stage. The controls were the baseline for comparison in this study. Plants with low or excessive NH4+-K+ concentration had leaf chlorosis or dark greenish colouration, stunted whole plant part biomass, and thin roots. We found that adequate K+ supply is a pragmatic way to mitigate NH4+-induced toxicity in tobacco plants. The optimal growth for tobacco leaf and root was attained at NH4+-K+ concentrations 2-2 mM (ratio 1:1), whereas stem growth was optimal at NH4+-K+ 1-2 mM (1:2). The study provided an insight into the right combination of NH4+/K+ that could mitigate or prevent NH4+ or K+ stress in the tobacco seedlings.
Ammonium (NH4+) is a predominant form of nitrogen (N) that supports plant growth, especially when furnished with an adequate amount of nitrate (NO3-) (Dubey et al., 2021; Vu et al., 2021; Zhu et al., 2021; Ninkuu et al., 2023). Compared to sole NO3- or NH4+, crop growth and yield peaks when NH4+ and NO3- are appropriately combined in growth medium (Liang et al., 2022; Saloner and Bernstein, 2022; Xiao et al., 2023). However, compelling evidence has shown that excessive or sole application of NH4+ could negate plant growth and yield potentials, causing leaf chlorosis, stunted growth, and other major crop physiological disorder (Britto and Kronzucker, 2002; Guo et al., 2019; Aluko et al., 2021; Katz et al., 2022). Over time, the mechanisms underlying NH4+ toxicity in plants have been debatable, with much speculations accrued to the displacement of cytosolic cations, including K+ (Walch-Liu et al., 2000; Guo et al., 2019).
Given that, the interactive effects of K+ and NH4+ on plant growth and development became a focus of research (Witold et al., 2017; Shi et al., 2020a; Nawarathna et al., 2021; Aluko et al., 2022; Xiao et al., 2023). Excessive NH4+ was found to limit growth and yield by reducing K+ uptake and influx in wheat (Kong et al., 2014), Arabidopsis (Walch-Liu et al., 2000), rice (Szczerba et al., 2008) and tobacco (Lu et al., 2005). Research has shown the potency of potassium in alleviating NH4+ toxicity symptoms in these crops. (Chen et al., 2021; Fang et al., 2021). Recently, Guo et al. (2019) reported a marked increase in the growth, nutrient uptake, and yield (improved panicle biomass production) when K+ concentration was supplied to high NH4+- induced wheat, demonstrating the positive impact of K+ in offsetting NH4+ stress in plants. Moreover, excessive application of K+ could hinder the uptake of NH4+, resulting to a competition in the uptake of both essential ions (K+ and NH4+) (Balkos et al., 2010). Disruption in the uptake of either of these two cations limit plant growth potentials. Despite the promising results of K+ ameliorative effects on NH4+, it is yet unknown the appropriate amount of NH4+ and K+ required for optimal yield, knowledge of which is important given the increasing NH4+ toxicity symptoms in plants. Hence, an in-depth understanding of a nutritional balance between NH4+ and K+ becomes expedient.
Tobacco plants require an adequate supply of K+ for improved growth and quality (Borges et al., 2012). Similarly, supply of NH4+ further promote growth, but becomes toxic if excessive. However, the issue of nutritional imbalances between K+ and NH4+ poses a great challenge to adopting a hydroponic system for tobacco cultivation. Hence, it becomes imperative to understand the appropriate NH4+/K+ concentration and the corresponding ratio required for the growth of tobacco. Research-based information on the basic NH4+/K+ concentration and corresponding ratio required for optimal growth of tobacco under a hydroponic system is still lacking. Moreover, little is known about the influence of increasing NH4+ and K+ supplies on the physiological growth of tobacco plants. Hence, an in-depth understanding of tobacco’s optimum NH4+- K+ concentration range is required to furnish hydroponic farmers with reliable information on the best NH4+/K+ combination to attain optimum growth output. This study aimed to investigate the effects of different levels of NH4+- K+ concentration on the growth of tobacco seedlings, and also critically evaluate and determine the optimal NH4+ - K+ concentration, and corresponding ratio that is required for the growth of different parts of tobacco seedlings.
The experiment was conducted in a controlled plant growth culture room at Tobacco Research Institute, Chinese Academy of Agricultural Sciences (TR1,CAAS), Qingdao, China. All methods used in this study were performed in accordance with the relevant guidelines and regulations. The seed of Nicotiana tabacum used in the present study was Zhongyan 100 (ZY100). ZY100 developed in TR1CAAS passed the variety approval in 2002. Tobacco seeds were initially sown in a potting soil mixture (soil/perlite, 3:1 v/v) under controlled conditions (continuous light at 24°C). At the three-leaf stage, uniformly grown seedlings were transferred into hydroponic pots (48 cm x 22.5 cm x 3.5 cm) with 2 liters of nutrient solution (one-fifth-strength Hoagland solution, 1/5 HS) for 6 days. The 1/5 HS, which was supplemented with 1mM K+ (K2SO4 is the K+ source) had the following composition in mM: 0.35 MgSO4, 0.2 NaH2PO4, 0.0125 H3BO3, 0.001 MnSO4, 0.0005 CuSO4, 0.001 ZnSO4, 0.0001 Na2MoO4, 0.01 Fe-EDTA, 1.4 Ca (NO3)2, 0.15 CaCl2. NH4+ was sourced from (NH4)2SO4.
After six days, tobacco seedlings with the same growth potential were transferred into another hydroponic container (26 cm x 17.5 cm x 8 cm) of 1/5 HS. NH4+ and K+ were supplied depending on the designated NH4+- K+ concentration in each treatment group. Seedlings were held in place by the conventional tip and grown at 24°C. The experiment was sectioned into two NH4+/K+ categories. The first category was fractioned into increasing NH4+ at constant K+, comprising 7 ratio, while the other, constant NH4+/increasing K+ had 5 ratios, giving 12 ratios in total. The 12 NH4+: K+ ratios comprise 45 different NH4+-K+ concentrations, and two additional controls (positive and negative control), bringing the total to 47 different NH4+-K+ concentrations (for composition; refer to Table 1). While the nutrient solution of the negative control was neither supplied with K+ nor NH4+, the medium with the positive control was supplemented with 1 mM K+ but no NH4+ supply. Tobacco seedlings were exposed to varying concentrations (47 treatments) of NH4+/K+ at different corresponding 12 ratios concurrently in a hydroponic system for 15 days. The nutrient solution was renewed every two days to ensure a steady nutritional state for tobacco seedlings. The solution pH was maintained between 5.6 and 6.0. The placements of the hydroponic pots were interchanged to avoid edge effects.
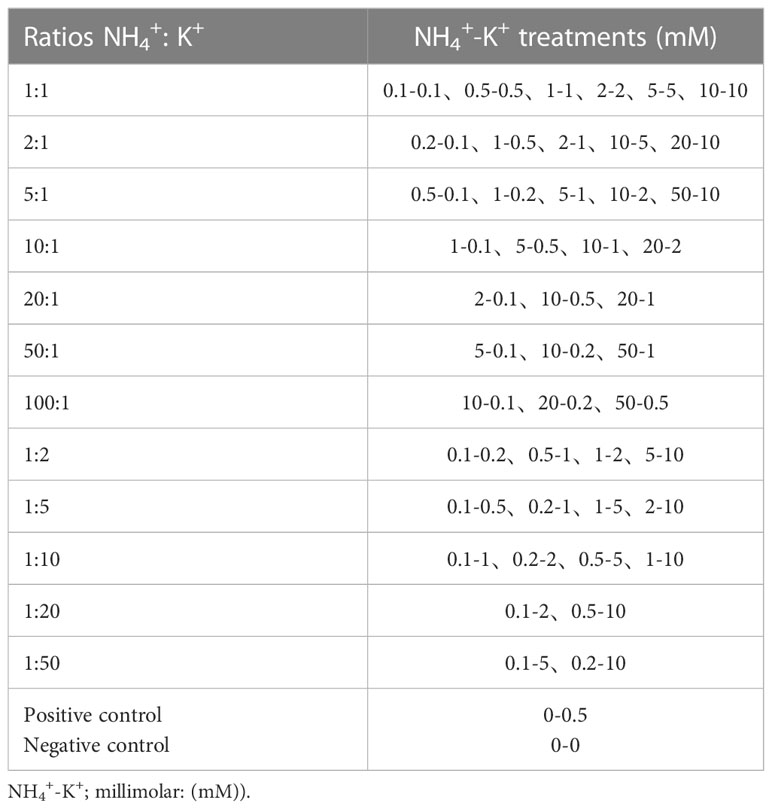
Table 1 NH4+/K+ concentrations with their corresponding ratios.
We had a pre-experimental trial, with the plants exceeding 15 days of NH4+- K+ treatments. when plants exceeded the 15th day, tobacco wilting and overall death were observed due to the excessive supply of NH4+ or K+ to some of the treated samples. As such, some samples were not available for phenotype analysis. Therefore, we considered sampling the tobacco seedlings at 15 days after treatment for thorough evaluation of the physiological parameters.
. After 15 days of treatment, tobacco seedlings were harvested for leaf, stem, and root growth, NH4+ and K+ content, and root activity analysis.
At harvest, uniformly grown seedlings from each treatment were fractioned into; (i) leaves, (ii) stems, and (iii) roots. Photos of different plant parts were taken with a camera. Subsequently, leaf and root surface area were determined using the ImageJ software (https://imagej.en.softonic.com/ ). Primary root length and stem length were measured with a scaling ruler. Plant root was carefully rinsed once with 10 mM CaSO4 and twice in double-distilled water (Szczerba et al., 2008), and then fresh weights of leaves, stems, and roots of plants were measured. The dry weights of the measured samples were taken after oven-drying at 110°C for 30 min and then 80 °C to a constant weight. The dry samples were crushed into fine powders with the mortar and pestle for K+ concentrations determination.
To measure K+ content, approximately 0.01 g of ground leaves, stems, and roots samples were weighed and digested in 8 ml 0.5 M HCl. The suspension was homogenized at 25°C, 100-150 rpm for 1hr and filtered into a new centrifuge tube. The aliquot of the filtrate was used for K+ determination by flame photometry (6400A) (Shi et al., 2020a). The reading obtained was used to calculate K+ concentrations in plant tissue as follows:
K+ (mmol g-1 DW) = ((A/M) * V *Dilution multiples*0.001)/m
where A = calculated concentration according to the readings on the standard curve (µg·ml-1)
M = relative molecular mass of K+
V = reading volume (ml)
m = dry weight (g)
For NH4+ content measurement, the freshly harvested plant was separated into different plant parts (leaves, stems, and roots). The root was washed with 10mM CaSO4 to eliminate any extracellular NH4+ (Szczerba et al., 2008). Fresh plant tissues of ≤ 0.5 g were homogenized under liquid nitrogen, and 6 ml of 10 mM formic acid was added to extract NH4+. The suspension was allowed to sit for 5 minutes and then centrifuged at 4°C and 12000 rpm for 10 minutes. The supernatant was centrifuged repeatedly 3 times. The supernatant obtained from the last centrifugation step was diluted with 2.5 ml o-phthalaldehyde (OPA) solution as previously described (Shi et al., 2020a). The absorbance of the sample was measured at 410 nm using a spectrophotometer (UV-7502PC, AOE Instruments). The reading obtained was used to calculate NH4+ concentrations in plant tissue as follows:
NH4+ (µmol g-1 FW) = ((A/M) * V * Dilution multiples)/m
where A = calculated concentration according to the readings on the standard curve (µg ml-1)
M = relative molecular mass of NH4+;
V = reading volume (ml)
m = fresh weight (g).
After 15 days of NH4+/K+ treatment, chlorophyll content was measured according to the previous method (Dong et al., 2015). The fourth leaf of each treatment was weighed (0.2 g) and incubated in 95% ethyl alcohol until the leaf strands became completely pale (approximately 48 hours). The absorbance of the extract was measured at 665 nm and 649 nm using a spectrophotometer.
Root activity was measured as described previously (Liu et al., 2008) using triphenyl tetrazolium chloride (TTC) method. Approximately 0.5 grams of freshly weighed root was fully immersed into 5 ml 0.4% TTC and phosphate buffer (adjusted to pH 7.0) and incubated at 37 °C for 3 hours to accelerate the reduction of TTC to triphenyl formazan (TTF). The resulting chemical reaction was halted by adding 2 ml of 1 mol/L sulphuric acid into each tube. Subsequently, the roots were moved out of the tubes, gently patted with tissue paper, and then crushed with 3-4 ml ethyl acetate. The liquid portion was removed into a new tube and made up to 10 ml with ethyl acetate. The absorbance was measured at 485 nm wavelength using spectrometer UV-7502PC, AOE Instruments). The OD values were expressed as mg TTF/(g·h).
Data was analyzed using the IBM SPSS Statistics 23 software. Variations among treatments were examined by one-way ANOVA, and means were compared using Duncan’s multiple range tests at P<0.05. All graphs were drawn using GraphPad Prism 6.0. The correlation analysis was performed using pearson correlation in R studio. ns: no significance difference; *p < 0.05; **p < 0.01; ***p < 0.001.
The observed results showed the influence of NH4+-K+ concentrations on fresh leaf weight (Figure 1). There were variations within treatments in all NH4+: K+ ratios. Within each of the increasing NH4+: constant K+ ratios, fresh leaf weight increases with increasing NH4+ -increasing K+ concentration until a point was reached where further increase led to a gradual reduction. NH4+-K+ millimolar concentration 2-2 mM (within1:1), 2-1 mM (within 2:1) and 5-1 mM (within 5:1) had the highest weight, with 57.7%, 21.7% and 6.5% increase in fresh leaf weight, respectively, compared with the positive control (0.5 mM K+, without NH4+). NH4+-K+ concentrations 0.1-0.1 mM, 0.2-0.1 mM and 50-10 mM had the lowest leaf weight following the same ratio pattern above. The fresh leaf weight of 0.5-0.5 mM at ratio 1:1 was also significantly lower than the positive control (0 mM NH4+- 0.5 mM K+) but higher than the negative control (no NH4+- K+). The leaf weight of the positive control was substantially higher than all the NH4+-K+ concentrations at ratios 2:1 and 5:1, with the exemption of 2-1 mM (2:1) and 5-1 mM (5:1). Compared with other concentrations within ratios 10:1, 20:1, 50:1, and 100:1, the positive control (0.5 mM K+, without NH4+) had the highest leaf weight. In fact, 50-1 mM (50:1) and 50-0.5 mM (100:1) were either insignificant or 75.2% lower than the negative control (without NH4+ and K+). When NH4+ was kept constant (at 1) at an increasing K+ ratio, the leaf fresh weight of NH4+: K+ ratios 1:2, 1:5, and 1:20 increased with increasing NH4+/K+ millimolar concentration, albeit concentrations at ratios 1:10 and 1:50 were exceptions to this. Following the same ratio pattern, the leaf weight of NH4+-K+ concentrations was substantially higher than both controls. Yet, the leaf weight of lower treatments such as 0.1-0.2 mM (1:2) and 0.1-0.5 mM (1:5) was drastically reduced by 47.1% and 15.2% compared with the positive control. With the exemption of 5-10 mM, all other treated concentrations under increasing K+ ratios had considerably lower leaf weight values relative to 2-2 mM (1:1). NH4+-K+ 5-10 mM (within a 1:2 ratio) had the highest leaf weight; however, when compared with 2-2 mM (within ratio 1:1; which was the highest under increasing NH4+/constant K (1)), 5-10 mM was higher, although at a small difference of 2.9%.
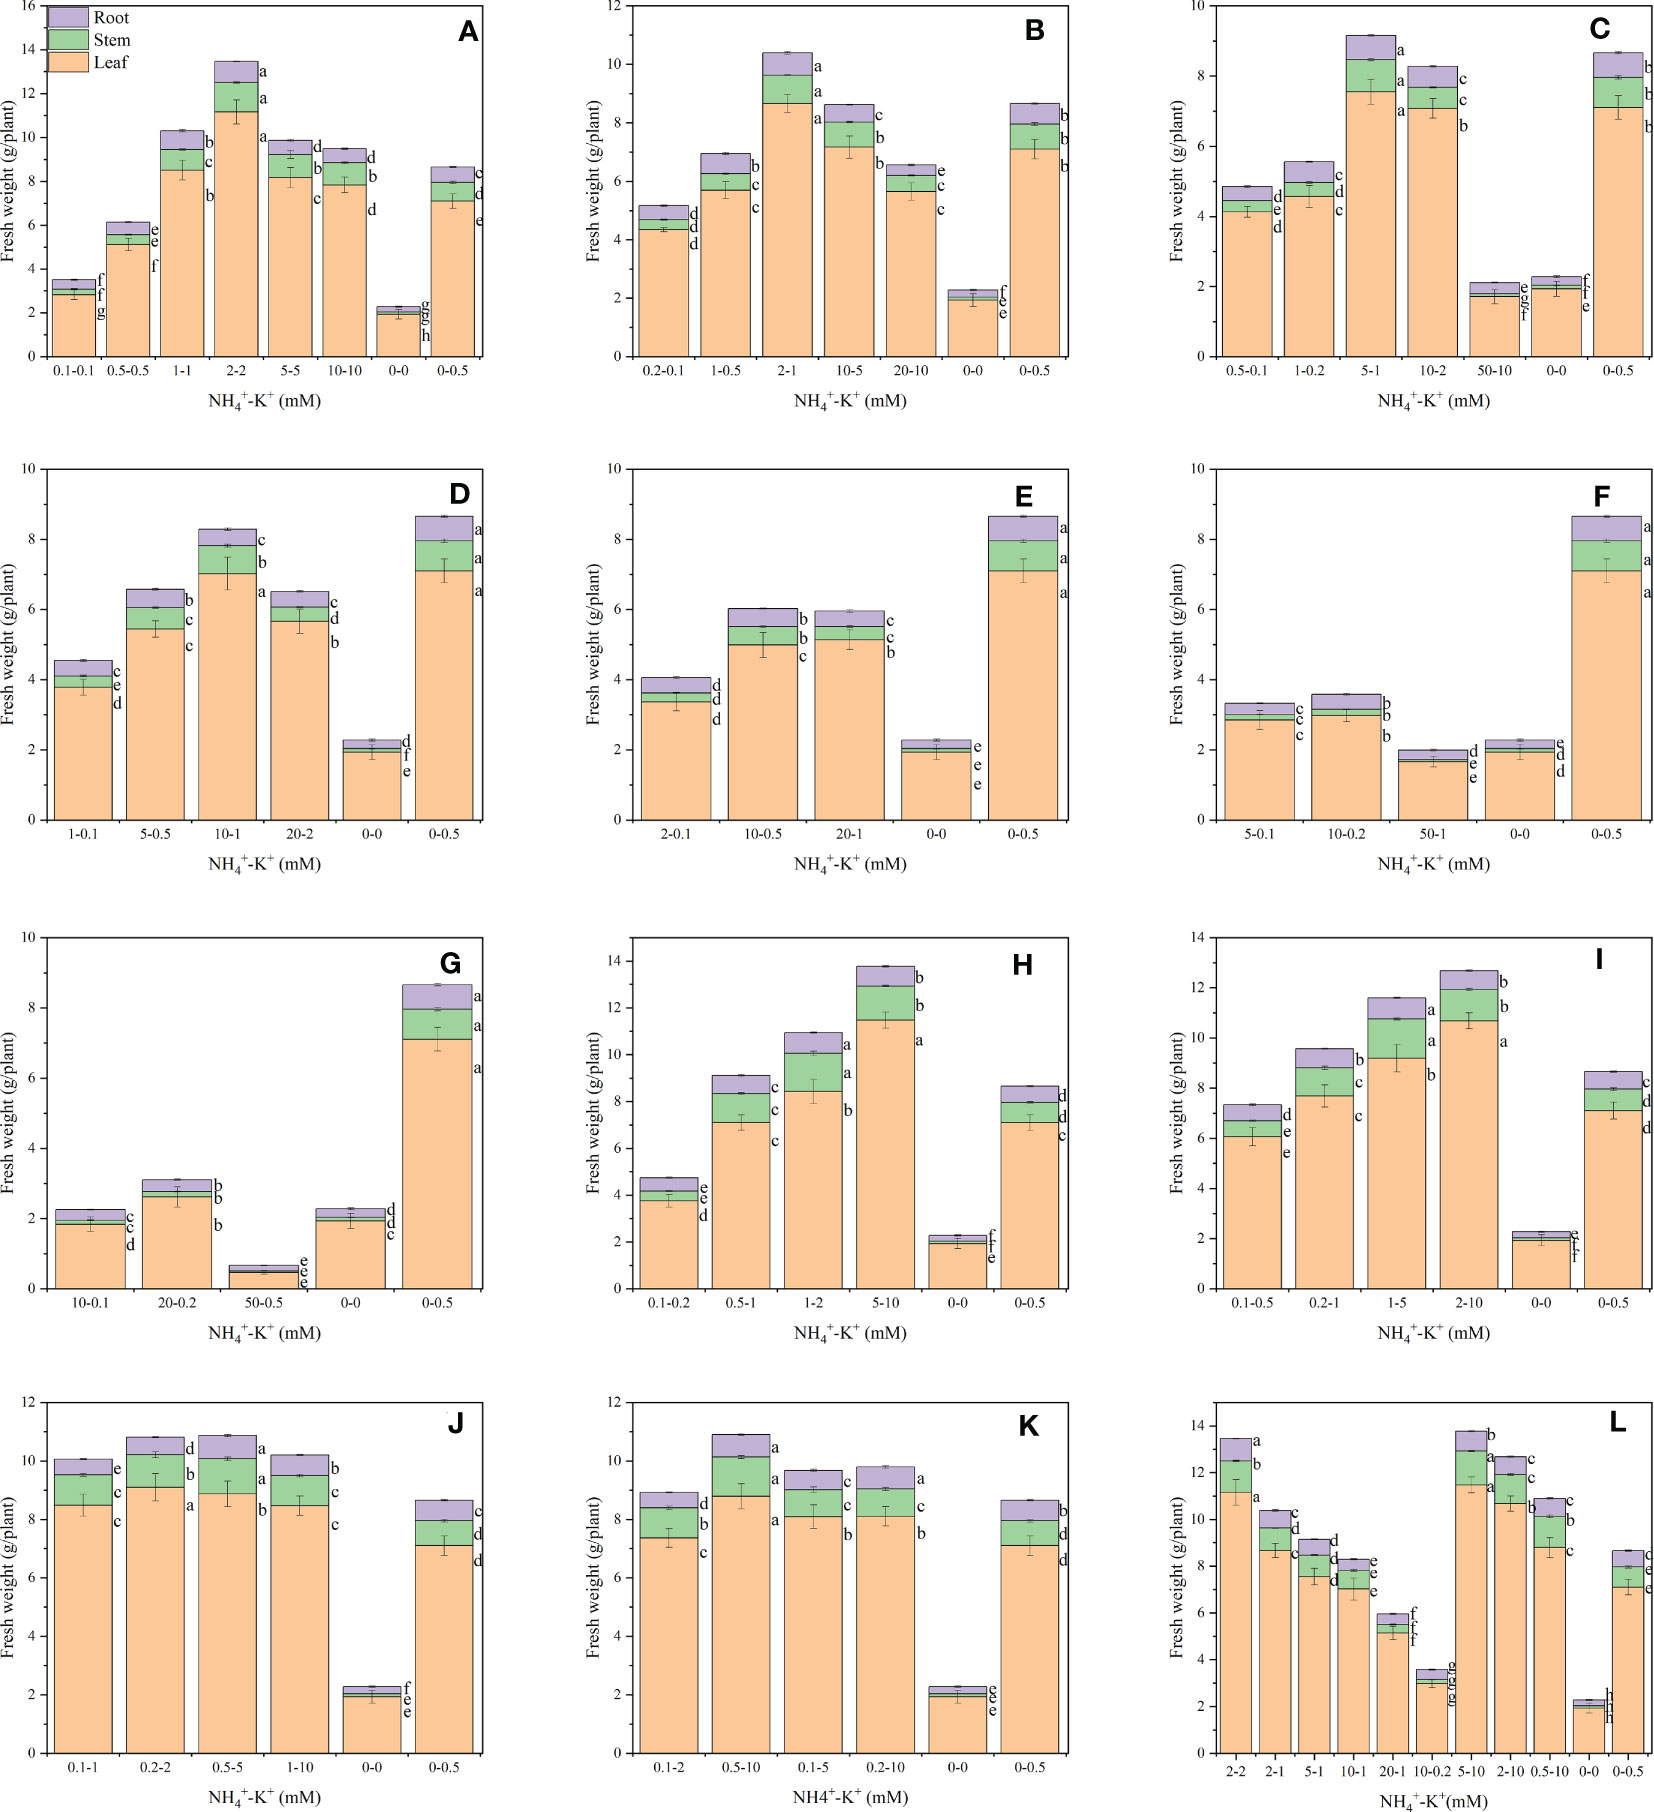
Figure 1 Fresh leaf weight (FLW), fresh stem weight (FSW), and fresh root weight (FRW) of tobacco plants as affected by different NH4+: K+ ratios. Graphs (A–G) represent NH4+-K+ concentrations at increasing NH4+/constant K+ (at 1) ratios. (A) NH4+: K+ ratio 1:1, (B) 2:1, (C) 5:1, (D) 10:1, (E) 20:1, (F) 50:1, and (G) 100:1. Graphs (H-K) indicate NH4+-K+ concentrations at constant NH4+ (at 1)/increasing K+ ratio. (H) NH4+: K+ ratio 1:2, (I) 1:5, (J) 1:10, (K) 1:20 (0.1-2 mM and 0.5-10 mM) and 1:50 (0.1-5 mM and 0.2-10 mM), (L) comparison of NH4+-K+ concentration within each ratio. All the NH4+-K+ concentration within each ratio were compared with the positive (without NH4+, but with K+).and negative control (without NH4+ and K+). Fresh weights were determined 15 days after treatment. Letters represent the mean values ± SD (n=15 biological replicates). The bars without letters have extremely low mean values.
NH4+-K+ concentrations at different ratios also significantly affected the leaf K+ content (Figure 2). Within each of the increasing NH4+: constant K+ ratios, leaf K+ content increases with increasing NH4+- increasing K+ concentration until a point is reached where further increase results in a gradual reduction. The leaf K+ content of 2-2 mM, 2-1 mM,10-2 mM at ratios 1:1, 2:1 and 5:1, respectively, were increased by 69.7%, 31.7% and 19.6% respectively, when compared with the positive control. Also, the leaf K+ contents were reduced at lower NH4+-K+ concentration 0.1-0.1 mM (1:1), 0.2-0.1 mM and 1-0.5 mM (2:1) relative to the positive control. At ratios 5:1, the leaf K+ content of the positive control was significantly higher than all other treated concentrations, except 5-1 mM. All other concentrations at ratios 10:1, 20:1, 50:1, and 100:1 exhibit reduced K+ contents compared with the positive control. When K+ was increased at constant NH4+ (1), K+ content increased with increasing NH4+-K+ millimolar concentration, irrespective of the controls (positive and negative). At such increasing K+ ratios, only the leaf K+ content of the lower concentration, 0.1-0.2 (1:2) and 0.1-0.5 (1:5), were reduced relative to the positive control; other NH4+-K+ treatments within these ratios were higher. Comparing the highest at both ends (constant NH4+/increasing K+ and increasing NH4+/constant K+ ratios), 0.5-10 mM (1:20) had the highest, and the leaf K+ content was approximately 1% higher than 2-2 mM (1:1; under increasing NH4+ and constant K+).
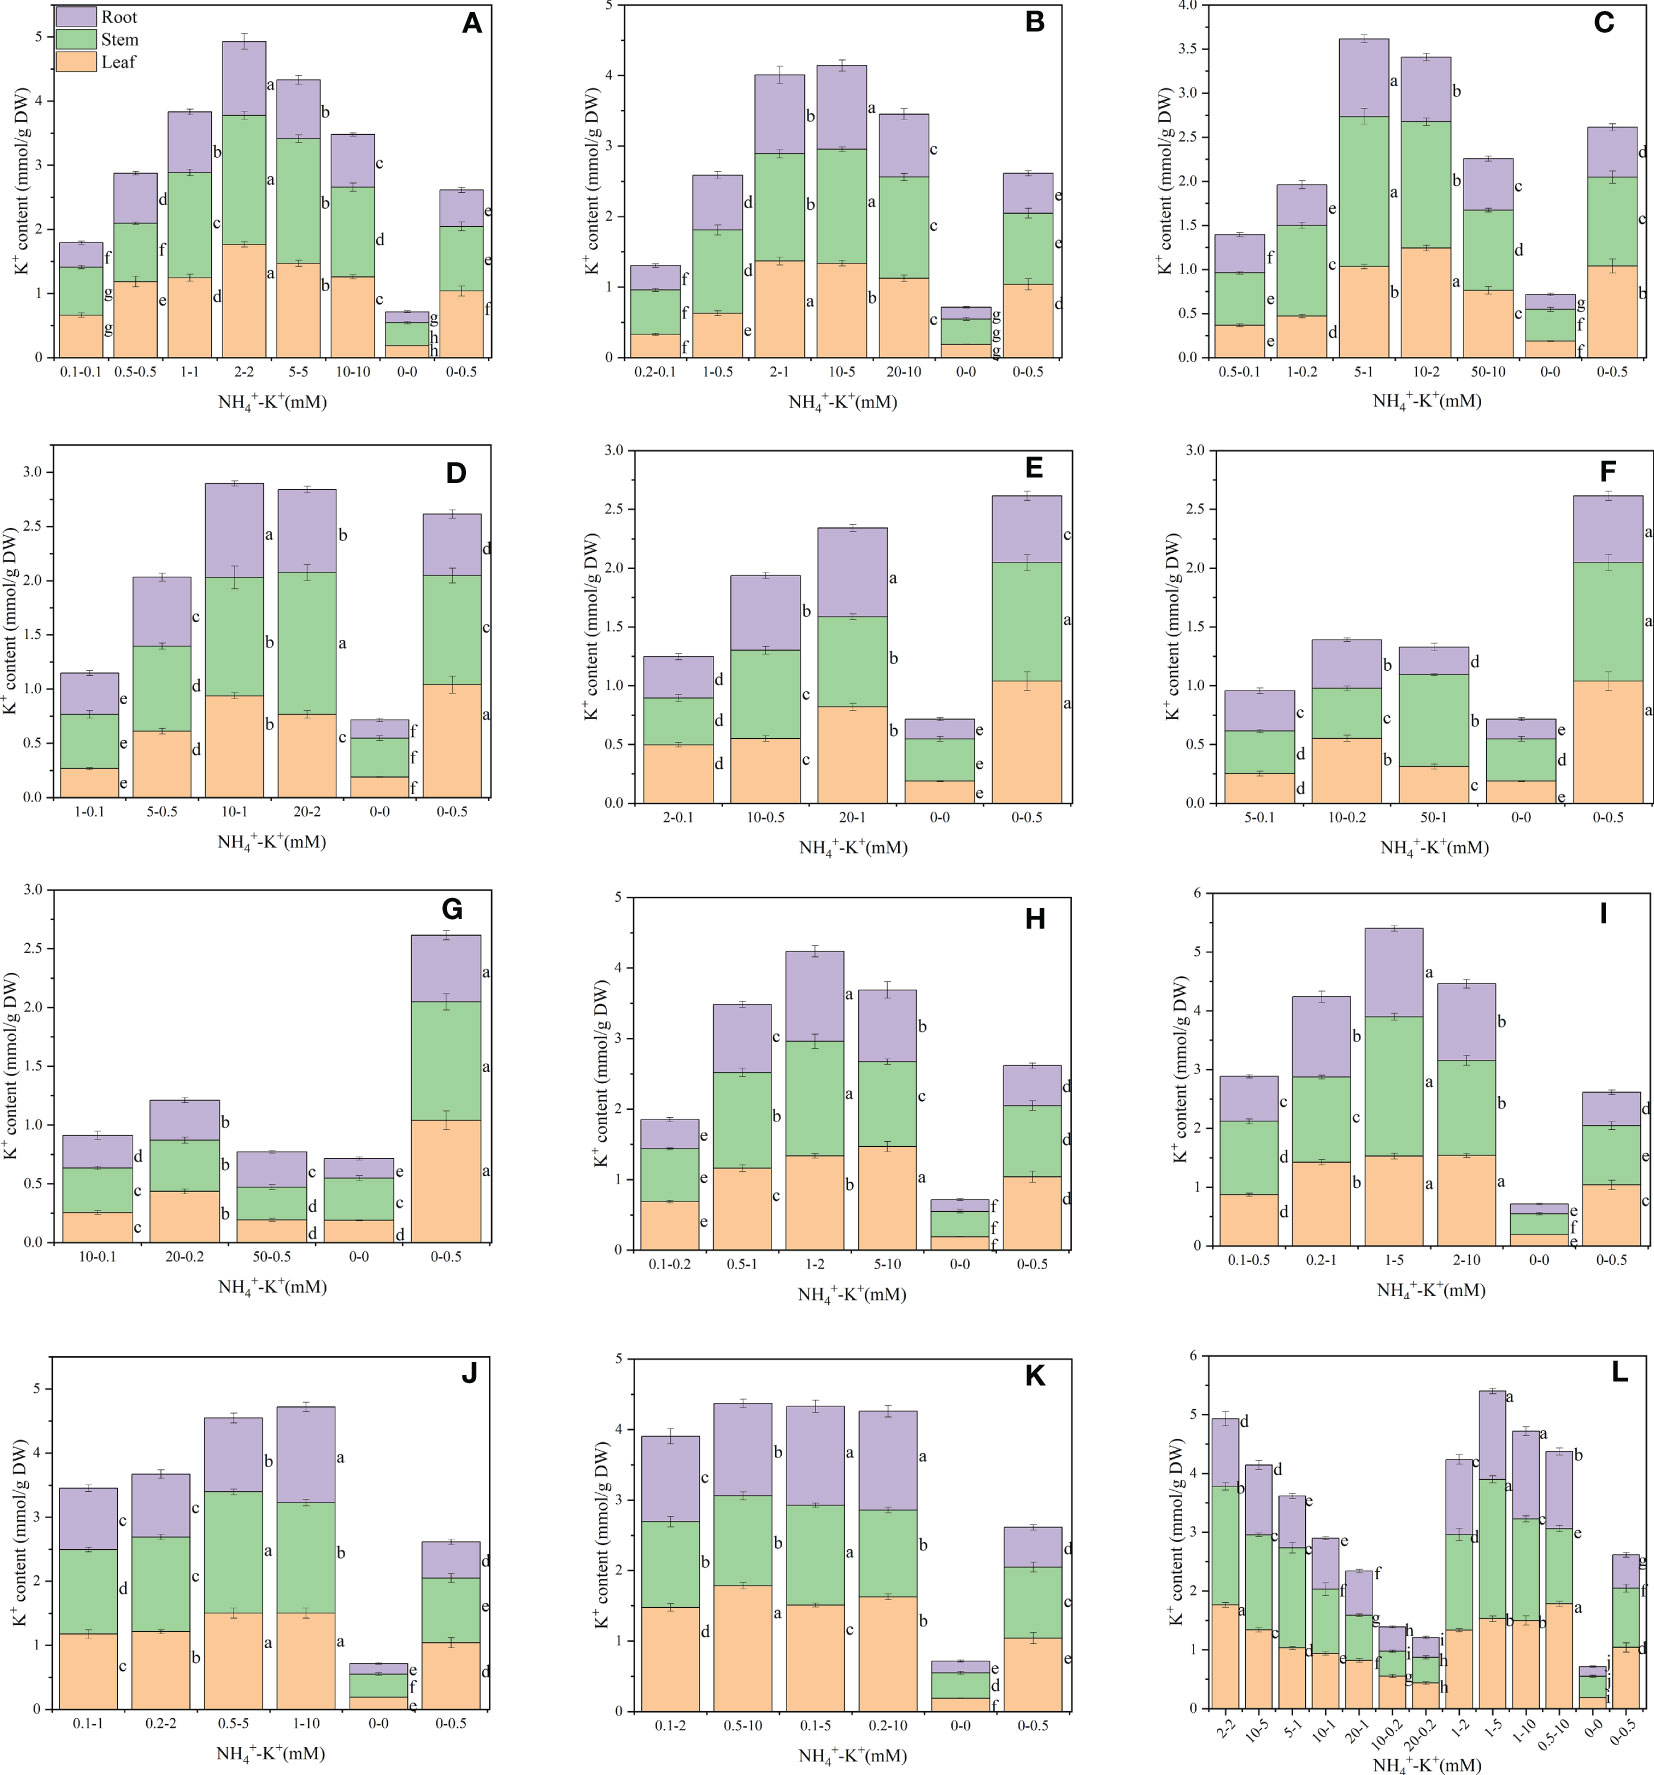
Figure 2 Potassium (K+) contents in the leaf (LKC), stem (SKC) and root (RKC) of tobacco subjected to different NH4+: K+ ratios. Graphs (A-G) represent NH4+- K+ concentrations at increasing NH4+/constant K+ (at 1) ratios. (A) NH4+: K+ ratio 1:1, (B) 2:1, (C) 5:1, (D) 10:1, (E) 20:1, (F) 50:1, and (G) 100:1. Graphs (H-K) connote NH4+- K+ concentrations at constant NH4+ (at 1)/increasing K+ ratio. (H) NH4+: K+ ratio 1:2, (I) 1:5, (J) 1:10, (K) 1:20 (0.1-2 mM and 0.5-10 mM) and 1:50 (0.1-5 mM and 0.2-10 mM) (L) comparison of NH4+-K+ concentration within each ratio. All the NH4+- K+ concentration within each ratio were compared with the positive (without NH4+, but with K+).and negative control (without NH4+ and K+). K+ content was measured 15 days after treatment. Letters represent the mean values + SD (n= 12 biological replicates).
Leaf NH4+ content was determined to evaluate the optimal NH4+-K+ concentration required for the growth of tobacco seedlings. There were variations among concentrations at different ratios. At ratios 1:1, 2:1 and 5:1, leaf NH4+ content increases with increasing NH4+-K+ millimolar concentration until a point was reached where a notable decrease in NH4+ content was observed (NH4+-K+ 2-2Mm (ratio 1:1); 2-1mM (2:1); 1-0.2mM (5:1). A further increase in NH4+-K+ millimolar concentration resulted in a surge in leaf NH4+ content. However, at ratios 10:1,20:1, 50:1 and 100:1, a steady rise in leaf NH4+ content was observed with increasing NH4+-K+ concentration. The concentrations within these ratios were significantly lower than the positive control (0-0.5 mM) (Figure 3). Compared to the treated concentration at a constant NH4+/increasing K+ ratio, treatments without NH4+ and K+ (negative control) had the highest leaf NH4+ content. In all, the leaf NH4+ content was highest at NH4+-K+ concentration 50-1 mM (72.7 µmol/g FW).
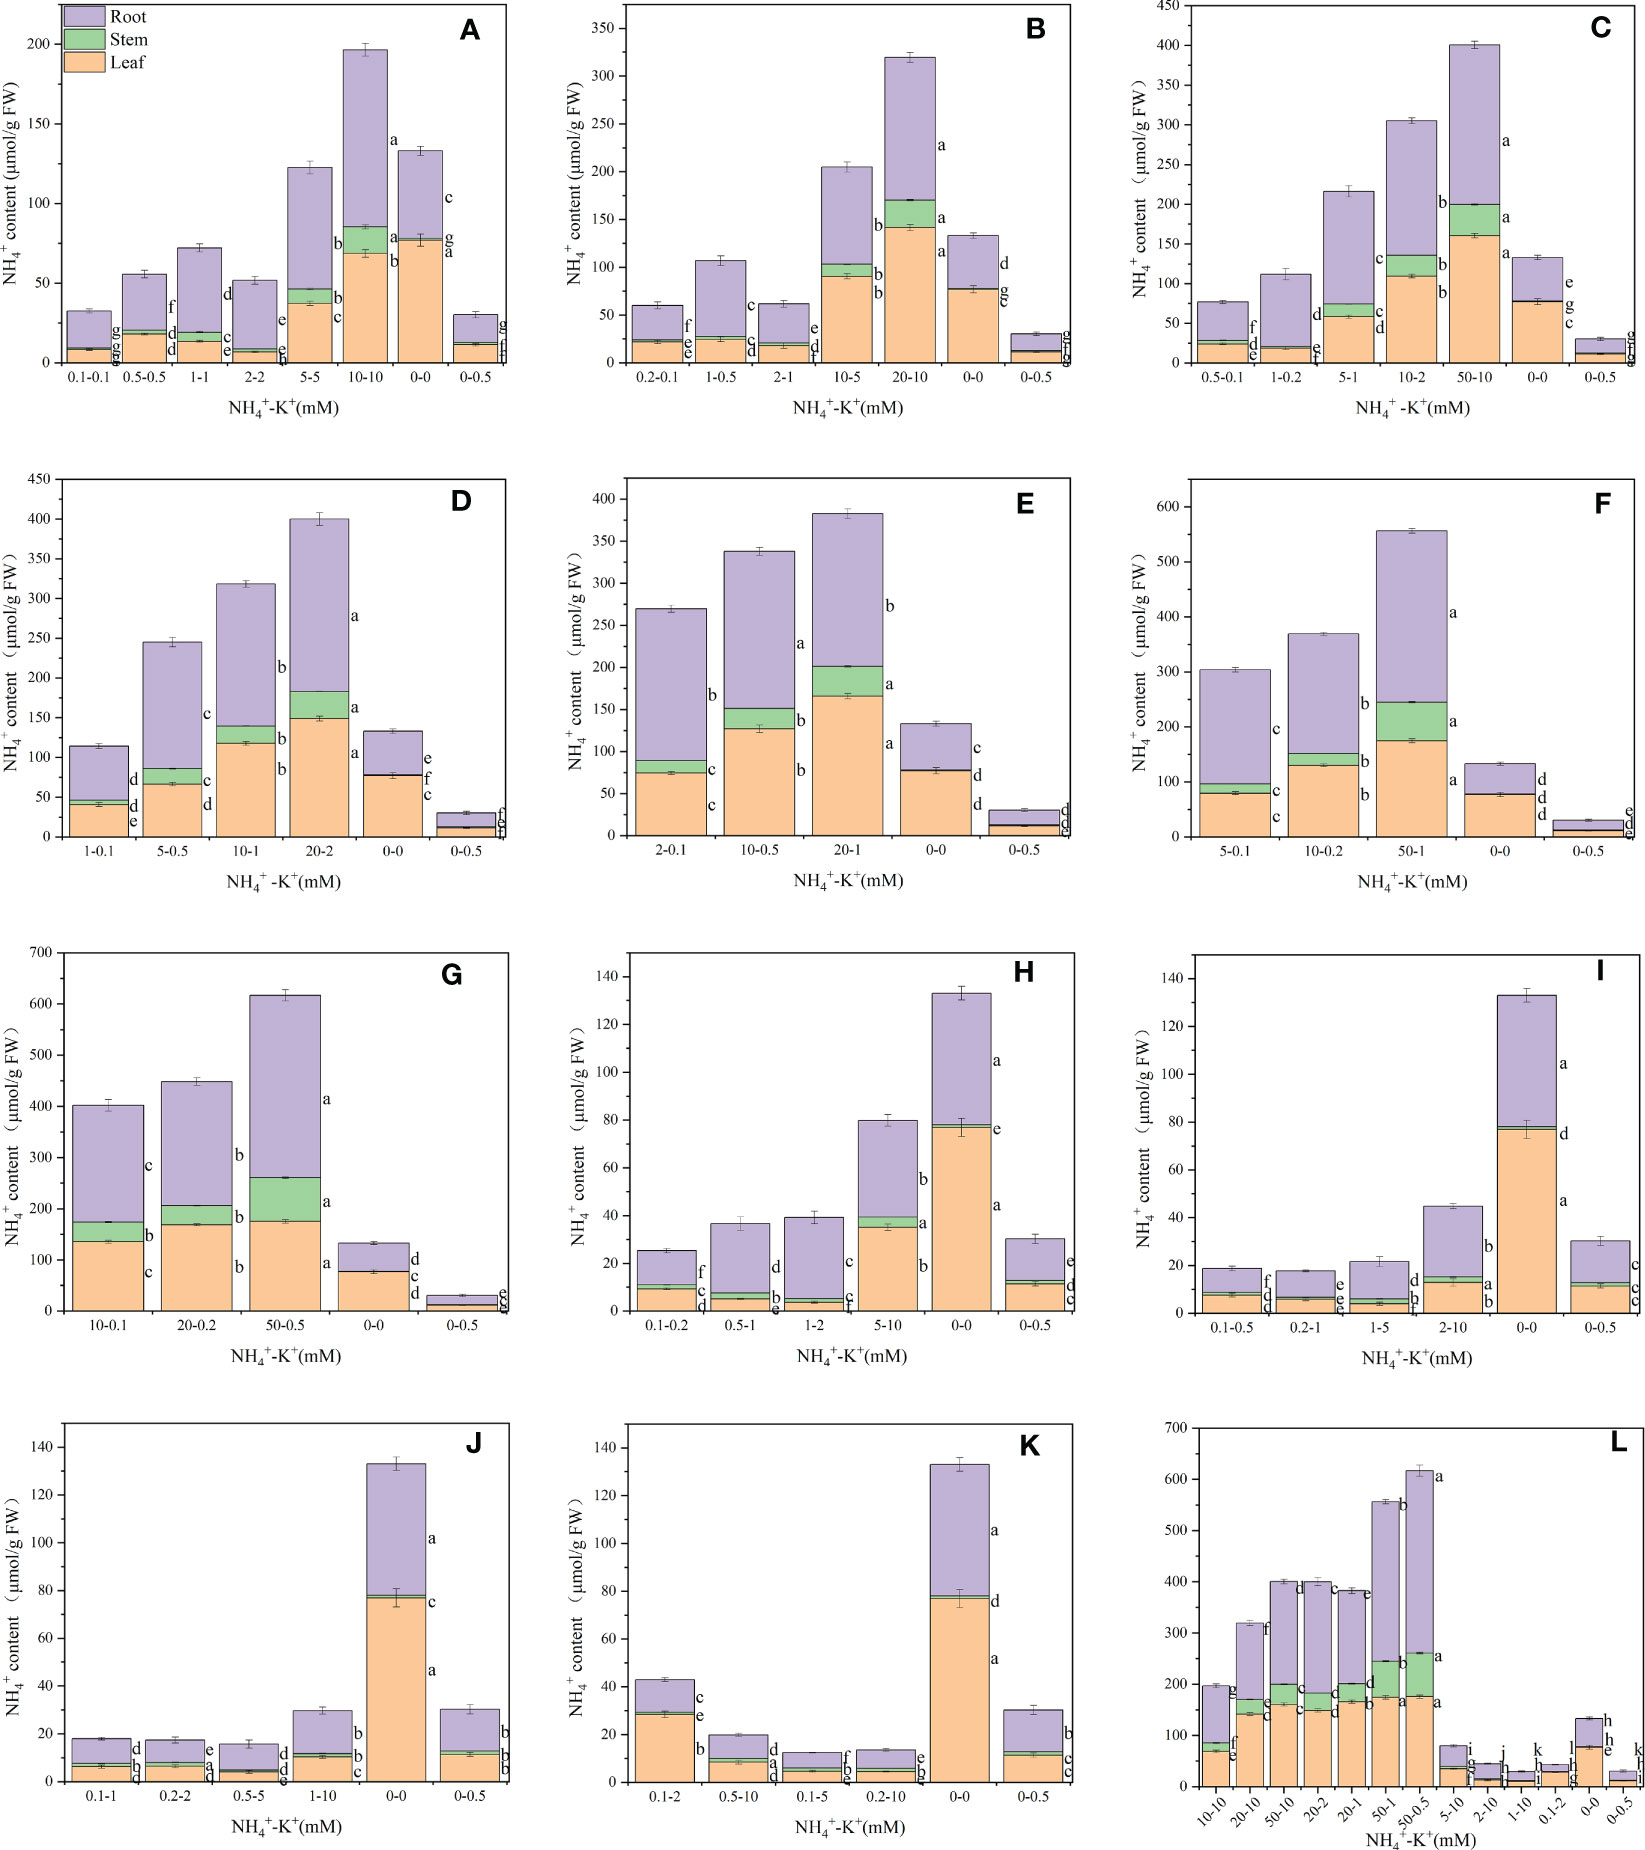
Figure 3 Ammonium (NH4+) contents in the leaf, stem and root of tobacco subjected to different NH4+: K+ ratios. Graphs (A-G) represent increasing NH4+ at constant K+ (at 1) ratios. (A) NH4+: K+ ratio 1:1, (B) 2:1, (C) 5:1, (D) 10:1, (E) 20:1, (F) 50:1, and (G) 100:1. Graphs (H–K) connote constant NH4+ (at 1) at increasing K+ ratio. (H) NH4+: K+ ratio 1:2, (I) 1:5, (J) 1:10, (K) 1:20 (0.1-2 mM and 0.5-10 mM) and 1:50 (0.1-5 mM and 0.2-10 mM) (L) comparison of NH4+-K+ concentration within each ratio. All the NH4+- K+ concentration within each ratio were compared with the positive (without NH4+, but with K+).and negative control (without NH4+ and K+). NH4+ content was measured 15 days after treatment. Letters represent the mean values + SD (n= 9 biological replicates). The bars without letters have extremely low mean values.
There were significant differences in the leaf area of tobacco seedlings exposed to varying NH4+-K+ concentrations, as presented in Figure 4. Within each of the increasing NH4+/constant K+ (1) ratios (irrespective of both controls), leaf area increases with increasing NH4+-K+ millimolar concentration until a point is reached where further increase led to a gradual reduction in leaf area. Following the same ratio pattern, leaf area peaks at concentration 2-2 mM (1:1), followed by 2-1 mM (2:1), 5-1 mM (5:1), and 10-1 mM (10:1), but was significantly reduced at ratios 20:1, 50:1 and 100:1 compared with the positive control (Figure 4). However, at constant NH4+/increasing K+, a direct relationship was observed between the treated concentrations and leaf area; leaf area increases as NH4+/K+ concentration increases. With the exemption of 0.1-0.2 mM (1:2), the leaf area of all other treated concentrations was significantly increased relative to the positive control. In all, leaf area of concentrations 5-10 mM (1:2) and 2-10 mM (1:5) were substantially increased by 10.5% and 6.1% relative to 2-2 mM (1:1; with the highest leaf area under increasing NH4+/constant K+) while the negative control had the lowest leaf area.
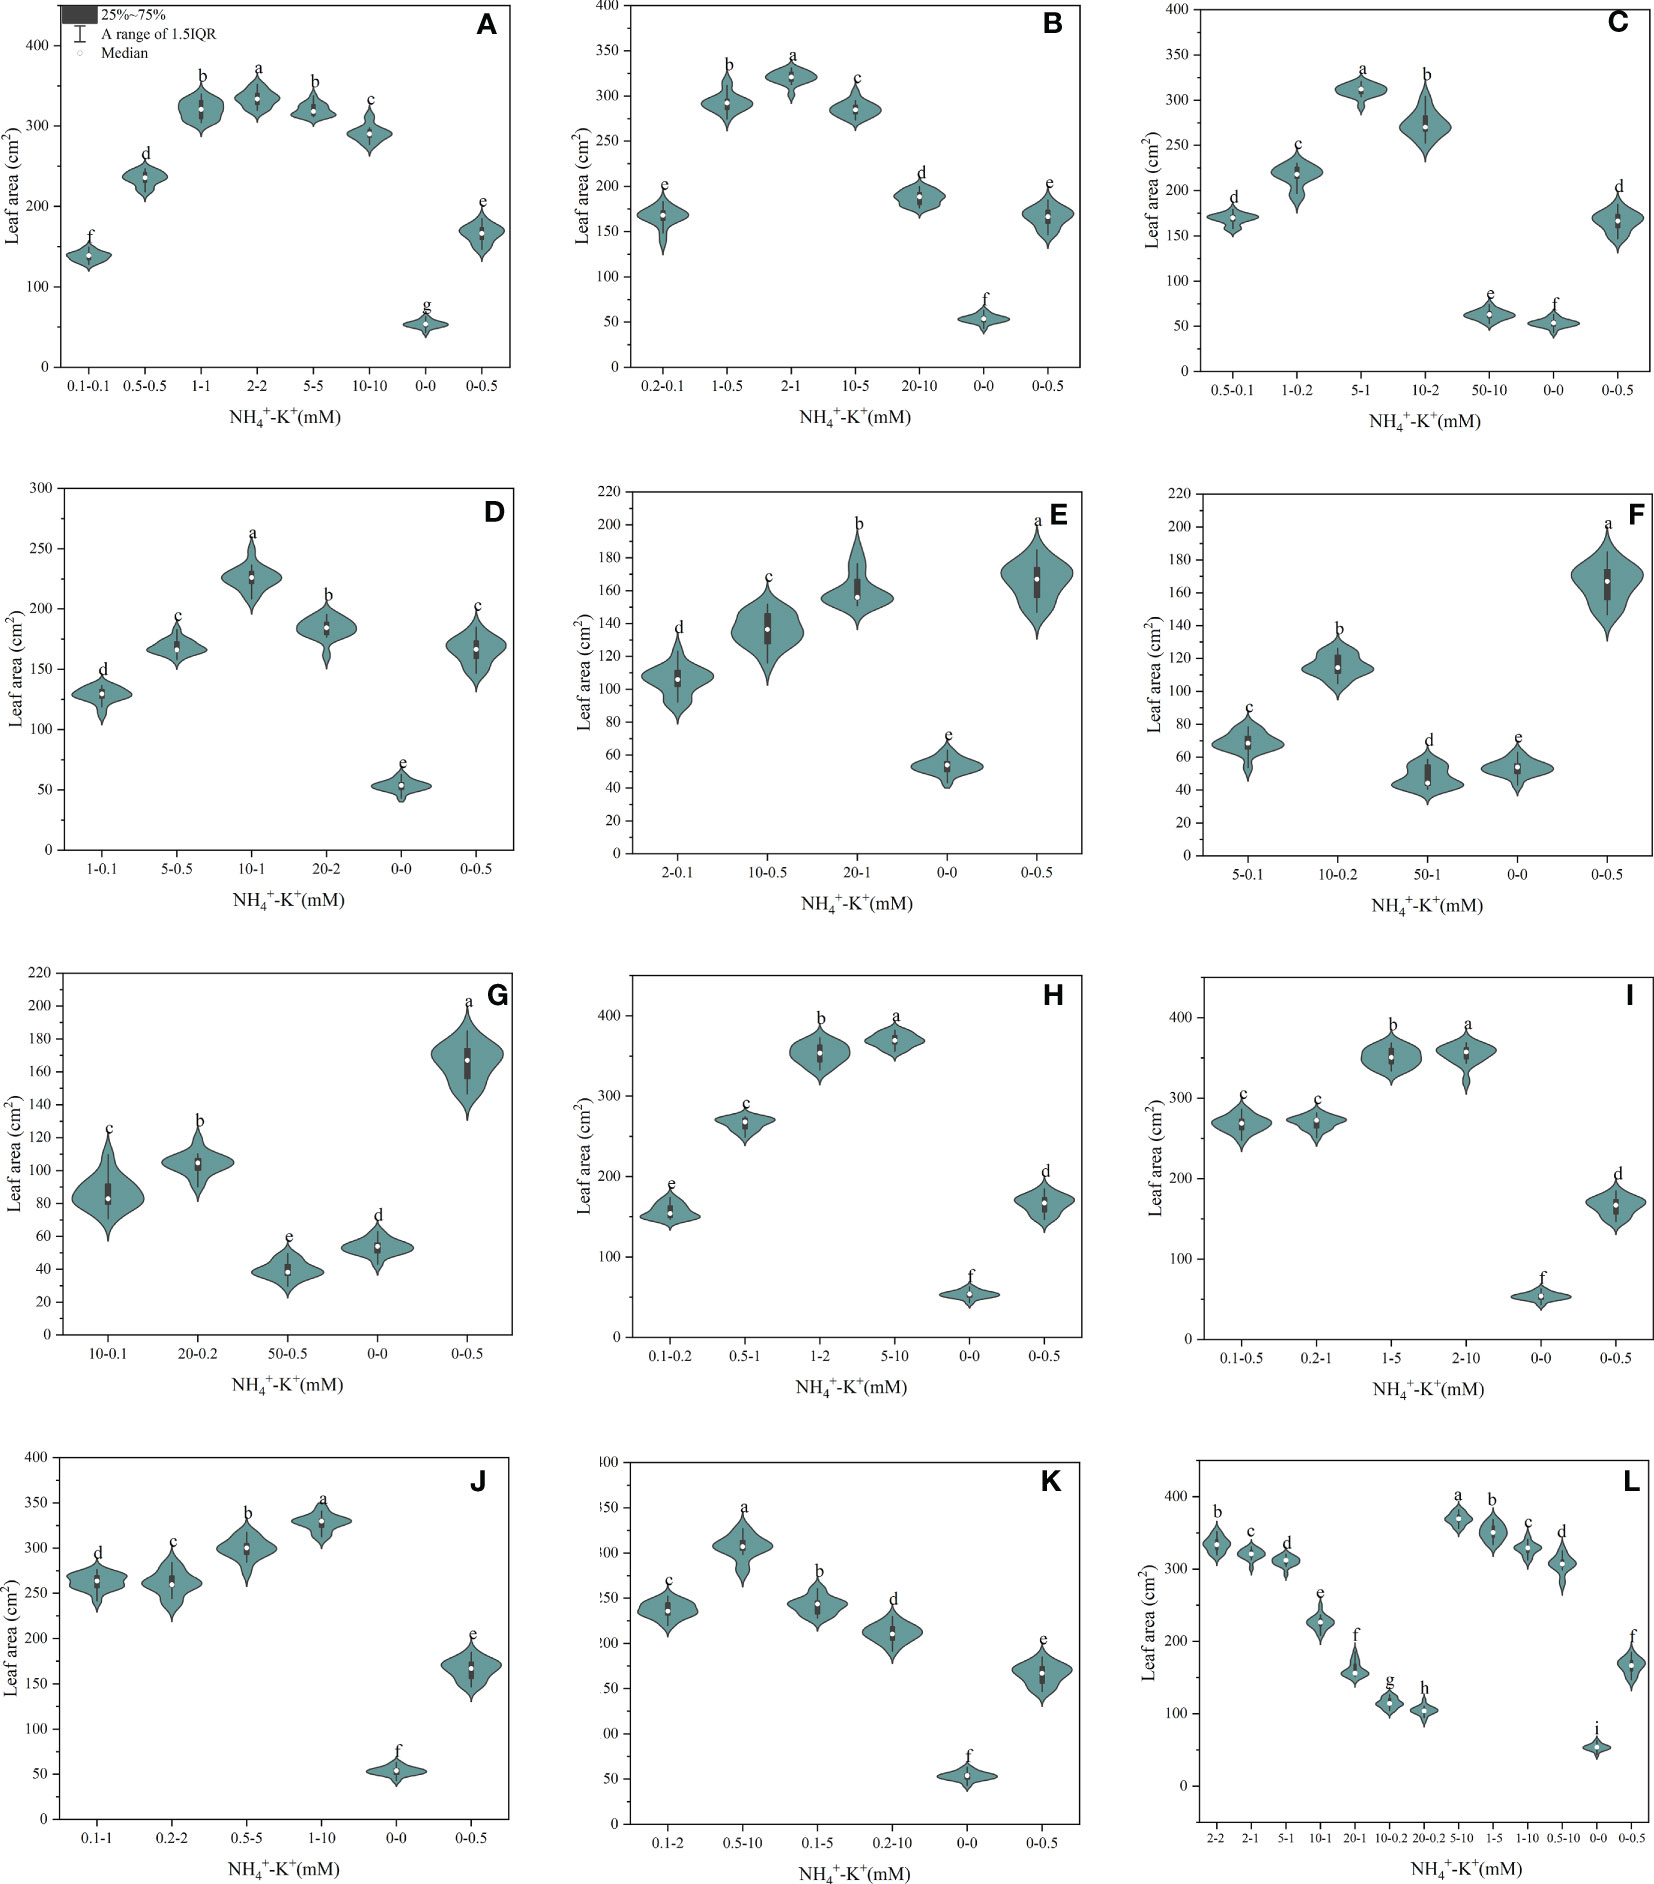
Figure 4 Leaf area of tobacco as affected by different NH4+: K+ ratios. Graphs (A–G) represent increasing NH4+ at constant K+ (at 1) ratios. (A) NH4+/K+ ratio 1:1, (B) 2:1, (C) 5:1, (D) 10:1, (E) 20:1, (F) 50:1, and (G) 100:1. Graphs (H–K) connote constant NH4+ (at 1) at increasing K+ ratio. (H) NH4+/K+ ratio 1:2, (I) 1:5, (J) 1:10, (K) 1:20 (0.1-2 mM and 0.5-10 mM) and 1:50 (0.1-5 mM and 0.2-10 mM) (L) comparison of NH4+-K+ concentration within each ratio. All the NH4+/K+ concentration within each ratio were compared with the positive (without NH4+, but with K+) and negative control (without NH4+ and K+). The above growth parameters were measured 15 days after treatment. Significant means were separated using standard deviation ± SD (n= 12 biological replicates).
As shown in (Figure 5), there were significant differences in the chlorophyll content of tobacco subjected to concentration at different NH4+: K+ ratios. In each NH4+: K+ ratio, the chlorophyll content increased with increasing NH4+ - K+ concentration and was highest at 20-1 mM (20:1); a further increase in NH4+ ratio to 50:1 and 100:1 led to a gradual decrease in chlorophyll content. Compared with increasing NH4+/constant K+, constant NH4+/increasing K+- plants had lower chlorophyll content.
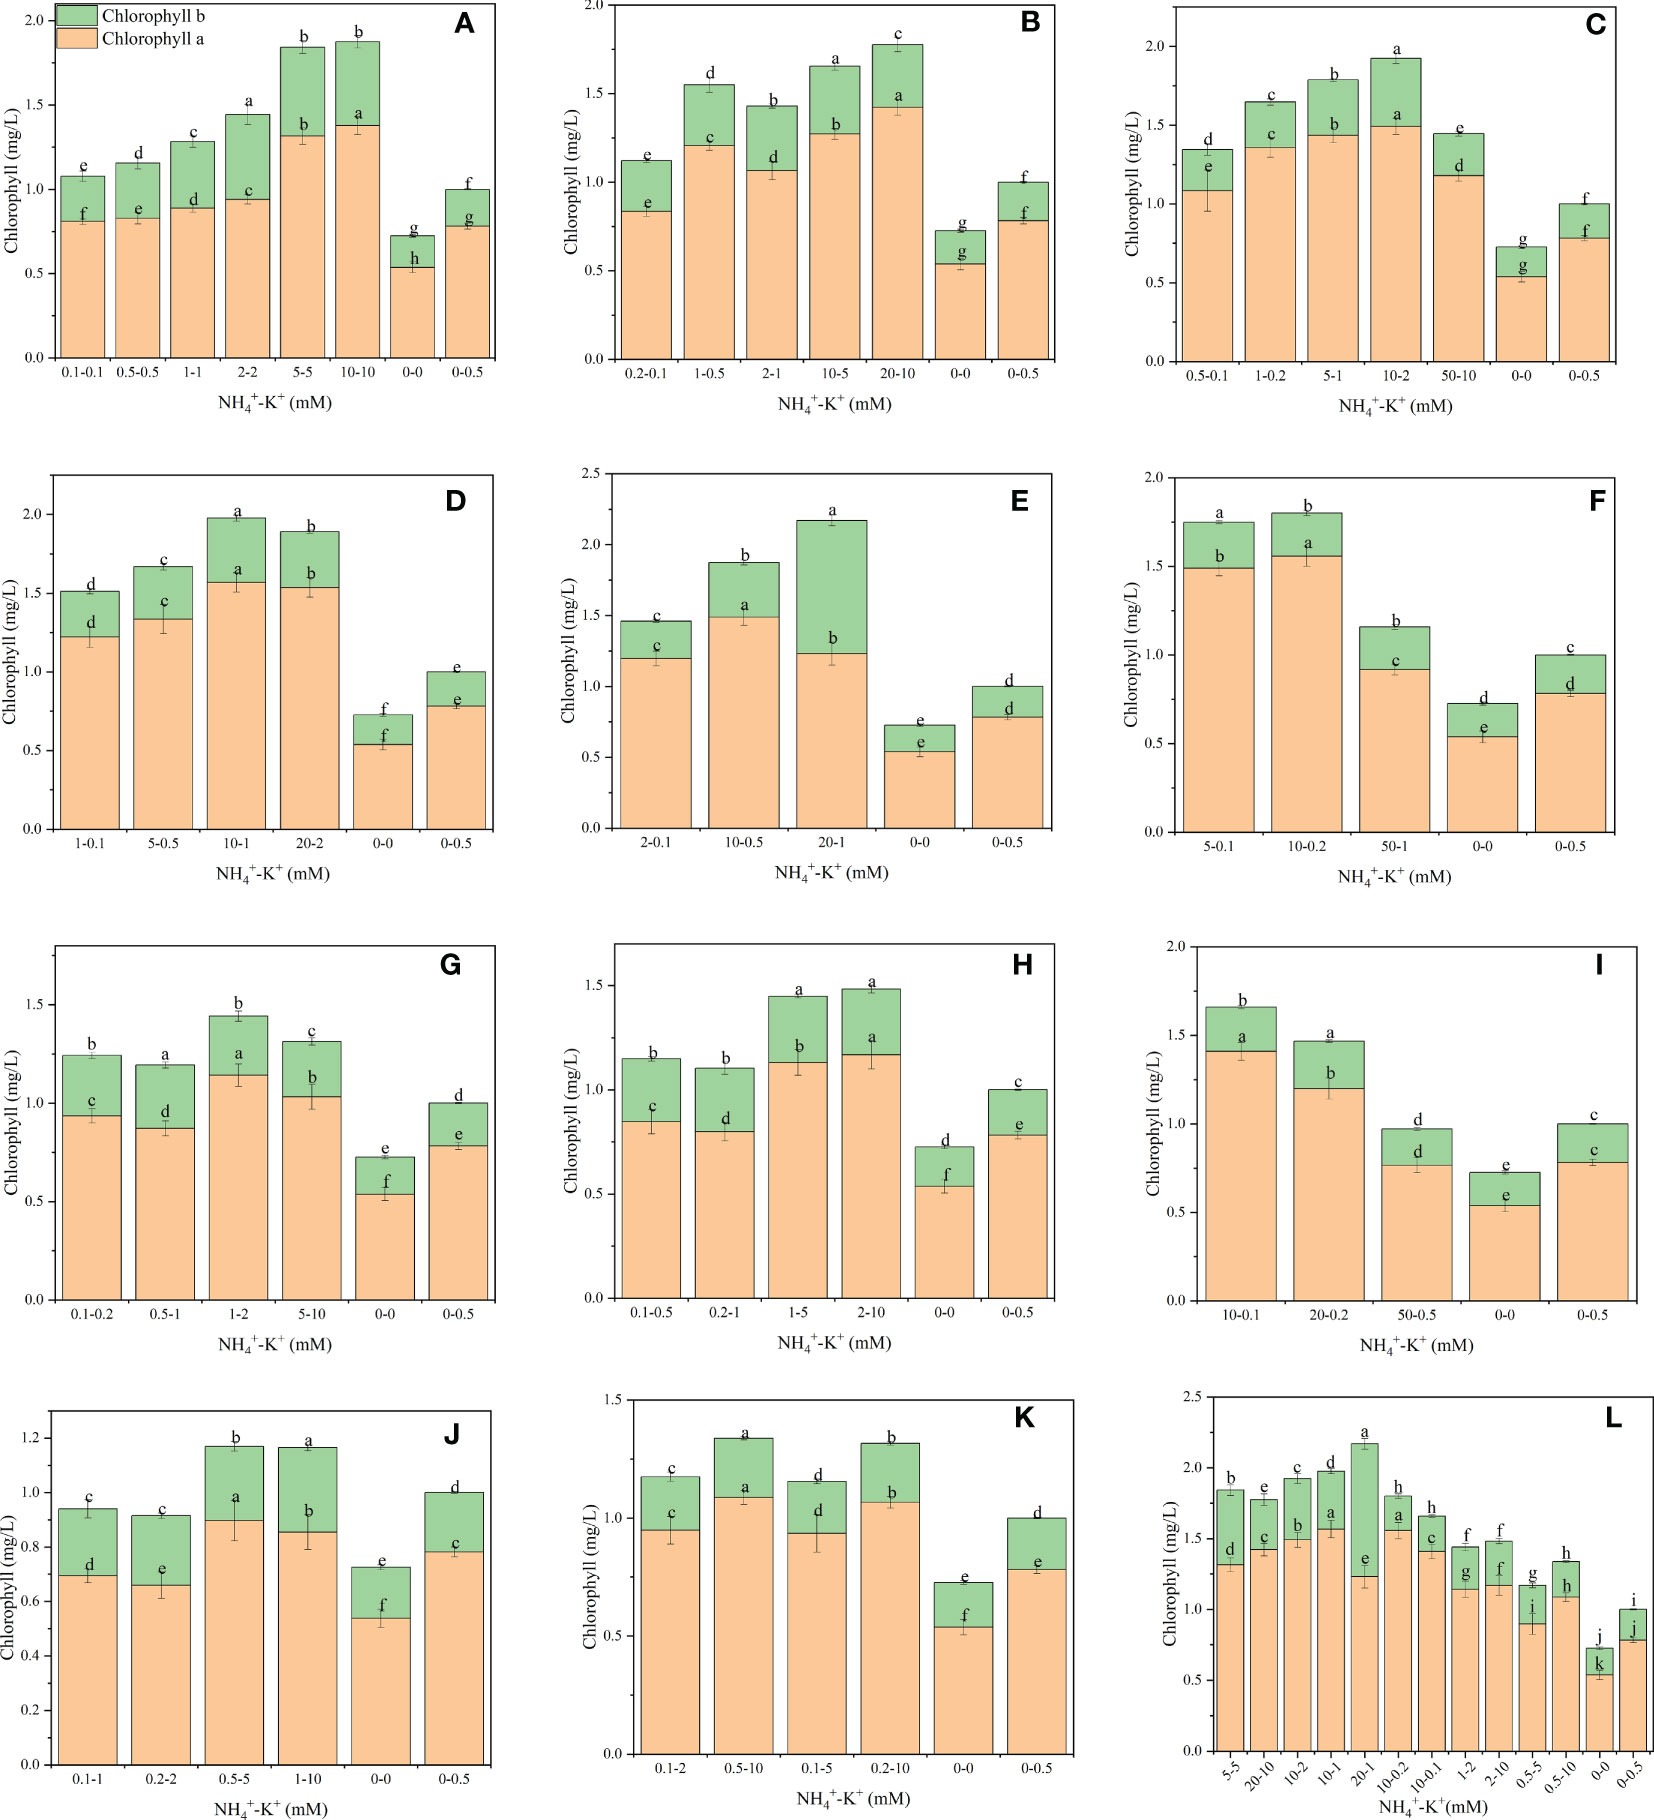
Figure 5 Chlorophyll contents of tobacco subjected to different NH4+: K+ ratios. Graphs (A–G) represent increasing NH4+ at constant K+ (at 1) ratios. (A) NH4 +/K+ ratio 1:1, (B) 2:1, (C) 5:1, (D) 10:1, (E) 20:1, (F) 50:1, and (G) 100:1. Graphs (H–K) connote constant NH4+ (at 1) at increasing K+ ratio. (H) NH4+/K+ ratio 1:2, (I) 1:5, (J) 1:10, (K) 1:20 (0.1-2 mM and 0.5-10 mM) and 1:50 (0.1-5 mM and 0.2-10 mM) (L) comparison of NH4+-K+ concentration within each ratio. All the NH4+/K+ concentration within each ratio were compared with the positive (without NH4+, but with K+). And negative control (without NH4+ and K+). Chlorophyll content was measured 15 days after treatment. Significant means were separated using standard deviation + SD (n= 12 biological replicates).
Increasing NH4+ at constant K+ exerts varying effects on the fresh stem weight (Figure 1). Fresh stem weight increases with a progressive increase in NH4+-K+ concentration until a point was reached where further increase resulted in drastic stem reduction. Within this increasing NH4+/constant K+ ratio pattern, NH4+-K+ concentrations 2-2 mM (1:1) had the highest stem weight, followed by 2-1 mM (2:1) and 5-1 mM (5:1 mM), and their stem weight were increased by 56.4%, 13.2% and 7.1%, respectively, relative to the positive control. Positive control was considerably higher than all other treated concentrations at ratios 2:1 and 5:1, except at 2-1 mM (2:1) and 5-1 mM (5:1). Positive control had the highest stem weight at ratios 10:1, 20:1, 50:1, and 100:1. Indeed, stem weights of 50-1 mM (50:1) and 50-0.5 mM (100:1) were drastically reduced compared with the negative control. At constant NH4+/increasing K+, stem weight of all the concentrations at different ratios was remarkably higher than the positive control, though stem weight reduction was observed at 0.1-0.2 mM (1:2) and 0.1-0.5 mM (1:5). Compared with 2-2 mM (1:1; highest at constant K+ and increasing NH4+ ratio), the stem weight of 1-2 mM (1:2) and 1-5 mM (1:5) (highest stem weight under constant NH4+/increasing K+ ratio) increased by 21.4% and 17.4%, respectively.
Furthermore, there were significant differences in the stem K+ content at various ratios (Figure 2). At increasing NH4+ and constant K+, 2-2 mM (1:1) had the highest stem K+ content, followed by 10-5 mM (2:1), 5-1 mM (5:1) and 20-2 mM (10:1), exhibiting approximately 99.8%, 60.5%, 69.0% and 30.2%, increase in K+ content, respectively, relative to the positive control. However, compared with the positive control, stem K+ contents were significantly lower in concentration at ratios 20:1, 50:1, and 100:1. A 15.4% reduction in stem K+ content was observed in 50-0.5 mM (100:1) medium compared with negative control. Within each of the constant NH4+/increasing K+ ratios (except for ratio 1:20), increasing NH4+-K+ concentration led to gradual improvement in the stem K+ content until a peak was reached where further increase led to reduction. Generally, stem K+ content was highest at 1-5 mM (1:5), and was 1.2% higher than 2-2 mM (1:1).
Stem NH4+ contents were affected by various NH4+-K+ concentrations at different ratios (Figure 3). Under increasing NH4+/constant K+ ratios 1:1, 2:1, and 5:1, the NH4+ content of stem was much lower compared to 10:1, 20:1, 50:1, and 100:1 as visually represented in the graphs; however, a marked increase in stem NH4+content was observed when these treatments were compared with controls. Following this same increasing NH4+/K+ ratio pattern, stem NH4+ content peaks at the highest NH4+- K+ concentration. With the exemption of ratios 1:10 (0.2-2 mM), a similar increase in the stem NH4+ content was observed at highest NH4+-K+ concentration grown under constant NH4+/increasing K+ ratios. Interestingly, stem NH4+ content of such increasing K+ concentrations were drastically lower than most of the increasing NH4+/constant K+ treated medium (NH4+: K+ 20:1, 50:1, and 100:1).
To further evaluate stem growth, stem diameter, which is one of the most important stem growth variables, was measured. At increasing NH4+/constant K+, stem diameter increases as the NH4+/K+ concentration increases; however, a point was reached where further increase led to a drop in stem diameter (Figure 6). There were significant reductions in the stem diameters of NH4+-K+ 50-10 mM (5:1), 50-1 mM (50:1), and 50-0.5 mM (100:1) compared with the negative control. In all the treated concentrations subjected to increasing NH4+ ratio, only 2-2 mM at ratio 1:1 had the largest stem diameter. Despite the increasing K+ at ratio 1:2, positive control still had the largest stem diameter. In case of further increase in K+ to 5 (1:5) and 10 (1:10), only 2-10 mM (1:5) and 0.5-5 mM (1:10) had larger stem diameter compared with positive control. The stem diameter of concentrations at ratios 1:20 and 1:50 was negligible since both had similar or smaller stem diameters compared with the positive control. In the overall treatments, 2-2 mM at ratio 1:1 had the largest stem diameter.
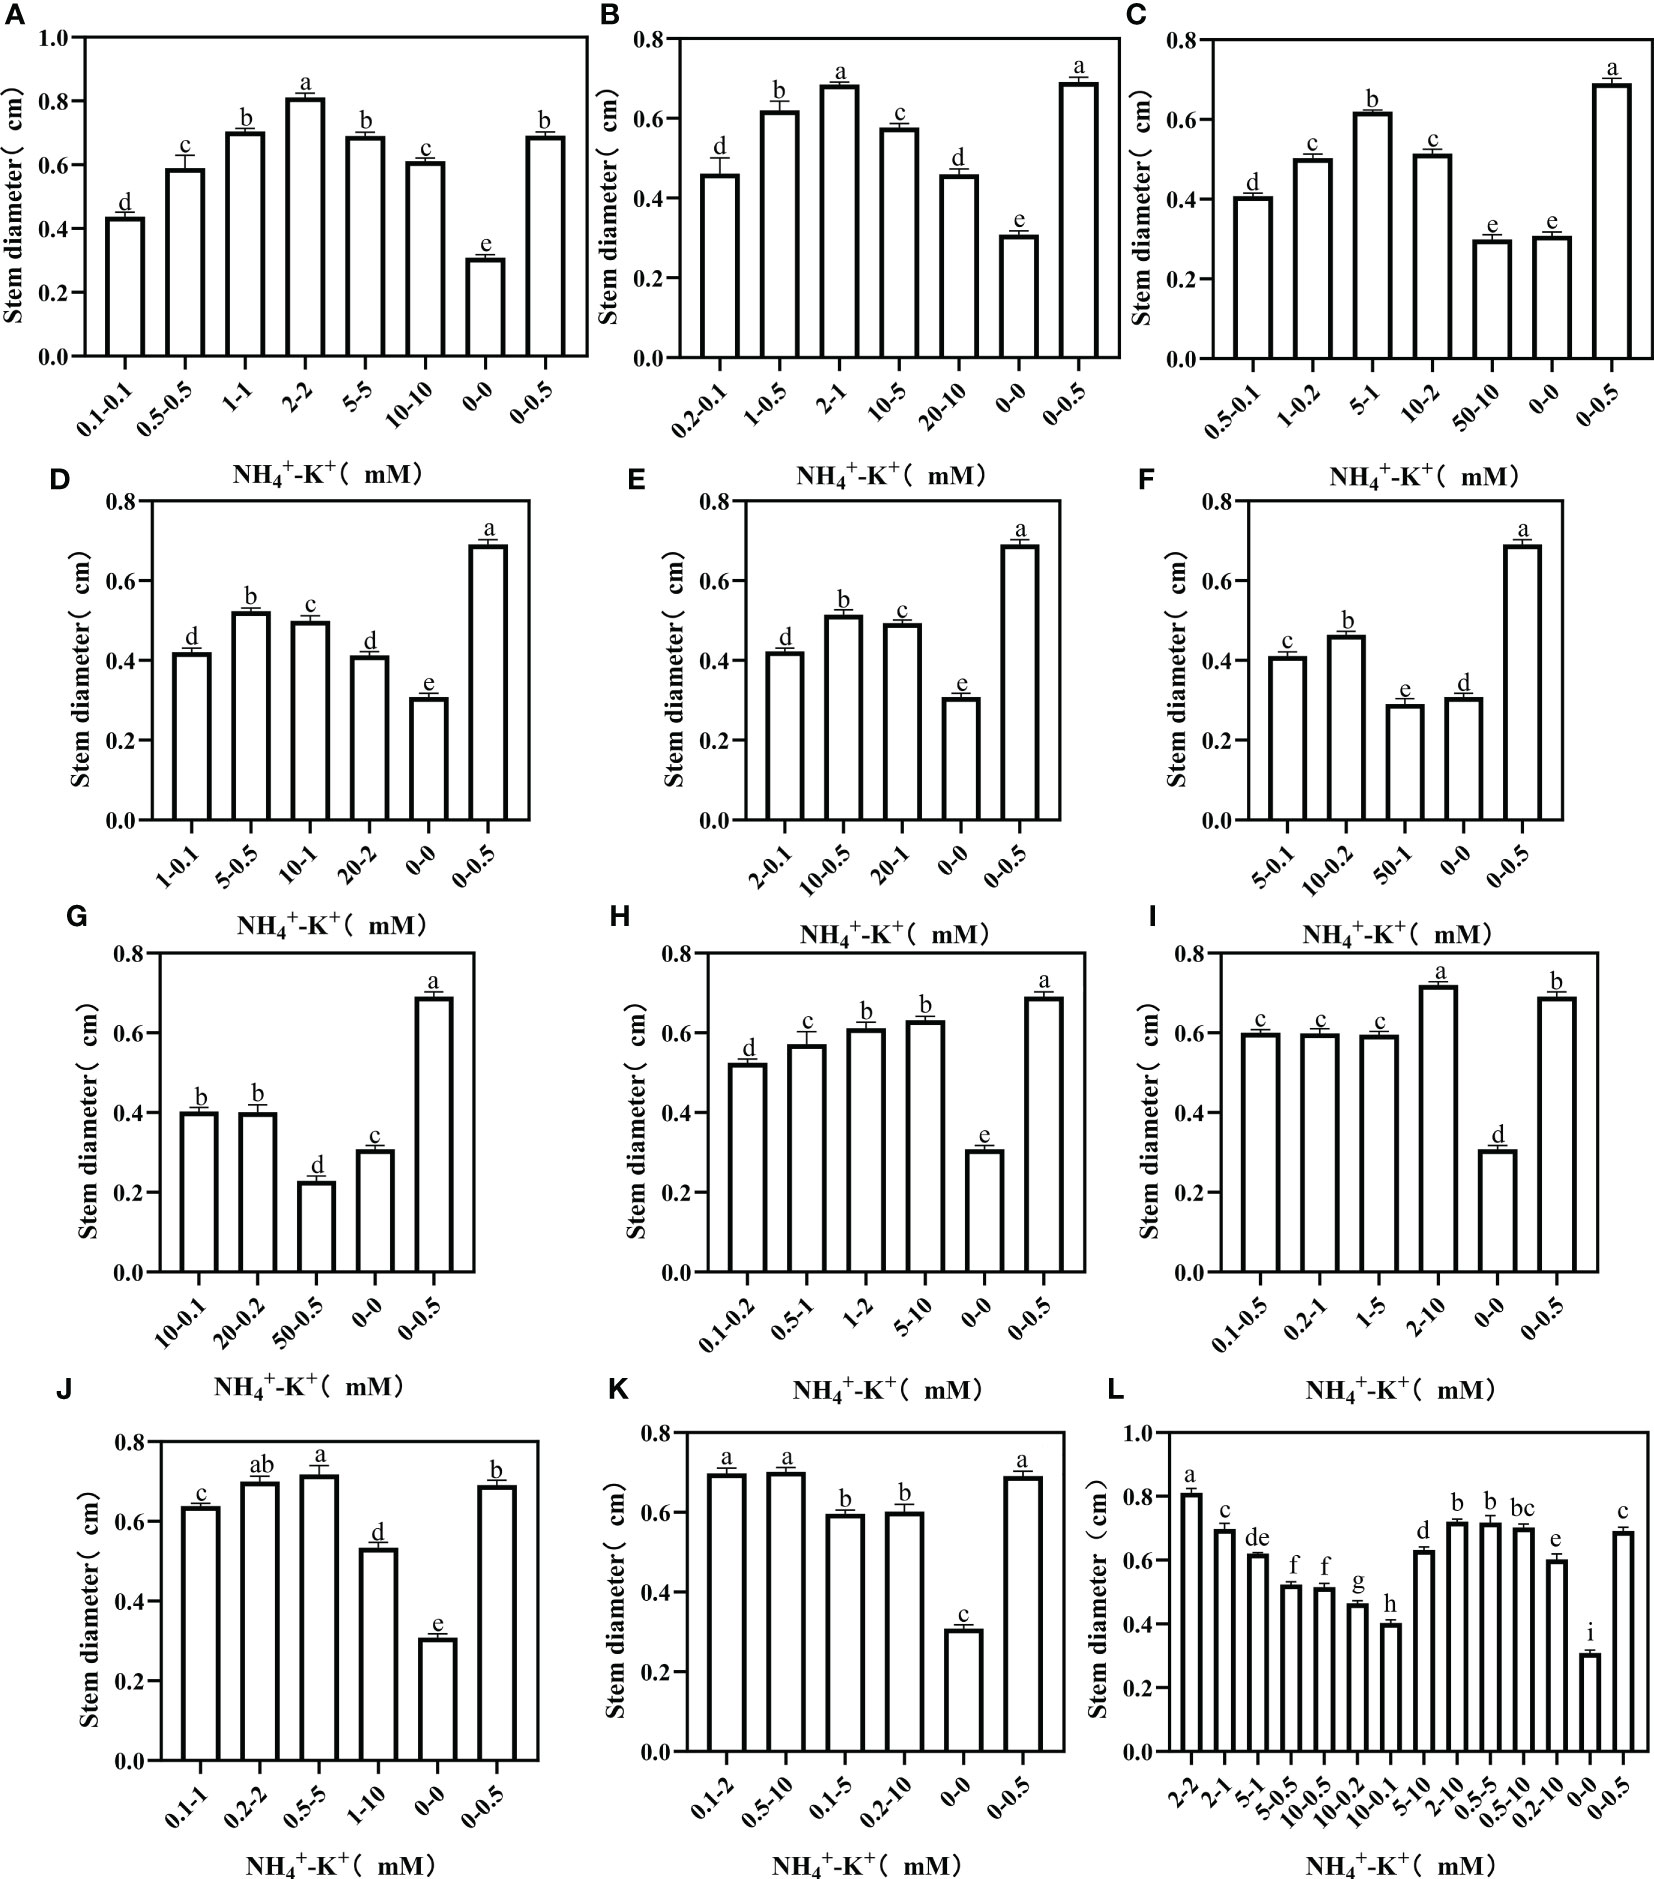
Figure 6 Stem diameter of tobacco as affected by different NH4+: K+ ratios. Graphs (A-G) represent increasing NH4+ at constant K+ (at 1) ratios. (A) NH4+/K+ ratio 1:1, (B) 2:1, (C) 5:1, (D) 10:1, (E) 20:1, (F) 50:1, and (G) 100:1. Graphs (H–K) connote constant NH4+ (at 1) at increasing K+ ratio. (H) NH4+/K+ ratio 1:2, (I) 1:5, (J) 1:10, (K) 1:20 (0.1-2 mM and 0.5-10 mM) and 1:50 (0.1-5 mM and 0.2-10 mM) (L) comparison of NH4+-K+ concentration within each ratio. All the NH4+/K+ concentration within each ratio were compared with the positive (without NH4+, but with K+).and negative control (without NH4+ and K+). The above growth parameters were measured 15 days after treatment. Significant means were separated using standard deviation ± SD (n= 3 biological replicates).
Stem length was measured to fully understand the optimal NH4+-K+ concentration required for stem growth. At increasing NH4+/constant K+, an increase in NH4+/K+ concentration led to a rapid surge in stem length, but further increase led to a decline (Figure 7). Compared with the positive control, stem length was markedly increased in all concentrations at ratios 1:1 and 2:1, except at concentration 20-10 mM (2:1), which had a 30.9% reduction. The stem length of the positive control was significantly higher than all other treatments under increasing NH4+ ratios (5:1, 10:1, 20:1, 50:1, and 100:1). Following the same ratio pattern, 50-1 mM and 20-0.2 mM (50:1) and 50-0.5 mM (100:1) were lower than the negative control. Regardless of both controls, stem length increases as NH4+/K+ concentration increases at ratios 1:2 and 1:5. Conversely, at ratios 1:10, 1:20, and 1:50, a drastic reduction in the stem length was observed when the concentration was increased. Taken together, stem length peaks at 2-2 mM (1:1), and was 35.1% higher than 5-10 mM (1:2) (which was the highest under constant NH4+/increasing K+ ratio).

Figure 7 Stem length of tobacco as affected by different NH4+: K+ ratios. Graphs (A-G) represent increasing NH4+ at constant K+ (at 1) ratios. (A) NH4+/K+ ratio 1:1, (B) 2:1, (C) 5:1, (D) 10:1, (E) 20:1, (F) 50:1, and (G) 100:1. Graphs (H–K) connote constant NH4+ (at 1) at increasing K+ ratio. (H) NH4+/K+ ratio 1:2, (I) 1:5, (J) 1:10, (K) 1:20 (0.1-2 mM and 0.5-10 mM) and 1:50 (0.1-5 mM and 0.2-10 mM) (L) comparison of NH4+-K+ concentration within each ratio. All the NH4+/K+ concentration within each ratio were compared with the positive (without NH4+, but with K+).and negative control (without NH4+ and K+). The above growth parameters were measured 15 days after treatment. Significant means were separated using standard deviation ± SD (n= 3 biological replicates).
Root weight differs within the treated concentrations at different ratios (Figure 1). Within each of the increasing NH4+: constant K+ ratios, fresh root weight increases with increasing NH4+ -increasing K+ concentration until a point was reached where further increase led to a gradual decrease. Compared with the positive control (1 mM K+ supply in the absence of NH4+), the fresh root weight of NH4+-K+ millimolar concentration 2-2 mM at ratios 1:1 was the highest, followed by 2-1 mM (2:1), with 37.1% and 8.2% increase, respectively. At ratios 5:1, 10:1, 20:1, 50:1, and 100:1, positive control had the highest root weight, but when compared with the negative control, which seems lower than all observed treatments, root weight of 50-0.5 mM at ratio 100:1 decreased by 36%. Except at lower NH4+ - K+ concentrations of constant NH4+/increasing K+ ratios, all other treated concentrations had increased root weight compared with the positive control. In all the concentrations examined, root weight peaks at 2-2 mM (1:1).
There were significant differences in the K+ content of roots under varying NH4+-K+ concentration, and are presented in Figure 2. A progressive increase in NH4+- K+ concentrations at increasing NH4+/constant K+ ratios resulted in a marked increase in the root K+ content, however, a point was reached where further increase led to a marked reduction. Except at lower NH4+-K+ concentrations (for example 0.1-0.1 mM, 0.2-0.1mM, 0.5-0.1mM, 1-0.2mM, 1-0.1mM and 2-0.1mM), the root K+ content of all other concentrations at NH4+: K+ ratios 1:1, 2:1, 5:1, 10:1, and 20:1 was significantly higher than the positive control. Root K+ content was highest at 10-5 mM (2:1), followed by 2-2 mM (1:1), 2-1 mM (2:1), 5-1 mM (5:1), 10-1 mM (10:1) and 20-1 mM (20:1). However, all concentrations at ratios 50:1 and 100:1 exhibit reduced K+ content relative to the positive control. Compared with the positive control, all observed concentrations under constant NH4+/increasing K+ ratios, had marked increment in their root K+ content, except 0.1-0.2 mM (1:2). At such NH4+/K+ ratio, root K+ content peaks at 1-5 mM (1:5), and increased by 26.4% relative to 10-5 mM (2:1), which was highest under increasing NH4+/constant K+ ratio.
There were significant differences in the NH4+ content of root under varying NH4+-K+ concentration, and are presented in Figure 3. At ratios 1:1, 2:1, 5:1, and 10:1 root NH4+ content increases with increasing NH4+- K+ millimolar concentration until a point was reached where a notable reduction in NH4+ content was observed (NH4+-K+ 2-2 mM (ratio 1:1); 2-1mM (2:1); 10-2mM (5:1); 10-1 mM (10:1); 10-0.2 mM (50:1)). A further increase in NH4+-K+ millimolar concentration resulted in a marked increase in leaf NH4+ content. However, at ratios 20:1 and 100:1, leaf NH4+ content increases with increasing NH4+-K+ concentration. Following same increasing NH4+ ratio pattern, positive control had the lowest root NH4+ content. Regardless of both controls, at constant NH4+/increasing K+ ratios, a direct relationship was observed between the root NH4+ content and NH4+/K+ concentration, except 1-20 mM (1:20). Under the same ratio pattern, treatment with no K+ and NH4+ (negative control) had the highest root NH4+ content.
As shown in Figure 8, root activity was affected by NH4+/K+ concentration at different ratios. At ratios 1:1, 2:1, and 5:1, root activity was enhanced as NH4+/K+ concentrations increased; however, a point was reached where further increase resulted in a decrease in root activity. Conversely, at NH4+/K+ ratios 10:1, 20:1, 50:1 and 100:1, root activity decreases with increasing NH4+/K+ concentrations. Concentrations 2-2 mM and 1-1 mM at ratios 1:1 had the strongest root activity. However, relative to the positive control, the root activity of other increasing NH4+ ratios (10:1, 20:1, 50:1, and 100:1) was either insignificant or decreased. At constant NH4+/increasing K+ ratio, root activity was strongest at concentrations 1-2 mM (1:2) and 0.2-1 mM (1:5), whereas, at NH4+/K+ ratios 1:10, 1:20 and 1:50, positive control had the highest root activity. Of all the treated concentration, root activity peaks at concentrations NH4+ - K+ 2-2 mM (1:1).
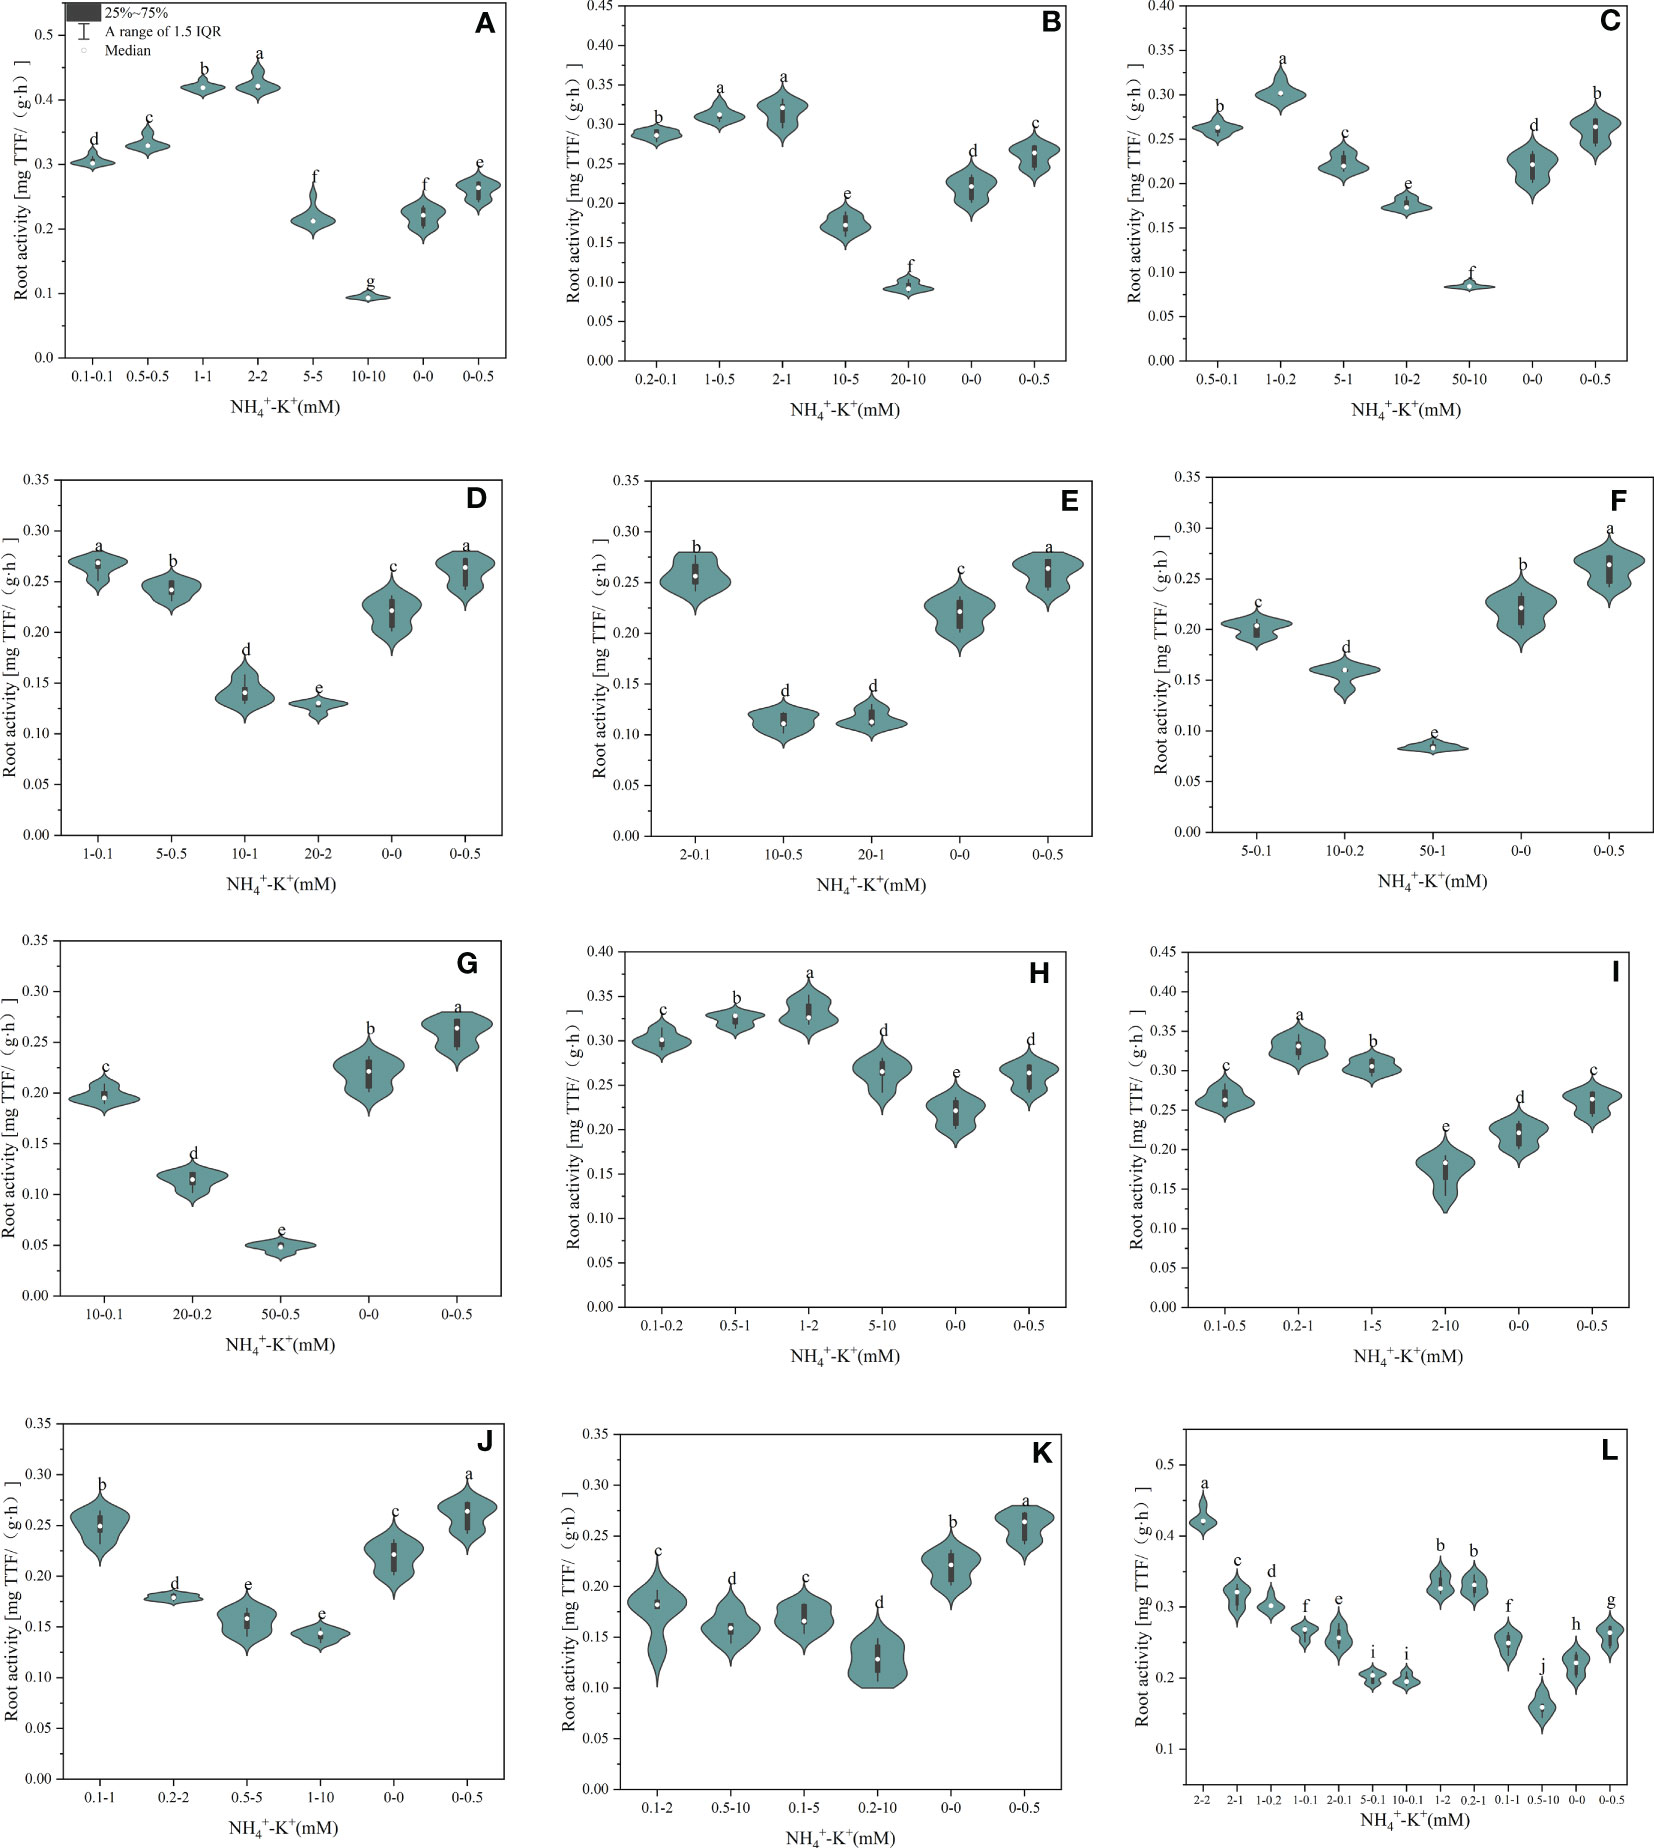
Figure 8 Root activity of tobacco as affected by different NH4+: K+ ratios. Graphs (A–G) represent increasing NH4+ at constant K+ (at 1) ratios. (A) NH4+/K+ ratio 1:1, (B) 2:1, (C) 5:1, (D) 10:1, (E) 20:1, (F) 50:1, and (G) 100:1. Graphs (H–K) connote constant NH4+ (at 1) at increasing K+ ratio. (H) NH4+/K+ ratio 1:2, (I) 1:5, (J) 1:10, (K) 1:20 (0.1-2 mM and 0.5-10 mM) and 1:50 (0.1-5 mM and 0.2-10 mM) (L) comparison of NH4+-K+ concentration within each ratio. All the NH4+/K+ concentration within each ratio were compared with the positive (without NH4+, but with K+).and negative control (without NH4+ and K+). The above growth parameters were measured 15 days after treatment. Significant means were separated using standard deviation ± SD (n= 9 biological replicates).
The effects of variations in NH4+-K+ concentration at different ratios were further evaluated in root length. The root length of the negative control was significantly higher than all other treated concentrations at an increasing NH4+/constant K+ ratio; only the root length of 2-2 mM at ratio 1:1 increased by 6.8% relative to the negative control (Figure 9). Similarly, at constant NH4+/increasing K+ ratios, only concentration 0.2-1 mM (1:5) had markedly increased (13.16 cm) root length compared with the negative control (12.29 cm), all other observed concentrations had a pronounced reduction in root length.
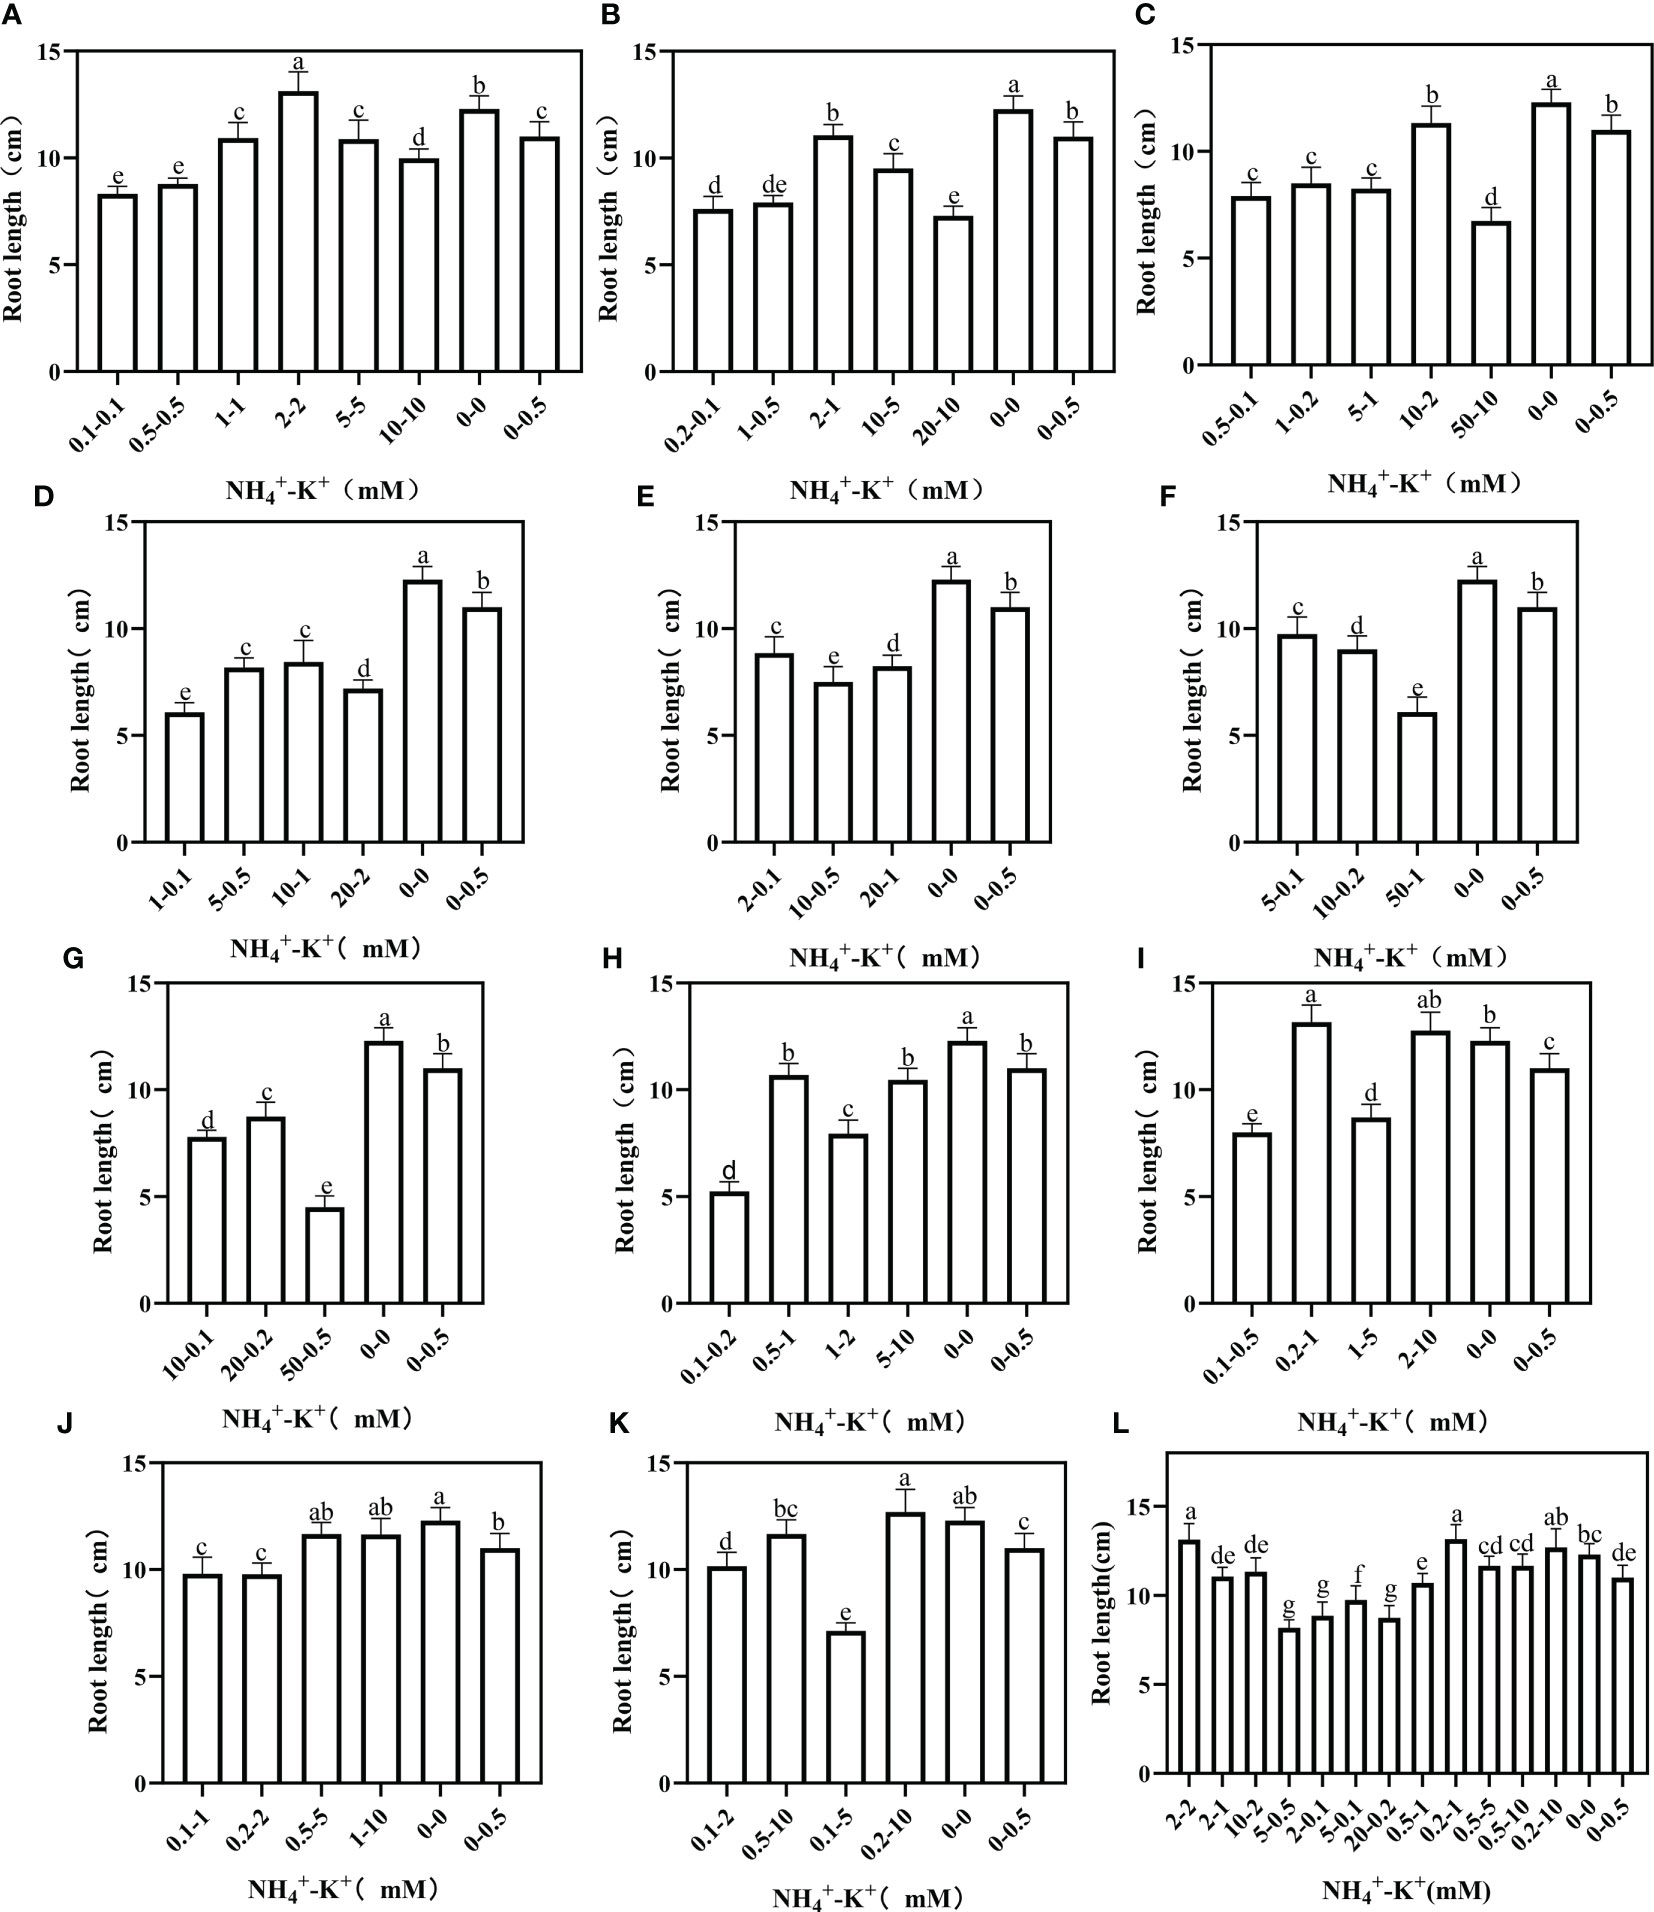
Figure 9 Root length of tobacco as affected by different NH4+: K+ ratios. Graphs (A-G) represent increasing NH4+ at constant K+ (at 1) ratios. (A) NH4+/K+ ratio 1:1, (B) 2:1, (C) 5:1, (D) 10:1, (E) 20:1, (F) 50:1, and (G) 100:1. Graphs (H–K) connote constant NH4+ (at 1) at increasing K+ ratio. (H) NH4+/K+ ratio 1:2, (I) 1:5, (J) 1:10, (K) 1:20 (0.1-2 mM and 0.5-10 mM) and 1:50 (0.1-5 mM and 0.2-10 mM) (L) comparison of NH4+-K+ concentration within each ratio. All the NH4+/K+ concentration within each ratio were compared with the positive (without NH4+, but with K+).and negative control (without NH4+ and K+). The above growth parameters were measured 15 days after treatment. Significant means were separated using standard deviation ± SD (n= 3 biological replicates).
Under increasing NH4+/constant K+, root area was highest at 2-2 mM (1:1), 2-1 mM (2:1), 1-0.2 mM (5:1), 5-0.5 mM (10:1) and 20-1 mM (20:1), but when compared with the positive control, all concentrations at ratios 50:1 and 100:1 had significantly lower root area (Figure 10). At constant NH4+/increasing K+ ratio, only 0.2-2 mM at ratio 1:10 had a lower root area relative to the positive control; all other observed concentrations under such increasing K+ ratio pattern was significantly higher. In all the treated concentrations, the root area peaks at 0.5-10 mM (1:20).
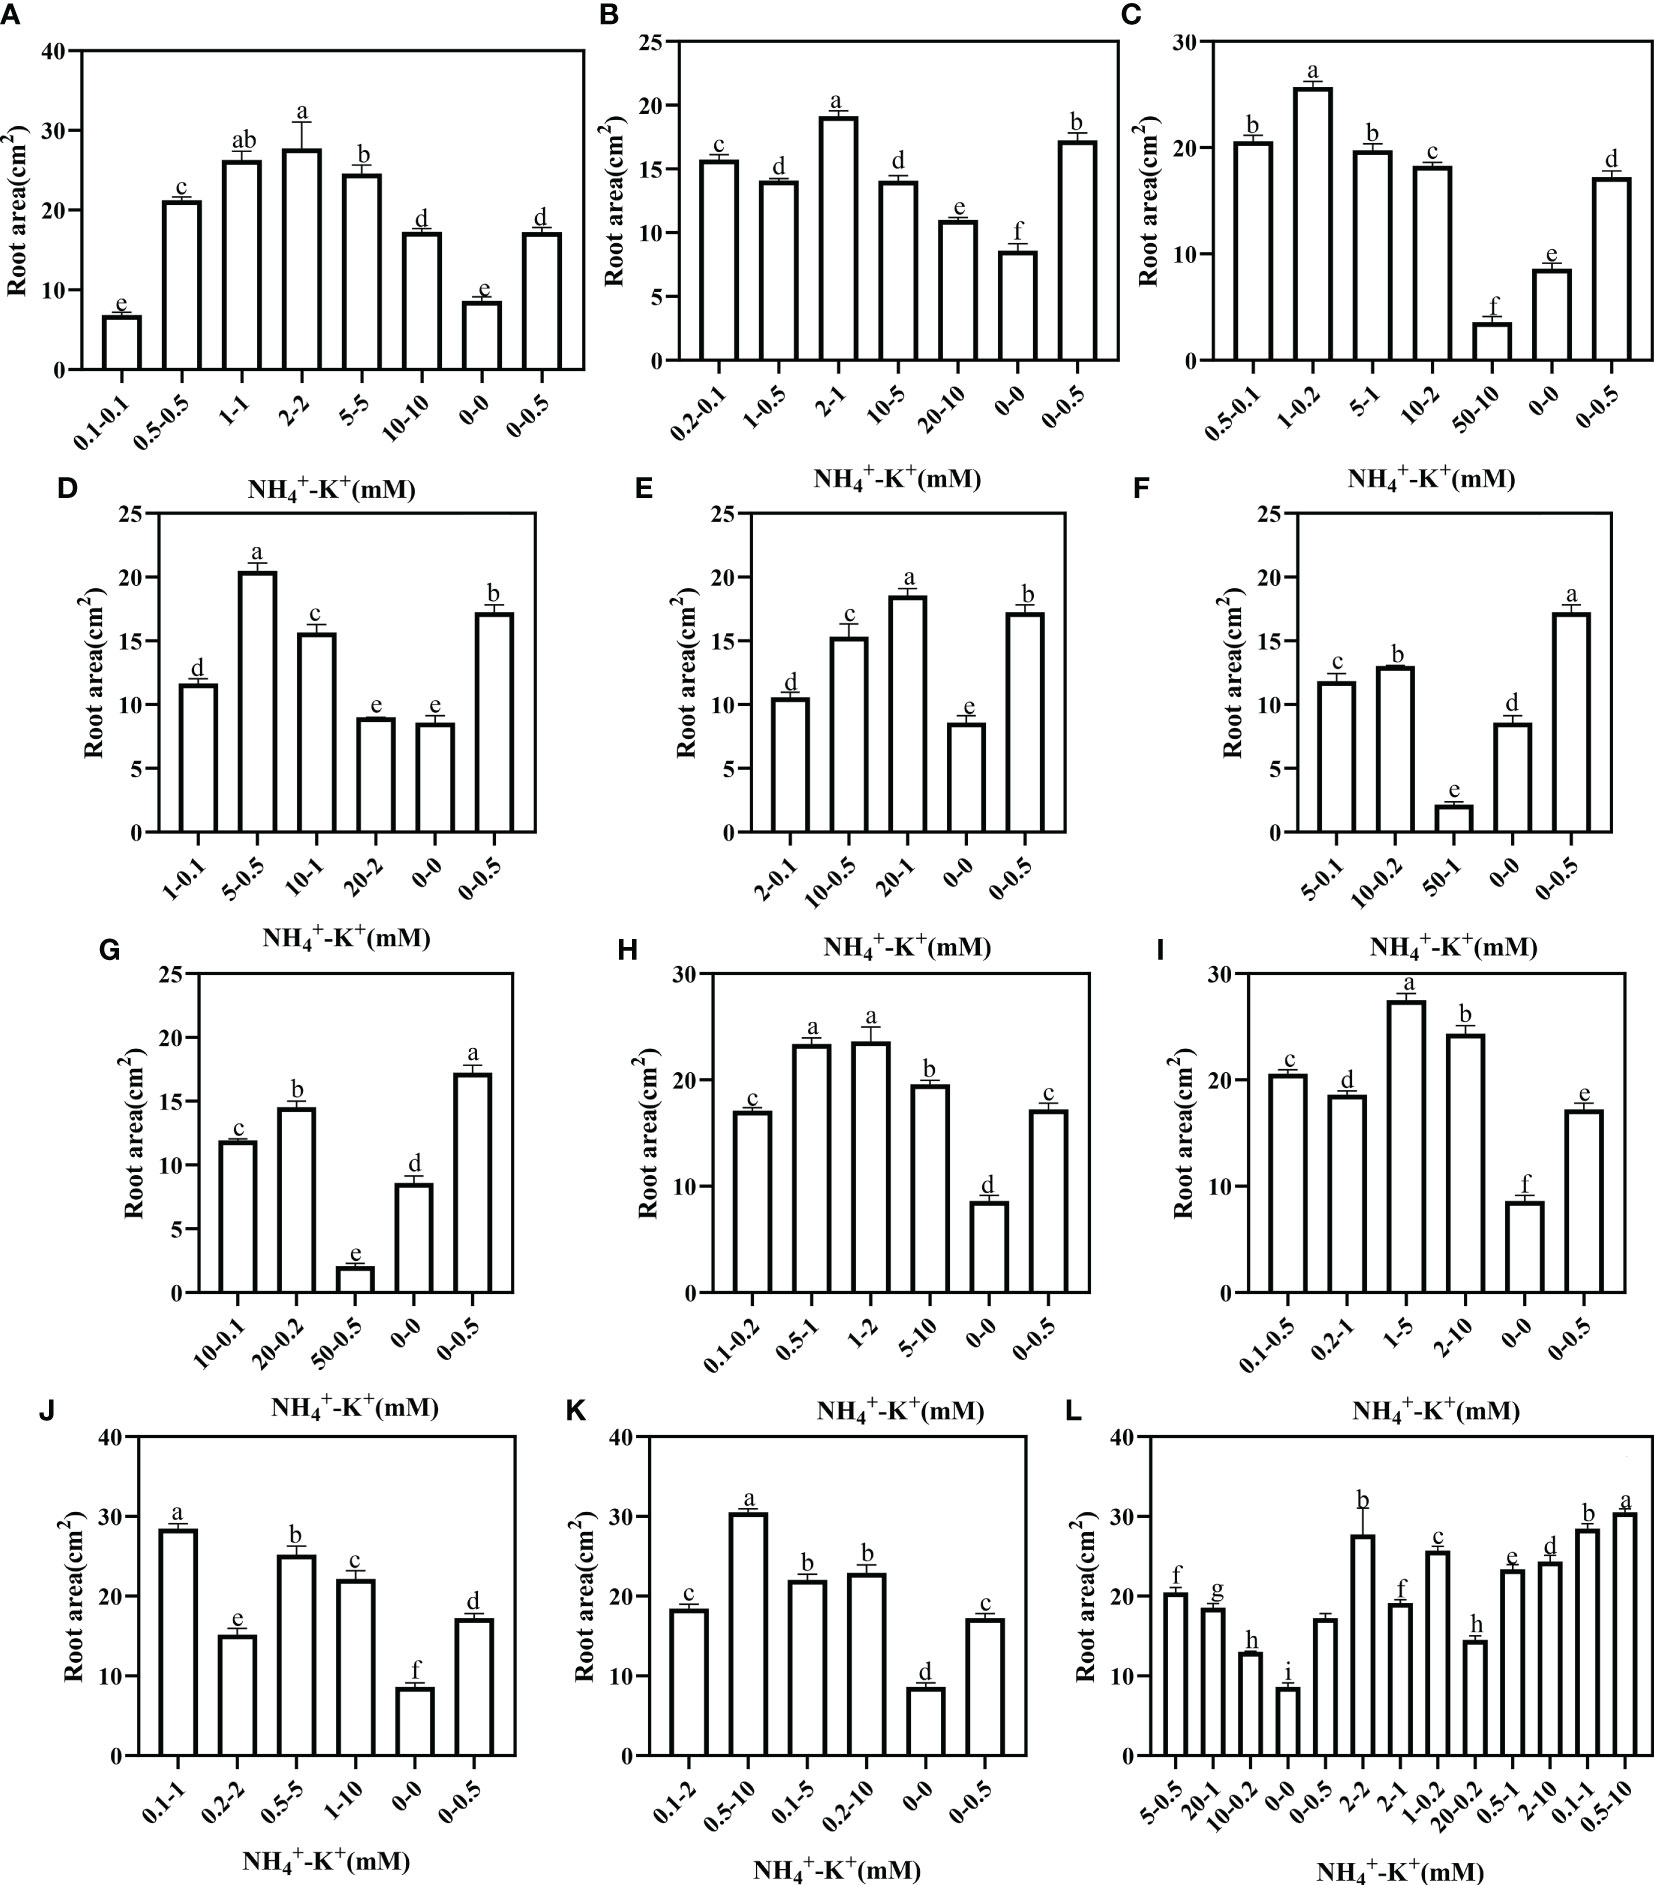
Figure 10 Root area of tobacco as affected by different NH4+: K+ ratios. Graphs (A-G) represent increasing NH4+ at constant K+ (at 1) ratios. (A) NH4+/K+ ratio 1:1, (B) 2:1, (C) 5:1, (D) 10:1, (E) 20:1, (F) 50:1, and (G) 100:1. Graphs (H-K) connote constant NH4+ (at 1) at increasing K+ ratio. (H) NH4+/K+ ratio 1:2, (I) 1:5, (J) 1:10, (K) 1:20 (0.1-2 mM and 0.5-10 mM) and 1:50 (0.1-5 mM and 0.2-10 mM) (L) comparison of NH4+-K+ concentration within each ratio. All the NH4+/K+ concentration within each ratio were compared with the positive (without NH4+, but with K+).and negative control (without NH4+ and K+). The above growth parameters were measured 15 days after treatment. Significant means were separated using standard deviation ± SD (n= 3 biological replicates).
We performed correlation analysis to establish the relationship between different growth parameters and their contributions to tobacco performance under different NH4+/K+ concentrations (Figure 11). Most of the growth traits are either positively or negatively correlated, very few are not significantly correlated. The strongest negative correlations (p < 0.001) are obtained between NH4+ content (leaves, stems and roots) and the other growth indicator such as dry root weight (DRW), fresh root weight (FRW), stem girth (diameter), root area, dry leaf weight (DLW), fresh leaf weight (FLW), dry stem weight (DSW), fresh stem weight (FSW), leaf area, stem K+ content (SK), leaf K+ content (LK), root K+ content (RK), root length, root activity, and stem length. This implies that value increase of NH4+ content in the leaves, stems, and roots leads to a decrease in each of the listed growth variables. However, nearly all other growth variables are positively correlated with each other. For example, increase in SK led to an increase in leaf area (p < 0.001), fresh weights (p < 0.001), among others. The relationship further supported the notion that excessive NH4+ supply leads to plant growth retardation.
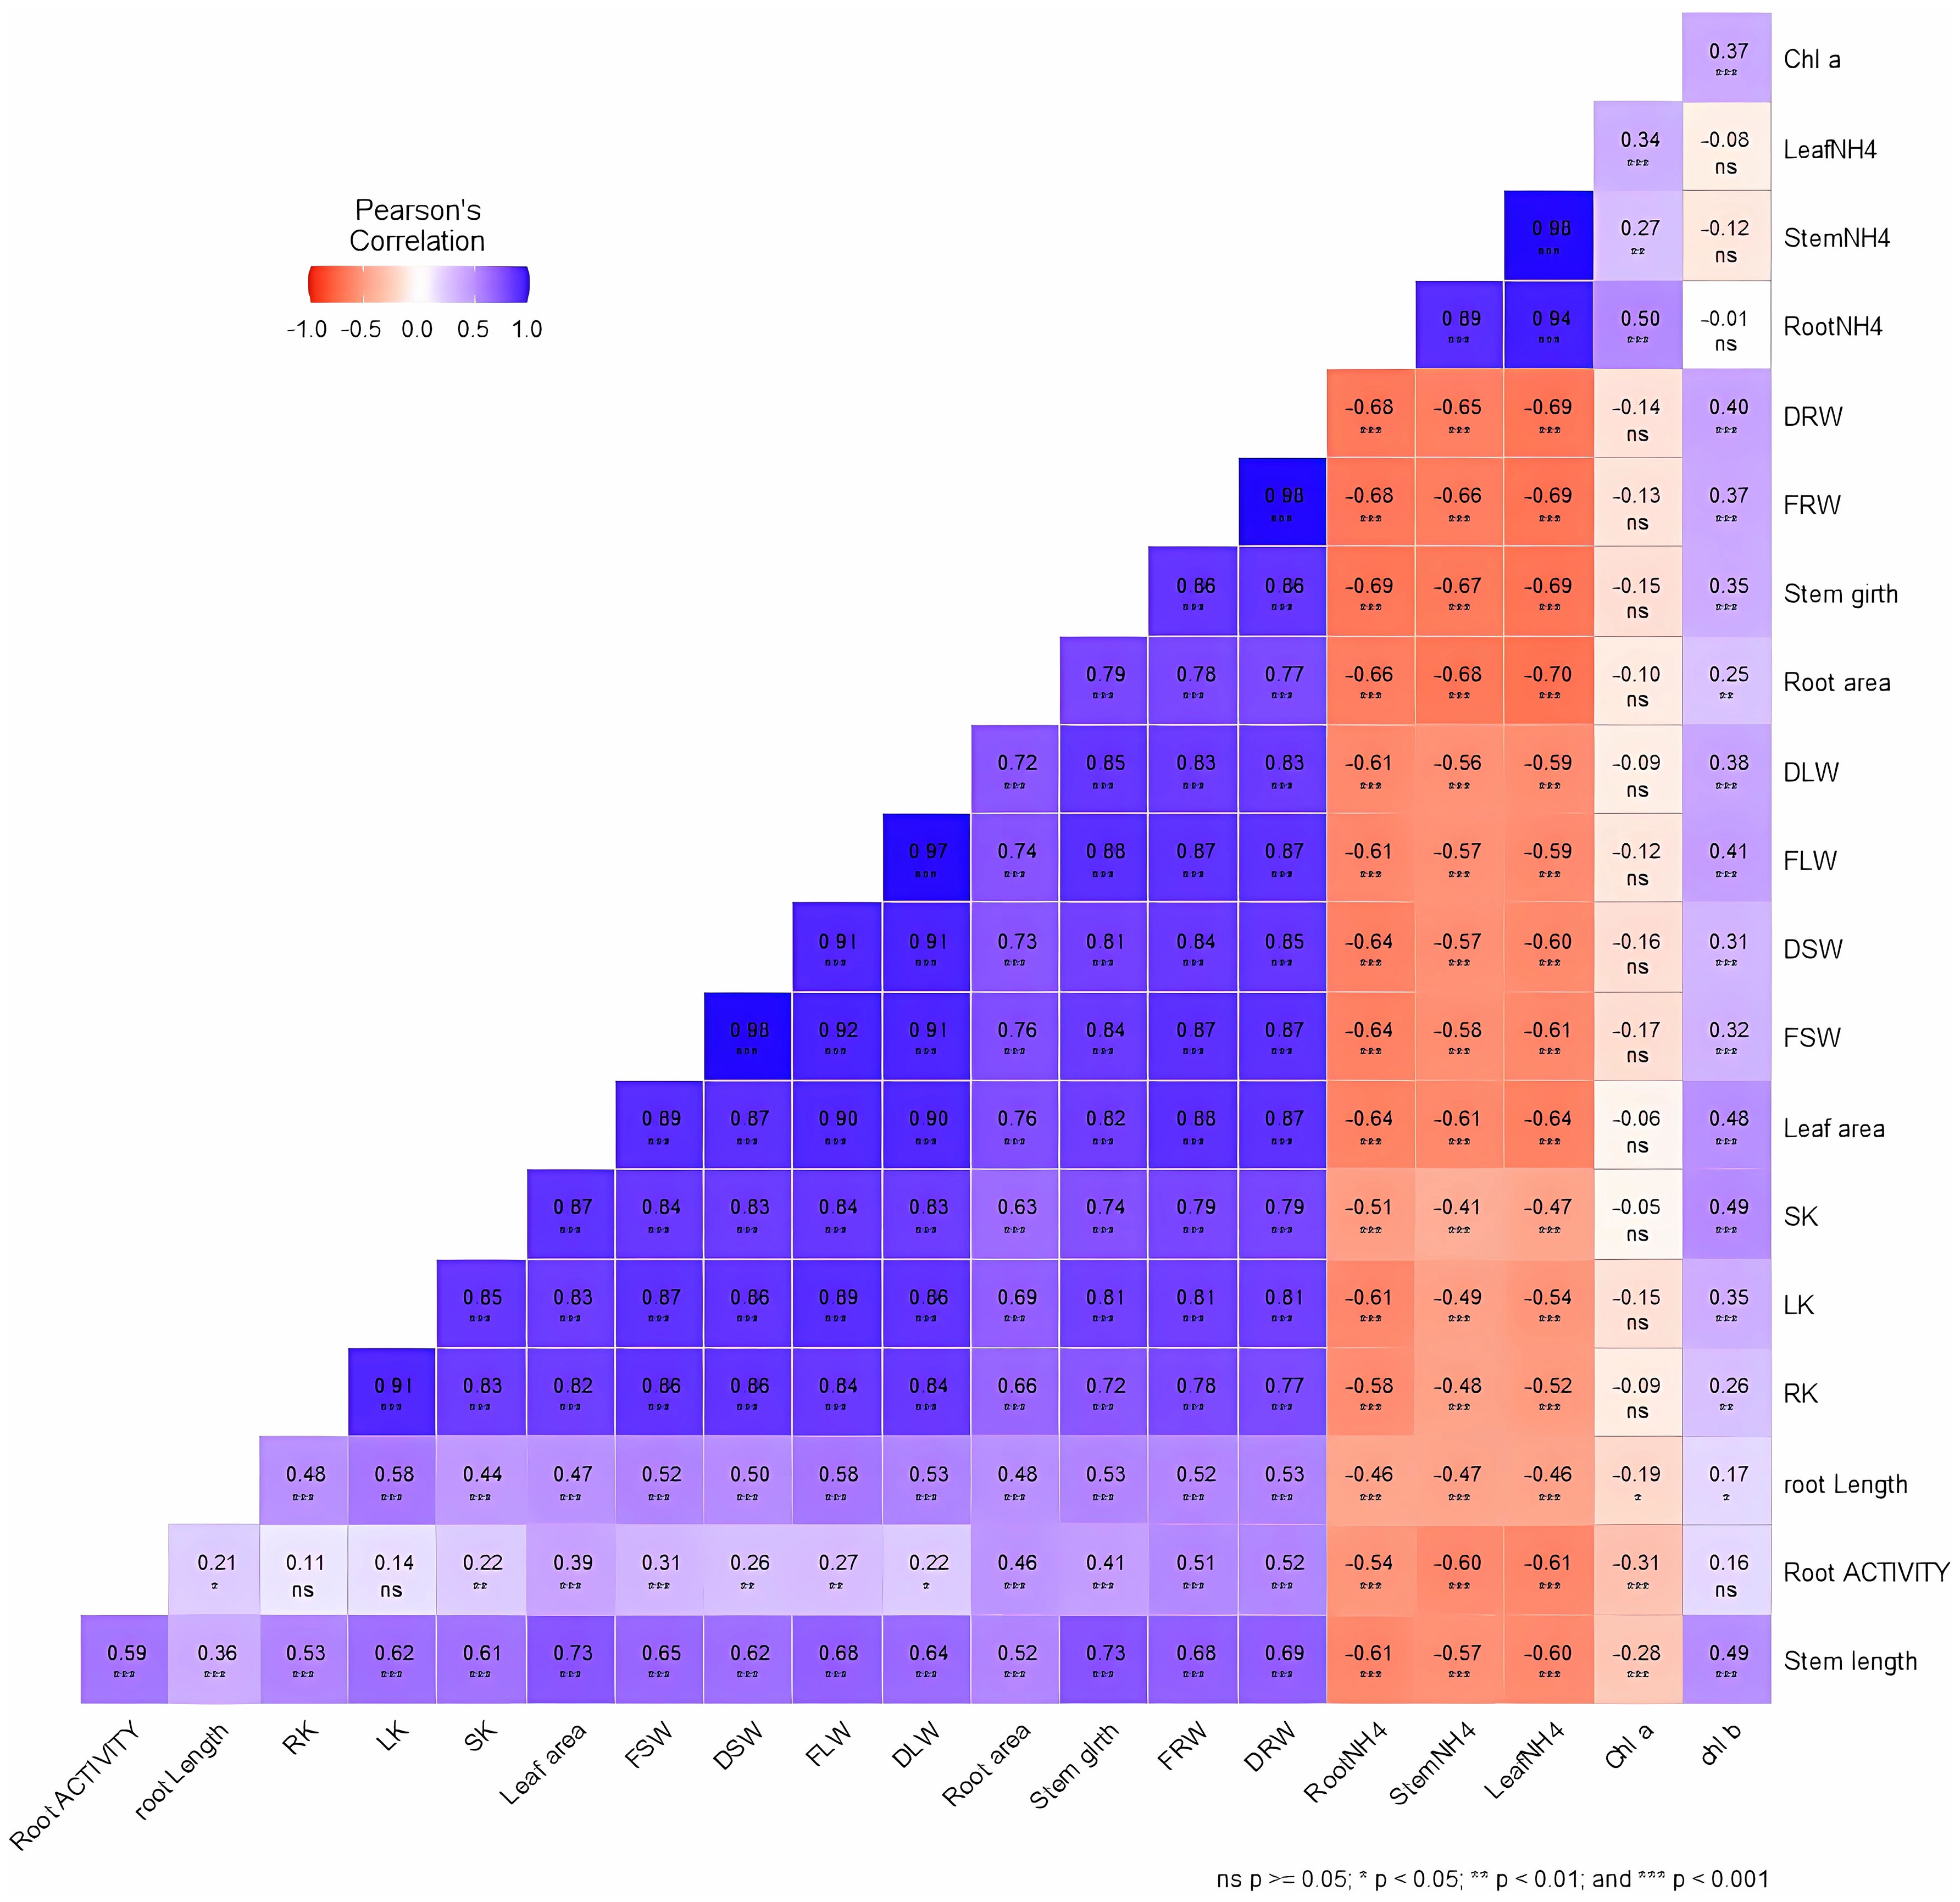
Figure 11 Relationship between growth variables in tobacco leaves, stems, and roots. The correlation analysis was performed using pearson correlation in R studio. ns: no significance difference; *p < 0.05; **p < 0.01; ***p < 0.001. The growth variables is represented by the acronyms in the figure, which include, dry root weight (DRW), fresh root weight (FRW), stem girth (diameter), root area, dry leaf weight (DLW), fresh leaf weight (FLW), dry stem weight (DSW), fresh stem weight (FSW), leaf area, stem K+ content (SK), leaf K+ content (LK), root K+ content (RK), chlorophyll a (Chl a), chlorophyll b (Chl b), leaf NH4+ content (LeafNH4), stem NH4+ content (stem NH4), root NH4+ content (root NH4), root length, root activity, and stem length.
The influence of K+ and nitrogen forms (NH4+ and NO3-) on plant growth and development has been a focus of research (Wang et al., 2003; Szczerba et al., 2008; Zhang et al., 2010; Witold et al., 2017). However, no such research has addressed the appropriate quantity of K+ and NH4+ required to enhance plant growth. To fully understand the effects of varying NH4+/K+ concentration on growth, and the appropriate amount required for optimal growth of tobacco seedlings, the 15-day- NH4+/K+ treated samples were evaluated on a leaf, stem and root basis. Our study revealed that NH4+- K+ concentration had a profound effect on the growth of tobacco seedlings while pinpointing the right combination needed for the optimum seedling growth.
It has been shown that potassium (K+) and nitrogen (N) (ammonium (NH4+) as a major form of inorganic nitrogen) is the most limiting nutrient during plant growth (Szczerba et al., 2008; El Gendy et al., 2015). Thus, symptoms ensued from their excessive supply/deficiency are notable on fresh leaf weight (Figure 1), dry leaf weight (Figure S1) leaf NH4+ and K+ content (Figures 2, 3), leaf area (Figure 4), leaf color (Figure S2) and chlorophyll content (Figure 5). The supply of NH4+ and K+ concentrations to tobacco plants during the seedling stage exerted varying effects on leaf weight. Under increasing NH4+ at constant K+ ratios, the tolerance of tobacco leaf to increasing NH4+/K+ nutrition was optimal at ratios 1:1 (2-2mM, which had the highest fresh leaf weight; 11.2 g/plant), 2:1(2-1 mM; 8.6 g/plant) and 5:1 (5-1 mM; 7.6 g/plant), and beyond these ratios, the tolerance capacity decreased drastically (Figure 1). However, the study by Balkos et al. (2010) revealed optimum leaf growth in rice plants with NH4+- K+ concentration 10-5 mM (ratio 2:1), suggesting strong tolerance of rice to high NH4+ nutrition, indicating that plant tolerance to high NH4+ is plant species dependent. Here, NH4+: K+ ratios beyond 5:1 impaired leaf growth, leading to stunted leaf weight and shrank leaves with deep greenish or yellowish colouration (leaf chlorosis). These symptoms, as presented in Figure S2, are typical of NH4+ toxicity. Also, at NH4+: K+ ratios 10:1, 20:1, 50:1 and 100:1, NH4+ toxicity repressed leaf growth, and reduced leaf K+ content (Figure 2). Following the same ratio pattern (increasing NH4+/constant K+), for example, NH4+/K+ millimolar concentration 2-2 mM at ratio 1:1 had improved leaf weight (11.2 g/plant) and K+ content (1.76 mmolg/DW), whereas, a drastic leaf weight (3.37 g) and K+ content (0.49 mmolg/DW) reduction was observed in NH4+: K+ ratio 20:1 (2-0.1 mM) (Figures 1, 2). This result indicates that leaf growth and K+ content are optimum at equal NH4+/K+ ratios 1:1, but are suppressed beyond ratios 5:1 during the seedling stage (Figures 1, 2). This is supported by previous studies, which reported that excessive supply of NH4+ nutrient represses leaf growth and K+ uptake (Szczerba et al., 2006; Shi et al., 2020a; Aluko et al., 2022). It is worth noting that the reduced K+ content in the leaf could be linked to NH4+ toxicity. Samples with high NH4+ tends to have higher leaf NH4+ content and lower leaf K+ content (Figure 11), an indication that an appropriate amount of these two nutrients is required for growth. Perhaps, the strong negative correlation between NH4+ toxicity and reduced K+ content in plant tissue altered in the balance between these two cations (NH4+ and K+) (Shi et al., 2020a).
Interestingly, beyond the optimal NH4+ - K+ concentrations (at increasing concentrations of both nutrients (NH4+ and K+), leaf weight decreases. Using ratio 1:1 as a good example, tobacco leaf weight at NH4+- K+ concentrations 5-5 mM and 10-10 mM, decreases by 37.5% and 43.5%, respectively, relative to the NH4+- K+ 2-2 mM (where optimal leaf weight was attained) (Figure 1). It appears that excessive supply of NH4+ and K+ beyond the optimal triggers leaf weight reduction, and in line with Shi et al., 2020a, who reported the same for Arabidopsis. The reductions in leaf growth under such high K+ and NH4+ conditions may partly be due to the energetic drain on root cells catalyzing substantial futile cycling of both cations (K+ and NH4+) when nutrient supply is high (Britto and Kronzucker, 2001; Britto and Kronzucker, 2002; Szczerba et al., 2006). Also, low concentrations of NH4+ and K+ may adversely affect leaf growth. In the present study, low NH4+- K+ concentrations (0.1-0.1 mM, 0.1-0.2 mM) had significantly reduced fresh leaf weight (Figures 1, 11). This result demonstrated that K+ and NH4+ deficiency also impair leaf growth (Shi et al., 2020a; Li et al., 2021; Liu et al., 2022), and as such, maintaining an optimal nutritional balance between these two cations becomes expedient.
NH4+ toxicity was mitigated with an additional K+ supply to wheat plants (Guo et al., 2019). Similarly, Kong et al. (2014) revealed that an extra supply of K+ mitigated the detrimental effects of excessive supply of NH4+, thus increasing the culm mechanical strength and N remobilization efficiency of wheat by 23% and 35%, respectively. Our findings showed that maintaining NH4+ and K+ at appropriate concentrations rather than an excessive supply of NH4+, could reduce the incidence of stunted leaf weight and leaf chlorosis. Given that leaf weight and leaf K+ content peaks at NH4+- K+ concentration 2-2 mM (at ratio 1:1), increased leaf weight at this concentration is strongly associated with the leaf K+ content (Figure 11) (Santos et al., 2021). However, at increasing K+ concentrations, the highest leaf weight (11.5 g) was attained at 5-10 mM and was comparable to that observed under 2-2mM (11.2 g) NH4+ - K+ concentration (Figure 1L), demonstrating the putative role of K+ in leaf development. In addition, NH4+: K+ at equal ratios (1:1) enhances the fresh leaf weight of tobacco seedlings. A similar trend was reported in Arabidopsis, with optimal shoot weight attained at NH4+: K+ ratio 1:1 (0.5-0.5 mM) (Shi et al., 2020a).
Leaf surface area is a crucial parameter that determines the capacity of a crop to intercept photosynthetic light, thus, affecting leaf growth and productivity (Weraduwage et al., 2015). Reduction in leaf area was more severe under a high NH4+: constant K+ ratio (Figure 4), thus limiting leaf growth under such conditions. Similar findings have been reported in tobacco (Weraduwage et al., 2015), wheat (Guo et al., 2019), and sugar beet (Raab and Terry, 1994). This finding showed that there is a strong correlation between reduced leaf area and leaf growth; hence the inhibition of tobacco leaf growth could be attributed to a reduction in leaf area (Figure 11). However, at increasing K+ concentration, increased leaf area suggests the crucial role of K+ in leaf expansion (Figures 4, 11) (Hu et al., 2020).
Based on the visual evaluation, leaf chlorophyll content is often assessed in terms of leaf colour. In the present study, we observed that the leaf colour of high NH4+-fed seedlings was dark green (Figure S2), and consequently, higher chlorophyll content was observed in such plants (Figures 5 , 11). This is in line with the study of Bojović and Marković (2009), which revealed that plants exposed to high N have leaves with dark green colour. The dark green leaf colour and enhanced chlorophyll content are associated with N being a structural component of chlorophyll, thereby influencing chloroplast formation in plants. Thus, leaf colour is strongly associated with the N content of the leaf. Nonetheless, under high NH4+ and constant K+ ratios 50:1 and 100:1, a drastic decline in the chlorophyll content was observed, reflecting leaf chlorosis (Figures S2, 5). Light green colouration was observed in the leaves of constant NH4+/increasing K+ - fed plants (Figure S2; Bojović and Marković (2009) reported that cultivars with low N content had reduced chlorophyll content in their leaves. Hence, reductions in the intensity of leaf green colour could be due to the reduced N content and, consequently low chlorophyll content.
We deduced that optimal growth for tobacco leaf during the seedling stage could be achieved with NH4+ and K+ at concentrations of 2-2 mM (ratio 1:1) (Figure 1L). This is because at such concentration, all leaf growth variables were significantly improved compared to positive control. Thus, any further increase or decrease beyond such concentration might not be crucial for tobacco leaf growth at the seedling stage. From our findings, the severity of K+ and NH4+ symptoms due to excessive supply or deficiency was apparent on the leaf growth parameters, which is in line with previous studies (Shi et al., 2020a; Li et al., 2021; Poucet et al., 2021; Saloner and Bernstein, 2022).
Stem growth often depends on the availability of nutrients such as N and K+ (Souza and Tavares, 2021; Xie et al., 2021; Aluko et al., 2022; Marschner and Rengel, 2023). Therefore, stem growth must be ensured to facilitate photosynthates and uptake of nutrient through the root, hence, the need for optimal supply of NH4+ - K+ at the right concentration and ratio.
Various NH4+ - K+ concentrations at different ratios influence stem growth. Our findings showed that thin stems were evident under high NH4+/constant K+, especially at ratios beyond 5:1 (Figures 1, S2), which suggests that the stem biomass was significantly suppressed due to NH4+ toxicity. In addition, stem weight was optimal at 1-2 mM (1:2), demonstrating the preference of stem for K+ over NH4+. This result indicates that tobacco stems are more susceptible to an excessive supply of NH4+, unlike the leaf weight, which was optimal at 2-2 mM (Figure 1).
Moreover, stem K+ content and stem growth were reduced when plants were exposed to NH4+/K+ ratios above 10:1, while NH4+ stem content was increased (Figures 2, 11). This observation was not unexpected as an excessive supply of NH4+ inhibits K+ uptake. Our research findings are in accordance with earlier studies in rice (Szczerba et al., 2008), barley (Walch-Liu et al., 2000), and wheat (Guo et al., 2019), that high NH4+ nutrition reduces K+ uptake and content. The effects of NH4+ toxicity was obviated with the supply of K+ at an increased concentration over NH4+. However, at high NH4+ - K+ concentrations [e.g., 20-2 mM and 10-1 mM (at ratio 10:1)] of both nutrients, K+ content was higher than the positive control (without NH4+) (Figure 2), probably because the K+ concentration was sufficient to counteract the effect of excessive NH4+. Furthermore, our results showed that at concentrations beyond 5-1 mM (at ratio 5:1), a decrease in stem growth was observed, but the K+ content was still high at ratio 10:1 (e.g. 20-2 mM and 10-1 mM) (Figures 1, 2), which indicates that tobacco stem can tolerate excess K+ up to ratios 10:1. The reason for such findings could partly be that under high nutrient supply, there is diversion of energy needed for growth to recycle excessive K+ and NH4+ which culminates in poor nutrient utilization due to energy drain and negative feedback mechanism (Britto et al., 2001; Britto and Kronzucker, 2002; Britto and Kronzucker, 2006). Unexpectedly, at constant NH4+/increasing K+ concentration, a drop in K+ content was notable at; 1-2 mM, 1-5 mM and 0.5-5 mM (Figure 1). A similar reduction was observed when external K+ supply was raised from 1.5 mM to 40 mM in rice seedlings (Szczerba et al., 2008). This interesting phenomenon may suggest the crucial need for a nutritional balance between these ions (NH4+ and K+) for plant growth and development.
We investigated the effect of NH4+ and K+ treatments on stem length and diameters, which are crucial indicators for stem growth. Our results showed that stem diameter was suppressed at ratios exceeding NH4+: K+ ratios 1:1 (Figure 6), while stem length was reduced at NH4+: K+ ratios beyond 2:1 (Figure 7). Also, stem length and stem diameter were increased at an elevated K+ concentration of 5 (NH4+: K+ ratio 1:5) but decreased when K+ exceeded such limit. These findings further demonstrated that stem growth could be enhanced when there is a balance between these ions (NH4+: K+). Zaman et al. (2015) mitigated the negative impact of excessive N application by supplementing with external K+ to improve stem strength and yield. Following the obtained result from stem weight and other growth variables, stem growth appears optimal at NH4+ - K+ concentrations 1-2 mM or 2-2 mM.
The root is the major plant organ responsible for the uptake of water and other mineral nutrients, including K+ and NH4+; hence, it becomes imperative to understand the optimal NH4+ - K+ concentrations required for the proper functioning of the root. The present study evaluated the root growth of tobacco plants at the seedling stage based on their exposure to NH4+ and K+ nutrients at various concentrations. Reductions in root growth evident in thin root and reduced K+ content was observed in increasing NH4+ - constant K+ concentrations beyond 5-1 mM (5:1), suggesting visible symptoms of NH4+ toxicity (Figures 1, S2). In support of this claim, Banuelos et al. (2002) reported reduced K+ uptake in detached rice roots exposed to high NH4+ concentration. The negative effect observed with high NH4+ nutrition was obviated when external K+ was increased (Figure S2), suggesting that NH4+ supply in plants depend on the optimal supply of K+ (Shi et al., 2020a).
Also, root growth variables, including root activity, root length, and root area, were improved with increasing K+ ratios (Figures 8-10). Although increasing K+ exerts a positive effect on root growth, optimal root growth was attained at equal concentrations of NH4+- K+ 2-2 mM (1:1). The response of various parts of tobacco plants organs (leaf, stem, and root) are influenced by both NH4+ - K+ millimolar concentration and ratio at which the nutrient was supplied. This is the first study that examined such influence, regarding NH4+: K+ ratios and concentration to ascertain optimum growth. This justifies why nutrient supply cannot be based only on either concentration or ratio, but on a combination of both provides an in-depth understanding of the optimal growth of tobacco seedlings.
Our study showed that various parts of the tobacco plant (leaf, stem, and root) respond differently to varying concentrations of NH4+/K+ as well as ratios. Optimum growth of tobacco leaf and root were observed with equal concentrations of NH4+/K+ (2-2 mM) at ratio 1:1, whereas stem growth was attained with concentration of 1 mM NH4+ and 2 mM K+ at ratio (1:2). Interestingly, our results explained the degree of tolerance of different organs of tobacco plant to ammonium despite its natural low tolerance for ammonium. This novelty was not explained in previous research on other crops which have low tolerance for ammonium like tobacco, rather the investigations was concentrated on the physiological response of NH4+ to plant yield. The study provided an insight into the right combination of NH4+/K+ that could mitigate or prevent NH4+ or K+ stress in the tobacco seedlings. In the same lieu, the large sample size (47 treatments) at 12 NH4+/K+ ratios lends an evidence for determination of optimal concentration of NH4+/K+ required for growth of tobacco seedling in a hydroponic system. Although, this present study found that NH4+/K+ concentrations stated above would be required for optimal growth of different organs of tobacco plant at seedling stage, further research would be required to validate the optimal NH4+ - K+ concentration, and at what ratio, required for growth at a later developmental stage of tobacco plant.
The original contributions presented in the study are included in the article Supplementary Material. Further inquiries can be directed to the corresponding authors.
CL and OA, designed the experiment, carried out most experiments, data analysis, and wrote the manuscript. SS participated in the design and provided useful advice. ZM, TN, CS, and ZL participated in the sample collection and parameter measurements. QW and HL conceived of the study and participated in its design and coordination. All authors contributed to the article and approved the submitted version.
This work was funded by the National Natural Science Foundation of China (32170387); the Agricultural Science and Technology Innovation Program (ASTIP-TRIC02); the International Foundation of Tobacco Research Institute of Chinese Academy of Agricultural Sciences (IFT202102); the Fundamental Research Funds for China Agricultural Academy of Sciences (1610232021002); the Key Funding of CNTC (No. 110202101035(JY-12)) and YNTI (No. 2022JY03).
We would like to thank Guang Yuan, Jiaping Yuan, Jingjing Mao from Tobacco Research Institute for valuable suggestions in tobacco breeding, Prof. Yuhe Sun, Prof. Yongfeng Guo, Prof. Aiguo Yang and Mengmeng Cui from Tobacco Research Institute for the support during the experiments, and G.A. Adegbite for helping out with the correlation analysis.
SS was employed by Shanghai Tobacco Company, Ltd. ZM and ZL were was employed by Yichang City Company, Hubei Tobacco Company.
The remaining authors declare that the research was conducted in the absence of any commercial or financial relationships that could be constructed as a potential conflict of interest.
All claims expressed in this article are solely those of the authors and do not necessarily represent those of their affiliated organizations, or those of the publisher, the editors and the reviewers. Any product that may be evaluated in this article, or claim that may be made by its manufacturer, is not guaranteed or endorsed by the publisher.
The Supplementary Material for this article can be found online at: https://www.frontiersin.org/articles/10.3389/fpls.2023.1152817/full#supplementary-material
Supplementary Figure 1 | Dry weight of leaf (FLW), stem (FSW), and root (FRW) of tobacco plants as affected by different NH4+/K+ ratios. Graphs (A-G) represent increasing NH4+ at constant K+ (at 1) ratios. (A) NH4+/K+ ratio 1:1, (B) 2:1, (C) 5:1, (D) 10:1, (E) 20:1, (F) 50:1, and (G) 100:1. Graphs (H-K) connote constant NH4+ (at 1) at increasing K+ ratio. (H) NH4+/K+ ratio 1:2, (I) 1:5, (J) 1:10, (K) 1:20 (0.1-2 mM and 0.5-10 mM) and 1:50 (0.1-5 mM and 0.2-10 mM). (L) comparison of NH4+-K+ concentration within each ratio. All the NH4+/K+ concentration within each ratio were compared with the positive (without NH4+, but with K+).and negative control (without NH4+ and K+). Dry weight was determined 15 days after treatment. Letters represent the mean values ± SD (n= 15 biological replicates). The bars without letters have extremely low mean values.
Supplementary Figure 2 | Tobacco seedlings subjected to various NH4+/K+ concentrations at different ratios. Plants were grown in a hydroponic system with all nutrients, including 1.4 mM NO3- as N source but without NH4+ or K+ for 6 days and subsequently treated with different NH4+ and K+ for 15 days as indicated.
Aluko, O. O., Li, C., Wang, Q., Liu, H. (2021). Sucrose utilization for improved crop yields: a review article. Int. J. Mol. Sci. 22, 4704. doi: 10.3390/ijms22094704
Aluko, O. O., Li, C., Yuan, G., Nong, T., Xiang, H., Wang, Q., et al. (2022). Differential effects of ammonium (NH4+) and potassium (K+) nutrition on photoassimilate partitioning and growth of tobacco seedlings. Plants 11, 3295. doi: 10.3390/plants11233295
Balkos, K. D., Britto, D. T., Kronzucker, H. J. (2010). Optimization of ammonium acquisition and metabolism by potassium in rice (Oryza sativa l. cv. IR-72). Plant Cell Environ. 33 (1), 23–34. doi: 10.1111/j.1365-3040.2009.02046.x
Banuelos, M. A., Garciadeblas, B., Cubero, B., Rodrıguez-Navarro, A. (2002). Inventory and functional characterization of the HAK potassium transporters of rice. Plant Physiol. 130, 784–795. doi: 10.1104/pp.007781
Bojović, B., Marković, A. (2009). Correlation between nitrogen and chlorophyll content in wheat (Triticum aestivum L.). Kragujevac J. Sci. 31, 69–74.
Borges, A., Morejón, R., Izquierdo, A., Ortega, E., Rodes, R. (2012). Nitrogen fertilization for optimizing the quality and yield of shade grown Cuban cigar tobacco: required nitrogen amounts, application schedules, adequate leaf nitrogen levels, and early season diagnostic tests. Contributions to Tobacco Nicotine Res. 25, 336–349. doi: 10.2478/cttr-2013-0913
Britto, D. T., Kronzucker, H. J. (2001). Can unidirectional influx be measured in higher plants? a mathematical approach using parameters from efflux analysis. New Phytol. 150, 37–47. doi: 10.1046/j.1469-8137.2001.00080.x
Britto, D. T., Kronzucker, H. J. (2002). NH4+ toxicity in higher plants: a critical review. J. Plant Physiol. 159, 567–584. doi: 10.1078/0176-1617-0774
Britto, D. T., Kronzucker, H. J. (2006). Futile cycling at the plasma membrane: a hallmark of low-affinity nutrient transport. Trends Plant Sci. 11, 529–534. doi: 10.1016/j.tplants.2006.09.011
Britto, D. T., Siddiqi, M. Y., Glass, A. D., Kronzucker, H. J. (2001). Futile transmembrane NH4+ cycling: a cellular hypothesis to explain ammonium toxicity in plants. Proc. Natl. Acad. Sci. 98, 4255–4258. doi: 10.1073/pnas.061034698
Chen, H., Zhang, Q., Wang, X., Zhang, J., Ismail, A. M., Zhang, Z. (2021). Nitrogen form-mediated ethylene signal regulates root-to-shoot k+ translocation via NRT1. 5. Plant Cell Environ. 44, 3806–3818. doi: 10.1111/pce.14182
Dong, L., Wang, Q., Manik, S. N., Song, Y., Shi, S., Su, Y., et al. (2015). Nicotiana sylvestris calcineurin b-like protein NsylCBL10 enhances salt tolerance in transgenic arabidopsis. Plant Cell Rep. 34, 2053–2063. doi: 10.1007/s00299-015-1851-4
Dubey, R. S., Srivastava, R. K., Pessarakli, M. (2021). “Physiological mechanisms of nitrogen absorption and assimilation in plants under stressful conditions,” in Handbook of plant and crop physiology (New York: CRC Press), 579–616. doi: 10.1201/9781003093640
El Gendy, A., El Gohary, A., Omer, E., Hendawy, S., Hussein, M., Petrova, V., et al. (2015). Effect of nitrogen and potassium fertilizer on herbage and oil yield of chervil plant (Anthriscus cerefolium l.). Ind. Crops Products 69, 167–174. doi: 10.1016/j.indcrop.2015.02.023
Fang, G., Yang, J., Sun, T., Wang, X., Li, Y. (2021). Evidence that synergism between potassium and nitrate enhances the alleviation of ammonium toxicity in rice seedling roots. PloS One 16, e0248796. doi: 10.1371/journal.pone.0248796
Guo, J., Jia, Y., Chen, H., Zhang, L., Yang, J., Zhang, J., et al. (2019). Growth, photosynthesis, and nutrient uptake in wheat are affected by differences in nitrogen levels and forms and potassium supply. Sci. Rep. 9, 1248. doi: 10.1038/s41598-018-37838-3
Hu, W., Lu, Z., Meng, F., Li, X., Cong, R., Ren, T., et al. (2020). The reduction in leaf area precedes that in photosynthesis under potassium deficiency: the importance of leaf anatomy. New Phytol. 227, 1749–1763. doi: 10.1111/nph.16644
Katz, E., Knapp, A., Lensink, M., Keller, C. K., Stefani, J., Li, J.-J., et al. (2022). Genetic variation underlying differential ammonium and nitrate responses in arabidopsis thaliana. Plant Cell 34, 4696–4713. doi: 10.1093/plcell/koac279
Kong, L., Sun, M., Wang, F., Liu, J., Feng, B., Si, J., et al. (2014). Effects of high NH+ 4 on k+ uptake, culm mechanical strength and grain filling in wheat. Front. Plant Sci. 5, 703. doi: 10.3389/fpls.2014.00703
Li, J., Hu, W., Lu, Z., Meng, F., Cong, R., Li, X., et al. (2021). Imbalance between nitrogen and potassium fertilization influences potassium deficiency symptoms in winter oilseed rape (Brassica napus L.) leaves. Crop J. 10 (2), 565–576. doi: 10.1016/j.cj.2021.06.001
Liang, H., Wang, L., Wang, Y., Quan, X., Li, X., Xiao, Y., et al. (2022). Root development in cunninghamia lanceolata and schima superba seedlings expresses contrasting preferences to nitrogen forms. Forests 13, 2085. doi: 10.3390/f13122085
Liu, J., Xia, H., Gao, Y., Pan, D., Sun, J., Liu, M., et al. (2022). Potassium deficiency causes more nitrate nitrogen to be stored in leaves for low-K sensitive sweet potato genotypes. Front. Plant Sci. 13, 4688. doi: 10.3389/fpls.2022.1069181
Liu, R.-X., Zhou, Z.-G., Guo, W.-Q., Chen, B.-L., Oosterhuis, D. M. (2008). Effects of n fertilization on root development and activity of water-stressed cotton (Gossypium hirsutum l.) plants. Agric. Water Manage. 95, 1261–1270. doi: 10.1016/j.agwat.2008.05.002
Lu, Y. X., Li, C. J., Zhang, F. (2005). Transpiration, potassium uptake and flow in tobacco as affected by nitrogen forms and nutrient levels. Ann. Bot. 95, 991–998. doi: 10.1093/aob/mci104
Marschner, P., Rengel, Z. (2023). “Chapter 12 - Nutrient availability in soils,” in Rengel, Z., Cakmak, I., White, P. J. Eds. Marschner's Mineral Nutrition of Plants (Fourth Edition) (Academic Press), 499–522. doi: 10.1016/B978-0-12-819773-8.00003-4
Nawarathna, K., Dandeniya, W., Dharmakeerthi, R., Weerasinghe, P. (2021). Vegetable crops prefer different ratios of ammonium-n and nitrate-n in the growth media. Trop. Agric. Res. 32, 95–104. doi: 10.4038/tar.v32i1.8445
Ninkuu, V., Liu, Z., Sun, X. (2023). Genetic regulation of nitrogen use efficiency in gossypium spp. Plant Cell Environ. 46 (6), 1749–1773. doi: 10.1111/pce.14586
Poucet, T., González-Moro, M. B., Cabasson, C., Beauvoit, B., Gibon, Y., Dieuaide-Noubhani, M., et al. (2021). Ammonium supply induces differential metabolic adaptive responses in tomato according to leaf phenological stage. J. Exp. Bot. 72, 3185–3199. doi: 10.1093/jxb/erab057
Raab, T. K., Terry, N. (1994). Nitrogen source regulation of growth and photosynthesis in beta vulgaris l. Plant Physiol. 105, 1159–1166. doi: 10.1104/pp.105.4.1159
Saloner, A., Bernstein, N. (2022). Nitrogen source matters: high NH4/NO3 ratio reduces cannabinoids, terpenoids, and yield in medical cannabis. Front. Plant Sci. 1209. doi: 10.3389/fpls.2022.830224
Santos, E. F., Mateus, N. S., Rosario, M. O., Garcez, T. B., Mazzafera, P., Lavres, J. (2021). Enhancing potassium content in leaves and stems improves drought tolerance of eucalyptus clones. Physiol. Plant 172, 552–563. doi: 10.1111/ppl.13228
Shi, S., Xu, F., Ge, Y., Mao, J., An, L., Deng, S., et al. (2020a). NH4+ toxicity, which is mainly determined by the high NH4+/K+ ratio, is alleviated by CIPK23 in arabidopsis. Plants 9, 501. doi: 10.3390/plants9040501
Souza, L. A., Tavares, R. (2021). Nitrogen and stem development: a puzzle still to be solved. Front. Plant Sci. 12, 630587. doi: 10.3389/fpls.2021.630587
Szczerba, M. W., Britto, D. T., Ali, S. A., Balkos, K. D., Kronzucker, H. J. (2008). NH4+-stimulated and-inhibited components of k+ transport in rice (Oryza sativa l.). J. Exp. Bot. 59, 3415–3423. doi: 10.1093/jxb/ern190
Szczerba, M. W., Britto, D. T., Kronzucker, H. J. (2006). Rapid, futile k+ cycling and pool-size dynamics define low-affinity potassium transport in barley. Plant Physiol. 141, 1494–1507. doi: 10.1104/pp.106.082701
Vu, D. H., Stuerz, S., Pieters, A., Asch, F. (2021). Leaf gas exchange of lowland rice in response to nitrogen source and vapor pressure deficit. J. Plant Nutr. Soil Sci. 184, 448–460. doi: 10.1002/jpln.202100032
Walch-Liu, P., Neumann, G., Bangerth, F., Engels, C. (2000). Rapid effects of nitrogen form on leaf morphogenesis in tobacco. J. Exp. Bot. 51, 227–237. doi: 10.1093/jexbot/51.343.227
Wang, G., Li, C., Zhang, F. (2003). Effects of different nitrogen forms and combination with foliar spraying with 6-benzylaminopurine on growth, transpiration, and water and potassium uptake and flow in tobacco. Plant Soil 256, 169–178. doi: 10.1023/A:1026268722353
Weraduwage, S. M., Chen, J., Anozie, F. C., Morales, A., Weise, S. E., Sharkey, T. D. (2015). The relationship between leaf area growth and biomass accumulation in arabidopsis thaliana. Front. Plant Sci. 6, 167. doi: 10.3389/fpls.2015.00167
Witold, G., Pavel, Č., Evan, R., Witold, S., Jarosław, P., György, F. (2017). Potassium impact on nitrogen use efficiency in potato–a case study from the central-East Europe. Plant Soil Environ. 63, 422–427. doi: 10.17221/344/2017-PSE
Xiao, C., Fang, Y., Wang, S., He, K. (2023). The alleviation of ammonium toxicity in plants. J. Integr. Plant Biol. 10.1111/jipb.13467. Advance online publication. doi: 10.1111/jipb.13467
Xie, K., Cakmak, I., Wang, S., Zhang, F., Guo, S. (2021). Synergistic and antagonistic interactions between potassium and magnesium in higher plants. Crop J. 9, 249–256. doi: 10.1016/j.cj.2020.10.005
Zaman, U., Ahmad, Z., Farooq, M., Saeed, S., Ahmad, M., Wakeel, A. (2015). Potassium fertilization may improve stem strength and yield of basmati rice grown on nitrogen-fertilized soils. Pakistan J. Agric. Sci. 52, 439–445.
Zhang, F., Niu, J., Zhang, W., Chen, X., Li, C., Yuan, L., et al. (2010). Potassium nutrition of crops under varied regimes of nitrogen supply. Plant Soil 335, 21–34. doi: 10.1007/s11104-010-0323-4
Keywords: NH4+ -K+ concentrations, NH4+: K+ ratios, tobacco seedling growth, NH4+ toxicity, tobacco plant organs (leaf, stem, and root)
Citation: Li C, Aluko OO, Shi S, Mo Z, Nong T, Shi C, Li Z, Wang Q and Liu H (2023) Determination of optimal NH4+/K + concentration and corresponding ratio critical for growth of tobacco seedlings in a hydroponic system. Front. Plant Sci. 14:1152817. doi: 10.3389/fpls.2023.1152817
Received: 28 January 2023; Accepted: 19 May 2023;
Published: 11 July 2023.
Edited by:
Li Wang, Shandong Academy of Agricultural Sciences, ChinaReviewed by:
Lei Ding, Université Catholique de Louvain, BelgiumCopyright © 2023 Li, Aluko, Shi, Mo, Nong, Shi, Li, Wang and Liu. This is an open-access article distributed under the terms of the Creative Commons Attribution License (CC BY). The use, distribution or reproduction in other forums is permitted, provided the original author(s) and the copyright owner(s) are credited and that the original publication in this journal is cited, in accordance with accepted academic practice. No use, distribution or reproduction is permitted which does not comply with these terms.
*Correspondence: Qian Wang, d2FuZ3FpYW4wMUBjYWFzLmNu; Haobao Liu, bGl1aGFvYmFvQGNhYXMuY24=
†These authors have contributed equally to this work
Disclaimer: All claims expressed in this article are solely those of the authors and do not necessarily represent those of their affiliated organizations, or those of the publisher, the editors and the reviewers. Any product that may be evaluated in this article or claim that may be made by its manufacturer is not guaranteed or endorsed by the publisher.
Research integrity at Frontiers
Learn more about the work of our research integrity team to safeguard the quality of each article we publish.