
94% of researchers rate our articles as excellent or good
Learn more about the work of our research integrity team to safeguard the quality of each article we publish.
Find out more
ORIGINAL RESEARCH article
Front. Plant Sci., 10 August 2023
Sec. Sustainable and Intelligent Phytoprotection
Volume 14 - 2023 | https://doi.org/10.3389/fpls.2023.1152698
This article is part of the Research TopicAI-Empowered Services for Interconnected Smart Plant Protection SystemsView all 7 articles
 Meng Chen
 Xiang-Dong Liu*
Estimating population density is a fundamental study in ecology and crop pest management. The density estimation of small-scale animals, such as insects, is a challenging task due to the large quantity and low visibility. An herbivorous insect is the big enemy of crops, which often causes serious losses. Feeding of insects results in changes in physiology-related chemical compositions of crops, but it is unknown whether these changes can be used to estimate the population density of pests. The brown planthopper (BPH), Nilaparvata lugens, is a serious insect pest hiding under rice canopy to suck the sap of rice stems. BPH density is a crucial indicator for determining whether the control using pesticides will be carried out or not. Estimating BPH density is still dependent on manmade survey and light-trap methods, which are time-consuming and low-efficient. Here, we developed a new method based on the physiological traits of rice leaves. The feeding of BPHs significantly decreased the contents of chlorophyll (the SPAD readings), water, silicon, and soluble sugar in rice leaves. Four ratio physiological indices based on these four physiological traits of the BPH-damaged rice leaves to those of healthy leaves were established, and they were significantly correlated with BPH density in rice plants. A rice growth stage-independent linear model based on the four ratio physiological indices and adding the other two variables, BPH damage duration and population increase rate, was developed. This model exhibited a reasonable accuracy for estimating BPH density. This new method will promote the development of density estimation of pest populations toward nonprofessionalization and automation.
Density estimation of animals is an important and challenging task in ecology and crop pest management that requires multiple skills, including sampling technique, species recognition and counting, data analysis, and density computing. The traditional methods for density estimation are mainly dependent on manmade investigation and traps using specific devices, such as light and net (Anderson et al., 1983; Parmenter and Macmahon, 1989; Keeping, 2014), although automatic recording via camera or other devices has been developed (Silveira et al., 2003; Rowcliffe et al., 2008; Nakashima et al., 2018; Yajima and Nakashima, 2021). These traditional methods totally rely on manual labor, and they are time-consuming and low-efficient. So, simple, less labor-intensive, and highly efficient methods are necessary in ecology and plant protection.
The brown planthopper (BPH), Nilaparvata lugens, is a devastating small-body insect pest of rice throughout Asia that hides under the rice canopy and sucks sap from the stem, often causing heavy losses of rice yield (Dyck and Thomas, 1979; Sogawa, 1982; Heong et al., 2015). Due to the small body size, large population density, and complex rice paddy system, estimating the density of BPH is a professional and highly labor-intensive task. Monitoring and prewarning of BPH population dynamics are fundamental to effectively managing this pest and mitigating the loss. BPH monitoring is still strongly dependent on manmade investigation in rice fields and light trapping for the migratory populations (Hu et al., 2011; Liu, 2013; Masarudin et al., 2019). These methods have the obvious characteristics of low efficiency, high labor intensity, and high professional requirements. Although the image recognition and counting techniques (Yao et al., 2014; Yu et al., 2019) and spectral remote sensing (Huang et al., 2015; Ghobadifar et al., 2016a; Ghobadifar et al., 2016b; Liu and Sun, 2016) have been found to have potential for estimating the density of rice planthoppers, their practical application is still rare because these methods are restricted by environmental conditions. Therefore, a practical, simple, and automatic technique is demanded and promising in rice planthopper monitoring.
The chemical composition, such as chlorophyll, water, and soluble sugar, will change when plants are damaged by sap-sucking insects. Aphid infestation resulted in a significant reduction of chlorophyll content of crops (Lal, 1973; Burd and Elliott, 1996). Aphids Lipaphis erysimi (Kalt) and Myzus persicae (Sulzer) significantly reduced the nutritional constituents of mustard plants, such as lipid, carbohydrate, nitrogen, and protein concentrations (Pushpa and Sinhal, 2011). Infestation of the cotton-melon aphid Aphis gossypii induced a significant reduction of total soluble sugar contents in watermelon seedlings (Wu et al., 2015). The water potentials in young barley plants became lower after infestation with the green bug Schizaphis graminum (Cabrera et al., 1995). Rice planthopper damage also leads to changes in the chemical composition of rice. The infestation with brown planthopper Nilaparvata lugens decreased the contents of water, total chlorophyll, and free sugars of rice plants (Cagampang et al., 1974), and in the susceptible rice varieties, the chlorophyll contents in leaves decreased by more than 20% (Chen et al., 2003). However, the relationship between changes in the chemical composition of crops and the population density of pests damaging the crop is still vague. When this relationship unfolds, it will be useful for monitoring pest density.
So, in this study, we aimed to develop a new method for estimating BPH density based on physiological traits of rice plants and carried out studies on (1) the effect of BPHs on physiological traits of rice leaves, contents of chlorophyll (denoted using SPAD readings), water, soluble sugar, and silicon at different growth stages of rice plants; (2) establishing ratio physiological index (RPI) based on these physiological traits of the BPH-damaged and healthy rice leaves; (3) simulating the relationship between RPI and BPH density; and (4) establishing a general model based on RPI and testing the estimation accuracy in the following 2 years. A new nonprofessional and automatable method for estimating BPH density was developed by examining the physiological index of rice leaves (Figure 1).
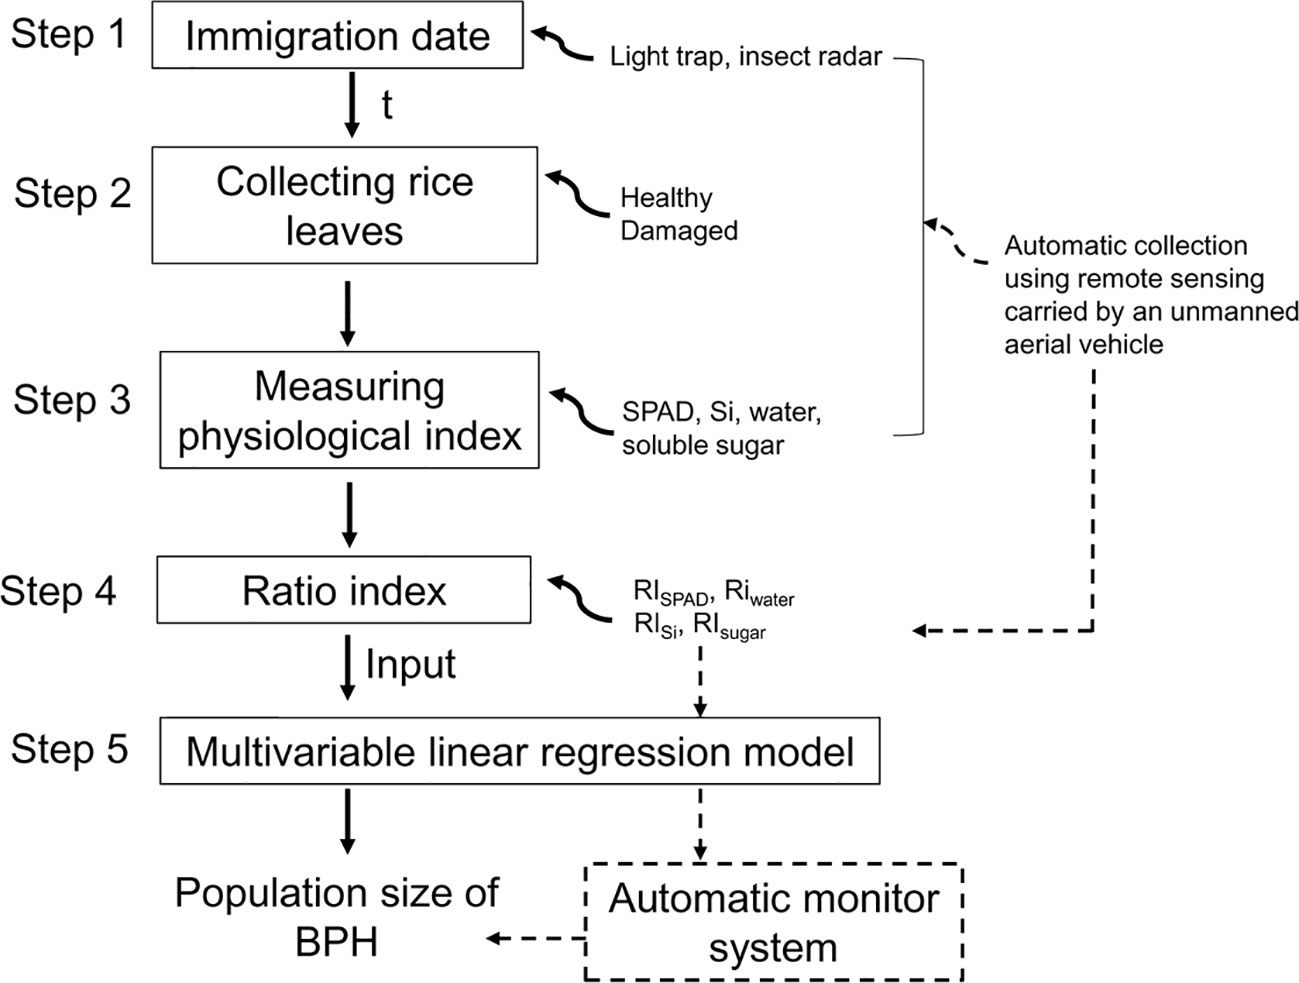
Figure 1 Flowchart of establishing a BPH monitor method based on the ratio physiological index of rice leaves. The solid line means the process has been established in this study, and the dashed line means it will be established. t means the damage duration of BPH.
The BPH, Nilaparvata lugens, was reared in the laboratory using rice seedlings at 25°C and 70%–80% RH. The rice cultivar was Wuyunjing 7 widely planted in Jiangsu province, China. The rice was planted in a plastic cup (diameter 8.4 cm, height 10.0 cm) with one hill of rice or in a pot (diameter, 33.0 cm; height, 32.5 cm) with three hills. Each hill of rice included three rice seedlings when transplanted.
Two-day-old adults of BPH were released onto cup-grown rice plants. Seven population densities, 0, one, two, three, four, five, and six pairs of female and male adults per hill of rice, were designed to generate rice plants with different degrees of damage by BPHs. After the release of BPH, the rice plants were covered using a transparent plastic box to avoid the escape of BPH, and then the number of BPH was examined every day and new ones were added when the adults died to maintain a constant density of BPH on the rice plants. The release time of BPH adults was performed at four growth stages of rice: tillering, jointing, booting, and heading stages, respectively, to explore the effect of the rice growth stage on the density estimation of BPH. After 1 and 2 weeks (two damage durations), the upper three leaves of a rice plant were collected for examining the traits: SPAD readings and contents of water, Si, and soluble sugar. The experiment for each BPH density (seven densities in total) in a growth stage of rice plants was performed with four replicates. A combination of four BPH release times and two damage durations formed eight types of BPH-damaged cases. Each type of damage case included four replicates, and each replicate had seven sets of BPH densities. So, 8 × 4 × 7 = 224 cases of BPH damage were established in the cup-grown rice plants.
A chlorophyll meter (SPAD-502, Soil–Plant Analysis Development Section, Minolta Camera Co., Osaka, Japan) was used to examine the SPAD readings of a rice leaf. Three SPAD readings of a leaf were measured at three equal-part points, and the upper three leaves of a rice plant randomly collected in the cup-grown rice (Huang et al., 2015). The mean of all nine SPAD readings from a rice plant was considered the SPAD reading of a cup of rice. The relative water content of rice leaves was measured using the gravimetric method. The fresh weight (FW) of the upper three leaves of a rice plant was measured, and then these leaves were placed in a hot oven at 100°C to dry. The constant weight of the dried leaves was considered the dried weight (DW). The relative water content (H2O %) was computed using H2O % = (FW − DW)/FW × 100. The content of soluble sugar in rice leaves was measured using the anthrone-H2SO4 colorimetry method followed by Chang et al. (2022). The content of silicon in rice leaves was examined using an autoclave-induced digestion method (Elliott and Snyder, 1991). The rice leaves in all 224 cases of BPH damage were measured.
The SPAD readings and contents of H2O, Si, and soluble sugar in rice leaves are affected not only by the BPH damage but also by the rice growth stage. To remove the effect of the latter, the ratio physiological index (RPI) of rice leaves was established using the ratio of a physiological trait value of BPH-damaged rice leaves to that of healthy rice leaves without BPHs. For example, the ratio physiological index of SPAD readings (RPISPAD) was computed: RPISPAD = (SPAD readings of rice leaves damaged by BPH)/(SPAD readings of healthy rice leaves). Four ratio physiological indices, RPISPAD, RPIwater, RPISi, and RPIsugar, based on the SPAD reading and contents of H2O, Si, and soluble sugar in leaves, were established, respectively.
Based on the RPI data collected from the cup-grown rice plants damaged by different BPH densities for 1 and 2 weeks mentioned above, the correlation between a PRI RPISPAD, RPISi, RPIwater, or RPIsugar and the BPH density damaging rice plants was analyzed using the Pearson method, and a significant correlation was found at almost all eight types of BPH-damaged case (Table 1). Therefore, we established eight multivariable linear regression models for estimating the BPH density (NBPH) in each type of damage case, respectively. For example, a model for estimating BPH density on the tillering rice damaged for 1 week was as follows: NBPH-1 = C0 + C1 × RPISPAD + C2 × RPISi + C3 × RPIwater + C4 × RPIsugar, where C0, C1, C2, C3, and C4 are constants. The F and p-values and the correlation coefficient between estimated and measured BPH density were used to assess the goodness-of-fit tests of a model. These eight case-specific models exhibited a good potential to estimate the population density of BPH, but their application range might be limited because they were rice growth stage and damage duration-specific.
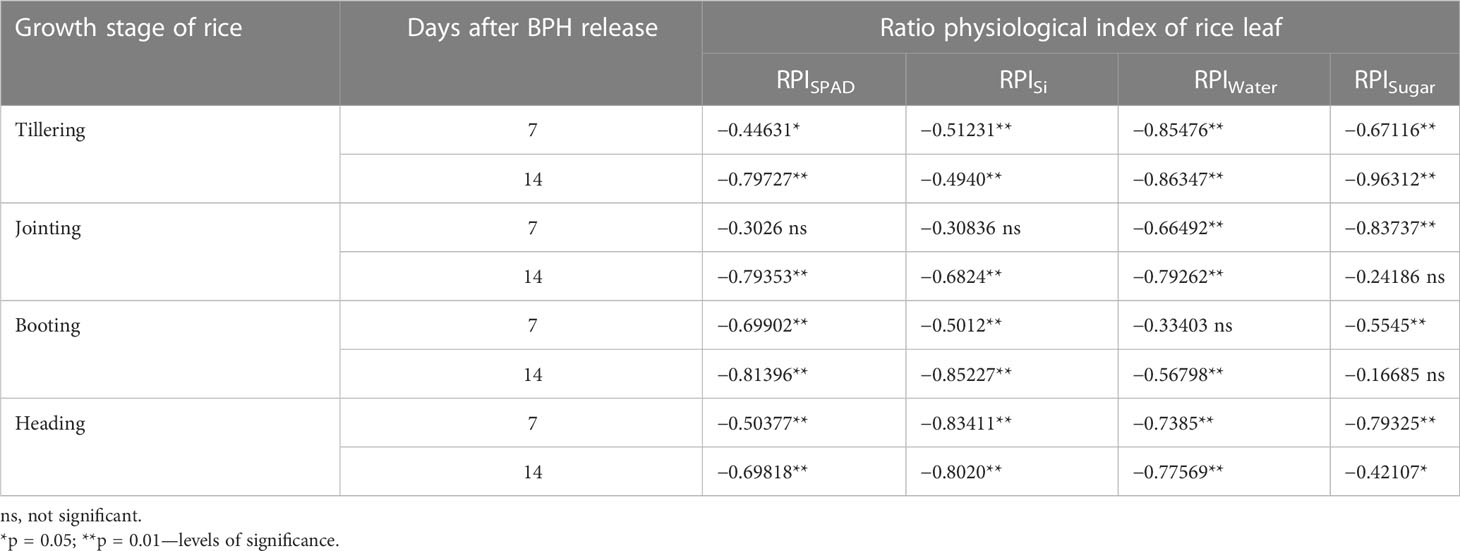
Table 1 Coefficient of correlation between ratio physiological index of rice leaf and BPH density damaged rice for 7 and 14 days.
The RPI was derived from the ratio based on damaged to healthy rice leaves, so the value was almost independent of the rice growth stage. However, the damage duration (t) and population increase rate (α) of BPH will impact the RPI. So, a general RPI model including these two factors (t and α) was established here, NBPH-t = α × (t − 1)(C0 + C1 × RPISPAD + C2 × RPISi + C3 × RPIwater + C4 × RPIsugar) (t ≥ 2), where RPISPAD, RPISi, RPIwater, and RPIsugar are the ratio physiological indices of SPAD readings and contents of Si, water, and soluble sugar in rice leaves measured at t weeks after BPH release or immigration. When t = 1, the model was NBPH-1 = C0 + C1 × RPISPAD + C2 × RPISi + C3 × RPIwater + C4 × RPIsugar. The increased rate of BPH (α) in a week can be empirically estimated via investigation. This general model can be used when the immigration peak of BPH has been known.
We tested the validity of the general model in 2019 and 2020 using pot-grown rice plants with three hills of rice per pot. In the tillering stage, 0, one, two, three, four, five, and six pairs of female and male BPH adults were released into a pot of rice, respectively, and then the rice plants were covered using a transparent plastic box. The number of BPH on three hills of rice in a pot was investigated at 1, 3, 4, 5, 6, and 7 weeks after BPH release in 2019, and at 1, 3, 4, and 7 weeks in 2020. On the same day, the rice leaves were collected to examine the SPAD readings and contents of H2O, Si, and soluble sugar using the same method as mentioned above. Four and five replicates were performed for each population density in 2019 and 2020, originally released into a pot of rice plants, respectively. A total of 168 and 140 time-series samples were attained in 2019 and 2020, respectively. The increased rate of BPH in a week (α) was approximately 5/3 found in 2 years of investigation (α = 1.667). We used the general model mentioned above to evaluate the population size of BPH on pot-grown rice plants. The validity of the model was examined using a linear relationship between estimated and measured population sizes (R2) and the root mean squared error (RMSE) based on 168 and 140 samples collected in 2019 and 2020, which were not used for establishing the model.
Effects of BPH density and rice growth stage on these physiological traits: contents of chlorophyll (SPAD readings), H2O, Si, and soluble sugar of rice leaves were analyzed using the GLM model, and the data collected at 7 and 14 days after BPH release were considered repeat measurements. If the effect of BPH density or its interaction with the rice growth stage on a physiological trait of rice was significant, differences in this trait among BPH densities were analyzed using ANOVA followed by post-hoc Tukey’s test. A significant difference between healthy (no BPHs) and damaged (with BPHs) leaves indicated the potential of a physiological trait of leaves to monitor the BPH density. The correlation between RPI and BPH density, or between the estimated and measured BPH densities, was analyzed using the Pearson method. All the data analyses and simulations of the multivariable linear regression model were performed using IBM SPSS Statistics V25.
The BPH density (F6, 84 = 34.860, p < 0.001) and rice growth stage (F3, 84 = 1,998.145, p < 0.001) significantly affected the SPAD readings of rice leaves, and there was no significant interaction between them (F18, 84 = 1.556, p = 0.091). The SPAD readings decreased as rice plants were damaged by BPHs for 14 days at all four growth stages: the tillering (F6, 21 = 7.990, p < 0.001; Figure 2A), jointing (F6, 21 = 3.783, p = 0.01; Figure 2B), booting (F6, 21 = 7.425, p < 0.001; Figure 2C), and heading stages (F6, 21 = 6.701, p < 0.001; Figure 2D), and the SPAD reading also decreased at tillering (F6, 21 = 3.304, p = 0.019; Figure 2A), booting (F6, 21 = 5.076, p = 0.002; Figure 2C), and heading stages (F6, 21 = 5.632, p = 0.001; Figure 2D), except at the jointing stage (F6, 21 = 0.928, p = 0.495; Figure 2B) as BPH were damaged for 7 days. The SPAD readings could distinguish healthy rice plants without BPHs from damaged rice plants by four or more BPHs for 14 days at the tillering stage (Figure 2A), by 12 BPHs for 14 days at the jointing stage (Figure 2B), by eight or more BPHs for 7 or 14 days (Figure 2C), and by 12 or more BPHs for 7 days (Figure 2D).
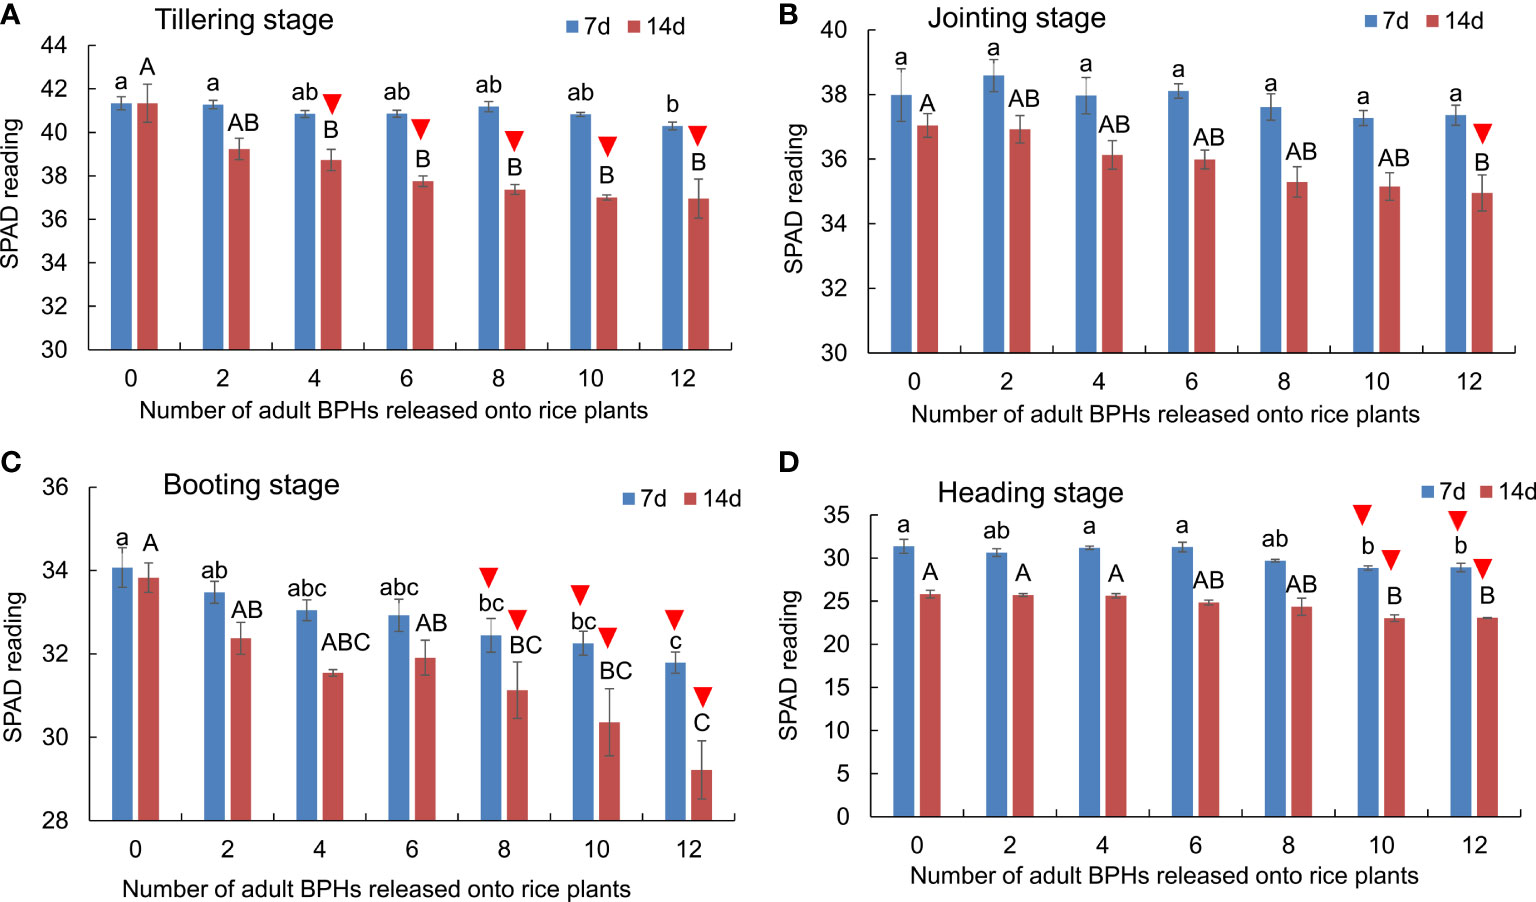
Figure 2 The SPAD readings of rice leaves at the tillering (A), jointing (B), booting (C), and heading stages (D) were damaged by different numbers of BPHs for 7 and 14 days. The different lowercase and uppercase letters above the bar mean significant differences among different numbers of BPHs damaged for 7 and 14 days, respectively, analyzed by the post-hoc Tukey’s test. A triangle above the bar means those rice plants damaged by BPHs were distinguishable from the healthy rice based on the SPAD.
The BPH density (F6, 84 = 19.904, p < 0.001) and rice growth stage (F6, 84 = 228.993, p < 0.001) significantly affected the content of silicon (Si) in rice leaves, and there was no interaction between them (F18, 84 = 1.157, p = 0.316). BPH damage led to the decrease of Si content in rice leaves at the tillering (Figure 3A), jointing (Figure 3B), and heading stages (Figure 3D), whereas the damage did not affect the Si content of leaves at the booting stage (Figure 3C). At the tillering stage, the healthy and BPH-damaged rice could be distinguished by the Si content in leaves when BPHs were damaged for 7 days (F6, 21 = 6.221, p = 0.001; Figure 3A), and the healthy rice and 12 BPH-damaged rice could be distinguished when BPHs were damaged for 14 days (F6, 21 = 4.724, p = 0.003; Figure 3A). At the jointing stage, the healthy rice plants were distinguishable from the BPH-damaged rice by two, eight, 10, or 12 BPHs for 14 days using the Si content (F6, 21 = 8.605, p = 0.001; Figure 3B). At the heading stage, the healthy rice was distinguishable from the BPH-damaged rice based on Si content when they were damaged by six to 12 BPHs for 7 days (F6, 21 = 7.864, p < 0.001; Figure 3D).
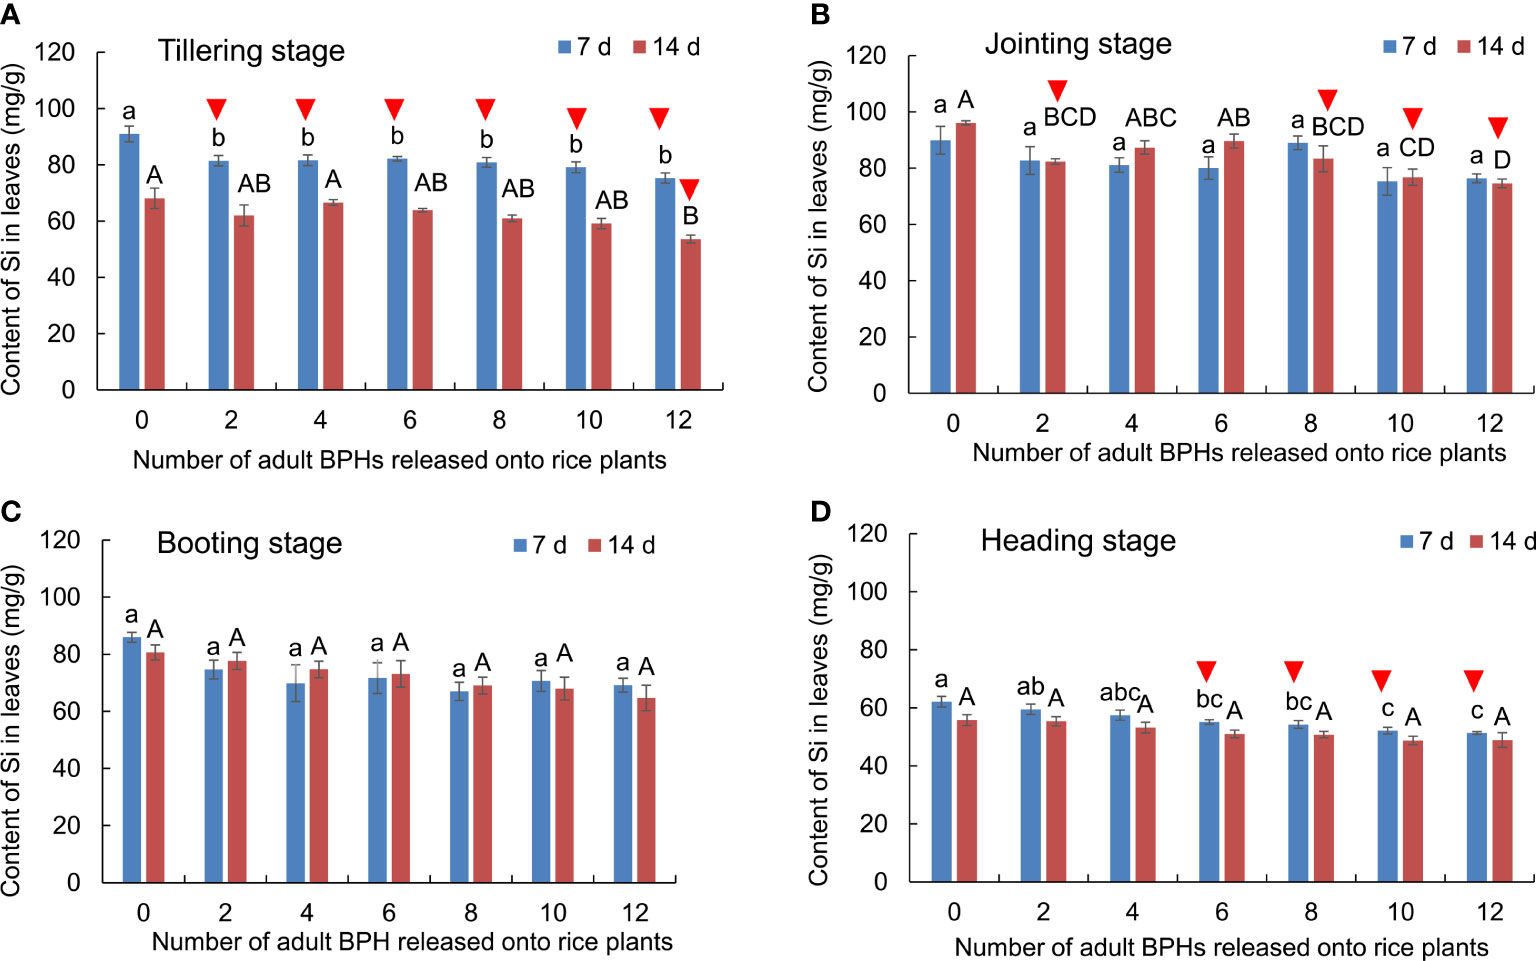
Figure 3 The content of Si in rice leaves at the tillering (A), jointing (B), booting (C), and heading stages (D) damaged by 0–12 BPHs. The different lowercase and uppercase letters above the bar mean significant differences among different numbers of BPHs damaged for 7 and 14 days, respectively, analyzed by the post-hoc Tukey’s test. A triangle above the bar means those rice plants damaged by BPHs were distinguishable from healthy rice based on the Si content in leaves.
Effects of BPH density (F6, 84 = 41.606, p < 0.001), rice growth stage (F3, 84 = 51.339, p < 0.001), and their interaction (F18, 84 = 3.336, p < 0.001) on the content of water in rice leaves were significant (Figure 4). The water content in leaves decreased as the number of BPH-damaged rice plants increased at tillering (Figure 4A), jointing (Figure 4B), booting (Figure 4C), and heading stages (Figure 4D). At the tillering stage of rice, the healthy rice plants could be distinguished from the damaged ones by eight to 12 BPHs for 14 days based on the water content (F6, 21 = 11.895, p < 0.001; Figure 4A). At the jointing stage of rice, the healthy rice plants were distinguishable from damaged ones by eight to 12 BPHs for 7 days (F6, 21 = 4.906, p = 0.003; Figure 4B) and 14 days (F6, 21 = 8.272, p < 0.001; Figure 4B).
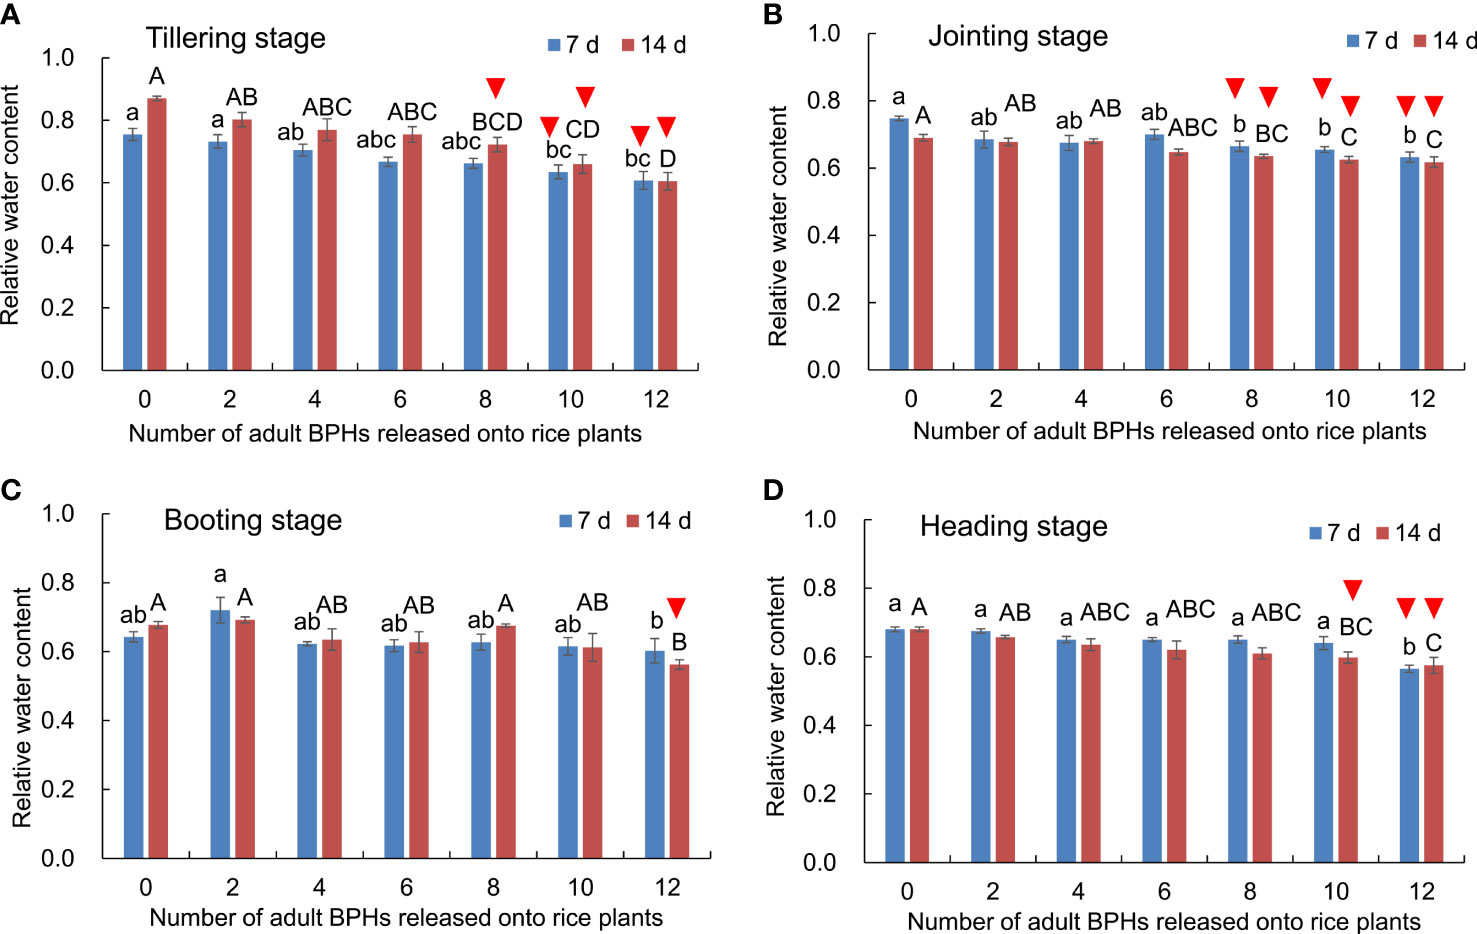
Figure 4 The content of water in rice leaves at the tillering (A), jointing (B), booting (C), and heading stages (D) damaged by 0–12 BPHs. The different lowercase and uppercase letters above the bar mean significant differences among different numbers of BPHs damaged for 7 and 14 days, respectively, analyzed by the post-hoc Tukey’s test. A triangle above the bar means those rice plants damaged by BPHs were distinguishable from healthy rice based on the water content in leaves.
The BPH density significantly affected the content of soluble sugar in rice leaves (F6, 84 = 17.983, p < 0.001), but the rice growth stage (F3, 84 = 2.601, p = 0.057) and its interaction with the BPH density (F18, 84 = 0.910, p = 0.569) did not significantly affect the content (Figure 5). The content of soluble sugar in rice leaves was significantly decreased by the damage of four to 12 BPHs for 14 days (F6, 21 = 9.636, p < 0.001) and by the damage of 10 and 12 BPHs for 7 days (F6, 21 = 8.272, p < 0.001) in the tillering stage of rice (Figure 5A). In the jointing (F6, 21 = 7.211, p < 0.001) and heading stages (F6, 21 = 4.064, p = 0.007), the eight to 12 BPH damage for 7 days significantly decreased the content of soluble sugar in leaves (Figures 5B, D). In the booting stage, the two to 12 BPH damage for 7 and 14 days did not affect the content of soluble sugar in leaves (Figure 5C). The rice damaged by BPHs could be distinguished using the content of soluble sugar in leaves at the tillering, jointing, and heading stages (Figure 5).
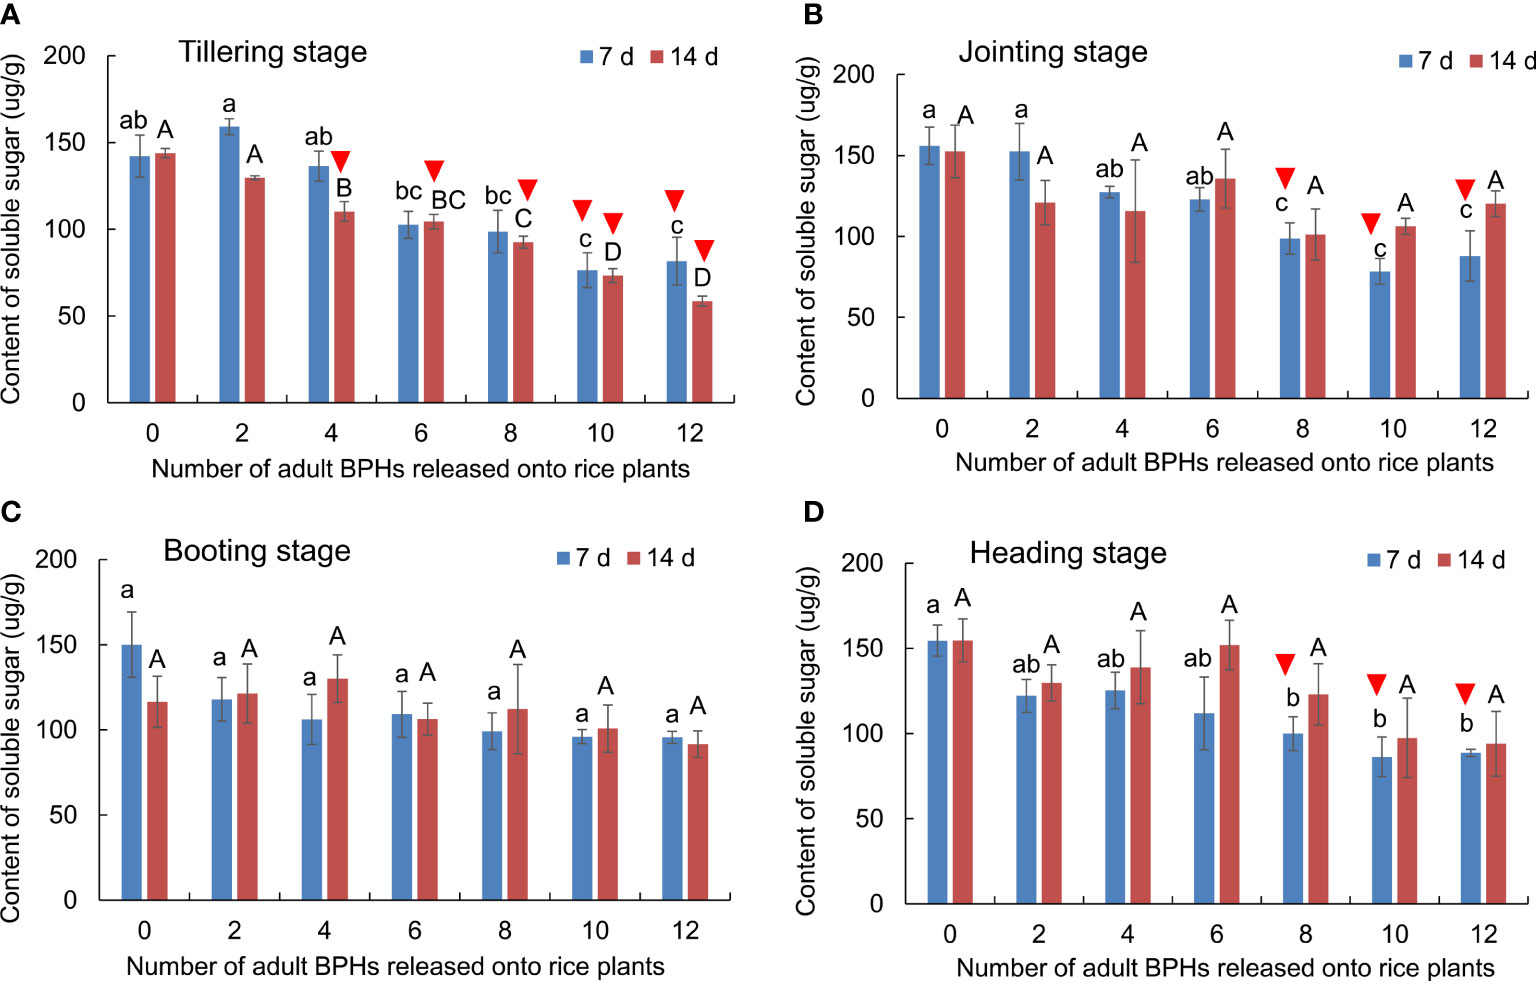
Figure 5 The content of soluble sugar in rice leaves at the tillering (A), jointing (B), booting (C), and heading stages (D) damaged by different numbers of BPHs. The different lowercase and uppercase letters above the bar mean significant differences among different numbers of BPHs damaged for 7 and 14 days, respectively, analyzed by the post-hoc Tukey’s test. A triangle above the bar means those rice plants damaged by BPHs were distinguishable from healthy rice based on the content of soluble sugar in leaves.
These four ratio physiological indices based on SPAD (RPISPAD) and contents of Si (RPISi), water (RPIwater), and soluble sugar (RPIsugar) in leaves were significantly correlated with the density of BPHs damaging these rice plants for 7 and 14 days at four growth stages (Table 1). These ratio indices, derived from rice leaves, exhibited great potential to estimate the population density of BPH.
The multivariable linear regression models based on these four ratio physiological indices, RPISPAD, RPISi, RPIwater, and RPIsugar of rice leaves, were established for estimating the BPH density on the tillering, jointing, booting, and heading stages of rice damaged for 1 week (NBPH-1) and 2 weeks (NBPH-2). There were significant correlations between the measured and estimated population density based on these models (Table 2). To extend the applied range to all growth stages of rice, a general model was set up to estimate the population density of BPH (NBPH-t) damaging rice for t weeks (t ≥ 2), NBPH-t = 1.667 × (t − 1)(71.91807 − 31.4125 × RPISPAD − 15.6221 × RPISi − 16.9861 × RPIwater − 7.34955 × RPISugar) based on these four ratio physiological indices of rice leaves.
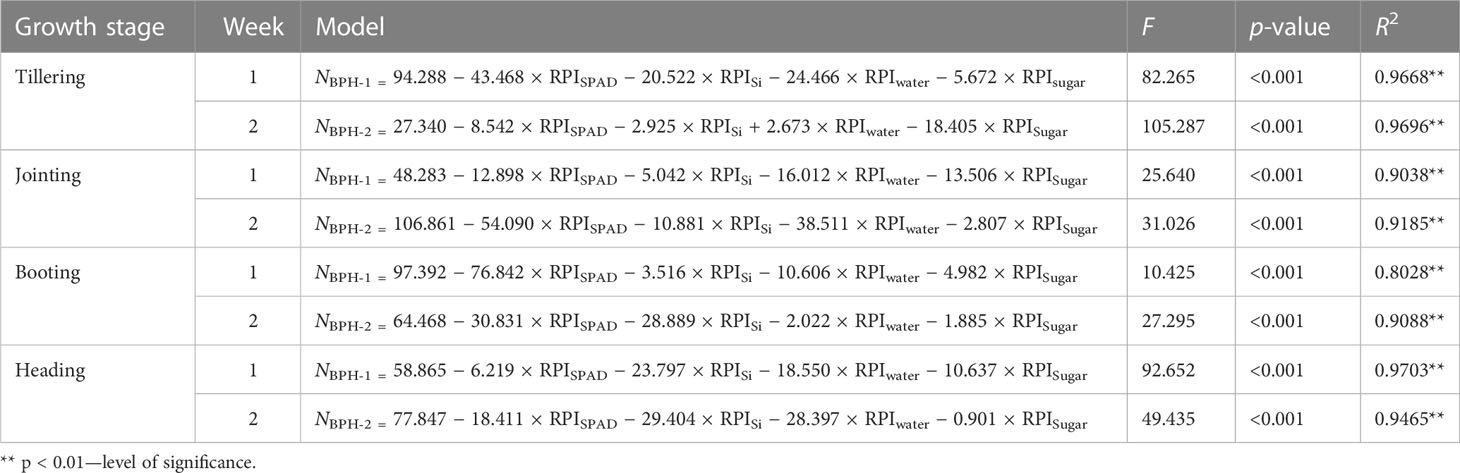
Table 2 Models for estimating the density of BPH on four growth stages of rice plants damaged for 1 and 2 weeks based on four ratio physiological indices of rice leaf and the coefficient of correlation between measured and estimated BPH density using the model (R2).
The validation of the general model was tested in 2 years, 2019 and 2020, using the pot-grown rice plants. The model exhibited higher accuracy when estimating the population density of BPH in both 2019 (Figure 6A) and 2020 (Figure 6B) after 1–7 weeks from release. The R2 values between the measured and estimated density of BPH on three hills of rice were 0.5658 and 0.7953 in 2019 (n = 168) and 2020 (n = 140), respectively, and the RMSEs for the predication were 26.06 and 22.69, respectively, indicating a good linear relationship (Figure 6). The general model based on four ratio physiological indices of rice leaves exhibited the potential for estimating BPH density on rice plants.
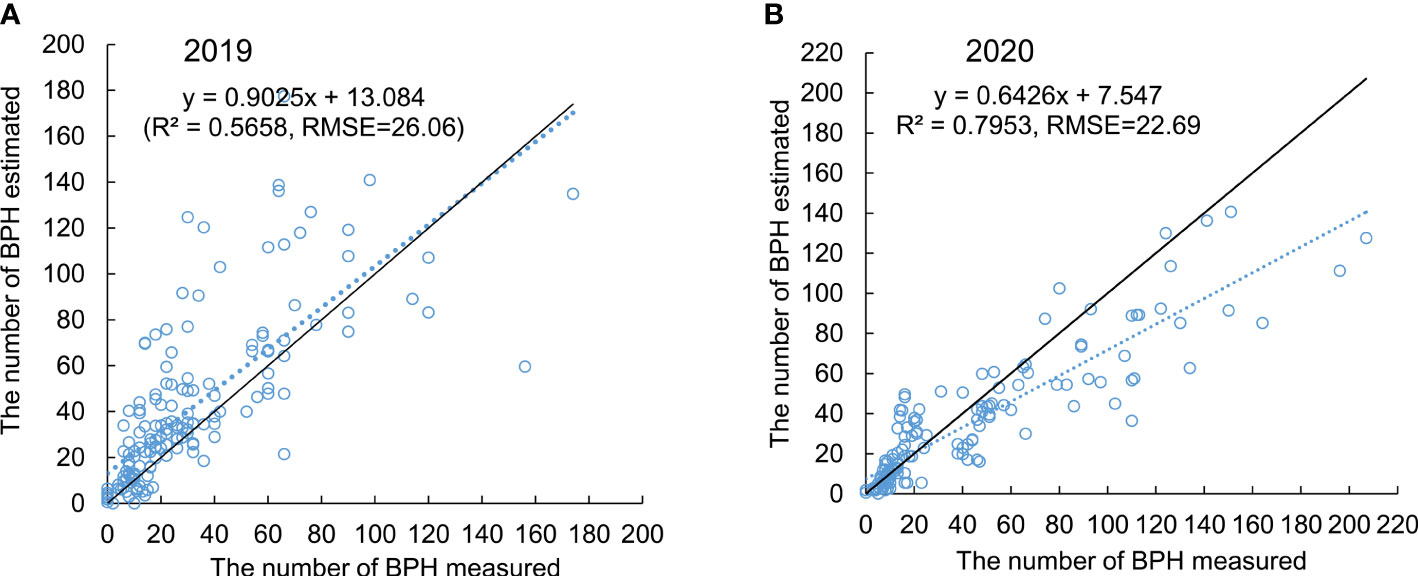
Figure 6 Validity of the general model tested in 2019 (A) and 2020 (B). The dashed line presents the relationship between the measured (x) and estimated (y) density of BPH using the general model. The solid line presents x = y.
Rice planthopper damage causes changes in the chemical composition of rice leaves (Cagampang et al., 1974; Chen et al., 2003). In this study, we found that the contents of chlorophyll (SPAD readings), water, silicon, and soluble sugar in rice leaves were reduced as the BPH damage degree increased. Previous studies showed that SPAD readings, which are an indicator of the content of chlorophyll in rice leaves, were significantly decreased due to BPH infestation (Watanabe and Kitagawa, 2000; Huang et al., 2015). The SPAD readings of wheat were also reduced as they were damaged by aphids (Franzen et al., 2008). BPH damage decreased the number of silica cells in rice leaf sheaths (Yang et al., 2017) and the contents of water and free sugars in rice plants (Cagampang et al., 1974). These four physiological traits, SPAD, water, Si, and soluble sugar in rice leaves, exhibited similar responses to BPH damage, suggesting great potential to estimate the population density of BPH on rice plants.
The four physiological traits, SPAD readings, and contents of water, Si, and soluble sugar in rice leaves were significantly related to the damage caused by BPH at the tillering, jointing, booting, and heading stages of rice. This result suggests that these four traits might be used to establish a model for monitoring BPH. To reduce the effect of different growth stages of rice on physiological traits, we established the ratio physiological index based on BPH-damaged and healthy rice. The four ratio physiological indices of rice leaves were negatively correlated with the density of BPH damaging the rice plants, although one or two indices were not significant in a specific damage case. Therefore, the accuracy of a model based on a single physiological index of rice leaf to monitor BPH may be lower. So, the multivariable linear regression models based on four ratio physiological indices were established in this study, which did exhibit high goodness of fit and estimated accuracy. Most prediction models for rice planthopper were weather-based, and these weather factors, temperature, humidity, and rainfall, were often used (Prasannakumar and Subhash, 2014; Chen et al., 2015; Srinivasa et al., 2020). However, factors derived from rice plants were rarely used for monitoring rice planthoppers. To our knowledge, this is the first time to develop the ratio physiological indices of rice leaf to estimate BPH density.
The general model developed in this study using ratio physiological indices of rice leaf to estimate BPH density has the advantages of convenient utilization, good estimating accuracy, and a broad prospect of application. Leaf collection in rice fields is more convenient than surveying samples of BPH. Sampling for BPHs is highly professional and labor-intensive (Wang et al., 2014; Masarudin et al., 2019). Collecting rice leaves can be carried out by nonprofessionals, and this job is relatively easier than sampling BPHs. The accuracy was 30%–70% depending on the population density of BPHs and the growth stage of rice in the survey based on the commonly used method of shake or beat sampling (Qi et al., 1995). Although a gap remained between the measured and estimated density of BPHs using the general model established in this study, the overall trend of all estimated values was in good agreement with the practical cases (Figure 6), suggesting reasonable accuracy. Moreover, this general model was established based on the ratio physiological indices between the healthy and damaged rice plants at four growth stages, and two crucial factors, damage duration (t) and population increase rate of BPH (α), which related to changes in rice leaves in physiological traits, were considered, suggesting that the application of this general model may be suitable to almost all damage cases of rice when the immigration peak is clear. The examination of the physiological traits of rice leaf can be performed using the standard methods in the laboratory, and this examination will be performed automatically on an assembly line in the laboratory. So, this method based on the physiological traits of rice leaves may automate the estimation of BPH density and have a broad prospect of application.
Based on this study, the BPH density estimation may be performed via five simple steps, (1) determination of BPH immigration peak using light trapping or radar observation methods (Riley et al., 1994; Qi et al., 2010) to attain the damage duration (t, week) of BPH populations; (2) collection of rice leaves in rice fields, especially the healthy leaf without BPH damage; (3) examination of SPAD and contents of water, Si, and soluble sugar in sampled rice leaves in the laboratory; (4) establishment of ratio physiological indices based on the heathy and BPH-damaged leaves; and (5) estimating the population density of BPH based on the general model (Figure 1). Collected rice leaves need to be retained freshly before examination. An ice box can be used when sampling. The healthy rice leaves can be determined via a few visual scouts or by using the leaves with the lowest physiological traits in all collected leaves. So, the sampling of rice leaves is simple.
Hyperspectral remote sensing is a nondestructive method to measure the chemical composition of plants. The nitrogen nutritional status and chlorophyll content of rice plants can be diagnosed using hyperspectral data (Tan et al., 2008; An et al., 2020). Hyperspectral imaging can measure the contents of sugar and water in plants (Guo et al., 2007; Kim et al., 2015). The digital images can be collected using unmanned aerial vehicles (Roosjen et al., 2020). When these four physiological traits of rice leaves, SPAD, water, Si, and soluble sugar, are measured via hyperspectral remote sensing, BPH monitoring will be accomplished automatically in rice fields using a sampling–monitoring system carried by an unmanned aerial vehicle (Figure 1). Therefore, an automatic and intelligent method based on the physiological traits of rice leaves will be developed for monitoring BPH density, which greatly enhances working efficiency and estimation accuracy.
The physiological traits of rice leaves are strongly correlated with the number of brown planthoppers damaging rice plants. The ratio physiological index of rice leaf damaged by brown planthoppers to healthy rice is effective in monitoring the population density of brown planthoppers based on the SPAD reading and contents of water, silicon, and soluble sugar in the leaf. The regression model based on four ratio physiological indices of rice leaf, the damage duration, and the population increase rate exhibits high goodness of fit and estimation accuracy. The new method based on the ratio physiological index of crops will promote the development of pest density estimation toward nonprofessionalization and automation.
The original contributions presented in the study are included in the article/supplementary material. Further inquiries can be directed to the corresponding author.
X-DL and MC conceived the ideas and designed methodology. MC collected the data. X-DL and MC analyzed the data. X-DL led the writing of the manuscript. All authors contributed the article and approved the submitted version.
This work was supported by the National Key Research and Development Program of China [2021YFD1401100] and the Key Research and Development Program of Jiangsu Province-Modern Agriculture [BE2022387]. The funders had no role in study design, data collection and interpretation, or the decision to submit the work for publication.
We are grateful to Ye Tan, Bing Zhang, and Yu Liu for helping to plant rice and rearing brown planthoppers.
The authors declare that the research was conducted in the absence of any commercial or financial relationships that could be construed as a potential conflict of interest.
All claims expressed in this article are solely those of the authors and do not necessarily represent those of their affiliated organizations, or those of the publisher, the editors and the reviewers. Any product that may be evaluated in this article, or claim that may be made by its manufacturer, is not guaranteed or endorsed by the publisher.
An, G., Xing, M., He, B., Liao, C., Huang, X., Shang, J., et al. (2020). Using machine learning for estimating rice chlorophyll content from in situ hyperspectral data. Remote Sens. 12, 3104. doi: 10.3390/rs12183104
Anderson, D. R., Burnham, K. P., White, G. C., Otis, D. L. (1983). Density estimation of small-mammal populations using a trapping web and distance sampling methods. Ecology 64, 674–680. doi: 10.2307/1937188
Burd, J. D., Elliott, N. C. (1996). Changes in chlorophyll α fluorescence induction kinetics in cereals infested with Russian wheat aphid (Homoptera: Aphididae). J. Economic Entomol. 89 (5), 1332–1337. doi: 10.1093/jee/89.5.1332
Cabrera, H. M., Argandona, V. H., Zuniga, G. E., Corcuera, L. J. (1995). Effect of infestation by aphids on the water status of barley and insect development. Phytochemistry 40 (4), 1083–1088. doi: 10.1016/0031-9422(95)00325-2
Cagampang, G. B., Pathak, M. D., Juliano, B. O. (1974). Metabolic changes in the rice plant during infestation by the brown planthopper, Nilaparvata lugens Stal (Hemiptera: Delphacidae). Appl. Entomol. Zool. 9 (3), 174–184. doi: 10.1303/aez.9.174
Chang, C. Y., Sun, X. W., Tian, P. P., Miao, N. H., Zhang, Y. L., Liu, X. D. (2022). Plant secondary metabolite and temperature determine the prevalence of Arsenophonus endosymbionts in aphid populations. Environ. Microbiol. 24 (8), 3764–3776. doi: 10.1111/1462-2920.15929
Chen, B., Yan, S., Jiang, M., Li, Y., Li, Z., Chen, G. (2015). Weather prediction model of the occurrence period and extent of rice planthopper in Huazhou. Chin. Agric. Sci. Bull. 31 (8), 123–127.
Chen, J., Yu, X., Cheng, J., Lu, Z., Xu, H. (2003). The changes of physiological indexes of different rice varieties after infestation by brown planthopper Nilaparvata lugens (Stal). Acta Phytophylacica Sin. 30 (3), 225–231.
Dyck, V. A., Thomas, B. (1979). The brown planthopper problem. Brown planthopper threat to rice production in Asian. Int. Rice Res. Institute Philippines, 3–17.
Elliott, C. L., Snyder, G. H. (1991). Autoclave-induced digestion for the colorimetric determination of silicon in rice straw. J. Agric. Food Chem. 39, 1118–1119. doi: 10.1021/jf00006a024
Franzen, L. D., Gutsche, R. A., Heng-Moss, M. T., Higley, G. L., Macedo, B. T. (2008). Physiological responses of wheat and barley to Russian wheat aphid, Diuraphis noxia (Mordvilko) and bird cherryoat aphid, Rhopalosiphum padi (L.) (Hemiptera: Aphididae). Arthropod Plant Interact. 2, 227–235. doi: 10.1007/s11829-008-9048-1
Ghobadifar, F., Aimrun, W., Jebur, M. N. (2016b). Development of an early warning system for brown planthopper (BPH) (Nilaparvata lugens) in rice farming using multispectral remote sensing. Precis. Agric. 17, 377–391. doi: 10.1007/s11119-015-9422-9
Ghobadifar, F., Wayayok, A., Mansor, S., Shafri, H. Z. (2016a). Detection of BPH (brown planthopper) sheath blight in rice farming using multispectral remote sensing. Geomatics Natural Hazards Risk 7 (1), 237–247. doi: 10.1080/19475705.2014.885468
Guo, F., Cao, Q. X., Nagata, M., Jasper, T. (2007). NIR hyperspectral imaging measurement of sugar content in peach using PLS regression. J. Shanghai Jiaotong Univ. E-12 (5), 597–601.
Heong, K. L., Cheng, J., Escalada, M. M. (2015). Rice Planthoppers Ecology, Management, Socio Economics and Policy (Dordrecht: Zhejiang University Press, Hangzhou and Springer).
Hu, G., Cheng, X. X., Qi, G. J., Wang, F. Y., Lu, F., Zhang, X. X., et al. (2011). Rice planting systems, global warming and outbreaks of Nilaparavata lugens (Stal). Bull. Entomol. Res. 101, 187–199. doi: 10.1017/S0007485310000313
Huang, J. R., Sun, J. Y., Liao, H. J., Liu, X. D. (2015). Detection of brown planthopper infestation based on SPAD and spectral data from rice under different rates of nitrogen fertilizer. Precis. Agric. 16, 148–163. doi: 10.1007/s11119-014-9367-4
Keeping, D. (2014). Rapid assessment of wildlife abundance: estimating animal density with tract counts using body mass-day range scaling rules. Anim. Conserv. 17, 486–497. doi: 10.1111/acv.12113
Kim, D., Zhang, H., Zhou, H., Du, T., Wu, Q., Mockler, T. C., et al. (2015). Highly sensitive image-derived indices of water-stressed plants using hyperspectral imaging in SWIR and histogram analysis. Sci. Rep. 5, 15919. doi: 10.1038/srep15919
Lal, O. P. (1973). Effect of aphid infestation on plant growth and chlorophyll contents of cabbage. J. Appl. Entomol. 73, 260–262. doi: 10.1111/j.1439-0418.1973.tb02291.x
Liu, X. D. (2013). Sampling techniques of insects in the field. Chin. J. Appl. Entomol. 50 (3), 863–867.
Liu, X. D., Sun, Q. H. (2016). Early assessment of the yield loss in rice due to the brown planthopper using a hyperspectral remote sensing method. Int. J. Pest Manage. 62 (3), 205–213. doi: 10.1080/09670874.2016.1174791
Masarudin, M. F., Bookeri, M. A. M., Yusoff, M. A. M. (2019). Brown planthopper surveillance technique between light trap and manual sampling. Int. J. Agriculture Forestry Plantation 8, 134–136.
Nakashima, Y., Fukasawa, K., Samejima, H. (2018). Estimating animal density without individual recognition using information derivable exclusively from camera traps. J. Appl. Ecol. 55, 735–744. doi: 10.1111/1365-2664.13059
Parmenter, R. R., Macmahon, J. A. (1989). Animal density estimation using a trapping web design: Field validation experiments. Ecology 70 (1), 169–179. doi: 10.2307/1938424
Prasannakumar, N. R., Subhash, C. (2014). Weather-based brown planthopper prediction model at Mandya, Karnataka. J. Agrometeorol. 16 (1), 126–129.
Pushpa, S., Sinhal, V. (2011). Effect of aphid infestation on the biochemical constitutes of mustard (Brassica juncea) plant. J. Phytol. 3 (8), 28–33.
Qi, L. Z., Ding, J. H., Zhang, Y. M., Yan, Z. S., Wu, J. C., Zhang, F. J. (1995). Determination on accuracy of the plant-flapping method to investigate the population of brown planthopper in rice. Entomological Knowledge 32 (2), 69–72.
Qi, H. H., Zhang, Y. H., Cheng, D. F., Han, E. B., Sun, J. R. (2010). Radar observation and trajectory analysis on the autumn return migration of the brown planthopper, Nilaparvata lugens (Homoptera: Delphacidae) in 2009 in China. Acta Entomologica Sin. 53, 1256–1264.
Riley, J. R., Reynolds, D. R., Smith, A. D., Rosenberg, L. J., Cheng, X. N., Zhang, X. X., et al. (1994). Observations of the autumn migration of Nilaparvata lugens (Homoptera: Delphacidae) and other pests in East Central China. Bull. Entomological Res. 84, 389–402. doi: 10.1017/S0007485300032521
Roosjen, P. P. J., Kellenberger, B., Kooistra, L., Green, D. R., Fahrentrapp, J. (2020). Deep learning for automated detection of Drosophila suzukii: potential for UAV-based monitoring. Pest Manage. Sci. 76, 2994–3002. doi: 10.1002/ps.5845
Rowcliffe, J. M., Field, J., Turvey, S. T., Carbone, C. (2008). Estimating animal density using camera traps without the need for individual recognition. J. Appl. Ecol. 45, 1228–1236. doi: 10.1111/j.1365-2664.2008.01473.x
Silveira, L., Jacomo, A. T. A., Diniz-Filho, J. A. F. (2003). Camera trap, line transect census and track surveys: a comparative evaluation. Biol. Conserv. 114, 351–355. doi: 10.1016/S0006-3207(03)00063-6
Sogawa, K. (1982). The rice brown planthopper: feeding physiology and host plant interactions. Annu. Rev. Entomol. 27, 49–73. doi: 10.1146/annurev.en.27.010182.000405
Srinivasa, N., Subhash, C., Sagar, D., Venkatesh, Y. N. (2020). Rice brown planthopper prediction model with sweepnet catches. Indian J. Entomol. 82 (3), 568–571. doi: 10.5958/0974-8172.2020.00141.8
Tan, C. W., Zhou, Q. B., Qi, L., Zhuang, H. Y. (2008). Hyperspectral remote sensing diagnosis models of rice plant nitrogen nutritional status. Chin. J. Appl. Ecol. 19 (6), 1261–1268.
Wang, R. L., Lu, M. H., Han, L. Z., Yu, F. L., Chen, F. J. (2014). Methods and technologies for surveying and sampling the rice planthopper, Nilaparvata lugens, Sogatella furcifera and Laodelphax striatellus. Chin. J. Appl. Entomol. 51 (3), 842–847.
Watanabe, T., Kitagawa, H. (2000). Photosynthesis and translocation of assimilates in rice plants following phloem feeding by the planthopper Nilaparvata lugens (Homoptera: Delphacidae). J. Economic Entomol. 93, 1192–1198. doi: 10.1603/0022-0493-93.4.1192
Wu, M., Yang, L., Yang, X., Zhang, X., Ma, J., Zhang, Y., et al. (2015). Effect of aphid invasion on physiological and biochemical indexes in watermelon seedling stage. J. Fruit Sci. 32 (5), 943–949.
Yajima, G., Nakashima, Y. (2021). Can video traps reliably detect animals? Implications for the density estimation of animals without individual recognition. Mammal Study 46 (3), 189–195. doi: 10.3106/ms2020-0055
Yang, L., Han, Y., Li, P., Li, F., Ali, S., Hou, M. (2017). Silicon amendment is involved in the induction of plant defense responses to a phloem feeder. Sci. Rep. 7, 4232. doi: 10.1038/s41598-017-04571-2
Yao, Q., Xian, D. X., Liu, Q. J., Yang, B. J., Diao, G. Q., Tang, J. (2014). Automated counting of rice planthoppers in paddy fields based on image processing. J. Integr. Agric. 13 (8), 1736–1745. doi: 10.1016/S2095-3119(14)60799-1
Keywords: density estimation, Nilaparvata lugens, rice leaf, silicon, soluble sugar, SPAD, water content
Citation: Chen M and Liu X-D (2023) Estimating insect pest density using the physiological index of crop leaf. Front. Plant Sci. 14:1152698. doi: 10.3389/fpls.2023.1152698
Received: 28 January 2023; Accepted: 24 July 2023;
Published: 10 August 2023.
Edited by:
Xu Zheng, University of Electronic Science and Technology of China, ChinaReviewed by:
Abhishek Ojha, Anhui Agricultural University, ChinaCopyright © 2023 Chen and Liu. This is an open-access article distributed under the terms of the Creative Commons Attribution License (CC BY). The use, distribution or reproduction in other forums is permitted, provided the original author(s) and the copyright owner(s) are credited and that the original publication in this journal is cited, in accordance with accepted academic practice. No use, distribution or reproduction is permitted which does not comply with these terms.
*Correspondence: Xiang-Dong Liu, bGl1eGRAbmphdS5lZHUuY24=
Disclaimer: All claims expressed in this article are solely those of the authors and do not necessarily represent those of their affiliated organizations, or those of the publisher, the editors and the reviewers. Any product that may be evaluated in this article or claim that may be made by its manufacturer is not guaranteed or endorsed by the publisher.
Research integrity at Frontiers
Learn more about the work of our research integrity team to safeguard the quality of each article we publish.