 Madhura M. Yapa
 Paymon Doroodian
 Zhenyu Gao
 Peifeng Yu
 Zhihua Hua
95% of researchers rate our articles as excellent or good
Learn more about the work of our research integrity team to safeguard the quality of each article we publish.
Find out more
ORIGINAL RESEARCH article
Front. Plant Sci. , 28 March 2023
Sec. Plant Abiotic Stress
Volume 14 - 2023 | https://doi.org/10.3389/fpls.2023.1146922
This article is part of the Research Topic Genetic and Epigenetic Regulatory Mechanisms in Higher Plants in Response to Abiotic Stress View all 6 articles
Retrograde signaling modulates the expression of nuclear genome-encoded organelle proteins to adjust organelle function in response to environmental cues. MULTIPLE ORGANELLAR RNA EDITING FACTOR 2 (MORF2) was initially recognized as a plastidial RNA-editing factor but recently shown to interact with GUN1. Given the central role of GUN1 in chloroplast retrograde signaling and the unviable phenotype of morf2 mutants that is inconsistent with many viable mutants involved in RNA editing, we hypothesized that MORF2 has functions either dosage dependent or beyond RNA editing. Using an inducible Clustered Interspaced Short Palindromic Repeat interference (iCRISPRi) approach, we were able to reduce the MORF2 transcripts in a controlled manner. In addition to MORF2-dosage dependent RNA-editing errors, we discovered that reducing MORF2 by iCRISPRi stimulated the expression of stress responsive genes, triggered plastidial retrograde signaling, repressed ethylene signaling and skotomorphogenesis, and increased accumulation of hydrogen peroxide. These findings along with previous discoveries suggest that MORF2 is an effective regulator involved in plastidial metabolic pathways whose reduction can readily activate multiple retrograde signaling molecules possibly involving reactive oxygen species to adjust plant growth. In addition, our newly developed iCRISPRi approach provided a novel genetic tool for quantitative reverse genetics studies on hub genes in plants.
Chloroplasts not only function as a powerhouse converting light energy into sugar through photosynthesis, but also compartmentalize multiple metabolic pathways for the biosynthesis of amino acids, fatty acids, and phytohormones (Chan et al., 2016). Given their vital importance, intensive studies have been focused on the function and development of chloroplasts (Jarvis and Lopez-Juez, 2013). One central topic is about the coordination between nuclear gene expression and the physiological and developmental status of chloroplasts, named anterograde (nucleus to chloroplasts) and retrograde (chloroplasts to nucleus) signaling (Chan et al., 2016). Because >95% of the chloroplast proteins are encoded by nuclear genes with the remainder encoded by the chloroplast genome, the expression of these two sets of proteins needs to be promptly controlled to maintain the stoichiometry of protein complexes assembled in the chloroplasts (Woodson and Chory, 2008). The activity of these complexes is sensitive to environmental cues such as light quality and/or intensity (Woodson and Chory, 2008; Chan et al., 2016). Since not all absorbed photons from photosystems are fixed, excess ones often alter the reduction/oxidation (redox) state of the photosynthetic electron transfer chain and induce oxidative damage (Bassi and Dall'osto, 2021). Additional stresses can further disrupt the balance of redox and metabolites in chloroplasts and promote the formation of reactive oxygen species (ROS) (Chan et al., 2016; Li and Kim, 2022). Increasing ROS and metabolic changes generate multiple signals, so called retrograde signaling (RS), to orchestrate vast expression changes of nuclear genes involved not only in chloroplast photoprotection but also in other intracellular functions (Chan et al., 2016; Bassi and Dall'osto, 2021; Dopp et al., 2021).
Emerging evidence has demonstrated a central role of chloroplasts/plastids in stress defense through RS. For example, the lincomycin-induced RS has been discovered to suppress and activate phytochrome and ethylene pathways, respectively, resulting in inhibition of photomorphogenesis of seedlings growing under a moderate light condition. The discoveries from these studies suggest a photoprotection role of RS during seedling de-etiolation (Martin et al., 2016; Gommers et al., 2021; Veciana et al., 2022). Given the presence of multiple RS molecules, it is plausible that some may have no impact on plant photomorphogenesis, such as that resulting from the arrested albino plastids of pap7-1, a mutant that lacks plastid-encoded RNA polymerase-associated proteins (Grubler et al., 2017). In addition to photomorphogenesis, the RS molecule, methylerythritol cyclodiphosphate (MEcPP), induces an array of nuclear genes responsible for general stress response (Walley et al., 2015; Benn et al., 2016).
While RS regulates the expression of nuclear-encoded chloroplast proteins, chloroplast genome-encoded proteins are under an organelle-specific posttranscriptional regulation, called RNA editing (Small et al., 2020). Although a multigene protein family composed of pentatricopeptide repeat (PPR) proteins has been demonstrated for specific recognition and/or cytidine deamination of RNA-editing sites, the biochemical roles of many other PPR-interacting factors are unknown (Takenaka, 2014; Small et al., 2020). Among these factors is a small family of nuclear genome-encoded proteins, termed MULTIPLE ORGANELLAR RNA EDITING FACTORs (MORFs). Mutant studies and protein-protein interaction analyses suggest that they are involved in a devoted RNA editosome (Takenaka et al., 2012). Although RNA editing was first documented 30 years ago, its biological influence is yet not clear because several Arabidopsis mutants showing RNA-editing errors both in mitochondria and chloroplasts have no or only mild growth defects (Takenaka et al., 2010; Sun et al., 2013). However, the null mutant allele, morf2-1, is albino with errors/deficiencies in multiple chloroplast RNA editing sites. Further analyses identified physical interactions of MORF2 with selected PPR proteins (Takenaka et al., 2012). Despite these, the detailed biochemical function of MORF2 in RNA editing is yet not clear. Intriguingly, MORF2 was recently shown to interact with GENOMES UNCOUPLED 1 (GUN1), one of the central players in RS. Transcriptomic analyses discovered a gun molecular phenotype in MORF2 overexpression plants, suggesting its negative function in RS regulation. Moreover, compared to wild type (WT), differential RNA-editing profiles were observed in both gun1 null mutant and the MORF2 overexpression lines when treated with the bleaching herbicide norflurazon (NF) (Zhao et al., 2019). Although this discovery suggests a possible interplay between RNA editing and RS, it remains elusive whether and how the observed RNA-editing changes result from RS or vice versa (Larkin, 2019; Zhao et al., 2019).
Delineating MORF2-mediated early interaction between RS and RNA editing would further our understanding about the biological function of RNA editing, explore the formation of RNA editosome, and categorize differential RS pathways in plant stress response. Because all up-to-date genetic studies in RS and RNA editing involve either strong pharmacological treatments or knockout mutants, which result in severe or no phenotypes, the early signaling in both pathways remains unknown. In this work, we applied a novel inducible Clustered Regularly Interspaced Short Palindromic Repeat interference (iCRISPRi) approach to quantitatively monitor early transcriptome and RNA-editing changes upon the gradient reduction of MORF2. Further physiological and expression analyses, in combination with the structure feature and a recent finding of a holdase-like chaperon activity of MORF2 (Yuan et al., 2022), collectively suggest that MORF2 is a stress effector in addition to its previously discovered role in RNA editing.
Unless otherwise noted, the Arabidopsis reference accession Col-0 was used as the WT control. The mutants, morf2-2 (stock number: SALK_094930) and ctr1-1 (stock number: CS8057), were obtained from the Arabidopsis Biological Resource Center (ABRC) at the Ohio State University. Locations of the T-DNA insertion in morf2-2 was confirmed by genomic Polymerase Chain Reaction (PCR) analysis using the primers indicated in Figure 1B. All oligonucleotide primers used in this study are listed in Table S1.
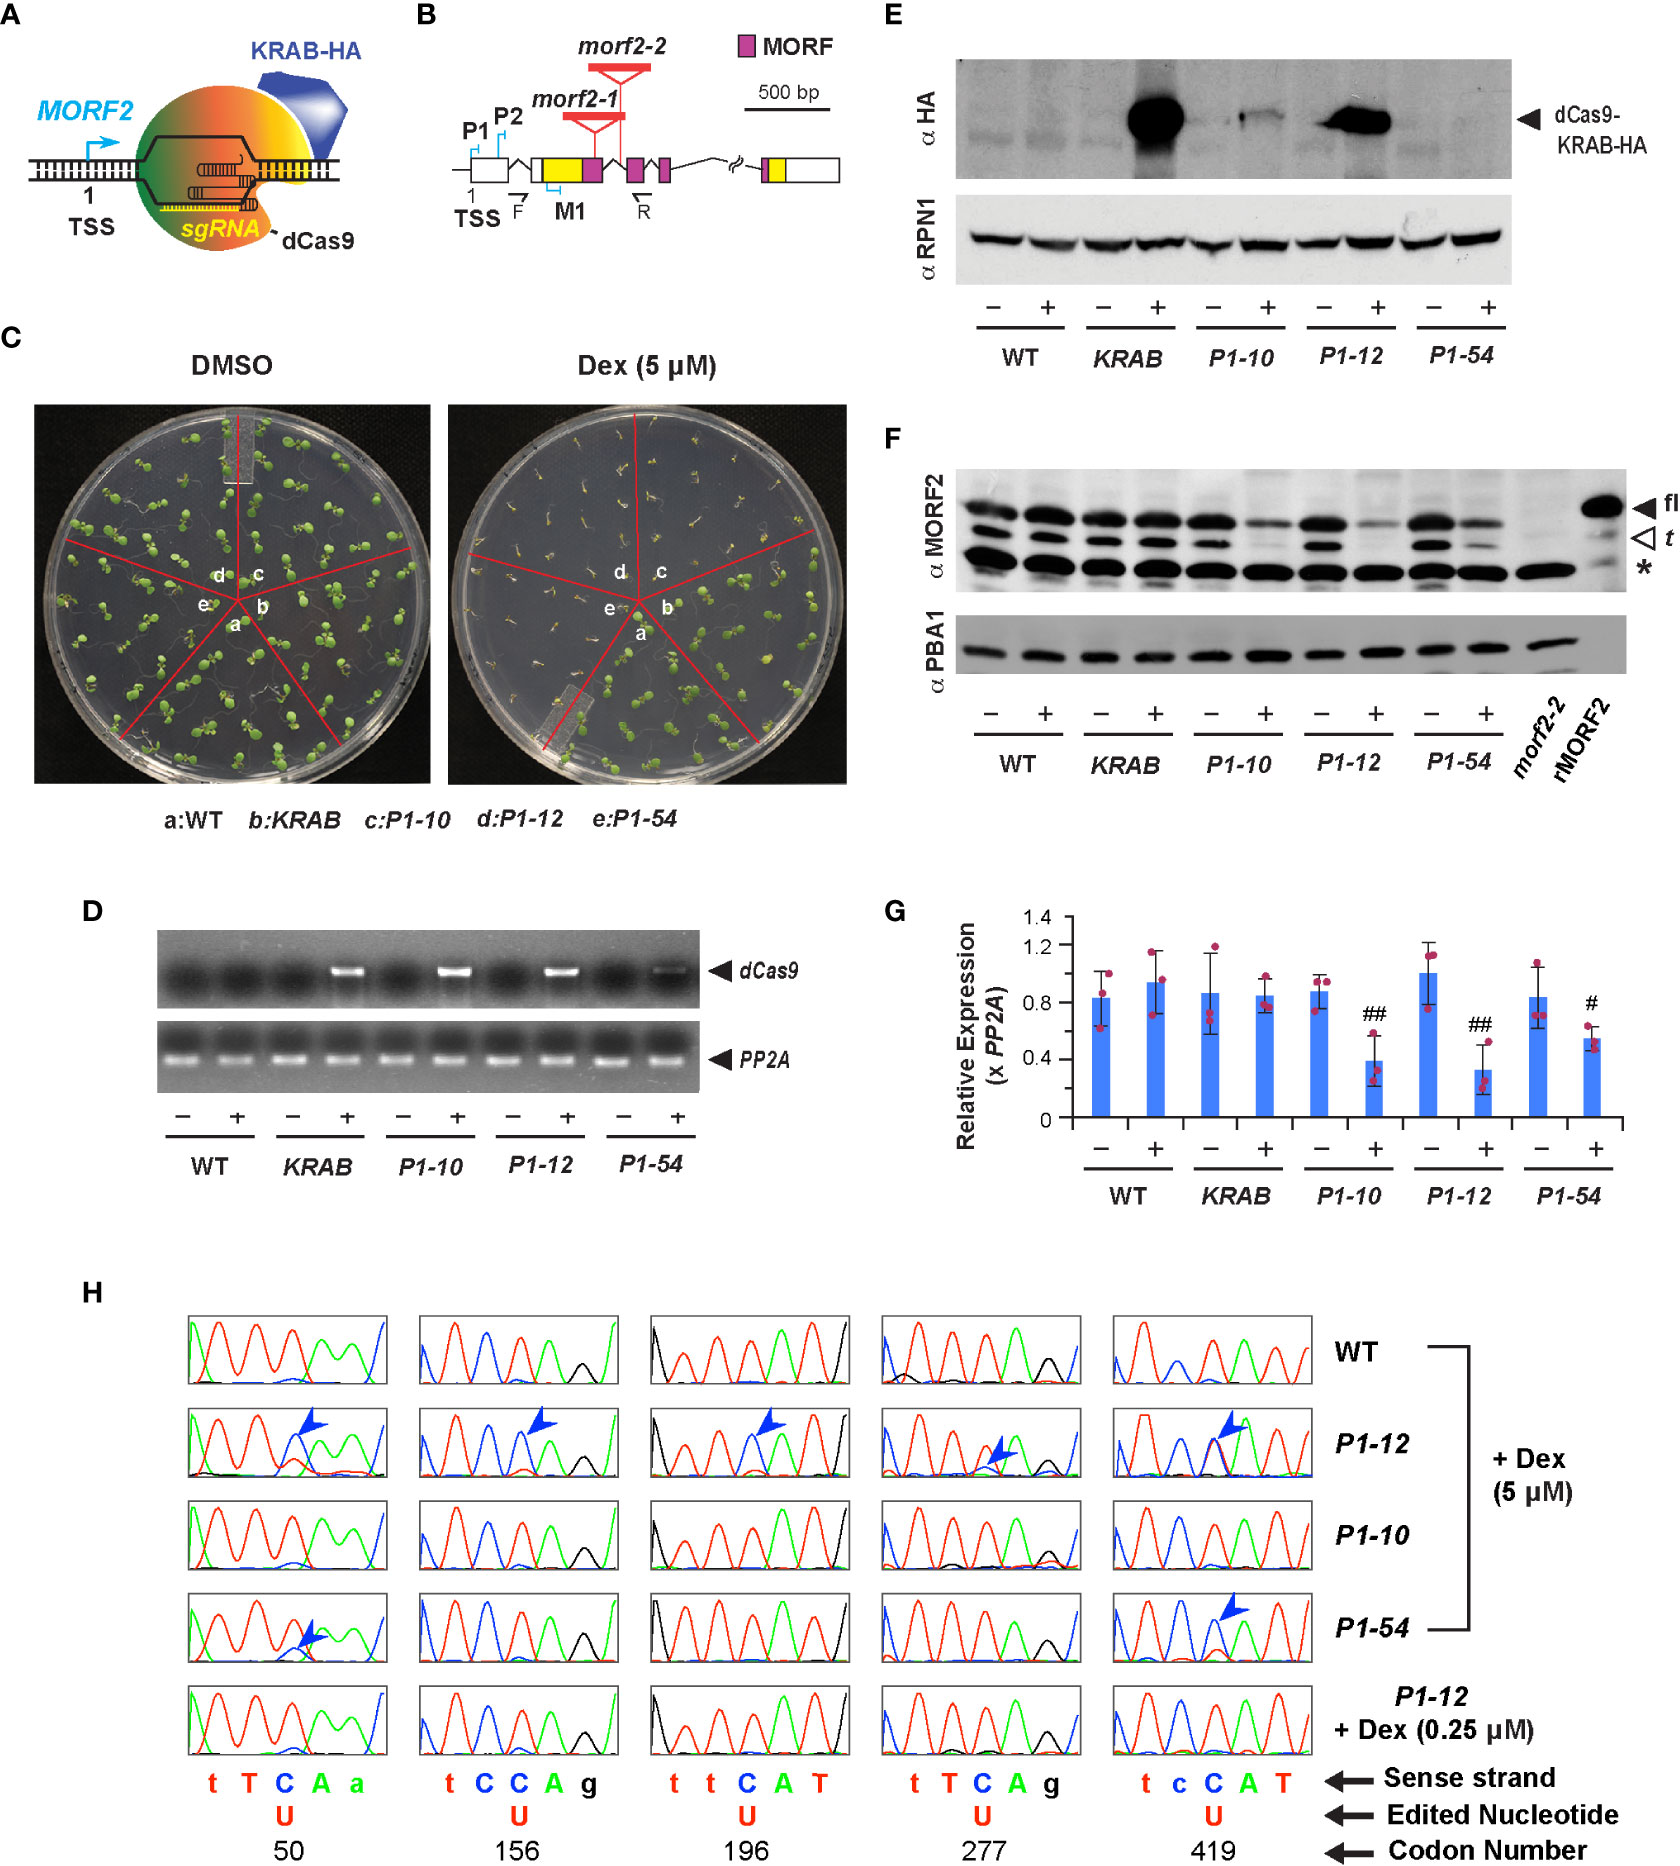
Figure 1 Downregulation of MORF2 by iCRISPRi inhibits plant growth prior to influencing RNA editing in chloroplasts. (A) A diagram showing the binding of dCas9-KRAB and sgRNA to the MORF2 locus. TSS: transcription start site. (B) Schematic representation of the MORF2 locus. Folded lines indicate introns, and the colored and white boxes represent coding and untranslated regions, respectively. Regions encoding the MORF domain are pink colored. Red triangles locate the T-DNA insertion sites for the morf2-1 and morf2-2 alleles. P1, P2, and M1 indicate the position of three protospacers. F and R represent the site of forward and reverse primers, respectively, used in combination with LBa1 (a left border primer of the T-DNA) for confirming the homozygous morf2-2 allele by PCR. Primer sequences are listed in Table S1. (C) Growth phenotypes of 7-d-old seedlings grown under LD on 1/2 MS media supplemented with 0.1% DMSO (DMSO hereafter) or 0.1% DMSO plus 5 μM Dex (5 μM Dex hereafter). (D) sqRT-PCR identifies an induced expression of dCas9 only in the indicated transgenic plants treated with 5 μM Dex as shown in (C). – and + indicate DMSO and 5 μM Dex treatments, respectively, herein as well as in (E-G). (E) Immunoblot analysis showing the detection of dCas9-KRAB-HA fusion in KRAB, P1-10, and P1-12 seedlings treated with 5 μM Dex as shown in (C). A proteasome subunit, RPN1, was used as a control indicating nearly equal protein loading. (F) Dex treatment reduced protein products of MORF2 in three P1 transformants but not in KRAB. Protein extracts from 7-d-old morf2-2 seedlings and E. coli cells expressing recombinant MORF2 (rMORF2) were used as negative and positive controls showing the absence and presence of MORF2, respectively. The full-length (fl) and truncated (t; putatively processed by peptidases) MORF2 are indicated by the closed and open arrowheads, respectively. The asterisk identifies an unknown cross-reacting species. A proteasome subunit, PBA1, was used as a control indicating nearly equal protein loading. (G) qPCR analysis of MORF2 transcripts in 7-d-old seedlings treated with or without 5 μM Dex as shown in (C). Relative expression of MORF2 is normalized to one of the three WT biological replicates treated with DMSO. PP2A shown in this figure and in Figures 2E, 3E, 7 was used as reference standards. Bars represent mean ( ± SD) from three biological replicates, each with three technical replicates. The maroon dots indicate three data points of replicates in each bar. # and ## indicate statistically significant differences between the two treatments within the same genotype (Student’s t-test, P < 0.05 and 0.01, respectively). (H) Comparison of sequencing chromatograms containing five indicated editing sites in the transcripts of ndhB gene obtained from 7-d-old light grown seedlings as indicated. Blue arrowheads point to the cytidine sites with lower editing efficiencies to uridine compared to WT. Genetic codons containing an editing site are capitalized and numbered.
Seeds harvested at the same time from plants grown under an identical environmental condition were used for growth assay. Dried seeds were vapor-phase surface sterilized for 3 to 5 h in the presence of 100 mL NaOCl (bleach) supplemented with 3 mL HCl. For seedlings grown under a long day (LD) photoperiod (16-h white light (120 μmol m-2 s-1)/8-h darkness at 21°C and 19°C, respectively), seeds were stratified in water at 4°C under darkness for three days before germination on half-strength Murashige-Skoog (1/2 MS; Caisson Labs) medium plus 1% (w/v) sucrose. For dark or dim light grown seedlings, seeds were briefly hydrated in water and plated on 1/2 MS without sucrose for stratification at 4°C under darkness for three days before germination. Dark grown seedlings were germinated in sealed two layers of aluminum foil wrap for three days with the same temperature condition as LD upon a 6-h germination initiation under white light (120 μmol m-2 s-1). Dim light grown seedlings were directly germinated and treated under continuous white light (1.5 μmol m-2 s-1) and temperature (23°C) for three days. Different concentrations of dexamethasone (Dex; MilliporeSigma), 1-Aminocyclopropane-1-carboxylate (10 μM ACC; MP Biomedicals), sliver nitrate (5 μM AgNO3; MilliporeSigma), lincomycin (Linc, 0.5 mM; MilliporeSigma), norflurazon (NF, 5 μM; MilliporeSigma), hygromycin B (30 mg/L; Calbiochem), and phosphinothricin (15 mg/L; Gold Biotechnology) were filter sterilized and added into the 1/2 MS medium after autoclave (121°C, 30min).
To prepare plants for seed propagation and transformation, 7-d-old seedlings grown on 1/2 MS under LD were planted on mixed soil containing 1/3 vermiculite, 1/3 peat moss, and 1/3 compost soil and grown under LD. Adult plants were fertilized once before bolting with 0.1% (w/v) 20-20-20 (Miracle-Gro), Calcium Nitrate (0.17 mM) and Magnesium Sulfate (0.33 mM).
The coding sequence for the fusion protein Flag-dCas9-KRAB-HA was PCR amplified from pHSN6I01 (addgene, Plasmid #50587) and cloned into the XhoI-SpeI sites of pTA7002 binary transformation vector to yield pTA7002-Dexp:KRAB (Aoyama and Chua, 1997). Upon ligation, an AscI site was introduced in front of SpeI site, between which an expression cassette for P1, P2, or M1 synthetic single-guide RNA (sgRNA) gene was inserted to generate a dual expression construct, pTA7002-Dexp:KRAB U6-26p:P1, P2, and M1, respectively. Each sgRNA expression cassette containing U6-26p, sgRNA gene and U6-26t was constructed by overlapping PCR using pCBC-DT1T2 (addgene, Plasmid # 50590) as a template. To construct Yellow Fluorescent Protein (YFP) tagged 35S:MORF2-YFP overexpression construct, the coding sequence of YFP was first PCR amplified from pEarleyGate101 (ABRC, #CD3-683) and cloned into pFGC5941 binary transformation vector between BamHI and XbaI sites. Upon construction, a 39-nucleotide DNA fragment encoding for a 13-amino acid linker (GSAGGGGGGGGGG) was introduced in-frame at the 5’-end of YFP. The resulting construct was further introduced with a coding sequence for HA or MORF2 in the AscI-BamHI sites in fusion with YFP to yield pFGC5941-35S:HA-YFP or pFGC5941-35S:MORF2-YFP, respectively.
All constructions were sequence-confirmed and introduced into the Agrobacterium tumefaciens strain GV3101, which was used to transform Col-0 using the floral dip method (Bent, 2006). Plants containing a single transgenic insertion were identified based on a 3:1 (resistant/sensitive) segregation ratio of T2 plants grown on 1/2 MS medium containing 30 mg/L hygromycin B for plants transformed with transgenes cloned in pTA7002 vector, or 15 mg/L phosphinothricin for plants transformed with transgenes cloned in pFGC5941 vector. Unless otherwise noted, all the experiments were performed using T4 or T5 progeny of homozygous transgenic plants carrying one transgenic insertion.
Total RNA was extracted from 10-50 mg seedlings using NucleoSpin RNA Plus kit (Macherey-Nagel) in accordance with the manufacturer’s protocol. Three independent biological samples were prepared for each assay. From each sample, 1.5 μg of total RNA was treated with DNase I (Thermo Fisher Scientific) for 15 min at room temperature prior to be converted into cDNA using the SuperScript III first-strand synthesis system (Thermo Fisher Scientific) following the manufacturer’s instructions. The resulting cDNA was then used as a template for either semi-quantitative Reverse-Transcription PCR (sqRT-PCR) or real-time quantitative (qPCR) analyses with primers listed in Table S1.
qPCR was performed on a Bio-Rad CFX Connect real-time PCR detection system using PowerUp™ SYBR™ Green Master Mix (Thermo Fisher Scientific) with three technical replicates for each of three biological samples. In a 10 μL qPCR reaction, 4 μL of cDNA (diluted 1/30 following first-strand synthesis) was amplified with 5 μL PowerUp™ SYBR™ Green Master Mix, and 0.5 μL each of 10 μM forward and reverse primers. Reactions were run in a cycling program consisting of 95°C for 5 min, 45 cycles of 95°C for 10 sec, 60°C for 10 sec, and 72°C for 30 sec, and followed by a melting curve program and cooling at 40°C for 2 min. Fluorescence data were collected at the end of each 72°C extension step, and continuously during the melting curve program. Relative gene expression was calculated according to the 2-ΔΔCt method with SERINE/THREONINE PROTEIN PHOSPHATASE 2A (PP2A) used as an internal control.
For transcriptome sequencing, two replicates of total RNA were isolated using the same method as described above from 8-d-old KRAB and P1-12 seedlings grown vertically on 1/2 MS media supplemented with or without different concentrations of Dex. For each sample, 1 μg RNA was used for pair-end 150-mer deep sequencing on a NovaSeq 6000 platform (Novogene). Adapter and low-quality sequences were removed from the raw FASTQ sequencing data (available at the Gene Expression Omnibus under accession number GSE213405) using Trimmomatic [phred=33, minimum length=36; (Bolger et al., 2014)]. The resulting valid sequences were aligned to the A. thaliana Col-0 reference genome (TAIR10; www.arabidopsis.org) using TOPHAT2 (Kim et al., 2013) to identify accepted hits of each locus. HTSeq was then used to calculate an absolute expression level (counts) of each locus based on the accepted hits (Anders et al., 2015).
To maximize cross experimental comparisons, we applied two standards for determining an expressed gene. For Significantly Differentially Expressed Gene (SDEG) analysis between KRAB and P1-12 seedlings shown in Figure 2, raw expression data (counts) from 10 transcriptomes with two from each of P1-12 (+DMSO), P1-12 (+0.025 μM), P1-12 (+0.25 μM), KRAB (+DMSO), and KRAB (+0.25 μM) were normalized to counts per million (CPM). A gene was considered as expressed if its CPM was above 2 in at least nine transcriptomes compared. For cross experimental comparisons, raw counts were normalized among 12 transcriptomes with two from each of P1-12 (+DMSO), P1-12 (+0.025 μM), Col6-3 (LS for 1/2 Linsmaier and Skoog medium), Col6-3 (+NF), gun1-9 (+NF), and morf2-2 (GM for Gamborg’s B5 basal medium). A gene was retained as expressed if it had a greater than 0.5 CPM in at least 11 samples. Similarly in the second cross experimental comparison for studying ethylene-regulated genes, we normalized the raw counts of four transcriptomes from P1-12 (+DMSO) and P1-12 (+0.25 μM) and considered a gene as expressed if it was expressed above 0.5 CPM in at least three samples. Normalized transcriptomes of expressed genes were further analyzed to calculate relative expression (Log2FC, FC for fold changes) and SDEGs ([Log2FC] ≥ 1; FDR < 0.01%) using edgeR (Robinson et al., 2010).
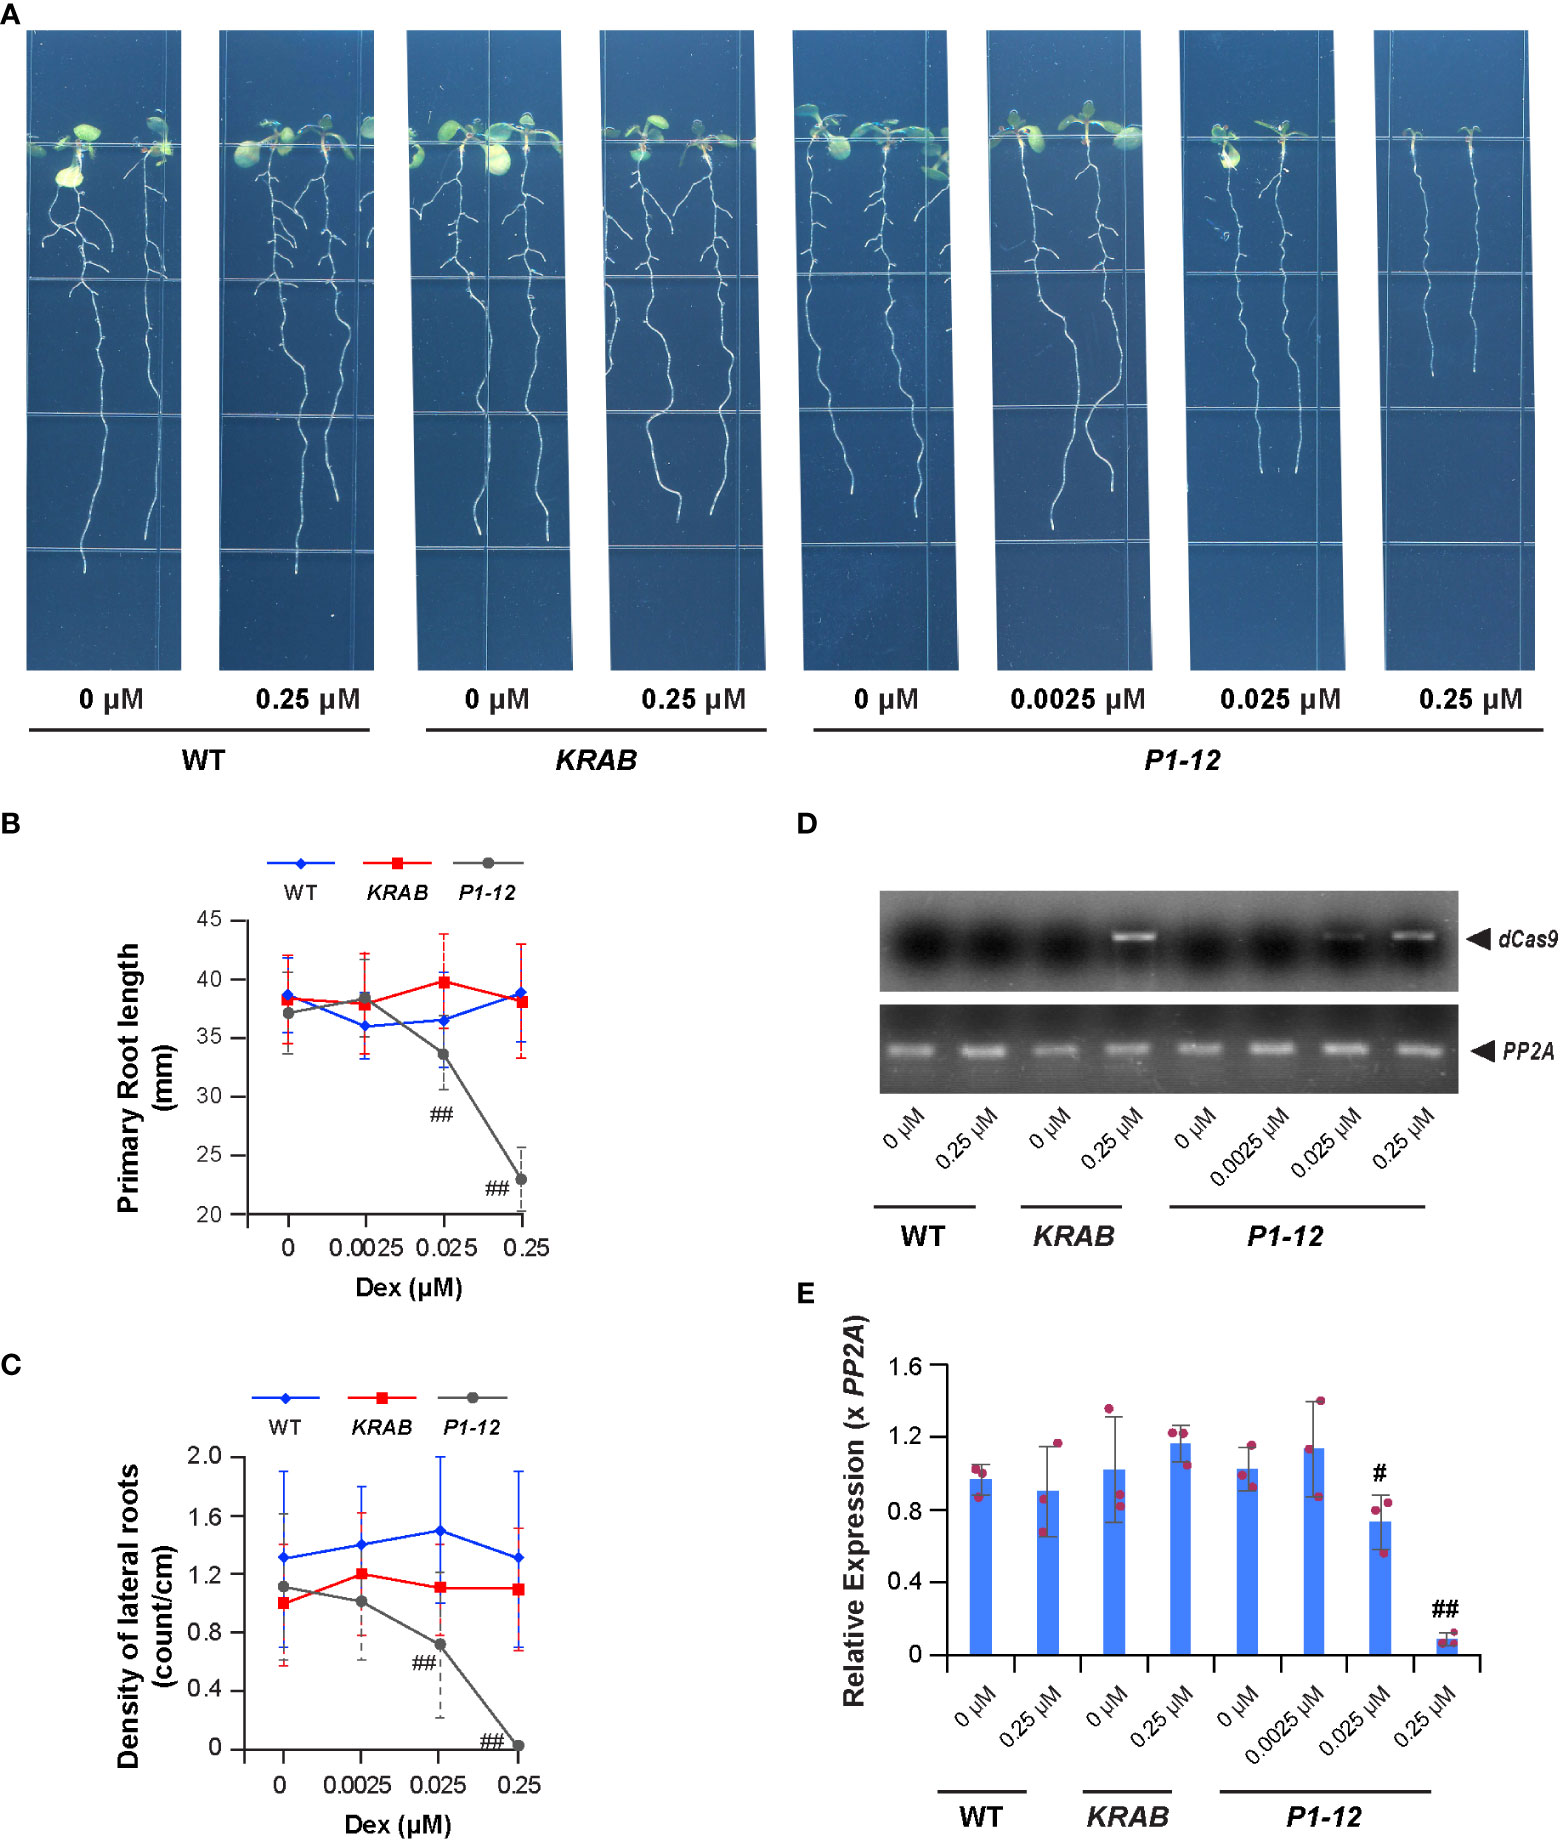
Figure 2 A MORF2 dosage-dependent growth inhibition. (A) Representative images showing seedlings from indicated genotypes grown vertically for 8 d under LD on 1/2 MS media supplemented with different concentrations of Dex. (B, C) Dex treatment inhibits primary (B) and lateral (C) root growth of P1-12 but not KRAB. The seedlings shown as in (A) were scanned and measured for primary root length using NeuronJ plugin in ImageJ. Visual lateral root number was counted manually. The density of lateral roots was normalized by the primary root length. (D) sqRT-PCR identifies the expression of dCas9-KRAB gene in seedlings of KRAB (+0.25 μM Dex) and P1-12 (+0.025/0.25 μM Dex). PP2A amplicons were shown to indicate a similar input of cDNA templates among different samples. (E) Dex treatment inhibits MORF2 expression in P1-12 at a concentration as low as 0.025 μM. Relative expression (mean ± SD) was normalized to PP2A from three biological replicates, each with three technical replicates. All data points were further normalized to one of the three biological replicates of WT seedlings grown under the DMSO treatment. The data points of replicates in each bar are indicated with maroon dots. P values were calculated using Student’s t-test. # and ##: P (< P1-12 (+DMSO)) < 0.05 and 0.01, respectively.
GO enrichment analysis was performed using a classical enrichment analysis embedded in the topGO package (Alexa et al., 2006). The assignment of GO functional categories was based on the TAIR GO categories from aspect “biological process” (ATH_GO_GOSLIM_20150408.txt) (Berardini et al., 2004). All GO terms at level 2 with P < 1e-10 (Fisher’s exact test) were considered to be overrepresented within each group of SDEGs. The list of SDEGs in GO:0009723 term was resolved using the “sigGenes” and “genesInTerm” functions in the topGO package (Alexa et al., 2006). Clustering analysis was performed using Heatmap.2 in R (http://www.r-project.org) based on row Z-scores of each expressed gene calculated by normalized CPM or relative expression.
Total RNA was extracted from 7-d-old LD-grown seedlings treated with different concentrations of Dex and converted to cDNA as described above. PCR fragments of ndhB were specifically amplified from the cDNA and sequenced using the primers listed in Table S1. The RNA editing efficiency at each site was measured by the proportion of sequenced thymine chromatogram area to that of cytosine at the editing site analyzed.
Transcriptome-wide analysis of chloroplast RNA-editing efficiency is performed using the RNA sequencing data obtained from 8-d-old KRAB and P1-12 seedlings upon Dex or DMSO treatments. The accepted reads of each locus obtained above in transcriptome analysis were sorted according to their positions in the Arabidopsis genome and saved as an aligned Binary Alignment Map (BAM) file. The resulting BAM file was further used to generate an index file using SAMtools (Li et al., 2009). Both position-sorted BAM and index files were loaded into the Integrative Genomics Viewer (IGV) program (Robinson et al., 2023) for manually examining the counts of thymine and cytosine nucleotides present in reads aligned with a specific editing site to digitally represent its editing efficiency. For each editing site, the counts of two biological replicates of the same genotype were combined and used to determine its statistically significant change of editing efficiency upon Dex treatment using Fisher’s exact test. All 33 known chloroplast RNA-editing sites as described in Takenaka et al. (Takenaka et al., 2012) were examined.
7-d-old LD-grown seedlings treated with or without 5 μM Dex were harvested, pulverized in liquid nitrogen, and immediately used for total protein extraction in 2 x SDS-PAGE sample buffer at 95°C for 5 min. Upon being resolved in SDS-PAGE, proteins were electrophoretically transferred onto polyvinylidene difluoride membranes (Immobilon-P; Millipore Sigma) for immunoblotting analysis.
MORF2 antibodies were raised against a MORF2-6His fusion in rabbits (Envigo Bioproducts). The antigenicity of MORF2 antibodies were verified by the absence and presence of protein bands with the expected size of full-length MORF2 (flMORF2) in morf2-2 and a tag-free recombinant MORF2 (rMORF2), respectively. rMORF2 was produced in BL21 E. coli cells transformed with pET28-MORF2, in which the CDS of MORF2 was inserted in the NcoI-EcoRI sites. Antibodies against 6His (Novagen), GST (Santa Cruz Biotechnology), the HA epitope (Biolegend), and α-tubulin (Sigma-Aldrich), were obtained from the indicated sources. Antibodies against RPN1 and PBA1 were used as previously described (Yu and Hua, 2022). Upon incubation with primary antibodies, each blot was further incubated with either goat anti-rabbit or goat anti-mouse secondary antibodies conjugated with horseradish peroxidase (SeraCare), and then visualized with SuperSignal West Pico Chemiluminescent Substrate or SuperSignal West Femto Maximum Sensitivity Substrate (Thermo Fisher Scientific), as according to the manufacturer’s instructions. Chemiluminescent signals on the immunoblot were scanned using an Azure 600 western blot imaging system (Azure Biosystems).
KRAB and P1-12 seedlings were germinated and grown in liquid 1/2 MS media supplemented with 0, 0.025, and 0.25 μM Dex for 4 d with slow shaking (100 rpm) at 23°C under continuous white light (120 μmol m-2 s-1). Upon treatment, 10 seedlings of each sample were selected and transferred separately into an Eppendorf tube containing 1 mL liquid 1/2 MS medium freshly mixed with 2 μM CM-H2DCFDA (Molecular Probes) for 10 min with gentle agitation. Fluorescence signals were observed under a Nikon Eclipse E600 epifluorescence microscope and recorded with Spot 5.2 software using the same exposure settings. Average fluorescence intensity in a fixed area (0.1 mm x 0.25 mm) that includes ~ 0.2 mm of a root tip was measured using ImageQuant5.2 (GE Healthcare).
CRISPRi applies a deactivated Cas9 (dCas9) fused with a transcriptional repressor to inhibit transcription of a target locus that is recognized by co-expressed sgRNAs (Figure 1A; Gilbert et al., 2013). Its effectiveness in plants has not been well documented (Karlson et al., 2021). To explore this technology, we adapted the dCas9-KRAB repressor from Gilbert et al (2014) and fused it with a Dex-inducible promoter (Dexp) in pTA7002 (Aoyama and Chua, 1997). Given the strong CRISPRi activity obtained within -50 to +300 nucleotide (nt) of the transcription start site (TSS) of a gene in human cells (Gilbert et al., 2014), we designed three sgRNA genes, P1, P2, and M1, containing a protospacer targeted to a similar region of the MORF2 locus (Figure 1B; Table S2; Xie et al., 2014). We raised 4, 9, and 4 independent T4 homozygous transgenic lines that were transformed with a dual expression construct carrying Dexp:dCas9-KRAB::U6-26p:P1, P2, and M1, respectively. As a negative control, we obtained 6 independent lines stably transformed with Dexp:dCas9-KRAB alone. Hereafter, we referred them as P1, P2, M1, and KRAB transformants. After screening seedlings grown on 1/2 MS medium containing 5 μM Dex under LD, we found severe growth inhibition in three P1 independent lines but only mild or nonsignificant phenotypes in P2 and M1 transformants, respectively. As a negative control, KRAB grew as normally as WT (Figures 1C, S1A). Therefore, a protospacer close to the TSS region is likely required for suppressing the transcription of MORF2.
To demonstrate iCRISPRi-mediated MORF2 expression suppression, we first found by both sqRT-PCR and immunoblot analyses the expression induction of dCas9-KRAB in three P1 transformants and KRAB upon Dex treatment. Neither protein bands nor RT-PCR products of dCas9-KRAB transgene were identified in WT or when transgenic seedlings were treated with DMSO only (Figures 1D, E). Consistent with the expression induction of dCas9-KRAB, we identified using anti-MORF2 polyclonal antibodies that the abundance of two protein species corresponding to the sizes of full-length (fl-) and truncated (t-) versions of MORF2 was apparently reduced in three P1 seedlings treated with 5 μM Dex but not in other samples (Figure 1F). Additional qPCR confirmed significant reduction of MORF2 transcripts in these samples as well (Figure 1G). While we detected a clear band of dCas9-KRAB by anti-HA antibodies in P2 and M1 seedlings treated with 5 μM Dex, the reduction of MORF2 was minor, suggesting that their weak phenotypes are likely due to the low efficiency of sgRNAs (Figure S1B).
To rule out the possibility of off-target suppression by P1 sgRNA, we analyzed the expression of six top off-target candidates (Figure S2A). Applying a transcriptome-wide analysis (see below), we only found MORF2 with a greater than 2-fold expression reduction in P1-12 treated with 0.25 μM Dex. The expression of off-targets maintained either no changes, undetectable, or upregulated in P1-12 (+0.25 μM Dex) (Figures S2B, C). Therefore, the P1 sgRNA does not likely bind to its putative off-target loci in P1-12.
To further test the specific expression inhibition of MORF2, we crossed P1-12 with a 35S:MORF2-YFP overexpression transgenic line to examine whether the reduced growth of P1-12 upon 0.25 μM Dex treatment could be rescued. We also crossed P1-12 with a 35S:HA-YFP transgenic plant as a control. Because homozygous MORF2 overexpression plants often induce co-suppression of MORF2 and lead to variegation phenotypes not only in early seedlings but also to all aerial tissues in adult plants (Figure S2D), only F1 plants were analyzed. We detected no growth differences among the three genotypes when seedlings were treated with DMSO only. However, upon 0.25 μM Dex treatment, both primary root growth and lateral root formation were suppressed in P1-12. Interestingly, this suppression was completely restored in the F1 plants of P1-12 x 35S:MORF2-YFP (Figures S2E, F), suggesting that MORF2-YFP complements the expression suppression of the endogenous MORF2. We also observed a partial growth recovery in the F1 plants of P1-12 x 35S:HA-YFP likely due to a 50% reduction of dCas9-KRAB and P1 sgRNA alleles. Hence, P1 sgRNA is specific to MORF2.
The development of iCRISPRi-mediated transcription suppression of MORF2 allowed us to modulate its endogenous products in a controlled manner. Consequently, we can quantify the influence of MORF2 on RNA editing and plant growth. As a control, we also characterized a new morf2-2 T-DNA insertion mutant allele to study the severest growth and developmental impact by loss-of-function of MORF2 (Figures 1B, F). In addition to previously discovered albino and RNA-editing deficiency phenotypes in morf2-1 (Takenaka et al., 2012), morf2-2 showed retarded embryo development and disrupted embryo structures that led to varied seedling morphology upon germination (Figure S3).
Because ndhB mRNA has the severest editing errors in morf2-1 and carries the highest number of RNA-editing sites among chloroplast mRNAs (Takenaka et al., 2012), we first compared RNA-editing efficiencies in its five codons that encode the 50th, 156th, 196th, 277th and 419th amino acids in 7-d-old LD-grown P1-12 seedlings treated with different concentrations of Dex using a Sanger sequencing approach. While we detected approximately 25, 20, 10, 75, and 50% C-to-U editing efficiencies for the five sites in 7-d-old LD-grown P1-12 seedlings treated with 5 μM Dex (Figure 1H), the editing efficiencies were either as normal as WT in P1-12 seedlings treated with 0.25 μM Dex or fully abolished to 0% in morf2-1 (Figures 1H, S3E, respectively), indicating a MORF2 dosage-dependent RNA-editing phenotype. Consequently, fewer RNA-editing errors were observed in P1-10 and P1-54 upon 5 μM Dex treatment due to a weaker suppression of MORF2 (Figures 1F–H, S1C). No RNA editing errors were identified in WT and KRAB when treated with 5 μM Dex (Figures 1H, S4), further confirming the specificity of P1 sgRNA to the MORF2 locus.
We then examined the growth of 8-d-old P1-12 seedlings grown vertically under LD on 1/2 MS media containing different concentrations of Dex. Surprisingly, we observed significant reductions of primary root length and density of lateral roots of its seedlings treated with Dex at a concentration as low as 0.025 μM, 200-fold below the concentration that caused detectable RNA-editing errors by the Sanger sequencing approach (Figures 2A–C). Interestingly, the expression induction of dCas9-KARB and suppression of MORF2 were detected in accordance with seedling growth inhibition (Figures 2D, E). This result was inconsistent with the well-known RNA-editing function of MORF2 (Yuan et al., 2022). To carefully examine this discrepancy, we developed a transcriptome-wide analysis of chloroplast RNA-editing efficiency. Based on the counts of thymine and cytosine nucleotides present in reads aligned with a specific editing site, we were able to precisely decipher the editing efficiencies of all 33-known chloroplast RNA-editing sites (Takenaka et al., 2012; Table S3). Interestingly, three and eight sites had significant changes of C-to-U editing efficiency in P1-12 (+0.025 μM Dex) and P1-12 (+0.25 μM Dex), respectively, compared to P1-12 (+DMSO). However, as a control, only one site showed a significant but small change of the editing efficiency in KRAB (+0.25 μM Dex) compared to KRAB (+DMSO) (P < 0.05, Fisher’s exact test with Bonferroni adjustment). Therefore, this digital data analysis better reflects the response of chloroplast RNA-editing machinery to the expression reduction of MORF2.
To tackle early gene expression regulatory pathways involving MORF2, we analyzed the transcriptome changes of P1-12 in response to the gradient expression reduction of MORF2. Through RNA-Seq analysis, we identified 161 and 1,131 upregulated SDEGs (≥ 2-fold changes, FDR (false discovery rate) < 0.01%), and 27 and 1,602 downregulated SDEGs, in 8-d-old LD-grown P1-12 seedlings upon 0.025 and 0.25 μM Dex treatments, respectively, in comparison to the control treated with DMSO (Figures 2A, 3A). Among them, 145 and 22 up and downregulated SDEGs (90.1 and 81.5%, respectively) from P1-12 (+0.025 μM Dex) are included in P1-12 (+0.25 μM Dex), suggesting that they are the early responsive genes to MORF2 reduction (Figure 3A).
Similarly, 1,023 and 1,470 SDEGs were detected to be up and downregulated, respectively, in P1-12 (+0.25 μM Dex) when compared with KRAB (+0.25 μM Dex) (Figure 3A). Among these, 886 and 1,362 (86.6 and 92.7%, respectively) were overlapped with the corresponding up and downregulated SDEG groups that were identified above (Figure 3A). Importantly, 98.2% overrepresented biological process (BP) GOs (all 79 upregulated and 198 out of 203 downregulated) in P1-12 (+0.25 μM Dex) compared to KRAB (+0.25 μM Dex) were commonly found in P1-12 (+0.25 μM Dex) compared to P1-12 (+DMSO) (Tables S4, 5). Hence, the influence of free dCas9-KRAB on the transcriptome changes in P1-12 (+0.25 μM Dex) is negligible. Hereafter, we referred to the SDEGs of P1-12 (+0.25 μM Dex) as compared with P1-12 (+DMSO).
Given the growth inhibition phenotype (Figures 2A–C), the small group of SDEGs in P1-12 (+0.025 μM Dex) likely reflects the early pathways in response to MORF2 reduction. Interestingly, all its 19 overrepresented upregulated BP GO pathways (Fisher’s exact test, P < 1e-10) were also significantly upregulated in P1-12 (+0.25 μM Dex). Given their ancestor pathways in response to stimulus, immune system process and interspecies interaction, we hypothesized that reducing MORF2 in P1-12 upregulated stress defense processes (Figure 3B). Five GO pathways involved in carbohydrate metabolism were commonly identified in the downregulated SDEGs of P1-12 (+0.025 μM Dex) and P1-12 (+0.25 μM Dex) despite a less statistically significant level (Fisher’s exact test, P < 0.01) applied in the former group due to its small size (Figures 3A, C). To rule out the possibility of a background change of GO pathways in P1-12 (+0.025 μM Dex) due to a general effect of Dex treatment, we also identified 80 and 5 SDEGs that are up and down regulated in KRAB (+0.25 μM Dex) compared with KRAB (+DMSO). However, all 19 overrepresented upregulated BP GO pathways commonly found in P1-12 (+0.025 μM Dex) and P1-12 (+0.25 μM Dex) were not discovered at the 1e-10 P-value cutoff (Fisher’s exact test) in the 80 upregulated SDEGs of KRAB (+0.25 μM Dex) (Table S6). Similarly, the only 5 down-regulated SDEGs do not show any enrichment of GO pathways involved in carbohydrate metabolism either (Table S7).
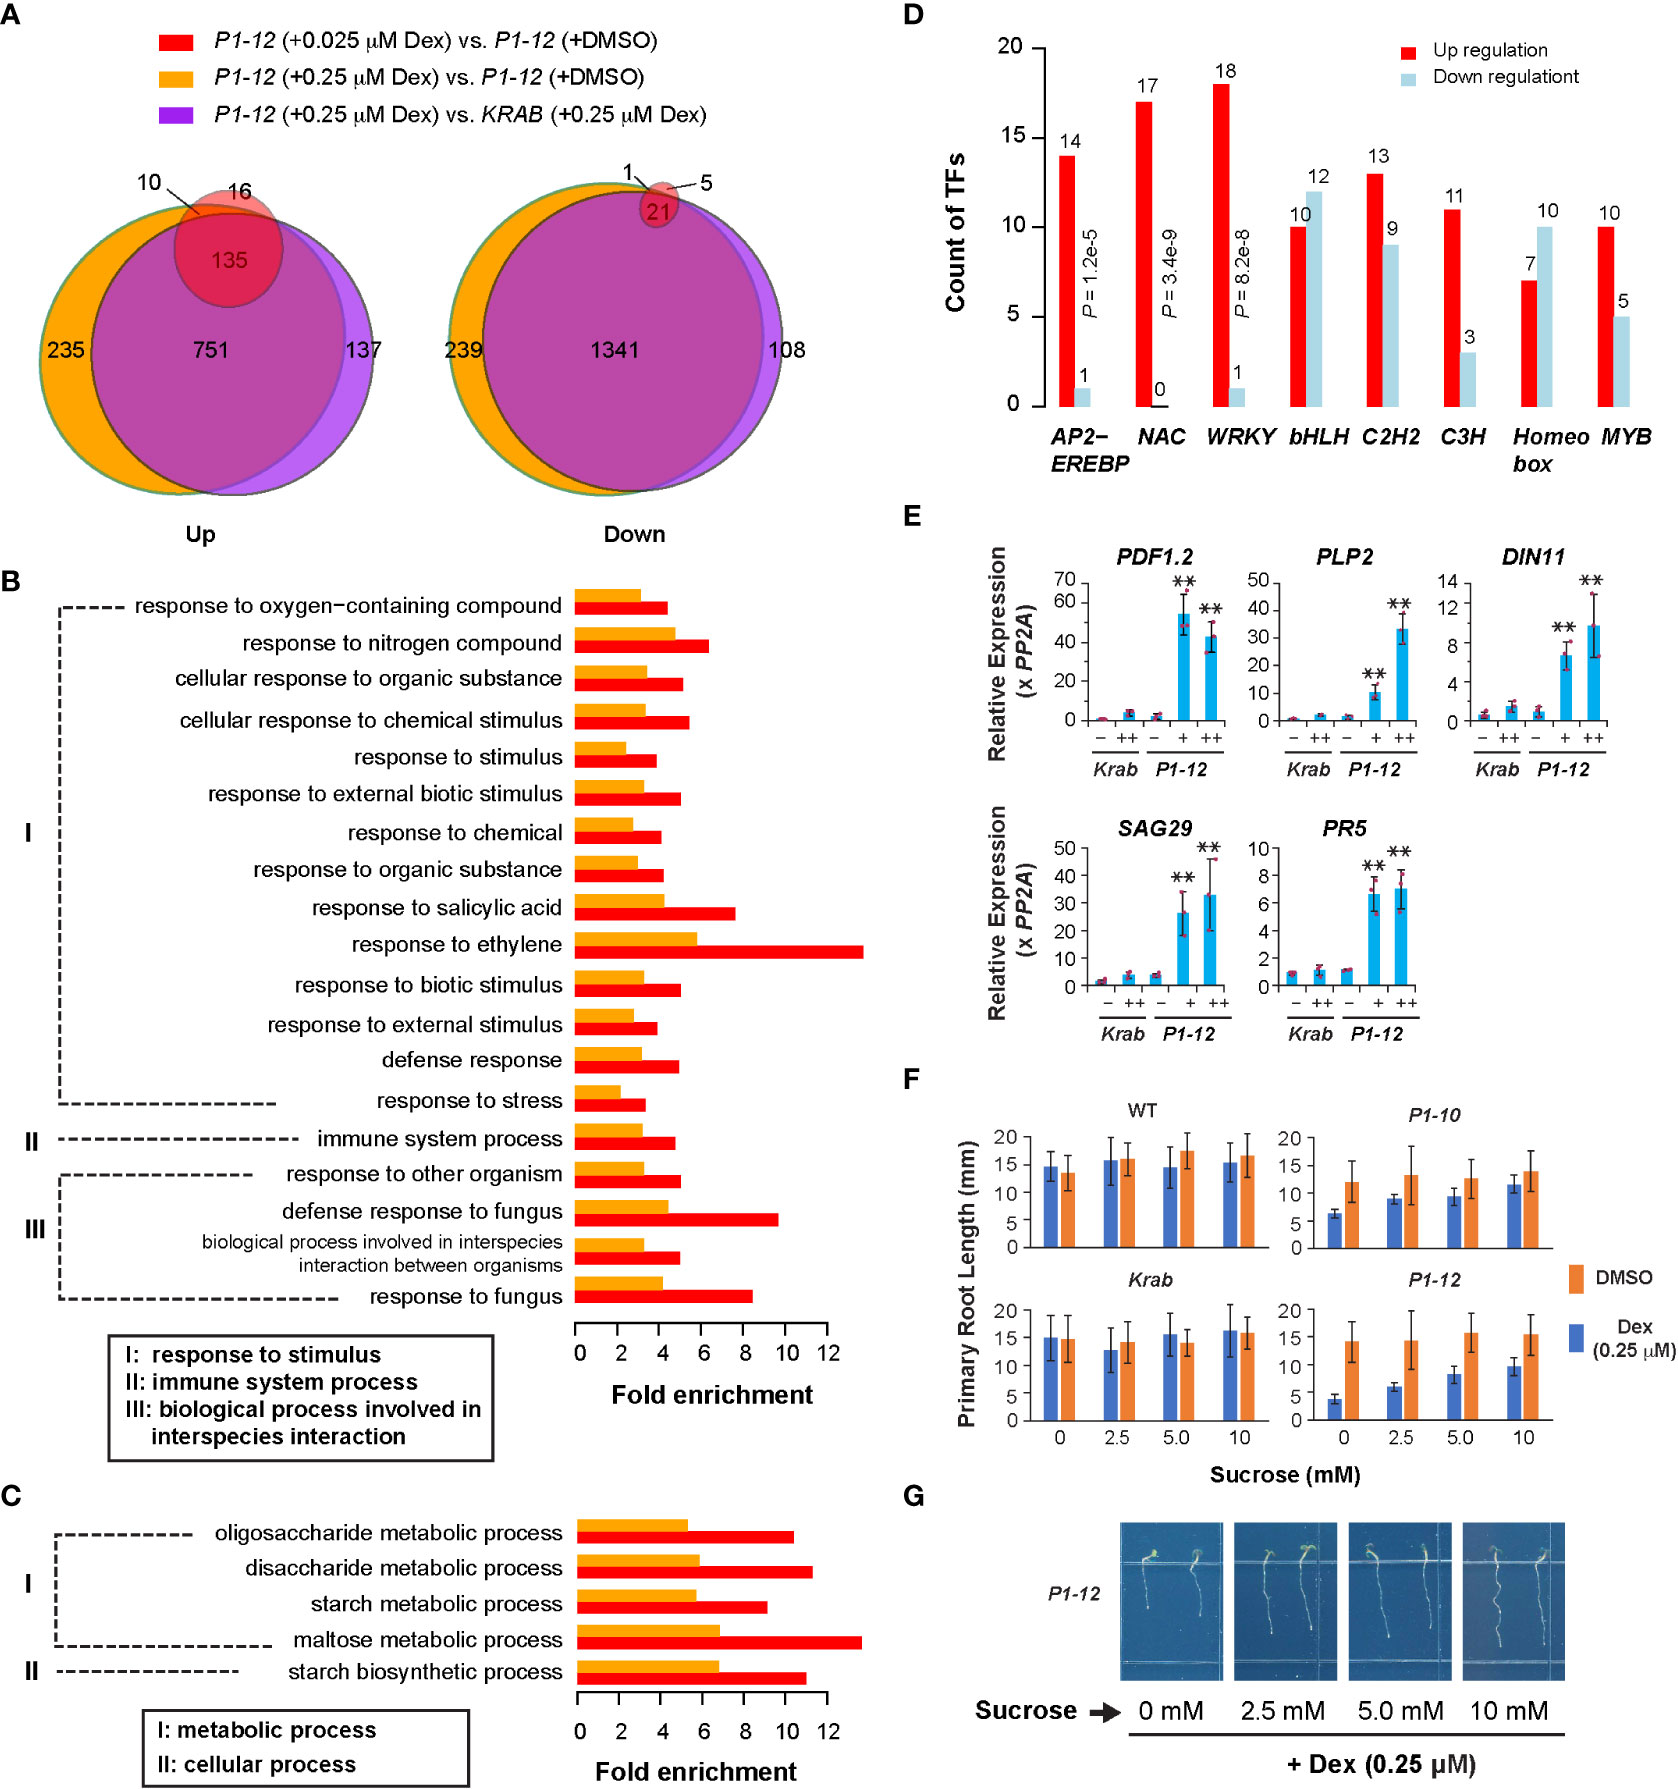
Figure 3 Transcriptome analysis revealed a role of MORF2 in regulating plant stress defense. (A) Overlap of SDEGs in three indicated pairs of transcriptomes suggests a little impact of dCas9-KRAB overexpression but a large impact of MORF2 reduction on transcriptome changes in P1-12. A gene was retained for comparison if its Counts Per Million (CPM) was above 2 in at least nine samples from two replicates each of P1-12 (+DMSO), P1-12 (+0.025 μM), P1-12 (+0.25 μM), KRAB (+DMSO) and KRAB (+0.25 μM). (B, C) Enrichment of biological processes in up (B) and downregulated (C) SDEGs of P1-12 seedlings treated with 0.025 μM (red bars) and 0.25 μM (orange bars) Dex demonstrated upregulation of stress response. (D) Overrepresentation of three major stress responsive transcription factor families, APETALA2/ETHYLENE-RESPONSIVE ELEMENT BINDING PROTEIN (AP2-EREBP), NO APICAL MERISTEM/ARABIDOPSIS TRANSCRIPTION ACTIVATION FACTOR/CUPSHAPED COTYLEDON (NAC), and WRKY, in upregulated SDEGs of P1-12 seedlings treated with 0.25 μM Dex. P values indicated were calculated using Fisher’s exact test. (E) qPCR verification of five stress defensive genes. Relative expression of a target gene is normalized to one of the three KRAB biological replicates treated with DMSO. Bars and the maroon dots are described as in Figure 1G. Double asterisks represent a statistically significant upregulation of an indicated gene in P1-12 seedlings treated with Dex compared to those treated with DMSO only (Student’s t-test, P < 0.01). –: DMSO; +: 0.025 μM Dex; ++: 0.25 μM Dex. (F) Sucrose promotes root growth of light-grown P1-10 and P1-12 seedlings only when treated with 0.25 μM Dex. Each bar represents mean ( ± SD) of 20 to 24 seedlings analyzed. WT and KRAB seedlings were included as negative controls. (G) Representative images of P1-12 seedlings grown on 0.25 μM Dex-containing 1/2 MS media supplemented with different concentrations of sucrose.
The identification of significantly upregulated stress defensive pathways in P1-12 (+0.025 μM Dex) and P1-12 (+0.25 μM Dex) explains the growth suppression according to the growth-defense tradeoff model (Huot et al., 2014). To further demonstrate the upregulation of plant defense responses in P1-12 upon Dex treatment, we 1) investigated the differential enrichment of all known transcription factor families, 2) analyzed the activity of senescence-associated genes (SAGs) as described in Garapati et al. (2015), 3) verified the expression of five selected stress responsive genes by qPCR, and 4) examined growth response to sucrose.
From a list of 52 transcription factor families including in total 1,851 annotated loci (Davuluri et al., 2003), we discovered that 8 families were overrepresented in the SDEGs of P1-12 (+0.25 μM Dex). Among these, three well-known stress responsive families, AP2-EREBP, NAC, and WRKY, were discovered to be overrepresented in the upregulated SDEGs of P1-12 (+0.25 μM Dex) (Figure 3D). Consistently, five selected genes involved in plant defense and senescence were detected by qPCR to be significantly upregulated in P1-12 upon Dex treatment as low as 0.025 μM (Figure 3E). To support a notion of stress induced senescence and starvation (Mahmood et al., 2016; Sade et al., 2018), we first identified a significant enrichment of SAGs in the SDEGs of P1-12 (+0.25 μM Dex) (Table S8). Unsurprisingly, 43 out of 46 enriched SAGs are upregulated (Table S9). Through germinating and growing seedlings on 1/2 MS media supplemented with different concentrations of sucrose, we found that addition of sucrose up to 10 mM alleviated the primary root growth suppression of P1-10 and P1-12 by 0.25 μM Dex treatment. This effect was not significant in WT and KRAB seedlings under both Dex and DMSO treatments (Figures 3F, G). Collectively, this transcriptome analysis suggests that MORF2 negatively modulates stress response beyond its role in RNA editing.
Further GO analysis on the downregulated SDEGs of P1-12 (+0.25 μM Dex) identified a significant enrichment of BP pathways related to photosynthesis, tetrapyrrole metabolism and pigment biosynthesis, all of which are characteristics related to RS (Table S5). Through comparison, we identified that 1,844 (60.7%) and 895 (29.5%) SDEGs of P1-12 (+0.25 μM Dex) were also significantly differentially expressed in NF-treated WT (Col6-3) and gun1-9 seedlings, respectively (Figure 4A; Zhao et al., 2019). We sorted out a group of 1,382 GUN1-dependent RS genes that are regulated in opposite in WT (+NF) and gun1-9 (+NF) (Figures 4B, C). Interestingly, their expression patterns in P1-12 (+0.25 μM Dex), particularly those overlapped with WT (+NF), had similar and opposite directions as they were in WT (+NF) and gun1-9 (+NF), respectively (Figures 4D, E). Consistent with reduction of MORF2 in P1-12 (+0.25 μM Dex), those genes showed a similar expression pattern as did they in morf2-2. Further comparing P1-12 (+0.25 μM Dex), morf2-2, and WT (+NF), we identified gradient expression changes, in which the GUN1-dependent RS genes showed higher fold-changes in morf2-2 and WT (+NF) than did they in P1-12 (+0.25 μM Dex) (Figure 4D). This feature is even more clear for the nuclear-encoded photosynthesis genes (Figure 4F; Table S10).
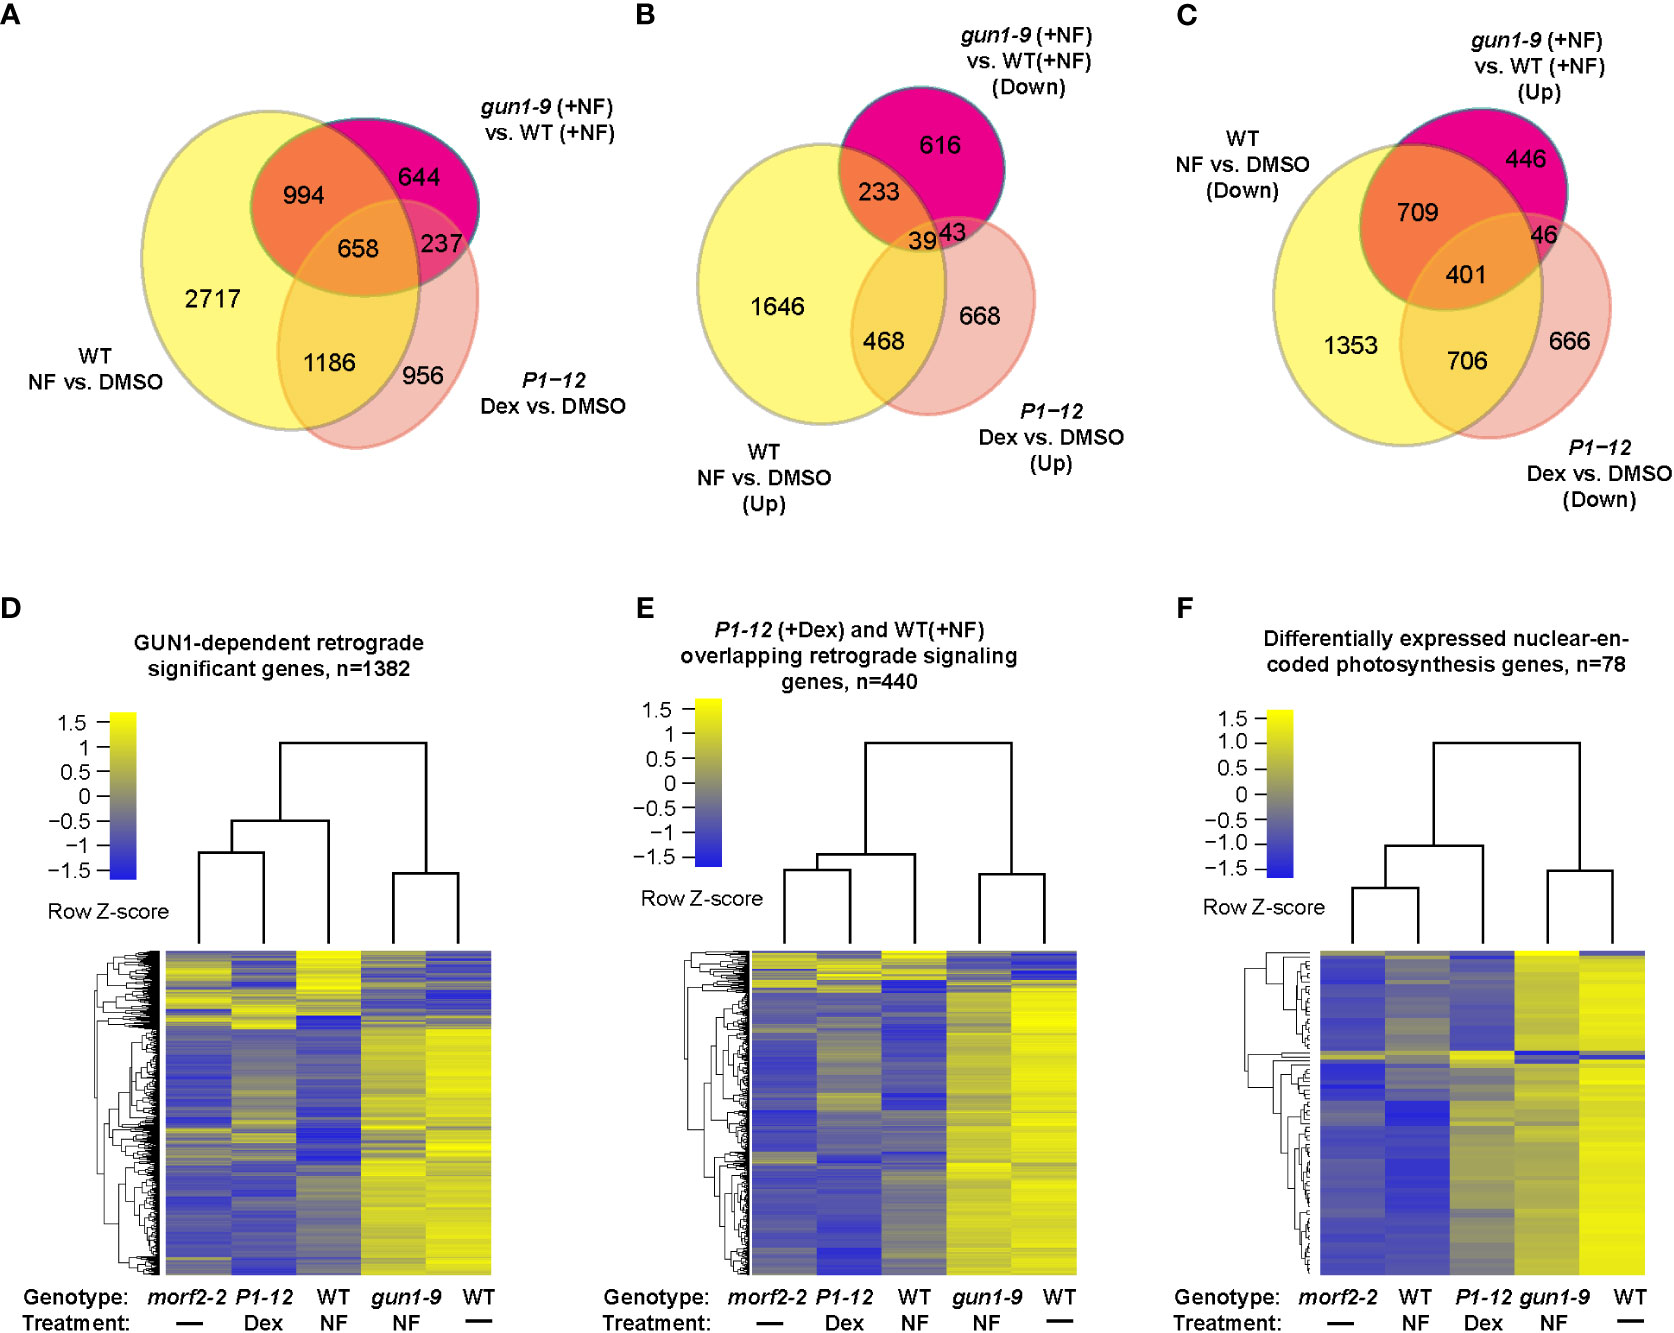
Figure 4 Cross experimental comparison demonstrates MORF2 as an effector of RS in chloroplasts. (A) Overlap of SDEGs resulting from MORF2 reduction in P1-12 (+0.25 μM Dex) with known SDEGs involved in RS either in WT (Col6-3; +NF) or in gun1-9 (+NF). The Venn diagram shows the overlap of SDEGs identified in P1-12 (+0.25 μM Dex), WT (+NF), and gun1-9 (+NF) compared to the corresponding controls indicated. A gene was retained for comparison if its CPM was above 0.5 in at least 11 samples from two replicates each of P1-12 (+DMSO), P1-12 (+0.25 μM), WT (+DMSO), WT (+NF), gun1-9 (+NF), and morf2-2. (B, C) Identifying the group of known GUN1-dependent RS genes and its overlap with up and downregulated SDEGs in P1-12 (+0.25 μM Dex). Shown are two Venn diagrams indicating the overlap of up or downregulated SDEGs from three different transcriptome pairs compared. (D–F) P1-12 (+0.25 μM Dex) show similar and opposite expression patterns to WT (+NF) and gun1-9 (+NF), respectively, for GUN1-dependent (D), P1-12 (+0.25 μM Dex)/WT (+NF) overlapping (E) retrograde signaling genes, and differentially expressed nuclear-encoded photosynthesis genes (F). The two-dimensional clustering diagrams were created based on row Z-scores of normalized expression data (CPM) of each expressed gene (>0.5 CPM) from indicated samples.
Lincomycin-induced RS suppresses photomorphogenesis (Martin et al., 2016; Gommers et al., 2021). Given the activation of RS in P1-12 (+0.25 μM Dex), we questioned whether P1-12 (+0.25 μM Dex) had altered morphogenesis. Since exogenous sucrose weakened the influence of lincomycin-induced RS (Martin et al., 2016), it was also eliminated hereafter. Upon 3 d after germination (DAG), we saw that WT, KRAB, and P1-12 grew similarly under LD except for reduced cotyledon areas of P1-12 when treated with ≥0.25 μM Dex (Figure 5A). However, we unexpectedly found opened cotyledons and shortened hypocotyls in dark-grown P1-12 seedlings upon ≥0.25 μM Dex treatments (Figures 5A, B), indicating suppression of skotomorphogenesis by MORF2-mediated RS.
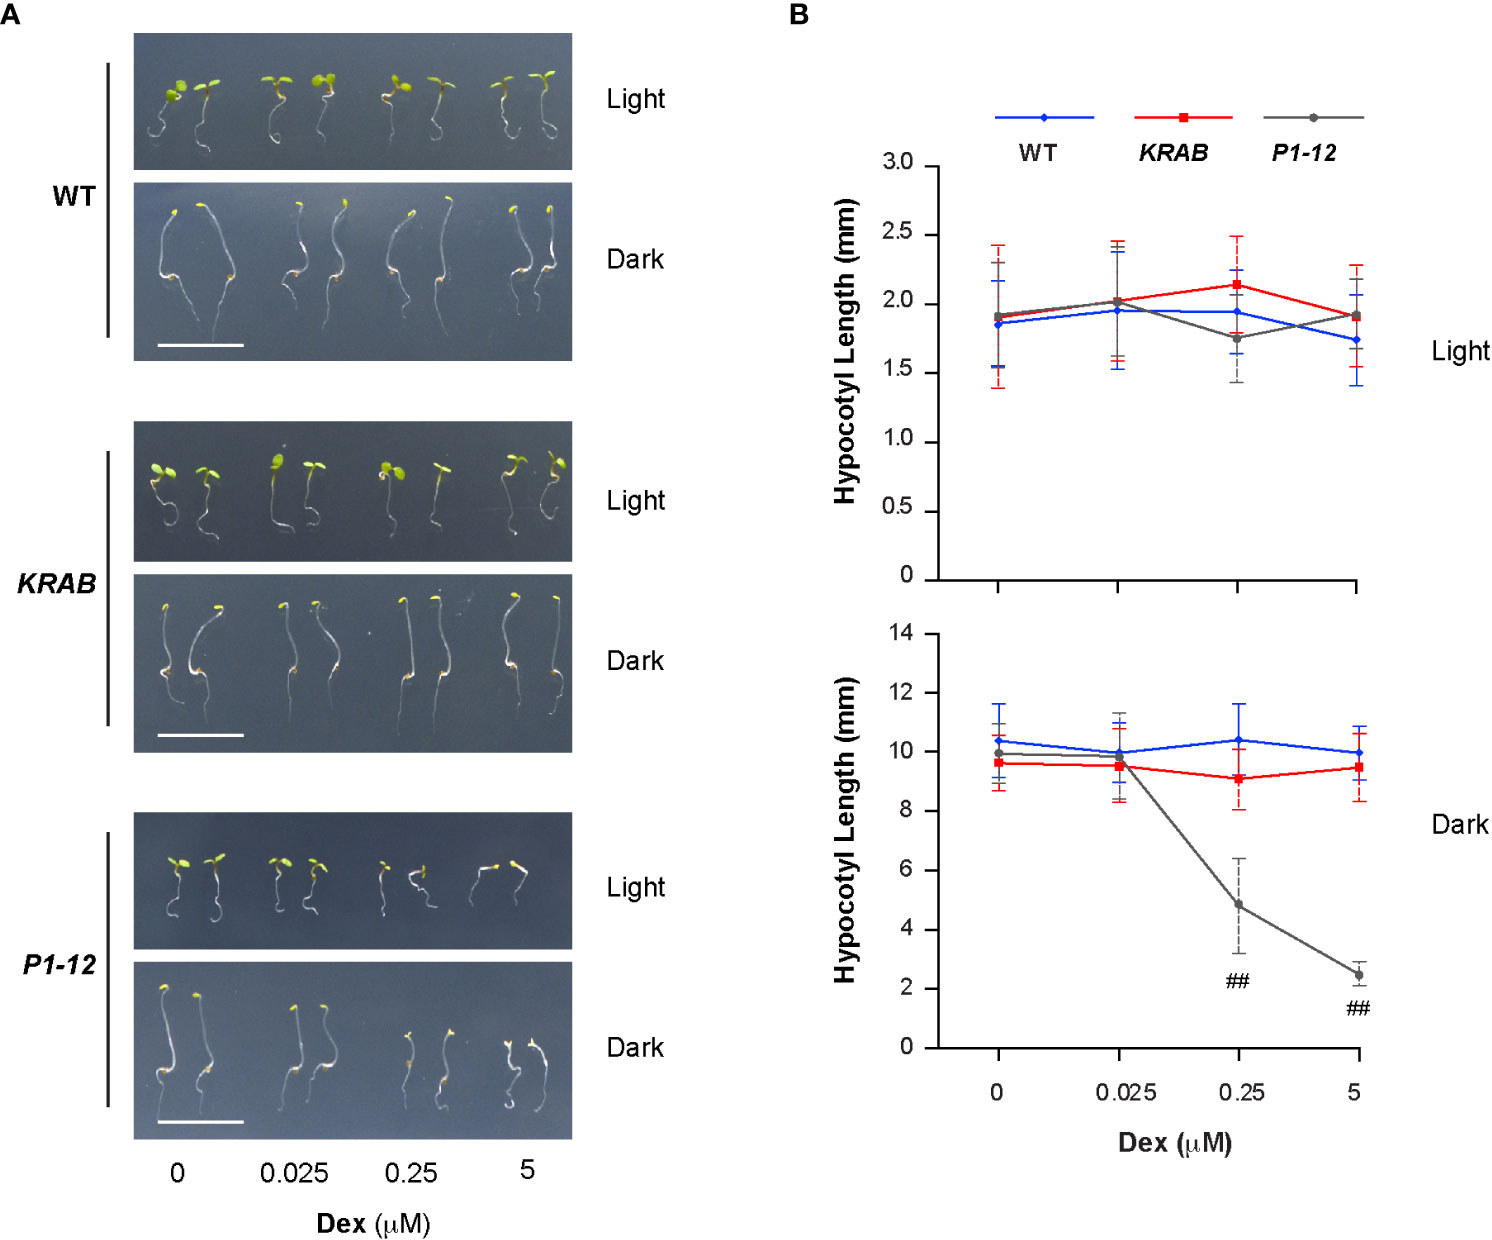
Figure 5 Reduction of MORF2 in P1-12 upon Dex treatment inhibits skotomorphogenesis. (A) Representative seedlings grown for 3 d under LD or in dark on media containing different concentrations of Dex. Bar = 1 cm. (B) Effect of different concentrations of Dex on hypocotyl elongation. Seedlings were grown for 3 d as in (A) before measurement. Double hash tags identify points with significant reductions of hypocotyl length in P1-12 than those in WT and KRAB (Student’s t test; P < 0.01). Each data point represents mean (± SD) of 20 replicates.
The unexpected discovery of open cotyledons in dark-grown P1-12 (+0.25 and 5 μM Dex) seedlings led us to hypothesize that MORF2-mediated RS suppresses ethylene signaling given its role in plant skotomorphogenesis (Leivar and Quail, 2011; Zdarska et al., 2015). To test this, we found a similar cotyledon opening phenotype in dark-grown P1-10 (+0.25 μM Dex) seedlings. In addition, the cotyledon opening of P1-12 (+0.25 μM Dex) was suppressed by constitutive triple response 1 (ctr1-1) (Figures 6A, B). Hence, suppression of skotomorphogenesis is neither due to transgenic position effect nor blocking ethylene signaling downstream of CTR1. Interestingly, addition of 10 μM ACC, the precursor of ethylene, significantly reduced but did not completely close cotyledon angles (Figures 6D, E), suggesting that MORF2-mediated RS acts on ethylene biosynthesis. Both elimination of CTR1 function and ACC treatment did not change the hypocotyl length of P1-12 (+0.25 μM Dex) (Figures 6C, F), implying that non-ethylene pathways also impact its morphology changes in dark.
Compromised ethylene signaling seemed to be contradictory to the upregulation of “response to ethylene” (GO:0009723) pathway in 8-d-old LD-grown P1-12 (+0.25 μM Dex) seedlings (Figure 3B). To address this discrepancy, we investigated the expression changes of a “gold standard” group of 139 ethylene-regulated genes (Harkey et al., 2019). In total, 128 were found to be differentially expressed in P1-12 (+0.25 μM Dex). Through comparing their expression responses to either ethylene or ACC treatments (Harkey et al., 2019), we identified a strikingly opposite regulation in P1-12 (+0.25 μM Dex) (Figure 6G; Table S11). After extracting 25 SDEGs involved in GO:0009723 from P1-12 (+0.025 μM Dex) (Table S12), we found none from the “gold standard” group but three ETHYLENE RESPONSIVE FACTORs (ERF8, ERF15, and ERF59), which could be regulated in an ethylene independent manner, such as ROS-activated MITOGEN-ACTIVATED PROTEIN KINASE (MPK) pathways (Meng et al., 2013). Hence, the upregulation of GO:0009723 in P1-12 (+0.25 μM Dex) is not likely through ethylene signaling.
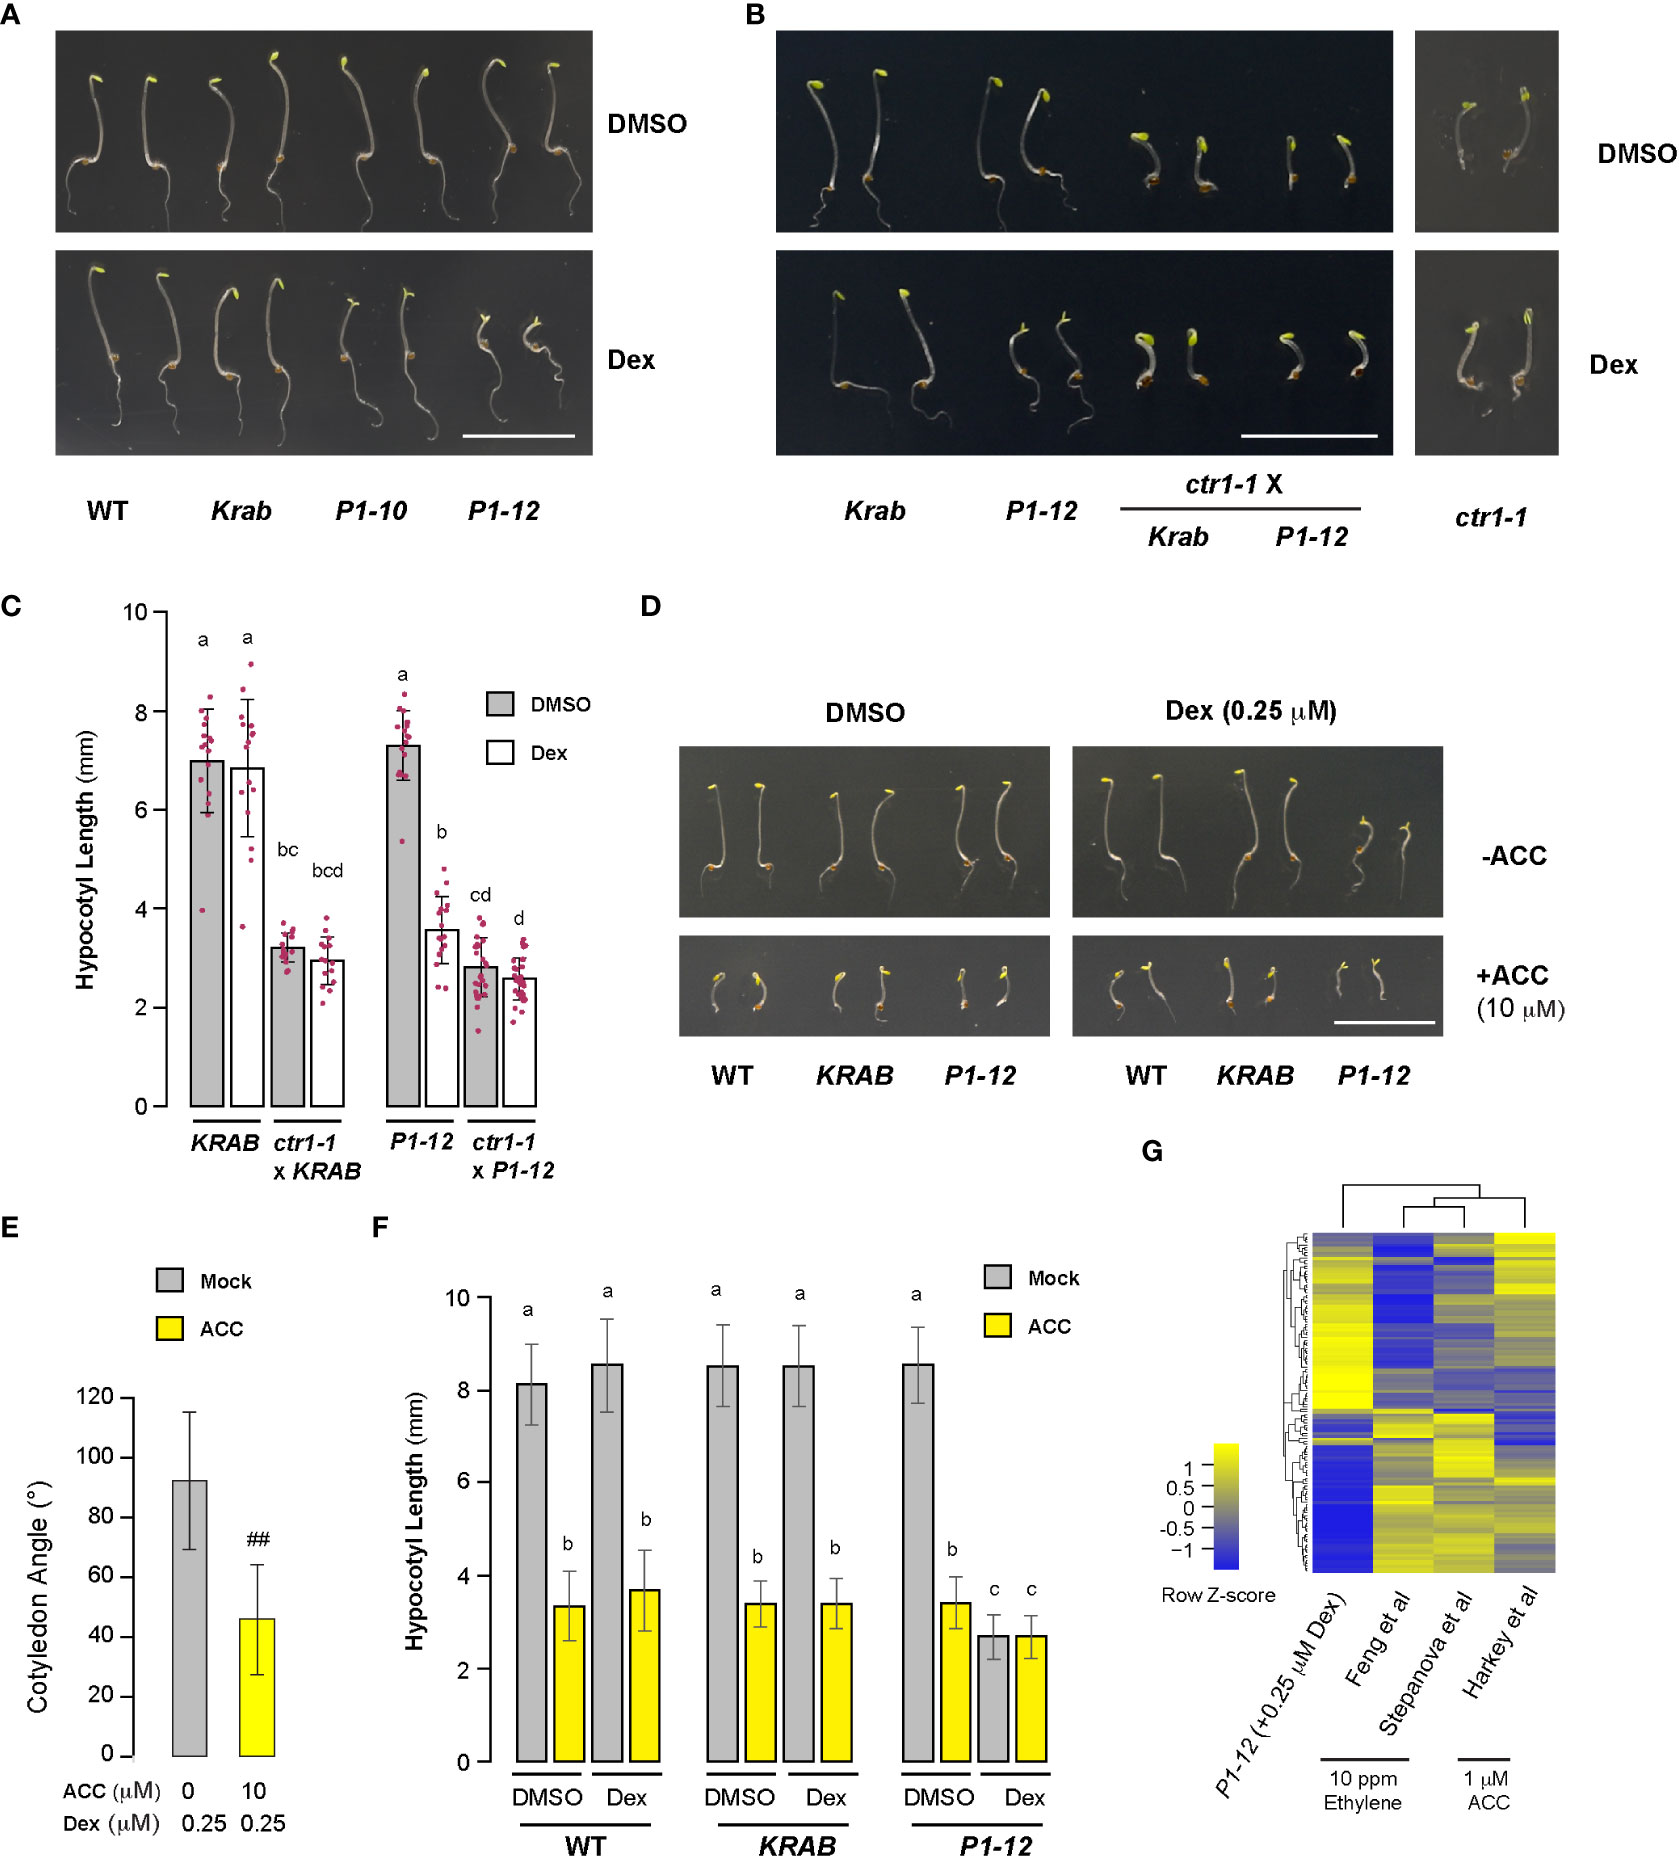
Figure 6 Skotomorphogenesis is partially suppressed by compromised ethylene signaling in P1 seedlings upon Dex treatment. (A, B) Representative images of seedlings from indicated genotypes grown for 3 d in dark on media containing DMSO or 0.25 μM Dex. Bar = 1 cm. Growth images of ctr1-1 were included to show its insensitivity to Dex treatment. (C) Quantitative analysis of hypocotyl length of seedlings as shown in (B) suggests that MORF2 impacts ethylene signaling upstream of CTR1. Each bar herein as well as in (E) and (F) represents mean ± SD. The data points of replicates are indicated with maroon dots (n=16 except for ctr1-1 x P1-12, which has 28 replicates). Different letters on the top of each bar indicate significant differences (Kruskal-Wallis test followed by Dunn’s test with Benjamini-Hochberg multiple testing correction, P < 0.05). (D) Images of representative seedlings grown for 3 d in dark on media supplemented with indicated combinations of DMSO, 0.25 μM Dex, and 10 μM ACC. (E) ACC treatment partially suppressed cotyledon opening of P1-12 (+0.25 μM Dex) (##: Student’s t-test, P < 0.01; n=71 and 64 for mock and ACC treatments, respectively). (F) The hypocotyl length of P1-12 (+0.25 μM Dex) is insensitive to ACC treatment. Different letters indicate significant differences as in (C) (n=72). (G) Comparison of expression changes of 128 “gold standard” genes involved in ethylene signaling among the indicated studies. P1-12 (+0.25 μM Dex) is described as in Figure 3A. Studies from Feng et al. and Stepanova et al. were 6 and 3-d-old light-grown seedlings treated with 10 ppm ethylene, respectively, and that from Harkey et al. was 5-d-old light-grown seedlings treated with 1 μM ACC. The relative expression changes (log2(FC)) of “gold standard” genes for the last three studies were retrieved from Harkey et al. (2019) and used to compare with their changes in P1-12 (+0.25 μM Dex). The two-dimensional clustering diagrams were created according to row Z-scores.
PHYTOCHROME INTERACTING FACTOR (PIF)s play a pivotal role in positively regulating skotomorphogenesis and interacting with ethylene signaling (Jeong et al., 2016; Paik et al., 2017). To search for additional factors contributing to the skotomorphogenic phenotypes of P1-12 (+0.25 μM Dex), we compared by qPCR the expression of three PIFs (PIF1, PIF3, and PIF4) and their direct targets, including PIF3-LIKE (PIL)1 and GOLDEN2-LIKE (GLK)1 (Martin et al., 2016; Ueda et al., 2020), between 3-d-old dark-grown P1-12 (+0.25 μM Dex) and KRAB (+0.25 μM Dex) (Figure 7). Consistent with suppressed skotomorphogenesis, we detected reduced expression of PIFs, including PIF1 and PIF4 whose expression was significantly lower in P1-12 (+0.25 μM Dex) than in KRAB (+0.25 μM Dex). Consequently, PIL1 and GLK1, which are positively and negatively regulated by PIFs in dark, were downregulated and upregulated, respectively, in P1-12 (+0.25 μM Dex). GLK2, the homologue of GLK1, however, demonstrated a lower expression in P1-12 (+0.25 μM Dex) than that in KRAB (+0.25 μM Dex). The opposite expression regulation of GLK1 and GLK2 further indicates the presence of yet-unidentified GLK1-specific pathways that positively contribute to the cotyledon opening both in dark-grown P1-12 (+0.25 μM Dex) and lincomycin-treated light-grown seedlings (Figure 5 and Martin et al., 2016, respectively).
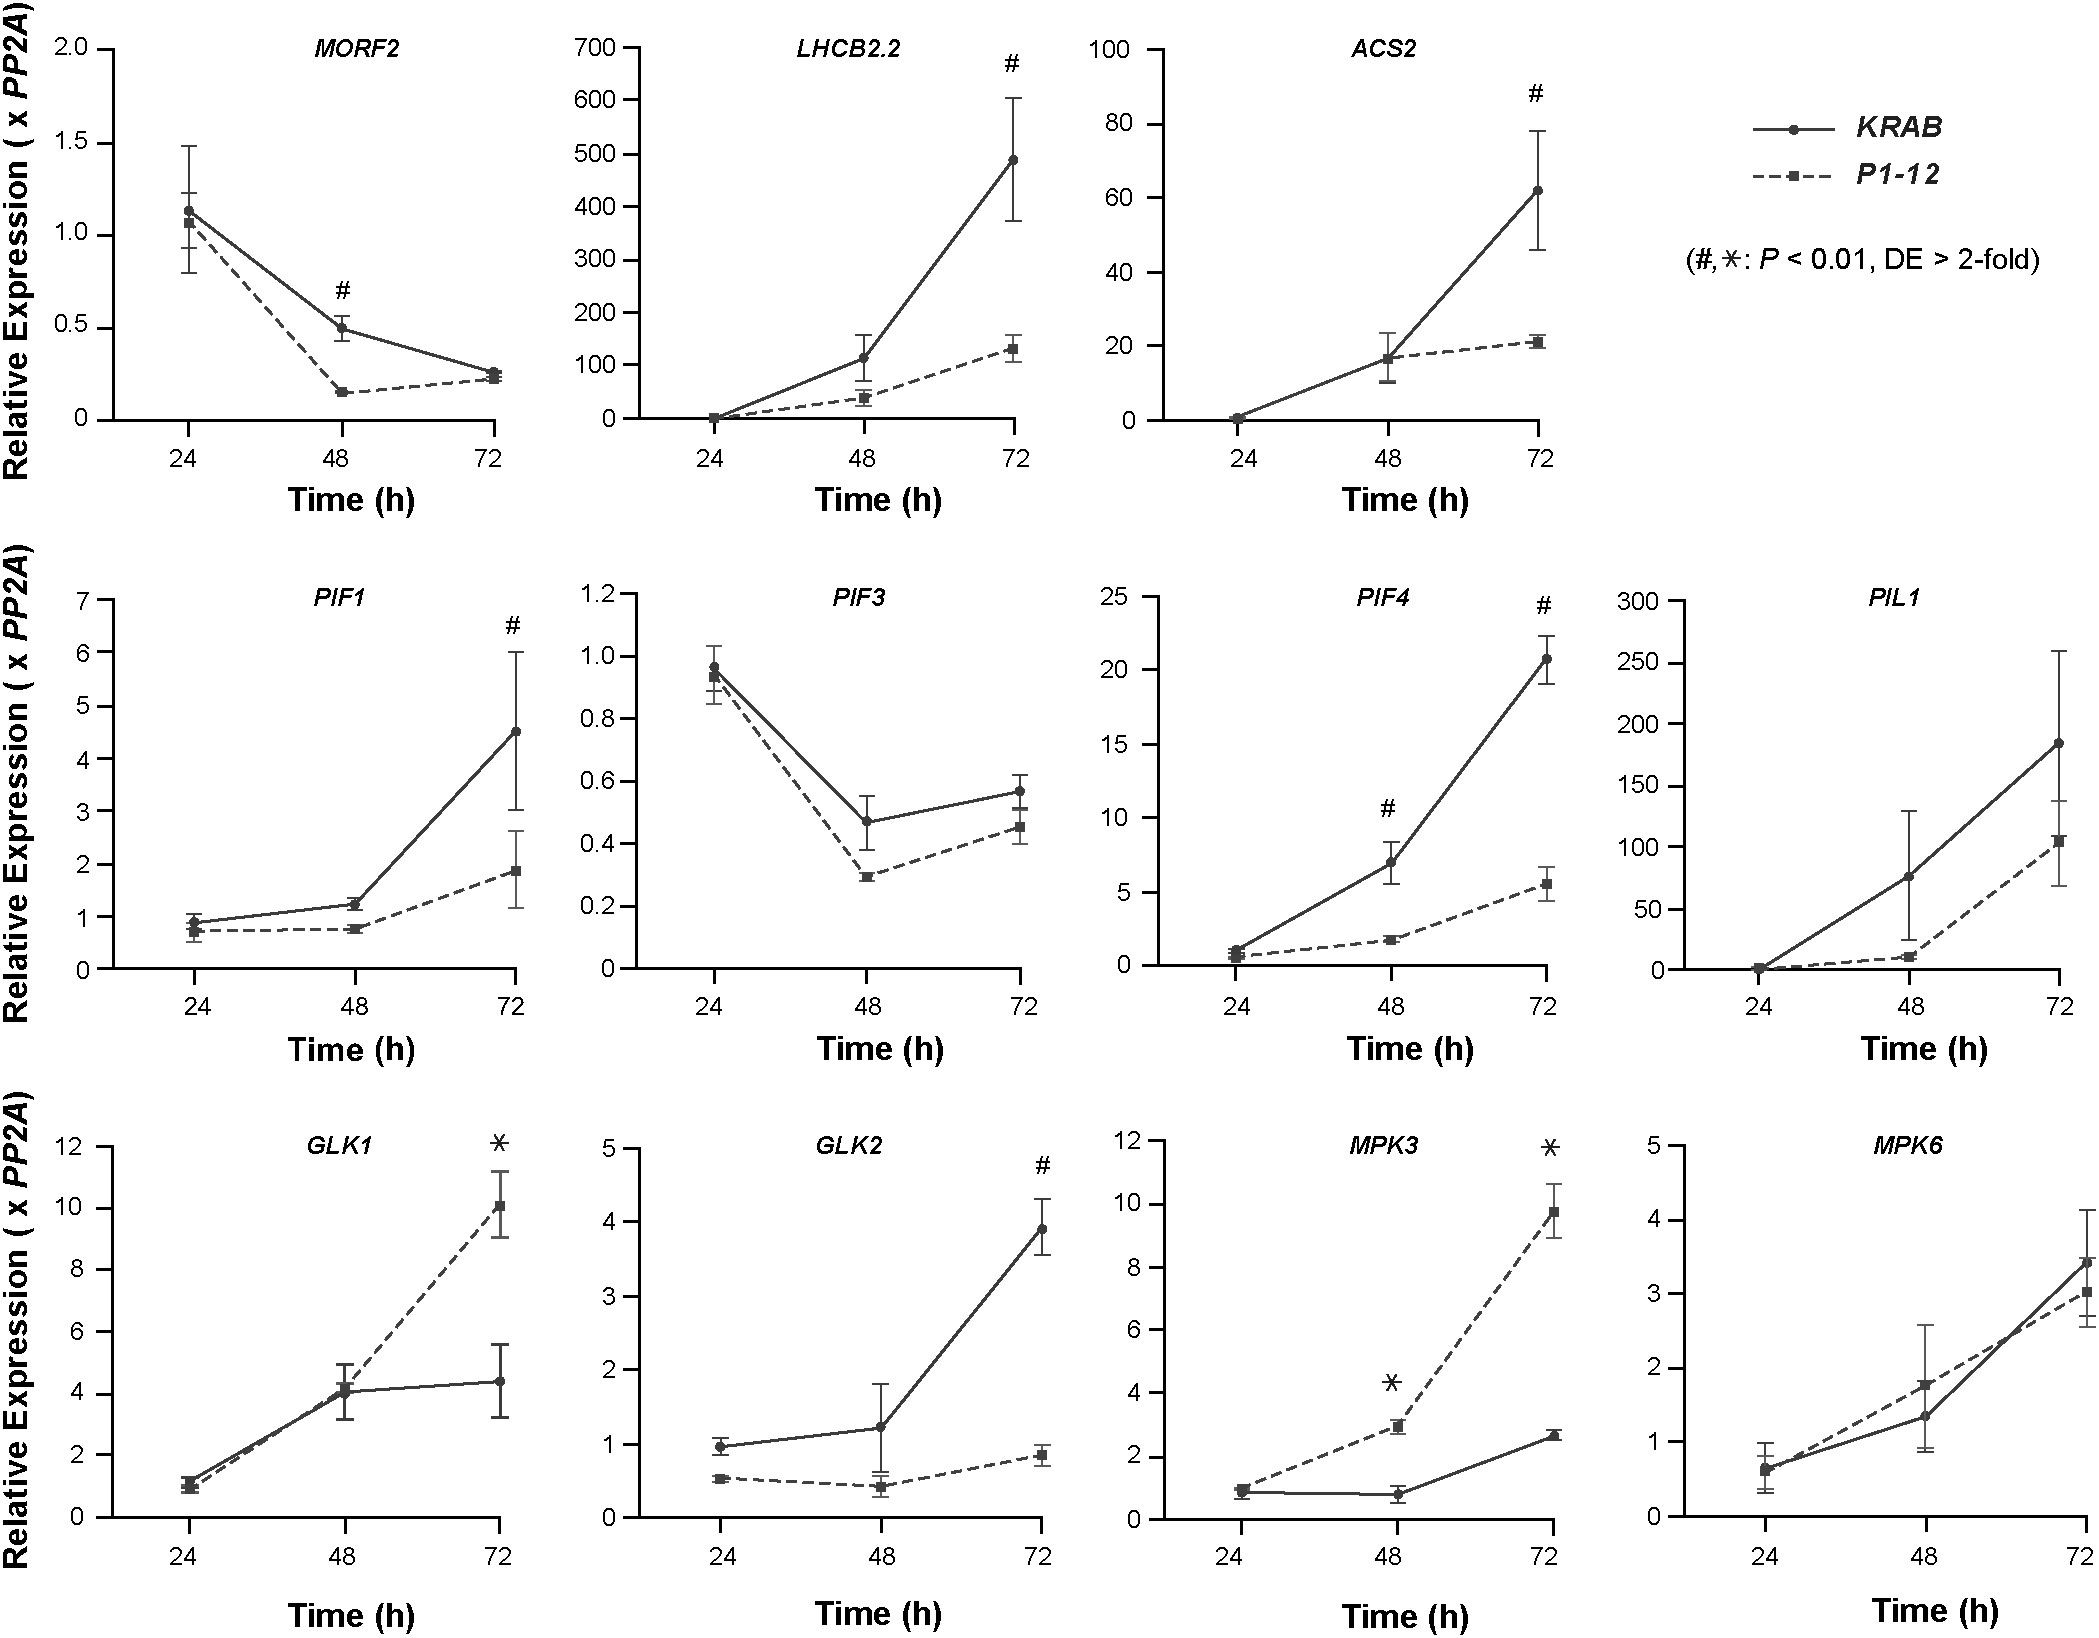
Figure 7 Early RS induced by MORF2 reduction suppresses PIFs but activates GLK1 and MPK3 expression. Upon stratification on 1/2 MS medium supplemented with 0.25 μM Dex in dark at 4°C for three days, KRAB and P1-12 seeds were light-treated for 6 hours followed by germination in dark for 24, 48, and 72 h. Either ruptured seeds (24 h) or etiolated seedlings with seed coat (48 h and 72 h) were harvested for qPCR analysis. Relative expression of each indicated gene was normalized to one of the three KRAB biological replicates at 24 h post germination. PP2A was used as reference standards. Each data point represents mean ( ± SD) from three biological replicates, each with three technical replicates. # and * represent a statistically significant reduction and upregulation, respectively, of indicated gene in P1-12 compared to KRAB (Student’s t-test, P < 0.01 and differential expression (DE) changes > 2-fold).
To confirm the activation of RS and compromised ethylene signaling in dark-grown P1-12 (+0.25 μM Dex) seedlings, we identified that one RS marker gene, LHCB2.2, and one ACC SYNTHASE (ACS) gene, ACS2, had a significantly lower expression in P1-12 (+0.25 μM Dex) than in KRAB (+0.25 μM Dex) (Figure 7). Downregulation of ACS2 could be also in part due to the reduction of PIFs since PIF4/5 have been discovered to positively regulate its expression (Song et al., 2018).
Unexpectedly, we found no significant difference of MORF2 expression in 3-d-old dark grown seedlings (Figure 7). We therefore backtracked in 1- and 2-DAG seedlings. We identified a development-dependent upregulation of PIF1, PIF4, PIL1, ACS2, LHCB2.2, and GLK2 in KRAB (+0.25 μM Dex) from 1-DAG to 3-DAG whereas this upregulation was significantly retarded in P1-12 (+0.25 μM Dex). Contrastingly, the expression of MORF2 declines more rapidly in P1-12 (+0.25 μM Dex) than in KRAB (+0.25 μM Dex). In 2-DAG seedlings, P1-12 (+0.25 μM Dex) had only 30.8% of the MORF2 transcripts as detected in KRAB (+0.25 μM Dex). These findings suggested that a RS pathway was activated in early etiolated seedlings of P1-12 (+0.25 μM Dex) due to rapid reduction of MORF2. Upon activation, it suppresses the expression of PIFs, at least PIF1 and PIF4 examined, which in turn upregulates GLK1 and downregulates ethylene signaling, thus promoting cotyledon opening. Of note, this activated RS also significantly upregulates the expression of MPK3 but not MPK6 in P1-12 (+0.25 μM Dex) (Figure 7), which in part explained the activation of ERFs (Table S12).
The opposite function in regulating cotyledon opening between RS mediated by MORF2 and that induced by lincomycin suggests their antagonistic interactions. To test this, we grew P1-12 and KRAB seedlings on 1/2 MS medium supplemented with 0.25 μM Dex and lincomycin both in dark and in a constant dim light condition as previously described (Martin et al., 2016). As controls, we also treated the seedlings with NF and examined the skotomorphogenesis of pifq under the same treatments in dark.
Upon three days of germination in dark, we observed open cotyledons of P1-12 (+0.25 μM Dex) and pifq (+0.25 μM Dex) seedlings grown under both mock (0.25 μM Dex only) and NF treatments (Figure 8A). However, their cotyledon opening responded differently to lincomycin treatment. While the cotyledon angles of pifq (+0.25 μM Dex) were closed by lincomycin treatment as previously reported (Martin et al., 2016), those of P1-12 (+0.25 μM Dex) seedlings only reduced 54% (Figures 8A, B), suggesting that MORF2-mediated RS and lincomycin-induced RS antagonistically regulate cotyledon opening in dark.
Consistent with the previous discovery showing that lincomycin-induced RS enhances the ethylene pathway (Gommers et al., 2021), silver treatment opened the otherwise appressed cotyledons of lincomycin-treated pifq (+0.25 μM Dex) in dark. This enhancement along with the PIF pathways collaboratively retained the closure of cotyledons in dark-grown KRAB (+0.25 μM Dex) seedlings even after the silver treatment (Figure 8B). Contradictory, the impact of silver on the changes of cotyledon angles of dark-grown P1-12 (+0.25 μM Dex) seedlings was negligible in all growth conditions (Figure 8B), further suggesting a compromised ethylene response in P1-12 (+0.25 μM Dex).
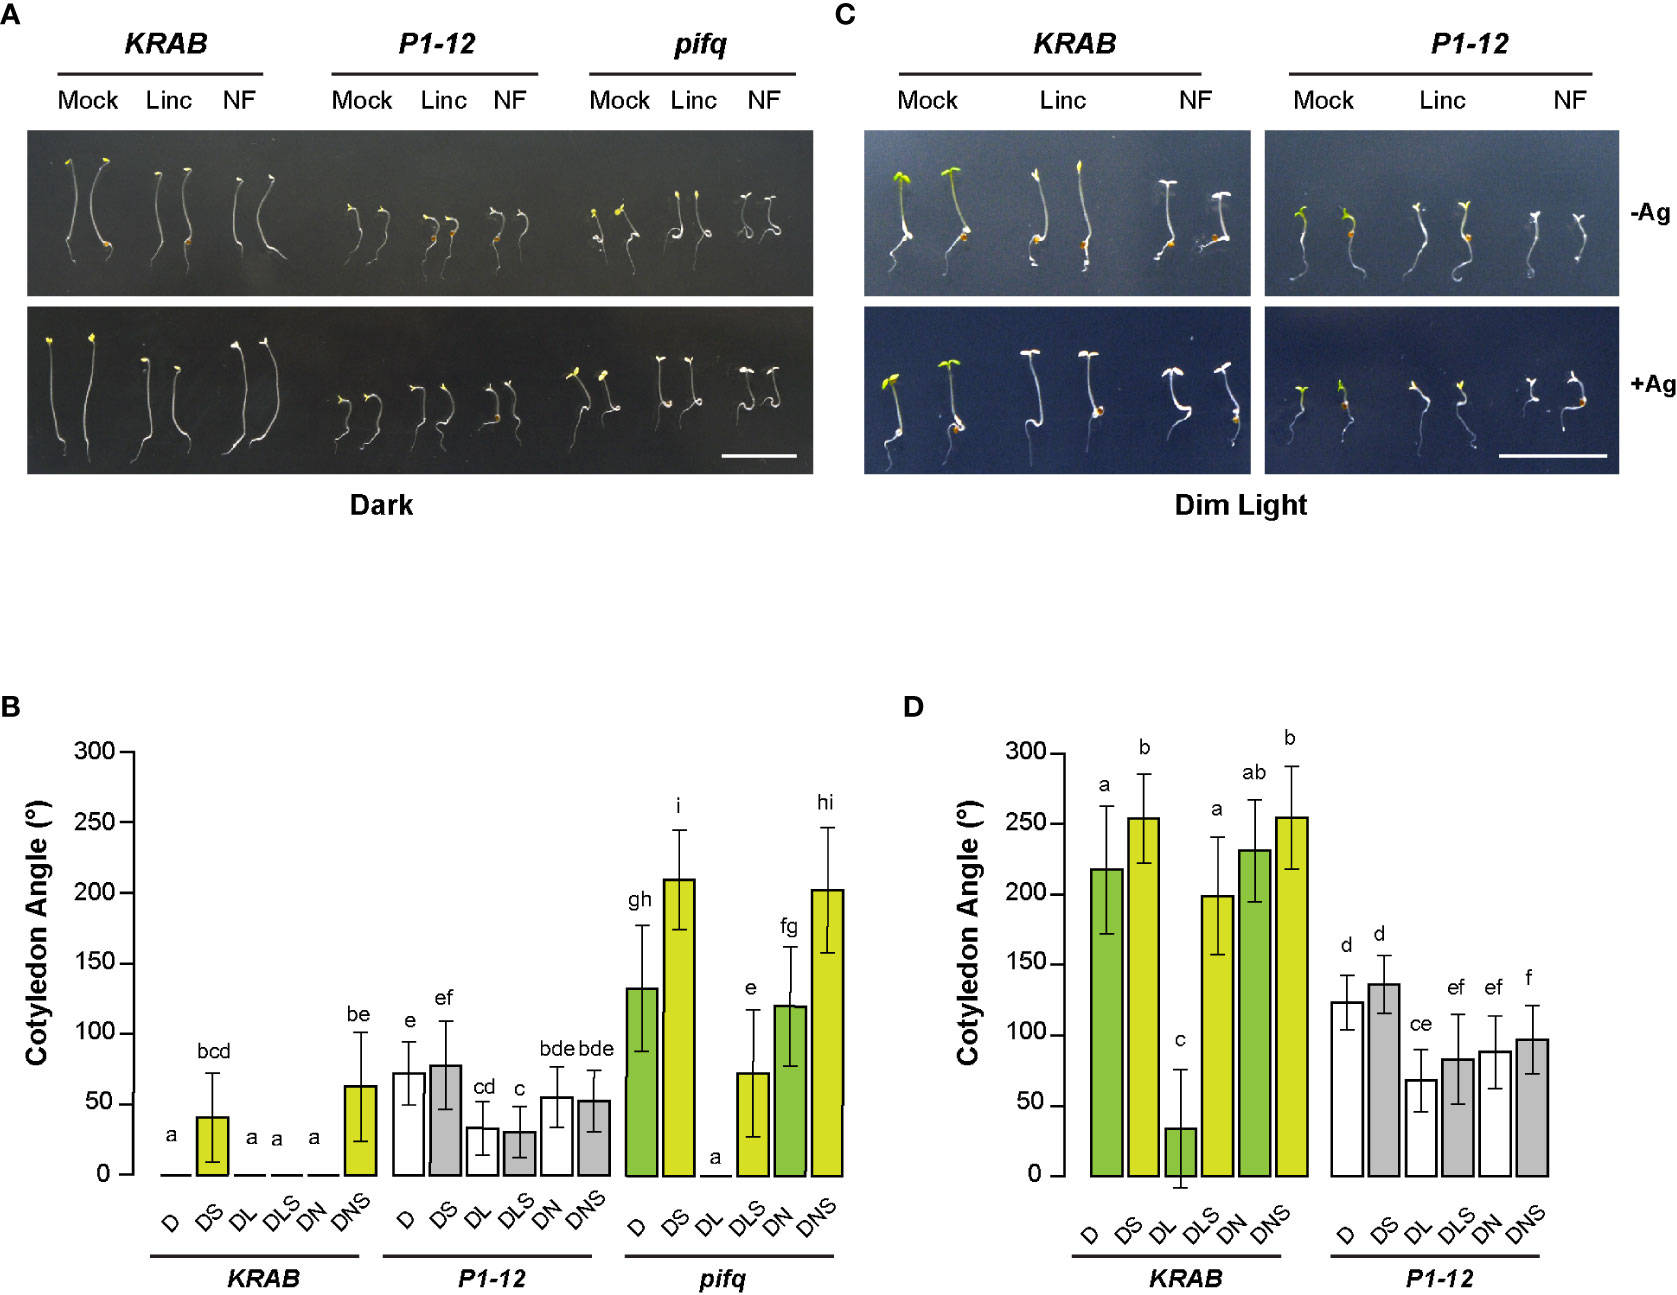
Figure 8 MORF2-dependent RS plays an antagonistic role to lincomycin-induced RS on plant photomorphogenesis. (A) Representative images of seedlings from indicated genotypes grown for 3 d in dark on media containing 0.25 μM Dex in the presence or absence of 5 μM AgNO3. Bar = 1 cm. (B) Quantitative analysis of cotyledon angle of seedlings shown in (A). Different letters on the top of each bar indicate significant differences as analyzed in Figure 6C (n = 30-35). D: 0.25 μM Dex; L: 0.5 mM lincomycin; N: 5μM NF; S: 5 μM AgNO3. (C) Representative images of seedlings from indicated genotypes grown for 3 d under continuous dim light on media containing 0.25 μM Dex in the presence or absence of 5 μM AgNO3. Bar = 1 cm. (D) Quantitative analysis of cotyledon angle of seedlings shown in (C). Different letters on the top of each bar and D, L, N, and S are indicated as in (B).
The lack of silver sensitivity was also evident in light-grown P1-12 (+0.25 μM Dex) seedlings (Figures 8C, D). While lincomycin-induced cotyledon closure was nearly inhibited by silver treatment in light-grown KRAB (+0.25 μM Dex) seedlings, only a non-significant increase was identified in sliver and lincomycin-treated P1-12 (+0.25 μM Dex) seedlings. Consistent with the antagonistic interaction model, lincomycin treatment reduced cotyledon angles of P1-12 (+0.25 μM Dex) seedlings significantly but not as severely as did it on KRAB (+0.25 μM Dex) seedlings (1.8-fold vs. 6.4-fold reductions, respectively). Of note, we observed no significant impact of NF on cotyledon angles of dark-grown pifq (+0.25 μM Dex) and light-grown KRAB (+0.25 μM Dex) seedlings. While the former was consistent with the previous study (Martin et al., 2016), the latter was not. We did not see any significant impact of NF on WT cotyledon angles either (Figure S5). This discrepancy could be caused by a mild impact of NF on photomorphogenesis and/or growth condition differences.
To search for a potential downstream metabolic response to MORF2 reduction, we monitored the root tip hydrogen peroxide (H2O2) content in 4-d-old liquid-grown P1-12 seedlings under constant light using CM-H2DCFDA (Wojtala et al., 2014). Upon staining, increasing concentrations of H2O2 became evidently detected in the root tip of P1-12 seedlings upon 0.025 μM Dex treatment (Figures 9A, S9A). When Dex concentration increased to 0.25 μM, more than 3-fold higher of H2O2 content was detected in the root tip of P1-12 seedlings than that without Dex treatment (Figure 9B). Consistent with the normal expression of MORF2, only a background level of H2O2 was detectable in the root tip of KRAB seedlings despite the Dex treatment (Figures 9, S9B). Hence, the increase of H2O2 in P1-12 seedlings upon Dex treatment most likely resulted from the expression downregulation of MORF2 but not from the ectopic expression of dCas9-KRAB. H2O2 has been known as one type of RS molecules (Exposito-Rodriguez et al., 2017). Its rapid upregulation upon MORF2 transcriptional reduction in P1-12 seedlings treated with Dex further supports a novel role of MORF2 in mediating RS.
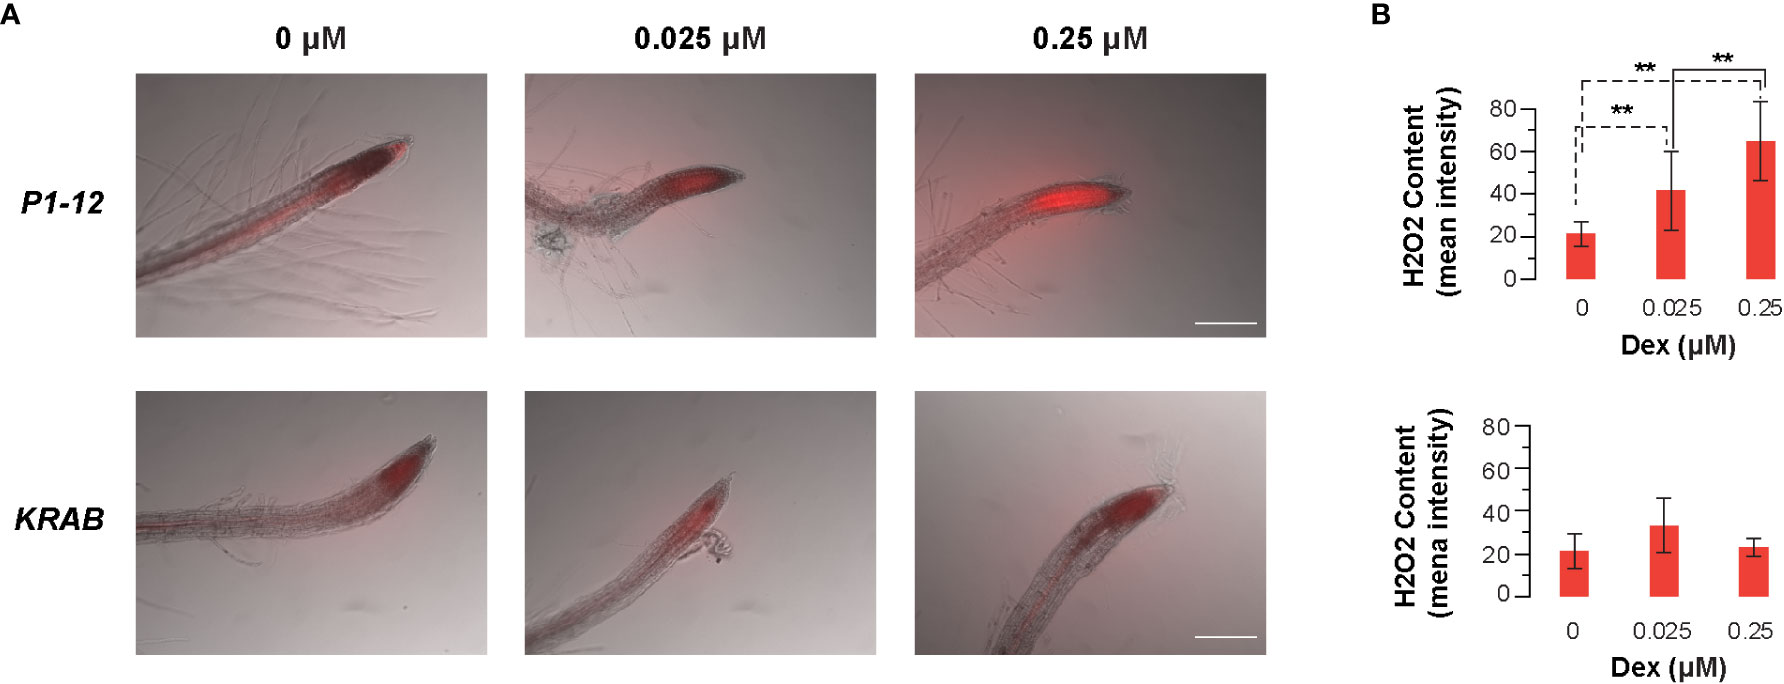
Figure 9 Dex-induced inhibition of MORF2 through dCas9-KRAB-mediated transcriptional repression in P1-12 increases accumulation of H2O2 in root tips. (A) Merged images of bright field (grayscale) and fluorescence (red pseudocolor) showing localization and accumulation of H2O2 at the root tip of 4-d-old P1-12 and KRAB seedlings treated with different concentrations of Dex. H2O2 content was displayed by 2 μM CM-H2DCFDA for 10 min before microscopy examination. Fluorescence indicates the presence of H2O2. Scale bar = 100 μm. (B) Quantification of H2O2 content in root tips. To avoid the size verification of root tips, average fluorescence intensity of a fixed area (0.1 mm x 0.25 mm) that includes ~ 0.2 mm of root tip was measured using ImageQuant5.2 and used to reflect the relative H2O2 content. In total 10 seedlings were analyzed for each data point except for KRAB (+0.025 M Dex), in which 9 seedlings were analyzed. Fluorescence images of all the replicates are presented in Figure S6. **: P < 0.01 (Student's t-test, n=10).
In this study, we provided several lines of evidence demonstrating the complexity of RS pathways originated in chloroplasts and MORF2-mediated regulation of chloroplast development and functions. First, we developed a dCas9-KRAB inducible expression-based quantitative manipulation of endogenous genes in plants. To our best knowledge, this is the first report showing the application of CRISPRi in deciphering the function of a genetic hub gene. Second, our results uncovered a dosage-dependent (i.e., MORF2 expression level) novel RS resource that plays an antagonistic role to lincomycin-induced RS in regulating plant morphogenesis. Third, we verified the roles of MORF2 in regulating both RS and RNA editing in chloroplasts.
Because the morf2-1 and morf2-2 T-DNA null mutants showed multiple growth defects that are much severer than several other RNA editing mutants (Figure S3; Bisanz et al., 2003; Takenaka et al., 2012; Small et al., 2020), we thought that plants could be sensitive to the expression level of MORF2. To manipulate its expression, one could apply a post-transcriptional regulation such as RNA-interference or microRNA-mediated RNA degradation (Ostergaard and Yanofsky, 2004). Unfortunately, our overexpression analysis of MORF2 discovered its strong co-suppression phenotype both in seedlings and adult plants (Figure S2D), which indicates that MORF2 mRNA could be too susceptible to be quantitatively manipulated post-transcriptionally. Given the success of CRISPRi on gene expression regulation in human cells (Gilbert et al., 2014; Konermann et al., 2015), we explored this technology herein to avoid a potentially complex post-transcriptional regulation of MORF2. Through controlling the expression level of dCas9-KRAB repressor by a Dex-inducible promoter, we demonstrated our improved iCRISPRi method for quantitatively manipulating the transcription of MORF2 (Figures 1, 2). This new method provided a genetic tool for quantitative reverse genetics studies on hub genes in the future.
Accumulating evidence indicates chloroplasts as a central organelle for stress sensing and response (Serrano et al., 2016; Crawford et al., 2018; Hu et al., 2020; Dopp et al., 2021; Li and Kim, 2022; Sierra et al., 2022). Given various types of stresses, chloroplasts most likely invoke different RS pathways to regulate the expression of nuclear genes in response to the stress signals. To date, multiple chloroplast metabolites, including intermediates from tetrapyrrole biosynthesis and MEP pathways, carotenoid derivatives, fatty acids, and ROS, have been proposed as chloroplast RS molecules (Dopp et al., 2021). While it is yet not clear about the signaling molecules involved in lincomycin and NF-induced RS pathways, several studies have demonstrated both overlapping and distinct responses triggered by these two chemicals. For example, the gun phenotype shown in NF-treated MORF2 overexpression lines was not replicated by lincomycin treatment (Zhao et al., 2019). On the other hand, lincomycin-induced RS suppressed the constitutive photomorphogenic phenotype of pifq in dark whereas NF failed (Martin et al., 2016). Since lincomycin inhibits translation machinery in chloroplasts while NF impacts carotenoid biosynthesis (Ellis, 1970 and Frosch et al., 1979, respectively), it suggests that lesions of different chloroplast activities employ either distinct or different levels of RS pathways. Consistently, it was also proposed that acclimation response in chloroplasts involves time- and concentration-dependent composition of RS signal mix (Dietz, 2015; Chan et al., 2016). Therefore, it is not surprising to discover a MORF2 dosage-dependent RS pathway that plays an antagonistic role to the lincomycin-induced RS in plant morphogenesis regulation (Figure 8).
RS and RNA editing are two distinct gene expression regulatory pathways that influence the chloroplast proteome homeostasis. Their interactions had not been clear until the discovery of RNA-editing errors in NF-treated gun1 mutant and MORF2 overexpression plants (Zhao et al., 2019). It was proposed that RNA-editing errors might either perturb the expression of subunits for plastid-encoded RNA polymerase (PEP) or result in unfolded protein stress response in chloroplasts, hence, activating GUN1-dependent RS (Zhao et al., 2019). However, in our transcriptome-wide analysis, we did not find a significant defect of RNA-editing in all the known editing sites of the three PEP subunits in P1-12 (+0.25 μM Dex) (Table S3). Instead, nine sites present in ndhB, ndhD, ndhF, psbZ, rpl23, and rps14 showed perturbed RNA-editing efficiencies. Although we cannot rule out the possibility that the lethal phenotype of morf2 is likely an accumulative effect of increasing RNA editing errors and RS response, we speculated that some defective growth phenotypes of P1-12 (+0.25 μM Dex) might result from additional biochemical functions of MORF2. For example, the less than 15% reductions of RNA-editing efficiencies occurred in only five editing sites, including ndhB (two sites with 15.3 and 10.1% reductions), psbZ (one site with 9.8% reduction), and rps14 (two sites with 5.1 and 4.0% reductions), might not have a profound growth effect. Consistent with our hypothesis, thirteen sites present in accD, matK, ndhB, ndhD, ndhG, rpoB, and rps12 were found to have > 90% reductions of editing efficiencies in a T-DNA insertional mutant of Organelle RRM protein 1, orrm1. However, orrm1 was shown to grow as normally as WT (Sun et al., 2013).
The essential role of MORF2 in RS could be attributed to its large array of binding partners in chloroplasts, such as MORF proteins (Zehrmann et al., 2015; Huang et al., 2019), PPR proteins involved in RNA-editing (Takenaka et al., 2012), GUN1 (Zhao et al., 2019), and multiple enzymes and regulators involved in tetrapyrrole biosynthesis (Zhang et al., 2014; Yuan et al., 2022). Its large binding capacity is consistent with its structural feature that can be divided into an N-terminal intrinsically disordered region and a peptidase inhibitor I9 domain-containing C-terminal region (Luo et al., 2017; Varadi et al., 2022). Both regions could be sticky to multiple interacting partners. Intrinsically disordered proteins have a one-to-many promiscuous binding capacity (Uversky, 2013), while peptidase inhibitor I9 members are known to function as molecular chaperones (Li et al., 1995). Interestingly, a recent work demonstrated that MORF2 possesses a holdase chaperon activity (Yuan et al., 2022). Therefore, we predicted that more MORF2-binding partners could be discovered in the future. Further supporting our discovery about the role of MORF2 in RS beyond RNA-editing, multiple MORF2-interacting enzymes and regulators involved in tetrapyrrole biosynthesis do not affect plastid RNA editing either (Yuan et al., 2022).
Given the holdase chaperon activity of MORF2 with a large binding capacity and the activation of RS pathways upon MORF2 reduction, we proposed that MORF2 is a genetic hub gene for balancing plant growth and defense. Although the present study has not established a direct connection between ROS and RS in P1-12 (+Dex), the rapid accumulation of ROS and upregulation of MPK3 in P1-12 (+Dex) indicate that ROS is one important type of metabolites downstream of MORF2 and that activation of MPK3 in cytoplasm relays the signal towards nucleus. The MORF2 dosage-dependent RS regulates not only nuclear genome-encoded chloroplast genes but also those associated with stress including three major groups of stress responsive transcription factors, AP2-EREBPs, NACs, and WRKYs (Figures 3, 4). The finding of rapid reduction of MORF2 transcripts upon development in normal dark-grown seedlings, such as KRAB (+0.25 μM Dex) (Figure 7), suggests that some MORF2-dosage dependent RS pathways are activated even in dark-grown WT seedlings. These RS pathways may help turn off skotomorphogenesis quickly upon the exposure of light. Its antagonistic role with lincomycin-induced RS pathways in plant morphogenesis further indicates the presence of a complex RS network. The former is activated in dark while the latter is involved in response to high light.
The datasets presented in this study can be found in online repositories. The names of the repository/repositories and accession number(s) can be found in the article/Supplementary Material.
ZH designed and supervised the research. MY, PD, ZG, PY, and ZH performed experiments. ZH analyzed the data and wrote the article. All authors contributed to the article and approved the submitted version.
This work was funded by a National Science Foundation CAREER award (MCB-1750361) to ZH. ZG was supported by a visiting scientist fellowship from ‘151 Talents Project’ of Zhejiang Province, China.
We are thankful to two previous undergraduate research assistants in the lab, Maria Gomez and Jacob Sieg, for technical support.
The authors declare that the research was conducted in the absence of any commercial or financial relationships that could be construed as a potential conflict of interest.
All claims expressed in this article are solely those of the authors and do not necessarily represent those of their affiliated organizations, or those of the publisher, the editors and the reviewers. Any product that may be evaluated in this article, or claim that may be made by its manufacturer, is not guaranteed or endorsed by the publisher.
The Supplementary Material for this article can be found online at: https://www.frontiersin.org/articles/10.3389/fpls.2023.1146922/full#supplementary-material
Alexa, A., Rahnenfuhrer, J., Lengauer, T. (2006). Improved scoring of functional groups from gene expression data by decorrelating GO graph structure. Bioinformatics 22, 1600–1607. doi: 10.1093/bioinformatics/btl140
Anders, S., Pyl, P. T., Huber, W. (2015). HTSeq–a Python framework to work with high-throughput sequencing data. Bioinformatics 31, 166–169. doi: 10.1093/bioinformatics/btu638
Aoyama, T., Chua, N. H. (1997). A glucocorticoid-mediated transcriptional induction system in transgenic plants. Plant J. 11, 605–612. doi: 10.1046/j.1365-313X.1997.11030605.x
Bassi, R., Dall'osto, L. (2021). Dissipation of light energy absorbed in excess: The molecular mechanisms. Annu. Rev. Plant Biol. 72, 47–76. doi: 10.1146/annurev-arplant-071720-015522
Benn, G., Bjornson, M., Ke, H., De Souza, A., Balmond, E. I., Shaw, J. T., et al. (2016). Plastidial metabolite MEcPP induces a transcriptionally centered stress-response hub via the transcription factor CAMTA3. Proc. Natl. Acad. Sci. U.S.A. 113, 8855–8860. doi: 10.1073/pnas.1602582113
Bent, A. (2006). Arabidopsis thaliana floral dip transformation method. Methods Mol. Biol. 343, 87–103. doi: 10.1385/1-59745-130-4:87
Berardini, T. Z., Mundodi, S., Reiser, L., Huala, E., Garcia-Hernandez, M., Zhang, P., et al. (2004). Functional annotation of the arabidopsis genome using controlled vocabularies. Plant Physiol. 135, 745–755. doi: 10.1104/pp.104.040071
Bisanz, C., Begot, L., Carol, P., Perez, P., Bligny, M., Pesey, H., et al. (2003). The arabidopsis nuclear DAL gene encodes a chloroplast protein which is required for the maturation of the plastid ribosomal RNAs and is essential for chloroplast differentiation. Plant Mol. Biol. 51, 651–663. doi: 10.1023/A:1022557825768
Bolger, A. M., Lohse, M., Usadel, B. (2014). Trimmomatic: A flexible trimmer for illumina sequence data. Bioinformatics. 30, 2114–2120. doi: 10.1093/bioinformatics/btu170
Chan, K. X., Phua, S. Y., Crisp, P., Mcquinn, R., Pogson, B. J. (2016). Learning the languages of the chloroplast: Retrograde signaling and beyond. Annu. Rev. Plant Biol. 67, 25–53. doi: 10.1146/annurev-arplant-043015-111854
Crawford, T., Lehotai, N., Strand, A. (2018). The role of retrograde signals during plant stress responses. J. Exp. Bot. 69, 2783–2795. doi: 10.1093/jxb/erx481
Davuluri, R. V., Sun, H., Palaniswamy, S. K., Matthews, N., Molina, C., Kurtz, M., et al. (2003). AGRIS: Arabidopsis gene regulatory information server, an information resource of arabidopsis cis-regulatory elements and transcription factors. BMC Bioinf. 4, 25. doi: 10.1186/1471-2105-4-25
Dietz, K. J. (2015). Efficient high light acclimation involves rapid processes at multiple mechanistic levels. J. Exp. Bot. 66, 2401–2414. doi: 10.1093/jxb/eru505
Dopp, I. J., Yang, X., Mackenzie, S. A. (2021). A new take on organelle-mediated stress sensing in plants. New Phytol. 230, 2148–2153. doi: 10.1111/nph.17333
Ellis, R. J. (1970). Further similarities between chloroplast and bacterial ribosomes. Planta 91, 329–335. doi: 10.1007/BF00387506
Exposito-Rodriguez, M., Laissue, P. P., Yvon-Durocher, G., Smirnoff, N., Mullineaux, P. M. (2017). Photosynthesis-dependent H2O2 transfer from chloroplasts to nuclei provides a high-light signalling mechanism. Nat. Commun. 8, 49. doi: 10.1038/s41467-017-00074-w
Frosch, S., Jabben, M., Bergfeld, R., Kleinig, H., Mohr, H. (1979). Inhibition of carotenoid biosynthesis by the herbicide SAN 9789 and its consequences for the action of phytochrome on plastogenesis. Planta 145, 497–505. doi: 10.1007/BF00380105
Garapati, P., Xue, G. P., Munne-Bosch, S., Balazadeh, S. (2015). Transcription factor ATAF1 in Arabidopsis promotes senescence by direct regulation of key chloroplast maintenance and senescence transcriptional cascades. Plant Physiol. 168, 1122–1139. doi: 10.1104/pp.15.00567
Gilbert, L. A., Horlbeck, M. A., Adamson, B., Villalta, J. E., Chen, Y., Whitehead, E. H., et al. (2014). Genome-scale CRISPR-mediated control of gene repression and activation. Cell 159, 647–661. doi: 10.1016/j.cell.2014.09.029
Gilbert, L. A., Larson, M. H., Morsut, L., Liu, Z., Brar, G. A., Torres, S. E., et al. (2013). CRISPR-mediated modular RNA-guided regulation of transcription in eukaryotes. Cell 154, 442–451. doi: 10.1016/j.cell.2013.06.044
Gommers, C. M. M., Ruiz-Sola, M. A., Ayats, A., Pereira, L., Pujol, M., Monte, E. (2021). GENOMES UNCOUPLED1-independent retrograde signaling targets the ethylene pathway to repress photomorphogenesis. Plant Physiol. 185, 67–76. doi: 10.1093/plphys/kiaa015
Grubler, B., Merendino, L., Twardziok, S. O., Mininno, M., Allorent, G., Chevalier, F., et al. (2017). Light and plastid signals regulate different sets of genes in the albino mutant pap7-1. Plant Physiol. 175, 1203–1219. doi: 10.1104/pp.17.00982
Harkey, A. F., Yoon, G. M., Seo, D. H., Delong, A., Muday, G. K. (2019). Light modulates ethylene synthesis, signaling, and downstream transcriptional networks to control plant development. Front. Plant Sci. 10, 1094. doi: 10.3389/fpls.2019.01094
Hu, S., Ding, Y., Zhu, C. (2020). Sensitivity and responses of chloroplasts to heat stress in plants. Front. Plant Sci. 11, 375. doi: 10.3389/fpls.2020.00375
Huang, C., Li, Z. R., Yu, Q. B., Ye, L. S., Cui, Y. L., Molloy, D. P., et al. (2019). MORF2 tightly associates with MORF9 to regulate chloroplast RNA editing in arabidopsis. Plant Sci. 278, 64–69. doi: 10.1016/j.plantsci.2018.10.020
Huot, B., Yao, J., Montgomery, B. L., He, S. Y. (2014). Growth-defense tradeoffs in plants: a balancing act to optimize fitness. Mol. Plant 7, 1267–1287. doi: 10.1093/mp/ssu049
Jarvis, P., Lopez-Juez, E. (2013). Biogenesis and homeostasis of chloroplasts and other plastids. Nat. Rev. Mol. Cell Biol. 14, 787–802. doi: 10.1038/nrm3702
Jeong, J., Kim, K., Kim, M. E., Kim, H. G., Heo, G. S., Park, O. K., et al. (2016). Phytochrome and ethylene signaling integration in arabidopsis occurs via the transcriptional regulation of genes co-targeted by PIFs and EIN3. Front. Plant Sci. 7, 1055. doi: 10.3389/fpls.2016.01055
Karlson, C. K. S., Mohd-Noor, S. N., Nolte, N., Tan, B. C. (2021). CRISPR/dCas9-based systems: mechanisms and applications in plant sciences. Plants (Basel) 10, 2055. doi: 10.3390/plants10102055
Kim, D., Pertea, G., Trapnell, C., Pimentel, H., Kelley, R., Salzberg, S. L. (2013). TopHat2: accurate alignment of transcriptomes in the presence of insertions, deletions and gene fusions. Genome Biol. 14, R36. doi: 10.1186/gb-2013-14-4-r36
Konermann, S., Brigham, M. D., Trevino, A. E., Joung, J., Abudayyeh, O. O., Barcena, C., et al. (2015). Genome-scale transcriptional activation by an engineered CRISPR-Cas9 complex. Nature 517, 583–588. doi: 10.1038/nature14136
Larkin, R. M. (2019). RNA Editing implicated in chloroplast-to-nucleus communication. Proc. Natl. Acad. Sci. U.S.A. 116, 9701–9703. doi: 10.1073/pnas.1905566116
Leivar, P., Quail, P. H. (2011). PIFs: pivotal components in a cellular signaling hub. Trends Plant Sci. 16, 19–28. doi: 10.1016/j.tplants.2010.08.003
Li, H., Handsaker, B., Wysoker, A., Fennell, T., Ruan, J., Homer, N., et al. (2009). The sequence Alignment/Map format and SAMtools. Bioinformatics 25, 2078–2079. doi: 10.1093/bioinformatics/btp352
Li, Y., Hu, Z., Jordan, F., Inouye, M. (1995). Functional analysis of the propeptide of subtilisin e as an intramolecular chaperone for protein folding. refolding and inhibitory abilities of propeptide mutants. J. Biol. Chem. 270, 25127–25132. doi: 10.1074/jbc.270.42.25127
Li, M., Kim, C. (2022). Chloroplast ROS and stress signaling. Plant Commun. 3, 100264. doi: 10.1016/j.xplc.2021.100264
Luo, M., Cai, M., Zhang, J., Li, Y., Zhang, R., Song, W., et al. (2017). Functional divergence and origin of the DAG-like gene family in plants. Sci. Rep. 7, 5688. doi: 10.1038/s41598-017-05961-2
Mahmood, K., El-Kereamy, A., Kim, S. H., Nambara, E., Rothstein, S. J. (2016). ANAC032 positively regulates age-dependent and stress-induced senescence in Arabidopsis thaliana. Plant Cell Physiol. 57, 2029–2046. doi: 10.1093/pcp/pcw120
Martin, G., Leivar, P., Ludevid, D., Tepperman, J. M., Quail, P. H., Monte, E. (2016). Phytochrome and retrograde signalling pathways converge to antagonistically regulate a light-induced transcriptional network. Nat. Commun. 7, 11431. doi: 10.1038/ncomms11431
Meng, X., Xu, J., He, Y., Yang, K. Y., Mordorski, B., Liu, Y., et al. (2013). Phosphorylation of an ERF transcription factor by arabidopsis MPK3/MPK6 regulates plant defense gene induction and fungal resistance. Plant Cell 25, 1126–1142. doi: 10.1105/tpc.112.109074
Ostergaard, L., Yanofsky, M. F. (2004). Establishing gene function by mutagenesis in Arabidopsis thaliana. Plant J. 39, 682–696. doi: 10.1111/j.1365-313X.2004.02149.x
Paik, I., Kathare, P. K., Kim, J. I., Huq, E. (2017). Expanding roles of PIFs in signal integration from multiple processes. Mol. Plant 10, 1035–1046. doi: 10.1016/j.molp.2017.07.002
Robinson, M. D., Mccarthy, D. J., Smyth, G. K. (2010). edgeR: A bioconductor package for differential expression analysis of digital gene expression data. Bioinformatics 26, 139–140. doi: 10.1093/bioinformatics/btp616
Robinson, J. T., Thorvaldsdottir, H., Turner, D., Mesirov, J. P. (2023). Igv.js: An embeddable JavaScript implementation of the integrative genomics viewer (IGV). Bioinformatics 39, 2023. doi: 10.1093/bioinformatics/btac830
Sade, N., Del Mar Rubio-Wilhelmi, M., Umnajkitikorn, K., Blumwald, E. (2018). Stress-induced senescence and plant tolerance to abiotic stress. J. Exp. Bot. 69, 845–853. doi: 10.1093/jxb/erx235
Serrano, I., Audran, C., Rivas, S. (2016). Chloroplasts at work during plant innate immunity. J. Exp. Bot. 67, 3845–3854. doi: 10.1093/jxb/erw088
Sierra, J., Mcquinn, R. P., Leon, P. (2022). The role of carotenoids as a source of retrograde signals that impact plant development and stress responses. J. Exp. Bot. 73, 7139–7154. doi: 10.1093/jxb/erac292
Small, I. D., Schallenberg-Rudinger, M., Takenaka, M., Mireau, H., Ostersetzer-Biran, O. (2020). Plant organellar RNA editing: What 30 years of research has revealed. Plant J. 101, 1040–1056. doi: 10.1111/tpj.14578
Song, Q., Ando, A., Xu, D., Fang, L., Zhang, T., Huq, E., et al. (2018). Diurnal down-regulation of ethylene biosynthesis mediates biomass heterosis. Proc. Natl. Acad. Sci. U.S.A. 115, 5606–5611. doi: 10.1073/pnas.1722068115
Sun, T., Germain, A., Giloteaux, L., Hammani, K., Barkan, A., Hanson, M. R., et al. (2013). An RNA recognition motif-containing protein is required for plastid RNA editing in arabidopsis and maize. Proc. Natl. Acad. Sci. U.S.A. 110, E1169–E1178. doi: 10.1073/pnas.1220162110
Takenaka, M. (2014). How complex are the editosomes in plant organelles? Mol. Plant 7, 582–585. doi: 10.1093/mp/sst170
Takenaka, M., Verbitskiy, D., Zehrmann, A., Brennicke, A. (2010). Reverse genetic screening identifies five e-class PPR proteins involved in RNA editing in mitochondria of arabidopsis thaliana. J. Biol. Chem. 285, 27122–27129. doi: 10.1074/jbc.M110.128611
Takenaka, M., Zehrmann, A., Verbitskiy, D., Kugelmann, M., Hartel, B., Brennicke, A. (2012). Multiple organellar RNA editing factor (MORF) family proteins are required for RNA editing in mitochondria and plastids of plants. Proc. Natl. Acad. Sci. U.S.A. 109, 5104–5109. doi: 10.1073/pnas.1202452109
Ueda, H., Ito, T., Inoue, R., Masuda, Y., Nagashima, Y., Kozuka, T., et al. (2020). Genetic interaction among phytochrome, ethylene and abscisic acid signaling during dark-induced senescence in Arabidopsis thaliana. Front. Plant Sci. 11, 564. doi: 10.3389/fpls.2020.00564
Uversky, V. N. (2013). Intrinsic disorder-based protein interactions and their modulators. Curr. Pharm. Des. 19, 4191–4213. doi: 10.2174/1381612811319230005
Varadi, M., Anyango, S., Deshpande, M., Nair, S., Natassia, C., Yordanova, G., et al. (2022). AlphaFold protein structure database: massively expanding the structural coverage of protein-sequence space with high-accuracy models. Nucleic Acids Res. 50, D439–D444. doi: 10.1093/nar/gkab1061
Veciana, N., Martin, G., Leivar, P., Monte, E. (2022). BBX16 mediates the repression of seedling photomorphogenesis downstream of the GUN1/GLK1 module during retrograde signalling. New Phytol. 234, 93–106. doi: 10.1111/nph.17975
Walley, J., Xiao, Y., Wang, J. Z., Baidoo, E. E., Keasling, J. D., Shen, Z., et al. (2015). Plastid-produced interorgannellar stress signal MEcPP potentiates induction of the unfolded protein response in endoplasmic reticulum. Proc. Natl. Acad. Sci. U.S.A. 112, 6212–6217. doi: 10.1073/pnas.1504828112
Wojtala, A., Bonora, M., Malinska, D., Pinton, P., Duszynski, J., Wieckowski, M. R. (2014). Methods to monitor ROS production by fluorescence microscopy and fluorometry. Methods Enzymol. 542, 243–262. doi: 10.1016/B978-0-12-416618-9.00013-3
Woodson, J. D., Chory, J. (2008). Coordination of gene expression between organellar and nuclear genomes. Nat. Rev. Genet. 9, 383–395. doi: 10.1038/nrg2348
Xie, K., Zhang, J., Yang, Y. (2014). Genome-wide prediction of highly specific guide RNA spacers for CRISPR-Cas9-mediated genome editing in model plants and major crops. Mol. Plant 7, 923–926. doi: 10.1093/mp/ssu009
Yu, P., Hua, Z. (2022). The ubiquitin-26S proteasome system and autophagy relay proteome homeostasis regulation during silique development. Plant J. 111, 1324–1339. doi: 10.1111/tpj.15891
Yuan, J., Ma, T., Ji, S., Hedtke, B., Grimm, B., Lin, R. (2022). Two chloroplast-localized MORF proteins act as chaperones to maintain tetrapyrrole biosynthesis. New Phytol. 235, 1868–1883. doi: 10.1111/nph.18273
Zdarska, M., Dobisova, T., Gelova, Z., Pernisova, M., Dabravolski, S., Hejatko, J. (2015). Illuminating light, cytokinin, and ethylene signalling crosstalk in plant development. J. Exp. Bot. 66, 4913–4931. doi: 10.1093/jxb/erv261
Zehrmann, A., Hartel, B., Glass, F., Bayer-Csaszar, E., Obata, T., Meyer, E., et al. (2015). Selective homo- and heteromer interactions between the multiple organellar RNA editing factor (MORF) proteins in Arabidopsis thaliana. J. Biol. Chem. 290, 6445–6456. doi: 10.1074/jbc.M114.602086
Zhang, F., Tang, W., Hedtke, B., Zhong, L., Liu, L., Peng, L., et al. (2014). Tetrapyrrole biosynthetic enzyme protoporphyrinogen IX oxidase 1 is required for plastid RNA editing. Proc. Natl. Acad. Sci. U.S.A. 111, 2023–2028. doi: 10.1073/pnas.1316183111
Keywords: plastid, MORF2/RIP2, RNA editing, retrograde signaling, stress response, skotomorphogenesis, reactive oxygen species, inducible CRISPR Interference
Citation: Yapa MM, Doroodian P, Gao Z, Yu P and Hua Z (2023) MORF2-mediated plastidial retrograde signaling is involved in stress response and skotomorphogenesis beyond RNA editing. Front. Plant Sci. 14:1146922. doi: 10.3389/fpls.2023.1146922
Received: 18 January 2023; Accepted: 13 March 2023;
Published: 28 March 2023.
Edited by:
Jemaa Essemine, Partner Institute for Computational Biology, ChinaReviewed by:
Guifeng Wang, Henan Agricultural University, ChinaCopyright © 2023 Yapa, Doroodian, Gao, Yu and Hua. This is an open-access article distributed under the terms of the Creative Commons Attribution License (CC BY). The use, distribution or reproduction in other forums is permitted, provided the original author(s) and the copyright owner(s) are credited and that the original publication in this journal is cited, in accordance with accepted academic practice. No use, distribution or reproduction is permitted which does not comply with these terms.
*Correspondence: Zhihua Hua, aHVhQG9oaW8uZWR1
†These authors have contributed equally to this work
Disclaimer: All claims expressed in this article are solely those of the authors and do not necessarily represent those of their affiliated organizations, or those of the publisher, the editors and the reviewers. Any product that may be evaluated in this article or claim that may be made by its manufacturer is not guaranteed or endorsed by the publisher.
Research integrity at Frontiers
Learn more about the work of our research integrity team to safeguard the quality of each article we publish.