 Hao Chen1,2*†
 Xinlei Yang3†
 Rirong Xu1
 Xiangyu Chen1Haifeng Zhong1
 Nian Liu2
 Li Huang2Huaiyong Luo2
 Dongxin Huai2Wenjing Liu4Yuhua Chen1Jianhong Chen5
 Huifang Jiang2*
- 1Institute of Crop Sciences, Fujian Academy of Agricultural Sciences, Fujian Research Station of Crop Gene Resource and Germplasm Enhancement, Ministry of Agriculture and Rural Affairs of People’s Republic of China, Fujian Engineering Research Center for Characteristic Upland Crops Breeding, Fujian Engineering Laboratory of Crop Molecular Breeding, Fuzhou, China
- 2Oil Crops Research Institute of the Chinese Academy of Agricultural Sciences, Key Laboratory of Biology and Genetic Improvement of Oil Crops, Ministry of Agriculture and Rural Affairs of People’s Republic of China, Wuhan, China
- 3State Key Laboratory of North China Crop Improvement and Regulation, North China Key Laboratory for Crop Germplasm Resources of Education Ministry, Key Laboratory for Crop Germplasm Resources of Hebei, Hebei Agricultural University, Baoding, China
- 4Institute of Quality Standards and Testing Technology for Agro-Products, Fujian Academy of Agricultural Sciences, Fujian Key Laboratory of Agro-products Quality and Safety, Fuzhou, China
- 5R&D Center for Oil Crops, Quanzhou Institute of Agricultural Sciences, Jinjiang, China
Introduction: Peanut (Arachis hypogaea L.) is an important cash crop worldwide. Compared with the ordinary peanut with pure pink testa, peanut with variegated testa color has attractive appearance and a higher market value. In addition, the variegated testa represents a distinct regulation pattern of anthocyanin accumulation in integument cells.
Methods: In order to identify the genetic locus underlying variegated testa color in peanut, two populations were constructed from the crosses between Fuhua 8 (pure-pink testa) and Wucai (red on white variegated testa), Quanhonghua 1 (pure-red testa) and Wucai, respectively. Genetic analysis and bulked sergeant analysis sequencing were applied to detect and identify the genetic locus for variegated testa color. Marker-assisted selection was used to develop new variegated testa peanut lines.
Results: As a result, all the seeds harvested from the F1 individuals of both populations showed the variegated testa type with white trace. Genetic analysis revealed that the pigmentation of colored region in red on white variegated testa was controlled by a previous reported gene AhRt1, while the formation of white region (un-pigmented region) in variegated testa was controlled by another single genetic locus. This locus, named as AhVt1 (Arachis hypogaea Variegated Testa 1), was preliminary mapped on chromosome 08 through bulked sergeant analysis sequencing. Using a secondary mapping population derived from the cross between Fuhua 8 and Wucai, AhVt1 was further mapped to a 1.89-Mb genomic interval by linkage analysis, and several potential genes associated with the uneven distribution of anthocyanin, such as MADS-box, MYB, and Chalcone synthase-like protein, were harbored in the region. Moreover, the molecular markers closely linked to the AhVt1 were developed, and the new variegated testa peanut lines were obtained with the help of marker-assisted selection.
Conclusion: Our findings will accelerate the breeding program for developing new peanut varieties with “colorful” testa colors and laid a foundation for map-based cloning of gene responsible for variegated testa.
1 Introduction
Variegation is an interesting phenomenon widely observed in many plant species (Marcotrigiano, 1997). It develops differently colored sectors in the surface of plant organs, such as leaves, stems, flowers, fruits, and seeds. In natural condition, the variegated leaves may help plants reduce the harm from the herbivore (Campitelli et al., 2008), and the variegated flowers may affect pollinator preferences (Davies et al., 2012; Glover et al., 2013). In the market, plants with attractive variegation in leaves, flowers, and fruits are preferred by the consumers and usually have higher commercial value (Behe et al., 1999; Chen et al., 2014). Hence, it is meaningful for us to uncover the mystery underlying variegation in plants.
It is believed that an uneven distribution of pigments in certain cells of variegated region is the main physiological reason for variegation (Wu et al., 2017). There are three major classes of plant pigments: anthocyanin, chlorophyll, and carotenoid. Of them, anthocyanin is the main pigment in flowers, fruits, and seeds and is responsible for red, violet, and blue colors, while carotenoid widely spread in various organs paints the plants with bright red, orange, and yellow colors, and chlorophyll is the fundamental pigment in leaves and confers green color (Tanaka et al., 2008).
Until now, most of the studies in plants revealed that the distinct expression patterns of anthocyanin biosynthesis structure genes or regulatory genes led to the un-balanced accumulation of anthocyanin, which were the main reasons for the formation of variegation. In some cases, the transposon elements influenced the anthocyanin accumulation by inserting or excising the anthocyanin biosynthesis genes or regulatory genes (Schiefelbein et al., 1988). In some other cases, exogenous RNA interference (RNAi) induced via virus or DNA methylation inhibited the expression of anthocyanin biosynthesis genes or regulatory genes in certain cells, leading to variegation (Nishizaki et al., 2011; Jiang et al., 2020). Studies also revealed that the specific transcriptional factors were involved in variegation formation. For example, the spatially and temporally distinct expression of MYB transcriptional factors resulted in the development of variegated color patterns in the petal of phalaenopsis (Hsu et al., 2015), tree peony (Gu et al., 2019), the peel of apple (Telias et al., 2011), the tepal of hybrid lilies (Suzuki et al., 2016), and so on. The MADS-box transcriptional factors were also considered as important regulatory factors for the bicolor pattern in ray florets (Qi et al., 2022), cattleya hybrida (Li et al., 2020). Furthermore, recent researches indicated that miRNA played an important role in the unstable distribution of pigments in cells (Tirumalai et al., 2019; Yamagishi and Sakai, 2020). All these results suggested the complexity of molecular mechanisms underlying variegation formation.
Peanut (Arachis hypogaea L.) is an important oil and economic crop in the world. Unlike most of the peanut varieties that show pure-pink testa color, a unique series of peanut varieties exhibit red on white variegated testa color. The peanut seeds with this variegated testa color have attractive appearance and a higher market value than ordinary peanut seeds. In addition, some studies claimed that this phenotype may be associated with other important agronomic traits, such as sugar content and nodulation habit (Dashiell et al., 2001; Hu et al., 2021). Therefore, it is important to dissect the molecular mechanism underlying the formation of variegated testa color in peanut. It is known that the major pigment in peanut seed testa is anthocyanin (Xue et al., 2021). A study compared transcripts and metabolites in the red-zone and white-zone of the same developing variegated testa, using transcriptomic and metabolomics joint analysis. It showed that the differently expressed genes (DEGs) were enriched in the anthocyanin biosynthesis and accumulation pathways, suggesting that cyanidin and delphinidin were the primary metabolites that caused the uneven distribution of pigments in two regions (Hu et al., 2021). A previous study revealed that the red on white variegated testa color was controlled by one single gene (the v gene) in peanut (Branch and Hammons, 1979). Although some progress have been made, the position for genetic locus and gene responsible for the red on white variegated testa color is still obscure to us, limiting the process of uncovering the mechanism underlying the phenotype and the breeding program for new “colorful” peanut varieties.
Bulked-segregant analysis is a strategy of genetic mapping by constructing two bulks of individuals with contrasting phenotypes from the segregating population. Bulked-segregant analysis sequencing (BSA-seq), based on next-generation sequencing technology, is an effective tool in mapping genetic loci underlying agronomic traits (especially for those quantitative traits) (Li and Xu, 2022). In peanut, this method has been applied for mapping genetic loci responsible for agronomic traits, such as late leaf spot resistance (Clevenger et al., 2018; Han et al., 2022), seed dormancy (Kumar et al., 2020), seed sucrose content (Guo et al., 2022), growth habit (Li et al., 2022; Pan et al., 2022), and testa color (Chen et al., 2021; Zhang et al., 2022).
In this study, to understand the inheritance of variegated testa in peanut, genetic analysis was performed in the segregating populations, using a variegated testa peanut landrace as a parent line. It revealed that the variegation phenotype was controlled via single genetic locus. This locus was mapped in chromosome 08 by BSA-seq. New variegated testa peanut lines have also been produced with the help of newly developed molecular markers.
2 Materials and methods
2.1 Plant material
“Wucai (Wc)” is a peanut landrace with red on white variegated testa color collected from Shandong Province, China. “Fuhua 8 (FH8)” is a peanut cultivar with pink testa color (containing AhRt1P allele) cultivated by Fujian Academy of Agricultural Sciences, China. Using FH8 as female parent, and Wc as male parent, FH8 was crossed with Wc to generate F1 plants, and the F2 population was constructed by selfing the F1 plants. The F2 population derived from the cross between FH8 and Wc was used for genetic analysis and BSA-seq. The advanced segregating population of this cross was used for further mapping analysis by selfing the F2 plants heterozygous in the targeting region. “Quanhonghua 1 (QH1)” is a red testa color peanut cultivar containing AhRt1R allele developed by Quanzhou Institute of Agricultural Sciences, China. Another F2 population was constructed to conduct progeny test, using QH1 as female parent, and Wc as male parent. “Yunnan Black (YB)” is a peanut landrace collected from Yunnan Province, China. It contains AhTc1B allele responsible for dark purple/black testa color, and was used as the donor for purple/black testa color for new variegated lines.
2.2 Quantification of anthocyanin in peanut testa
The anthocyanin content in testa was measured based on the UV visible spectroscopy method described in the previous study (Giusti and Wrolstad, 2001).
2.3 Determination of testa color type
The color type of testa was determined by the area of unpigmented region (white region), using visual observation. The unpigmented region of pink on white variegated testa (PW) individuals and red on white variegated testa (RW) individuals take up more than half of the surface in testa, while the unpigmented region in red with white trace (RWT) individuals and pink with white trace (PWT) individuals just take up less than a quarter of the surface in testa. The difference of color type in testa can be examined by the unaided eye.
2.4 Prepare for DNA bulks and illumina sequencing
We collected the young leaves of the parent line Wc, FH8, 10 individuals showing pure pink testa (PP), 20 individuals showing pure red testa (PR), 10 individuals showing pink on white variegated testa (PW), and 20 individuals showing red on white variegated testa (RW) from the F2 population derived from the cross between FH8 and Wc.
The collected young leaves were used for extracting DNA, respectively, following a modified CTAB method. We evaluated the quality and concentration of the DNA for each sample by 1% agarose gel electrophoresis and NanoDrop. The Pure Testa Bulk (PTB) pool was generated by mixing the equal amount of total DNA for each collected PP and PR DNA samples, and the Variegated Testa Bulk (VTB) pool was generated by mixing the equal amount of total DNA for each collected PW and RW DNA samples. The DNA libraries (including PTB, VTB, and the parent line Wc, FH8) were constructed by following the protocol of the NEB Next Ultra II DNA Library Prep Kit for Illumina, and the high-throughput sequencing of DNA libraries was performed by Illumina NovaSeq platform with NovaSeq 6000 S4 Reagent Kit in Genoseq Technology Co. Ltd (Wuhan, China). The raw data of Illumina sequencing data have been deposited in GenBank (BioProject: PRJNA681634 and PRJNA925001).
2.5 Variant detection and BSA-seq
The high-quality clean data were obtained from the Illumina sequencing data, after removing the low-quality reads (Q <20), adapter sequences, N > 10% reads, and too short reads (<50 bp) by the software of fastap. We aligned the obtained high-quality clean data to the reference cultivated peanut genome (Tifrunner, https://peanutbase.org/data/v2/Arachis/hypogaea/genomes/Tifrunner.gnm2.J5K5/), using the BWA software (Li and Durbin, 2009). The process of variant detection and annotation was described in a previous study (Chen et al., 2021). In general, after getting the alignment result by BWA, we used the SAMTOOLS to remove the duplicates (Li et al., 2009), and used “SortSam” in “Picard” tools to remove the PCR repeats. The variation detection was conducted by using the “HaplotypeCaller” module of “GATK” software (Magwene et al., 2011), and the annotation of variant was carried out by ANNOVAR (Wang et al., 2010).
We performed the BSA-seq via QTLseqr R package (Mansfeld and Grumet, 2018). The variants from the PTB and VTB were selected according to a previous study (Chen et al., 2021). The determination of the genomic region responsible for variegated testa was based on Δ (SNP-index) of genomic regions from PTB and VTB DNA pools (Takagi et al., 2013). In this study, the genomic region with the Δ (SNP-index) value higher than threshold calculated with 10000 permutations under p < 0.01 level was considered as the candidate region with gene controlling variegated testa color.
2.6 Genetic mapping using the flanking marker method
A segregation population containing 1006 individuals was generated from a cross between FH8 and Wc. The plants from this segregating population were used for selecting the recombination in the genomic region flanking AhVt1. Two markers, PA01 and P10, which flanked AhVt1, were firstly used to detect the recombination events that occurred in the preliminary mapping region. Nine new SNP markers (PA2, PA4, PA5, PA6, PA7, PA8, PB7, PC4, and PC6) distributed in the AhVt1 mapping region were developed. The order of the markers and the genetic distance between every two adjacent markers in the target region were determined by linkage analysis. All the recombinants were genotyped and the phenotype for testa color was evaluated. The recombination condition of the target gene and these markers was also analyzed. Finally, the mapping interval of AhVt1 was determined by flanking marker method.
2.7 Development of molecular markers
A total of 11 new SNP markers (PA01, PA2, PA4, PA5, PA6, PA7, PA8, PA10, PB7, PC4, and PC6) were further developed based on the re-sequencing result of two parent lines (FH8 and Wc). In addition, the markers PF1, PF2, and PF3 used for marker-assisted selection were developed based on the information from this study and previous studies (Chen et al., 2021; Huang et al., 2020; Zhao et al., 2020). All these SNP markers were developed by the procedure described in the previous study (Campbell et al., 2015). The further sequence information of all primers used in this study is listed in Supplementary Table S1.
2.8 Gene annotation in the mapping interval of AhVt1
According to the physical position for the mapping region of AhVt1, the annotated information of putative genes in the mapping region was obtained from Peanutbase (https://peanutbase.org/data/v2/Arachis/hypogaea/annotations/Tifrunner.gnm2.ann1.4K0L/). The DEGs profile between the red pigmented region and white non-pigmented region of developing testa was obtained from a previous study (Hu et al., 2021). Fold change ≥2 and FDR <0.01 were considered as the screening criteria for DEGs.
3 Result
3.1 Genetic analysis of the variegated testa color in peanut
The peanut landrace Wucai (Wc) showed the red on white variegated testa color. It is known that the major pigment in peanut testa is anthocyanin. Hence, we measured the anthocyanin content in the different pigmented zones of Wc testa, while the testa from a pure pink peanut cultivar Fuhua 8 (FH8) was also measured as control. As expected, the red zone in Wc exhibited the highest level of anthocyanin content, while the white unpigmented zone displayed the lowest anthocyanin content (Figure 1). In order to identify the gene controlling the red on white variegated testa color in peanut, a cross between FH8 with pure-pink testa and Wc with red on white variegated testa color was conducted (Figure 2A). All the seeds harvested from F1 individuals showed the same “red with white trace” variegated pigmentation pattern in testa. However, compared with their red on white variegated testa color parent Wc, the “red with white trace” variegated testa exhibited an obvious increase in the area with red pigmentation and a decrease in the white un-pigmented area (Figure 2B). We further investigated the testa color in the F2 population, and found that the testa color of the seeds from F2 individuals could be segregated into six types: pure red (PR), pure pink (PP), red on white variegated (RW), pink on white variegated (PW), red with white trace (RWT), and pink with white trace (PWT) (Figure 2C), with an approximate segregation ratio of 3: 1: 3: 1: 6: 2, respectively (χ2 = 1.316<11.070 at degree of freedom, df = 5, and p = 0.05). Interestingly, the number of red testa individuals (including PR + RW + RWT) and the pink testa individuals (including PP + PW + PWT) in the F2 population was consistent with a 3:1 ratio (χ2 = 0.034<3.841 at df = 1, and p = 0.05), while the number of pure-color testa individuals (including PR+PP), the variegated testa with white trace individuals (including RWT+PWT), and the “pure” variegated testa individual (including PW+RW) in the F2 population were consistent with a 1: 2: 1 ratio (χ2 = 0.944<5.991 at df = 2, and p = 0.05) (Table 1). These results suggested that the red/pink color and variegation in the testa were controlled by two independently inherited genes, respectively. The red/pink color in testa was controlled by a dominant gene, while the variegated pigmentation in testa was controlled by a co-dominant gene.
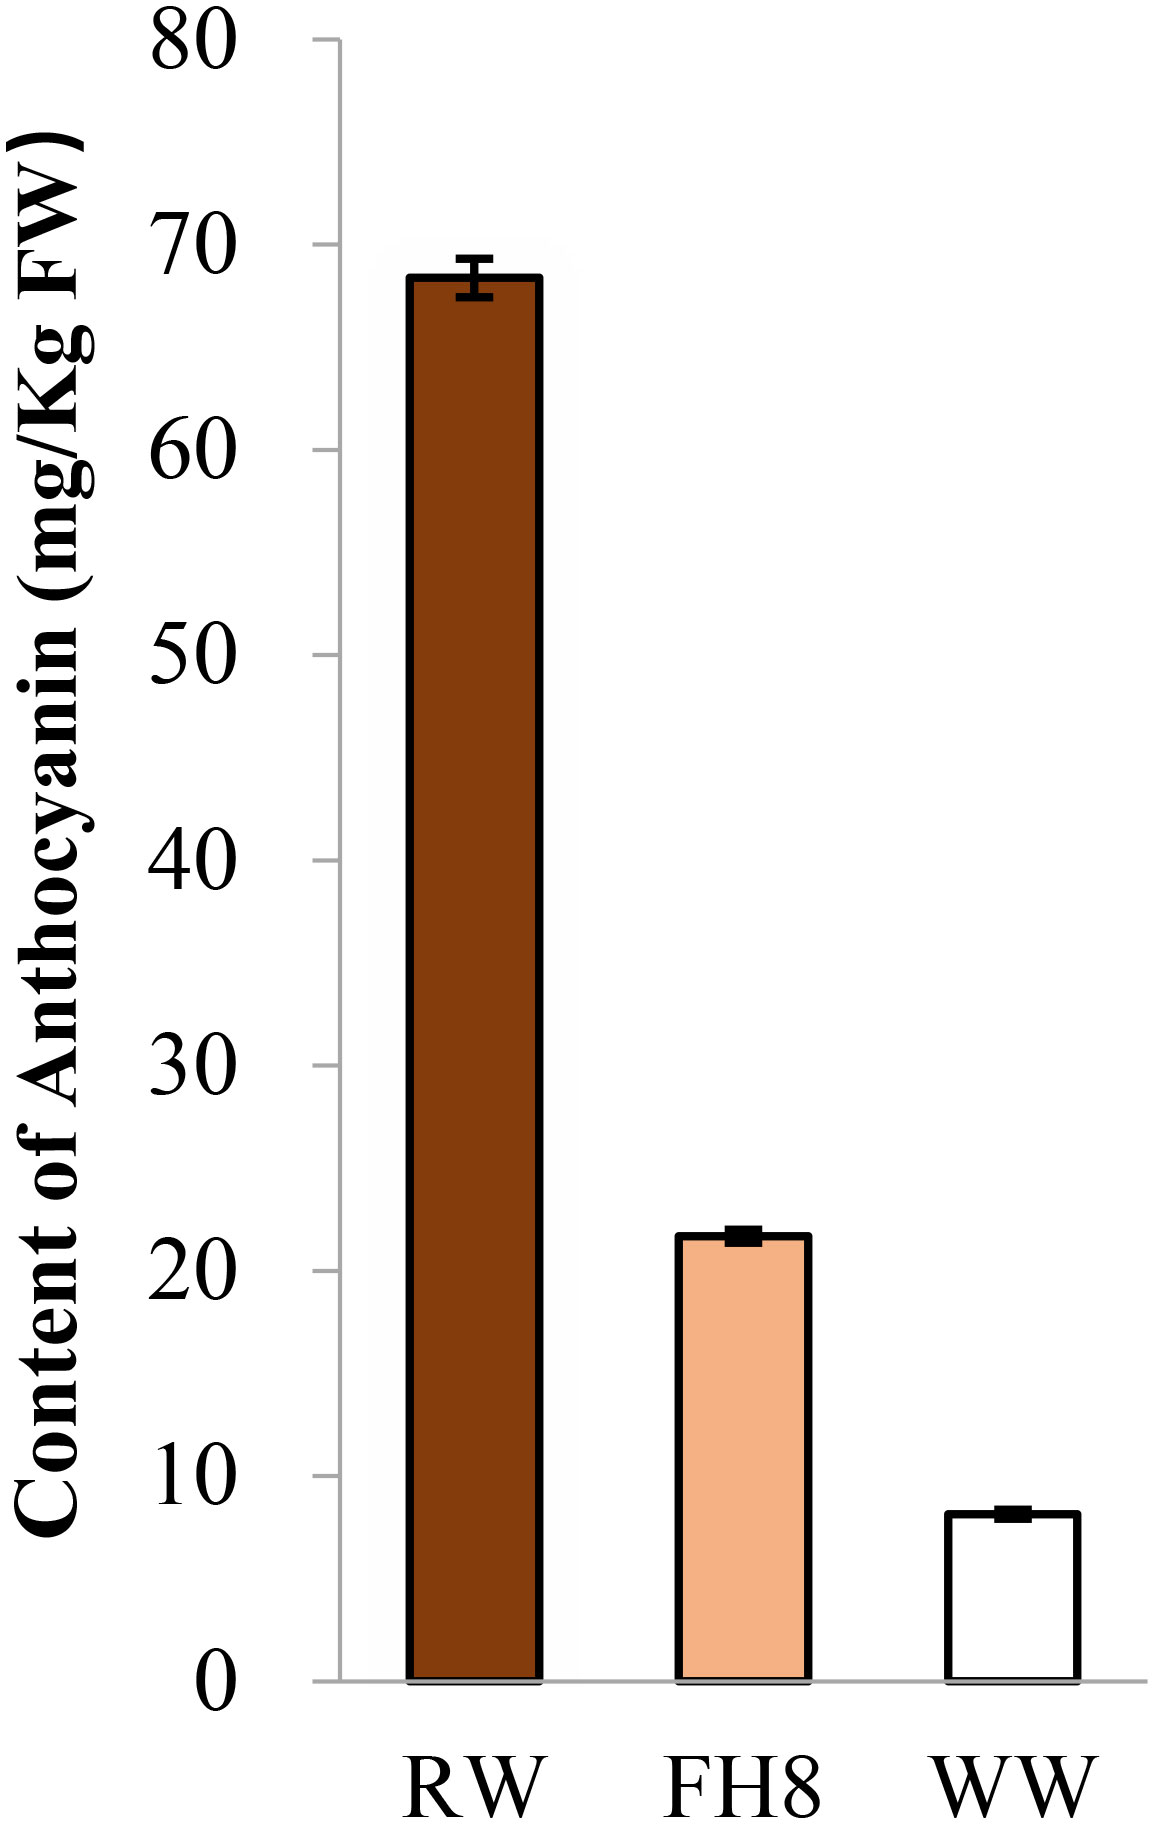
Figure 1 Comparison of the anthocyanin content in testa from different testa pigmentation pattern peanut germplasm. Red zone on Wc (RW), white zone on Wc (WW), and pink zone on Fuhua 8.
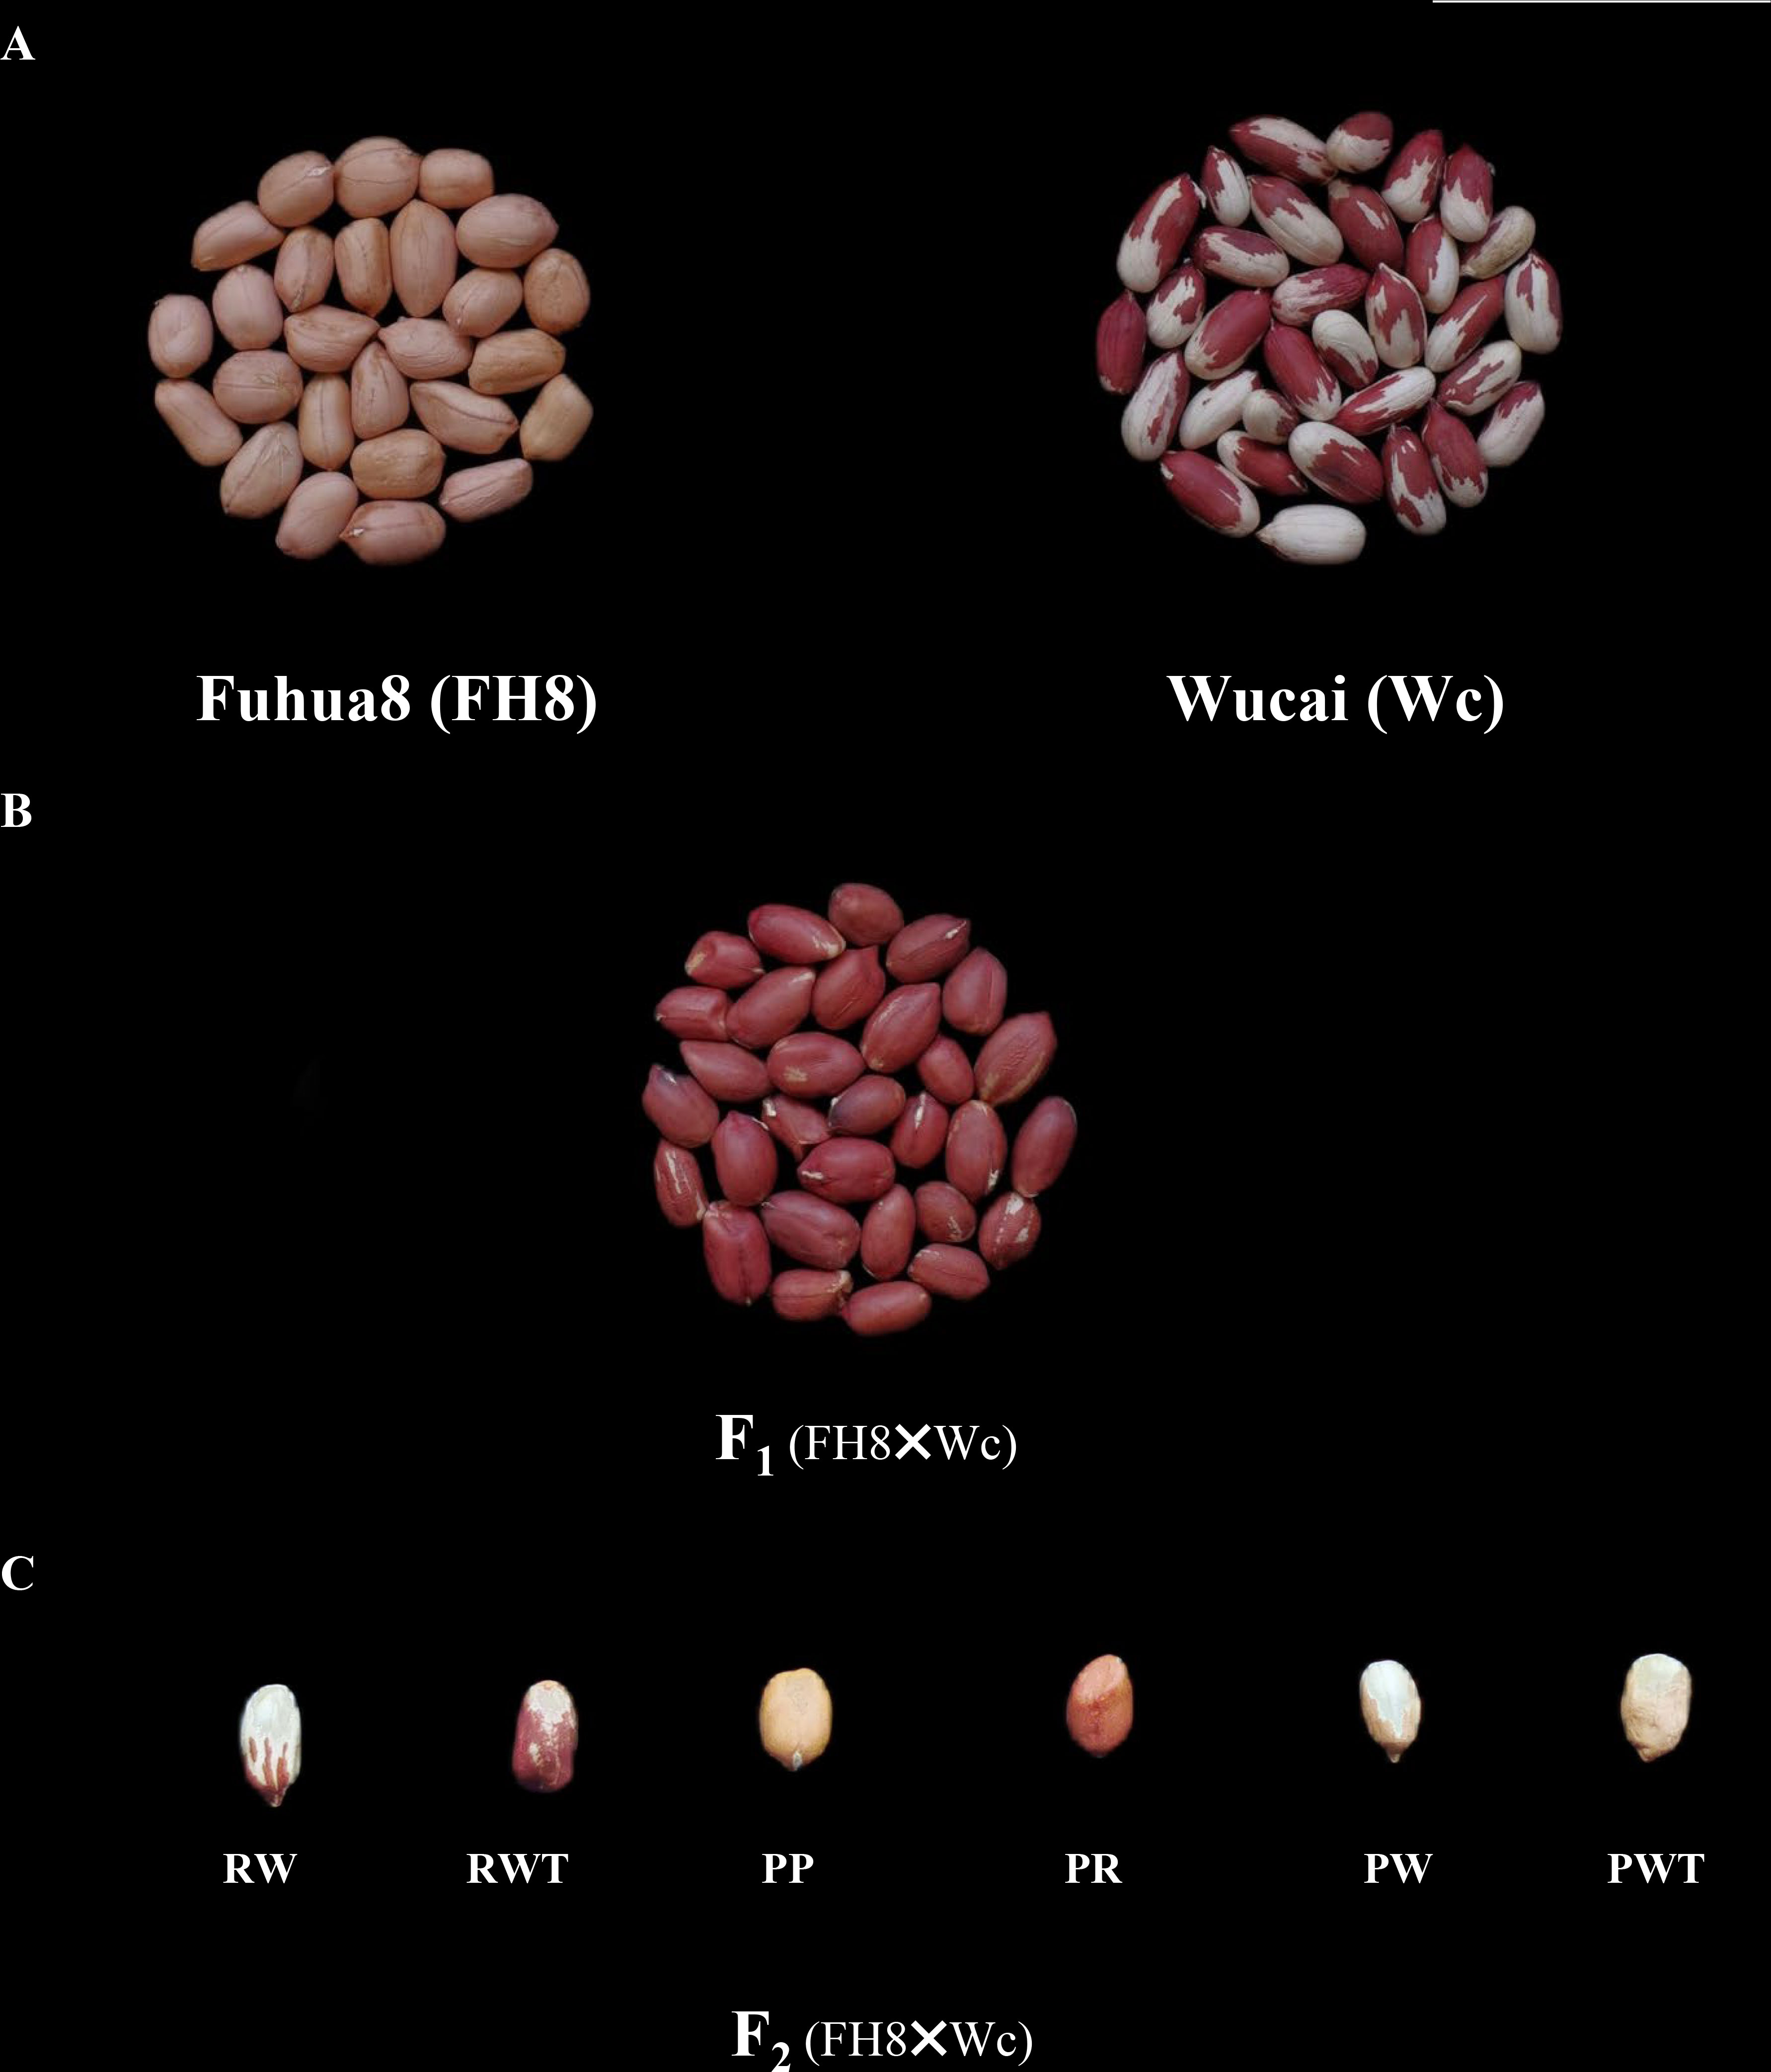
Figure 2 Comparison of testa color of peanut cultivar “Fuhua 8” and “Wucai”, and the genetic analysis for variegated testa color in peanut. (A). Seeds of pink testa cultivar “Fuhua 8” and red on white variegated testa color landrace “Wucai”. Scale bar = 5 cm. (B). The red on white trace testa seeds harvested from F1 plants derived from the cross between “Fuhua 8” and “Wucai”. (C). The segregation of testa pigmentation pattern of seeds harvested from F2 individuals derived from the cross between “Fuhua 8” and “Wucai”. Pure red (PR), pure pink (PP), red on white variegated (RW), pink on white variegated (PW), red with white trace (RWT), and pink with white trace (PWT).
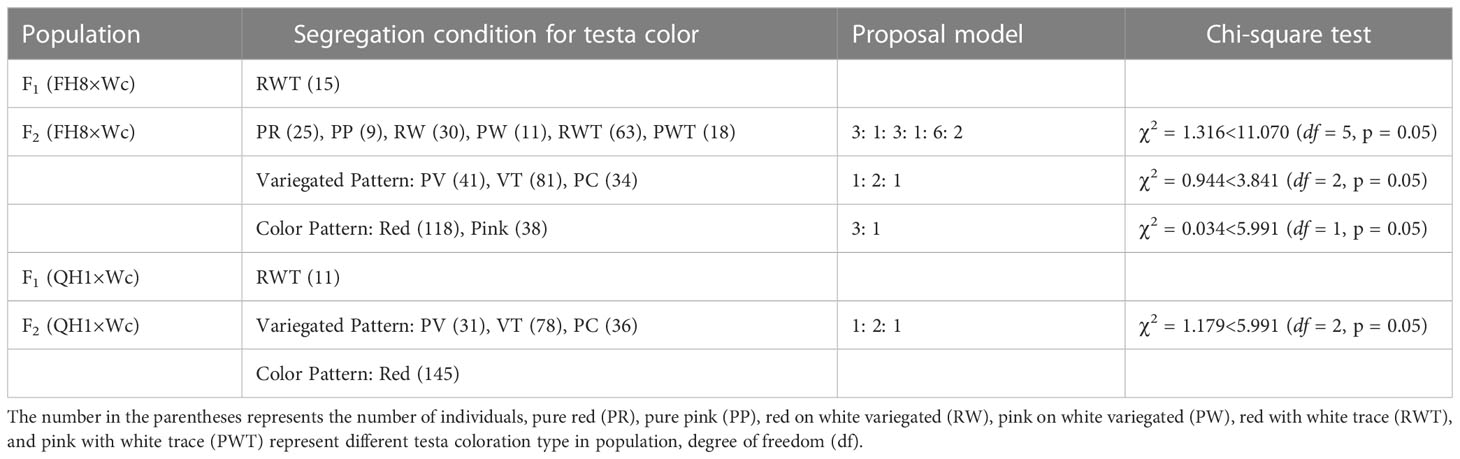
Table 1 Genetic analysis of variegated testa color.
As our previous study has reported a dominant locus AhRt1 conferring the red testa color in peanut (Chen et al., 2021), we hypothesized that the red color in this study was also controlled via AhRt1. A marker PF3 tightly linked to AhRt1 was used to confirm this hypothesis in the F2 population. It was shown that the marker can classify the red and pink individuals in F2 population. We further constructed another F2 population derived from a cross between Quanhonghua 1 (QH1, pure red testa, and containing AhRt1R) and Wc. The testa color of the seeds from the plants in this F2 population was just segregated into three types: pure red (PR), red with white trace (RWT), and red on white variegated (RW), with a segregation ratio of 1: 2: 1(χ2 = 1.179<5.991 at df = 2, and p = 0.05) (Table 1). The color in the testa was not segregated in this F2 population, while the variegation type in testa was segregated.
Taken all of these results together, it was indicated that the red color in the red on white variegated testa was controlled by AhRt1; the variegation in testa was actually controlled by one single gene. We named it as AhVt1 (Arachis hypogaea Variegated Testa 1).
3.2 BSA-seq identified AhVt1
The BSA-seq was conducted to map AhVt1. We randomly selected 30 individuals with “pure” testa color (including PR and PP) and 30 individuals with variegated color testa (including RW and PW) in the F2 population derived from the cross between FH8 and Wc. The DNA from selected F2 individuals was pooled together to construct two DNA bulks: Pure Testa Bulk (PTB) and Variegated Testa Bulk (VTB), respectively, based on their testa color (Figure 3). We re-sequenced the PTB, VTB, and the parent lines Wc and FH8 by the whole-genome re-sequencing method. The whole-genome re-sequencing generated 261,215,250 reads from PTB (average 25.0× depth and 94.83% coverage, using the Tifrunner as reference genome), 286,939,221 short reads from VTB (27.34× depth and 94.88% coverage), 172,382,458 short reads from wucai (16.59× depth and 93.57% coverage), and 79,241,708 short reads from FH8 (8.67× depth and 90.27% coverage) (Table 2). A total of 322,377 SNP and 37,355 Indel markers uniformly and evenly distributed in the genome of cultivated peanut have been identified by comparing the re-sequencing data from PTB, VTB, Wc, and FH8 (Supplementary Table S2). Using the SNP and Indel variants data from PTB and VTB, the SNP-index and Δ (SNP-index) for two bulks were analyzed and plotted against the position of the reference genome (Figure 4A). Most of the genomic regions showed no significant difference in SNP-index for PTB and VTB, demonstrating that they were not relevant to the variegated color testa phenotype. Interestingly, one unique genomic region comprised 6.21 to 19.17 Mb on chromosome 08 exhibited unequal contributions from two parent lines, and the Δ (SNP-index) value was significantly higher than the cut off value, indicating that this region was highly relevant to the variegated color testa (Figure 4B). It also conformed to the result of genetic analysis. Hence, we regarded this genomic region as the preliminary mapping region for AhVt1.

Figure 3 A simplified overview of our BSA-seq.
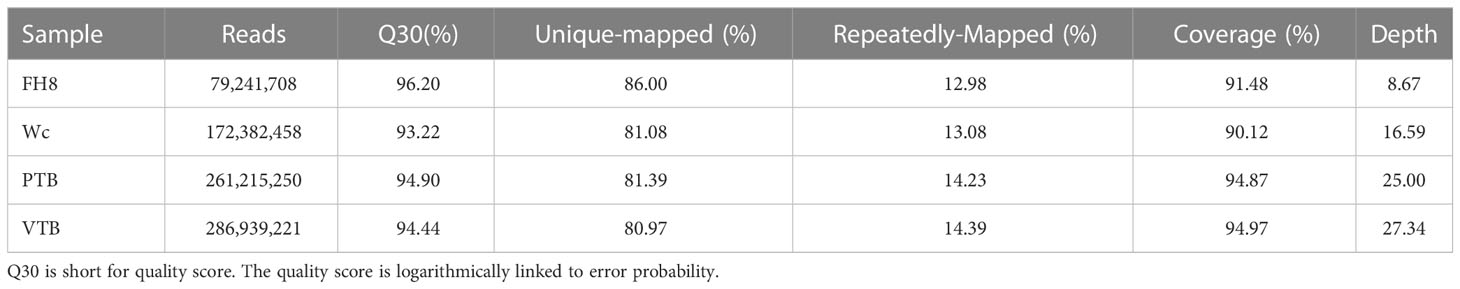
Table 2 Summary of sequencing data.
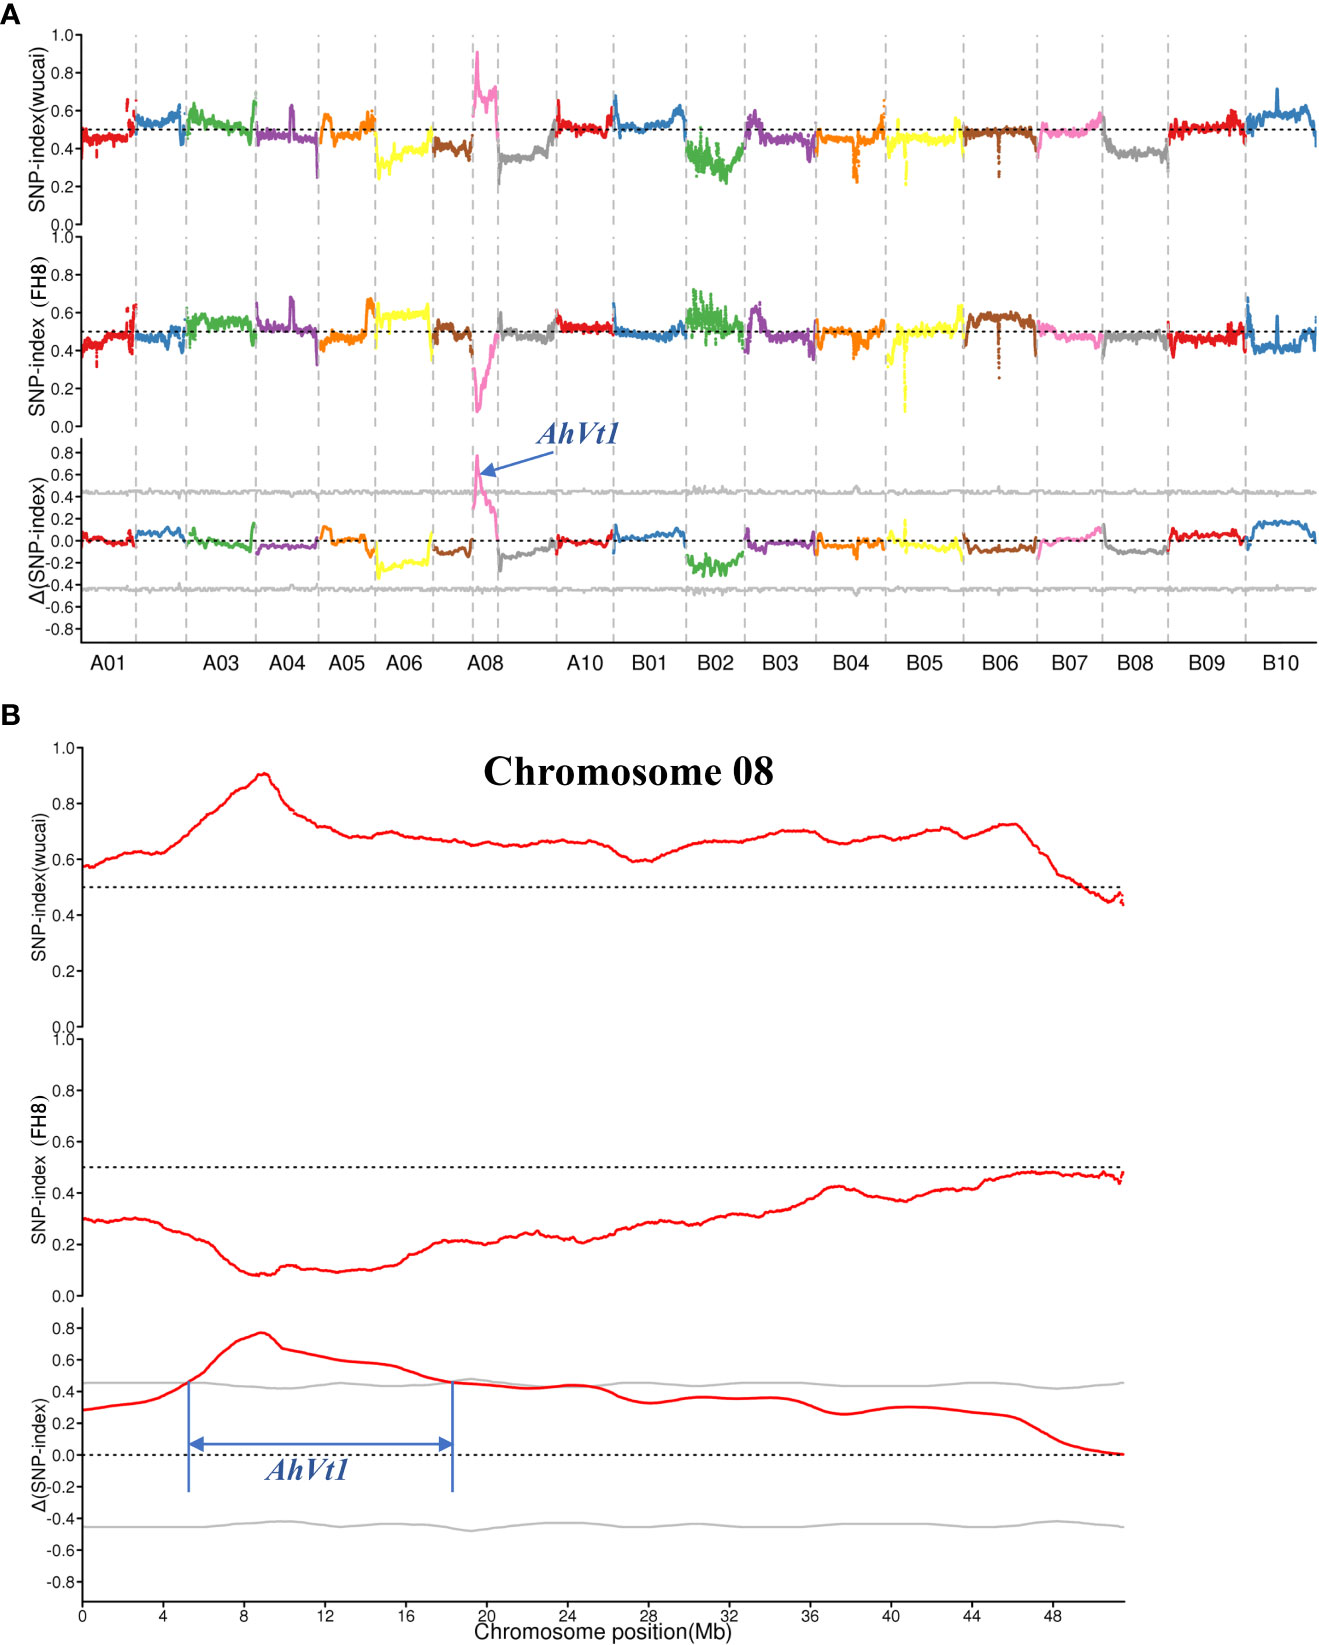
Figure 4 Mapping of locus responsible for variegated testa by BSA-seq strategy. (A). SNP and ΔSNP index of the Pure Testa Bulk (PTB) and Variegated Testa Bulk (VTB) in the whole genome-wide scale. (B). Preliminary mapping of AhVt1 in chromosome 08. The gray lines indicate the threshold value. The preliminary mapping region of AhVt1 was limited by two blue lines.
3.3 Narrowing down the mapping region of AhVt1
To reduce the mapping interval of AhVt1, we generated a segregating population containing 1006 individuals derived from the cross between FH8 and Wc. Two markers, PA01 and PA10, which flanked the AhVt1 preliminary mapping region, were developed to screen the recombinant individuals. A total of 43 recombinants between PA01 and PA10 were identified. Nine markers (PA2, PC4, PC6, PB7, PA4, PA5, PA6, PA7, and PA8) distributed across the mapping region were further developed to genotype these recombinants. A high-resolution map flanking the AhVt1 mapping region was constructed. We evaluated the genotype and phenotype of the recombinant individuals. AhVt1 was narrowed down to a 1.89-Mb genomic region between markers PC6 and PB7 (Figure 5). A total of 93 predicted genes were presented in this region, based on a cultivated peanut sequence annotation database (Supplementary Table S3).
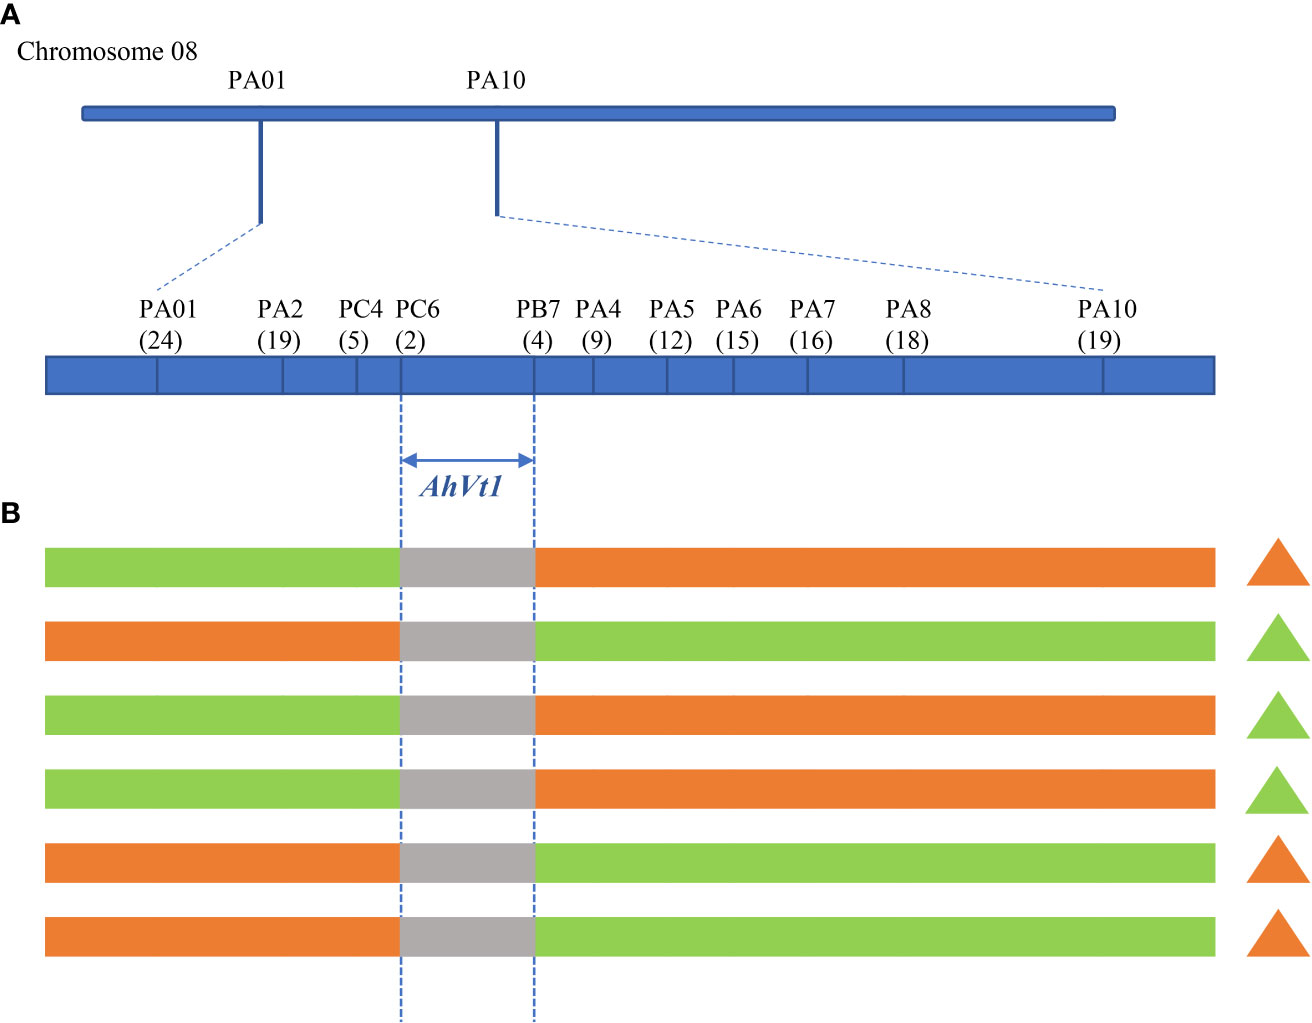
Figure 5 Narrow down the mapping region of AhVt1. (A). Genetic mapping of AhVt1 on chromosome 08 based on individuals from the segregating population. The number of recombinants between adjacent markers is indicated under the linkage map. (B). The genotype of important recombinants that determine the mapping region of AhVt1. The green bar represents the genomic segment from FH8, the orange bar represents the genomic segment from Wc, the grey bar represents the genomic segment where the recombination occurs. The triangle represents the testa phenotype of corresponding recombinant. The green triangle represents the pure-color testa, while the orange triangle represents the variegated testa color.
To explore the nucleotide variants in AhVt1 mapping region, the re-sequencing data of two parent lines, FH8 and Wc, were compared and analyzed. As a result, a total of 82 SNPs and 15 Indels were detected in the genome of the AhVt1 mapping region. We further annotated these SNPs/Indels, and there were two SNPs located on the exon, three SNPs and two Indels located on the intronic region, three SNPs and two Indels located on the 5′UTR or 3′UTR region, five SNPs located on the upstream/downstream of genes, and one SNP located on the splicing junction of intronic/exonic. The remaining SNPs and Indels were harbored in the intergenic region (Supplementary Table S4).
The putative differentially expressed genes (DEGs) in the AhVt1 mapping region were predicted by comparing the published transcriptomic data between the pigmented (red) and unpigmented areas (white) in the developing red on white variegated testa (Hu et al., 2021). A total of four DEGs were identified in the AhVt1 mapping region, including the arahy.NKL1UU encoding MADS-box transcription factor family protein, arahy.33MSFM encoding senescence-inducible chloroplast stay-green protein 2, arahy.AG2MXP encoding transmembrane amino acid transporter family protein, and arahy.FQ5ZUR encoding response regulator. Among them, arahy.NKL1UU, arahy.33MSFM and arahy.FQ5ZUR showed significant higher expression level in the unpigmented zone than that in the red zone, while arahy.AG2MXP exhibited the opposite expression tendency (Supplementary Table S5).
3.4 Developing new variegation testa pattern peanut lines using the marker-assist selection approach
As the genetic basis of variegation in testa pigmentation of peanut has been uncovered (Figure 6A), new peanut lines with variegated testa can be developed by directional selection of two loci (one variegated testa locus and one testa color locus), using the MAS system. For example, we developed a new black on white variegated testa line by conducting a cross between a peanut landrace “Yunnan Black (YB)” with black/deep purple testa (conferred via AhTc1B) and Wc with the red on white variegated testa. As the black testa in YB was controlled via a previous reported allele AhTc1B, we used a marker PF2 tightly linked to AhTc1, and a marker PF1 tightly linked to AhVt1 to screen the F2 and F3 population derived from the cross between YB and Wc (Figure 6B). As a result, a stable black on white variegated testa peanut line was rapidly obtained by MAS (with the combination of alleles AhTc1BAhTc1B/AhVt1VAhVt1V (Figure 6C). We can also obtain the causal individuals with black with white trace testa, purple with white trace testa, and purple on white variegated testa by MAS, if necessary. In addition, the new type pink on the white variegated testa line (with the combination of alleles AhRt1PAhRt1P/AhVt1VAhVt1V) was also obtained by screening the population derived from FH8 and Wc with the similar procedure by the markers PF1 and PF3 (Figure 6C).
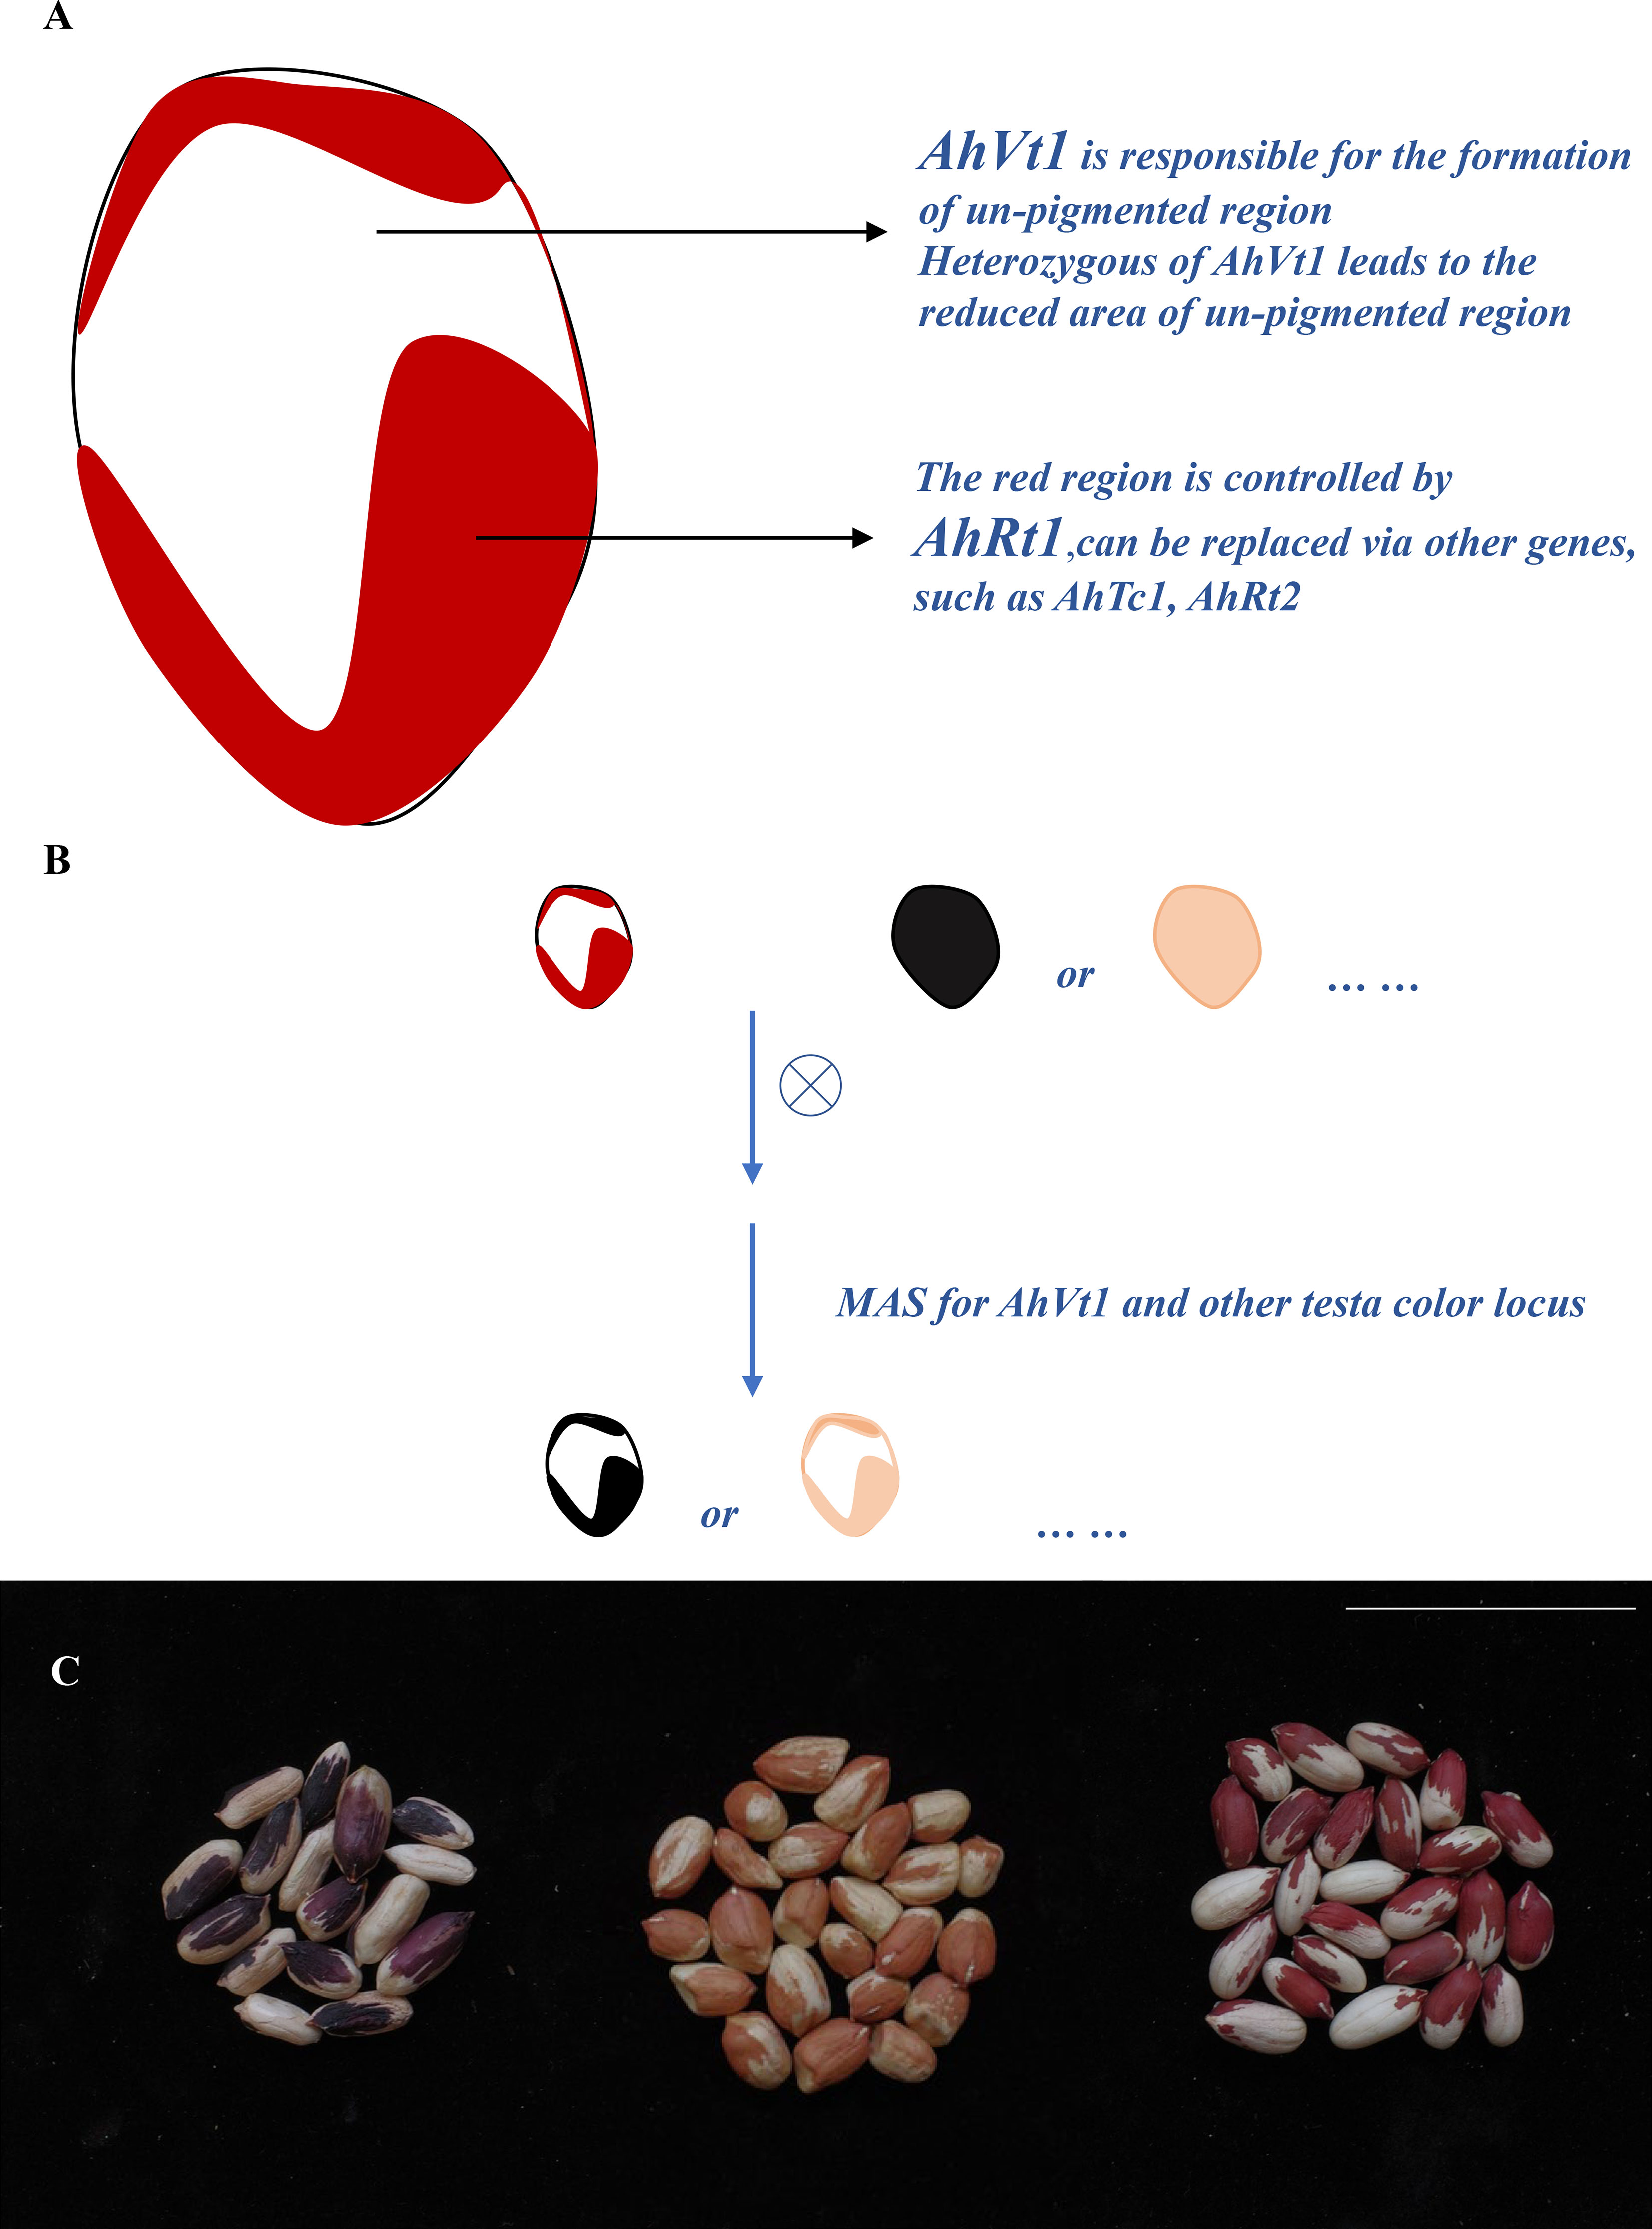
Figure 6 Development new variegation testa pattern peanut lines by marker-assist selection (MAS) approach. (A). Work model for AhVt1 in formatting the variegation testa. (B). Development of the new variegation testa pattern peanut lines by MAS. (C). The seed of new developed black on white variegated and pink on white variegated testa peanut lines. Scale bar = 5 cm.
4 Discussion
Anthocyanin is known to be the major pigment of testa in peanut. The content and composition of anthocyanin co-determine the color of peanut testa, and also give different types of peanut testa distinct nutritional and healthcare functions (Zhang et al., 2022). Understanding the regulation mechanisms for the accumulation of anthocyanin in integument also uncovers the regulation of pigmentation in peanut testa. People have systematically studied the mechanism of peanut testa color for over 100 years (Branch, 2011). Especially in the recent years, with the rapid progress in peanut functional genomics research (Chen et al., 2016; Yin et al., 2018; Bertioli et al., 2019; Zhuang et al., 2019), many genetic loci underlying the peanut testa color have been identified, such as AhTc1 for black/purple color (Huang et al., 2020; Zhao et al., 2020) and AhRt1 and AhRt2 for red color (Chen et al., 2021; Zhang et al., 2022), respectively. These studies laid the foundation for uncovering the genetic mechanisms of peanut testa color formation and breeding for new peanut varieties with different colors in testa. In this study, we identified a new genetic locus responsible for variegated testa color in chromosome 08.
According to our result, we conclude that this red on white variegated testa phenotype is controlled via two types of loci. One type of locus is AhVt1; this type of locus is responsible for the formation of variegation phenotype. The allele from Wc (AhVt1V) leads to a lack of pigmentation ability for part of the epidermal cells in seed coat, therefore exhibiting white color in seed coat. The heterozygous of AhVt1V allele also leads to a lack of pigmentation ability for some of the epidermal cells in seed coat, but non-pigmented region for heterozygous AhVt1V genotype is smaller (fewer non-pigmented cells) compared to that in the homozygous AhVt1v allele, while the homozygous AhVt1P allele led to a pure color testa without any non-pigmented region. This suggests a semi-dominant effect of AhVt1V, when compared to AhVt1P. The other type of locus is the normal testa color genes that control pigmentation of the remaining of the testa epidermal cells in variegated seed coat. This gene could be AhRt1 underlying red testa color as in Wc, and it could be replaced via other seed coat genes, such as AhTc1, AhRt1, or other testa color genes in peanut. Hence, we can directly and effectively generate new type variegated testa peanut lines via hybridization and MAS. In fact, we have obtained a stable-inherited black on white variegated testa line by MAS in two generations.
AhVt1 has been delimited to a 1.89-Mb genomic region, and there were 93 genes in this genomic region. Of these, arahy.H1H5BB, arahy.NKL1UU, arahy.M75BKX, and arahy.33MSFM are more interesting candidate genes for AhVt1. arahy.H1H5BB, as well as arahy.LY4YXE and arahy.FM6CZ7 in the mapping region, which encode a Chalcone synthase (CHS)-like protein. CHS is known to be a key enzyme to catalyze the first reaction which produces cyanidin 3-O-ß-rutinoside in the biosynthesis pathway of flavonoids. The expression level and spatial expression pattern of CHS genes has been reported to be associated with the accumulation of anthocyanin in different tissues, and to finally influence the pigmentation of tissues in many species (Morita et al., 2012; Deng et al., 2014). In addition, one annotated SNP was located on the upstream of arahy.H1H5BB. arahy. NKL1UU belongs to MADS-box transcription factor family protein. MADS-box transcription factors can regulate anthocyanin biosynthesis by influencing MYB gene transcription (Jaakola et al., 2010), or though regulating the expression of anthocyanin biosynthesis structure genes (Wu et al., 2014). Nevertheless, the MADS-box transcription factors can also influence bicolor pattern formation in cineraria ray florets (Qi et al., 2022). The predicted gene arahy.M75BKX encodes the MYB transcription factor, and recent studies have reported that MYB genes have participated in the differential coloration formation (Hsu et al., 2015; Gu et al., 2019). arahy.33MSFM encoding senescence-inducible chloroplast stay-green protein 2 (SGR2) were also harbored in the mapping region. SGR2 is a negative regulator of chlorophyll degradation during leaf senescence, and it determines the seed coat color in pea (Armstead et al., 2007). Among four DEGs identified in the mapping region, arahy.NKL1UU showed a significantly higher expression level in the un-colored zone than that in the red zone of testa. It coincided with the expressional tendency of the MADS-box transcriptional factor ScAG and ScAGL11 in cineraria ray florets. ScAG and ScAGL11 negatively regulated the anthocyanin biosynthesis and influenced the bicolor pattern formation (Qi et al., 2022). Therefore, arahy.NKL1UU may have the similar function in variegation formation. However, the candidate genes should be validated by the future research.
In conclusion, identification of AhVt1 helps us uncover the genetic rule for variegated testa color in peanut, and improves the breeding programs of new “colorful” peanut varieties.
Data availability statement
The datasets presented in this study can be found in online repositories. The names of the repository/repositories and accession number(s) can be found below: https://www.ncbi.nlm.nih.gov/genbank/, PRJNA681634, https://www.ncbi.nlm.nih.gov/genbank/, PRJNA925001.
Author contributions
HC and HJ conceived and designed the research. HC, RX, XC, HZ, YC, and JC developed the populations, planted the materials, and conducted field management. WL performed the measurement of anthocyanin. HC, XY, NL, LH, and HL performed the BSA-seq, mapping, and gene candidate analysis. HC, LH, and XY developed the molecular markers and new variegated lines. HC wrote the manuscript; DH, HL, XY, and HJ revised the manuscript. All authors contributed to the article and approved the submitted version.
Funding
This research was financially supported by the Natural Science Foundation of Fujian Province (2021J0416), the National Natural Science Foundation of China (32001577), the National Peanut Industry Technology System Construction (CARS-13), the Support Program for the Top Young Talents of Hebei Province (0602015), the Foreign Cooperation Projects for Fujian Academy of Agricultural Sciences (DWHZ-2022-02), and the Youth Science and Technology Innovative Team in Fujian Academy of Agricultural Sciences (CXTD2021008-3).
Conflict of interest
The authors declare that the research was conducted in the absence of any commercial or financial relationships that could be construed as a potential conflict of interest.
Publisher’s note
All claims expressed in this article are solely those of the authors and do not necessarily represent those of their affiliated organizations, or those of the publisher, the editors and the reviewers. Any product that may be evaluated in this article, or claim that may be made by its manufacturer, is not guaranteed or endorsed by the publisher.
Supplementary material
The Supplementary Material for this article can be found online at: https://www.frontiersin.org/articles/10.3389/fpls.2023.1145098/full#supplementary-material
References
Armstead, I., Donnison, I., Aubry, S., Harper, J., Hörtensteiner, S., James, C., et al. (2007). Cross-species identification of mendel's I locus. Science 315 (5808), 73–73. doi: 10.1126/science.1132912
Behe, B., Nelson, R., Barton, S., Hall, C., Safley, C. D., Turner, S. (1999). Consumer preferences for geranium flower color, leaf variegation, and price. HortScience 34 (4), 740–742. doi: 10.21273/HORTSCI.34.4.740
Bertioli, D. J., Jenkins, J., Clevenger, J., Dudchenko, O., Gao, D., Seijo, G., et al. (2019). The genome sequence of segmental allotetraploid peanut Arachis hypogaea. Nat. Genet. 51 (5), 877–884. doi: 10.1038/s41588-019-0405-z
Branch, W. (2011). First 100 years-inheritance of testa color in peanut (Arachis hypogaea L.). Crop Sci. 51 (1), 1–4. doi: 10.2135/CROPSCI2010.06.0349
Branch, W., Hammons, R. O. (1979). Inheritance of testa color variegation in peanut. Crop Sci. 19 (6), 786–788. doi: 10.2135/cropsci1979.0011183X001900060010x
Campbell, N. R., Harmon, S. A., Narum, S. R. (2015). Genotyping-in-Thousands by sequencing (GT-seq): A cost effective SNP Genotyping method based on custom amplicon sequencing. Mol. Ecol. Resour. 15 (4), 855–867. doi: 10.1111/1755-0998.12357
Campitelli, B. E., Stehlik, I., Stinchcombe, J. R. (2008). Leaf variegation is associated with reduced herbivore damage in hydrophyllum virginianum. Botany 86 (3), 306–313. doi: 10.1139/B07-139
Chen, H., Chen, X., Xu, R., Liu, W., Liu, N., Huang, L., et al. (2021). Fine-mapping and gene candidate analysis for AhRt1, a major dominant locus responsible for testa color in cultivated peanut. Theor. Appl. Genet. 134 (11), 3721–3730. doi: 10.1007/s00122-021-03924-w
Chen, X., Li, H., Pandey, M. K., Yang, Q., Wang, X., Garg, V., et al. (2016). Draft genome of the peanut a-genome progenitor (Arachis duranensis) provides insights into geocarpy, oil biosynthesis, and allergens. Proc. Natl. Acad. Sci. 113 (24), 6785–6790. doi: 10.1073/pnas.1600899113
Chen, Y., Mao, Y., Liu, H., Yu, F., Li, S., Yin, T. (2014). Transcriptome analysis of differentially expressed genes relevant to variegation in peach flowers. PloS One 9 (3), e90842. doi: 10.1371/journal.pone.0090842
Clevenger, J., Chu, Y., Chavarro, C., Botton, S., Culbreath, A., Isleib, T., et al. (2018). Mapping late leaf spot resistance in peanut (Arachis hypogaea) using QTL-seq reveals markers for marker-assisted selection. Front. Plant Sci. 9, 83. doi: 10.3389/fpls.2018.00083
Dashiell, K., Gallo-Meagher, M., Gorbet, D. (2001). Linkage between loci controlling nodulation and testa variegation in peanut. J. Heredity 92 (6), 509–511. doi: 10.1093/jhered/92.6.509
Davies, K. M., Albert, N. W., Schwinn, K. E. (2012). From landing lights to mimicry: the molecular regulation of flower colouration and mechanisms for pigmentation patterning. Funct. Plant Biol. 39 (8), 619–638. doi: 10.1071/FP12195
Deng, X., Bashandy, H., Ainasoja, M., Kontturi, J., Pietiäinen, M., Laitinen, R. A., et al. (2014). Functional diversification of duplicated chalcone synthase genes in anthocyanin biosynthesis of gerbera hybrida. New Phytol. 201 (4), 1469–1483. doi: 10.1111/nph.12610
Giusti, M., Wrolstad, R. (2001). Anthocyanins. characterization and measurement with UV-visible spectroscopy. Curr. Protoc. Food Analytical Chem. 1, 1–13. doi: 10.1002/0471142913.faf0102s00
Glover, B. J., Walker, R. H., Moyroud, E., Brockington, S. F. (2013). How to spot flower. New Phytol. 197 (3), 687–689. doi: 10.1111/nph.12112
Gu, Z., Zhu, J., Hao, Q., Yuan, Y., Duan, Y., Men, S., et al. (2019). A novel R2R3-MYB transcription factor contributes to petal blotch formation by regulating organ-specific expression of PsCHS in tree peony (Paeonia suffruticosa). Plant Cell Physiol. 60 (3), 599–611. doi: 10.1093/pcp/pcy232
Guo, J., Qi, F., Qin, L., Zhang, M., Sun, Z., Li, H., et al. (2022). Mapping of a QTL associated with sucrose content in peanut kernels using BSA-seq. Front. Genet. 13. doi: 10.3389/fgene.2022.1089389
Han, S., Zhou, X., Shi, L., Zhang, H., Geng, Y., Fang, Y., et al. (2022). AhNPR3 regulates the expression of WRKY and PR genes, and mediates the immune response of the peanut (Arachis hypogaea L.). Plant J. 110 (3), 735–747. doi: 10.1111/tpj.15700
Hsu, C., Chen, Y., Tsai, W., Chen, W., Chen, H. (2015). Three R2R3-MYB transcription factors regulate distinct floral pigmentation patterning in Phalaenopsis spp. Plant Physiol. 168 (1), 175–191. doi: 10.1104/pp.114.254599
Hu, M., Li, J., Hou, M., Liu, X., Cui, S., Yang, X., et al. (2021). Transcriptomic and metabolomic joint analysis reveals distinct flavonoid biosynthesis regulation for variegated testa color development in peanut (Arachis hypogaea L.). Sci. Rep. 11 (1), 1–14. doi: 10.1038/s41598-021-90141-6
Huang, L., Liu, X., Pandey, M. K., Ren, X., Chen, H., Xue, X., et al. (2020). Genome-wide expression quantitative trait locus analysis in a recombinant inbred line population for trait dissection in peanut. Plant Biotechnol. J. 18 (3), 779–790. doi: 10.1111/pbi.13246
Jaakola, L., Poole, M., Jones, M. O., Kämäräinen-Karppinen, T., Koskimäki, J. J., Hohtola, A., et al. (2010). A SQUAMOSA MADS box gene involved in the regulation of anthocyanin accumulation in bilberry fruits. Plant Physiol. 153 (4), 1619–1629. doi: 10.1104/pp.110.158279
Jiang, S., Wang, N., Chen, M., Zhang, R., Sun, Q., Xu, H., et al. (2020). Methylation of MdMYB1 locus mediated by RdDM pathway regulates anthocyanin biosynthesis in apple. Plant Biotechnol. J. 18 (8), 1736–1748. doi: 10.1111/pbi.13337
Kumar, R., Janila, P., Vishwakarma, M., Khan, A., Manohar, S., Gangurde, S. S., et al. (2020). Whole-genome resequencing-based QTL-seq identified candidate genes and molecular markers for fresh seed dormancy in groundnut. Plant Biotechnol. J. 18 (4), 992–1003. doi: 10.1111/pbi.13266
Li, L., Cui, S., Dang, P., Yang, X., Wei, X., Chen, K., et al. (2022). GWAS and bulked segregant analysis reveal the loci controlling growth habit-related traits in cultivated peanut (Arachis hypogaea L.). BMC Genomics 23 (1), 403. doi: 10.1186/s12864-022-08640-3
Li, H., Durbin, R. (2009). Fast and accurate short read alignment with burrows–wheeler transform. Bioinformatics 25 (14), 1754–1760. doi: 10.1093/bioinformatics/btp324
Li, H., Handsaker, B., Wysoker, A., Fennell, T., Ruan, J., Homer, N., et al. (2009). The sequence alignment/map format and SAMtools. Bioinformatics 25 (16), 2078–2079. doi: 10.1093/bioinformatics/btp352
Li, Z., Xu, Y. (2022). Bulk segregation analysis in the NGS era: A review of its teenage years. Plant J. 109 (6), 1355–1374. doi: 10.1111/tpj.15646
Li, B., Zheng, B., Wang, J., Tsai, W., Lu, H., Zou, L., et al. (2020). New insight into the molecular mechanism of colour differentiation among floral segments in orchids. Commun. Biol. 3 (1), 1–13. doi: 10.1038/s42003-020-0821-8
Magwene, P. M., Willis, J. H., Kelly, J. K. (2011). The statistics of bulk segregant analysis using next generation sequencing. PloS Comput. Biol. 7 (11), e1002255. doi: 10.1371/journal.pcbi.1002255
Mansfeld, B., Grumet, R. (2018). QTLseqr: an r package for bulk segregant analysis with next-generation sequencing. Plant Genome 11(2).doi: 10.3835/plantgenome2018.01.0006
Marcotrigiano, M. (1997). Chimeras and variegation: patterns of deceit. HortScience 32 (5), 773–784. doi: 10.21273/HORTSCI.32.5.773
Morita, Y., Saito, R., Ban, Y., Tanikawa, N., Kuchitsu, K., Ando, T., et al. (2012). Tandemly arranged chalcone synthase a genes contribute to the spatially regulated expression of siRNA and the natural bicolor floral phenotype in petunia hybrida. Plant J. 70 (5), 739–749. doi: 10.1111/j.1365-313X.2012.04908.x
Nishizaki, Y., Matsuba, Y., Okamoto, E., Okamura, M., Ozeki, Y., Sasaki, N. (2011). Structure of the acyl-glucose-dependent anthocyanin 5-o-glucosyltransferase gene in carnations and its disruption by transposable elements in some varieties. Mol. Genet. Genomics 286 (5), 383–394. doi: 10.1007/s00438-011-0655-7
Pan, J., Zhou, X., Ahmad, N., Zhang, K., Tang, R., Zhao, H., et al. (2022). BSA−seq and genetic mapping identified candidate genes for branching habit in peanut. Theor. Appl. Genet. 135 (12), 4457–4468. doi: 10.1007/s00122-022-04231-8
Qi, F., Liu, Y., Luo, Y., Cui, Y., Lu, C., Li, H., et al. (2022). Functional analysis of the ScAG and ScAGL11 MADS-box transcription factors for anthocyanin biosynthesis and bicolour pattern formation in senecio cruentus ray florets. Horticulture Res. 9. doi: 10.1093/hr/uhac071
Schiefelbein, J. W., Furtek, D. B., Dooner, H. K., Nelson, O. E., Jr (1988). Two mutations in a maize bronze-1 allele caused by transposable elements of the Ac-ds family alter the quantity and quality of the gene product. Genetics 120 (3), 767–777. doi: 10.1093/genetics/120.3.767
Suzuki, K., Suzuki, T., Nakatsuka, T., Dohra, H., Yamagishi, M., Matsuyama, K., et al. (2016). RNA-Seq-based evaluation of bicolor tepal pigmentation in Asiatic hybrid lilies (Lilium spp.). BMC Genomics 17 (1), 1–19. doi: 10.1186/s12864-016-2995-5
Takagi, H., Abe, A., Yoshida, K., Kosugi, S., Natsume, S., Mitsuoka, C., et al. (2013). QTL-seq: rapid mapping of quantitative trait loci in rice by whole genome resequencing of DNA from two bulked populations. Plant J. 74 (1), 174–183. doi: 10.1111/tpj.12105
Tanaka, Y., Sasaki, N., Ohmiya, A. (2008). Biosynthesis of plant pigments: anthocyanins, betalains and carotenoids. Plant J. 54 (4), 733–749. doi: 10.1111/j.1365-313X.2008.03447.x
Telias, A., Lin-Wang, K., Stevenson, D. E., Cooney, J. M., Hellens, R. P., Allan, A. C., et al. (2011). Apple skin patterning is associated with differential expression of MYB10. BMC Plant Biol. 11 (1), 1–15. doi: 10.1186/1471-2229-11-93
Tirumalai, V., Swetha, C., Nair, A., Pandit, A., Shivaprasad, P. V. (2019). miR828 and miR858 regulate VvMYB114 to promote anthocyanin and flavanol accumulation in grapes. J. Exp. Bot. 70 (18), 4775–4792. doi: 10.1093/jxb/erz264
Wang, K., Li, M., Hakonarson, H. (2010). ANNOVAR: functional annotation of genetic variants from high-throughput sequencing data. Nucleic Acids Res. 38 (16), e164–e164. doi: 10.1093/nar/gkq603
Wu, X., Gong, Q., Ni, X., Zhou, Y., Gao, Z. (2017). UFGT: the key enzyme associated with the petals variegation in Japanese apricot. Front. Plant Sci. 8, 108. doi: 10.3389/fpls.2017.00108
Wu, R., Wang, T., McGie, T., Voogd, C., Allan, A. C., Hellens, R. P., et al. (2014). Overexpression of the kiwifruit SVP3 gene affects reproductive development and suppresses anthocyanin biosynthesis in petals, but has no effect on vegetative growth, dormancy, or flowering time. J. Exp. Bot. 65 (17), 4985–4995. doi: 10.1093/jxb/eru264
Xue, Q., Zhang, X., Yang, H., Li, H., Lv, Y., Zhang, K., et al. (2021). Transcriptome and metabolome analysis unveil anthocyanin metabolism in pink and red testa of peanut (Arachis hypogaea L.). Int. J. Genomics 2021. doi: 10.1155/2021/5883901
Yamagishi, M., Sakai, M. (2020). The microRNA828/MYB12 module mediates bicolor pattern development in Asiatic hybrid lily (Lilium spp.) flowers. Front. Plant Sci. 11, 590791. doi: 10.3389/fpls.2020.590791
Yin, D., Ji, C., Ma, X., Li, H., Zhang, W., Li, S., et al. (2018). Genome of an allotetraploid wild peanut arachis monticola: a de novo assembly. Gigascience 7 (6), giy066. doi: 10.1093/gigascience/giy066
Zhang, K., Yuan, M., Xia, H., He, L., Ma, J., Wang, M., et al. (2022). BSA−seq and genetic mapping reveals AhRt2 as a candidate gene responsible for red testa of peanut. Theor. Appl. Genet. 135(5),1529–1540. doi: 10.1007/s00122-022-04051-w
Zhao, Y., Ma, J., Li, M., Deng, L., Li, G., Xia, H., et al. (2020). Whole-genome resequencing-based QTL-seq identified AhTc1 gene encoding a R2R3-MYB transcription factor controlling peanut purple testa colour. Plant Biotechnol. J. 18 (1), 96–105. doi: 10.1111/pbi.13175
Keywords: variegated testa color, BSA-seq, peanut (Arachis hypogaea L), genetic mapping, marker- assisted selection
Citation: Chen H, Yang X, Xu R, Chen X, Zhong H, Liu N, Huang L, Luo H, Huai D, Liu W, Chen Y, Chen J and Jiang H (2023) Genetic mapping of AhVt1, a novel genetic locus that confers the variegated testa color in cultivated peanut (Arachis hypogaea L.) and its utilization for marker-assisted selection. Front. Plant Sci. 14:1145098. doi: 10.3389/fpls.2023.1145098
Received: 15 January 2023; Accepted: 27 February 2023;
Published: 20 March 2023.
Edited by:
Chuanzhi Zhao, Shandong Academy of Agricultural Sciences, ChinaReviewed by:
Quanxi Sun, Shandong Peanut Research Institute (CAAS), ChinaShengzhong Zhang, Shandong Peanut Research Institute (CAAS), China
Copyright © 2023 Chen, Yang, Xu, Chen, Zhong, Liu, Huang, Luo, Huai, Liu, Chen, Chen and Jiang. This is an open-access article distributed under the terms of the Creative Commons Attribution License (CC BY). The use, distribution or reproduction in other forums is permitted, provided the original author(s) and the copyright owner(s) are credited and that the original publication in this journal is cited, in accordance with accepted academic practice. No use, distribution or reproduction is permitted which does not comply with these terms.
*Correspondence: Hao Chen, YnVsbG5ldF8xOTg1QDE2My5jb20=; Huifang Jiang, cGVhbnV0bGFiQG9pbGNyb3BzLmNu
†These authors have contributed equally to this work