 Hualin Nie1†
 Moonkyo Kim2,3†
 Sanghee Lee1,4
 Sohee Lim1Mi Sun Lee2Ju Hyeok Kim2Sol Ji Noh5Seong Won Park5
 Sang-Tae Kim6
 Ah-Young Shin1,7*
 Yi Lee2*
 Suk-Yoon Kwon1,4*
- 1Plant Systems Engineering Research Center, Korea Research Institute of Bioscience and Biotechnology, Daejeon, Republic of Korea
- 2Department of Industrial Plant Science and Technology, Chungbuk National University, Cheongju, Republic of Korea
- 3Division of Life Science, Korea Polar Research Institute, Incheon, Republic of Korea
- 4Biosystems and Bioengineering Program, Korea Research Institute of Bioscience and Biotechnology (KRIBB) School of Biotechnology, University of Science and Technology, Daejeon, Republic of Korea
- 5Watermelon and Strawberry Research Institute, Chungcheongbuk-do Agricultural Research and Extension Services, Cheongju, Republic of Korea
- 6Department of Medical and Biological Sciences, Catholic University of Korea, Bucheon, Republic of Korea
- 7Department of Bioinformatics, Korea Research Institute of Bioscience and Biotechnology (KRIBB) School of Bioscience, University of Science and Technology, Daejeon, Republic of Korea
The unique color and type characteristics of watermelon fruits are regulated by many molecular mechanisms. However, it still needs to be combined with more abundant genetic data to fine-tune the positioning. We assembled genomes of two Korean inbred watermelon lines (cv. 242-1 and 159-1) with unique color and fruit-type characteristics and identified 23,921 and 24,451 protein-coding genes in the two genomes, respectively. To obtain more precise results for further study, we resequenced one individual of each parental line and an F2 population composed of 87 individuals. This identified 1,539 single-nucleotide polymorphisms (SNPs) and 80 InDel markers that provided a high-density genetic linkage map with a total length of 3,036.9 cM. Quantitative trait locus mapping identified 15 QTLs for watermelon fruit quality-related traits, including β-carotene and lycopene content in fruit flesh, fruit shape index, skin thickness, flesh color, and rind color. By investigating the mapping intervals, we identified 33 candidate genes containing variants in the coding sequence. Among them, Cla97C01G008760 was annotated as a phytoene synthase with a single-nucleotide variant (A → G) in the first exon at 9,539,129 bp of chromosome 1 that resulted in the conversion of a lysine to glutamic acid, indicating that this gene might regulate flesh color changes at the protein level. These findings not only prove the importance of a phytoene synthase gene in pigmentation but also explain an important reason for the color change of watermelon flesh.
Introduction
Watermelon (Citrullus lanatus, 2n = 2x = 22), originally from South Africa, is an edible fruit crop belonging to the family Cucurbitaceae (Bae et al., 2020) that is rich in lycopene, citrulline, vitamin C, and other essential micronutrients and vitamins (Dubey et al., 2021). Humans have domesticated and grown watermelons for 4,000 years (Paris, 2015). Although the original wild watermelon had small fruit (about 0.2 kg) with watery, hard-textured, pale-colored, and bland or bitter-tasting flesh, common watermelons have become sweet and savory after centuries of improvement (Paris, 2015; Guo et al., 2019; Chomicki et al., 2020). There are now more than 1,200 watermelon varieties worldwide with fruits of various sizes, shapes, rind patterns, and flesh colors (Perkins-Veazie et al, 2012; Porcher et al., 2013). According to the characteristics of their fruit, watermelons can be divided into three cultivar groups: Citroides (“Red-Seeded” preserving melon, red-seeded citron), Lanatus (Tsamma, Kalahari, South-African, and wild watermelons), and Vulgaris (commonly cultivated watermelon) (Guo et al., 2019).
The color of watermelon flesh is closely related to the carotenoid composition and can be defined as white, pale yellow, canary yellow, salmon yellow, orange, crimson red (red), scarlet red, or green (Zhao et al., 2013). In watermelons with red, pink, or scarlet flesh, lycopene accounts for 70%–90% of the total carotenoids (Perkins-Veazie et al., 2006; Nadeem et al., 2022). Watermelons with yellow flesh have high levels of xanthophylls (mainly neoxanthin, violaxanthin, and neochrome) (Bang et al., 2010; Liu et al., 2012). Watermelons with orange flesh have much more β-carotene, ζ-carotene, and prolycopene than other pigments (Tadmor et al., 2005). White-flesh watermelons have almost no pigment and only contain trace amounts of phytofluene (Wang et al., 2019). These differences in carotenoid composition are likely due to molecular variation in the processes of carotenoid biosynthesis and accumulation. In addition to flesh colors, a variety of watermelon rind colors are highly desirable to consumers, and breeders place considerable emphasis on this trait. The rind coloration of watermelon is affected by chlorophylls and carotenoids that are synthesized in plant plastids from metabolic precursors provided by the methylerythritol 4-phosphate (MEP) pathway (Simpson et al., 2016; Liu et al., 2020; Ma et al., 2021). The rind colors are likely to be influenced by the same or similar molecular mechanisms that influence the flesh colors (Liu et al., 2020; Xiao et al., 2022). Other traits that are important for watermelon quality include the shape, weight, firmness, and diameter of the fruit. Many previous studies have applied genetic mapping and gene prediction to investigate these unique traits in watermelons (Sandlin et al., 2012; Guo et al., 2015; Liu et al., 2020; Sun et al., 2020).
Several watermelon genomes have been assembled for functional genomics studies and genetic improvement. A non-bitter, white-fleshed Sudanese Kordofan melon (C. lanatus subsp. Cordophanus) assembled in 2019 appears to be the most closely related ancestor of the domesticated watermelon (Renner et al., 2021). The first high-quality assembled genome sequence of domesticated watermelon was released in 2013 as a result of comprehensive genomic and transcriptomic analyses of the East Asian watermelon cultivar 97103, which contains preferentially selected genomic regions and has lost many disease-resistant genes during domestication (Guo et al., 2013). Subsequently, Wu et al. (2019) created a high-quality genome assembly of a principal American cultivar, Charleston Gray, and conducted a comparative analysis of the Charleston Gray and 97103 genomes. Deng et al. (2022) recently completed assembly of the telomere-to-telomere gap-free genome G42 using high-coverage and accurate long-read sequencing data. These genomic resources were developed to study the evolution, domestication, and genotyping of watermelons. In addition, resequencing analyses have further improved capabilities to identify single-nucleotide polymorphisms (SNPs), simple sequence repeats, and InDels that can be used as co-dominant markers to determine the genotypes of watermelon populations (Rhee et al., 2015).
Watermelon cultivars 242-1 and 159-1 have been bred in the Chungcheongbuk-do Agricultural Research and Extension Services (Cheongju, Korea), which have unique characteristics of color and fruit type: 242-1 has orange flesh, black rind, and oval shape, whereas 159-1 has red flesh, yellow rind, and round shape. To provide more genetic information about watermelon cultivars with unique flesh colors, we assembled the genomes of cultivars 242-1 and 159-1 using Nanopore long-read sequencing and Illumina short-read sequencing. We then resequenced the whole genomes of F2 population to construct a high-density genetic map and perform quantitative trait locus (QTL) analysis. Finally, we investigated the mapped QTL regions to identify candidate genes associated with flesh quality-related traits, including lycopene, β-carotene, flesh color, skin color, skin thickness, and fruit shape index. Our results provide a basis for candidate gene selection, annotation, and functional verification to elucidate the genetics of valuable traits and contribute to the development of breeding strategies based on molecular markers.
Materials and methods
Plant materials and DNA sequencing
We selected the Korean inbred watermelon cultivars 242-1 and 159-1 as experimental materials because of their differential characteristics (Figure 1). Seeds of the 242-1 and 159-1 cultivars were kindly provided by Chungcheongbuk-do Agricultural Research and Extension Services (ASES; Cheongju, Korea). For DNA sequencing, seeds were planted in the ASES experimental field and harvested on day 80 of cultivation.
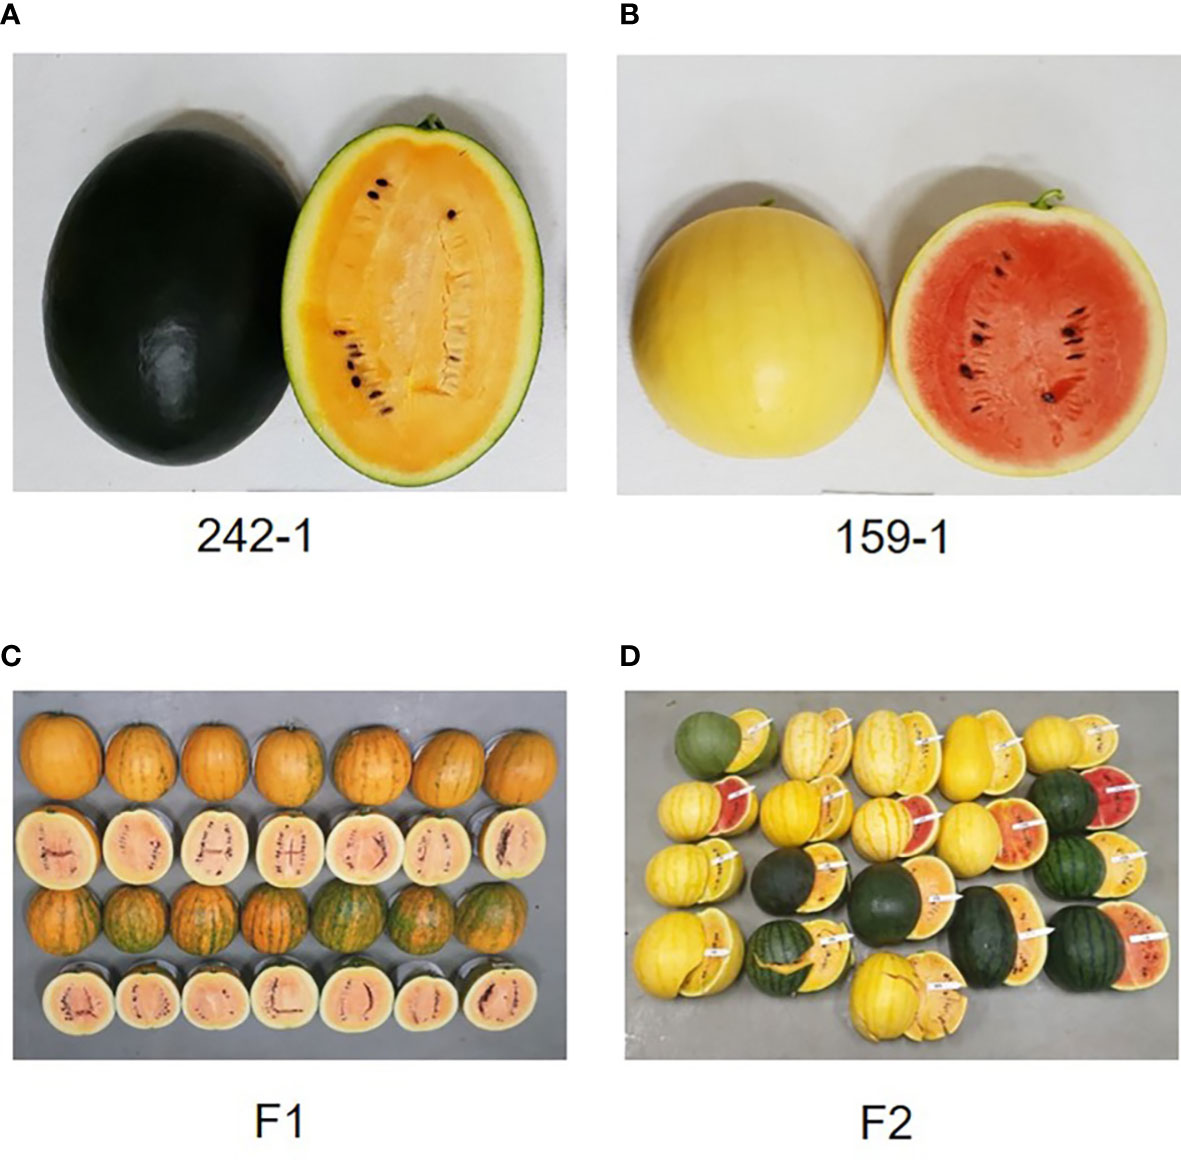
Figure 1 Morphological characteristics of the inbred parental lines and F1 and F2 individuals. (A, B) Fruits of parental cultivars 242-1 (A) and 159-1 (B). (C) Fruits of F1 hybrids are round with striped rind and yellow flesh color. (D) Fruits of F2 individuals produced by self-pollination of F1 individuals. The F2 generation segregated into various rind colors (dark green, black, and mixture of black and dark green) and flesh colors (red, orange, and mixture of red and orange).
For genome assembly, high–molecular weight genomic DNA was isolated from the fresh young leaf tissues of 242-1 and 159-1 plants by performing a nuclei isolation step according to previous protocols (Zerpa-Catanho et al., 2021). Libraries for long-read sequencing were prepared by end-repair and dA-tailing, ligation, and purified-ligated DNA purification using NEBNext® Ultra™ II End Repair/dA-Tailing Module (cat. no. E7546, New England Biolabs, Ipswich, MA, USA), NEBNext® Quick Ligation Module (cat. no. E6056, New England Biolabs), and Ligation Sequencing Kit [cat. no. SQK-LSK109, Oxford Nanopore Technologies Co. (ONT), Oxfordshire, UK], respectively, according to recommendations by ONT. MinION sequencing was performed as per the manufacturer’s guidelines using R9.4 SpotON Flow Cell (cat. no. FLO-MIN106) and controlled using ONT MinKOW software (ONT). For short-read sequencing, genomic DNA paired-end (PE) and mate-pair (MP) libraries were constructed with 350–800, 550–800, and 600–800 bp insert sizes using the NEBNext Ultra DNA Library Prep Kit (New England Biolabs) and with 2- and 5-kb insert sizes using the Nextera Mate Pair Kit (Illumina, San Diego, CA, USA), respectively. The PE and MP libraries were sequenced at DNACARE Co. (Seoul, Korea)
Genome assembly and pseudomolecule construction
We used the Trimmomatic v0.38 tool to check the quality of the Nanopore long-read sequences and delete the adapters, low-quality reads (reads that contained “N” as more than 10% of the nucleotides), and duplicated reads. The clean PE reads were assembled using the NextDenovo v2.5.0 software with the default parameters. The reads were mapped to an initial assembly using Minimap2 v2.17 with the options “–MD -ax map-ont -t 20 -L” and then sorted using SAMtools v1.16.1 software (Li et al., 2009). The raw assembly was polished with the short-reads from Illumina sequencing in three rounds using NextPolish v1.4.0 software (Hu et al., 2020). Then, haplotigs were removed using PurgeHaplotigs (Roach et al., 2018) with the default parameters. Finally, we validated the genome assemblies using the Benchmarking Universal Single-Copy Ortholog (BUSCO) v4.1.4 software (Simão et al., 2015) with 1,614 Nb of BUSCO markers in Embryophyta (odb10).
The assembled genome sequences were separated into chromosomal units corresponding to the reference sequence for C. lanatus cultivar 97103 (http://cucurbitgenomics.org/organism/1 ) using the NUCMER 4 program (Marçais et al., 2018). Anchoring was performed to determine the order and orientation of sequences within the chromosome. Pseudomolecules were constructed using an in-house perl script, and 100 N’s were artificially inserted between contigs to complete the sequence of each chromosome unit. The assembled pseudomolecules were then used for nucmer alignment with the 97103 reference genome, and a dot plot was generated using mummerplot to finally confirm the completeness of the pseudomolecules.
Genome annotation, gene prediction, and functional annotation
The process of genome annotation was divided into three parts: repeat annotation, structural annotation, and functional annotation (Supplementary Figure S1). Repeat annotation was performed using a homology-based method and a de novo method in parallel. Homology-based repeat annotation was performed using RepeatMasker v4.0.3 (Tarailo-Graovac and Chen, 2009) with the plant repeat database PlantsRep (http://www.plantrep.cn/ ) (Luo et al., 2022). For de novo repeat annotation, RepeatModeler v1.0.8 (Flynn et al., 2020) was used to predict de novo repeats from the assembled genome sequence and construct a RepeatMasker library for further analysis. The results of the two repeat analyses were integrated, and the repetitive regions in the genome sequences were masked using bedtools maskfasta (Quinlan and Hall, 2010).
We downloaded and analyzed the Illumina short-read transcripts of five tissues (flesh, SRR10389406; leaf, SRR3156561; light green rind, SRR10803496; root, SRR12079410; and shoot apex, SRR3156569) of watermelon (Citrullus lanantus) from NCBI SRA database (https://www.ncbi.nlm.nih.gov/sra ) (Wang et al., 2021). We trimmed the raw RNA sequence using the trimmomatic v0.39 to obtain transcript sequences with an average phred quality score of at least 30 and a minimum length of 50 bp. By removing the Illumina adapter sequences, a total of 27 Gb of paired high-quality nucleotide sequences were obtained for annotation. Gene model predictions for structural annotation were made using the PASA v2.5.1 program (Haas et al, 2003) based on de novo transcript assemblies generated with the Trinity v2.8.6 program (Haas et al, 2013) and mapped-region information for RNA-seq short-read data generated with the StringTie v2.0.4 program (Kovaka et al., 2019). In addition, 22,596 protein sequences from the 97103 reference genome were mapped by the protein2genome method in the Exonerate v2.2.0 program and used for gene prediction (Slater and Birney, 2005). Finally, all prediction results (ab initio, transcript-based, and protein alignment) were merged to generate a non-redundant original gene set in Evidence Modeler (Haas et al., 2008).
Functional annotation of the gene set was performed by querying the protein sequences against the RefSeq (4,416,162 sequences; https://www.ncbi.nlm.nih.gov/refseq/ ), UniProt (557,491 sequences; https://www.uniprot.org ), and The Arabidopsis Information Resource (TAIR) (48,359 sequences; https://www.arabidopsis.org ) databases with an e-value cutoff of 1e−4. Analyses of conserved protein domains, gene ontology, and pathways were performed using the InterProScan program (Jones et al., 2014) and the Pfam, Gene Ontology, and Kyoto Encyclopedia of Genes and Genomes (KEGG) databases. Gene expression information was obtained for regions with FPKM values greater than 0.5 in the integrated gene model based on the watermelon RNA-seq maps.
Fruit phenotype analysis
The 242-1 and 159-1 watermelon cultivars were used as maternal and paternal lines, respectively, to produce F1 and F2 progeny. The F1 hybrid was produced by the crossing cultivars 242-1 and 159-1. The F2 plants were subsequently produced by self-pollination of an F1 plant and used for whole-genome sequencing analysis, genetic linkage mapping, QTL mapping, and phenotyping of fruit-related traits.
The β-carotene and lycopene of F2 individuals were extracted from freeze-dried watermelon flesh according to the method described by Lee et al. (2022). Briefly, 0.1 g of finely crushed watermelon sample was added to 1 ml of ethanol containing 0.5 mM butylated hydroxytoluene and mixed carefully. Then, 3 ml of petroleum ether was added and vortexed, followed by 8 ml of 20% NaCl and additional vortexing for 1 min. After centrifugation at 3,000 rpm for 10 min, the supernatant was collected, and 1:1 (v/v) Na2SO4 was added and mixed. Finally, the sample was filtered with a 13-mm 0.2-μm Polytetrafluoroethylene (PTFE) Syringe Filter (Advantec Co., Tokyo, Japan) for analysis. Lycopene content was determined with an UltiMate 3000RS High performance liquid chromatography (HPLC) system (Thermo Fisher Scientific Inc.) equipped with a Kinetex 2.6-µm C18 100A reversed-phase column 100 × 4.60 mm (Phenomenex, Torrance, CA, USA), using 78% methanol for phase A and 100% ethyl acetate for phase B at a flow rate of 1 ml/min. The separation conditions were as follows: 0–8 min, 70% solution B; 8–10 min, 60% solution B; 10–12 min, 100% solution B; 12–14.01 min, 0% solution B; and 14.01–20 min, 100% solution B. Trans-lycopene (Sigma-Aldrich, St. Louis, MO, USA) and β-carotene (Sigma-Aldrich) were used as quantitative standards. Lycopene and β-carotene were quantified in the samples by measuring absorbance at 450 and 660 nm. The flesh color and rind color were expressed as red, green, and blue values using a Red-Green-Blue image analysis system (Aït-Aissa et al., 2018). Descriptive statistics and other statistical analyses were evaluated using SPSS v18.0 software (SPSS Inc., Chicago, IL, USA).
Whole-genome sequencing of F2 populations and raw variant calling
For whole-genome resequencing, total genomic DNA was isolated from fresh young leaf tissues of F2 plants and two parental plants (242-1 and 159-1) using the DNeasy Mini Kit (QIAGEN, Hilden, Germany). DNA samples were combined using different barcode adapters (5 μl each) and purified using the QIAquick PCR Purification Kit (cat. no. 28104, QIAGEN) according to the manufacturer’s instructions. A 150-bp PE library with an insert size of 350 bp was constructed for each individual plant using the NEBNext Ultra DNA Library Prep Kit (New England Biolabs). The qualified libraries were sequenced using an Illumina Hi Seq 2500 platform to produce 150-bp PE reads. Quality trimming was performed with the sliding window (4:20), average quality (20), and minimum read size (36) options in the Trimmomatic v 0.38 program. The trimmed reads were aligned to the 242-1 genome (female) using BWA-MEM aligner. After correcting the map file information using Picard and GATK codebases, a variant call was performed to generate SNP and InDel information for each sample. To select high-quality SNPs, variants with biallelic extraction, depth of coverage < 10, genotype quality < 30, or missing rate < 10% were removed. A total of 36,632 contigs were created for the 242-1 cultivar, and candidate InDel loci were compared to corresponding loci in the 159-1 cultivar. We selected InDel loci with a variant ratio > 0.8, InDel size > 30 bp, and number of reads > 20 for more accurate genotyping.
High-resolution mapping and QTL analysis of qualitative traits
A genetic map was constructed using the IciMapping v4.2 software (Institute of Crop Science Chinese Academy of Agricultural Sciences, Beijing, China) according to the following process: binning to remove duplicate markers, placing markers in linkage groups, ordering markers within linkage groups, and adjusting marker intervals within linkage groups (Meng et al., 2015). Markers were first filtered out by comparison of the offspring genotype distribution with the expected Mendelian proportions (1:2:1). A default value of data tolerance based on the X2 test (p < 0.05) was used to discard highly separated markers. Then, markers were grouped using a maximum threshold recombination fraction value of 0.3. The recombination frequency was converted to map distance by Kosambi mapping (Kosambi, 2016). QTL analysis was performed using the IciMapping v4.2 software (Meng et al., 2015) with the inclusive composite interval mapping method. The logarithm of the odds (LOD) threshold was analyzed by the permutation method with 1,000 repeats to limit the type I error to 0.05 or less.
Results
Genome sequencing and assembly
We assembled and annotated a complete genome for Korean inbred watermelon cultivars 242-1 and 159-1 (Supplementary Figure S1). Nanopore long-read sequencing and Illumina short-read sequencing generated 7.7 Gb (22× coverage) and 8.6 Gb (25× coverage) long-read sequences and 15.6 Gb (44.6× coverage) and 14.1 Gb (40.3× coverage) high-quality trimmed short-read sequences for the 242-1 and 159-1 cultivars, respectively (Supplementary Table S1). The assembled long-read sequences of cultivars 242-1 and 159-1 had total lengths of 361.7 and 362.1 Mb, containing 43 and 103 initial contigs with N50 lengths of 16.0 and 6.3 Mb, respectively (Table 1). Pseudomolecules were constructed at the chromosome level based on the C. lanatus 97103 genome. Initial contigs were assembled de novo and clustered into 11 chromosomes ranging in length from 24.4 to 37.8 Mb for the 242-1 cultivar and 26.7 Mb to 37.9 Mb for the 159-1 cultivar (Supplementary Table S2). The lengths of most of the assembled chromosomes were very similar between 242-1 and 159-1, except that chromosome 4 of cultivar 242-1 was 24.4 Mb, which was about 2.7 Mb shorter than that of C. lanatus 97103 and about 2.3 Mb shorter than that of cultivar 159-1. We also used long-read sequencing to assemble the chloroplast genomes of cultivars 242-1 and 159-1, which provided new usable genetic information (Supplementary Figure S2).
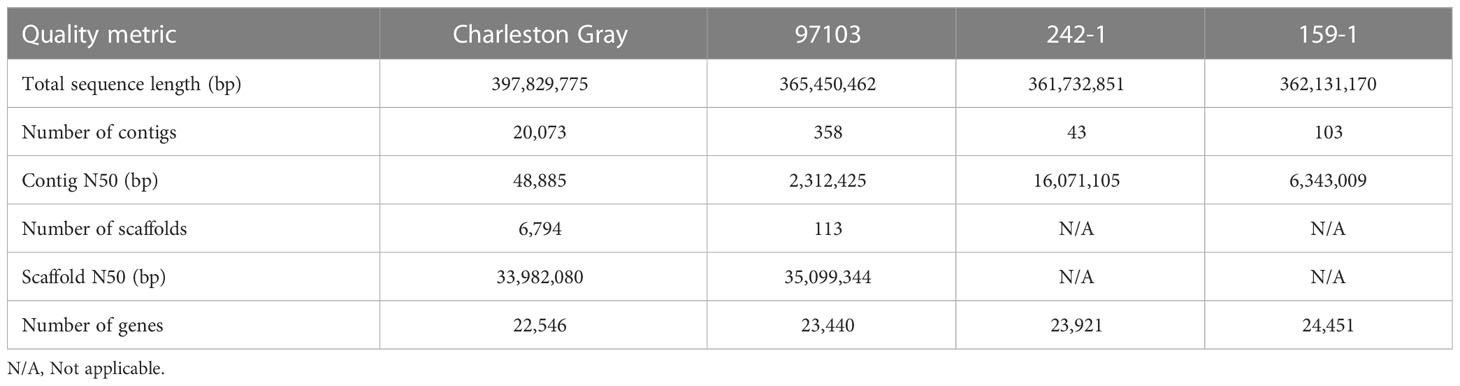
Table 1 Comparison of the two assembled genomes (242-1 and 159-1) with two reference watermelon genomes (Charleston Gray and 97103).
We assessed the completeness of the genome assemblies by aligning published RNA-seq reads and performing BUSCO analysis. The full-length Illumina short-read transcripts of five watermelon tissues (flesh, SRR10389406; leaf, SRR3156561; light green rind, SRR10803496; root, SRR12079410; and shoot apex, SRR3156569) were aligned to the genome sequences of 242-1 and 159-1 (Wang et al., 2021). The results showed that more than 83.2% of the full-length transcripts could be mapped to the retained reads (Supplementary Table S3). A total of 1,548 (95.9%) and 1,547 (95.8%) BUSCOs were detected in the assembled genome of cultivars 242-1 and 159-1, respectively, indicating equivalent assembly quality compared to other assembled watermelon genomes (Figure 2C; Supplementary Table S4). The assembled genomes had similar chromosome synteny with the 97103 reference genome, which was expected given that the 242-1 and 159-1 pseudochromosomes were generated according to the genes and sequence of the 97103 genome. We found a high number of syntenic blocks in most of the chromosomes, except for chromosome 4. The syntenic blocks between the 242-1 assembly and the 97103 genome had different patterns in chromosome 4 (Supplementary Figure S3). Whole-genome nucleotide alignment showed that both assembled genomes aligned closely with the 97103 reference genome (Supplementary Figure S4, S5).
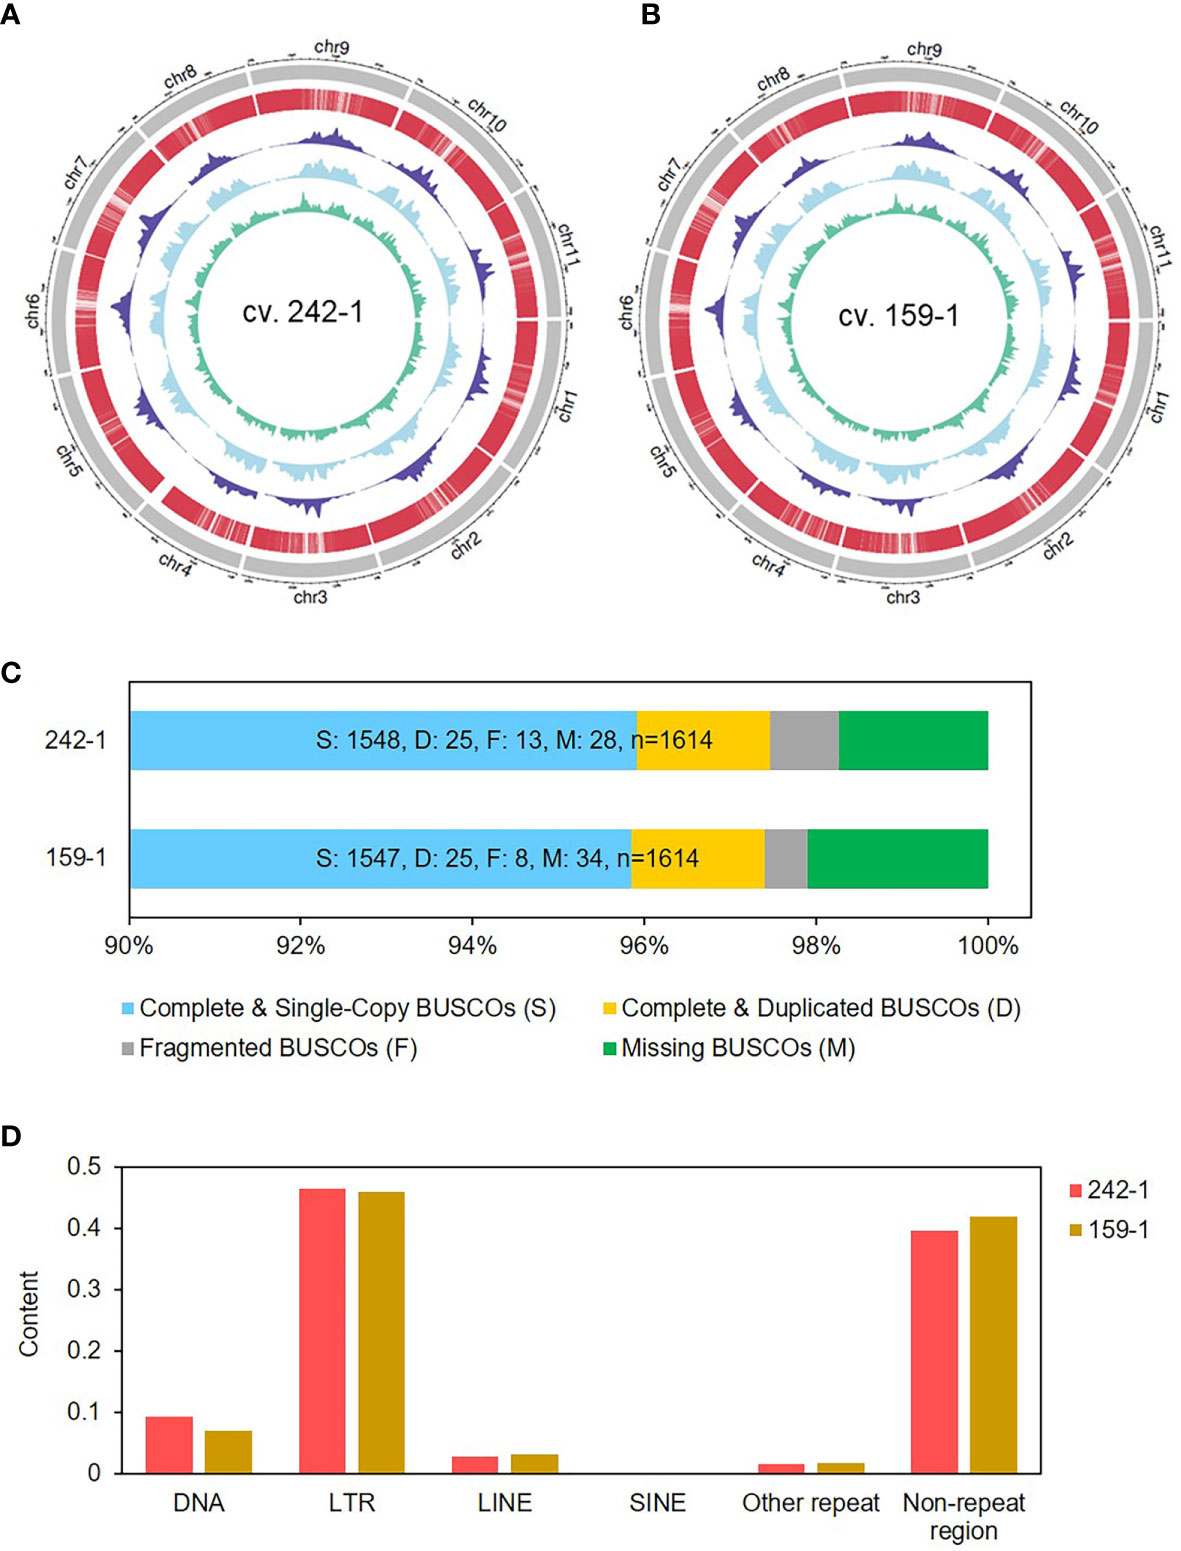
Figure 2 Genome characterization of the two inbred parental watermelon lines. (A, B) The outermost circle is the ideogram of 11 chromosomes in Mb scale, enclosing concentric circles of gene distribution (red), Gypsy content (navy blue), Copia content (sky blue), and DNA transposon content (green) in 1-Mb scale. (C) BUSCOs of the assembled watermelon genomes analyzed by using BUSCO v4.1.4 software. (D) Repetitive contents of the watermelon genomes analyzed by Repeat Masker with Repbase.
Repeat sequence annotation and gene prediction
We mapped the distributions of protein-coding genes, long terminal repeat (LTR)/Gypsy and LTR/Copia retrotransposons, and DNA transposons in the genome 242-1 and 159-1 to obtain an overview of the genome organization (Figures 2A, B). Analysis of repeat sequences revealed that the 242-1 and 159-1 assemblies contained 206 Mb (57.6%) and 207 Mb (57.5%) of repeat sequences and only 87 Mb (24.0%) and 86 Mb (24.2%) of assigned genes and gene-related sequences, respectively (Supplementary Figure S6). LTR retrotransposons were the most abundant repeat elements, comprising 46.4% and 45.9% of the 242-1 and 159-1 assemblies, respectively, followed by DNA transposons (9.3% and 7.1%), long interspersed nuclear elements (3.0% and 3.2%; Figure 2D; Supplementary Table S5). Gene annotations of the 242-1 and 159-1 assemblies predicted 23,921 and 24,451 protein-coding genes, respectively (Table 1). Of those, 21,358 (89.3%) in the 242-1 assembly and 21,321 (87.2%) in the 159-1 assembly have putative functional descriptions in public databases (Supplementary Table S6).
Carotenoid biosynthesis-related gene analysis
We compared the expression of protein-coding genes involved in carotenoid biosynthesis between the 242-1 and 159-1 cultivars. Comparison of the Illumina short-read transcripts to annotated sequences in the KEGG database identified 24 genes in the carotenoid biosynthetic pathway that were expressed in 242-1 and 159-1: three phytoene synthases (PSY1, PSY2, and PSY3), three phytoene desaturases (PDS1, PDS2, and PDS3), one ζ-carotene isomerase (Z-ISO), one ζ-carotene desaturase (ZDS), three β-carotene isomerases (CRTISO1, CRTISO2, and CRTISO3), four lycopene cyclases (LCYB1, LCYB2, LCYB/E, and LCYE), two β-carotene hydroxylases (CHYB1 and CHYB2), five zeaxanthin epoxidases (ZEP1, ZEP2, ZEP3, ZEP4, and ZEP5), and two violaxanthin de-epoxidases (VDE1 and VDE2) (Figure 3; Supplementary Table S7). A heatmap of these genes based on FPKM values calculated from the Illumina short-read transcripts showed that upstream genes for phytoene synthesis (PSY1, PSY2, and PSY3) and the downstream genes for zeaxanthin epoxide synthesis (ZEP1, ZEP2, ZEP3, ZEP4, ZEP5, VDE1, and VDE2) in the carotenoid biosynthesis pathway had similar expression in the 242-1 and 159-1 cultivars. By contrast, most of the genes for lycopene synthesis (PDS2, ZDS, and CRTISO1) and carotene synthesis (LCYB1, LCYB/E, and CHYB1) had different expressions between 242-1 and 159-1.
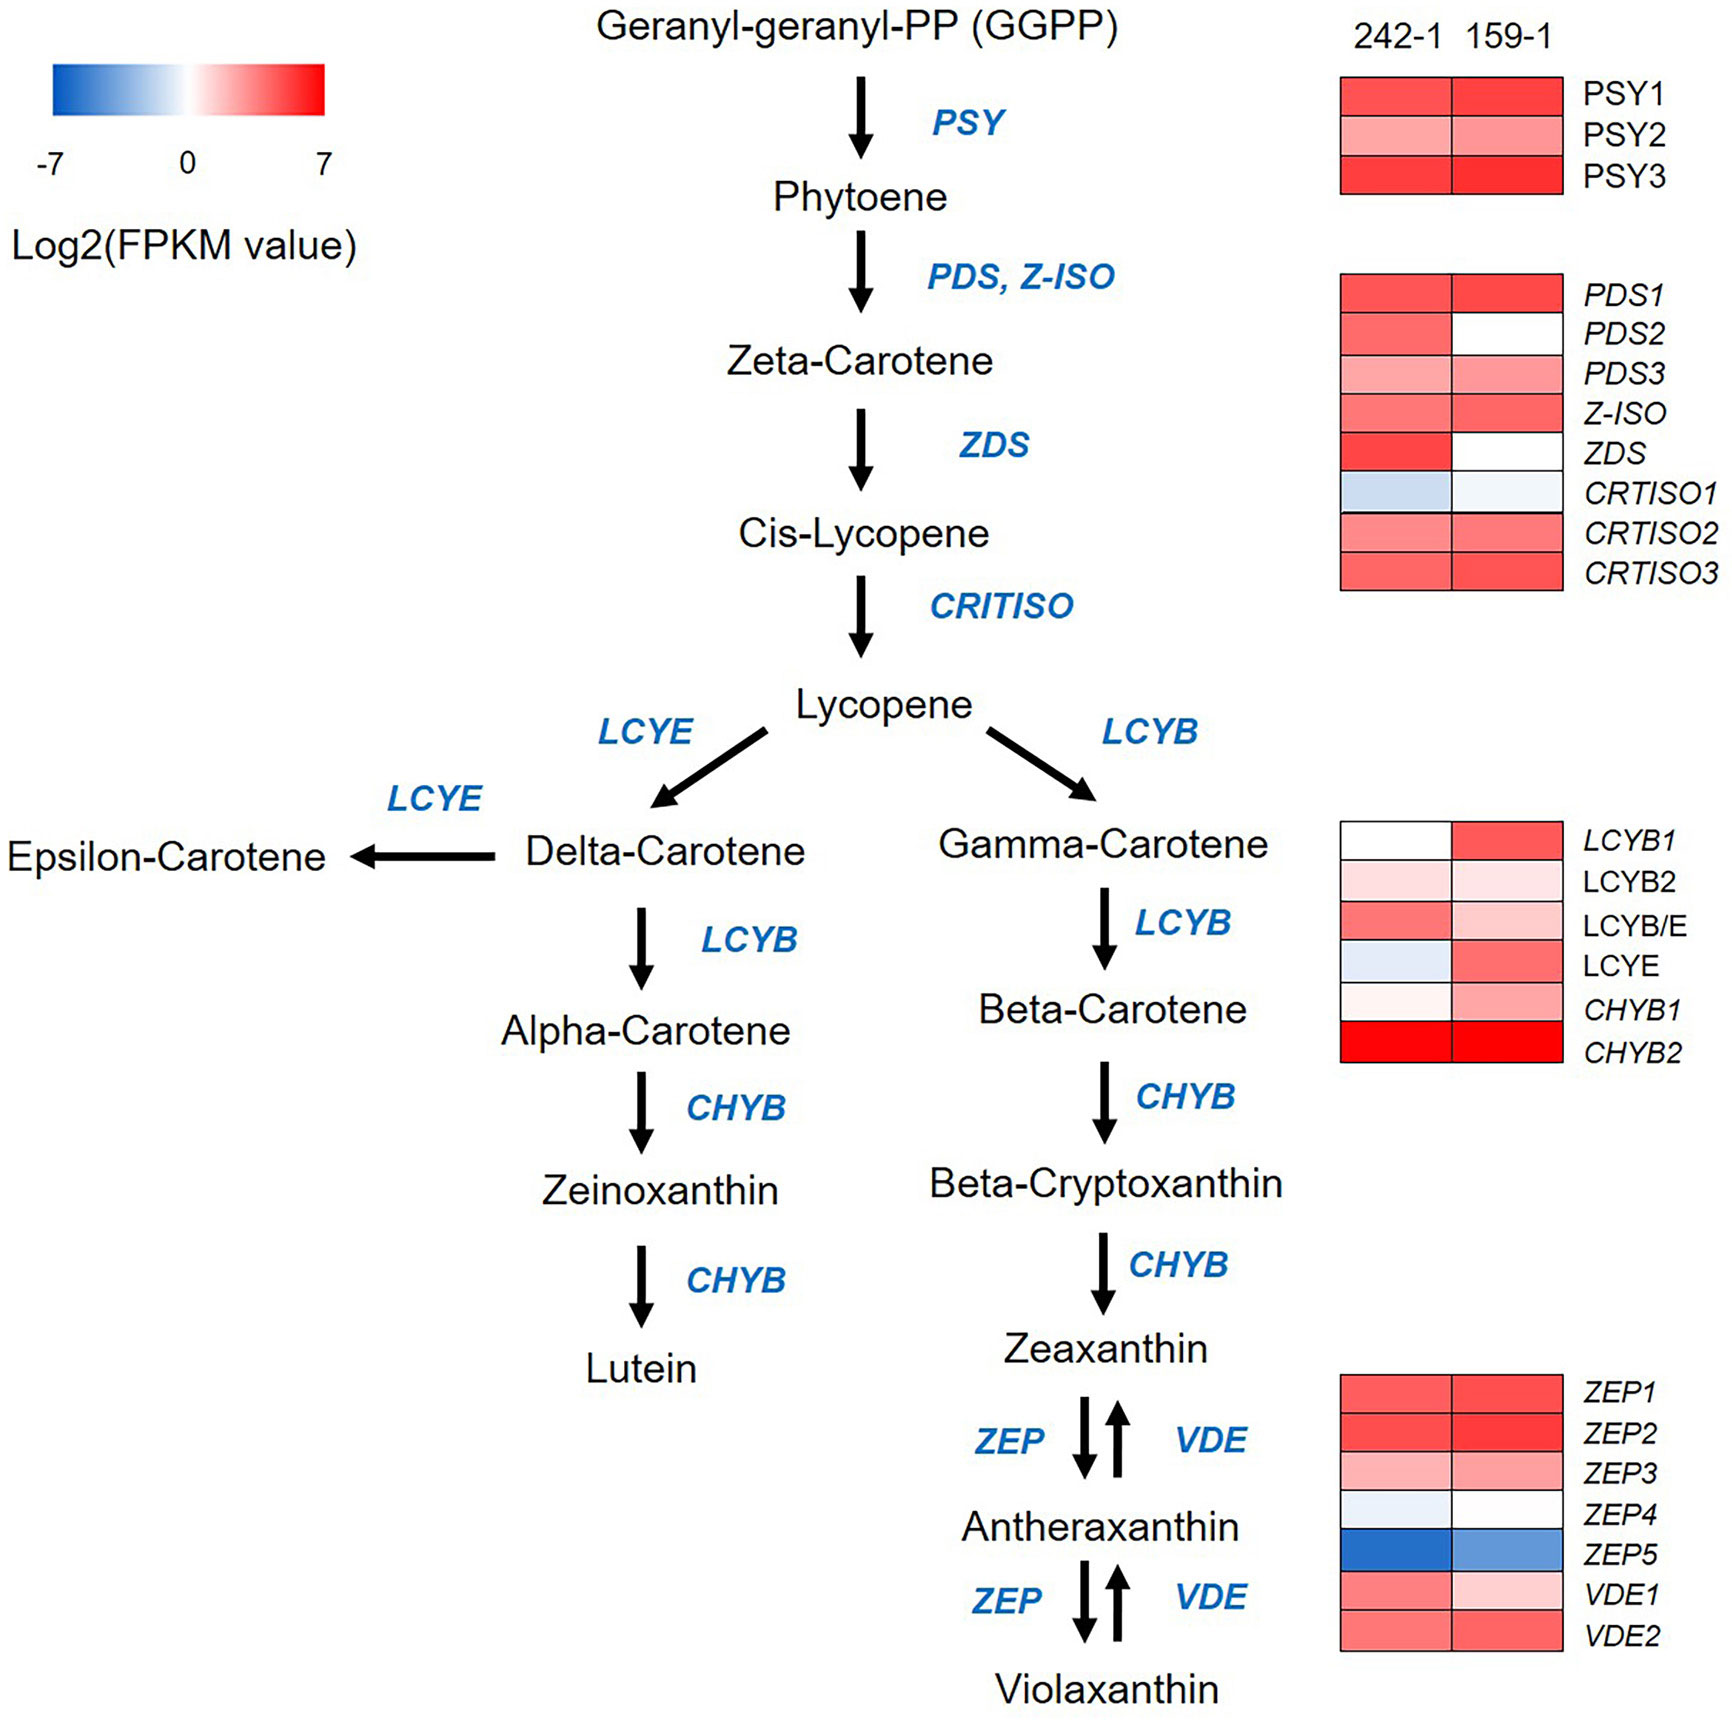
Figure 3 A heatmap diagram of expression levels of carotenoid biosynthetic pathway genes identified by KEGG analysis. The heatmap was drawn according to FPKM values calculated from Illumina short-read transcripts. Columns and rows in the heatmap represent samples and genes, respectively. Sample names are displayed above the heatmap. Color scale indicates fold changes in gene expression. PSY, phytoene synthase; PDS, phytoene desaturase; Z-ISO, zeta-carotene isomerase; CRTISO, beta-carotene isomerase; LCYB, lycopene beta-cyclase; LCYB/E, lycopene beta/epsilon cyclase; LCYE, lycopene epsilon cyclase; ZEP, zeaxanthin epoxidase; VDE, violaxanthin de-epoxidase.
Genotyping and genetic linkage mapping
For genetic linkage mapping, a total of 1.1 Tb of WGS data comprising 7.5 billion reads were generated from the two parental samples (242-1 and 159-1) and the 87 F2 samples (Supplementary Table S8). A total of 2,029,598 raw SNPs and 869,298 InDels were identified among all individuals using VCF tools (Danecek et al., 2011). Of those, 686,357 SNPs and 937 InDels passed through quality filtering (see Materials and Methods; Supplementary Table S9). We selected 140,650 homozygous SNPs by screening for SNPs with the same genotype as the 242-1 (maternal) sequence (AA) and a different genotype than the 159-1 (paternal) sequence (BB). After the linkage maps were subjected to a binning process to remove duplicate markers, a total of 2,319 SNP markers were selected. In addition, a total of 167 InDels were selected and used to genotype the individual samples. These InDel markers were tested by PCR and electrophoresis analysis to confirm the genotypes of 242-1, 159-1, and F1 samples. As a result, 126 InDel markers were finally selected for genotyping of the F2 samples (Supplementary Table S10). On the basis of the electrophoresis bands of the selected InDel markers, each F2 individual was genotyped for each marker as maternal type, paternal type, or F1 type (heterozygous) (Supplementary Figure S7).
A total of 780 (33.6%) SNP markers and 45 (35.7%) InDel markers did not conform to a Mendelian ratio of 1:2:1 in the F2 samples and were discarded. As a result, a total of 1,619 SNP and InDel markers were identified and prepared for genetic linkage mapping (Supplementary Tables S11; Table S12). These markers were sorted into 11 linkage groups (Figure 4), which is consistent with the reported haploid chromosome number of watermelon (Guo et al., 2013). The genetic linkage map spanned 3,036.9 cM, with an average interval of 1.87 cM. The genetic length of each chromosome ranged from 187.37 cM (chromosome 11) to 379.57 cM (chromosome 01), with an average SNP distance of 1.56–2.48 cM (Figure 4 and Supplementary Table S11).
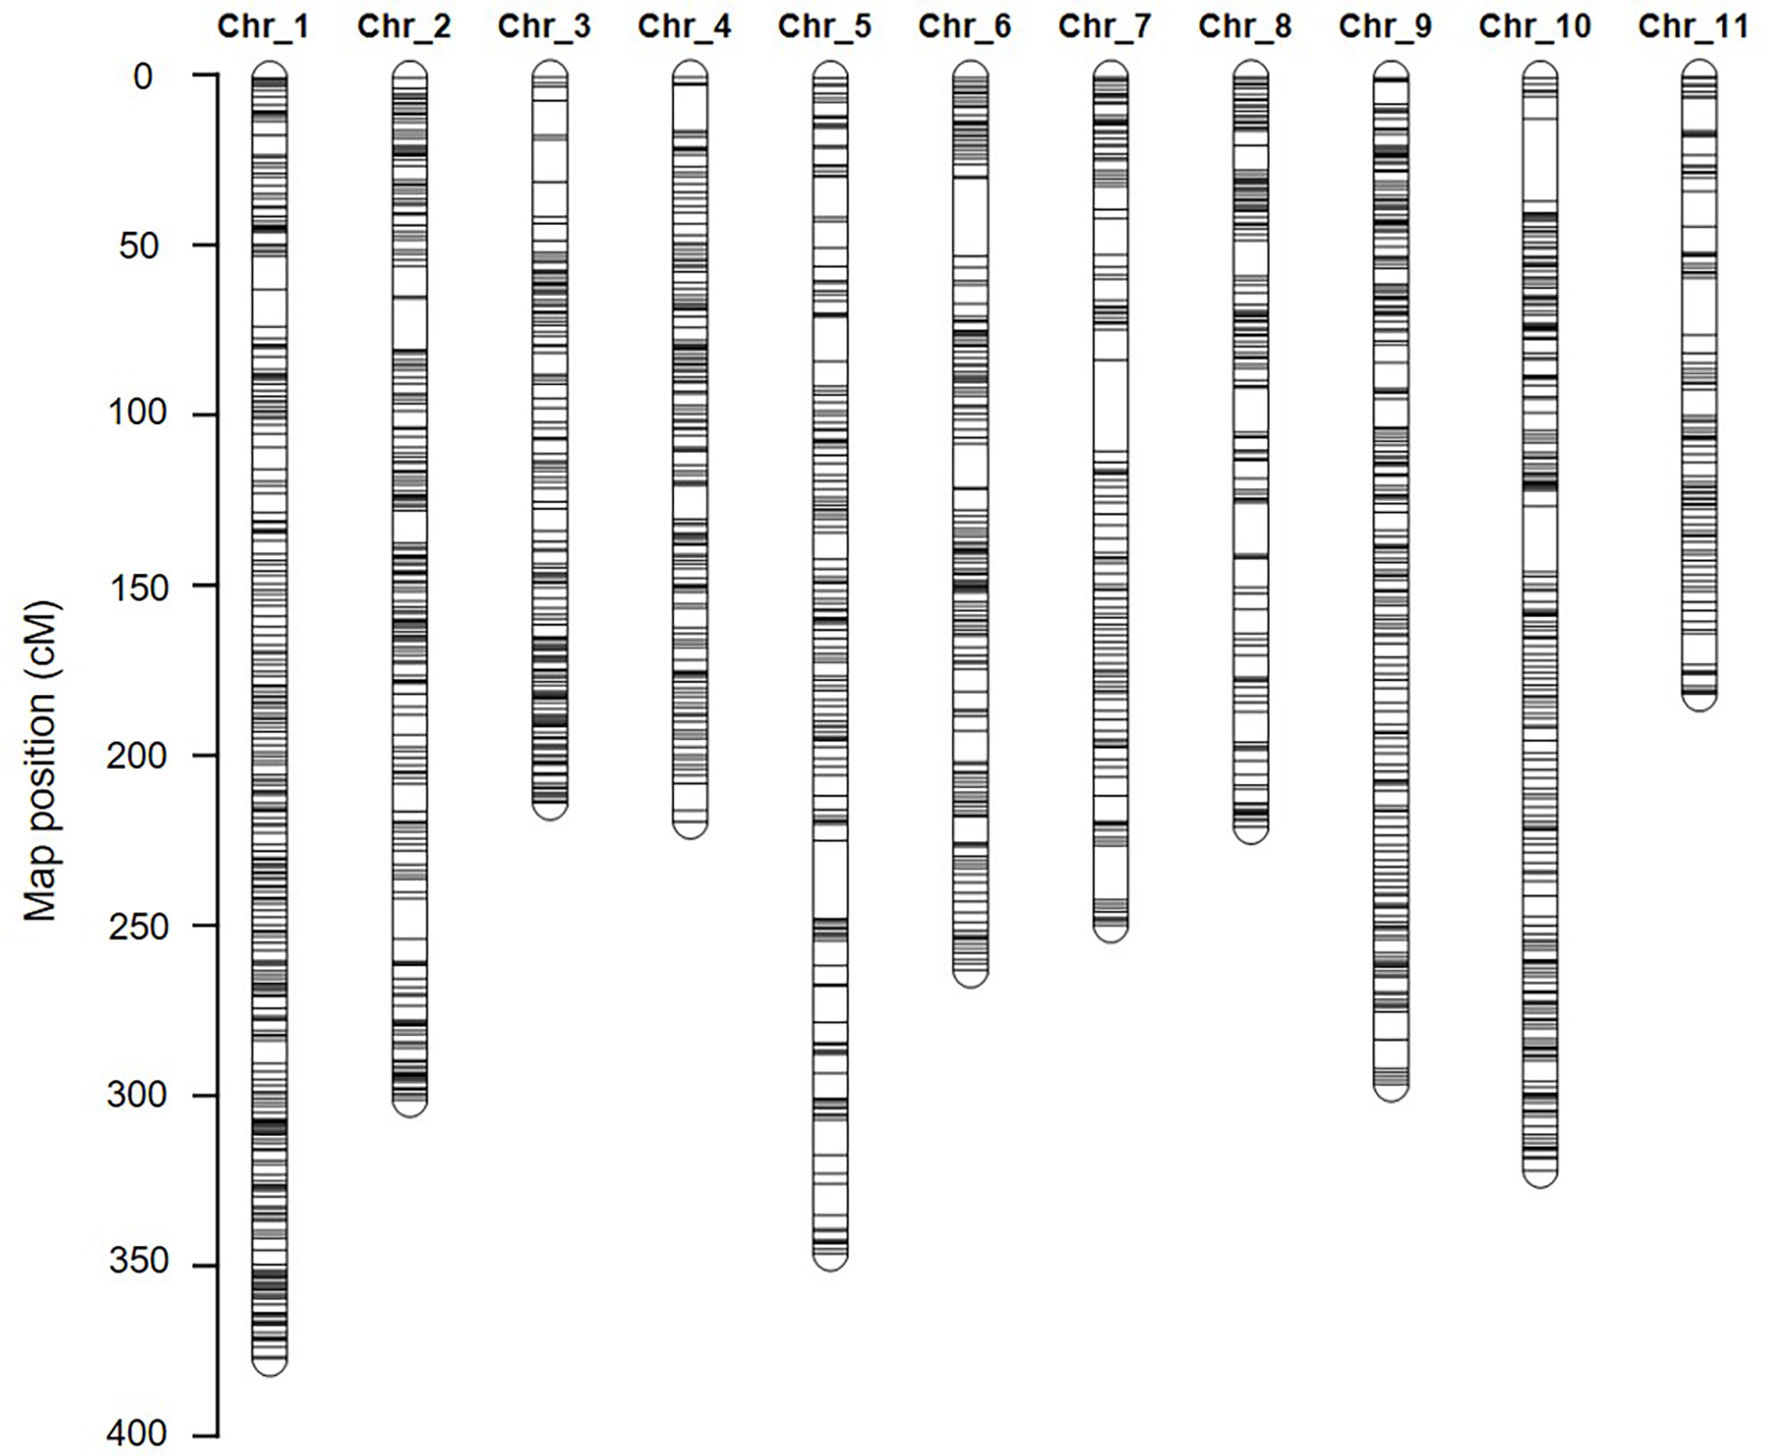
Figure 4 The high-density genetic linkage map of watermelon. The inter-specific linkage map of the inbred watermelon lines 242-1 and 159-1 harboring 1,619 loci. SNP and InDel markers are represented in black.
QTL mapping of fruit quality-related traits
Descriptive statistics for fruit quality-related traits are shown in Table 2; Supplementary Table S13. As the main components of flesh pigment, individuals in the F2 mapping family had lycopene levels ranging from 0.13 to 38.3 μg/g and β-carotene levels ranging from 0.17 to 5.24 μg/g. The flesh and rind color of the red, green, and blue values were obvious differences among F2 individuals. We performed Kolmogorov-Smirnov and Shapiro-Wilk tests (Razali and Wah, 2011) to investigate the normality of each fruit quality-related trait among the samples. The frequency distributions of the traits are shown in Supplementary Figure S8. Traits related to red or green color in the flesh or rind were strongly correlated with each other (r = 0.92 for flesh color, r = 0.99 for rind color, P-value < 0.01 for all). Traits related to lycopene content were also strongly correlated with traits related to red or green flesh color (r = −0.8 for red flesh, r = −0.84 for green flesh, P-value < 0.01 for all; Supplementary Figure S9). This result showed that the red or green flesh color were closely related to lycopene content in watermelon.
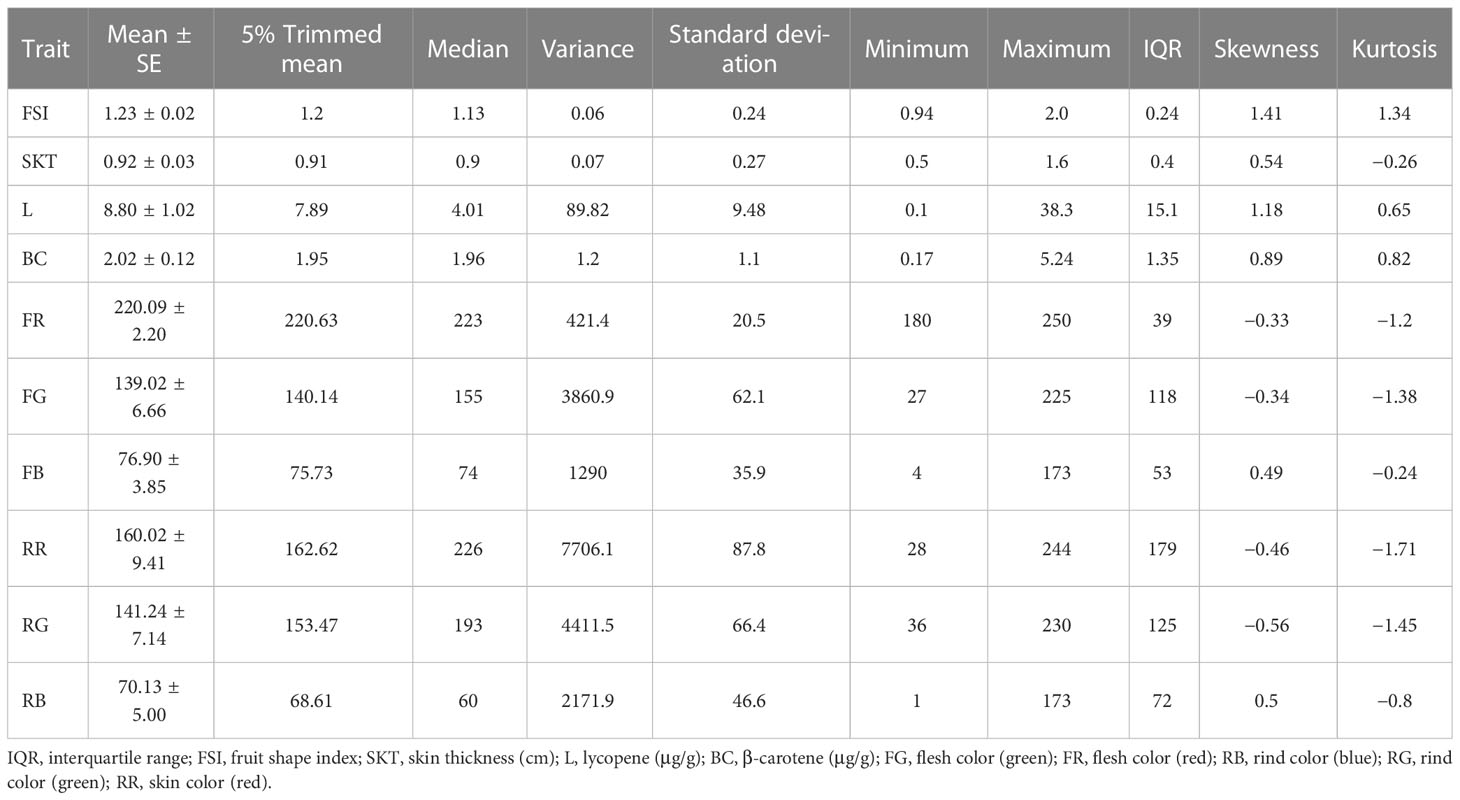
Table 2 Descriptive statistics of the traits investigated in the F2 population.
Fifteen QTL intervals (one for fruit shape index, one for skin thickness, two for lycopene content, two for β-carotene content, four for flesh color, and five for skin color) associated with fruit quality-related traits were identified on chromosomes 1, 2, 3, 4, 6, and 8 by permutation tests (p < 0.05, LOD > 4.3; Figure 5; Table 3). The QTL interval with the highest LOD value of 25.4 was located at 171 cM between the markers ClaB_Chr04_14736633 and ClaB_Chr04_14817220 and accounted for 47.3% of the percentage variance explained (PVE). Eight QTL intervals contributed simultaneously to two traits: Cqly2.1 and Cqbc2.1 to lycopene and β-carotene levels; Cqfg2.1, Cqfr2.1, Cqfg4.1, and Cqfr4.1 to green and red fruit colors; and Cqrg4.1 and Cqrr4.1 to read and green skin colors.
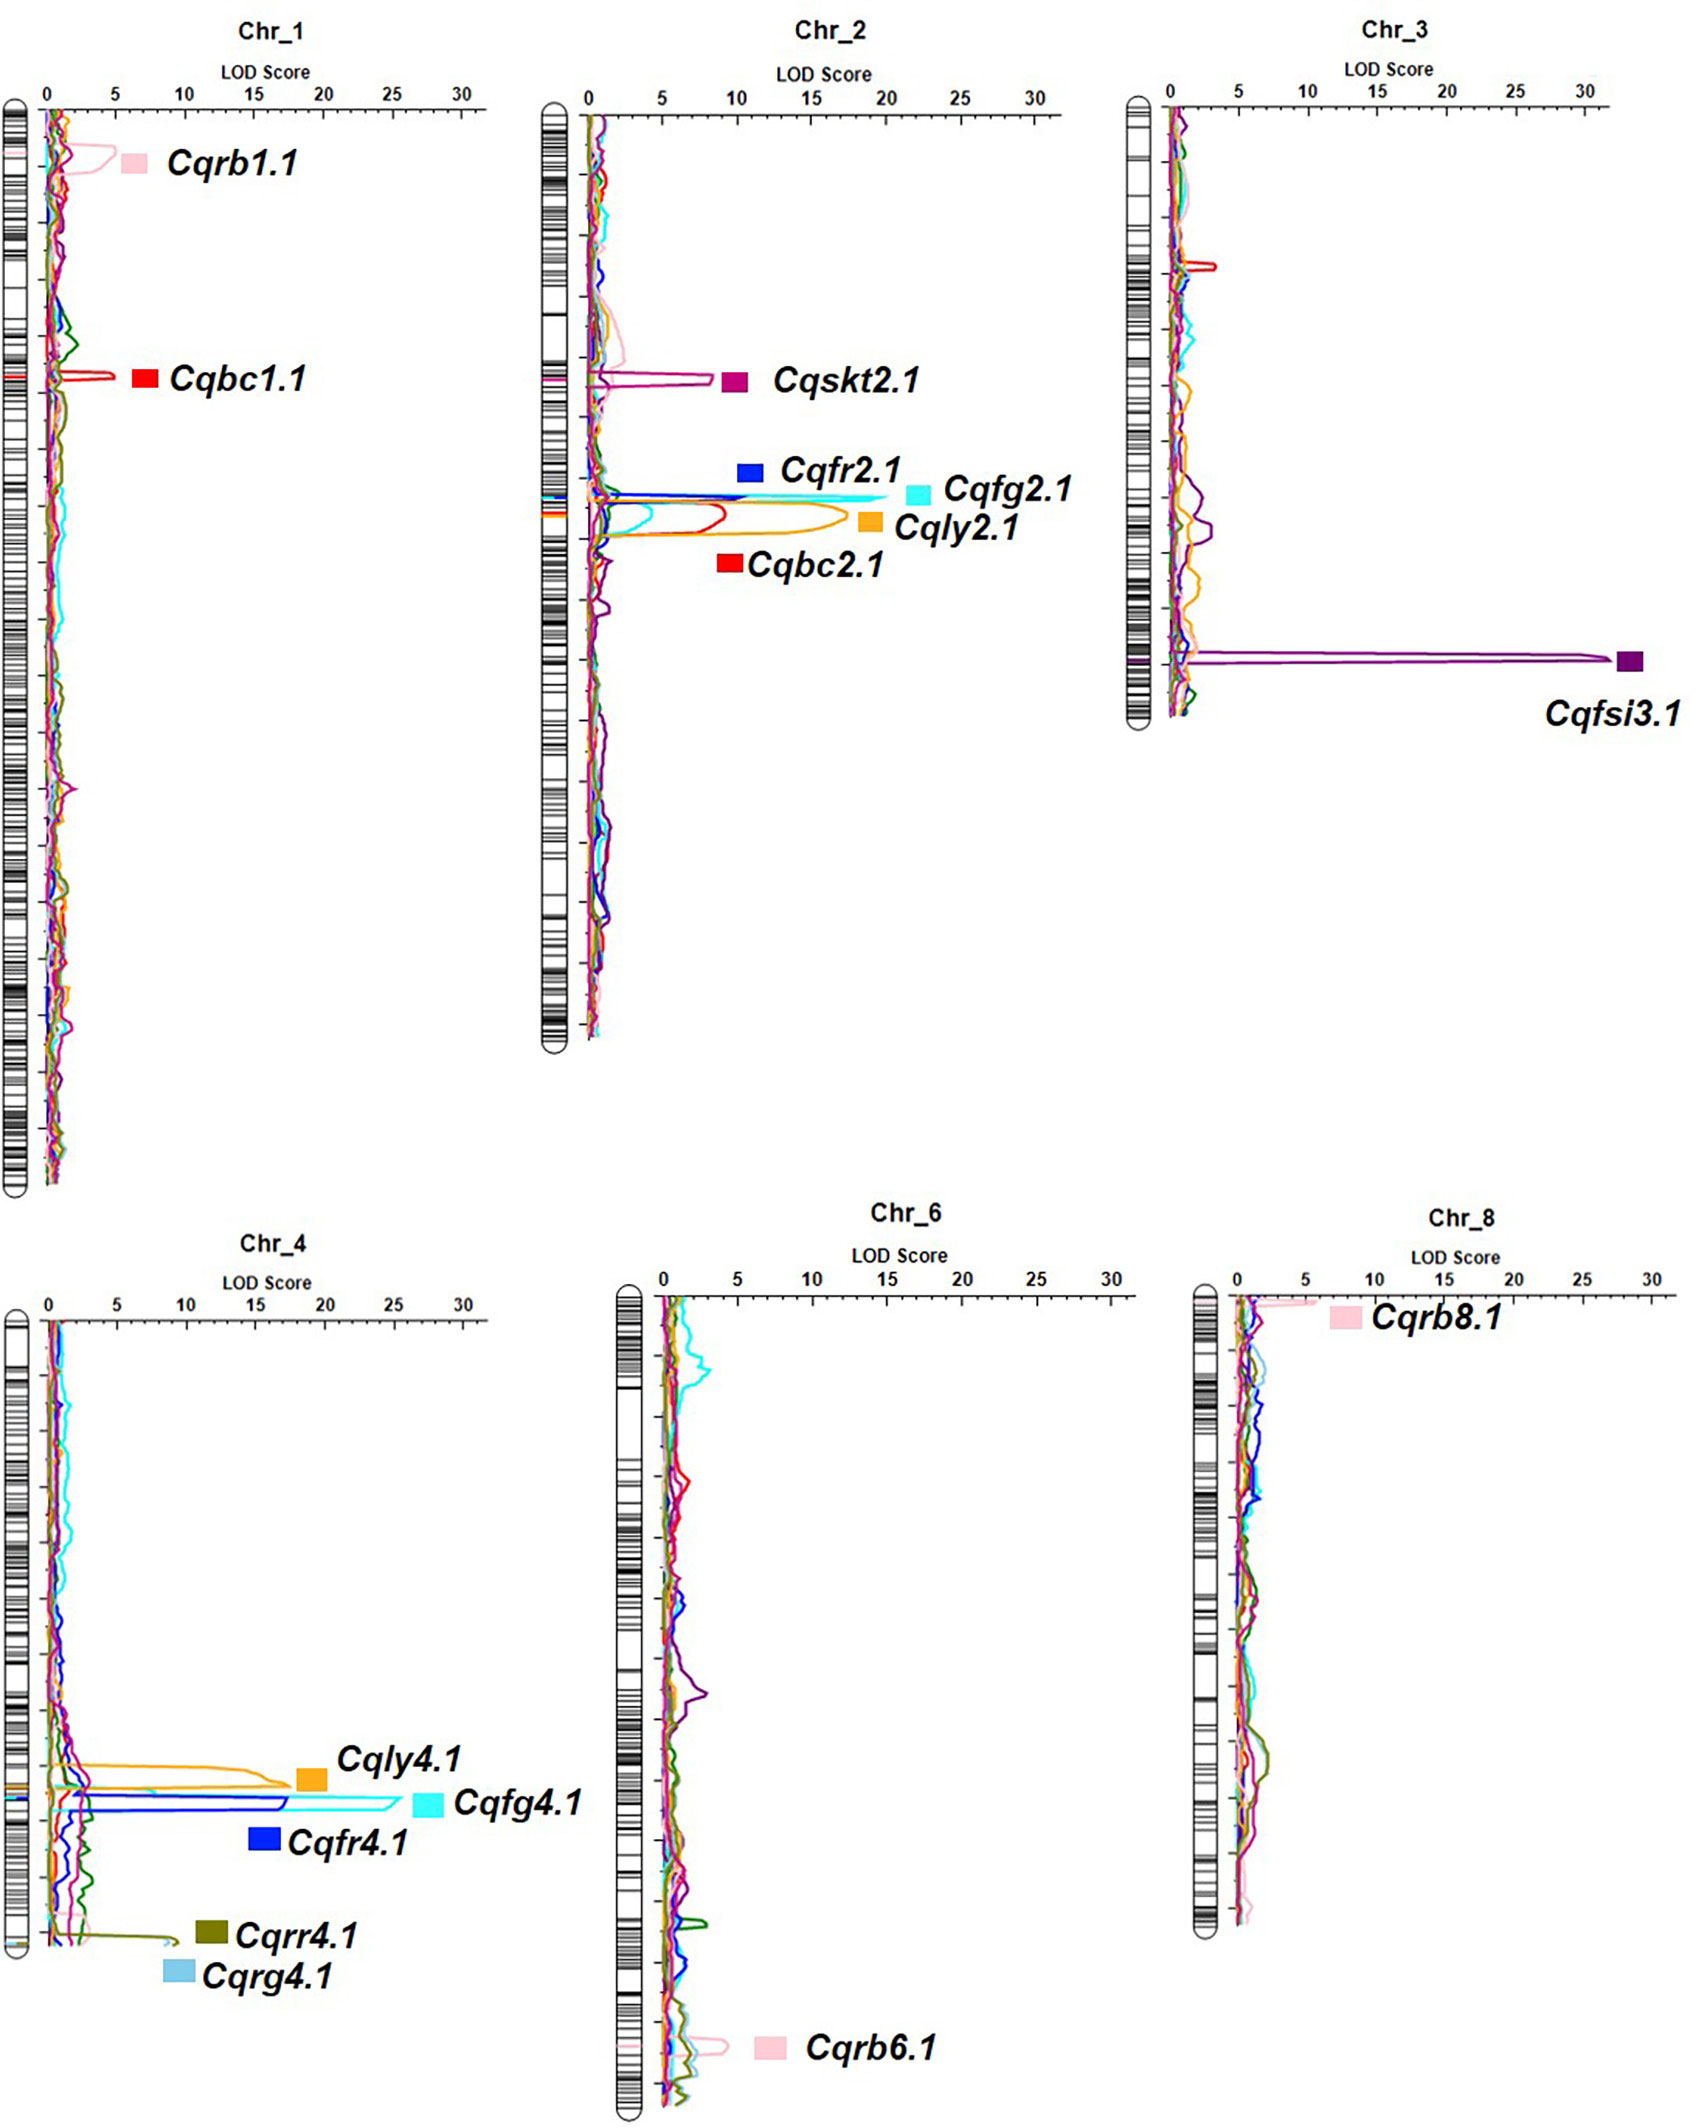
Figure 5 Genome-wide QTL mapping of fruit quality-related traits in the F2 population. The boxes on the right of the chromosomes represent QTLs for fruit shape index (Cqfsi3.1), skin thickness (Cqskt2.1), lycopene (Cqly2.1 and Cqly4.1), β-carotene (Cqbc1.1 and Cqbc2.1), flesh color (Cqfg2.1, Cqfg4.1, Cqfr2.1, and Cqfr4.1), and rind color (Cqrb1.1, Cqrb6.1, Cqrb8.1, Cqrg4.1, and Cqrr4.1).
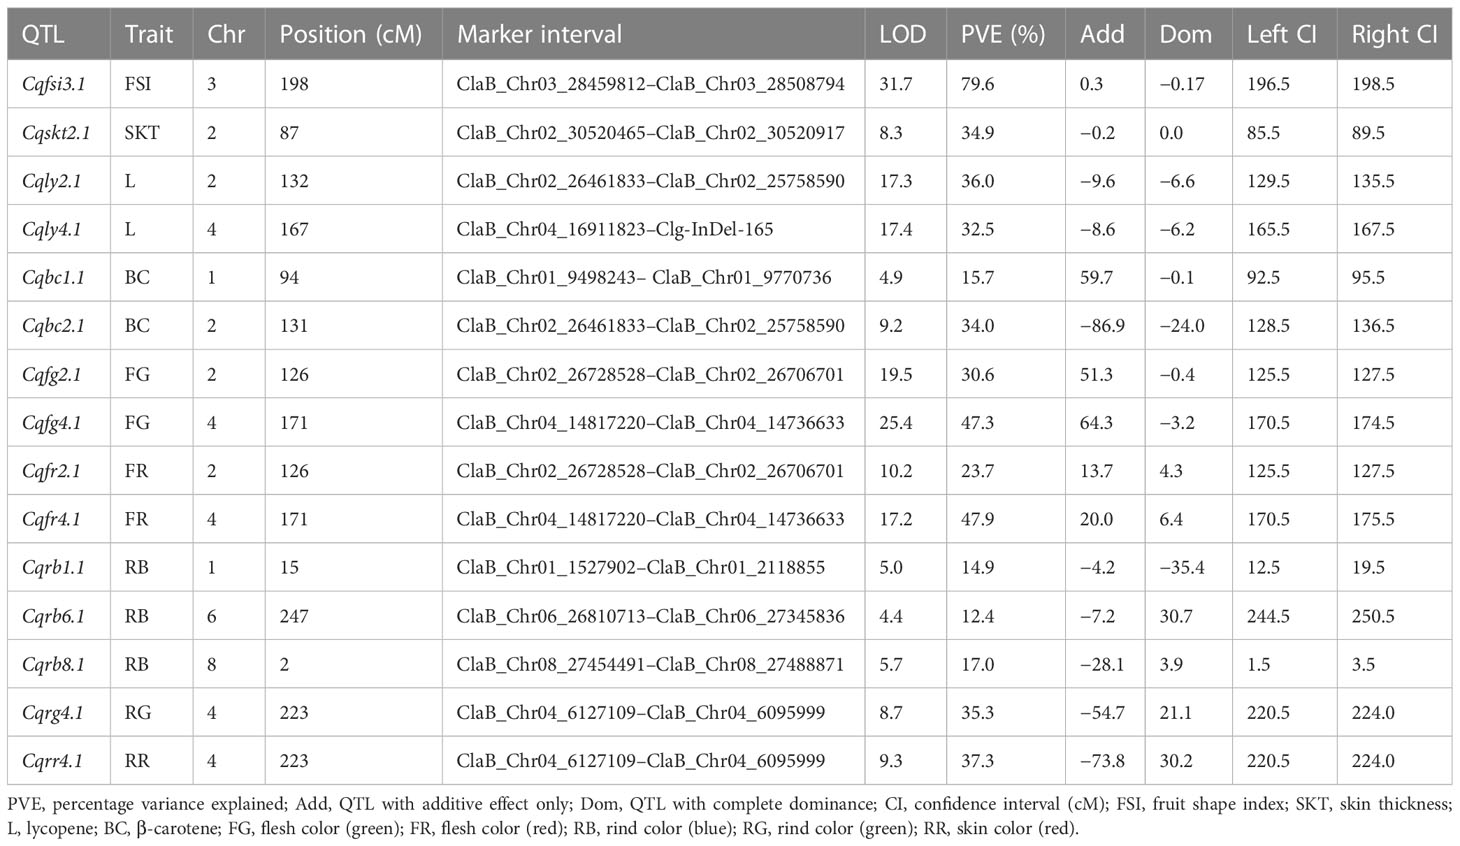
Table 3 Characteristics of the fruit quality-related QTLs in the watermelon (LOD > 4.3).
We used BLAST to search for gene sequences in the 15 fruit quality-related QTL intervals based on the annotation of the 97103 reference genome in the Cucurbit Genomics Database (http://cucurbitgenomics.org/blast ) (Zheng et al., 2019). We identified a total of 302 candidate genes in the 15 QTL intervals. The QTL interval with the most candidate genes was Cqrb6.1, which contained 67 candidate genes, followed by Cqrb1.1 with 66 candidate genes, whereas Cqskt2.1, Cqrg4.1, and Cqrr4.1 each contained one candidate gene (Supplementary Table S14). We compared the candidate genes between the parental cultivars using the resequencing data and identified 33 genes that had variation in an exon (Supplementary Table S15). We then performed gene ontology-enrichment analysis and KEGG pathway analysis to investigate the functions of these 33 genes. The results identified two genes involved in carotenoid biosynthesis that were also linked to flesh color, phytoene synthase 1 (PSY1, Cla97C01G008760), and red chlorophyll catabolite reductase (RCCR, Cla97C02G038270), which were located in the QTL intervals Cqbc1.1 and Cqly2.1, respectively (Supplementary Table S15). RCCR had a single-nucleotide variant (C → G) in the first exon at the 25,790,540 bp of chromosome 2 that resulted in conversion of an asparagine to a lysine. PSY1 had a single-nucleotide variant (A → G) in the first exon at 9,539,129 bp of chromosome 1 that resulted in conversion of a lysine to glutamic acid (Figure 6). In 242-1 and 159-1, the PSY1 variant encoding the glutamic acid was exclusive to 242-1, which was the only cultivar with non-red flesh (orange flesh).
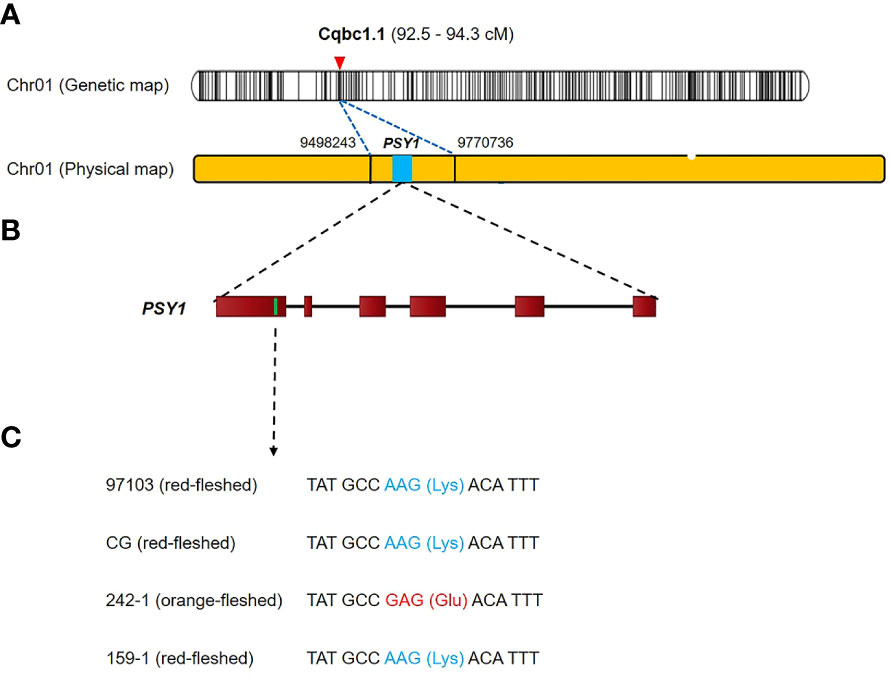
Figure 6 Genetic mapping and phenotypic analysis of the carotenoid biosynthesis gene PSY1 in watermelon. (A) The preliminary genetic map and physical map. The PSY1 gene is located on chromosome 1. (B) Structure of the PSY1 gene. A nonsynonymous SNP mutant is located in the first exon at 9,539,129 bp on chromosome 1. (C) The SNP (A → G) results in the conversion of a lysine (Lys) to a glutamic acid (Glu).
Discussion
The three previously assembled domesticated watermelon genomes (Charleston Gray, 97103, and G42) are all from cultivars with green skin and red flesh (Guo et al., 2013; Wu et al., 2019; Deng et al., 2022). Our genome assemblies provide new information on watermelon cultivars with black or yellow skin and orange flesh. Chromosome 4 of the red-flesh, yellow-rind 159-1 cultivar is similar to that of the red-flesh 97103 reference cultivar, whereas chromosome 4 of the orange-flesh, black-rind 242-1 cultivar has a different construction. There are many genes and regions associated with fruit color (Guo et al., 2019; Wang et al., 2019; Wang et al., 2021) and rind color (Park et al., 2016; Dou et al., 2018; Liu et al., 2020) on chromosome 4, which indicates the specificity of the 242-1 genome. The distinguishing characteristics of the 242-1 and 159-1 watermelon genomes are mainly reflected in flesh and rind colors. The carotenoid biosynthesis-related genes identified in the two new assembled genomes provide a basis for the mapping of watermelon fruit color and rind color.
The color of watermelon flesh is mainly linked to the composition of xanthophylls and carotenes (mainly phytoene, lycopene, and β-carotene) (Wang et al., 2021). We found that two lycopene biosynthesis-related genes, PDS2 and ZDS, had higher expression in the orange-fleshed 242-1 cultivar than in the red-fleshed 159-1 cultivar. The PDS, ZDS, and CRTISO genes are considered to play only connecting roles in lycopene biosynthesis and accumulation (Kato et al., 2004). These results suggest that PDS2 catalysis of ζ-carotene biosynthesis and ZDS catalysis of cis-lycopene biosynthesis are more active in orange-fleshed watermelon (242-1) than in red-fleshed watermelon (159-1), but this difference does not result in a change of lycopene content. The expression of lycopene cyclase genes (LCYB1, LCYB/E, and LCYE) that regulate α-carotene, β-carotene, γ-carotene, δ-carotene, and ϵ-carotene biosynthesis from lycopene was also different between the 242-1 and 159-1 cultivars, suggesting that the two watermelon cultivars have very different mechanisms of carotene synthesis and accumulation.
A single-nucleotide variant of the PSY1 (Cla97C01G008760) gene located in the β-carotene–mapping QTL interval Cqbc1.1 differs between the orange-fleshed cultivar 242-1 and the three red-fleshed cultivars 97103, Charleston Gray, and 159-1, suggesting that this variant has a strong impact on flesh color. Phytoene synthase is the first enzyme in the carotenoid biosynthesis pathway and converts geranylgeranyl diphosphate into phytoene. This enzyme defines the size of the carotenoid pool, which suggests that the variation that we detected in PSY1 affects the carotenoid composition of the watermelon fruit, resulting in the orange color in cultivar 242-1. Orange-flesh watermelon is a landrace of red-flesh watermelon, and coral-red flesh (Y) is dominant to orange flesh (y°) (Bang et al., 2010; Guo et al., 2019). This implies that red-flesh watermelon evolved from orange-flesh watermelon during a process of selective breeding and domestication, during which variation of PSY1 arose and resulted in a decrease in β-carotene content and an increase in lycopene content. On the basis of QTL mapping of variants related to lycopene and β-carotene synthesis, we found an RCCR gene in the QTL intervals Cqly2.1 and Cqbc2.1. RCCR is essential in chlorophyll degradation during leaf senescence and fruit ripening in higher plants (Hörtensteiner, 2006), and this chlorophyll degradation is closely linked to the formation of carotenoids (Meier et al., 2011; Tripathy and Pattanayak, 2012; Leng et al., 2017). Our results suggest that the RCCR gene participates in the regulation of lycopene and β-carotene biosynthesis and accumulation in watermelon fruit. A previous study reported that levels of various carotenoids, such as lutein, β-carotene, violaxanthin, and zeaxanthin, were highly increased in RCCR-silenced tobacco plants (Dong et al., 2022). Furthermore, although lycopene was not mentioned in that report, expression of the phytoene synthase NbPSY1 and the β-carotene isomerase NbCRTISO, both key genes in lycopene synthesis, was also increased after RCCR silencing (Dong et al., 2022). This may be because there is no important mechanism for lycopene accumulation in tobacco leaves. In tomatoes, the lycopene and chlorophyll contents are inversely proportional, and lycopene synthesis and chlorophyll decomposition are synchronized (Carrillo-López and Yahia, 2014; Arthanari and Dhanapalan, 2019). Our results confirmed that RCCR plays an important role in controlling the chlorophyll and carotenoid contents in leaves and fruits of higher plants, although the mechanism varies among plants.
Like the flesh, the rind of watermelon fruit can have various colors, including black, dark green, light green, or yellow (Guo et al., 2013). Yellow-rind watermelon also has high carotenoid contents (Dou et al., 2018); however, there have been few genetic studies of the mechanism of rind color inheritance in watermelons. Previously, rind color-related loci were detected at the ends of chromosomes 4, 6, 8, and 10 (Jones et al, 2014; Park et al., 2016; Park et al., 2018). Genes involved in fruit skin color were previously linked to pigment binding; chloroplast membrane development; anthocyanin, porphyrin, and chlorophyll metabolism; hormone signal transduction; photosynthesis; and carotenoid biosynthesis (Hu et al, 2020; Liu et al., 2020). We found five rind color-related QTL intervals (Cqrb1.1, Cqrg4.1, Cqrr4.1, Cqrb6.1, and Cqrb8.1) on chromosomes 1, 4, 6, and 8, suggesting that rind color-related loci are located mainly on chromosomes 4, 6, and 8. We identified five candidate genes with CDS variation that might be involved in rind color (Cla97C04G070840, Cla97C06G124570, Cla97C06G124600, Cla97C06G124910, and Cla97C08G160580). In previous studies, the Dgo gene (Cla97C04G068530/Cla002769), which is involved in chlorophyll synthesis, was found to be involved in determining the background rind color (Park et al., 2016), and the ClCGMenG gene, which encodes 2-phytyl-1,4-beta-naphthoquinone methyltransferase, was found to be involved in determining dark green or light green color in the rind (Li et al., 2019). However, neither of these genes mapped to our candidate regions. Cultivars 242-1 and 159-1 have black and yellow rinds, respectively, which is different from the green-rind watermelons used in previous studies (Li et al., 2009; Park et al., 2016; Park et al., 2018; Li et al., 2019). The black and yellow rind colors may be the result of loci and candidate genes identified in our screen.
In summary, we performed genetic mapping of traits related to watermelon fruit quality, especially flesh color and rind color, and identified important loci and genes. A phytoene synthase encoded by Cla97C01G008760 is likely to be a core element regulating the carotenoid metabolic pathways in the fruits of watermelon cultivars 242-1 and 159-1, which might have a chain effect on the downstream synthesis or accumulation of other substances, thereby changing the flesh color. We will continue to pay attention to this variation and use further genetic analysis to study the mechanisms that determine the color of watermelon flesh.
Data availability statement
The data presented in the study are deposited in the National Center for Biotechnology Information (https://www.ncbi.nlm.nih.gov/) repository, accession number PRJNA924512 and PRJNA924516.
Author contributions
S-YK and YL designed the project. SN and SP collected and grew the plant material. SLe, SLi, ML, and JK performed the experiments. MK performed the data analysis. HN conducted software analysis and wrote the original draft. S-TK, A-YS, YL, and S-YK revised the manuscript. All authors contributed to the article and approved the submitted version.
Funding
This work was supported by grants from the Korea Post-Genome Project of the Rural Development Administration (No. PJ013344012019), Korea, and the Korean Research Institute of Bioscience and Biotechnology Initiative Program.
Conflict of interest
The authors declare that the research was conducted in the absence of any commercial or financial relationships that could be construed as a potential conflict of interest.
Publisher’s note
All claims expressed in this article are solely those of the authors and do not necessarily represent those of their affiliated organizations, or those of the publisher, the editors and the reviewers. Any product that may be evaluated in this article, or claim that may be made by its manufacturer, is not guaranteed or endorsed by the publisher.
Supplementary material
The Supplementary Material for this article can be found online at: https://www.frontiersin.org/articles/10.3389/fpls.2023.1142856/full#supplementary-material
References
Aït-Aissa, A., Zaddem, M., Aïder, M. (2018). Red–Green–Blue (RGB) colour system approach to study the segregation and percolation in a mixture of white wheat flour and bleached wheat bran. Int. J. Food Sci. Technol. 53, 254–261. doi: 10.1111/ijfs.13581
Arthanari, M., Dhanapalan, S. (2019). Quantification of β-carotene, lycopene, and chlorophyll content in tomato fruits of enrichment of chicken feathers composting. Int. J. Recycl. Org. Waste Agric. 8, 473–477. doi: 10.1007/s40093-019-0258-6
Bae, S. J., Islam, M. M., Kim, H. Y., Lim, K. B. (2020). Induction of tetraploidy in watermelon with oryzalin treatments. Hortic. Sci. Technol. 38, 385–393. doi: 10.7235/HORT.20200037
Bang, H., Davis, A. R., Kim, S., Leskovar, D. I., King, S. R. (2010). Flesh color inheritance and gene interactions among canary yellow, pale yellow, and red watermelon. J. Am. Soc Hortic. Sci. 135, 362–368. doi: 10.21273/jashs.135.4.362
Carrillo-López, A., Yahia, E. M. (2014). Changes in color-related compounds in tomato fruit exocarp and mesocarp during ripening using HPLC-APcI+-mass spectrometry. J. Food Sci. Technol. 51, 2720–2726. doi: 10.1007/s13197-012-0782-0
Chomicki, G., Schaefer, H., Renner, S. S. (2020). Origin and domestication of cucurbitaceae crops: insights from phylogenies, genomics and archaeology. New Phytol. 226, 1240–1255. doi: 10.1111/nph.16015
Danecek, P., Auton, A., Abecasis, G., Albers, C. A., Banks, E., DePristo, M. A., et al. (2011). The variant call format and VCFtools. Bioinformatics 27, 2156–2158. doi: 10.1093/bioinformatics/btr330
Deng, Y., Liu, S., Zhang, Y., Tan, J., Li, X., Chu, X., et al. (2022). A telomere-totelomere gap-free reference genome of watermelon and its mutation library provide important resources for gene discovery and breeding. Mol. Plant 15, 1268–1284. doi: 10.1016/j.molp.2022.06.010
Dong, C., Zhang, M., Wei, F., Guo, Y., Qin, L., Wei, P., et al. (2022). Inhibition of red chlorophyll catabolite reductase improved chlorophyll and carotenoid synthesis in tobacco. Plant Cell. Tissue Organ Cult. 148, 687–698. doi: 10.1007/s11240-022-02228-1
Dou, J., Lu, X., Ali, A., Zhao, S., Zhang, L., He, N., et al. (2018). Genetic mapping reveals a marker for yellow skin in watermelon (Citrullus lanatus l.). PloS One 13, 1–15. doi: 10.1371/journal.pone.0200617
Dubey, S., Rajput, H., Batta, K. (2021). Utilization of watermelon rind (Citrullus lanatus) in various food preparations: A review. J. Agric. Sci. Food Res. 12, 5–7. doi: 10.37273/chesci.cs205205361
Flynn, J. M., Hubley, R., Goubert, C., Rosen, J., Clark, A. G., Feschotte, C., et al. (2020). RepeatModeler2 for automated genomic discovery of transposable element families. Proc. Natl. Acad. Sci. U. S. A. 117, 9451–9457. doi: 10.1073/pnas.1921046117
Guo, S., Sun, H., Zhang, H., Liu, J., Ren, Y., Gong, G., et al. (2015). Comparative transcriptome analysis of cultivated and wild watermelon during fruit development. PloS One 10, 1–21. doi: 10.1371/journal.pone.0130267
Guo, S., Zhang, J., Sun, H., Salse, J., Lucas, W. J., Zhang, H., et al. (2013). The draft genome of watermelon (Citrullus lanatus) and resequencing of 20 diverse accessions. Nat. Genet. 45, 51–58. doi: 10.1038/ng.2470
Guo, S., Zhao, S., Sun, H., Wang, X., Wu, S., Lin, T., et al. (2019). Resequencing of 414 cultivated and wild watermelon accessions identifies selection for fruit quality traits. Nat. Genet. 51, 1616–1623. doi: 10.1038/s41588-019-0518-4
Haas, B. J., Delcher, A. L., Mount, S. M., Wortman, J. R., Smith, R. K., Hannick, L. I., et al. (2003). Improving the arabidopsis genome annotation using maximal transcript alignment assemblies. Nucleic Acids Res. 31, 5654–5666. doi: 10.1093/nar/gkg770
Haas, B. J., Papanicolaou, A., Yassour, M., Grabherr, M., Blood, P. D., Bowden, J., et al. (2013). De novo transcript sequence reconstruction from RNA-seq using the trinity platform for reference generation and analysis. Nat. Protoc. 8, 1494–1512. doi: 10.1038/nprot.2013.084
Haas, B. J., Salzberg, S. L., Zhu, W., Pertea, M., Allen, J. E., Orvis, J., et al. (2008). Automated eukaryotic gene structure annotation using EVidenceModeler and the program to assemble spliced alignments. Genome Biol. 9, 1–22. doi: 10.1186/gb-2008-9-1-r7
Hörtensteiner, S. (2006). Chlorophyll degradation during senescence. Annu. Rev. Plant Biol. 57, 55–77. doi: 10.1146/annurev.arplant.57.032905.105212
Hu, J., Fan, J., Sun, Z., Liu, S. (2020). NextPolish: A fast and efficient genome polishing tool for long-read assembly. Bioinformatics 36, 2253–2255. doi: 10.1093/bioinformatics/btz891
Jones, P., Binns, D., Chang, H. Y., Fraser, M., Li, W., McAnulla, C., et al. (2014). InterProScan 5: Genome-scale protein function classification. Bioinformatics 30, 1236–1240. doi: 10.1093/bioinformatics/btu031
Kato, M., Ikoma, Y., Matsumoto, H., Sugiura, M., Hyodo, H., Yano, M. (2004). Accumulation of carotenoids and expression of carotenoid biosynthetic genes during maturation in citrus fruit. Plant Physiol. 134, 824–837. doi: 10.1104/pp.103.031104
Kosambi, D. D. (2016). The estimation of map distances from recombination values. Eds. Kosambi, D. D., Ramaswamy, R. (New Delhi Springer), 125–130. Available at: https://link.springer.com/chapter/10.1007/978-81-322-3676-4_16.
Kovaka, S., Zimin, A. V., Pertea, G. M., Razaghi, R., Salzberg, S. L., Pertea, M. (2019). Transcriptome assembly from long-read RNA-seq alignments with StringTie2. Genome Biol. 20, 1–13. doi: 10.1186/s13059-019-1910-1
Lee, S., Park, G., Choi, Y., Park, S., Kim, H., Lee, O., et al. (2022). Whole-genome resequencing of near-isogenic lines reveals a genomic region associated with high trans-lycopene contents in watermelon. Plants 11, 1–14. doi: 10.3390/plants11010008
Leng, X., Wang, P., Wang, C., Zhu, X., Li, X., Li, H., et al. (2017). Genome-wide identification and characterization of genes involved in carotenoid metabolic in three stages of grapevine fruit development. Sci. Rep. 7, 1–13. doi: 10.1038/s41598-017-04004-0
Li, H., Handsaker, B., Wysoker, A., Fennell, T., Ruan, J., Homer, N., et al. (2009). The sequence Alignment/Map format and SAMtools. Bioinformatics 25, 2078–2079. doi: 10.1093/bioinformatics/btp352
Li, B., Zhao, S., Dou, J., Ali, A., Gebremeskel, H., Gao, L., et al. (2019). Genetic mapping and development of molecular markers for a candidate gene locus controlling rind color in watermelon. Theor. Appl. Genet. 132, 2741–2753. doi: 10.1007/s00122-019-03384-3
Liu, D., Yang, H., Yuan, Y., Zhu, H., Zhang, M., Wei, X., et al. (2020). Comparative transcriptome analysis provides insights into yellow rind formation and preliminary mapping of the clyr (Yellow rind) gene in watermelon. Front. Plant Sci. 11. doi: 10.3389/fpls.2020.00192
Liu, C., Zhang, H., Dai, Z., Liu, X., Liu, Y., Deng, X., et al. (2012). Volatile chemical and carotenoid profiles in watermelons [Citrullus vulgaris (Thunb.) schrad (Cucurbitaceae)] with different flesh colors. Food Sci. Biotechnol. 21, 531–541. doi: 10.1007/s10068-012-0068-3
Luo, X., Chen, S., Zhang, Y. (2022). PlantRep: a database of plant repetitive elements. Plant Cell Rep. 41, 1163–1166. doi: 10.1007/s00299-021-02817-y
Ma, G., Zhang, L., Kudaka, R., Inaba, H., Furuya, T., Kitamura, M., et al. (2021). Exogenous application of aba and naa alleviates the delayed coloring caused by puffing inhibitor in citrus fruit. Cells 10, 1–13. doi: 10.3390/cells10020308
Marçais, G., Delcher, A. L., Phillippy, A. M., Coston, R., Salzberg, S. L., Zimin, A. (2018). MUMmer4: A fast and versatile genome alignment system. PloS Comput. Biol. 14, 1–14. doi: 10.1371/journal.pcbi.1005944
Meier, S., Tzfadia, O., Vallabhaneni, R., Gehring, C., Wurtzel, E. T. (2011). A transcriptional analysis of carotenoid, chlorophyll and plastidial isoprenoid biosynthesis genes during development and osmotic stress responses in arabidopsis thaliana. BMC Syst. Biol. 5, 1–19. doi: 10.1186/1752-0509-5-77
Meng, L., Li, H., Zhang, L., Wang, J. (2015). QTL IciMapping: Integrated software for genetic linkage map construction and quantitative trait locus mapping in biparental populations. Crop J. 3, 269–283. doi: 10.1016/j.cj.2015.01.001
Nadeem, M., Navida, M., Ameer, K., Iqbal, A., Malik, F., Nadeem, M. A., et al. (2022). A comprehensive review on the watermelon phytochemical profile and their bioactive and therapeutic effects. Korean J. Food Preserv. 29, 546–576. doi: 10.11002/kjfp.2022.29.4.546
Paris, H. S. (2015). Origin and emergence of the sweet dessert watermelon, citrullus lanatus. Ann. Bot. 116, 133–148. doi: 10.1093/aob/mcv077
Park, G., Kim, J., Jin, B., Yang, H. B., Park, S. W., Kang, S. C., et al. (2018). Genome-wide sequence variation in watermelon inbred lines and its implication for marker-assisted breeding. Hortic. Sci. Technol. 36, 280–291. doi: 10.12972/kjhst.20180028
Park, S., Kim, K. T., Kang, S. C., Yang, H. B. (2016). Rapid and practical molecular marker development for rind traits in watermelon. Hortic. Environ. Biotechnol. 57, 385–391. doi: 10.1007/s13580-016-0005-0
Perkins-Veazie, P., Collins, J. K., Davis, A. R., Roberts, W. (2006). Carotenoid content of 50 watermelon cultivars. J. Agric. Food Chem. 54, 2593–2597. doi: 10.1021/jf052066p
Perkins-Veazie, P., Davis, A., Collins, J. K. (2012). Watermelon: From dessert to functional food. Isr. J. Plant Sci. 60, 395–402. doi: 10.1560/IJPS.60.1.402
Porcher, M. H., Noriko, A., Mundy, A., Marinos Drakopoulos, E. M., Rocha, A., Li, J., et al. (2013) Sorting citrullus names. multiling. multiscript plant name database. Available at: https://www.plantnames.unimelb.edu.au/Sorting/Citrullus.html#lanatus-vulgaris-gr.
Quinlan, A. R., Hall, I. M. (2010). BEDTools: A flexible suite of utilities for comparing genomic features. Bioinformatics 26, 841–842. doi: 10.1093/bioinformatics/btq033
Razali, N. M., Wah, Y. B. (2011). Power comparisons of shapiro-wilk, kolmogorov-smirnov, lilliefors and anderson-darling tests. J. Stat. Model. Anal. 2, 21–33.
Renner, S. S., Wu, S., Pérez-Escobar, O. A., Silber, M. V., Fei, Z., Chomicki, G. (2021). A chromosome-level genome of a kordofan melon illuminates the origin of domesticated watermelons. Proc. Natl. Acad. Sci. U. S. A. 118, 1–9. doi: 10.1073/pnas.2101486118
Rhee, S. J., Han, B. K., Jang, Y. J., Sim, T. Y., Lee, G. P. (2015). Construction of a genetic linkage map using a frame set of simple sequence repeat and high-resolution melting markers for watermelon (Citrullus spp.). Hortic. Environ. Biotechnol. 56, 669–676. doi: 10.1007/s13580-015-0110-5
Roach, M. J., Schmidt, S., Borneman, A. R. (2018). Purge haplotigs: Synteny reduction for third-gen diploid genome assemblies. BMC Bioinf. 19, 1–10. doi: 10.1186/s12859-018-2485-7
Sandlin, K., Prothro, J., Heesacker, A., Khalilian, N., Okashah, R., Xiang, W., et al. (2012). Comparative mapping in watermelon [Citrullus lanatus (Thunb.) matsum. et nakai]. Theor. Appl. Genet. 125, 1603–1618. doi: 10.1007/s00122-012-1938-z
Simão, F. A., Waterhouse, R. M., Ioannidis, P., Kriventseva, E. V., Zdobnov, E. M. (2015). BUSCO: Assessing genome assembly and annotation completeness with single-copy orthologs. Bioinformatics 31, 3210–3212. doi: 10.1093/bioinformatics/btv351
Simpson, K., Quiroz, L. F., Rodriguez-Concepción, M., Stange, C. R. (2016). Differential contribution of the first two enzymes of the MEP pathway to the supply of metabolic precursors for carotenoid and chlorophyll biosynthesis in carrot (Daucus carota). Front. Plant Sci. 7. doi: 10.3389/fpls.2016.01344
Slater, G. S. C., Birney, E. (2005). Automated generation of heuristics for biological sequence comparison. BMC Bioinf. 6, 1–11. doi: 10.1186/1471-2105-6-31
Sun, L., Zhang, Y., Cui, H., Zhang, L., Sha, T., Wang, C., et al. (2020). Linkage mapping and comparative transcriptome analysis of firmness in watermelon (Citrullus lanatus). Front. Plant Sci. 11. doi: 10.3389/fpls.2020.00831
Tadmor, Y., King, S., Levi, A., Davis, A., Meir, A., Wasserman, B., et al. (2005). Comparative fruit colouration in watermelon and tomato. Food Res. Int. 38, 837–841. doi: 10.1016/j.foodres.2004.07.011
Tarailo-Graovac, M., Chen, N. (2009). Using RepeatMasker to identify repetitive elements in genomic sequences. Curr. Protoc. Bioinforma. 4, 1–14. doi: 10.1002/0471250953.bi0410s25
Wang, C.-n., Luan, F.-s., Liu, H.-y., Davis, A. R., Zhang, Q., Dai, Z.-y., et al. (2021). Mapping and predicting a candidate gene for flesh color in watermelon. J. Integr. Agric. 20, 2100–2111. doi: 10.1016/S2095-3119(20)63487-6
Wang, C., Qiao, A., Fang, X., Sun, L., Gao, P., Davis, A. R., et al. (2019). Fine mapping of lycopene content and flesh color related gene and development of molecular marker–assisted selection for flesh color in watermelon (Citrullus lanatus). Front. Plant Sci. 10. doi: 10.3389/fpls.2019.01240
Wu, S., Wang, X., Reddy, U., Sun, H., Bao, K., Gao, L., et al. (2019). Genome of ‘Charleston gray’, the principal American watermelon cultivar, and genetic characterization of 1,365 accessions in the U.S. national plant germplasm system watermelon collection. Plant Biotechnol. J. 17, 2246–2258. doi: 10.1111/pbi.13136
Xiao, J., Chen, S.-y., Sun, Y., Yang, S.-d., He, Y. (2022). Differences of rhizospheric and endophytic bacteria are recruited by different watermelon phenotypes relating to rind colors formation. Sci. Rep. 12, 1–13. doi: 10.1038/s41598-022-10533-0
Zerpa-Catanho, D., Zhang, X., Song, J., Hernandez, A. G., Ming, R. (2021). Ultra-long DNA molecule isolation from plant nuclei for ultra-long read genome sequencing. STAR Protoc. 2, 1–17. doi: 10.1016/j.xpro.2021.100343
Zhao, W., Lv, P., Gu, H. (2013). Studies on carotenoids in watermelon flesh. Agric. Sci. 04, 13–20. doi: 10.4236/as.2013.47a003
Keywords: watermelon, genome assembly, linkage map, quantitative trait locus (QTL), carotenoid biosynthesis, phytoene synthase
Citation: Nie H, Kim M, Lee S, Lim S, Lee MS, Kim JH, Noh SJ, Park SW, Kim S-T, Shin A-Y, Lee Y and Kwon S-Y (2023) High-quality genome assembly and genetic mapping reveal a gene regulating flesh color in watermelon (Citrullus lanatus). Front. Plant Sci. 14:1142856. doi: 10.3389/fpls.2023.1142856
Received: 12 January 2023; Accepted: 15 February 2023;
Published: 01 March 2023.
Edited by:
Qiusheng Kong, Huazhong Agricultural University, ChinaReviewed by:
Yong Xu, Beijing Academy of Agriculture and Forestry Sciences, ChinaMd Abdur Rahim, Sher-e-Bangla Agricultural University, Bangladesh
Copyright © 2023 Nie, Kim, Lee, Lim, Lee, Kim, Noh, Park, Kim, Shin, Lee and Kwon. This is an open-access article distributed under the terms of the Creative Commons Attribution License (CC BY). The use, distribution or reproduction in other forums is permitted, provided the original author(s) and the copyright owner(s) are credited and that the original publication in this journal is cited, in accordance with accepted academic practice. No use, distribution or reproduction is permitted which does not comply with these terms.
*Correspondence: Ah-Young Shin, c2hpbmF5QGtyaWJiLnJlLmty; Yi Lee, bGVleWkyMkBoYW5tYWlsLm5ldA==; Suk-Yoon Kwon, c3lrd29uQGtyaWJiLnJlLmty
†These authors have contributed equally to this work and share first authorship