 Yudong Chen1,2,3†
 Jinlong Wang1,2,3†
 Lamei Jiang1,2,3Hanpeng Li1,2,3Hengfang Wang1,2,3
 Guanghui Lv1,2,3*Xiaotong Li1,2,3
- 1College of Ecology and Environment, Xinjiang University, Urumqi, China
- 2Key Laboratory of Oasis Ecology of Education Ministry, Xinjiang University, Urumqi, China
- 3Xinjiang Jinghe Observation and Research Station of Temperate Desert Ecosystem, Ministry of Education, Jinghe, China
The relationship between plant functional traits and ecosystem function is a hot topic in current ecological research, and community-level traits based on individual plant functional traits play important roles in ecosystem function. In temperate desert ecosystems, which functional trait to use to predict ecosystem function is an important scientific question. In this study, the minimum data sets of functional traits of woody (wMDS) and herbaceous (hMDS) plants were constructed and used to predict the spatial distribution of C, N, and P cycling in ecosystems. The results showed that the wMDS included plant height, specific leaf area, leaf dry weight, leaf water content, diameter at breast height (DBH), leaf width, and leaf thickness, and the hMDS included plant height, specific leaf area, leaf fresh weight, leaf length, and leaf width. The linear regression results based on the cross-validations (FTEIW - L, FTEIA - L, FTEIW - NL, and FTEIA - NL) for the MDS and TDS (total data set) showed that the R2 (coefficients of determination) for wMDS were 0.29, 0.34, 0.75, and 0.57, respectively, and those for hMDS were 0.82, 0.75, 0.76, and 0.68, respectively, proving that the MDSs can replace the TDS in predicting ecosystem function. Then, the MDSs were used to predict the C, N, and P cycling in the ecosystem. The results showed that non-linear models RF and BPNN were able to predict the spatial distributions of C, N and P cycling, and the distributions showed inconsistent patterns between different life forms under moisture restrictions. The C, N, and P cycling showed strong spatial autocorrelation and were mainly influenced by structural factors. Based on the non-linear models, the MDSs can be used to accurately predict the C, N, and P cycling, and the predicted values of woody plant functional traits visualized by regression kriging were closer to the kriging results based on raw values. This study provides a new perspective for exploring the relationship between biodiversity and ecosystem function.
1 Introduction
Plant functional traits are morphological, physiological, and life history traits that indirectly affect plant fitness (Violle et al., 2007). In natural ecosystems, plants adapt to external changes by the changes of traits such as height, leaf area, leaf mass, leaf longevity, seed size, and seed dispersal mode, which may also lead to changes in ecosystem functions (Li et al., 2008; Messier et al., 2010; Albert et al., 2012; Kraft et al., 2015). However, plant species are diverse in nature, and plant functional traits are influenced by factors such as climate change and human disturbance (He et al., 2018). Therefore, using plant functional traits to reflect and predict changes in plant community and ecosystem function is of great importance.
Many studies have explored the relationship between plant functional traits and ecosystem processes or functions. Most researchers believe that the relative biomass of dominant species in plant communities and their specific traits dominate the dynamics of ecosystem processes in time and space (Vile et al., 2006; Catorci et al., 2014; Cavanaugh et al., 2014; Lohbeck et al., 2015). For example, Grime (1998) proposed the “mass ratio hypothesis”, arguing that plant functional traits can be used to predict ecosystem functions or processes (Diaz et al., 2007; Niu et al., 2010; Diaz et al., 2016). Furthermore, some scholars held that the change of one plant functional trait may lead to changes in multiple ecosystem functions, and one ecosystem function may be simultaneously affected by multiple plant functional traits (Temmerman et al., 2005; Kearney and Fagherazzi, 2016; Sun et al., 2020).
At present, there are two main ways to study the functional traits of plant communities. One is to use community functional parameters based on plant functional traits, for example, the community weighted mean (CWM) of plant functional traits, which is calculated using the weighted average of functional traits and relative abundances of species (Kattge et al., 2011; Zhang et al., 2011b; Zhang et al., 2020a). The other is to use plant functional trait diversity, for example, the size, range, and distribution of plant functional trait values in a community, which is considered important for biodiversity (Finegan et al., 2015; Huang et al., 2019b; Lin et al., 2022). Studies have shown that community functional parameters based on plant functional traits and plant functional trait diversity can influence plant community structure and ecosystem functions or processes (Flynn et al., 2011; Mei et al., 2017). However, the parameters are numerous, redundant, and cumbersome. Therefore, the selection of representative parameters that play an important role in ecosystem functioning has become the key to current research.
With the in-depth study of ecosystem functions, researchers gradually realize that ecosystems provide multiple ecosystem functions simultaneously, i.e. ecosystem multifunctionality (Pasari et al., 2013; Garland et al., 2020). Most previous studies have focused on the effects of a single trait on the functions of a single ecosystem (Fortunel et al., 2009; Zuo et al., 2016; Pakeman and Fielding, 2020) and the quantification of plant functional trait diversity and ecosystem functions (Petchey and Gaston, 2002; Laliberte and Legendre, 2010; Isbell et al., 2011). In recent years, quantitative analysis of the relationship between multiple plant functional traits and multiple functions of single ecosystems has been sought after (Wei et al., 2016a; Wei et al., 2016b; Liu et al., 2017; Liang et al., 2019; Li et al., 2020b). Spatial heterogeneity of single functions of single ecosystems has been proposed by ecologists and botanists at landscape and regional levels (Lin et al., 2010; Giese et al., 2013; Liu et al., 2018). Some scholars reported that morphological variation and spatial distribution of plant functional traits are the results of environmental filtering and biological interactions, reflecting plant adaptations to their habitats (Duran et al., 2019; Ma et al., 2019; Zhang et al., 2020b). Therefore, by analyzing the spatial distribution of functional traits and their relationship to environment, it is possible to how plants respond to environmental changes and how the responses affect the functions of single ecosystems.
Arid regions account for about 41% of the world’s total land, and about 38% of the population lives in arid regions (Reynolds et al., 2007). Due to the influences of climate change and anthropogenic disturbances, the aridification of terrestrial ecosystems is exacerbating (Gao and Giorgi, 2008; Feng and Fu, 2013). In Xinjiang, China, the desert area (65.46 × 10⁴ km2) accounts for 39% of the total area of Xinjiang, and has increased significantly (Ni and OuYang, 2006). Previous studies have shown that the proportions of C, N, and P in the total elemental content are relatively stable in desert ecosystems (Elser et al., 2000; Elser et al., 2010). However, plants with different life forms affect C, N, and P cycling to a certain extent, which could impact the spatial distribution of the functions of C, N, and P cycling in ecosystems (Wang and Yu, 2008; Wang et al., 2019).
Therefore, based on the spatial heterogeneity of ecosystem functions, the spatial distributions of the functions of C, N, and P cycling were predicted using the MDS of the dominant plant functional traits in a temperate desert region by regression kriging (RK), a method that combines regression modeling with kriging (Sarmadian et al., 2014; Pham et al., 2019). The objectives were to: (1) Select the functional traits of woody and herbaceous plants that play a dominant role in temperate desert ecosystems to construct the wMDS and hMDS, (2) determine the spatial distribution characteristics of C, N, and P cycling in temperate desert ecosystems using geostatistical methods, and (3) predict the spatial distribution characteristics of C, N and P cycling using linear and non-linear models based on the wMDS and hMDS. This study will advance our understanding of the relationship between plant functional traits and ecosystem function.
2 Materials and methods
2.1 Study site, sampling and experiment design
The study area is located in the Xinjiang Ebinur Lake Wetland National Nature Reserve on the southwestern edge of the Junggar Basin (44°30’ - 45°09’N, 82°36’ - 83°50’E). Surrounded by mountains on three sides, it is the lowest depression and water and salt enrichment centre (Wang et al., 2021a). In the Reserve, swamps, rivers, salt lakes, riparian forests, and deserts are the main landscapes. Aeolian sandy soil, grey brown desert soil, and grey desert soil are the zonal soils, and saline soil is the intrazonal soil. Central Asian and Mongolian flora is the main part of vegetation (He et al., 2014; Yang et al., 2014).
Three plots (100 m × 100 m) perpendicular to the Aqikesu River were set up from southwest to northeast (A-C) in the riparian forest-desert transition zone in the north of the Aqikesu River, and the distance between the plots was about 1.5 km (Figure 1). From July to August 2018, Herbaceous and woody plants were surveyed separately and the soil under the canopy of their collections was collected. Each plot was divided into 100 subplots (10 m × 10 m) (300 subplots totally), and the multiplicity, plant height (H), crown width (CW), leaf thickness (LT), leaf length (LL), leaf width (LW), DBH/basal diameter, leaf area (LA), and leaf fresh weight (LFW) of plants were recorded.
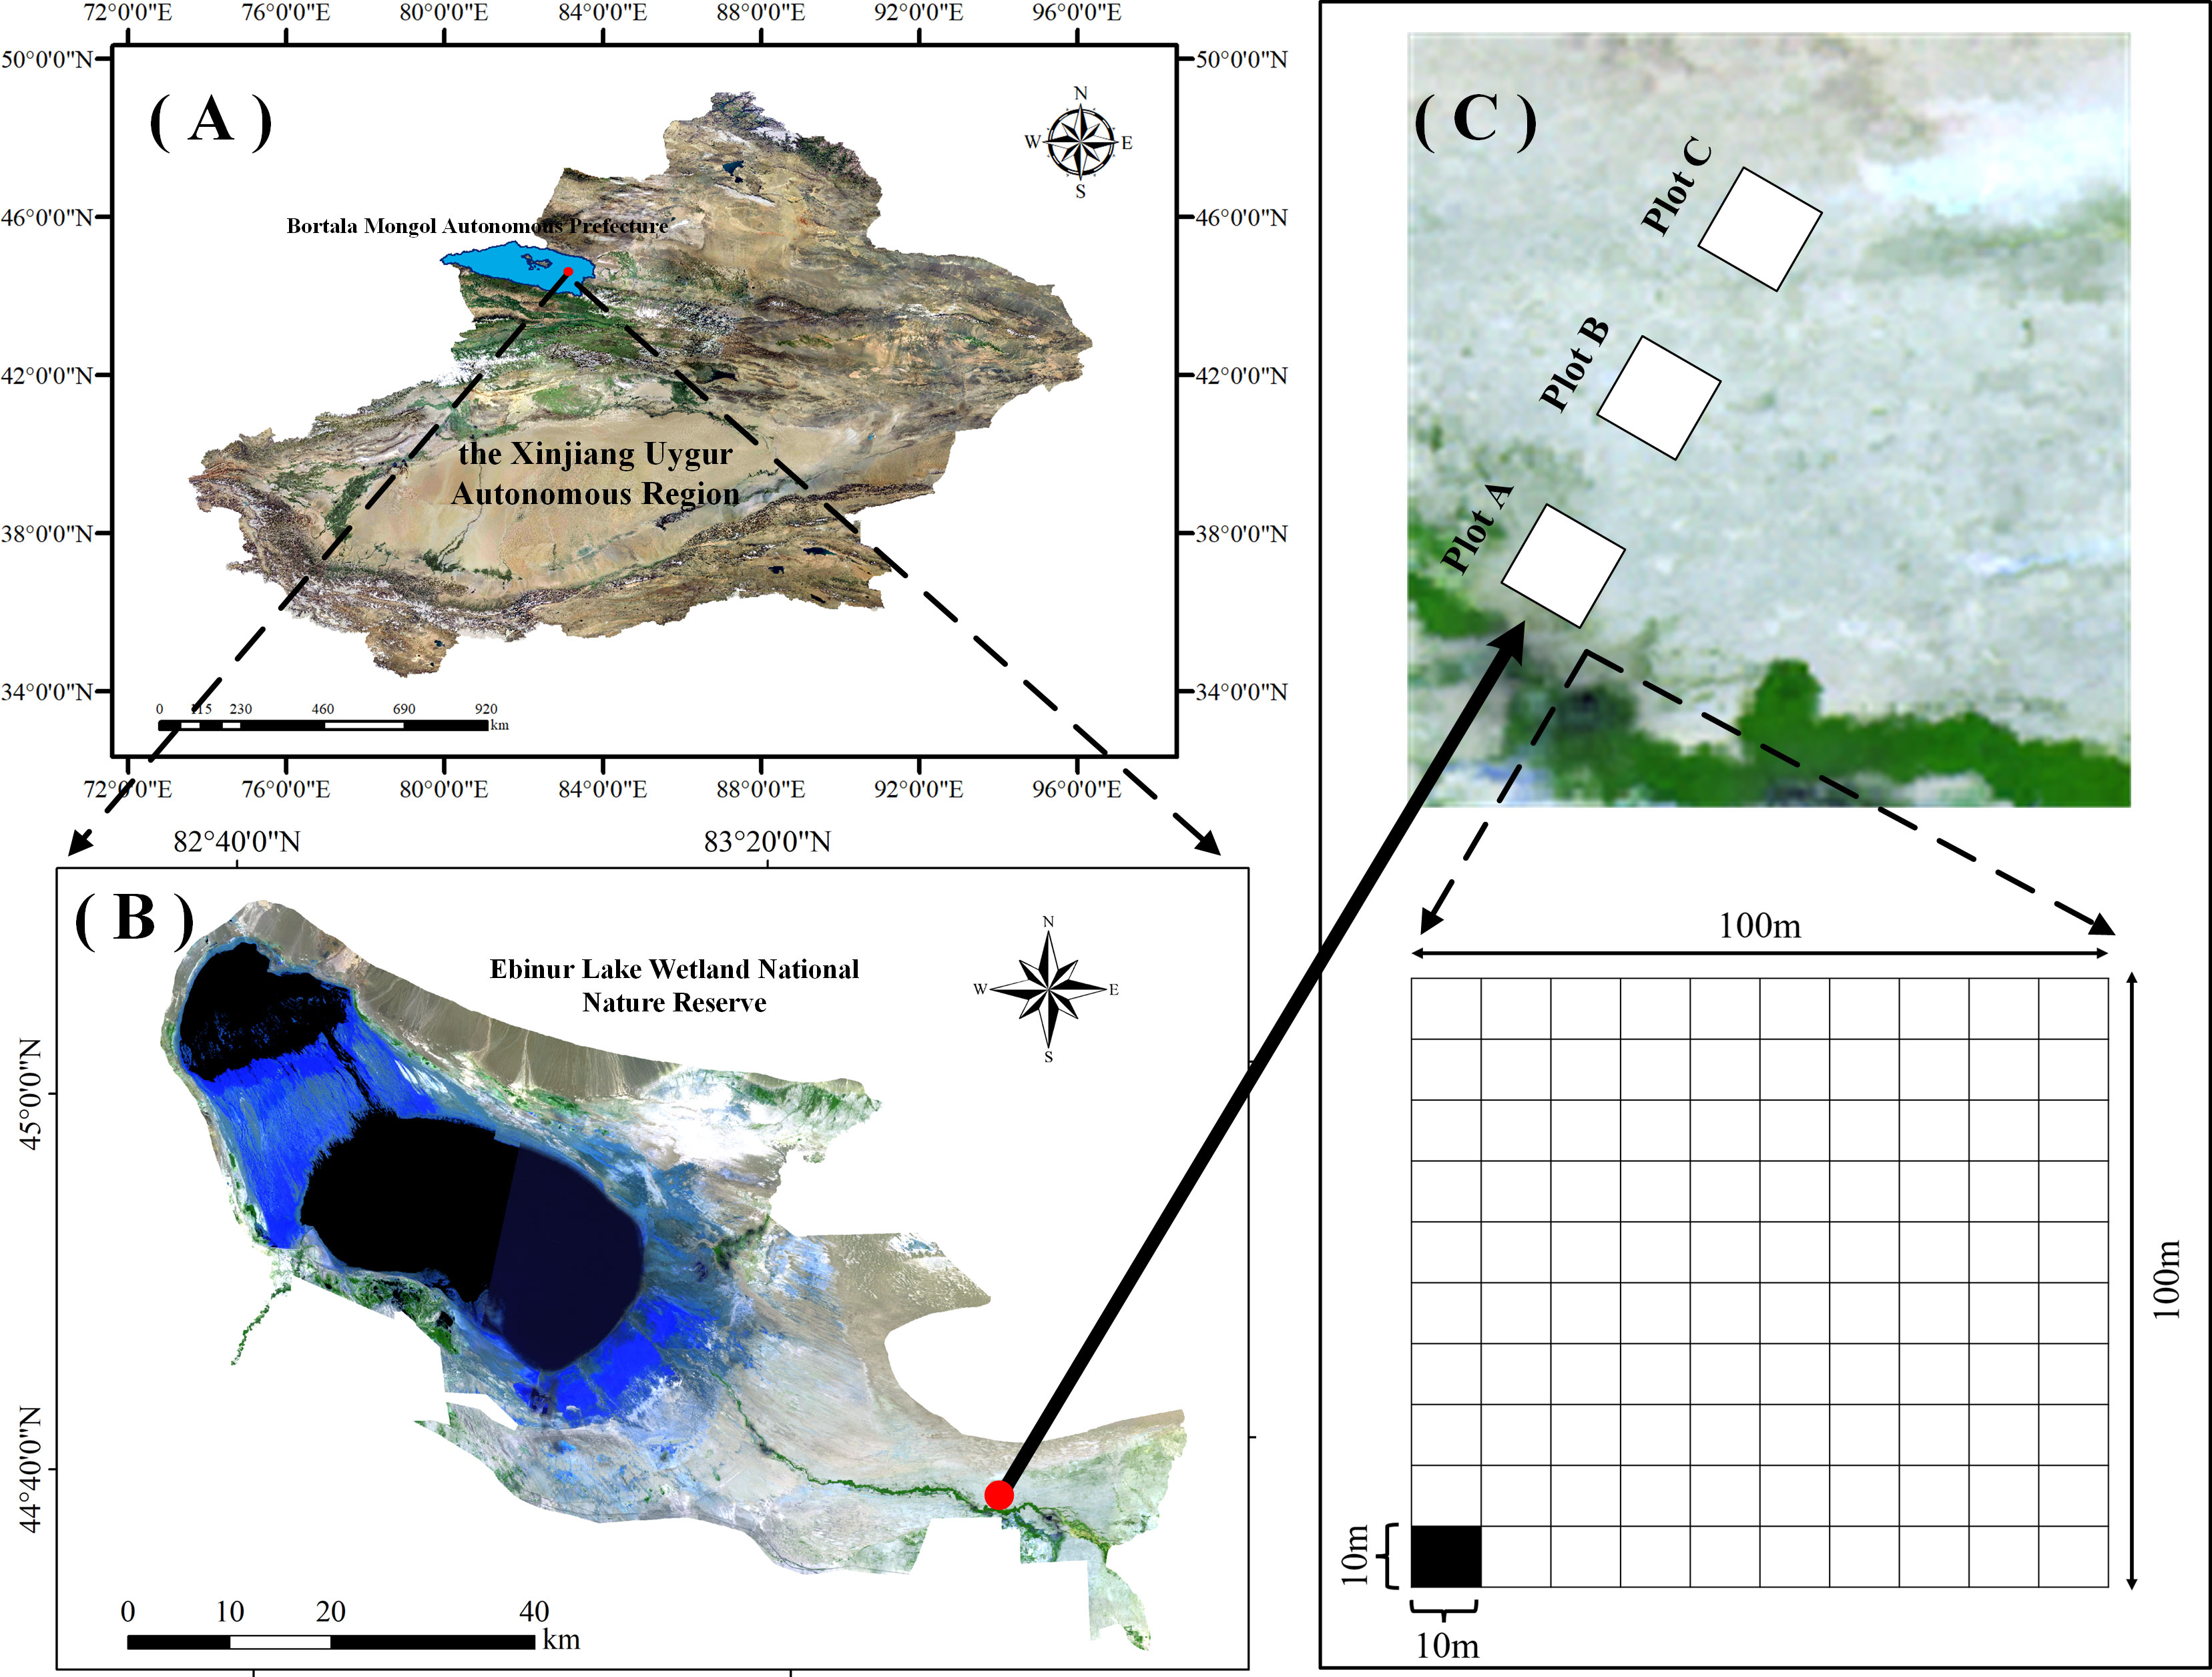
Figure 1 Overview map of the study area. (A) Ebinur Lake Basin, (B) the monitoring area within the basin, (C) and the sample sites. Plot A, Plot B, and Plot C represent river bank, transitional zone, and desert margin, respectively.
2.2 Plant and soil physicochemical experiments
Three plants of each species in each subplot were selected for the following determinations. The CW of trees was measured using a laser rangefinder (Dimetix-DAE-10-050, Dimetix, Switzerland), and that of shrubs and herbs was measured using a steel tape measure. For all trees in the subplots, the DBH was measured using a tape measure at a height of 1.3 m. For shrubs and herbs, the basal diameter was measured at 2.54 cm from the ground. Three to five leaves at each plant position (upper, middle, and bottom) were collected to determine the LT, LL, and LW using digital vernier caliper. To measure the LA, a 1 cm scale was marked on the lower right corner of a paper, then 10-20 leaves were laid flatly on the paper, followed by the photographing using a camera parallel to the paper. The pictures were processed using Photoshop software (2020CC, Adobe, USA) to obtain LA. After LA measurement, the leaves were transferred in sealed bags, weighed immediately (fresh weight), and dried for the measurements of dry weight and C, N, and P concentrations according to the methods of Bao (2000) (Table S1).
Within each subplot, five sampling points were selected along the diagonal, and the 0-30 cm soil layer was sampled at each sampling point for the determinations of soil C, N, and P concentrations (Bao, 2000) (Table S1).
2.3 Statistical analyses
2.3.1 CWM
The CWM was calculated as a sample of the functional trait values within each subplot, based on the species diversity in each subplot and the measured functional trait values.
where is the species abundance in a subplot, and is the functional trait value of a species in a subplot (Ren, 2021).
2.3.2 Construction of minimal data sets of plant functional traits
Sixteen plant functional traits were selected, including leaf carbon (LC), leaf nitrogen (LN), leaf phosphorus (LP), specific leaf area (SLA), specific leaf weight (SLW), LA, leaf dry matter content (LDMC), leaf water content (LWC), LFW, leaf dry weight (LDW), diameter at breast height (DBH) (stem base diameter (SBD)), H, LT, LL, LW, and width to length ratio (WLR) to perform Kaiser Mayer-Olkin (KMO) test and Bartlett’s test based on partial correlation. If tests were passed, factor analysis was performed on the selected traits. All above analyses were performed by using the psych and vegan package in R software (R Development Core Team, 2021).
The Norm value is an important reference for trait selection and MDS construction. The Norm value indicates the combined loading of a trait on multiple principal components with PC ≥ 1. So the larger the Norm value of a trait, the higher its combined loading value, and the more information on the principal components with PC ≥ 1 it has (Wu et al., 2019). Norm values were calculated as follows:
where is the combined loadings of the ith variable on k principal components with eigenvalue ≥ 1(Norm value), is the loading of the ith variable on the kth principal component, and is the eigenvalue of the kth principal component (Wu et al., 2019).
Based on the results of the factor analysis, principal component variables with eigenvalues greater than 1 (PC > 1) were screened out. Among the variables, the traits with factor loadings |PC| ≥ 0. 5 were screened out and grouped by different principal component variables. If a trait had a factor loading value |PC| ≥ 0.5 in two main variables, it was classified into the group with the lower correlation. Norm values of each group of traits were compared. Traits with Norm values in the top 10% in each group were retained, and the rest was discarded. If there were multiple traits in the top 10%, the correlations between the trait with the highest Norm value in each group and the traits in the top 10% were checked. If the correlation coefficient |r| ≥ 0.5, then the trait with higher Norm value and coefficient of variation was put into the MDS. If |r|< 0.5, then both were put into the MDS (Pulido et al., 2017).
2.3.3 Minimum data set test model
Linear and non-linear scores of each trait was used to assign scores to the functional traits in the MDS:
where SL is the score derived from the linear score, ranging from 0 to 1, X is the value of a functional trait in the MDS, and Xmax and Xmin are the maximum and minimum value of each functional trait, respectively.
Equation (3) was applied to positive functional traits (the higher the value, the better the plant growth), while equation (4) was applied to negative functional traits (the lower the value, the better the plant growth) (Askari and Holden, 2014; Li et al., 2020a). The formula for the non-linear function:
where SNL is the score derived from the non-linear score, ranging from 0 to 1, a is the maximum value that can be obtained for a functional trait, which is defined as 1 in this study, X is the value of a functional trait in the MDS, Xm is the average value of a functional trait, and b is the slope, which is set to -2.5 for positive functional traits and +2.5 for negative functional traits (Zhang et al., 2011a; Raiesi, 2017).
After all functional traits in the MDS were assigned a score, the scores of all functional traits were summed using the following formula. The evaluation index FTEIA is the average of the scores of the traits in the MDS, while FTEIW is the sum of the scores of the functional traits multiplied by the corresponding weights (Askari and Holden, 2015).
where FTEIA and FTEIW are the functional trait evaluation indices calculated without and with weights, respectively, Si is the score of the functional trait i, n is the number of functional traits in the MDS, and Wi is the weight of the functional trait i. The weight was determined by the ratio of the characteristic roots of the principal component of functional trait i in the PCA analysis to the sum of all characteristic roots in the MDS (Guo et al., 2017; Jin et al., 2018).
2.3.4 Ecosystem functions
The three ecosystem functions were the C, N, and P cycling in this study. The C cycling indicators included plant organic carbon and soil organic carbon, the N cycling indicators included soil nitrate nitrogen, ammonium nitrogen, and total nitrogen, and plant leaf total nitrogen, the P cycling indicators included soil available phosphorus and total phosphorus and plant leaf total phosphorus. All above were calculated by the average method (Maestre et al., 2012; Bowker et al., 2013).
where EF is a single ecosystem function, fi is the measured value of function i, ri is the mathematical function that converts fi to a positive value, g is the normalization of all measured values, and n represents the number of functions measured.
2.3.5 Linear and non-linear predictive models
In this study, linear and non-linear models were used to predict the functions of single ecosystems based on the MDSs of plant functional traits. Models selected 70% sample size of C, N and P cycle indices of each first-level plot (100 m × 100 m) for training, and the remaining 30% sample size for model verification. The linear model was constructed by using partial least squares regression (PLS), which was based on covariance regression. PLS models can effectively catch the unique contributions of each independent variable to overcome multicollinearity. PLS models were constructed by the pls package in R software (Ge et al., 2018; Tan et al., 2020).
The non-linear model was constructed by using the Random Forest (RF) and BP neural network (BPNN). RF algorithm was based on the statistical learning theory of decision trees, which can effectively process high-dimensional data and overcome the overfitting. In this study, the RF model set the number of trees to 100, the GBM used the default setting, the maximum number of iterations was set to 500, the linear output unit was used, and the grid was set with the option to optimize the hyperparameters. The model constructions using the RF were completed by using the random Forest package (Breiman, 2001; Poggio et al., 2019; Vilchez-Mendoza et al., 2022). BPNN model is a multi-layer feed-forward neural network that continuously approximates the desired output based on the backward transmission of errors to obtain a prediction. In this study, the BPNN model built four hidden layers with five nodes in each layer and used backprop algorithm for calculation. The model constructions using the BPNN were completed by using the neural net package (Huang et al., 2019a; Morais et al., 2021).
Root mean square error (RMSE) and mean absolute error (MAE) were used to test the accuracy of the predictive models (Qiu et al., 2010; Guo et al., 2013; Knadel et al., 2021).
where is the predicted value of a subplot, is the measured value of a subplot, and N is the number of subplots. The smaller the RMSE and MAE, the higher the prediction accuracy.
2.3.6 Geostatistical analysis
2.3.6.1 Regression kriging
Regression kriging (RK) is a spatial interpolation technique that performs kriging interpolation on the prediction residuals by combining the regression of the dependent variable on the predictor variables (such as environmental variables) (Hengl et al., 2004). That is to say, RK is a hybrid method that combines a simple or multiple linear regression model with ordinary kriging for predicting residuals. RK allows the auxiliary variables to interpolate the dependent variables at unsampled locations (Hengl et al., 2007). In this study, Partial least squares kriging (PLSK) (Guo et al., 2021), Random forest kriging (RFK) (Breiman, 2001; Behnamian et al., 2017), and Back propagation neural network (BPNNK) models were constructed (Li et al., 2017; Chen et al., 2020). Regression Kriging (RK)was constructed using the predicted values from the PLS, RF and BPNN models in combination with the Ordinary Kriging (OK) method. Aim of this method was to establish linear and non-linear mapping relationships between the MDSs and a single ecosystem function by PLS, RF, and BPNN. Relative coordinates were established in each subplot, and then the residual terms were spatially interpolated using the OK method to obtain the final prediction results. This was completed by using the automap and gstat packages (Meng and Liu, 2013; Mukherjee et al., 2015).
where is the interpolation result at the predicted subplot , is the deterministic part of the fitting by regression, is the interpolation result on the regression residuals by OK method, k is the position number in the fitting by regression, p is the sample size of the regression model based on the predicted values, is the coefficient of the regression model, is the intercept when k=0, i is the position number at the regression residual interpolation, n is the sample size for kriging interpolation of the residual value based on the predicted values, is the value of the auxiliary variable at the predicted position , is the OK interpolation weight determined by the spatial correlation structure of the regression residual, and is the residual at position .
2.3.6.2 Semi-variable functions
The traits were tested for normal distribution before geostatistical analysis. If the traits did not follow normal distribution, they would be transformed with Box-Cox (Wang et al., 2021a). The spatial variability of ecosystem functional diversity was analyzed using geostatistical software (GS+, version 9.0, Gamma Design Software. LLC, USA), and a semi-covariance function model was fitted. By analyzing the nugget (C0), structural variance (C), sill (C0 + C), variation range (Range), and nugget-sill ratio (C0/(C0 + C)), the proportion of nugget variance in total spatial heterogeneity variance was determined, i.e. the proportion of structural variance in the total variance. It is often used to describe the degree of variation in the spatial heterogeneity of study objects. If C0/(C0 + C)< 25%, the variable has strong spatial autocorrelation; if C0/(C0 + C) is between 25% and 75%, the variable has moderate spatial autocorrelation among the variables; if C0/(C0 + C) > 75%, the variable has weak spatial autocorrelation (Robertson et al., 1993; Zartman, 2005).
where γ(h) is the semi-variance of the interval class h, N(h) is the number of samples separated by the lag distance, and Ai(xi) and Ai(xi+h) are the measurement variables for spatial locations i and i+h, respectively. There are four types of models: linear, spherical, exponential, and Gaussian. The coefficient of determination (R2) and the residual sum of squares (RSS) were used to select the best-fitting model. The larger the R2, the smaller the RSS, the better the model fitted (Cambardella et al., 1994; Wang et al., 2021b).
3 Results
3.1 Indicators of minimum data set of functional traits
In the three plots (A-C), where were the species and frequencies of plant in Table S2, the wMDS and hMDS were constructed based on the functional traits of woody and herbaceous plants in the subplots (Table 1). The results showed that the SBD, H, LT, LL, LW, and WLR of herbaceous plants in plot C were different (P< 0.05) from those of herbaceous plants in plots A and B. The SBD and H in plot B was different (P< 0.05) from those in plot A. Therefore, the functional traits of woody and herbaceous plants in the three plots were combined to construct wMDS and hMDS.
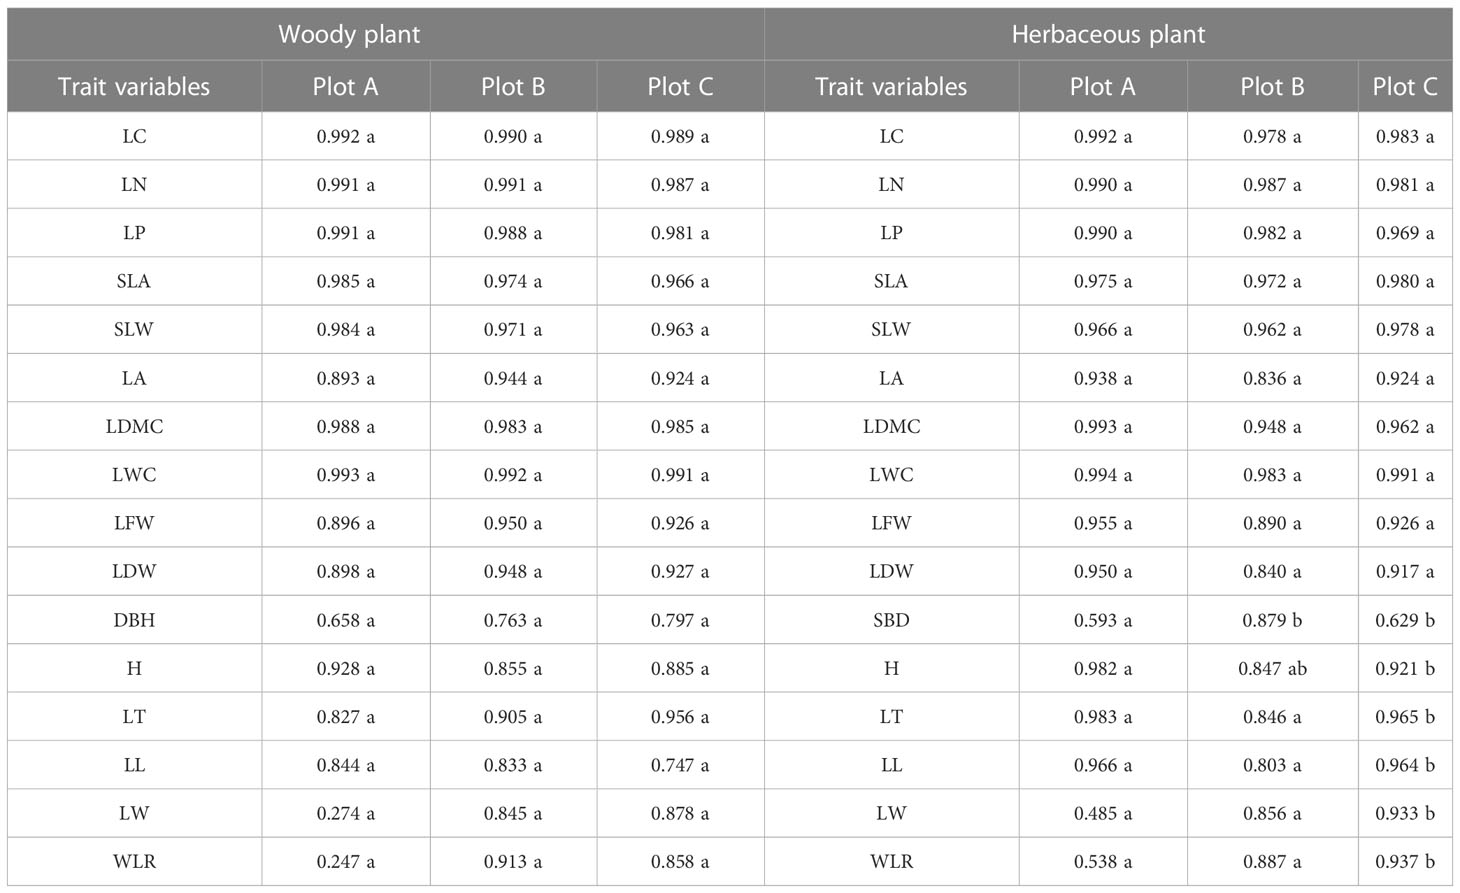
Table 1 Analysis of variance for functional traits of woody and herbaceous plants in plots A, B and C.
The KMO test based on partial correlation on the CWMs of the 16 plant functional traits showed that the KMO value of woody plants was 0.77 (P< 0.001), with Bartlett’s test P< 1.7e-16, and that of herbaceous plants was 0.74 (P< 0.001), with Bartlett’s test P< 2.2e-16. This indicates that there is a correlation between the woody and herbaceous functional traits, and it is suitable for factor analysis.
Based on the results of the factor analysis (Table 2), the CWMs of the 16 woody plant functional traits were initially divided into seven groups. For group 1, because the ratios of the Norm values of LC, LN, LP, and LL to that of H were less than 90%, H was included in the wMDS. For group 2, the ratio of the Norm value of SLW to that of SLA was higher than 90%, and the Pearson correlation analysis (Figure 2A) showed that the correlation coefficient was greater than 0.5, thus SLA was included in the wMDS. With the same screening method as group 2, the LDW, LWC, and LW were included into the wMDS for groups 3, 4, and 7, respectively. Group 5 and 6 only had DBH and LT, respectively, which were included into the wMDS. Therefore, seven traits (H, SLA, LDW, LWC, LW, DBH, and LT) were ultimately included in the wMDS.
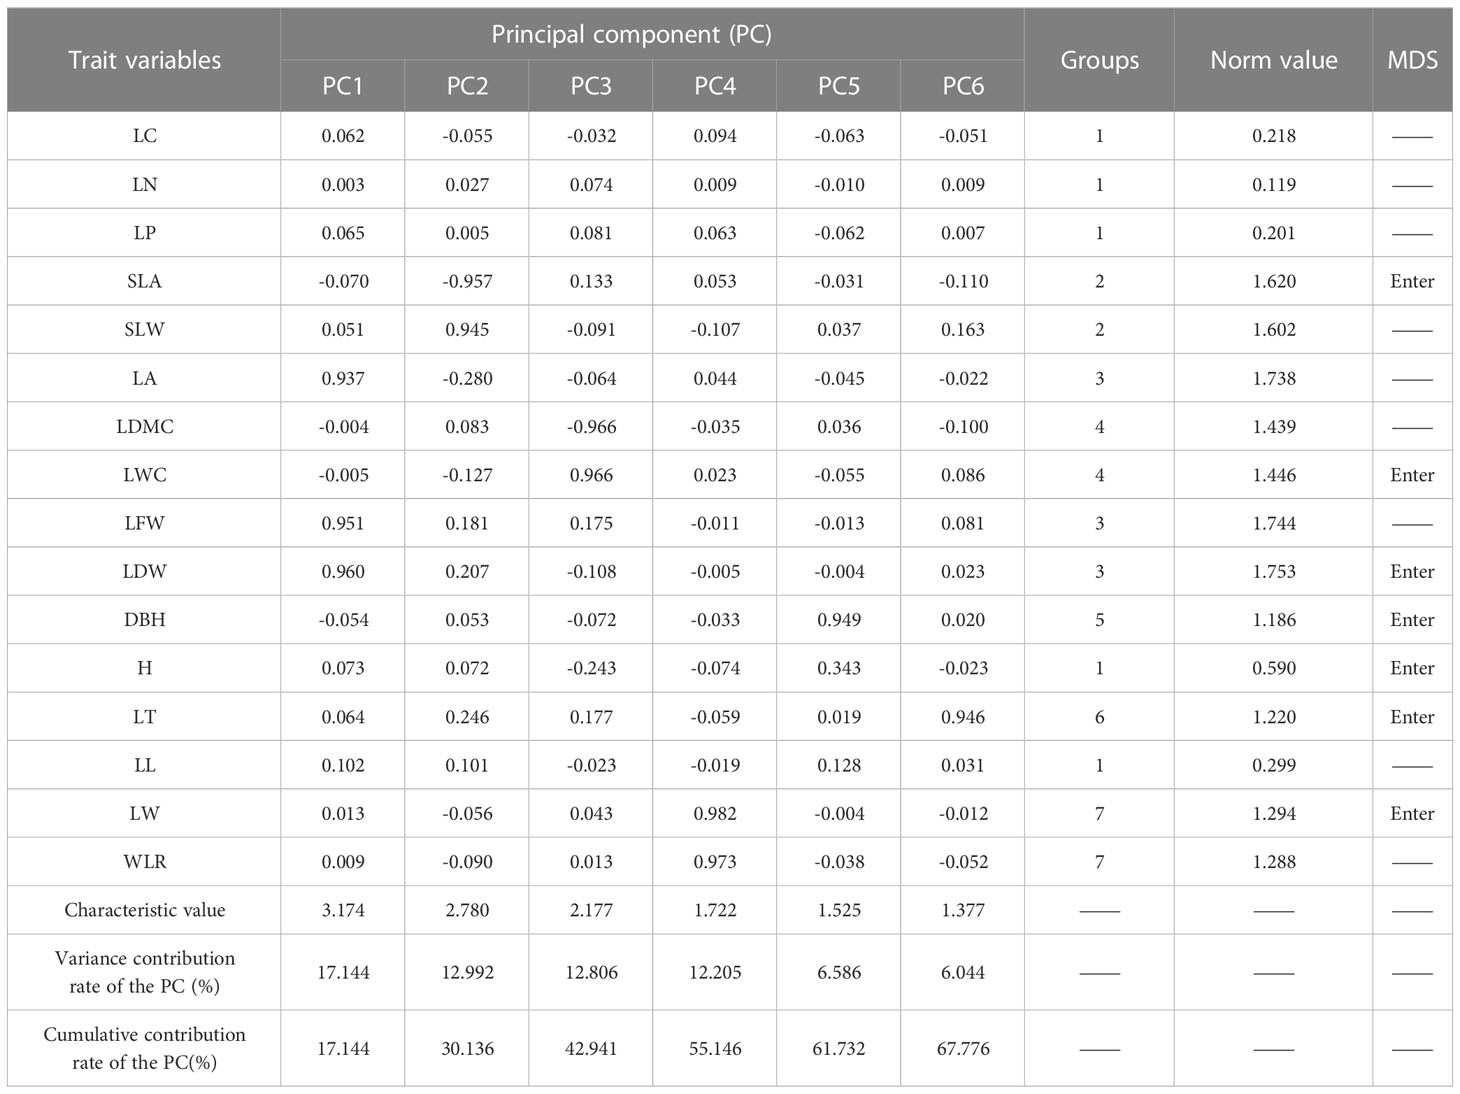
Table 2 Factor loading matrices, groupings and Norm values for functional traits in woody plant communities.
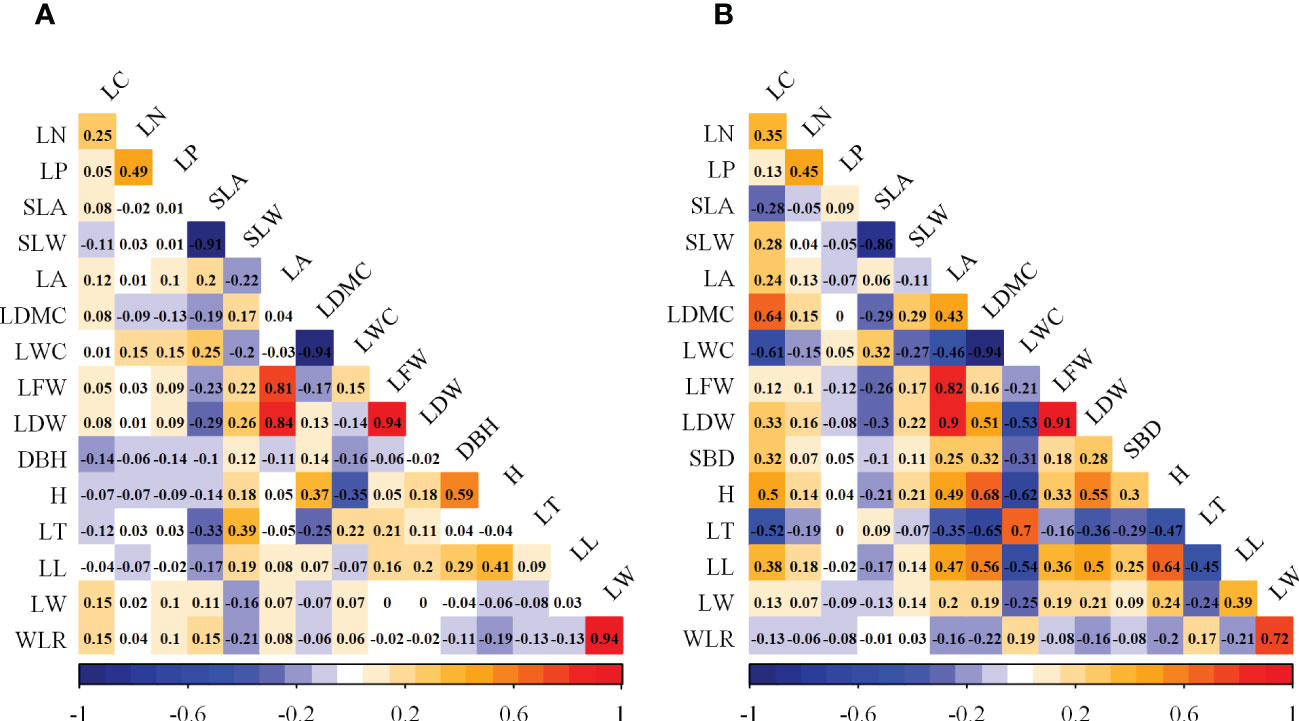
Figure 2 Pearson correlation analysis of functional traits in woody and herbaceous communities. (A) Woody functional trait indicators; (B) Herbaceous functional trait indicators.
The CWMs of herbaceous plant functional traits were divided into six groups (Table 3). For group 1, the ratio of the Norm values of LC, LN, LP, SBD, and LT to that of H was lower than 90%, then H was included in the hMDS. For group 2, the ratio of the Norm value of SLW to that of SLA was higher than 90% and the Pearson correlation analysis (Figure 2B) showed that the correlation coefficient was greater than 0.5, then SLA was included in the hMDS. With the same screening method as group 2, LFW, LWC, and LW were included in the hMDS for groups 3, 4, and 6, respectively. Group 5 had LL only. Therefore, six traits (H, SLA, LFW, LWC, LW, and LL) were ultimately included in the hMDS
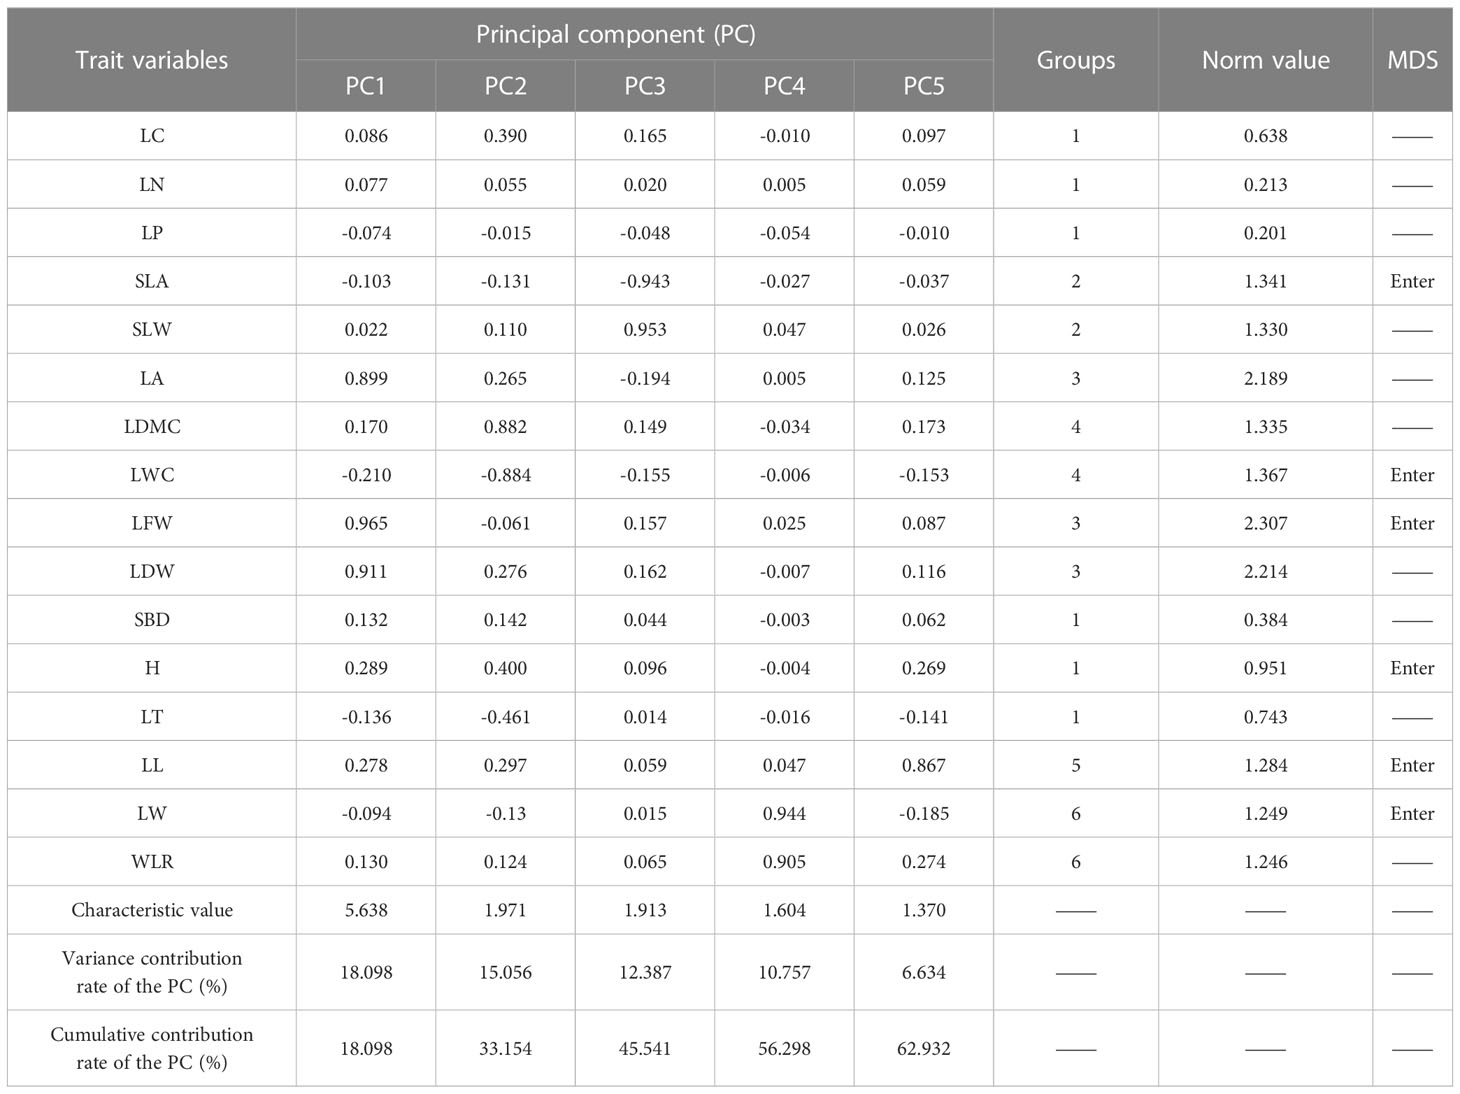
Table 3 Factor loading matrix, groupings and Norm values for functional traits in herbaceous communities.
3.2 Minimum data set test
Four cross-validation methods including FTEIW - L (linear weight evaluation method), FTEIA - L (linear average evaluation method), FTEIW - NL (non-linear weight evaluation method), and FTEIA - NL (non-linear average evaluation method) were used to test the correlation between MDS and TDS in this study. The R2 of the linear regression of FTEIW - L, FTEIA - L, FTEIW - NL, and FTEIA - NL of MDS and TDS of woody plants were 0.29, 0.34, 0.75, and 0.57, respectively, and those of herbaceous plants were 0.82, 0.75, 0.76, and 0.68, respectively. Overall, the test results by FTEIW - L, FTEIA - L, FTEIW - NL, and FTEIA - NL all showed significant correlation (Figure 3).
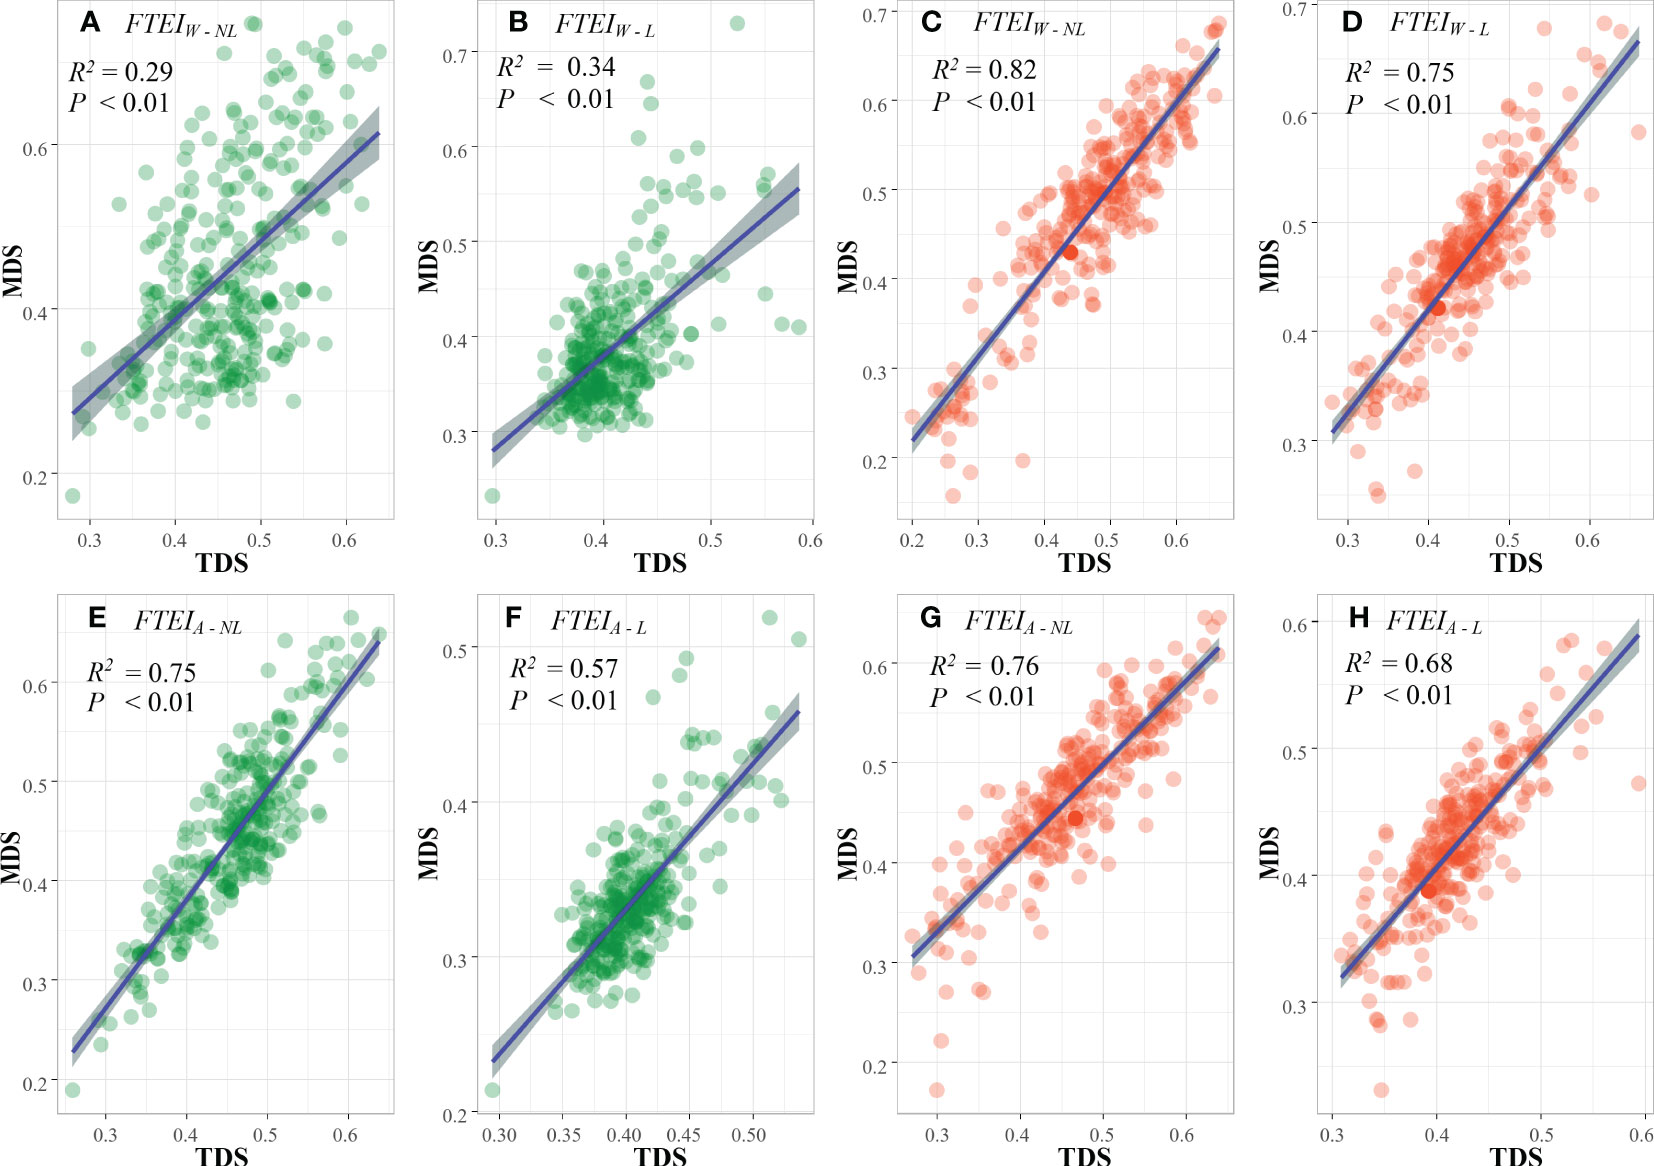
Figure 3 Regression analysis of four cross-tests for MDS and TDS. (A, B, E, F) are MDS tests for woody functional traits; (C, D, G, H) are MDS tests for herbaceous functional traits.
In this study, the SL method outperformed the SNL method when the same evaluation system was used (Figure 3). By comparing different traits, it was found that the correlation coefficients calculated by FTEIA were higher than those calculated by FTEIW under the same assignment function method. Furthermore, MDS and TDS showed a positive correlation (P< 0.001) in all the resultant models tested by cross-validation. Therefore, the constructed wMDS and hMDS can replace TDS.
3.3 Spatial distribution characteristics of ecosystem functions
The optimal semi-variance function model for predicting C cycling based on the raw values, wMDS, and hMDS was the exponential model. The analysis results of C0/(C0 + C) showed that the structure of spatial variability had strong spatial autocorrelation (Table 4). This suggests that the spatial distribution of C cycling is mainly influenced by structural factors. The optimal semi-variance models based on raw and predicted values of N cycling were exponential and Gaussian models (Table 5). Except for the moderate spatial autocorrelation of the PLS model-predicted values based on the wMDS in plot B, the C0/(C0 + C) of the remaining raw and predicted values also showed strong spatial autocorrelation. This indicates that there is an error in PLS prediction accuracy and the spatial heterogeneity is dominated by structural factors. The optimal semi-variance models based on raw and predicted values of P cycling were exponential and Gaussian models (Table 6). The C0/(C0 + C) of raw values and predicted values based on wMDS for plot B showed moderate spatial autocorrelation, while that of the remaining values showed strong spatial autocorrelation, with structural factors dominating spatial heterogeneity. In summary, the C, N, and P cycling showed strong spatial autocorrelation, and the prediction accuracy of the RF and BPNN models were better than that of PLS model. By comparing the C, N, and P cycling predicted results of the three models based on the wMDS, it was found that the prediction accuracy of the RF model was higher than that of the BPNN and PLS models (Figures 4A–C). Furthermore, the same results were obtained by comparing the predicted results of the three models based on the hMDS (Figures 4D–F).

Table 4 Statistical parameters of the ecosystem C cycle function.
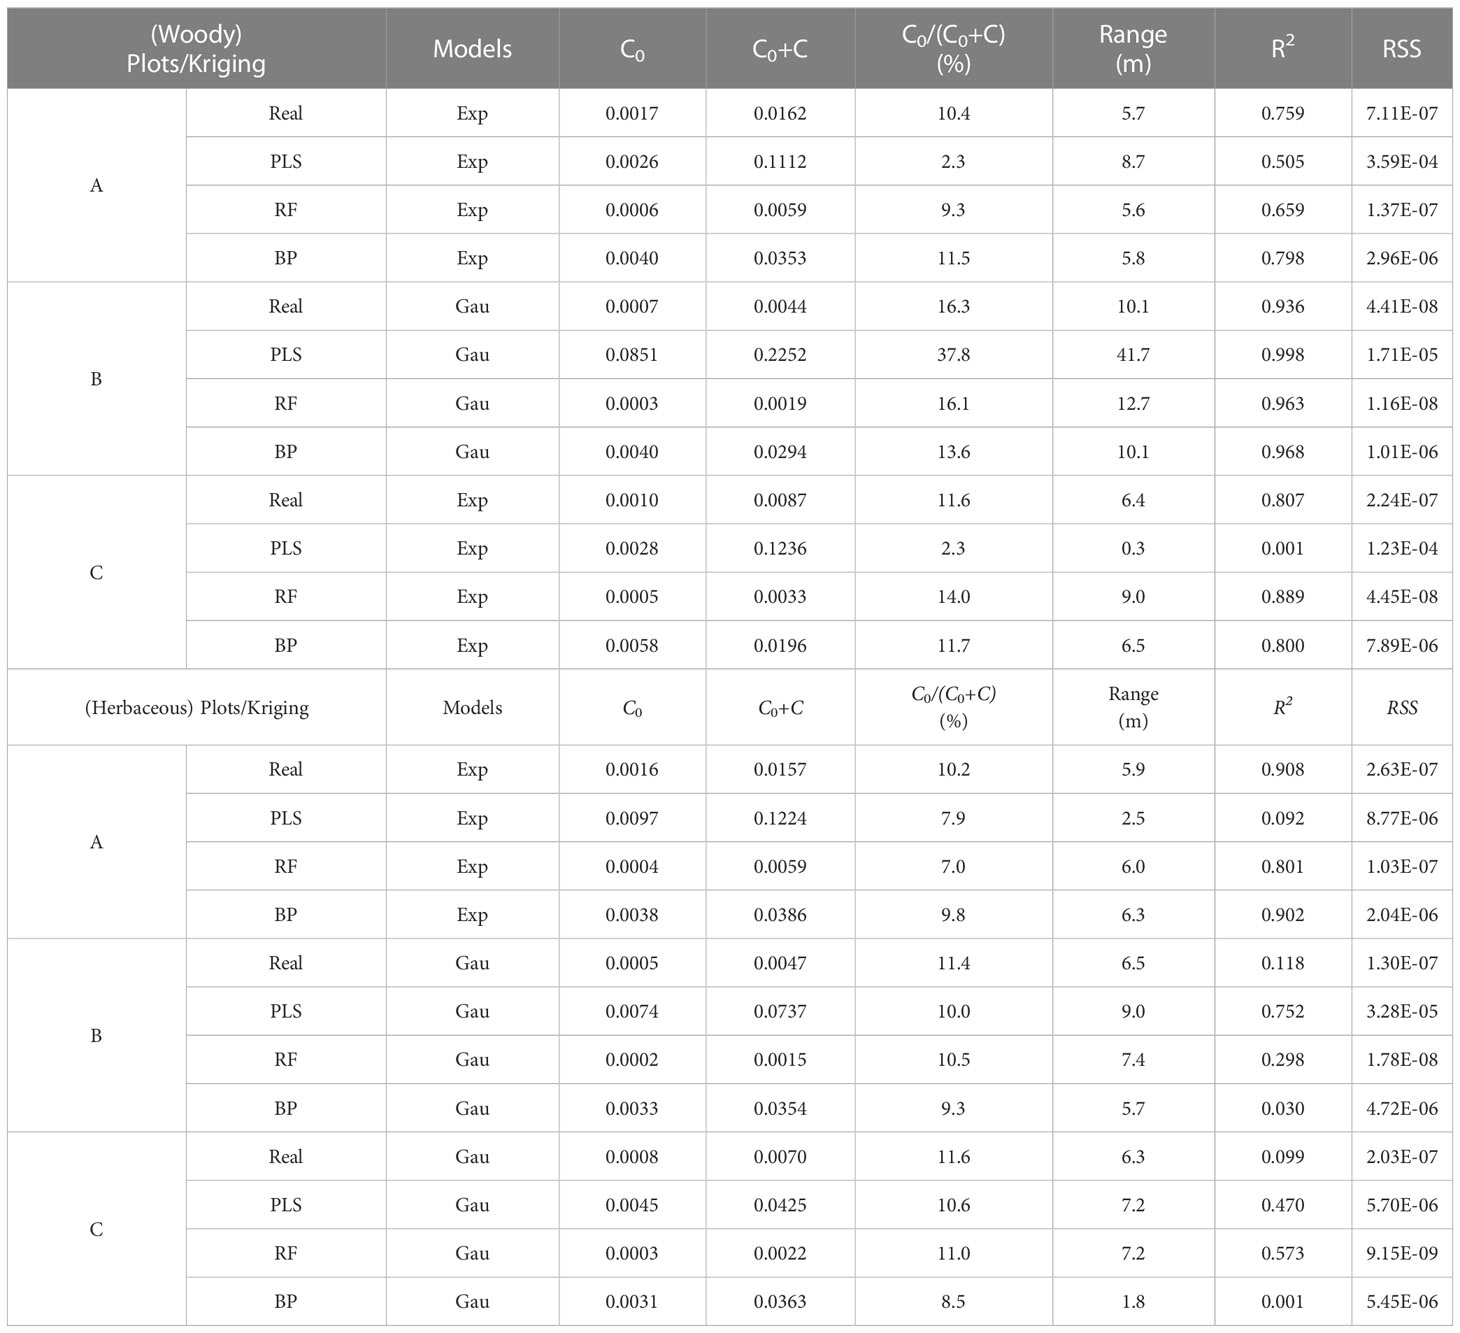
Table 5 Statistical parameters of the ecosystem N cycle function.

Table 6 Statistical parameters of the ecosystem P cycle function.
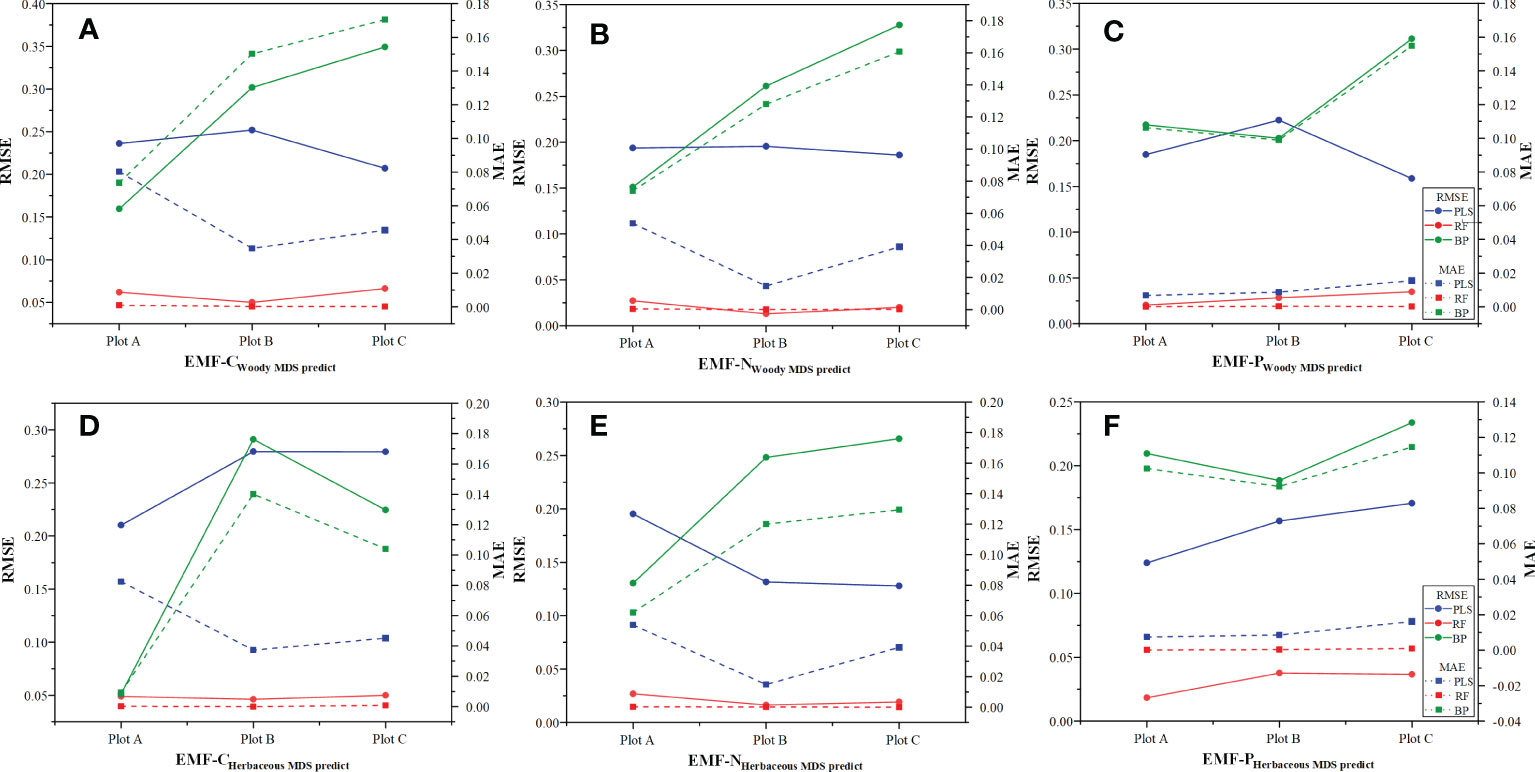
Figure 4 Prediction model accuracy tests. (A–C) are ecosystem functions predicted by MDS for woody functional traits; (D–F) are ecosystem functions predicted by MDS for herbaceous functional traits.
The OK results showed that the ecosystem function C, N and P cycles from river bank to desert margin (Plot A-C). The C cycle of woody plants firstly decreased and then increased with gradients (Figure 5), while the carbon cycle of herbaceous plants was the opposite. The N cycles in both woody and herbaceous plants were weakened along the gradients (Figure 6). The P cycle of herbaceous plants was continuously decreased while the woody plants were continuously increased (Figure 7).
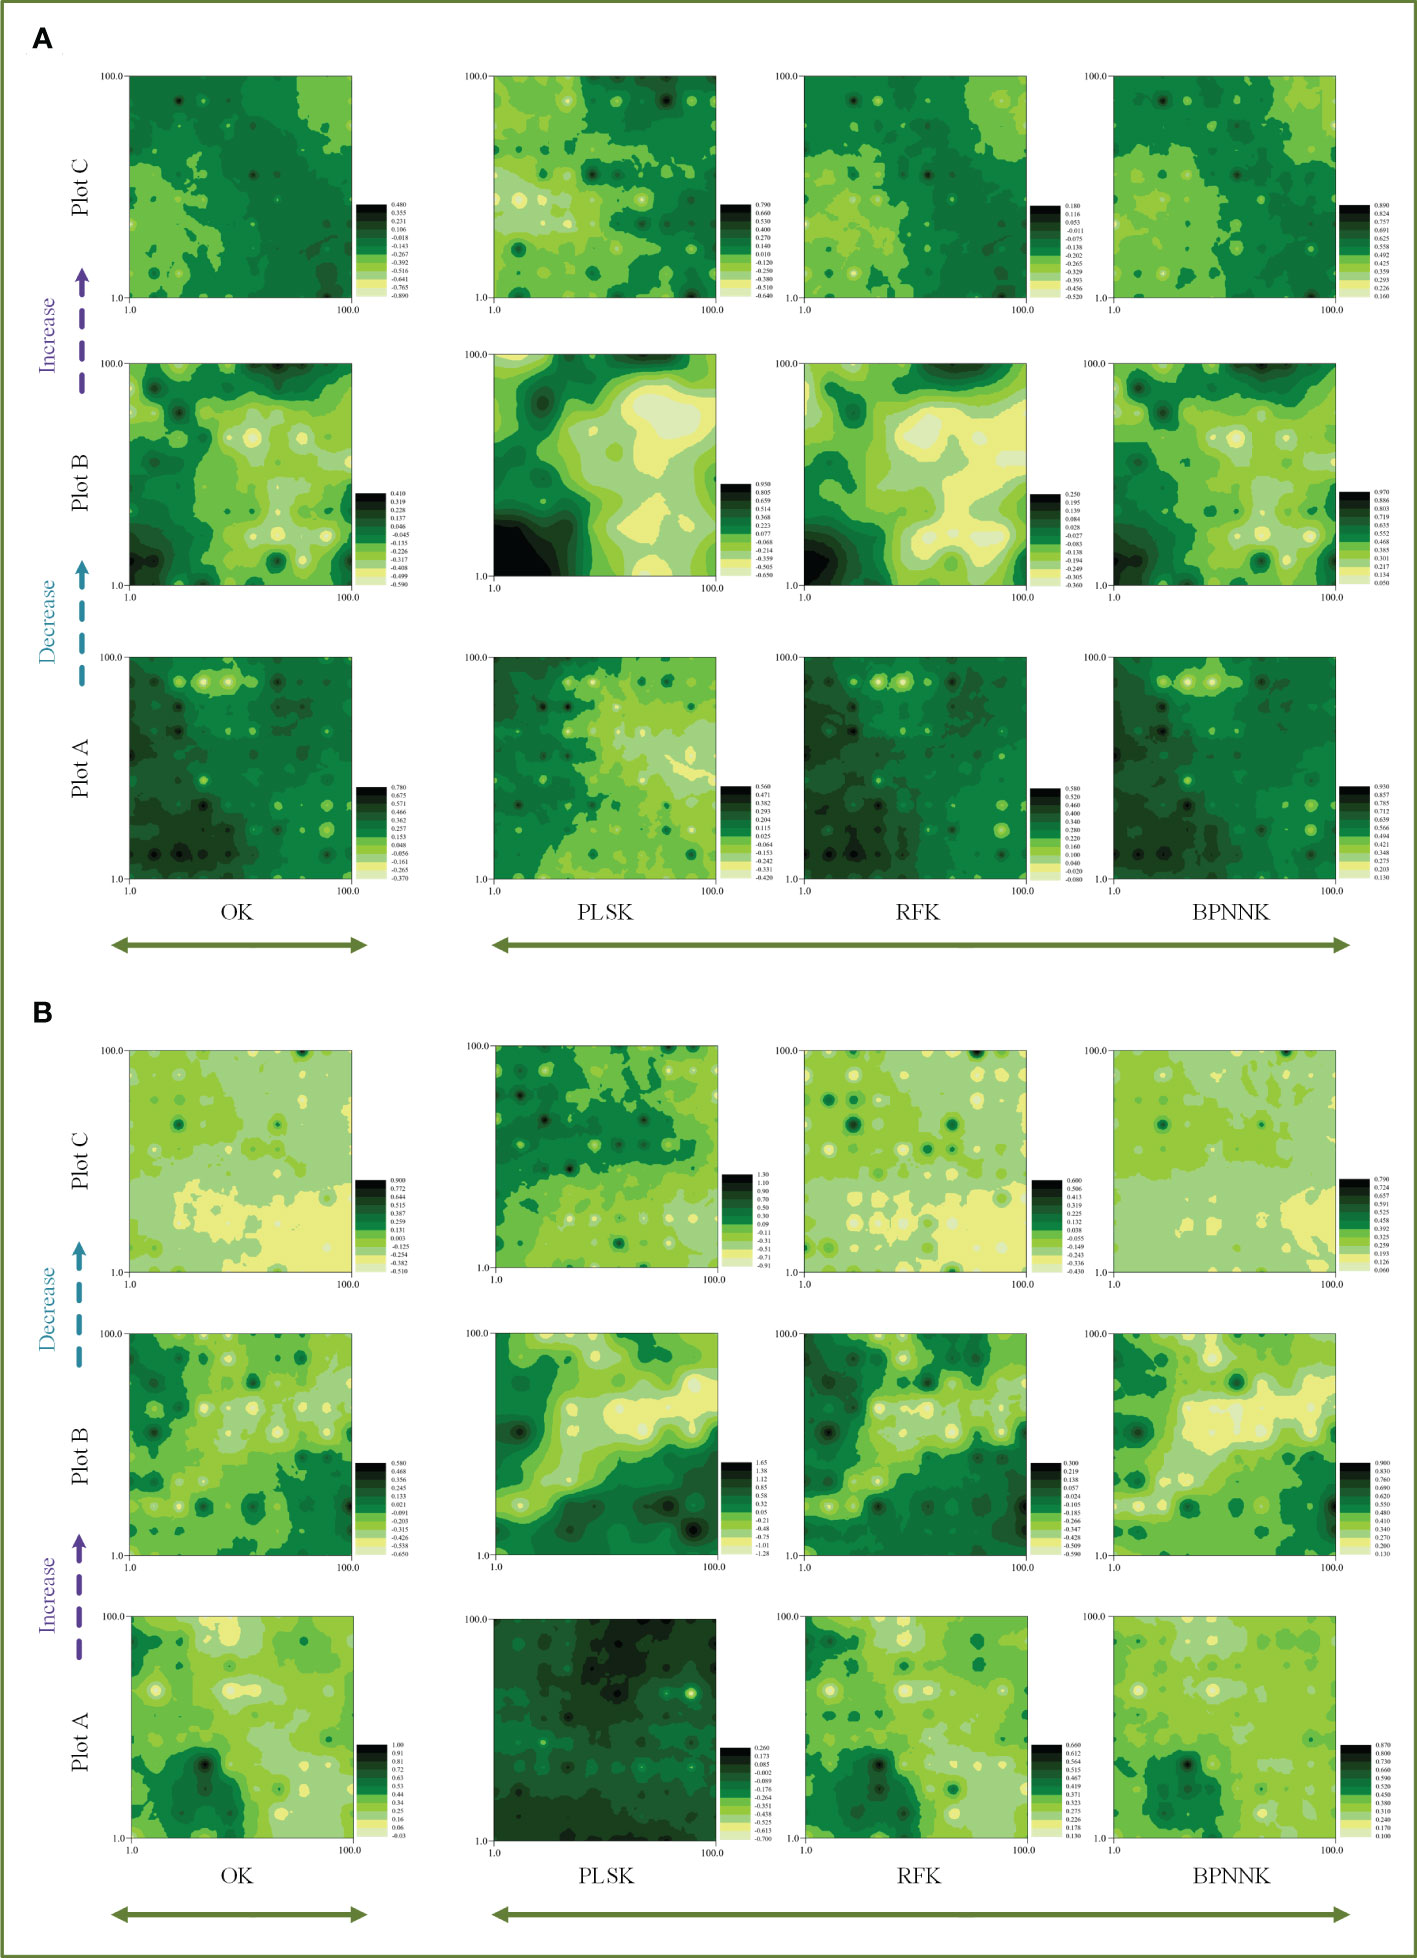
Figure 5 Spatial distribution characteristics of the carbon cycle, OK, Ordinary Kriging. (A, B) are the spatial distribution characteristics of carbon cycle prediction of woody MDS and herbaceous MDS respectively, PLSK, Partial least squares Kriging; RFK, Random forest Krieger; BPNNK, BP neural network Kriging.
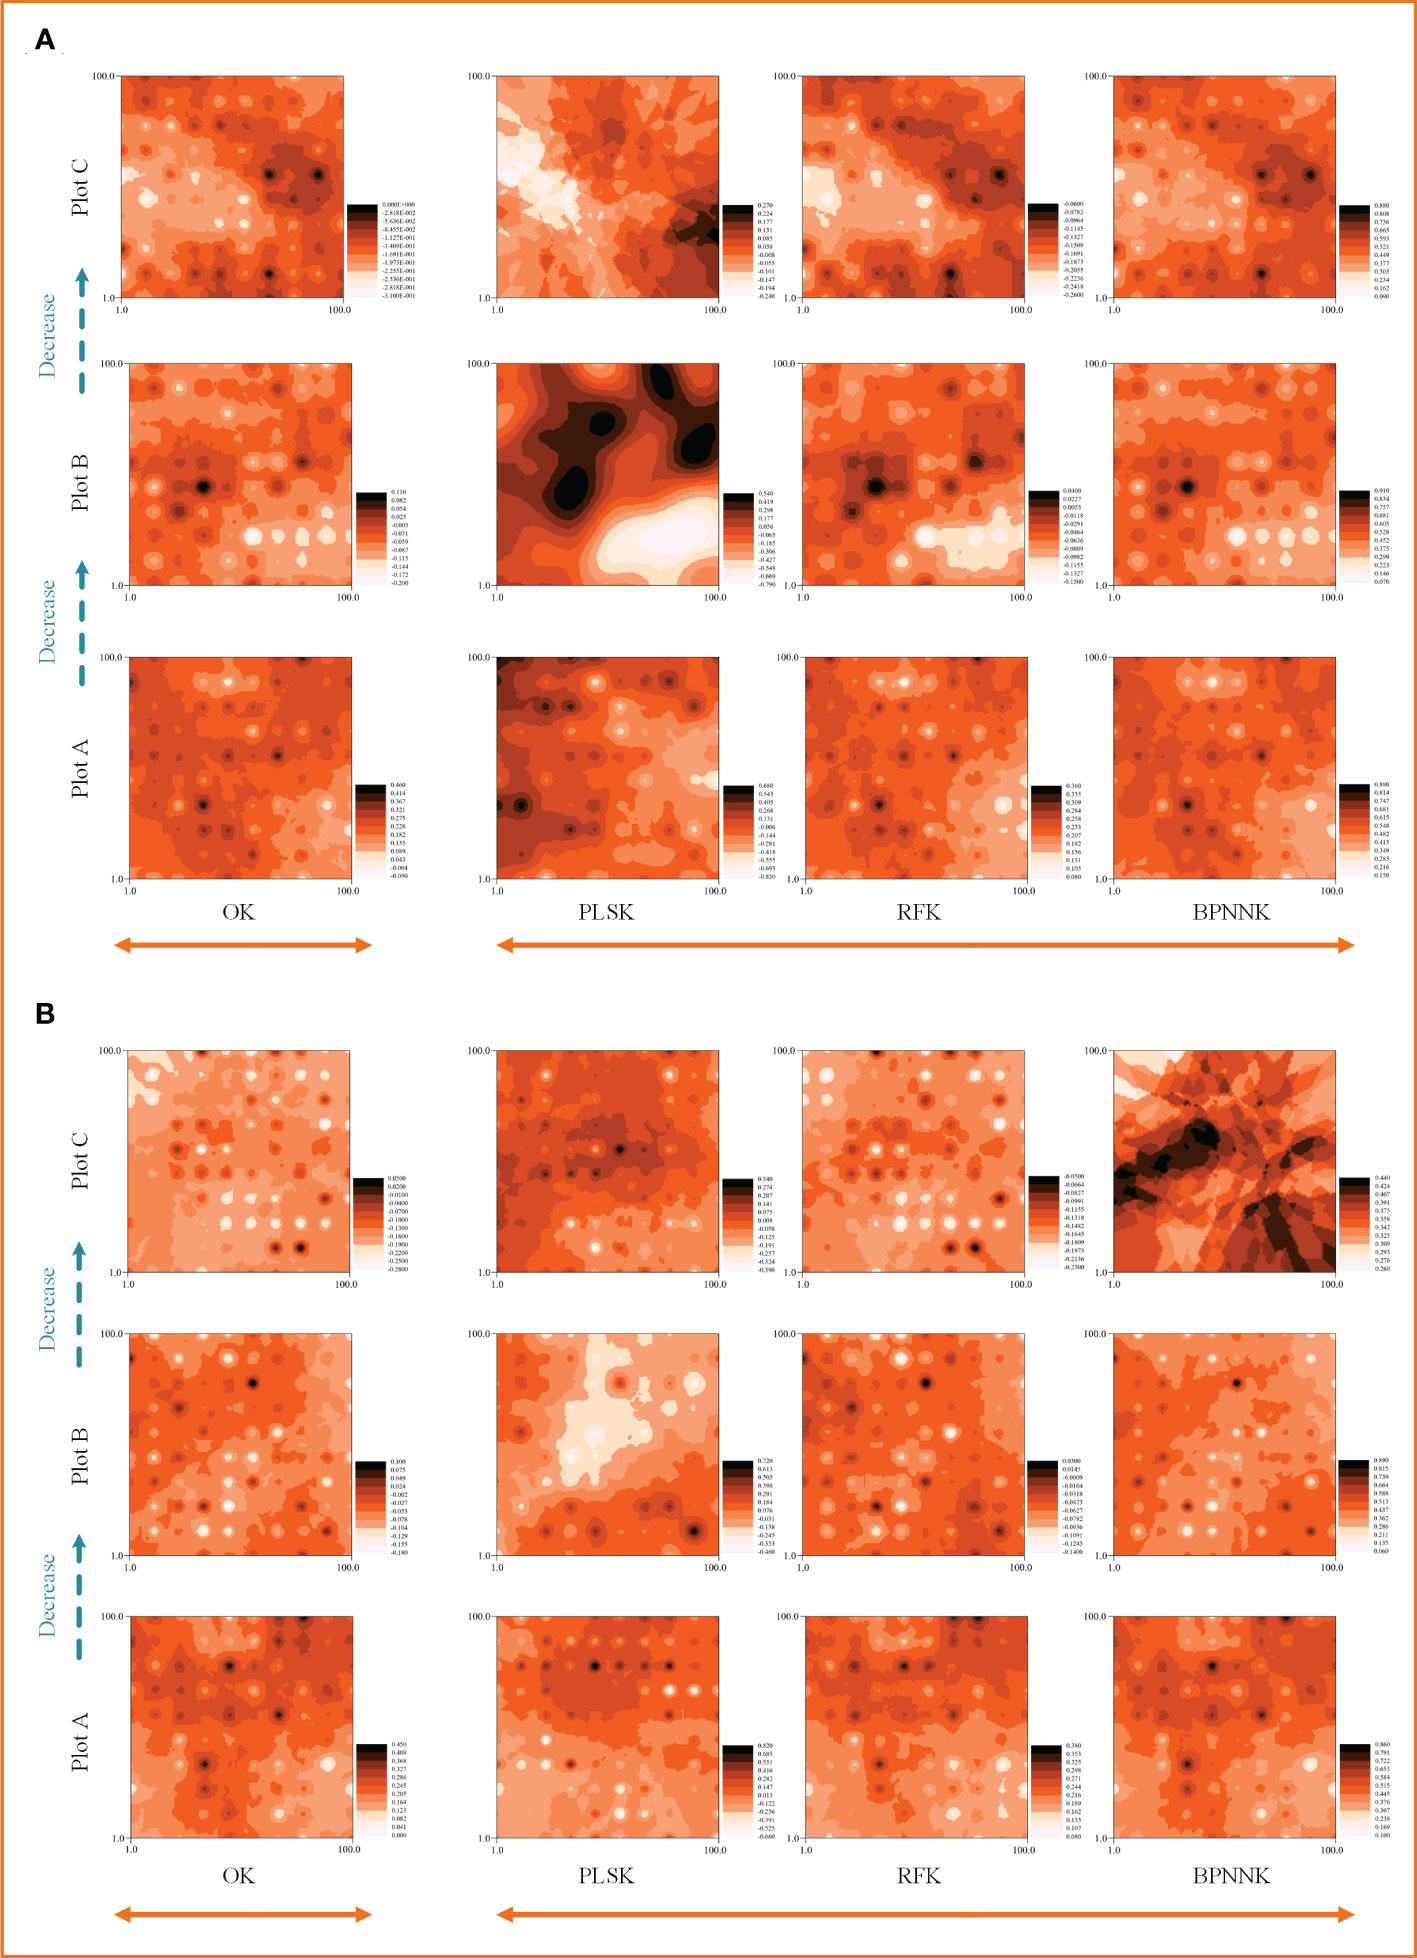
Figure 6 Spatial distribution characteristics of the nitrogen cycle, OK, Ordinary Kriging. (A, B) are the spatial distribution characteristics of carbon cycle prediction of woody MDS and herbaceous MDS respectively, PLSK, Partial least squares Kriging; RFK, Random forest Krieger; BPNNK, BP neural network Kriging.
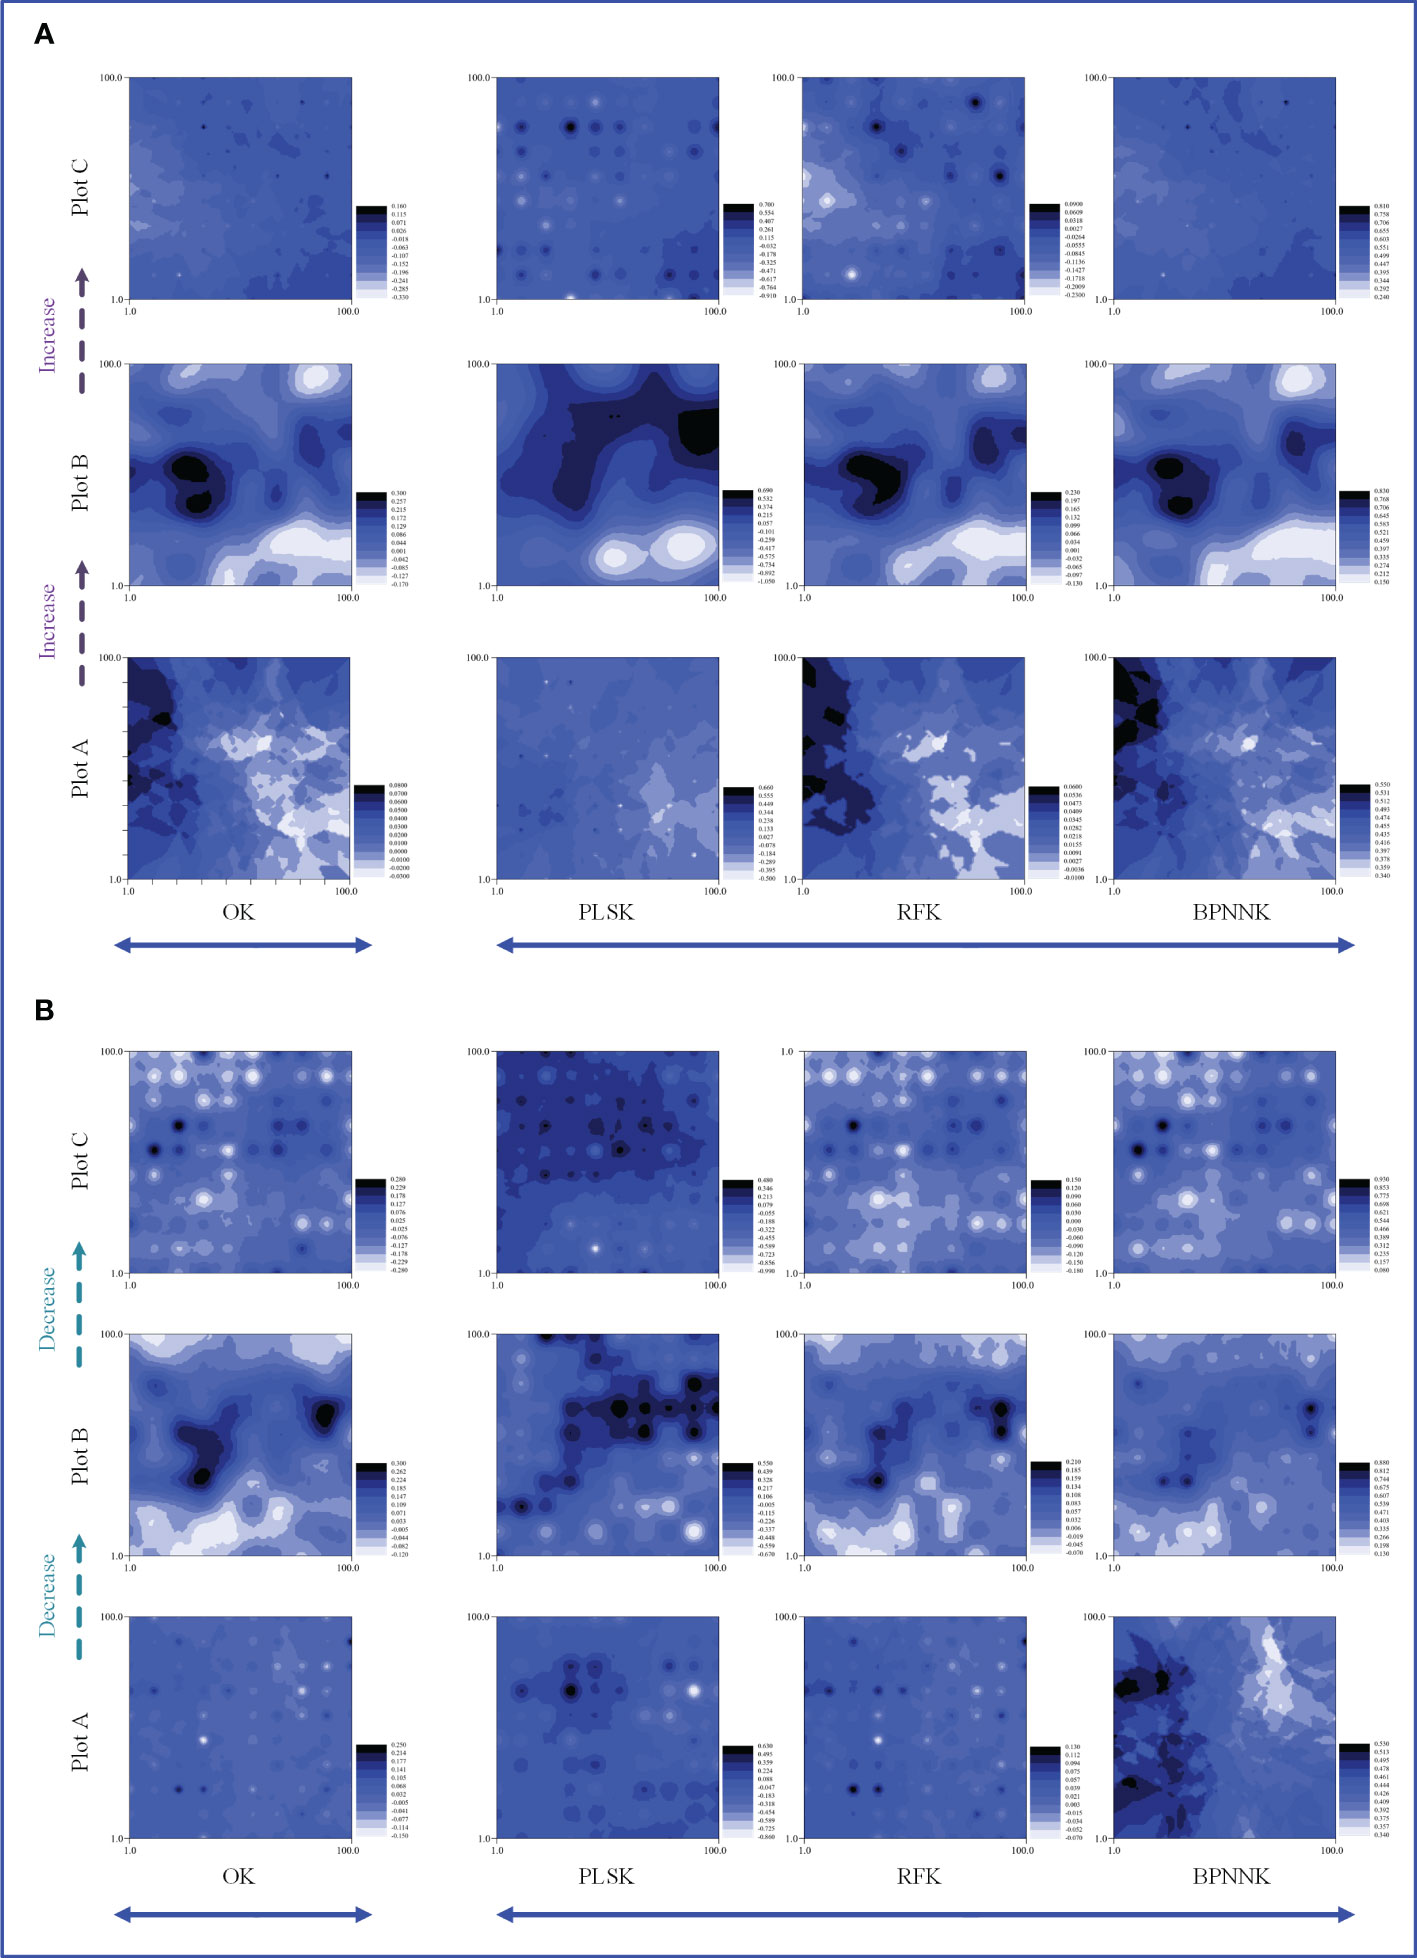
Figure 7 Spatial distribution characteristics of the phosphorus cycle, OK, Ordinary Kriging. (A, B) are the spatial distribution characteristics of carbon cycle prediction of woody MDS and herbaceous MDS respectively, PLSK, Partial least squares Kriging; RFK, Random forest Krieger; BPNNK, BP neural network Kriging.
3.4 Regression kriging prediction
The RK visualization results based on wMDS are shown in (Figures 5, 6, 7A). The visualization results based on raw and predicted values all showed that the prediction accuracy of the BPNNK model was the highest, followed by RFK and PLSK models. The OK and RK visualization results of P cycling in plot B all showed “bull’s eye phenomenon”. The visualization results by hMDS (Figures 5, 6, 7B) based on raw and predicted values all showed that the prediction accuracy of the BPNNK model was similar to that of the RFK model, and the prediction accuracy of the PLSK model was the lowest. Furthermore, local extremum or over smoothing (lack of details) were shown in the P cycling in plot A, the C cycling in plot B, and the N cycling in plot C. Therefore, RF and BPNN are better than PLS in RK prediction. The accuracy test results also showed that RF and BPNN were better than PLS (Figure 4). Moreover, the RK visualization results based on wMDS were better than those based on hMDS (Figures 5–7).
4 Discussion
4.1 Minimum data set of functional traits
In this study, plant functional traits were used as predictor variables, and hMDS and wMDS were constructed by selecting important plant functional traits to predict ecosystem functions. According to the study results, morphological traits including SLA, DBH, PH, LW, and LT, and physiological traits including LWC and LDW were included in the wMDS. Previous studies have shown that plant leaf morphological traits could determine plant photosynthetic capacity (Cornelissen et al., 2003; Yu et al., 2014; Liu and Liang, 2016). Some scholars also reported that H and SBD (DBH) could reflect the adaptability of plants to environmental changes and their ability to acquire resources, and the length and thickness of the stems of woody plants were more sensitive to environmental filtering (Fernández et al., 2002; Liu et al., 2015). In this study, in desert ecosystems, water is the most important environmental factor affecting plant distribution and growth. LWC can reflect the water status of plant tissues (Li et al., 2013) and the resistance and adaptation of plants to drought stress (Joly et al., 2017). With the increase of drought degree, soil water content and LWC of plants decreased greatly (Maréchaux et al., 2015; Zhou et al., 2021). Furthermore, LFW can reflect the dehydration resistance of plants. The higher the LWC, the higher the LFW, and the stronger the drought resistance (Zou et al., 2019). Therefore, through the construction of hMDS and wTDS, the representative functional traits can be screened out. The results of this study showed that desert plants adapt to the arid environment mainly by the changes of morphological and physiological traits. Furthermore, by comparing the components in hMDS with those in the wMDS, it was found that woody plants invest more on stem.
4.2 Prediction of spatial distribution characteristics of ecosystem functions by functional trait MDS
Spatial heterogeneity is jointly affected by random and structural factors. In geostatistics, a high nugget-sill ratio (C0/(C0 + C) > 50%) indicates a high degree of spatial heterogeneity caused by the random factors. If the ratio is close to 100%, it means that the object variables have constant variation, i.e., the spatial heterogeneity comes from random factors (Boerner et al., 2015; Shi et al., 2020). According to the results of this study, the nugget-sill ratios of the raw and predicted values of C, N, and P cycling for the three plots were less than 25%, the functions in each plot had strong spatial autocorrelation, and the spatial variation was mainly influenced by structural factors. This indicates that natural factors (structural factors) such as topography, parent material, and vegetation play important roles in the spatial variation. The study area is in a national nature reserve, where human interference is minimal. Within each plot, soil type, relief, light radiation, temperature, and other conditions are nearly uniform, so structural factors may come from vegetation type and functional traits of plants. Furthermore, a small proportion of random factors may be caused by experimental errors such as sampling.
Plant functional traits are biological regulators of C, N, and P cycling (Wright et al., 2004; Xu et al., 2017; Butler et al., 2018). They can regulate hydrothermal and material redistribution (Campos et al., 2016; Wasternack, 2017) to influence the extent and intensity of C, N, and P cycling in the ecosystem (McCormack et al., 2015). The OK model results showed that the relative contributions of woody and herbaceous plants to the ecosystem functioning C cycle were mainly determined by the plant biomass. In Plot B, the biomass of herbaceous plants dominated for more C stock, while in Plot A, woody plants were the dominant life forms, and in Plot C, woody plants were more deeply rooted and drought tolerant than herbaceous plants, so woody plants participated in carbon cycles with higher carbon stocks in Plots A and C. The contribution of both woody and herbaceous plants to the ecosystem functional N cycle decreased with gradients, potentially due to moisture limitation (Chen X. et al., 2021). Edmondson et al. (2013) concluded that nitrogen accumulation and transport were influenced by soil moisture, and in natural communities with no anthropogenic nitrogen addition, nitrification and denitrification of plant residues would be more intense in wet areas than in arid areas, with wetter areas receiving more nitrogen accumulation (Liu et al., 2020; Zhao et al., 2021). The contribution of woody plants to the ecosystem functional C cycle and the contribution of herbaceous plants to the ecosystem functional C cycle showed overall contrary results in areas ranging from riparian forests to desert margins. Some studies suggested that in grassland ecosystems, phosphorus was slowing down grassland degradation. When herbaceous plants are moisture-limited, phosphorus stocks are also reduced (Liu et al., 2018). Woody, being perennial, retains more nutrients and reduces the phosphorus metabolic loss in extreme conditions (Zhang et al., 2012). At the small scale of desert ecosystems, ecosystem cycles were largely influenced by vegetation type and may be disturbed by animals and microorganisms in the soil (Zhao et al., 2018). Whereas at large scales (a few square kilometers or hundreds of square kilometers), it has been suggested that ecosystem functioning was affected by climate, topography or anthropogenic emissions (Marklein and Houlton, 2012).
The RK model results show that the wMDS and hMDS can improve the prediction accuracy of the spatial distribution of C, N and P cycling. It has been argued that plant community characteristics influence soil C, N, and P cycling and control the decomposition process in ecosystems. Furthermore, the abundance and composition of species or functional groups within a community influence the input and output of soil C (Oelmann et al., 2011; Zhang, 2020; Shen et al., 2021). According to the mass ratio hypothesis, ecosystem function is primarily determined by the traits of the biomass-dominant species in the community (Smith et al., 2001; Wright et al., 2003; Prentice et al., 2014). Therefore, the relative abundance and biomass of plants and their traits may be the main determinants of C, N, and P cycling in the ecosystem. It has also been shown that plant functional traits can influence C cycling in wetland ecosystems (Wang et al., 2010), plant trait combinations influence the diversity of soil decomposers through the diversity of habitat conditions they create. In turn, the diversity of decomposers may significantly affects soil C cycling (Duan et al., 2021). Li and Wang (2021) argued that C and N cycling were related to plant morphological traits, and ecosystem function was strongly influenced not only by dominant species or functional group traits, but also by dominant functional traits. Meng et al. (2017) showed that C cycling was mainly influenced by vegetation type, which could explain 66.10% of the total variation. Duan et al. (2018) showed that the spatial distribution of C cycling was progressively enhanced by vegetation structure as farmlands were returned to forestland. Gong et al. (2017) also reported a significant positive correlation between plant leaves and soil organic matter content in their study on the C cycling. Therefore, it is reasonable that plant functional traits can predict the function of C cycling in ecosystems. Plant functional traits are the structural factors that have the strongest impact on ecosystem functions.
The results of the RK analysis also indicated that the N and P cycles were also predicted more accurately. Phenotypic traits can reflect changes in ecosystem functions, as well as changes in the spatial distribution of ecosystem processes and functions (McIntyre et al., 2009), such as SLW and SLA (Cornelissen et al., 2003). C, N, and P cycling in ecosystems are often affected by traits of multiple plant organs. For example, the C, N, and P concentrations of plant leaves have a stable positive relationship (Rawat et al., 2020). Furthermore, the maximum diameter of stems (Jucker et al., 2016) and the maximum plant height also have a stable positive relationship with the C, N, and P concentrations of plant leaves (Falster et al., 2011). The accumulation and transformation of N and P between plants and soil is a complex process, which is affected by many environmental factors. Under the same climate and habitat conditions, the dynamic changes of vegetation factors and soil factors regulate the input and output of soil N and P, and then affect the accumulation of N and P in the soil (Dijkstra et al., 2012). Therefore, the functional traits of plants can directly reflect the N and P cycling in the ecosystem.
4.3 Comparison of regression kriging models
By comparing the prediction results of the PLS, RF, and BPNN models based on the Kriging method, it was found that the RF model can significantly improve the prediction accuracy on ecosystem functions based on the MDS, and it can accurately predict the spatial distribution of C, N, and P cycling in the desert ecosystem. This may be a non-linear relationship between RF analysis of multiple source auxiliary variables (MDS) and C, N, and P cycling through a classification algorithm to obtain a globally optimal solution, which can overcome the defect of the local minimum solution of the BPNN method (Tyralis et al., 2019). Song et al. (2017) compared the accuracy of Support Vector Machine (SVR), BPNN, and RF models in predicting SOM, and showed that the RF model had higher coefficient of determination and prediction accuracy. This is consistent with the results of this study. Furthermore, it was found that the RF model based on the wMDS had a better performance in predicting C, N, and P cycling than the RF model based on the hMDS, enabling global and point specific predictions. Zeng et al. (2014) also showed that the RF model could better reflect the “pure information” changes in the samples and obviously improve the prediction accuracy of the model.
The BPNN model with non-transparency of data operation has strong fault tolerance, but traditional BPNN models are also prone to over-fitting and local optimality (Chen S. Y. et al., 2021). The results of this study confirmed that the BPNN model was very unstable. PLS, on the other hand, had a low prediction accuracy. It may be that the algorithm has difficulty explaining the loading of independent latent variables. It is based on a cross product with the response variables, rather than on correlations between independent variables in conventional factor analysis (Lednev et al., 2018; Wang et al., 2022). Consequently, visualisation results from the non-linear RF and BPNN models combined with kriging demonstrate that the MDS of plant functional traits could be used to predict C, N, and P cycling in ecosystems.
5 Conclusion
In this study, the MDSs (hMDS and wMDS) of plant functional traits was constructed. The spatial distribution of C, N, and P cycling in the desert ecosystem in the Xinjiang Ebinur Lake Basin were accurately predicted based on the hMDS and wMDS using linear and non-linear models combined with regression kriging and geostatistical analysis. The wMDS included H, SLA, LDW, LWC, DBH, LW, and LT, and the hMDS included H, SLA, LFW, LWC, LL, and LW. The cross-validation performed in this study showed that the MDS can replace TDS in predicting ecosystem functions, and the constructed MDSs could accurately predict the spatial distribution of C, N, and P cycling in the ecosystem. Furthermore, C, N, and P cycles are strongly spatially autocorrelated due to structural factors, and C, N and P cycles in desert ecosystems do not behave uniformly between different life forms of plants, subject to water limitation. The RK predicted result was highly consistent with the distribution of the raw values.
Data availability statement
The original contributions presented in the study are included in the article/Supplementary Material. Further inquiries can be directed to the corresponding author.
Author contributions
Conceptualization, YC and JW. Methodology, YC and JW. Software, YC and JW. Validation, YC and JW. Formal Analysis, GL. Investigation and Project Administration, LJ, HL, HW. Resources. All authors contributed to the article and approved the submitted version.
Funding
This study was financially supported by National Natural Science Foundation of China (No.42171026), Xinjiang Uygur Autonomous Region innovation environment Construction special project & Science and technology innovation base construction project (PT2107), and Excellent doctoral research and innovation Project of Xinjiang University (XJU2022BS060).
Acknowledgments
We greatly thank Xuemin He, Wenjing Li, Zhoukang Li, Kunduz Sattar and Shiyun Wang et al. for their strong help with field and laboratory work.
Conflict of interest
The authors declare that they have no known competing financial interests or personal relationships that could have appeared to influence the work reported in this paper.
Publisher’s note
All claims expressed in this article are solely those of the authors and do not necessarily represent those of their affiliated organizations, or those of the publisher, the editors and the reviewers. Any product that may be evaluated in this article, or claim that may be made by its manufacturer, is not guaranteed or endorsed by the publisher.
Supplementary material
The Supplementary Material for this article can be found online at: https://www.frontiersin.org/articles/10.3389/fpls.2023.1131778/full#supplementary-material
Abbreviations
LC, Leaf carbon; LN, Leaf nitrogen; LP, Leaf phosphorus; SLA, Specific leaf area; SLW, Specific leaf weight; LA, leaf area; LDMC, Leaf dry matter content; LWC, Leaf water content; LFW, Leaf fresh weight; LDW, Leaf dry weight; DBH, diameter at breast height; SBD, Stem base diameter; H, Height; LT, Leaf thickness; LL, Leaf length; LW, Leaf width; WLR, Width to length ratio; SOC, Soil organic carbon content; SAN, Soil ammonium nitrogen; SNN, Soil nitrate nitrogen; STN, Total nitrogen content; STP, Soil total phosphorus; SAP, Soil available phosphorus.
References
Albert, C. H., de Bello, F., Boulangeat, I., Pellet, G., Lavorel, S., Thuiller, W. (2012). On the importance of intraspecific variability for the quantification of functional diversity. Oikos 121 (1), 116–126. doi: 10.1111/j.1600-0706.2011.19672.x
Askari, M. S., Holden, N. M. (2014). Indices for quantitative evaluation of soil quality under grassland management. Geoderma 230, 131–142. doi: 10.1016/j.geoderma.2014.04.019
Askari, M. S., Holden, N. M. (2015). Quantitative soil quality indexing of temperate arable management systems. Soil Tillage Res. 150, 57–67. doi: 10.1016/j.still.2015.01.010
Behnamian, A., Millard, K., Banks, S. N., White, L., Richardson, M., Pasher, J. (2017). A systematic approach for variable selection with random forests: achieving stable variable importance values. IEEE Geosci. Remote Sens. Lett. 14 (11), 1988–1992. doi: 10.1109/LGRS.2017.2745049
Boerner, R., Brinkman, J. A., Smith, A. (2015). Seasonal variations in enzyme activity and organic carbon in soil of a burned and unburned hardwood forest. Soil Biol. Biochem. 37 (8), 1419–1426. doi: 10.1016/j.soilbio.2004.12.012
Bowker, M. A., Maestre, F. T., Mau, R. L. (2013). Diversity and patch-size distributions of biological soil crusts regulate dryland ecosystem multifunctionality. Ecosystems 16 (6), 923–933. doi: 10.1007/s10021-013-9644-5
Butler, E. E., Datta, A., Flores-Moreno, H., Chen, M., Reich, P. B. (2018). Mapping local and global variability in plant trait distributions. PNAS 114 (51), E10937–E10946. doi: 10.1073/pnas.1708984114
Cambardella, C. A., Moorman, T. B., Novak, J. M., Parkin, T. B., Konopka, A. E. (1994). Field-scale variability of soil properties in central Iowa soils. Soil Sci. Soc. America J. 58 (5), 1501–1511. doi: 10.2136/sssaj1994.03615995005800050033x
Campos, M. L., Yoshida, Y., Major, I. T., de Oliveira Ferreira, D., Weraduwage, S. M., Froehlich, J. E., et al. (2016). Rewiring of jasmonate and phytochrome b signalling uncouples plant growth-defense tradeoffs. Nat. Commun. 7, 12570. doi: 10.1038/ncomms12570
Catorci, A., Cesaretti, S., Malatesta, L., Tardella, F. M. (2014). Effects of grazing vs mowing on the functional diversity of sub-Mediterranean productive grasslands. Appl. Vegetation Sci. 17 (4), 658–669. doi: 10.1111/avsc.12103
Cavanaugh, K. C., Gosnell, J. S., Davis, S. L., Ahumada, J., Boundja, P., Clark, D. B., et al. (2014). Carbon storage in tropical forests correlates with taxonomic diversity and functional dominance on a global scale. Global Ecol. Biogeogr 23 (5), 563–573. doi: 10.1111/geb.12143
Chen, S. Y., Gao, J. S., Fu, H. G., Zhao, R. (2021). A selective ensemble modeling method based on accuracy and difference of game theory and its application. J. Beijing Univ. Technol. 47 (1), 32–39. doi: 10.11936/bjutxb2019070012
Chen, W., Ran, H., Cao, X., Wang, J., Teng, D., Chen, J., et al. (2020). Estimating PM2.5 with high-resolution 1-km AOD data and an improved machine learning model over shenzhen, China. Sci. Total Environ. 746, 141093. doi: 10.1016/j.scitotenv.2020.141093
Chen, X., Searle, E., Chen, C., Reich, P. (2021). Negative to positive shifts in diversity effects on soil nitrogen over time. Nat. Sustainability 4 (3), 225–232. doi: 10.1038/s41893-020-00641-y
Cornelissen, J. H. C., Lavorel, S., Garnier, E., Diaz, S., Buchmann, N., Gurvich, D. E., et al. (2003). A handbook of protocols for standardised and easy measurement of plant functional traits worldwide. Aust. J. Bot. 51 (4), 335–380. doi: 10.1071/Bt02124
Diaz, S., Kattge, J., Cornelissen, J. H., Wright, I. J., Lavorel, S., Dray, S., et al. (2016). The global spectrum of plant form and function. Nature 529 (7585), 167–171. doi: 10.1038/nature16489
Diaz, S., Lavorel, S., McIntyre, S., Falczuk, V., Casanoves, F., Milchunas, D. G., et al. (2007). Plant trait responses to grazing - a global synthesis. Global Change Biol. 13 (2), 313–341. doi: 10.1111/j.1365-2486.2006.01288.x
Dijkstra, F. A., Pendall, E., Morgan, J. A., Blumenthal, D. M., Carrillo, Y., LeCain, D. R., et al. (2012). Climate change alters stoichiometry of phosphorus and nitrogen in a semiarid grassland. New Phytol. 196 (3), 807–815. doi: 10.1111/j.1469-8137.2012.04349.x
Duan, Y., Chen, L., Li, Y. M., Wang, Q. Y., Zhang, C. Z., Ma, D. H., et al. (2021). N, p and straw return influence the accrual of organic carbon fractions and microbial traits in a mollisol. Geoderma 403, 115373. doi: 10.1016/j.geoderma.2021.115373
Duan, Y. F., Wang, K. L., Feng, D., Wu, M., Zhang, W., Chen, H. S. (2018). Spatial pattern changes of soil organic carbon and total nitrogen and their responses to the conversion of cropland to forest and grassland in a typical karst watershed. Acta Ecologica Sin. 38 (5), 1560–1568. doi: 10.5846/stxb201701220184
Duran, S. M., Martin, R. E., Diaz, S., Maitner, B. S., Malhi, Y., Salinas, N., et al. (2019). Informing trait-based ecology by assessing remotely sensed functional diversity across a broad tropical temperature gradient. Sci. Adv. 5 (12), eaaw8114. doi: 10.1126/sciadv.aaw8114
Edmondson, J., Terribile, E., Carroll, J. A., Price, E. A. C., Caporn, S. J. M. (2013). The legacy of nitrogen pollution in heather moorlands: ecosystem response to simulated decline in nitrogen deposition over seven years. Sci. Total Environ. 444, 138–144. doi: 10.1016/j.scitotenv.2012.11.074
Elser, J. J., Fagan, W. F., Kerkhoff, A. J., Swenson, N. G., Enquist, B. J. (2010). Biological stoichiometry of plant production: metabolism, scaling and ecological response to global change. New Phytol. 186 (3), 593–608. doi: 10.1111/j.1469-8137.2010.03214.x
Elser, J. J., Sterner, R. W., Gorokhova, E., Fagan, W. F., Markow, T. A., Cotner, J. B., et al. (2000). Biological stoichiometry from genes to ecosystems. Ecol. Lett. 3 (6), 540–550. doi: 10.1046/j.1461-0248.2000.00185.x
Falster, D. S., Brannstrom, A., Dieckmann, U., Westoby, M. (2011). Influence of four major plant traits on average height, leaf-area cover, net primary productivity, and biomass density in single-species forests: a theoretical investigation. J. Ecol. 99 (1), 148–164. doi: 10.1111/j.1365-2745.2010.01735.x
Feng, S., Fu, Q. (2013). Expansion of global drylands under a warming climate. Atmospheric Chem. Phys. 13 (19), 10081–10094. doi: 10.5194/acp-13-10081-2013
Fernández, P. L., Pablos, F., Martín., M. J., González, A. G. (2002). Multi-element analysis of tea beverages by inductively coupled plasma atomic emission spectrometry. Food Chem. 76 (4), 483–489. doi: 10.1016/S0308-8146(01)00312-0
Finegan, B., Pe, M., De Oliveira, A., Ascarrunz, N., Bret-Harte, M. S., Casanoves, F., et al. (2015). Does functional trait diversity predict above-ground biomass and productivity of tropical forests? Testing three Altern. hypotheses. J. Ecol. 103 (1), 191–201. doi: 10.1111/1365-2745.12346
Flynn, D. F. B., Mirotchnick, N., Jain, M., Palmer, M. I., Naeem, S. (2011). Functional and phylogenetic diversity as predictors of biodiversity-ecosystem-function relationships. Ecology 92 (8), 1573–1581. doi: 10.1890/10-1245.1
Fortunel, C., Garnier, E., Joffre, R., Kazakou, E., Quested, H., Grigulis, K., et al. (2009). Leaf traits capture the effects of land use changes and climate on litter decomposability of grasslands across Europe. Ecology 90 (3), 598–611. doi: 10.1890/08-0418.1
Gao, X. J., Giorgi, F. (2008). Increased aridity in the Mediterranean region under greenhouse gas forcing estimated from high resolution simulations with a regional climate model. Global Planetary Change 62 (3-4), 195–209. doi: 10.1016/j.gloplacha.2008.02.002
Garland, G., Banerjee, S., Edlinger, A., Miranda Oliveira, E., Herzog, C., Wittwer, R., et al. (2020). A closer look at the functions behind ecosystem multifunctionality: a review. J. Ecol. 109 (2), 600–613. doi: 10.1111/1365-2745.13511
Ge, X., Ding, J., Wang, J., Fei, W., Sun, H. (2018). Estimation of soil moisture content based on competitive adaptive reweighted sampling algorithm coupled with machine learning. Acta Optica Sin. 38 (10), 1030001. doi: 10.3788/aos201838.1030001
Giese, M., Brueck, H., Gao, Y. Z., Lin, S., Steffens, M., Kogel-Knabner, I., et al. (2013). N balance and cycling of inner Mongolia typical steppe: a comprehensive case study of grazing effects. Ecol. Monogr. 83 (2), 195–219. doi: 10.1890/12-0114.1
Gong, Z. N., LI, H., Cheng, Q. W. (2017). Spatial distribution of soil organic matter in water-level-fluctuation zone of guanting reservoir. Acta Ecologica Sin. 37 (24), 8336–8347. doi: 10.5846/stxb201611182344
Grime, J. P. (1998). Benefits of plant diversity to ecosystems: immediate, filter and founder effects. J. Ecol. 86 (6), 902–910. doi: 10.1046/j.1365-2745.1998.00306.x
Guo, L., Sun, X., Fu, P., Shi, T., Dang, L., Chen, Y., et al. (2021). Mapping soil organic carbon stock by hyperspectral and time-series multispectral remote sensing images in low-relief agricultural areas. Geoderma 398, 115118. doi: 10.1016/j.geoderma.2021.115118
Guo, L. L., Sun, Z. G., Ouyang, Z., Han, D. R., Li, F. D. (2017). A comparison of soil quality evaluation methods for fluvisol along the lower yellow river. Catena 152, 135–143. doi: 10.1016/j.catena.2017.01.015
Guo, P. T., Wu, W., Sheng, Q. K., Li, M. F., Liu, H. B., Wang, Z. Y. (2013). Prediction of soil organic matter using artificial neural network and topographic indicators in hilly areas. Nutr. Cycl Agroecosys 95 (3), 333–344. doi: 10.1007/s10705-013-9566-9
He, M., Dijkstra, F. A., Zhang, K., Li, X., Tan, H., Gao, Y., et al. (2014). Leaf nitrogen and phosphorus of temperate desert plants in response to climate and soil nutrient availability. Sci. Rep. 4, 6932. doi: 10.1038/srep06932
He, N. P., Li, C. C., Zhang, J. H., Xu, L., Yu, G. R. (2018). Opportunities and challenges in plant trait research: from organs to communities. Acta Ecologica Sin. 38 (19), 6787–6796. doi: 10.5846/stxb201710241900
Hengl, T., Heuvelink, G. B. M., Rossiter, D. G. (2007). About regression-kriging: from equations to case studies. Comput. Geosciences 33 (10), 1301–1315. doi: 10.1016/j.cageo.2007.05.001
Hengl, T., Heuvelink, G. B. M., Stein, A. (2004). A generic framework for spatial prediction of soil variables based on regression-kriging. Geoderma 120 (1-2), 75–93. doi: 10.1016/j.geoderma.2003.08.018
Huang, T., Liao, X. Y., Zhao, D., Gong, X. G., Cassidy, D. P. (2019a). Delineation of soil contaminant plumes at a co-contaminated site using BP neural networks and geostatistics. Geoderma 354, 113878. doi: 10.1016/j.geoderma.2019.07.036
Huang, X. Q., Zhao, J., Zhou, X., Zhang, J. B., Cai, Z. C. (2019b). Differential responses of soil bacterial community and functional diversity to reductive soil disinfestation and chemical soil disinfestation. Geoderma 348, 124–134. doi: 10.1016/j.geoderma.2019.04.027
Isbell, F., Calcagno, V., Hector, A., Connolly, J., Harpole, W. S., Reich, P. B., et al. (2011). High plant diversity is needed to maintain ecosystem services. Nature 477 (7363), 199–U196. doi: 10.1038/nature10282
Jin, H. F., Shi, D. M., Chen, Z. F., Liu, Y. J., Yang, X. (2018). Evaluation indicators of cultivated layer soil quality for red soil slope farmland based on cluster and PCA analysis. Trans. Chin. Soc. Agric. Eng. 34 (7), 155–164. doi: 10.11975/j.issn.1002-6819.2018.07.020
Joly, F. X., Kurupas, K. L., Throop, H. L. (2017). Pulse frequency and soil-litter mixing alter the control of cumulative precipitation over litter decomposition. Ecology 98 (9), 2255–2260. doi: 10.1002/ecy.1931
Jucker, T., Sanchez, A. C., Lindsell, J. A., Allen, H. D., Amable, G. S., Coomes, D. A. (2016). Drivers of aboveground wood production in a lowland tropical forest of West Africa: teasing apart the roles of tree density, tree diversity, soil phosphorus, and historical logging. Ecol. Evol. 6 (12), 4004–4017. doi: 10.1002/ece3.2175
Kattge, J., Diaz, S., Lavorel, S., Prentice, C., Leadley, P., Bonisch, G., et al. (2011). TRY - a global database of plant traits. Global Change Biol. 17 (9), 2905–2935. doi: 10.1111/j.1365-2486.2011.02451.x
Kearney, W. S., Fagherazzi, S. (2016). Salt marsh vegetation promotes efficient tidal channel networks. Nat. Commun. 7, 12287. doi: 10.1038/ncomms12287
Knadel, M., Rehman, H. U., Pouladi, N., de Jonge, L. W., Moldrup, P., Arthur, E. (2021). Estimating atterberg limits of soils from reflectance spectroscopy and pedotransfer functions. Geoderma 402 (1-2), 115300. doi: 10.1016/j.geoderma.2021.115300
Kraft, N. J., Godoy, O., Levine, J. M. (2015). Plant functional traits and the multidimensional nature of species coexistence. P Natl. Acad. Sci. U.S.A. 112 (3), 797–802. doi: 10.1073/pnas.1413650112
Laliberte, E., Legendre, P. (2010). A distance-based framework for measuring functional diversity from multiple traits. Ecology 91 (1), 299–305. doi: 10.1890/08-2244.1
Lednev, V., Tretyakov, R., Sdvizhenskii, P., Grishin, M., Asyutin, R., Pershin, S. (2018). Laser induced breakdown spectroscopy for in-situ multielemental analysis during additive manufacturing process. J. Physics: Conf. Ser. 1109, 12050. doi: 10.1088/1742-6596/1109/1/012050
Li, S. F., Huang, X. B., Lang, X. D., Shen, J. Y., Xu, F. D., Su, J. R. (2020b). Cumulative effects of multiple biodiversity attributes and abiotic factors on ecosystem multifunctionality in the jinsha river valley of southwestern China. For. Ecol. Manage. 472, 118281. doi: 10.1016/j.foreco.2020.118281
Li, T., Shen, H., Zeng, C., Yuan, Q., Zhang, L. (2017). Point-surface fusion of station measurements and satellite observations for mapping PM2.5 distribution in China: methods and assessment. Atmospheric Environ. 152, 477–489. doi: 10.1016/j.atmosenv.2017.01.004
Li, J. S., Su, P. X., Zhang, H. N., Zhou, Z. J., Xie, T. T. (2013). Leaf water and functional traits of desert plants and their relationship. Plant Physiol. J. 49 (2), 153–160. doi: 10.13592/j.cnki.ppj.2013.02.011
Li, Y. Q., Wang, Z. H. (2021). Ecological function, geographic distribution and genesis of plant leaf morphology. Chin. J. Plant Ecol. 45 (10), 1154–1172. doi: 10.17521/cjpe.2020.0405
Li, P., Wu, M. C., Kang, G. D., Zhu, B. J., Li, H. X., Hu, F., et al. (2020a). Soil quality response to organic amendments on dryland red soil in subtropical China. Geoderma 373, 114416. doi: 10.1016/j.geoderma.2020.114416
Li, G. Y., Yang, D. M., Sun, S. C. (2008). Allometric relationships between lamina area, lamina mass and petiole mass of 93 temperate woody species vary with leaf habit, leaf form and altitude. Funct. Ecol. 22 (4), 557–564. doi: 10.1111/j.1365-2435.2008.01407.x
Liang, M., Liu, X., Parker, I. M., Johnson, D., Zheng, Y., Luo, S., et al. (2019). Soil microbes drive phylogenetic diversity-productivity relationships in a subtropical forest. Sci. Adv. 5 (10), eaax5088. doi: 10.1126/sciadv.aax5088
Lin, Y., Hong, M., Han, G. D., Zhao, M. L., Bai, Y. F., Chang, S. X. (2010). Grazing intensity affected spatial patterns of vegetation and soil fertility in a desert steppe. Agr Ecosyst. Environ. 138 (3-4), 282–292. doi: 10.1016/j.agee.2010.05.013
Lin, J. N., Lin, D. M., Zhu, G. Y., Wang, H. J., Qian, S. H., Zhao, L., et al. (2022). Earthworms exert long lasting afterlife effects on soil microbial communities. Geoderma 420, 115906. doi: 10.1016/j.geoderma.2022.115906
Liu, Y. R., Delgado-Baquerizo, M., Trivedi, P., He, J. Z., Wang, J. T., Singh, B. K. (2017). Identity of biocrust species and microbial communities drive the response of soil multifunctionality to simulated global change. Soil Biol. Biochem. 107, 208–217. doi: 10.1016/j.soilbio.2016.12.003
Liu, Z. M., Guo, S. J., Qin, T. T., Sun, X. B. (2015). Growth response of 1a castanea mollissima seedlings to compost of forestry and agricultural residues. J. Cent. South Univ. Forestry Technol. 35 (10), 62–68. doi: 10.14067/j.cnki.1673-923x.2015.10.011
Liu, M. X., Liang, G. L. (2016). Advances in studies on plant specific leaf quality. Chin. J. Plant Ecol. 40 (8), 847–860. doi: 10.17521/cjpe.2015.0428
Liu, Y., Tenzintarchen, Geng, X., Wei, D., Dai, D., Xu-Ri (2020). Grazing exclusion enhanced net ecosystem carbon uptake but decreased plant nutrient content in an alpine steppe. Catena 195, 104799. doi: 10.1016/j.catena.2020.104799
Liu, S. B., Zamanian, K., Schleuss, P. M., Zarebanadkouki, M., Kuzyakov, Y. (2018). Degradation of Tibetan grasslands: consequences for carbon and nutrient cycles. Agr Ecosyst. Environ. 252, 93–104. doi: 10.1016/j.agee.2017.10.011
Lohbeck, M., Poorter, L., Martinez-Ramos, M., Bongers, F. (2015). Biomass is the main driver of changes in ecosystem process rates during tropical forest succession. Ecology 96 (5), 1242–1252. doi: 10.1890/14-0472.1
Ma, X. L., Mahecha, M. D., Migliavacca, M., van der Plas, F., Benavides, R., Ratcliffe, S., et al. (2019). Inferring plant functional diversity from space: the potential of sentinel-2. Remote Sens. Environ. 233, 111368. doi: 10.1016/j.rse.2019.111368
Maestre, F. T., Quero, J. L., Gotelli, N. J., Escudero, A., Ochoa, V., Delgado-Baquerizo, M., et al. (2012). Plant species richness and ecosystem multifunctionality in global drylands. Science 335 (6065), 214–218. doi: 10.1126/science.1215442
Maréchaux, I., Bartlett, M. K., Sack, L., Baraloto, C., Chave, J. (2015). Drought tolerance as predicted by leaf water potential at turgor loss point varies strongly across species within an Amazonian forest. Funct. Ecol. 29 (10), 1268–1277. doi: 10.1111/1365-2435.12452
Marklein, A. R., Houlton, B. Z. (2012). Nitrogen inputs accelerate phosphorus cycling rates across a wide variety of terrestrial ecosystems. New Phytol. 193, 696–704. doi: 10.1111/j.1469-8137.2011.03967.x
McCormack, M. L., Dickie, I. A., Eissenstat, D. M., Fahey, T. J., Fernandez, C. W., Guo, D., et al. (2015). Redefining fine roots improves understanding of below-ground contributions to terrestrial biosphere processes. New Phytol. 207 (3), 505–518. doi: 10.1111/nph.13363
McIntyre, S., Lavorel, S., Landsberg, J., Forbes, T. D. A. (2009). Disturbance response in vegetation - towards a global perspective on functional traits. J. Vegetation Sci. 10 (5), 621–630. doi: 10.2307/3237077
Mei, S., Tian, K., Yun, Z., Hang, W., Guan, D. X., Yue, H. T. (2017). Research on leaf functional traits and their environmental adaptation. Plant Sci. J. 35 (6), 940–949. doi: 10.11913/PSJ.2095-0837.2017.60940
Meng, Q. M., Liu, Z. J. (2013). Assessment of regression kriging for spatial interpolation – comparisons of seven GIS interpolation methods. Cartography Geographic Inf. Sci. 40 (1), 28–39. doi: 10.1080/15230406.2013.762138
Meng, G. X., Zha, T. G., Zhang, X. X., Zhang, Z. Q., Zhu, Y. S., Zhou, Y., et al. (2017). Effects of vegetation types and topography on vertical distribution of soil organic carbon in reclaimed farmland in loess region. Chin. J. Ecol. 36 (9), 2447–2454. doi: 10.13292/j.1000-4890.201709.018
Messier, J., McGill, B. J., Lechowicz, M. J. (2010). How do traits vary across ecological scales? A Case trait-based ecology. Ecol. Lett. 13 (7), 838–848. doi: 10.1111/j.1461-0248.2010.01476.x
Morais, T. G., Tufik, C., Rato, A. E., Rodrigues, N. R., Gama, I., Jongen, M., et al. (2021). Estimating soil organic carbon of sown biodiverse permanent pastures in Portugal using near infrared spectral data and artificial neural networks. Geoderma 404 (8), 115387. doi: 10.1016/j.geoderma.2021.115387
Mukherjee, S., Joshi, P. K., Garg, R. D. (2015). Regression-kriging technique to downscale satellite-derived land surface temperature in heterogeneous agricultural landscape. IEEE J. Selected Topics Appl. Earth Observations Remote Sens. 8 (3), 1245–1250. doi: 10.1109/JSTARS.2015.2396032
Ni, Y. M., OuYang, Z. Y. (2006). Distribution characteristics and succession trend of desert ecosystem in xinjiang. J. Arid Land Resour. Environ. 20 (2), 7–10. doi: 10.3969/j.issn.1003-7578.2006.02.002
Niu, K. C., Zhang, S. T., Zhao, B. B., Du, G. Z. (2010). Linking grazing response of species abundance to functional traits in the Tibetan alpine meadow. Plant Soil 330 (1-2), 215–223. doi: 10.1007/s11104-009-0194-8
Oelmann, Y., Richter, A. K., Roscher, C., Rosenkranz, S., Temperton, V. M., Weisser, W. W., et al. (2011). Does plant diversity influence phosphorus cycling in experimental grasslands? Geoderma 167-168, 178–187. doi: 10.1016/j.geoderma.2011.09.012
Pakeman, R. J., Fielding, D. A. (2020). A functional assessment of the impact of changing grazing management of upland grassland mosaics. Appl. Vegetation Sci. 23 (4), 539–550. doi: 10.1111/avsc.12504
Pasari, J. R., Levi, T., Zavaleta, E. S., Tilman, D. (2013). Correction for pasari et al., several scales of biodiversity affect ecosystem multifunctionality. Proc. Natl. Acad. Sci. 110 (37), 15163–15163. doi: 10.1073/pnas.1314558110
Petchey, O. L., Gaston, K. J. (2002). Functional diversity (FD), species richness and community composition. Ecol. Lett. 5 (3), 402–411. doi: 10.1046/j.1461-0248.2002.00339.x
Pham, T. G., Kappas, M., Van Huynh, C., Nguyen, L. H. K. (2019). Application of ordinary kriging and regression kriging method for soil properties mapping in hilly region of central Vietnam. Isprs Int. J. Geo-Information 8 (3), 147–165. doi: 10.3390/ijgi8030147
Poggio, L., Lassauce, A., Gimona, A. (2019). Modelling the extent of northern peat soil and its uncertainty with sentinel: Scotland as example of highly cloudy region. Geoderma 346, 63–74. doi: 10.1016/j.geoderma.2019.03.017
Prentice, I. C., Dong, N., Gleason, S. M., Maire, V., Wright, I. J. (2014). Balancing the costs of carbon gain and water transport: testing a new theoretical framework for plant functional ecology. Ecol. Lett. 17 (1), 82–91. doi: 10.1111/ele.12211
Pulido, M., Schnabel, S., Contador, J. F. L., Lozano-Parra, J., Gomez-Gutierrez, A. (2017). Selecting indicators for assessing soil quality and degradation in rangelands of extremadura (SW Spain). Ecol. Indic 74 (mar.), 49–61. doi: 10.1016/j.ecolind.2016.11.016
Qiu, Y., Fu, B., Wang, J., Chen, L., Meng, Q., Zhang, Y. (2010). Spatial prediction of soil moisture content using multiple-linear regressions in a gully catchment of the loess plateau, China. J. Arid Environments 74 (2), 208–220. doi: 10.1016/j.jaridenv.2009.08.003
Raiesi, F. (2017). A minimum data set and soil quality index to quantify the effect of land use conversion on soil quality and degradation in native rangelands of upland arid and semiarid regions. Ecol. Indic 75, 307–320. doi: 10.1016/j.ecolind.2016.12.049
Rawat, M., Arunachalam, K., Arunachalam, A., Alatalo, J. M., Kumar, U., Simon, B., et al. (2020). Relative contribution of plant traits and soil properties to the functioning of a temperate forest ecosystem in the Indian Himalayas. Catena 194, 104671. doi: 10.1016/j.catena.2020.104671
R Development Core Team (2021). R: a language and environment for statistical computing (Vienna, Austria: R Foundation for Statistical Computing.).
Ren, S. Y. (2021). Responses of plant diversity-productivity relationship to canopy gap disturbance in tiantong evergreen broad-leaved forest (Shanghai: East China Normal University).
Reynolds, J. F., Smith, D. M., Lambin, E. F., Turner, B. L., 2nd, Mortimore, M., Batterbury, S. P., et al. (2007). Global desertification: building a science for dryland development. Science 316 (5826), 847–851. doi: 10.1126/science.1131634
Robertson, G. P., Crum, J. R., Ellis, B. G. (1993). The spatial variability of soil resources following long-term disturbance. Oecologia 96 (4), 451–456. doi: 10.1007/BF00320501
Sarmadian, F., Keshavarzi, A., Rooien, A., Iqbal, M., Javadikia, H. (2014). Digital mapping of soil phosphorus using multivariate geostatistics and topographic information. Aust. J. Crop Sci. 8 (8), 1216–1223.
Shen, J., Tao, Q., Dong, Q., Luo, Y. L., Luo, J. P., He, Y. T., et al. (2021). Long-term conversion from rice-wheat to rice-vegetable rotations drives variation in soil microbial communities and shifts in nitrogen-cycling through soil profiles. Geoderma 404, 115299. doi: 10.1016/j.geoderma.2021.115299
Shi, B. K., Hu, G., Henry, H. A. L., Stover, H. J., Sun, W., Xu, W. L., et al. (2020). Temporal changes in the spatial variability of soil respiration in a meadow steppe: the role of abiotic and biotic factors. Agr For. Meteorol 287, 107958. doi: 10.1016/j.agrformet.2020.107958
Smith, B., Prentice, I. C., Sykes, M. T. (2001). Representation of vegetation dynamics in the modelling of terrestrial ecosystems: comparing two contrasting approaches within European climate space. Global Ecol. Biogeogr 10 (6), 621–637. doi: 10.1046/j.1466-822X.2001.00256.x
Song, Y. Q., Yang, L. A., Li, B., Hu, Y. M., Wang, A. L., Zhou, W., et al. (2017). Spatial prediction of soil organic matter using a hybrid geostatistical model of an extreme learning machine and ordinary kriging. Sustainability 9 (5), 754. doi: 10.3390/su9050754
Sun, J., Zhou, T. C., Liu, M., Chen, Y. C., Liu, G. H., Xu, M., et al. (2020). Water and heat availability are drivers of the aboveground plant carbon accumulation rate in alpine grasslands on the Tibetan plateau. Global Ecol. Biogeogr 29 (1), 50–64. doi: 10.1111/geb.13006
Tan, C. X., Zhang, Z. T., Xu, Z. H., Ma, Y., Yao, Z. H., Wei, G. F., et al. (2020). Unmanned aerial vehicle (UAV) multi-spectral remote sensing retrieval of soil moisture content in maize root region at various growth stages. Trans. Chin. Soc. Agric. Eng. 36 (10), 63–74. doi: 10.11975/j.issn.1002-6819.2020.10.008
Temmerman, S., Bouma, T. J., Govers, G., Wang, Z. B., De Vries, M. B., Herman, P. M. J. (2005). Impact of vegetation on flow routing and sedimentation patterns: three-dimensional modeling for a tidal marsh. J. Geophysical Research-Earth Surface 110 (F4), 2169–9003. doi: 10.1029/2005jf000301
Tyralis, H., Papacharalampous, G., Langousis, A. (2019). A brief review of random forests for water scientists and practitioners and their recent history in water resources. Water-Sui 11 (5), 910. doi: 10.3390/w11050910
Vilchez-Mendoza, S., Romero-Gurdián, A., Avelino, J., DeClerck, F., Bommel, P., Betbeder, J., et al. (2022). Assessing the joint effects of landscape, farm features and crop management practices on berry damage in coffee plantations. Agriculture Ecosyst. Environ. 330, 107903. doi: 10.1016/j.agee.2022.107903
Vile, D., Shipley, B., Garnier, E. (2006). Ecosystem productivity can be predicted from potential relative growth rate and species abundance. Ecol. Lett. 9 (9), 1061–1067. doi: 10.1111/j.1461-0248.2006.00958.x
Violle, C., Navas, M. L., Vile, D., Kazakou, E., Fortunel, C., Hummel, I., et al. (2007). Let the concept of trait be functional! Oikos 116 (5), 882–892. doi: 10.1111/j.0030-1299.2007.15559.x
Wang, X. Y., Li, Y. G., Gong, X. W., Niu, Y. Y., Chen, Y. P., Shi, X. P., et al. (2019). Storage, pattern and driving factors of soil organic carbon in an ecologically fragile zone of northern China. Geoderma 343, 155–165. doi: 10.1016/j.geoderma.2019.02.030
Wang, M., Liu, H., Lennartz, B. (2021b). Small-scale spatial variability of hydro-physical properties of natural and degraded peat soils. Geoderma 399, 115123. doi: 10.1016/j.geoderma.2021.115123
Wang, P., Sheng, L. S., Yan, H., Zhou, D. Y., Song, Y. T. (2010). Plant functional traits and soil carbon sequestration in wetland ecosystem. Acta Ecologica Sin. 30 (24), 6990–7000.
Wang, J., Teng, D., He, X., Qin, L., Yang, X., Lv, G. (2021a). Spatial non-stationarity effects of driving factors on soil respiration in an arid desert region. Catena 207, 105617. doi: 10.1016/j.catena.2021.105617
Wang, K. Y., Yang, S., Guo, C. Y., Bian, X. H. (2022). Research on spectral variable selection method based on LASSO algorithm. J. Analytical Testing 41 (3), 398–402+408. doi: 10.19969/j.fxcsxb.21070503
Wang, S. Q., Yu, G. R. (2008). Ecological stoichiometric characteristics of carbon, nitrogen and phosphorus in an ecosystem. Acta Ecologica Sin. 28 (8), 3937–3947. doi: 10.3321/j.issn:1000-0933.2008.08.054
Wasternack, C. (2017). A plant’s balance of growth and defense - revisited. New Phytol. 215 (4), 1291–1294. doi: 10.1111/nph.14720
Wei, X., Ma, Z., Xin, J., He, J. S., Ecology, D. O. (2016a). Biodiversity and ecosystem multifunctionality: advances and perspectives. Biodiversity Sci. 24 (1), 55. doi: 10.17520/biods.2015091
Wei, X., Xin, J., Ma, Z., He, J. S. (2016b). A review on the measurement of ecosystem multifunctionality. Biodiversity Sci. 24 (1), 72–84. doi: 10.17520/biods.2015170
Wright, I., Reich, P., Westoby, M. (2003). Least-cost input mixtures of water and nitrogen for photosynthesis. Am. Nat. 161, 98–111. doi: 10.1086/344920
Wright, I. J., Reich, P. B., Westoby, M., Ackerly, D. D., Baruch, Z., Bongers, F., et al. (2004). The worldwide leaf economics spectrum. Nature 428 (6985), 821–827. doi: 10.1038/nature02403
Wu, C. S., Liu, G. H., Huang, C., Liu, Q. S. (2019). Soil quality assessment in yellow river delta: establishing a minimum data set and fuzzy logic model. Geoderma 334, 82–89. doi: 10.1016/j.geoderma.2018.07.045
Xu, S., Fu, W., Ping, q., He, X. Y., Chen, W., Wu, X., et al. (2017). Research progress on effects of climate change on tree litter decomposition. Chin. J. Ecol. 36 (11), 3266–3272. doi: 10.13292/j.1000-4890.201711.029
Yang, J., Zhang, G. C., Ci, X. Q., Swenson, N. G., Cao, M., Sha, L. Q., et al. (2014). Functional and phylogenetic assembly in a Chinese tropical tree community across size classes, spatial scales and habitats. Funct. Ecol. 28 (2), 520–529. doi: 10.1111/1365-2435.12176
Yu, H. Y., Chen, Y. T., Xu, Z. Z., Zhou, G. S. (2014). Relationship and economic spectrum analysis of leaf functional traits in desert steppe of inner Mongolia. Chin. J. Plant Ecol. 38 (10), 1029–1040. doi: 10.3724/SP.J.1258.2014.00097
Zartman, R. E. (2005). Spatial and temporal statistics: sampling field soils and their vegetation. Vadose Zone J. 4 (4), 983–983. doi: 10.2136/vzj2005.0004br
Zeng, Y., Lu, Y. Z., Chang, W. D., Jian, M. Z. (2014). Infrared photoacoustic spectroscopy and support vector machine model were used to determine soil organic matter content. Acta Pedologica Sin. 51 (6), 1262–1269. doi: 10.11766/trxb201311110526
Zhang, M. (2020). Linking soil nutrient cycling and microbial community with vegetation cover in riparian zone. Geoderma 384, 114801. doi: 10.1016/j.geoderma.2020.114801
Zhang, C. B., Ke, S. S., Wang, J. A., Ge, Y., Chang, S. X., Zhu, S. X., et al. (2011b). Responses of microbial activity and community metabolic profiles to plant functional group diversity in a full-scale constructed wetland. Geoderma 160 (3-4), 503–508. doi: 10.1016/j.geoderma.2010.10.020
Zhang, M. N., Li, G. Y., Liu, B., Liu, J. S., Wang, L., Wang, D. L. (2020b). Effects of herbivore assemblage on the spatial heterogeneity of soil nitrogen in eastern Eurasian steppe. J. Appl. Ecol. 57 (8), 1551–1560. doi: 10.1111/1365-2664.13655
Zhang, C. B., Liu, W. L., Luo, B., Guan, M., Wang, J., Ge, Y., et al. (2020a). Spartina alterniflora invasion impacts denitrifying community diversity and functioning in marsh soils. Geoderma 375, 114456. doi: 10.1016/j.geoderma.2020.114456
Zhang, C., Xue, S., Liu, G. B., Song, Z. L. (2011a). A comparison of soil qualities of different revegetation types in the loess plateau, China. Plant Soil 347 (1-2), 163–178. doi: 10.1007/s11104-011-0836-5
Zhang, S.-B., Zhang, J.-L., Ferry, J., Cao, K.-F. (2012). Leaf element concentrations of terrestrial plants across China are influenced by taxonomy and the environment. Global Ecol. Biogeography 21(8), 809–818. doi: 10.1111/j.1466-8238.2011.00729.x
Zhao, S., Wang, Q., Zhou, J., Yuan, D. (2018). Linking abundance and community of microbial N2O-producers and N2O-reducers with enzymatic N2O production potential in a riparian zone. Sci. Total Environ. 642, 1090–1099. doi: 10.1016/j.scitotenv.2018.06.110
Zhao, S., Zhang, B., Sun, X., Yang, L. (2021). Hot spots and hot moments of nitrogen removal from hyporheic and riparian zones: a review. Sci. Total Environ. 762, 144168. doi: 10.1016/j.scitotenv.2020.144168
Zhou, H. L., Zhou, G. S., He, Q. J., Zhou, L., Ji, Y. H., Lv, X. M. (2021). Capability of leaf water content and its threshold values in reflection of soil-plant water status in maize during prolonged drought. Ecol. Indic 124, 1470–1160. doi: 10.1016/j.ecolind.2021.107395
Zou, Q. Y., Chen, H. S., Ma, X. Y., Nie, Y. P. (2019). Analysis of plant water source in karst exposed bedrock habitat based on water control experiment. Chin. J. Appl. Ecol. 30 (3), 759–767. doi: 10.13287/j.1001-9332.01903.012
Keywords: arid regions, random forest, regression kriging, semi-variable functions, spatial variation
Citation: Chen Y, Wang J, Jiang L, Li H, Wang H, Lv G and Li X (2023) Prediction of spatial distribution characteristics of ecosystem functions based on a minimum data set of functional traits of desert plants. Front. Plant Sci. 14:1131778. doi: 10.3389/fpls.2023.1131778
Received: 26 December 2022; Accepted: 10 May 2023;
Published: 02 June 2023.
Edited by:
Zhong-Hua Chen, Western Sydney University, AustraliaReviewed by:
Lingcheng Li, Pacific Northwest National Laboratory (DOE), United StatesTerry Lin, Western Sydney University, Australia
Copyright © 2023 Chen, Wang, Jiang, Li, Wang, Lv and Li. This is an open-access article distributed under the terms of the Creative Commons Attribution License (CC BY). The use, distribution or reproduction in other forums is permitted, provided the original author(s) and the copyright owner(s) are credited and that the original publication in this journal is cited, in accordance with accepted academic practice. No use, distribution or reproduction is permitted which does not comply with these terms.
*Correspondence: Guanghui Lv, bGVyQHhqdS5lZHUuY24=
†These authors have contributed equally to this work and share first authorship