
94% of researchers rate our articles as excellent or good
Learn more about the work of our research integrity team to safeguard the quality of each article we publish.
Find out more
ORIGINAL RESEARCH article
Front. Plant Sci., 19 June 2023
Sec. Plant Abiotic Stress
Volume 14 - 2023 | https://doi.org/10.3389/fpls.2023.1120777
This article is part of the Research TopicUsing Rootstocks in Crops and Fruit Trees to Mitigate the Effects of Climate Change and Abiotic StressView all 6 articles
 Bin Xie1†Yanhui Chen1†Yanzhen Zhang1Xiuhong An2Xin Li1An Yang1Guodong Kang1Jiangtao Zhou1
 Cungang Cheng1*
Nitrogen (N) and phosphorus (P) are essential phytomacronutrients, and deficiencies in these two elements limit growth and yield in apple (Malus domestica Borkh.). The rootstock plays a key role in the nutrient uptake and environmental adaptation of apple. The objective of this study was to investigate the effects of N and/or P deficiency on hydroponically-grown dwarfing rootstock ‘M9-T337’ seedlings, particularly the roots, by performing an integrated physiological, transcriptomics-, and metabolomics-based analyses. Compared to N and P sufficiency, N and/or P deficiency inhibited aboveground growth, increased the partitioning of total N and total P in roots, enhanced the total number of tips, length, volume, and surface area of roots, and improved the root-to-shoot ratio. P and/or N deficiency inhibited influx into roots, and H+ pumps played a important role in the response to P and/or N deficiency. Conjoint analysis of differentially expressed genes and differentially accumulated metabolites in roots revealed that N and/or P deficiency altered the biosynthesis of cell wall components such as cellulose, hemicellulose, lignin, and pectin. The expression of MdEXPA4 and MdEXLB1, two cell wall expansin genes, were shown to be induced by N and/or P deficiency. Overexpression of MdEXPA4 enhanced root development and improved tolerance to N and/or P deficiency in transgenic Arabidopsis thaliana plants. In addition, overexpression of MdEXLB1 in transgenic Solanum lycopersicum seedlings increased the root surface area and promoted acquisition of N and P, thereby facilitating plant growth and adaptation to N and/or P deficiency. Collectively, these results provided a reference for improving root architecture in dwarfing rootstock and furthering our understanding of integration between N and P signaling pathways.
Nitrogen (N) and phosphorus (P) are two major phytomacronutrients required for plant growth and development (Feng et al., 2022; Wang et al., 2022). Nitrate () is the main source of N in aerobic soils (Bouguyon et al., 2015; Lu et al., 2021), but its availability can fluctuate dramatically in both time and space (Lv et al., 2021). deficiency inhibits photosynthesis, accelerates leaf senescence, alters root architecture, induces expression of transporters NRT1.1 and NRT2 to promote N absorption capacity, and affects most enzyme activities required for energy metabolism (Wang et al., 2019a; Wang et al., 2020; Zhao et al., 2020; Nezamivand-Chegini et al., 2022; Wen et al., 2022). Phosphate (Pi), the major inorganic form of P taken up by roots, has low mobility due to its affinity for cations and its conversion to organic forms (Zhang et al., 2021d). Pi deficiency negatively affects structural compounds, delays leaf development, restricts plant growth, and changes root architecture (Epie et al., 2019; Sun et al., 2021b; Nezamivand-Chegini et al., 2022). Several genes, such as Pi transporter PHT and SPX family members, as well as transcription factors, such as P starvation response (PHR), are involved in the response to Pi deficiency (Sun et al., 2017b; Kumar et al., 2021; Xiao et al., 2021; Li et al., 2022; Liu et al., 2022).
and Pi are also important signaling molecules, and their signaling pathways interact at several levels (Hu et al., 2019; Krouk and Kiba, 2020; Torres-Rodriguez et al., 2021). Accumulating evidence suggests that the P starvation response (PSR) strongly depends on N availability (Hannam et al., 2018; Hu et al., 2019; Medici et al., 2019; Ueda et al., 2020). inducible transcription factors, such as HRS1, Hox52, and GLK1, affect the PSR and root development, thereby regulating Pi uptake in response to P deficiency (Medici et al., 2015; Li et al., 2022; Wei et al., 2022). Medici et al. (2015) reported that AtNIGT1, a GRAP transcription factor, can be regulated by both and Pi. AtNIGT1 was able to regulate the expression of response genes and Pi-starvation-inducible genes (PSIs), and coordinate the utilization of N and P. In addition, AtNIGT1 together with its close homolog (HHO1) involved in modulating root development by regulating the expression of downstream genes. Therefore, through the module integrating and Pi, which constructed with AtNIGT1 as the center, plant can simultaneously sense the changes in N and P availability and regulate root development by comprehensive commands.
Root is the first organ that perceives and takes up nutrients in plants (Nasr Esfahani et al., 2021). Plant root cell wall is a solid matrix wall structure that is made up of protein and polysaccharide biopolymers, and it is the first barrier to resist biotic and abiotic stress (Yan et al., 2022). When roots come into contact with the soil, root cell walls alter their composition, as the ion exchange groups in the cell wall polymers react with ions in the soil (Ogden et al., 2018; Meychik et al., 2021). A lack of nutrient elements such as N, P, boron, calcium, iron, etc. impairs cell wall formation and cell growth (Fang et al., 2019; Qin et al., 2019; Zhu et al., 2019; Liu et al., 2021b; Rivai et al., 2021; Chen et al., 2022a; Li et al., 2023; Nezamivand-Chegini et al., 2023). The integrity of plant cell wall also affected the root formation process (Devi et al., 2021). Expansins are cell-wall-loosening proteins, they interact with the primary cell wall, which is composed of cellulose, hemicellulose, pectin, and xyloglucan. Expansins can promote the non-covalent interactions between cellulose microfibrils, which weaken and move against each other, leading to loosening of the tight cellulosic structure (Chen et al., 2022b). Previous reports have provided evidences that expansins were not only associated with environmental stress tolerance in plants such as nutrient deficiency, drought, salt, etc., but involved in root development (Han et al., 2014; Kong et al., 2019; Ding et al., 2021; Liu et al., 2021a; Wu et al., 2021; Tian et al., 2022). Although previous studies have provided insights into the physiological and molecular processes of apple in response to or Pi deficiency (Valentinuzzi et al., 2019; Sun et al., 2021b; Zhang et al., 2021b; Tahir et al., 2022; Wen et al., 2022), the exact metabolite profiles in root remain unknown. In agricultural systems, plants often suffer from N and Pi co-limitation. Combined N and P deficiencies lead to a series of adaptive responses that cannot be ascribed simply to the combined deficiency (Pueyo et al., 2021; Nasr Esfahani et al., 2022). In chickpea, although molecular responses under combined N and P deficiency are weaker than those seen under deficiency of a single nutrient, simultaneous deficiency produces unique metabolic characteristics (Nasr Esfahani et al., 2021; Nasr Esfahani et al., 2022). Investigations of transcriptome responses to combined N and P deficiency have been performed in Arabidopsis thaliana (Medici et al., 2015), rice (Oryza sativa) (Cai et al., 2013), Medicago truncatula (Bonneau et al., 2013), and giant duckweed (Spirodela polyrhiza) (Yang et al., 2022), etc. The structural and functional modifications of roots that occur under combined N and P deficiency are gradually being revealed. Nevertheless, the adaptive responses in apple under persistent P and/or N deficient conditions have not yet been studied systematically.
Rootstock plays an important role in nutrient absorption and environmental adaptability regulation in apple (Wang et al., 2019b). Dwarfing rootstock ‘M9-T337’ delivers an early and high cumulative yield and increased fruit quality, without the need for labor-intensive inputs, and it has become a commonly used rootstock in the main apple-producing regions of China (Li et al., 2018). However, apple with ‘M9-T337’ rootstock is vulnerable to N and P nutritional deficiencies (Xie et al., 2022a; Xie et al., 2022b), because greater amounts of N are required by perennial woody plants, and the availability of inorganic P in soils is low (Carranca, 2012; Rennenberg and Herschbach, 2013). Therefore, understanding the mechanism of dwarfing rootstock ‘M9-T337’ responses to N and/or P deficiency, and thus exploring the improvement of nutrient use efficiency is of great significance for realizing sustainable development of apple in modern agriculture.
In this study, using hydroponically-grown dwarfing rootstock ‘M9-T337’ as the experimental material, we explored the variation in plant growth, root morphology, and N and P absorption under N and/or P deficiency and identified the key genes and metabolites associated with root morphological changes under different N and P supply conditions. Furthermore, we investigated the potential roles of two cell wall expansin genes, MdEXPA4 and MdEXLB1, which are significantly induced by N and/or P deficiency, in root development using stable overexpression systems. Our results contribute to the understanding of root architecture regulation in apple dwarfing rootstock and provide important information about the molecular mechanisms underlying the coordinated utilization of N and P under N and P nutritional deficit environment.
Tissue-cultured ‘M9-T337’ seedlings were transplanted to soil after rooting and grown for an additional 5 weeks in a greenhouse at 25°C (day) and 20°C (night), relative humidity 65–70%, light intensity 400 μM m−2 s−1, and a photoperiod of at 16 (light):8 h (dark), using full spectrum LED lamps. During this period, plants were watered weekly with modified 1/2-strength Hoagland nutrient solution [2.5 mM (NH4)2Suc, 0.1 mM KH2PO4, 5.9 mM KCl, 1 mM CaCl2·2H2O, 2 mM MgSO4, 0.1 mM Fe-EDTANa2, 0.05 mM H3BO3, 0.001 mM ZnSO4, 0.001 mM CuSO4·5H2O, 0.012 mM MnSO4·H2O, and 0.0002 mM Na2MOO4·7H2O) to ensure normal growth. Then, 180 plants of similar size with 8–9 leaves were selected to pre-culture in deionized water for about 10 d, allowing them to adapt to the hydroponic conditions and fully consume their stored nutrients. Next, the plants were divided randomly into four groups and separately exposed to (1) N+P-sufficient (NNNP, 5 mM KNO3 and 1 mM KH2PO4), (2) P-deficient (NNLP, 5 mM KNO3 and 0.001 mM KH2PO4), (3) N-deficient (LNNP, 0.2 mM KNO3 and 1 mM KH2PO4), and (4) N+P-deficient (LNLP, 0.2 mM KNO3 and 0.001 mM KH2PO4) conditions. The four nutrient solutions each contained 1 mM CaCl2·2H2O, 2 mM MgSO4, 0.1 mM Fe-EDTANa2, 0.05 mM H3BO3, 0.001 mM ZnSO4, 0.001 mM CuSO4·5H2O, 0.012 mM MnSO4·H2O, and 0.0002 mM Na2MOO4·7H2O, and the pH was adjusted to 5.9. In the NNLP, LNHP, and LNLP treatments, KCl was used to replace KH2PO4 or KNO3 to avoid K deficiency. In this experiment, 15 hydroponic boxes (1 L volume) were set up for each treatment. Each box contained 1 L of nutrient solution and three seedlings. The nutritional treatments were continued for 8 weeks and refreshed every 7 d. A submersible pump (power: 3W) was used to supply oxygen to the nutrient solution in each hydroponic box, and 30 minutes every two hours. For 15N determination, nine seedlings from each treatment were selected to treat with nutrient solutions that replaced potassium nitrate with 15N-KNO3 (10.14%, Shanghai Research Institute of Chemical Industry, China).
After treatment, the roots were dispersed in water to separate them, and photographs were taken using a photo scanner (Epson, Japan). The images were analyzed using WinRHIZO Pro2009 (Regent Instruments, Canada) to determine the root parameters. Three biological replicates were assessed for each treatment.
The roots, stems, and leaves of three experimental replications from each treatment were harvested and the fresh weights measured. The components were then dried in an oven individually at 105°C for 30 min and then at 70°C to a constant weight. The dry weight was then measured.
The roots, stems, and leaves of ‘M9-T337’ seedlings labelled with 15N were washed three times with distilled water, fixed at 105°C for 30 min, and dried at 70°C to a constant weight before being ground into a powder. Then, 0.3 g of powdered material from each tissue type was digested using H2SO4-H2O2 and fixed in distilled water to a final volume of 50 mL. Five milliliters of the clear supernatant were removed to determine the total P content using the vanadium molybdate yellow colorimetric method (Zhang et al., 2020). The remaining 0.1 g of powdered material from each tissue type was used to determine the total N content and 15N abundance using a Flash 2000HT elemental analyzer coupled to a Finnigan DELTA V Advantage isotope ratio mass spectrometer (Thermo Fisher Scientific, Germany). The total N contents or 15N contents of the leaf, stem, and root were calculated by multiplying the N concentration or 15N concentration by the dry weight, respectively. 15N utilization efficiency (15NUE) was calculated as the ratio of the total 15N content in the seedling to the total 15N in the fertilizer.
On Day 7 of the experimental period, three seedlings from each treatment were used for ion flux measurements. The net H+ and flux in the rhizosphere was measured with a noninvasive micro test technique (NMT 100 Series, Younger USA LLC, USA). Ionic flux data were calculated using Mage Flux (http://xuyue.net/mageflux).
On Day 30 of the experimental period, the roots from each treatment were harvested and divided into two portions, one for widely targeted metabolomics determination and the other for transcriptome sequencing. Extraction, derivatization, detection, quantification, and data analyses were carried out by Wuhan MetWare Biotechnology Co., Ltd., China. Three biological replicates were assessed for each treatment, and one biological replicate was used for every nine seedling root mixes. The metabolites were extracted with a 70% methanol solution from 0.1 g of the lyophilized powdered samples, and, subsequently, the sample extracts were analyzed using an UPLC-ESI-MS/MS system (Applied Biosystems 4500 Q TRAP, Germany; SHIMADZU Nexera X2, MS, Japan).
The metabolites in the different samples were analyzed based on the Kyoto Encyclopedia of Genes and Genomes (KEGG) compound database, MetWare database (MWDB), and multiple reaction monitoring (MRM). To study metabolite accession-specific accumulation, metabolites from 12 samples were used for hierarchical clustering analysis (HCA) and orthogonal partial least squares discriminant analysis (OPLS-DA) after being log2-transformed and normalized. The metabolites were selected on the basis of the combination of a statistically significant threshold of variable influence in projection (VIP) values obtained from the OPLA-DA model and P values from a two-tailed Student’s t-test on the normalized peak areas from different groups, where metabolites with VIP > 1.0 and P< 0.05 were considered differentially accumulated metabolites (DAMs). Venn diagrams were used to illustrate the number of DAMs among different treatments. In order to study the trend of relative metabolite content under different N and P supply conditions, the relative content of all DAMs was standardized to z-core, and then Kmeans cluster analysis was conducted based on z-core. Z-core was calculated by equation (1). x represents the quantitative value of a specific metabolite, μ represents the average quantitative value of all metabolites, and σ represents the standard deviation.
Total RNA of the samples was extracted with an RNAprep Pure Plant kit (DP441, Tiangen, China). The high-quality mRNA was randomly fragmented. First-strand cDNA was synthesized using the M-MuLV reverse transcriptase system. The RNA strand was then degraded by RNase H, and second-strand cDNA was synthesized using DNA polymerase. The double-stranded cDNAs were ligated to sequencing adapters. After amplification and purification, cDNA libraries were obtained and sequenced using a Novaseq6000 system (Illumina, USA).
Gene expression levels were determined using the RPKM (reads per kb per million reads) method. Differential expression analysis was performed using DESeq2 with a design formula [|log2(FoldChange)|≥ 1 and false discovery rate (FDR)< 0.05] that took into account the contrast among samples from four treatments. The genes/transcripts with an adjusted P value of<0.05, using multi-testing error correction (Benjamini-Hochberg test) and corresponding to a false discovery rate (FDR) of 1%, were considered to be differentially expressed genes (DEGs). All DEGs were mapped to pathway terms in the KEGG database (http://www.genome.jp/kegg/). The FPKM values after centralization and standardization were used for DEGs hierarchical clustering analysis, and the clustering heatmap was drawn.
Quantitative values of genes and metabolites in all samples were used for correlation analysis using R (corrplot, Version 0.84). Correlation results with correlation coefficient greater than 0.8 and p value less than 0.05 were selected to draw nine-quadrant heatmap and correlation heatmap.
Purified RNA was reverse transcribed to first-strand cDNA with a PrimeScript™ RT Master Mix cDNA Reverse Transcription Kit (Takara, China). qRT-PCR was conducted with a ChamQ SYBR qPCR Master Mix kit (Vazyme, China) and a C1000 Touch™ Thermal Cycler system (Bio-Rad, USA). Relative transcript levels were calculated according to the 2−ΔΔCp method using MdActin as a reference. Three biological and technical replications were performed. The primes sequences are shown in Table S1.
The open reading frames of MdEXPA4 and MdEXLB1 were respectively inserted into the pRI 101-AN vector (TaKaRa, China), and the recombinant plasmids were respectively transformed into Agrobacterium strain GV3101. The recombinant plasmids were transformed into Col-0 using floral-dip transformation. T0 seeds were sown on 1/2 MS medium containing Kanamycin (50 mg/L) for transgenic selection. Two homozygous T3 transgenic A. thaliana lines (#1 and #2) were selected for further study. The MdEXLB1 plasmids were transfected into Solanum lycopersicum (cultivar Ailsa Craig) plants through leaf explant infection. Three third generation homozygous transgenic lines (#5, #8, and #11) were selected for further study.
Seeds of wild-type (WT) and MdEXLB1-OE S. lycopersicum were sown in MS medium. After sprouting, the seedlings were transplanted to soil and grown for an additional 2 weeks. Then, seedlings of similar size were randomly divided into four groups and separately exposed to N+P-sufficient, P-deficient, N-deficient, and N+P-deficient conditions, as in section 2.1. The nutritional treatments were continued for 8 weeks and refreshed every 7 d.
The seeds of wild-type and MdEXPA4-OE A. thaliana were sown in MS medium. After sprouting, the seedlings were grown on MS medium with different concentrations of and : (1) N+P-sufficient (NNNP, 60 mM and 1.25 mM ), (2) P-deficient (NNLP, 60 mM and 0.01 mM ), (3) N-deficient (LNNP, 0.2 mM and 1.25 mM ), and (4) N+P-deficient (LNLP, 0.2 mM and 0.01 mM ) conditions.
All physiological data were graphed using GraphPad Prism v6.01 (GraphPad Software Inc., USA). Duncan’s test (P< 0.05) was used to analyze the statistical significance by SAS v9.0 (SAS Institute Inc. USA).
Compared with NNNP, the above-ground growth of ‘M9-T337’ seedlings was inhibited under NNLP, LNNP, and LNLP conditions (Figure 1). Relative to NNNP, the leaf fresh weight decreased by 57.64%, 68.16%, and 81.24% under NNLP, LNNP, and LNLP conditions, respectively, and the leaf dry weight decreased by 48.10%, 46.32%, and 76.49%, respectively. In addition, the stem fresh weight decreased significantly only under LNLP, whereas the stem dry weight decreased by 29.46% and 58.63% under NNLP and LNLP conditions, respectively. However, the root fresh weight increased 1.78-fold under LNLP, and the root dry weight increased 1.35- and 1.94-fold under LNNP and LNLP conditions, respectively. Overall, the total plant fresh weight decreased in the order NNNP > NNLP > LNNP > LNLP, while the total plant dry weight decreased by 36.42% and 57.55% under NNLP and LNLP, respectively (Figures 1B, C). Based on the dry weights of the shoot and root, 1.86-fold, 2.14-fold, and 5.71-fold increases were found in the root-to-shoot ratio under NNLP, LNLP, and LNLP conditions, respectively (Figure 1D).
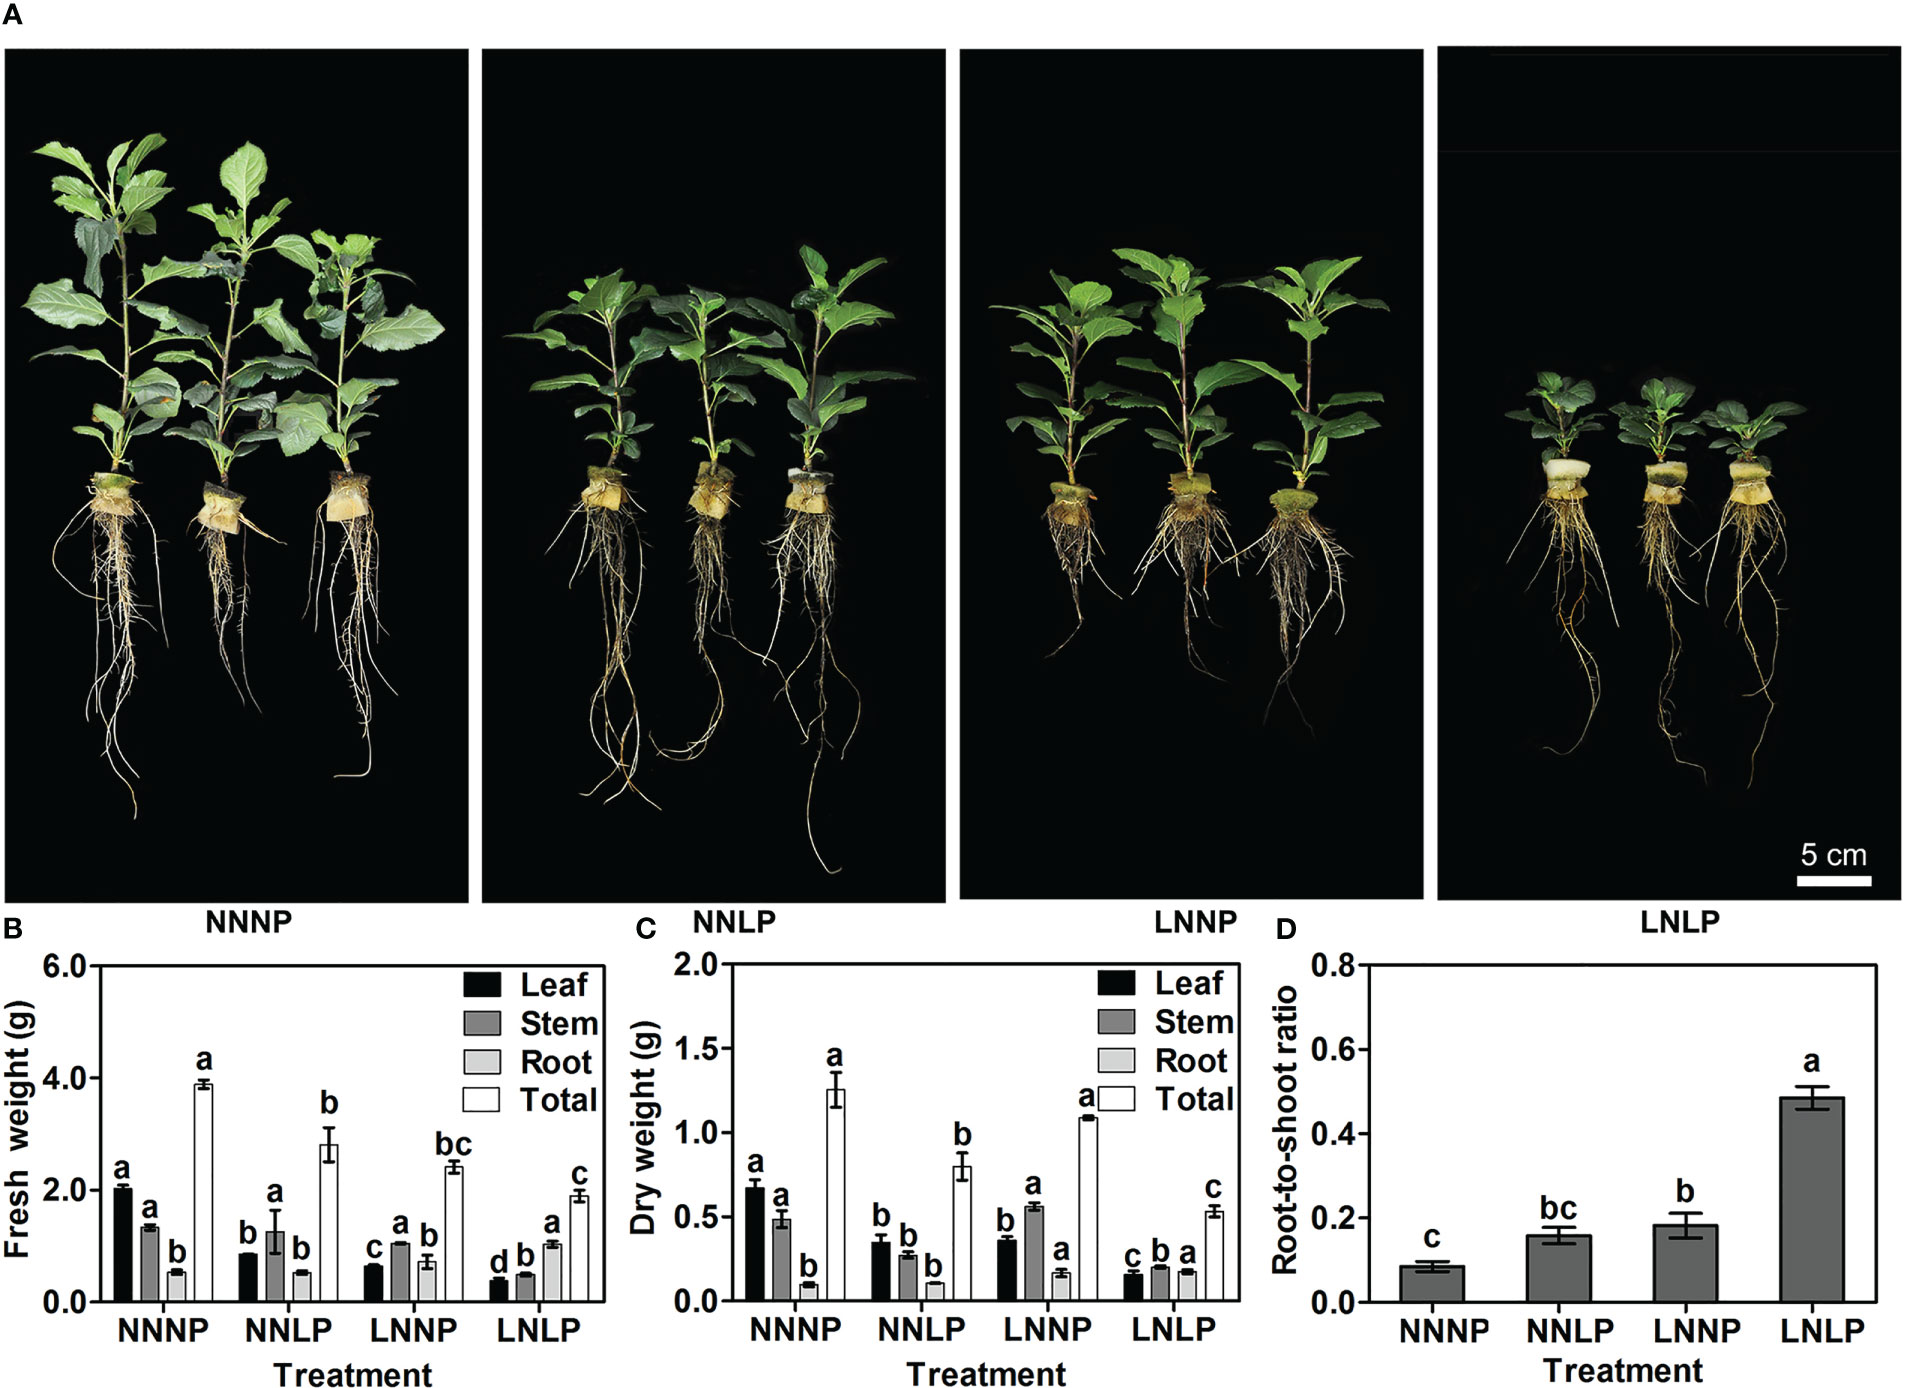
Figure 1 Effects of N and P supply conditions on growth of ‘M9-T337’ seedlings. (A) Phenotype characterization of ‘M9-T337’ seedlings after growth in N, P-sufficient (NNNP), P-deficient (NNLP), N-deficient (LNNP), and N, P-deficient (LNLP) nutrient solutions for 60 d, respectively. Scale bar = 5 cm. (B) Fresh weights, (C) dry weights and (D) the root-to-shoot ratio after growth in NNNP, NNLP, LNNP, and LNLP nutrient solutions for 60 d. Data were shown as means ± SE (n = 3), and different lowercase letters above the bars indicate significant differences among different treatments (p<0.05).
Taking into account the root parameters, NNLP, LNNP, and LNLP significantly affected the total root length, volume, surface area, average diameter, and number of tips. The total values for root length, volume, and surface area decreased among treatments in the following order: NNLP > LNLP > LNNP > NNNP, and the differences were significant (Figures 2A–C). The root average diameter increased 1.13 times under LNNP, whereas it reduced by 11.36% and 24.40% under NNLP and LNLP, respectively (Figure 2D). The greatest increase in root forks was found under the LNLP condition (Figure 2E). Additionally, 19.20%, 25.33%, and 39.18% increases in root tips were observed in NNLP, LNNP, and LNLP, respectively (Figure 2F).
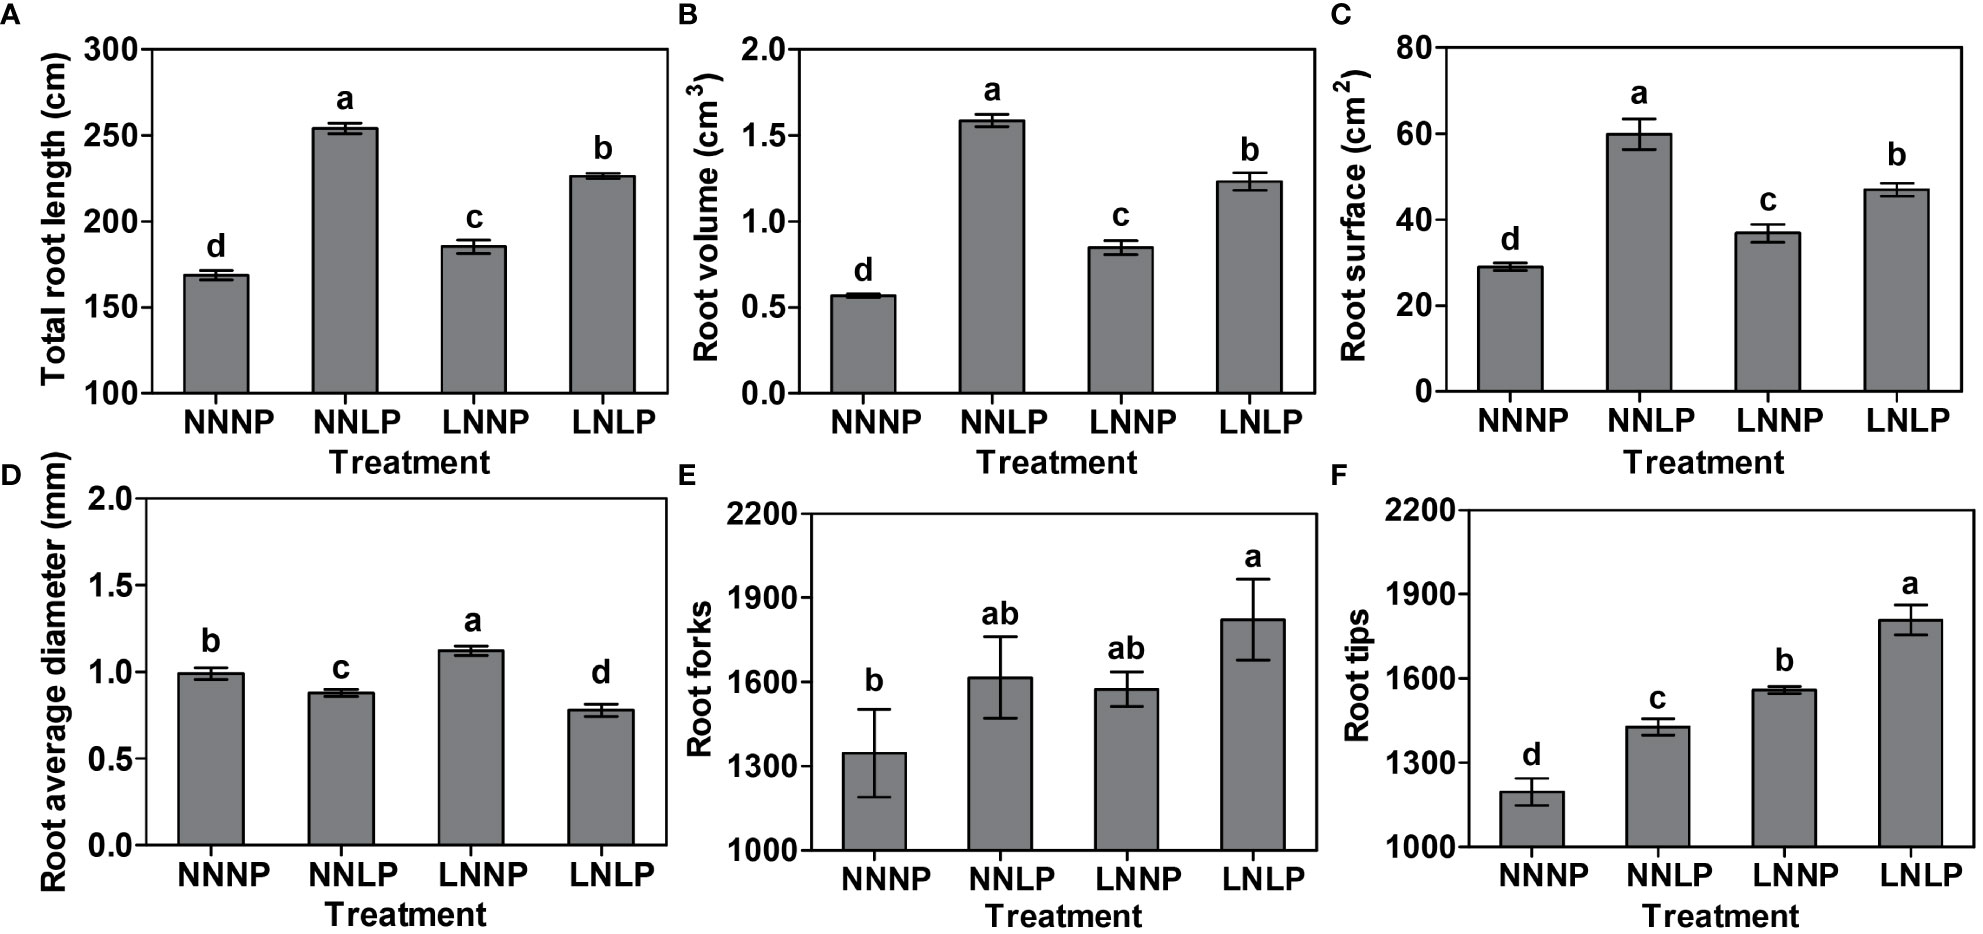
Figure 2 Differences in the root parameters of the "M9-T337" seedlings after growth in NNNP, NNLP, LNNP, and LNLP nutrient solutions for 60 d. (A) Total root length, (B) root volume, (C) root surface area, (D) root average diameter, (E) number of root forks and (F) number of root tips. Data are shown as means ± SE (n = 3), and different lowercase letters above the bars indicate significant differences among the treatments (p < 0.05).
Compared with that in NNNP, the total leaf N contents in NNLP, LNNP, and LNLP were significantly reduced by 18.87%, 77.67%, and 75.94%, respectively; the total stem N content was increased 1.15-fold in LNNP, but reduced by 15.87% in LNLP; and the total root N contents in NNLP, LNNP, and LNLP were increased 1.39-fold, 1.30-fold, and 1.72-fold. Based the total N content in all organs, the ranking for the total N content in whole plants under different treatments was NNNP > NNLP > LNNP ≌ LNLP (Figure 3A). Similarly, compared to those grown under NNNP conditions, the 15N contents under NNLP, LNNP, and LNLP conditions were reduced by 46.87%, 95.39%, and 91.75% in leaf, respectively. In stem and root, the 15N contents decreased significantly under LNNP and LNLP, but the greatest decreases were found in the LNNP treatment (75.54% and 62.57%); the decreases under NNLP were not significant (Figure 3C). Based on the 15N contents of different organs, 3.30-fold and 4.60-fold increases were found in the 15NUE under LNNP and LNLP, but no difference was found under NNLP (Figure 3D). NNLP caused a reduction of influx in comparison with NNNP, while there was much less influx under LNNP and LNLP in comparison with NNNP and NNLP (Figures 3E, G).

Figure 3 N and P absorption of ‘M9-T337’ seedlings after growth in NNNP, NNLP, LNNP, and LNLP nutrient solutions for 60 d. (A) Total N content and (B) total P in the leaf, stem, and root were measured, the content in total plant was calculated as the sum of the content in three parts. 15N content in the leaf, stem, root and the plant were shown as (C), and 15NUE was calculated as the ratio of total 15N content in the seedling to total 15N in the nutrient solutions (D). (E, G) Net fluxes of NO3- after growth in NNNP, NNLP, LNNP, and LNLP nutrient solutions for 7 d. (F) Net fluxes of H+ in different regions of root surface of ‘M9-T337’ seedlings after growth on NNNP nutrient solution for 7 d. (H) Changes of H+ fluxes at 400 μm from the apical end of the root tip in roots of ‘M9-T337’ seedlings after growth on NNNP, NNLP, LNNP, and LNLP nutrient solutions for 7 d. Data in the (A-D, G, H) were shown as means ± SE (n = 3), data in the (E-H) positive values indicate iron influx, negative values indicate iron efflux. Duncan’s test (p < 0.05) was used to analyze the statistical significance, and different lowercase letters indicate significant differences among different treatments.
The total leaf P content by treatment decreased in the order: NNNP > NNLP > LNNP > LNLP, and the differences were significant. The greatest decrease in the total stem P content was observed in the LNLP treatment (64.03%). Relative to NNNP, the total root P content decreased by 31.80% under NNLP but increased by 29.90% and 16.83% under LNNP and LNLP, respectively. The total P contents in whole plants under NNLP, LNNP, and LNLP decreased, with the greatest decrease found in the LNLP treatment (62.08%) (Figure 3B). The maximum H+ influx was detected at 400 μm from the apical end of the root tip in roots of ‘M9-T337’ seedlings after growth under NNNP conditions for 7 d (Figure 3F). However, obvious H+ efflux was detected in the same region of the roots of ‘M9-T337’ seedlings under NNLP, LNNP, and LNLP treatments. The maximum H+ efflux was detected in the roots of ‘M9-T337’ seedlings under the LNNP treatment (Figure 3H).
A total of 1,069 metabolites were obtained, and these substrates were classified into 11 categories at Class 1 level; specifically: 216 flavonoids, 227 phenolic acids, 152 lipids, 96 amino acids and derivatives, 85 organic acids, 69 nucleotides and derivatives, 57 alkaloids, 41 triterpenes, 40 lignans and coumarins, 19 tannins, and 97 others (Figure S1). To study the metabolite accumulation patterns, a K-means cluster analysis was performed. The results showed the metabolites were divided into five subclasses (Figure 4A). Metabolites in subclass 1 showed an increasing trend under LNNP, and the content of metabolites in subclass 3 tended to increase under NNLP and LNLP compared with NNNP, while subclass 4 metabolites showed a decreasing trend under LNLP, and those in subclasses 2 and 5 exhibited a decreasing trend under NNLP, LNNP, and LNLP in comparison to NNNP. Compared with NNNP, 264 DAMs were observed under NNLP, of which 21.97% were significantly up-regulated and 78.03% exhibited significant down-regulation. The 313 DAMs were observed under LNLP, of which 38.02% were up-regulated and 72.52% were down-regulated. In addition, 229 DAMs were observed under LNNP, of which 17.90% were up-regulated and 82.10% were down-regulated (Figure 4B). Venn analysis revealed 79 common DAMs in the comparisons of NNNP vs NNLP, NNNP vs LNNP, and NNNP vs LNLP. In addition, 78 DAMs were shared in comparisons of the NNNP vs NNLP and NNNP vs LNLP treatments, 22 were shared in the comparisons of NNNP vs NNLP and NNNP vs LNNP treatments, and 47 were shared in the comparisons of NNNP vs LNNP and NNNP vs LNLP treatments (Figure 4C).
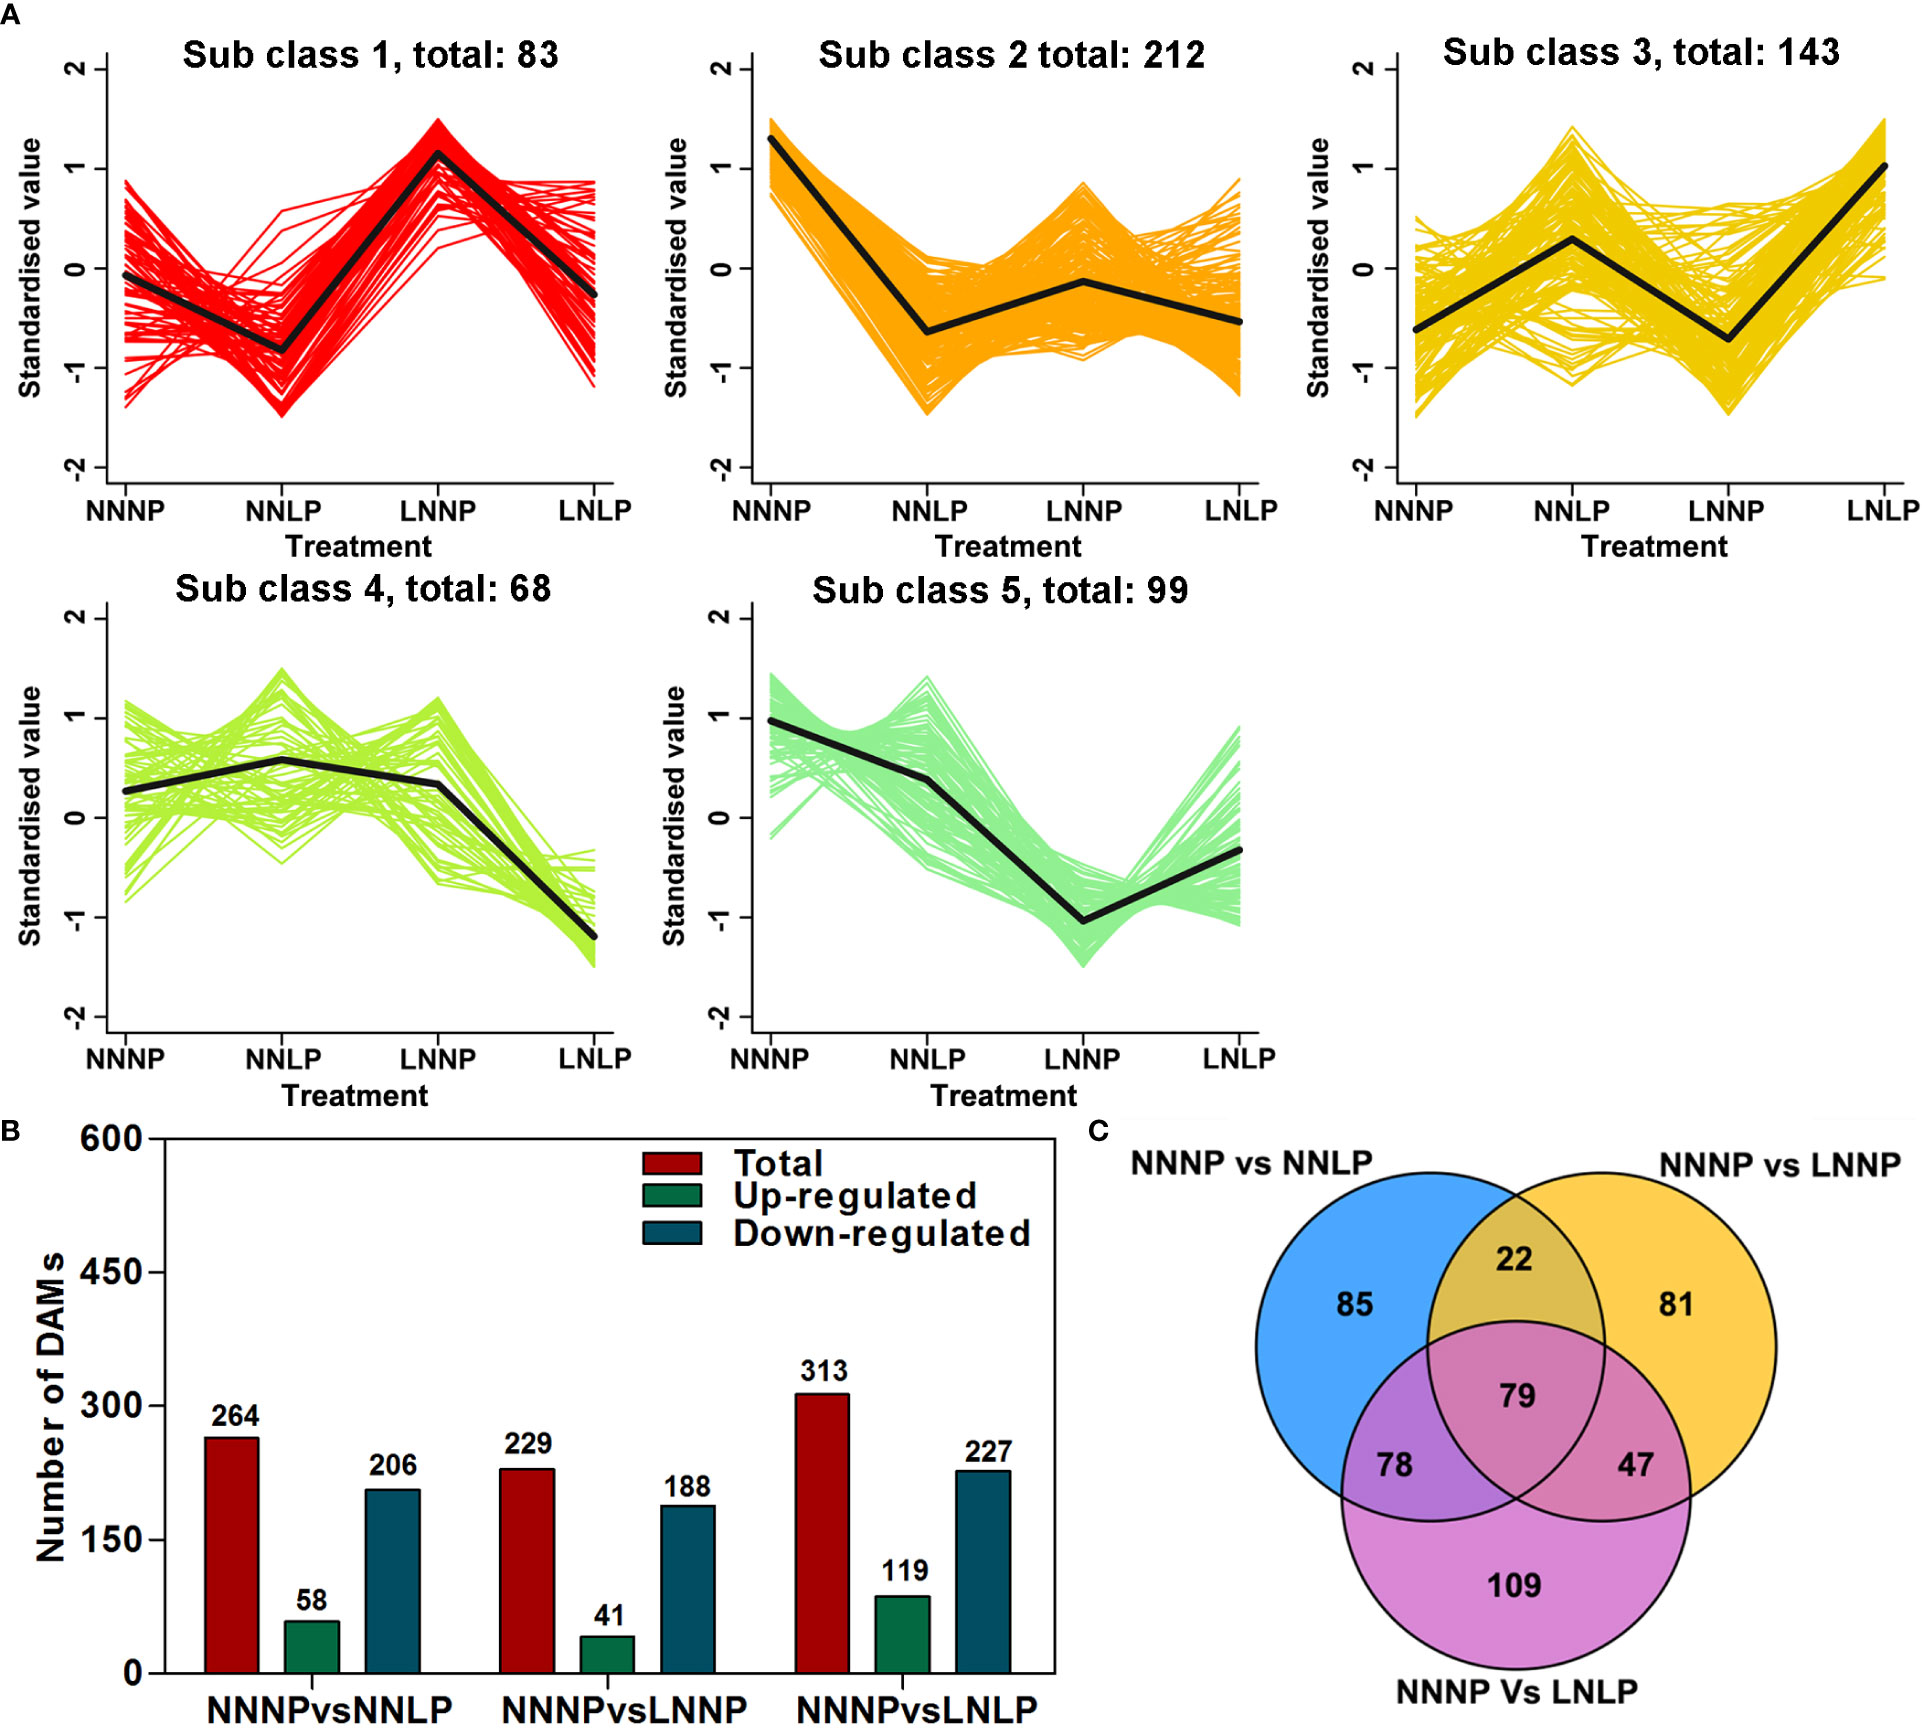
Figure 4 Differential metabolite analysis in the roots of ‘M9-T337’ seedlings after growth on NNNP, NNLP, LNNP, and LNLP nutrient solutions for 30 d. (A) K-means cluster diagram of differentially accumulated metabolites (DAMs). The X-coordinate represented the sample, the Y-coordinate represented the relative standardized metabolite content. Sub class represented the K-means clustering category number of metabolites with similar trends, and total represented the numbers of metabolites in the sub class. (B) Number of up-regulated, down-regulated, and total DAMs in multiple pairwise comparisons of NNNP vs. NNLP, NNNP vs. LNNP, and NNNP vs. LNLP. (C) Venn diagram of DAMs in multiple pairwise comparisons of NNNP vs. NNLP, NNNP vs. LNNP, and NNNP vs. LNLP.
To further analyze genome-wide changes in gene expression, the 12 samples were used to construct RNA libraries and perform RNA-seq. A total of 2025 DEGs were identified in the NNNP vs NNLP comparison, of which 52.40% were up-regulated and the rest were down-regulated; a total of 2851 genes were differentially expressed in the NNNP vs LNNP comparison, of which 61.24% were up-regulated, and the rest were down-regulated; a total of 1963 genes exhibited significant differences in expression in the NNNP vs LNLP comparison, of which 52.29% were up-regulated, and the rest were down-regulated (Figure 5A). Five hundred DEGs were common in the comparisons of NNNP vs NNLP, NNNP vs LNNP, and NNNP vs LNLP (Figure 5B). Compared with NNNP, the changes in gene transcription levels under NNLP and LNLP were greater than those under LNNP (Figure 5C).
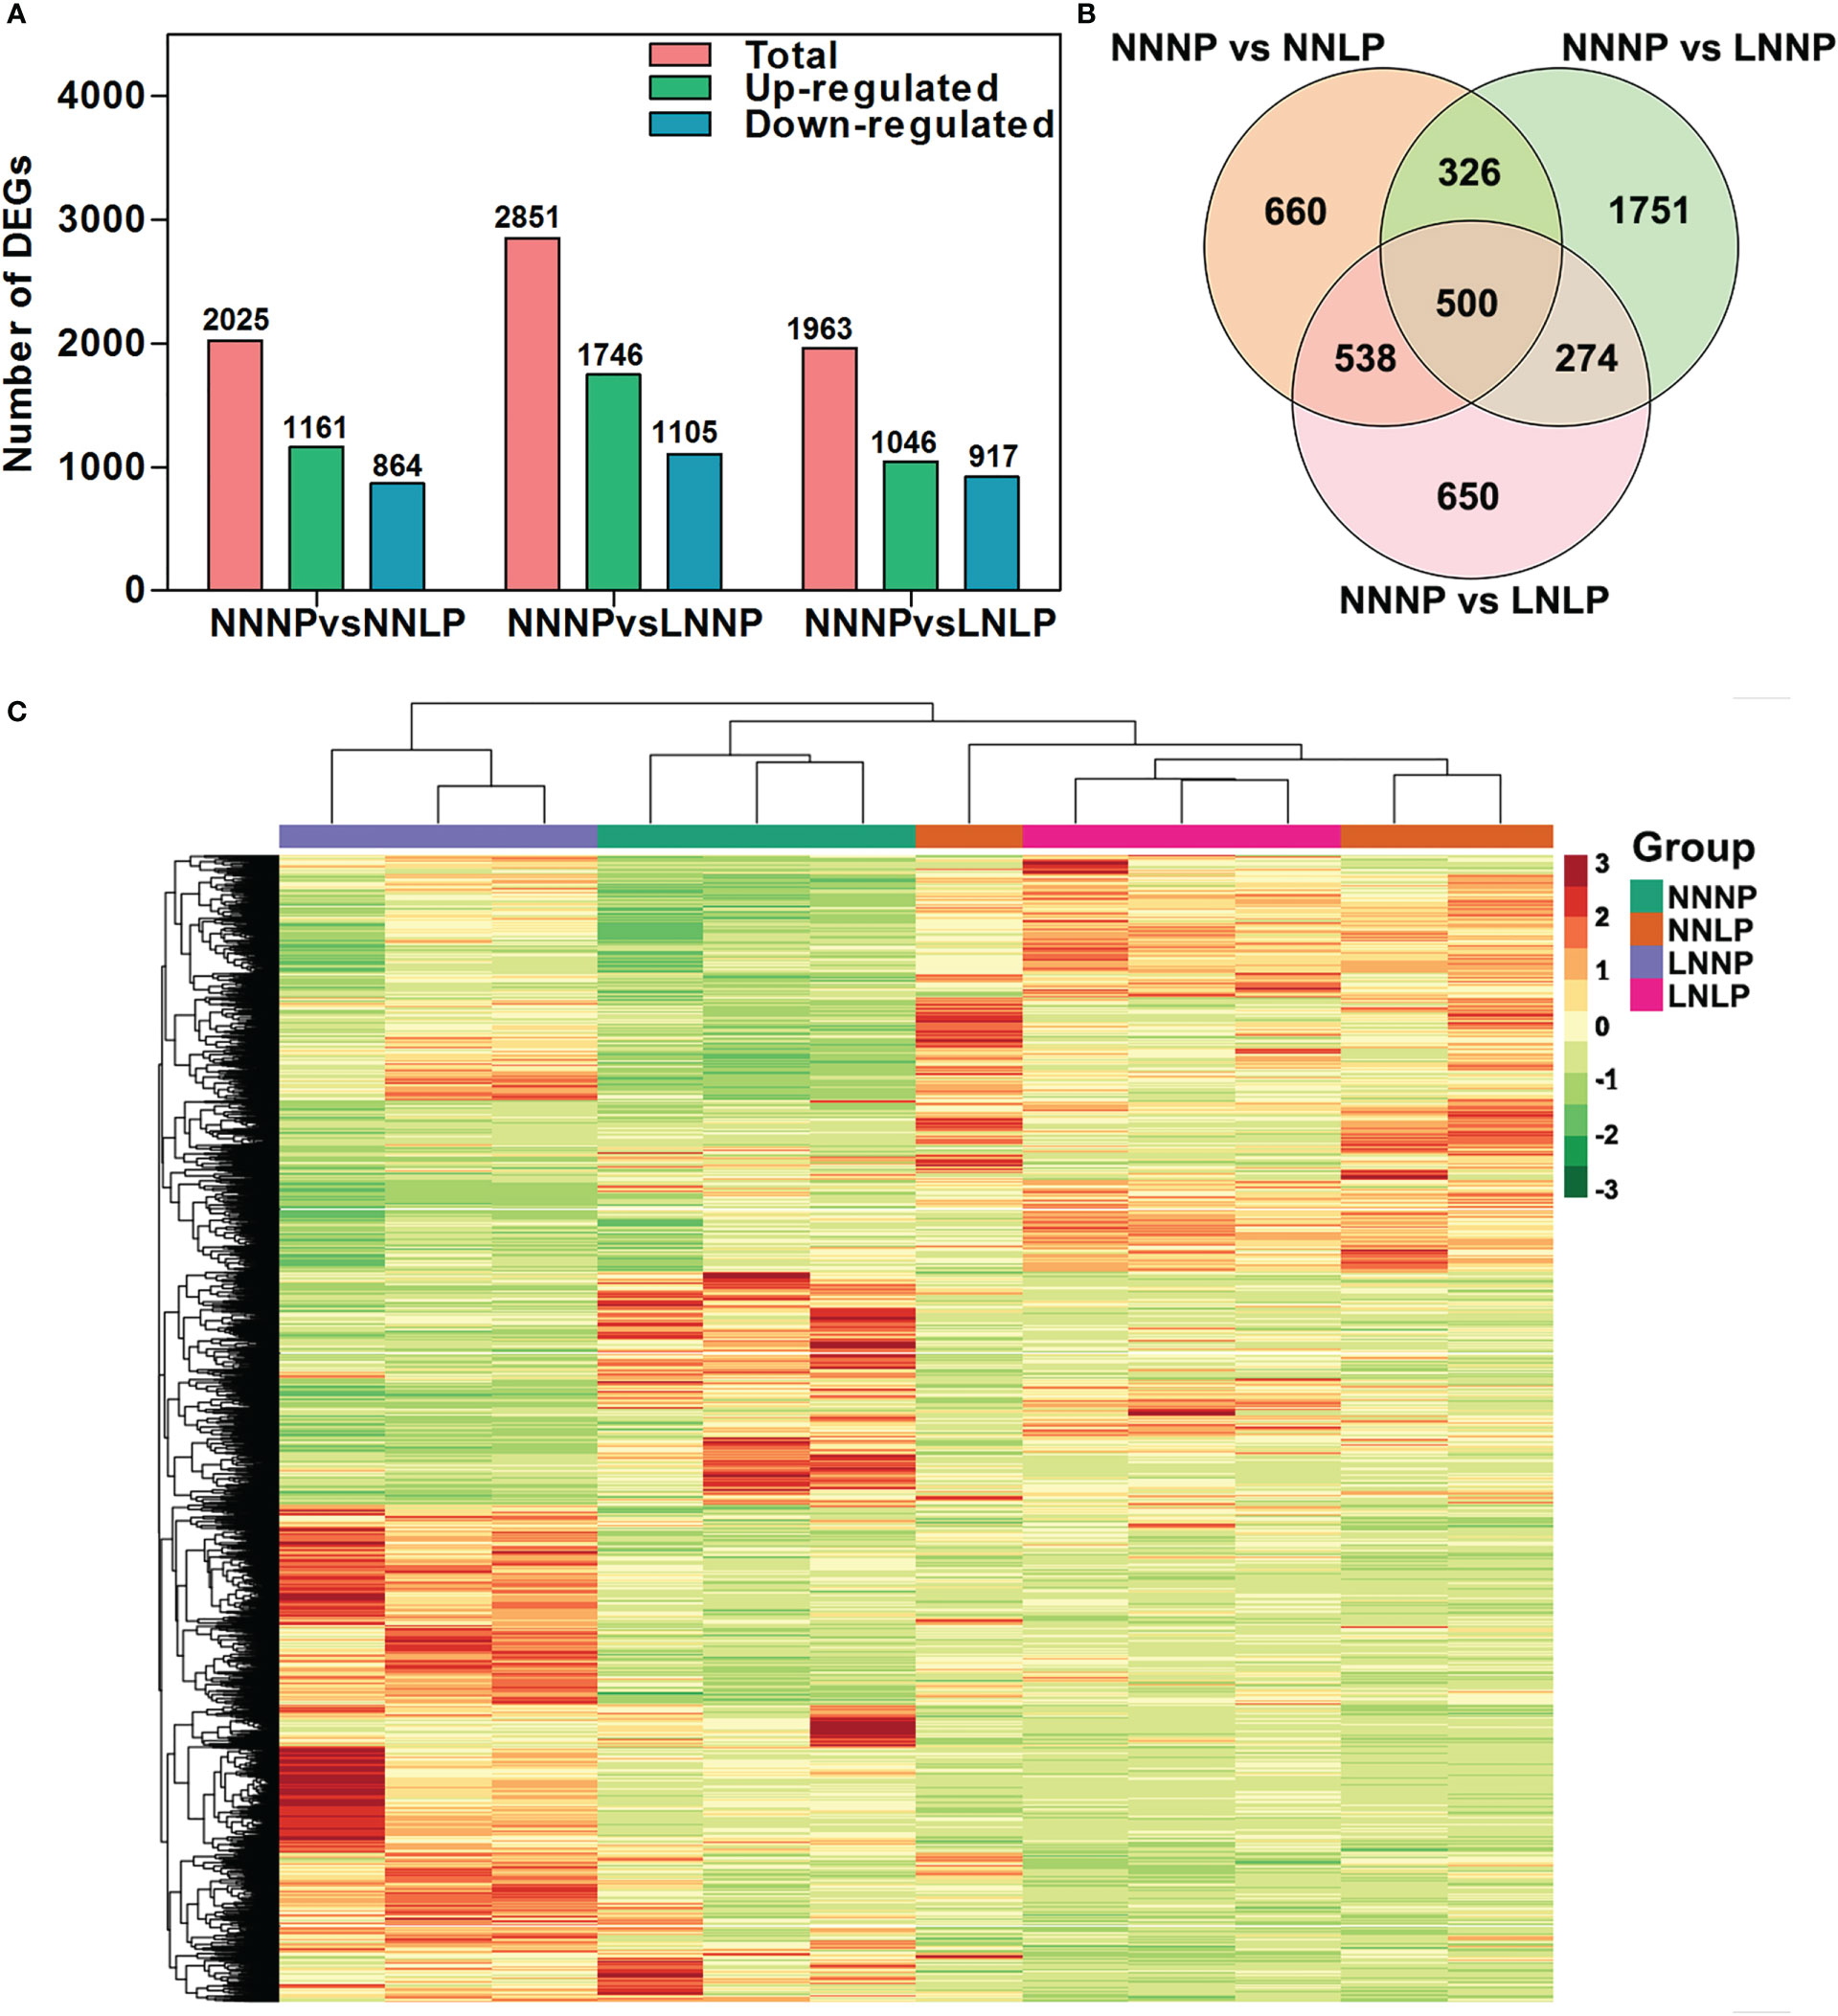
Figure 5 .Differential expressed gene analysis in the roots of ‘M9-T337’ seedlings after growth on NNNP, NNLP, LNNP, and LNLP nutrient solutions for 30 d. (A) The number of differentially expressed genes (DEGs) in the comparison of NNNP vs NNLP, NNNP vs LNNP, and NNNP vs LNLP. (B) Venn diagram showing the overlap among DEGs in each of the different conditions of N and P supply. (C) Heatmap showing the divergence of the respective transcriptome in response to N and/or P deficiency. Hierarchical clustering analysis was based on Euclidean distance among samples.
KEGG enrichment analysis showed that DEGs and DAMs in the comparison of NNNP vs NNLP were association with 62 co-mapped pathways; those in the comparison of NNNP vs LNNP were associated with 49 co-mapped pathways; and those in the comparison of NNNP vs LNLP were associated with 63 co-mapped pathways. Metabolism-related assignments such as metabolic pathways, biosynthesis of secondary metabolites, biosynthesis of cofactors, biosynthesis of amino acids, flavonoid biosynthesis, 2-oxocarboxylic acid metabolism, phenylpropanoid biosynthesis, carbon metabolism, and purine metabolism, as well as environmental information processing-related pathways, including ABC transporters, were conspicuously enriched pathways under N and/or P deficient conditions (Figure S2). According to the Pearson correlation coefficients (PCCs) for genes and metabolites detected in each sample, the metabolite changes may have been positively regulated by genes in the third and seventh quadrants, while the patterns of genes and metabolites from the first and ninth quadrants showed the opposite (Figures 6A–C). The DAMs and DEGs with PCCs greater than 0.8 are shown in Figures 6D–F. Respectively, 256 DAMs and 1,915 DEGs, 228 DAMs and 2,656 DEGs, and 306 DAMs and 1,893 DEGs were screened in the comparisons of NNNP vs. NNLP, NNNP vs. LNNP, and NNNP vs. LNLP. The DAMs under NNLP and LNLP conditions were distributed in the 11 groups of Class I, while the DAMs under LNNP were distributed among 10 groups. Notably, tannin substances such as procyanidin C2, strictinin, corilagin, and Sanguiin H1 were not screened under LNNP.
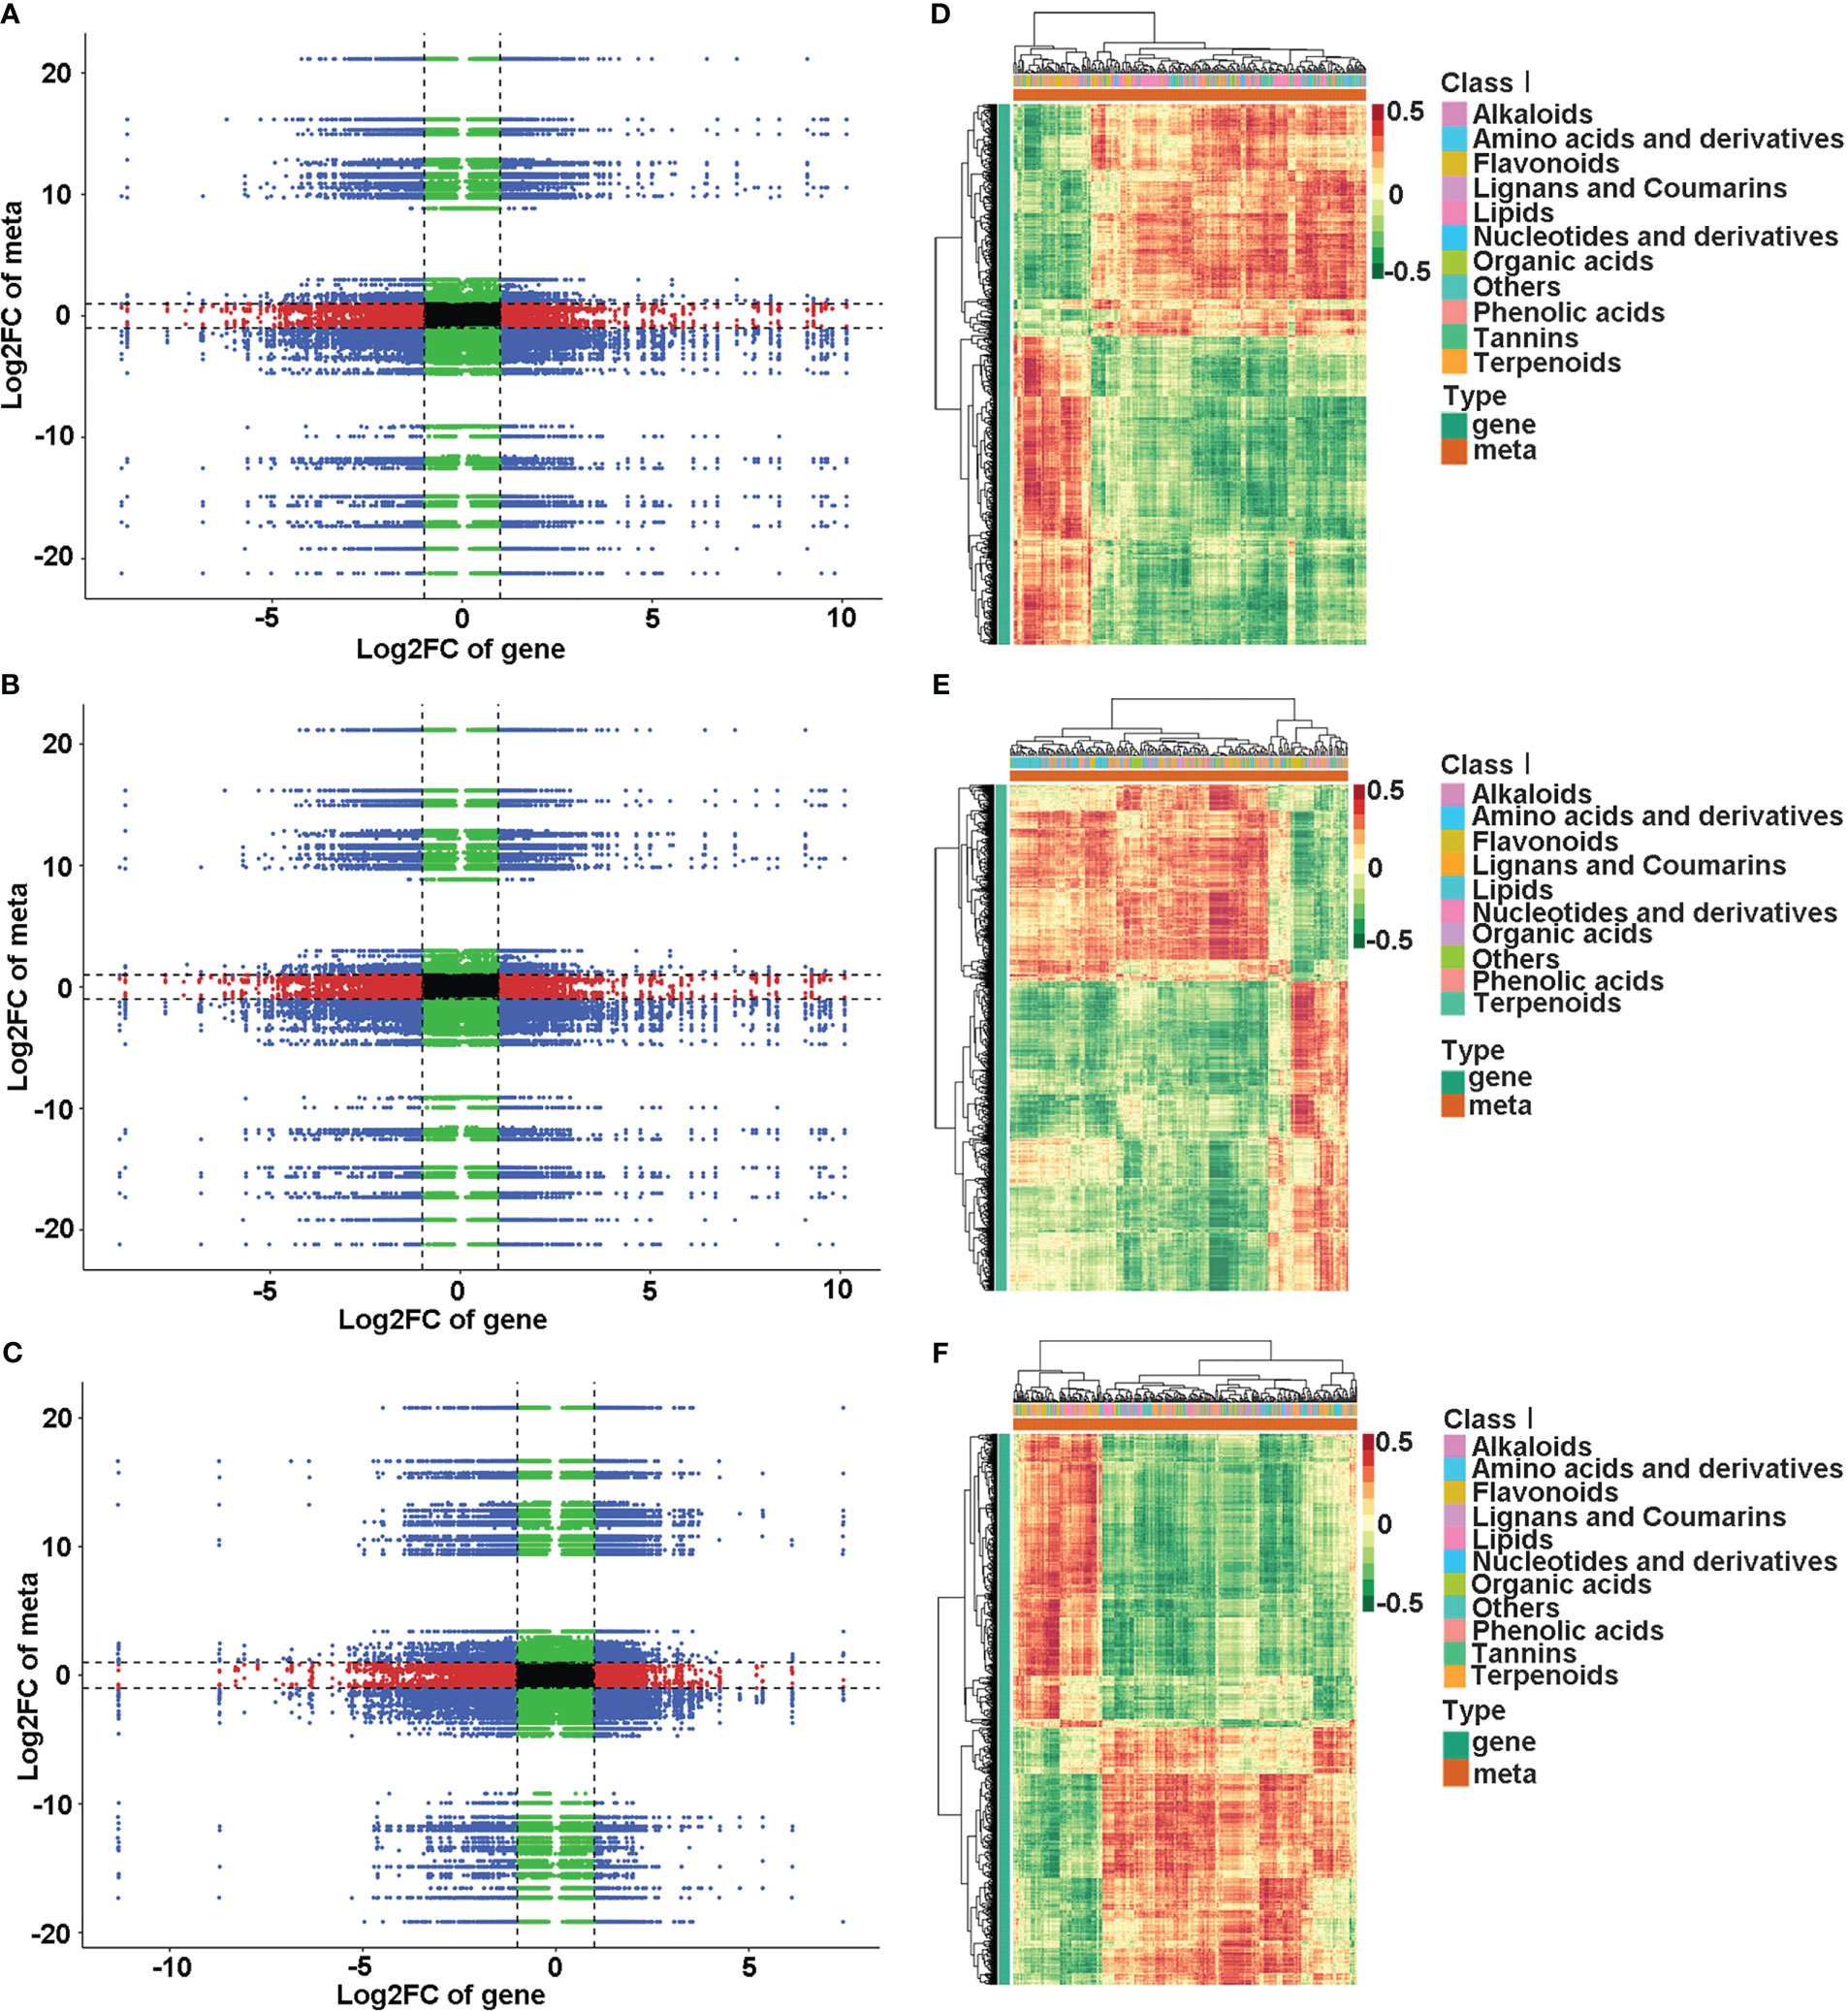
Figure 6 Conjoint analysis of DEGs and DAMs in the roots of the ‘M9-T337’ under P-deficiency, N-deficiency and N and P-deficiencies. Correlation analysis of transcriptomic and metabolomic data (A–C) and the Pearson correlation coefficient cluster heatmap of DEGs and DAMs (PCCs > 0.8 and p<0.05) (D–F) in comparison of NNNP vs NNLP (A, D), NNNP vs LNNP (B, E) and NNNP vs LNLP (C, F).
Association analysis based on the KEGG database showed that, in the comparison of NNNP vs. NNLP, the 68 DAMs and 413 DEGs with PCCs greater than 0.8 were mapped to 36 KEGG pathways; in the comparison of NNNP vs. LNNP, 59 DAMs and 521 DEGs with higher PCCs were mapped to 23 KEGG pathways in the comparison of NNNP vs. LNNP; and 80 DAMs and 360 DEGs with higher PCCs were mapped to 30 KEGG pathways in the comparison of NNNP vs. LNLP (Figure S3, Table S2). Among them, pentose and glucuronate interconversions, starch and sucrose metabolism, galactose metabolism, amino sugar and nucleotide sugar metabolism, and phenylpropanoid biosynthesis were conspicuously enriched pathways (Figure S4).
The content of D-Glucoronic acid and D-Arabinose, which involved in pectin synthesis, were reduced under LNNP, in addition, the content of Glucose-1-phosphate, Uridine 5’-diphospho-D-glucose, and D-Galacturonic acid, which related to pectin metabolism, tended to decrease under NNLP, however, the metabolites in pentose and glucuronate interconversions pathway which related to pectin metabolism did not change significantly under LNLP. The metabolites in starch and sucrose metabolism pathway and galactose metabolism pathway, and involved in hemicellulose metabolism such as D-Glucose 6-phosphate, D-Fructose 6-Phosphate, Glucose-1-phosphate, Uridine 5’-diphospho-D-glucose, D-Glucose 1,6-bisphosphate, and Dihydroxyacetone phosphate were all down-regulated under NNLP, moreover, D-Glucose 6-phosphate, D-Fructose 6-Phosphate, and Raffinose were down-regulated under LNLP, furthermore, D-Mannose and Dulcitol were down-regulated under LNNP, but D-Glucose 1,6-bisphosphate was up-regulated under LNNP. The metabolites involved in lignin metabolism pathway such as Syringin and Caffeoylquinic acid were down-regulated under NNLP and LNLP, Ferulic acid, Sinapic acid, and Sinapyl alcohol were up-regulated under NNLP and LNLP, Coumarin and Cinnamaldehyde were down-regulated under LNLP. Under LNNP, Cinnamic acid and Sinapine were down-regulated significantly. The content of amino acid that made up extension, such as L-lysine showed a decreasing trend under LNLP, and the content of amino acid that made up expansin such as L-tryptophan was decreased under LNLP. The content of above amino acids did not change significantly under NNLP and LNNP (Figure 7).
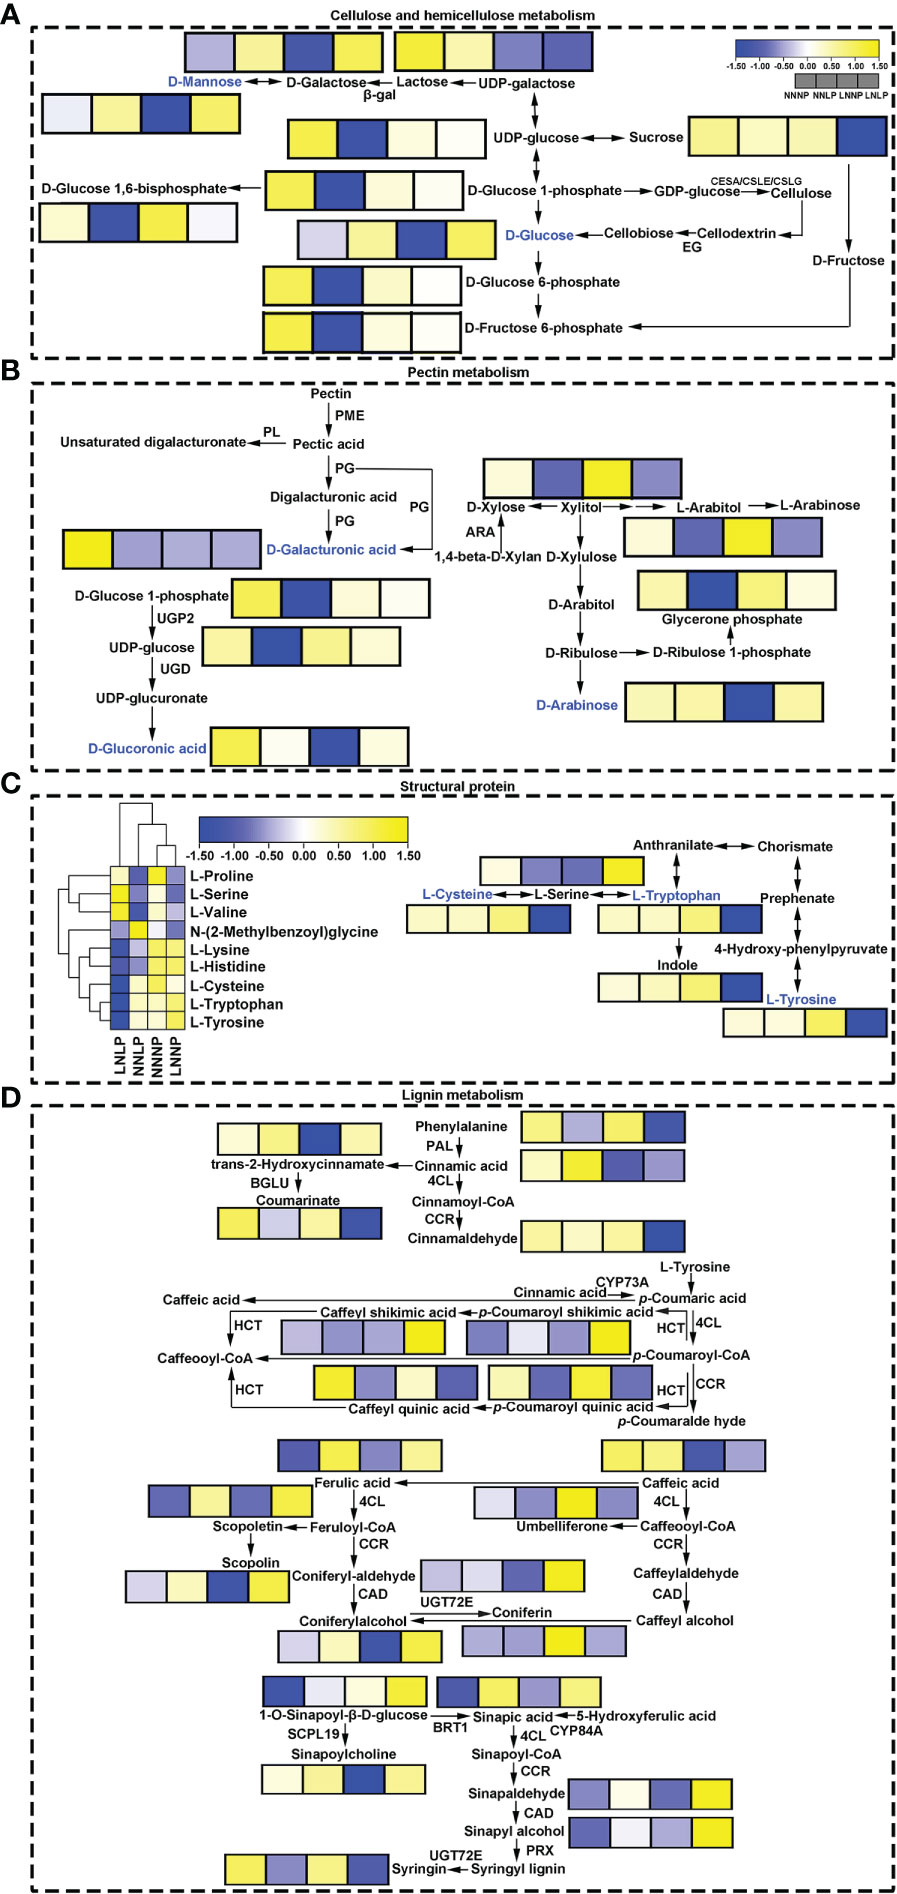
Figure 7 Schematic diagram showing hemicellulose metabolism (A), pectin metabolism (B), structural protein (C) and lignin biosynthesis (D). The box in the pathway represents differential metabolites. Yellow and blue represent upregulated and downregulated metabolites, respectively. ARA, beta-xylosidase/alpha-L-arabinofuranosidase 1-like; β-gal, beta-galactosidase; BRT, sinapate 1-glucosyltransferase; 4CL, 4-coumarate--CoA ligase; CSLE, cellulose synthase-like E; CSLG, cellulose synthase-like G; .CAD, cinnamyl-alcohol dehydrogenase; CCR, cinnamoyl-CoA reductase; CYP73A, trans-cinnamate 4-monooxygenase; EG, endoglucanase; HCT, shikimate O-hydroxycinnamoyltransferase; PAL, phenylalanine ammonia-lyase; PG, polygalacturonase; PL, pectatelyase; PME, pectinesterase; PRX, peroxidase; SCPL, serine carboxypeptidase-like; UGD, UDP glucose 6-dehydrogenase; UGP, UTP-glucose-1-phosphate uridylyltransferase; UGT72E, coniferyl-alcohol glucosyltransferase. The same as below.
A total of 261 non-redundant DEGs encoding cell wall proteins or enzymes involved in cell wall metabolism were screened, of which 44 were involved in hemicellulose metabolism, 10 in cell wall synthesis, 129 in lignin metabolism, 44 in glycoprotein synthesis, and 41 in pectin metabolism (Figure 8).
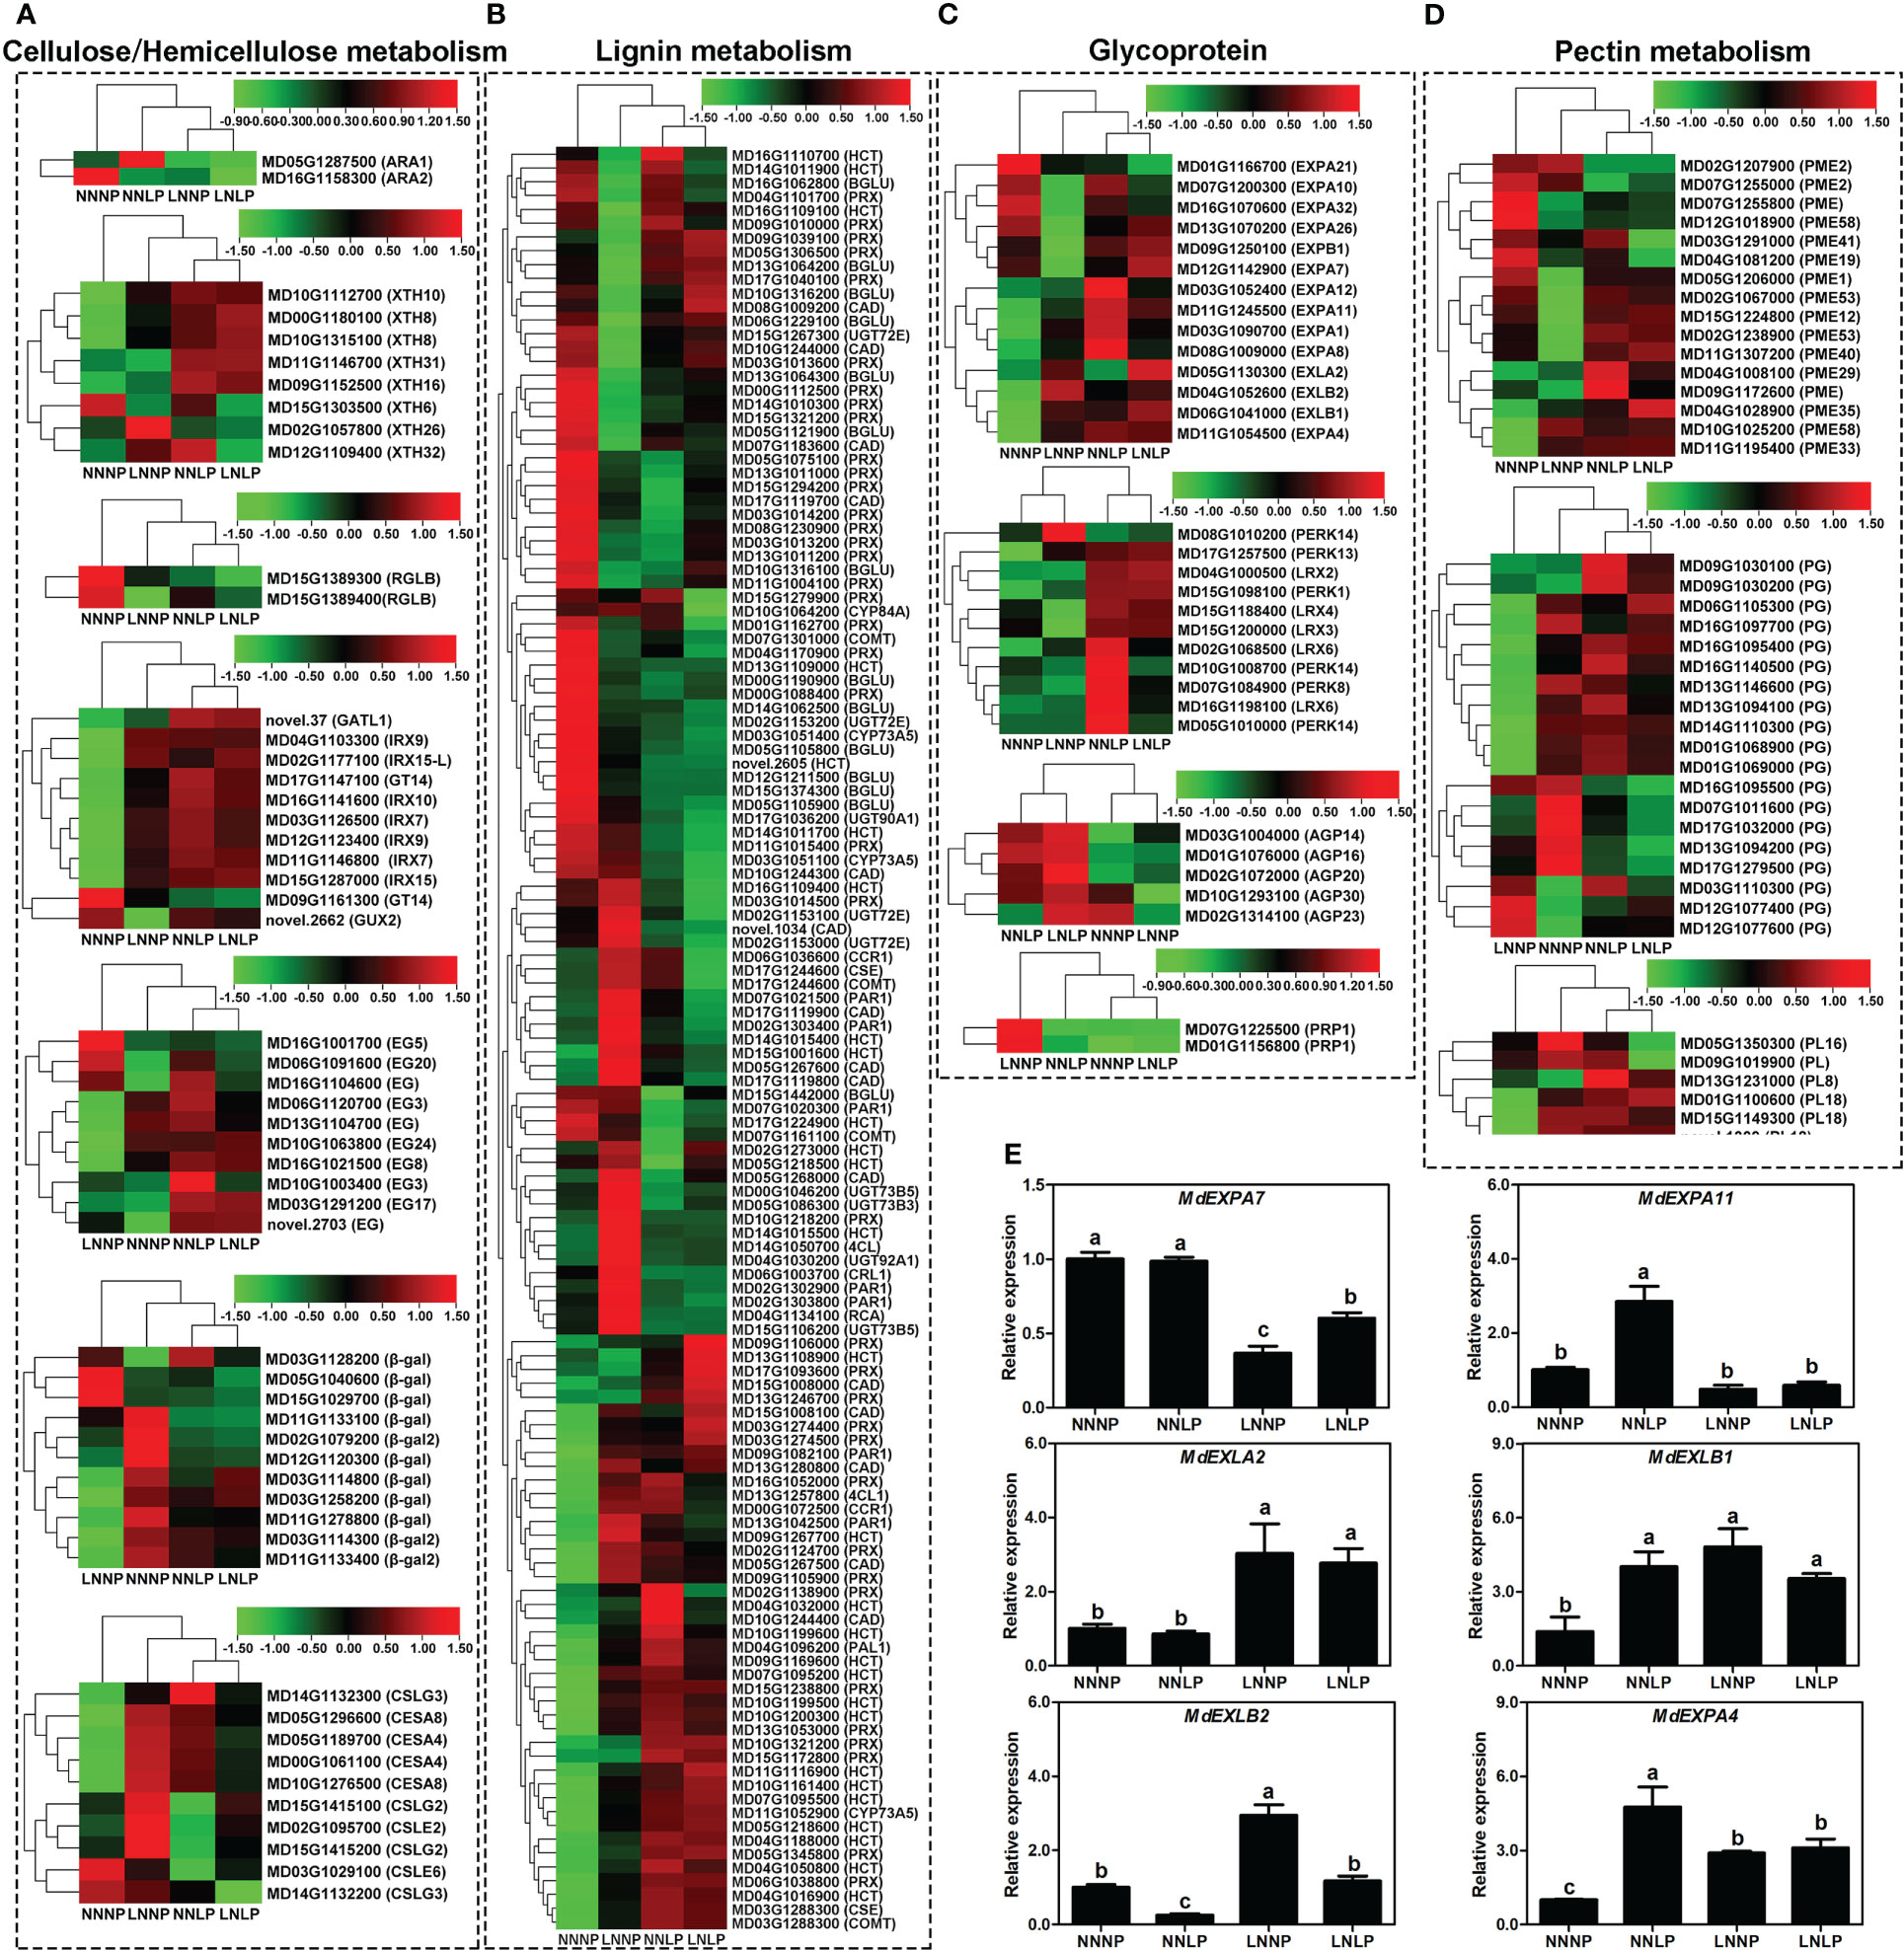
Figure 8 Transcript profiles of DEGs for cell wall metabolism. Heat map diagram of the log2 (FPKM) values for genes annotated as hemicellulose metabolism (A), lignin metabolism (B), glycoprotein (C), pectin metabolism (D), and cellulose synthase (E) genes. (F) Expression of expansin genes under different N and P supply conditions, as examined by qPCR. The transcript levels of the genes are indicated relative to the level of MdActin expression under NNNP (set at 1) in the same samples. Each column represents the mean ± SE of three replicates. AGP, arabinogalactan protein; BGLU, beta-glucosidase; CESA, cellulose synthase; COMT, caffeic acid 3-O-methyltransferase/acetylserotonin O-methyltransferase; CYP84A, ferulate-5-hydroxylase; EXPA, expansin A; EXPB, expansin B; EXLA, expansin-like A; EXLB, expansin-like B; GT, glycosyltransferase; GATL, galacturonosyltransferase-like; GUX, UDP-glucuronate xylan alpha-glucuronosyltransferase; HCT, shikimate O-hydroxycinnamoyltransferase; IRX, irregular xylem; LRX, leucine-rich repeat/ extension; PEX, leucine rich extensin protein; PERK, proline-rich extension-like receptor kinase; PRP, prolinerich protein; RGLB, rhamnogalacturonan endolyase; XTH, xyloglucan endotransglucosylase/hydrolase.
Overall, 25 (20 up-regulated and five down-regulated), 27 (13 up-regulated and 14 down-regulated), and 18 (12 up-regulated and six down-regulated) genes involved in cellulose and hemicellulose metabolism were identified in the comparisons of NNNP vs. NNLP, NNNP vs. LNNP, and NNNP vs. LNLP, respectively. Five, two, and four genes encoding xyloglucan endotransglucosylase/hydrolase (XTH) were up-regulated in comparisons of NNNP vs NNLP, NNNP vs LNNP, and NNNP vs LNLP, respectively. The expression of genes encoding type II glycosyltransferases, such as MD03G1126500 (IRX7), MD11G1146800 (IRX7) MD04G1103300 (IRX9), MD15G1287000 (IRX15), MD12G1123400 (IRX9), MD15G1287000 (IRX15), and MD02G1177100 (IRX15-L), showed an increasing trend in three comparisons, while novel.2662 (GUX2) was down-regulated in the comparison of NNNP vs LNNP. Seven of ten DEGs encoding type III polysaccharide synthases, including MD00G1061100 (CESA4), MD05G1189700 (CESA4), MD05G1296600 (CESA8), MD10G1276500 (CESA8), MD02G1095700 (CSLE2), MD15G1415100 (CSLG2), and MD15G1415200 (CSLG2), were up-regulated in the comparison of NNNP vs LNNP (Figure 8A).
A total of 58 (27 up-regulated and 31 down-regulated), 66 (29 up-regulated and 37 down-regulated), and 63 DEGs (28 up-regulated and 35 down-regulated) involved in lignin metabolism were screened in the comparisons of NNNP vs NNLP, NNNP vs LNNP, and NNNP vs LNLP, 13 DEGs, including MD03G1051400 (CYP73A5), MD17G1224900 (HCT), MD12G1211500 (BGLU), MD15G1374300 (BGLU), MD07G1161100 (COMT), MD07G1301000 (COMT), MD03G1288300 (COMT), MD17G1119700 (CAD), MD00G1088400 (PRX), MD02G1124700 (PRX), MD02G1138900 (PRX), MD03G1014200 (PRX), and MD13G1011000 (PRX), were down-regulated in all three comparisons, and nine DEGs, MD04G1016900 (HCT), MD07G1095200 (HCT), MD09G1169600 (HCT), MD09G1267700 (HCT), MD10G1161400 (HCT), MD10G1199500 (HCT), MD06G1038800 (PRX), MD13G1053000 (PRX), and MD15G1238800 (PRX), were up-regulated in all three comparisons (Figure 8B).
Six, two, and five expansin family genes were up-regulated in the comparisons of NNNP vs NNLP, NNNP vs LNNP, and NNNP vs LNLP, respectively. All DEGs in the comparison of NNNP vs NNLP were up-regulated; MD11G1054500 (EXPA4) and MD06G1041000 (EXLB1) were shared in three comparisons. The qRT-PCR results were generally consistent with the RNA-seq data (Figure 8E). A total of 18 extensin genes were differentially expressed, of which MD17G1257500 (PERK13) was up-regulated in the three comparisons. Three genes encoding arabinogalactan protein, MD03G1004000 (AGP14), MD01G1076000 (AGP16), and MD02G1072000 (AGP20), were up-regulated under NNLP and LNLP, but not differentially expressed under LNNP, while two genes, MD10G1293100 (AGP30) and MD02G1314100 (AGP23), were down-regulated under LNNP. Two genes encoding proline-rich proteins, MD07G1225500 (PRP1) and MD01G1156800 (PRP1), were down-regulated under LNNP (Figure 8C).
Three, seven, and three genes encoding pectinesterase (PME) were down-regulated in the comparisons of NNNP vs. NNLP, NNNP vs. LNNP, and NNNP vs. LNLP, respectively, of which MD12G1018900 (PME58) was the common DEG. Three, one, and two genes were up-regulated in the comparisons of NNNP vs NNLP, NNNP vs LNNP, and NNNP vs LNLP, respectively. A total of seven (four up-regulated and three down-regulated), 15 (three up-regulated and 12 down-regulated), and six (two up-regulated and four down-regulated) encoding polygalacturonase (PG) were identified in the three comparisons NNNP vs. NNLP, NNNP vs. LNNP, and NNNP vs. LNLP, of which MD12G1077600 (PG) was up-regulated and MD17G1279500 (PG) was down-regulated in the three comparisons. Compared with NNNP, the expression profile of a gene encoding pectate lyase (PL), MD13G1231000 (PL8), was up-regulated under NNLP, while three PL genes, MD01G1100600 (PL18), MD15G1149300 (PL18), novel.1309 (PL18), were down-regulated under LNNP, and the remaining two genes, MD05G1350300 (PL16) and MD09G1019900 (PL), were down-regulated under LNLP (Figure 8D).
Although MdEXPA4 transcription was not induced under NNNP treatment (Figure 8E), this gene was expressed under the other three treatments. To clarify the role of MdEXPA4 in the response to N and/or P deficiency, the phenotypes of wild-type (WT) and MdEXPA4-overexpressing A. thaliana subjected to NNNP, NNLP, LNNP, and LNLP conditions were analyzed. The results showed that MdEXPA4-overexpressing lines exhibited longer root length and more root forks than the WT when treated with NNNP (Figures S8E, F). Under NNLP conditions, the root lengths of transgenic lines #1 and #2 were 1.70-fold and 1.72-fold higher than that of the WT, respectively (Figure S8E). LNNP treatment led to 1.63-fold, 1.75-fold and 9.73-fold, 12.47-fold increases in the number of root forks and tips in transgenic lines #1 and #2, respectively, compared to the WT (Figures S8F, G). The LNLP condition caused the root lengths of transgenic lines #1 and #2 to increase by 1.34-fold and 1.54-fold compared to the WT, respectively, while the numbers of root tips also increased significantly (Figures S8E, G).
Another gene, MdEXLB1, was hypothesized to be an important candidate for involvement in the response to N and/or P deficiency (Figure 8E, Figure S10). To evaluate the function of MdEXLB1, WT and MdEXLB1-overexpressing S. lycopersicum plants were cultivated hydroponically under different P and/or N supply conditions. The results showed that under the NNNP treatment, the fresh weights of transgenic lines #5, #8, and #11 were 1.78-fold, 1.79-fold, and 2.07-fold higher than that of WT, and the root fresh weights of these transgenic plants were 3.50-fold, 3.83-fold, and 4.19-fold higher than that of the WT, respectively. Under NNLP, LNNP, and LNLP conditions, the fresh weights of the transgenic plants were significantly higher than that of the WT; in particular, the roots exhibited a significant increase in fresh weight compared with those of the WT (Figure 9). The total length, surface area, and volume of roots in MdEXLB1-overexpressing lines were significantly higher than those of the WT under NNNP. Under NNLP, LNNP, and LNLP, the root surface areas of the transgenic plants were significantly higher than that of the WT (Figure S9). Moreover, NNNP treatment led to 1.26-fold, 1.53-fold, and 1.76-fold and 1.41-fold, 1.39-fold, and 1.28-fold increases in the total P and total N accumulation in transgenic lines #5, #8, and #11, respectively. Under the NNLP, LNNP, and LNLP treatments, the values for total P and total N accumulation were significantly higher than those in the WT (Figure S9).
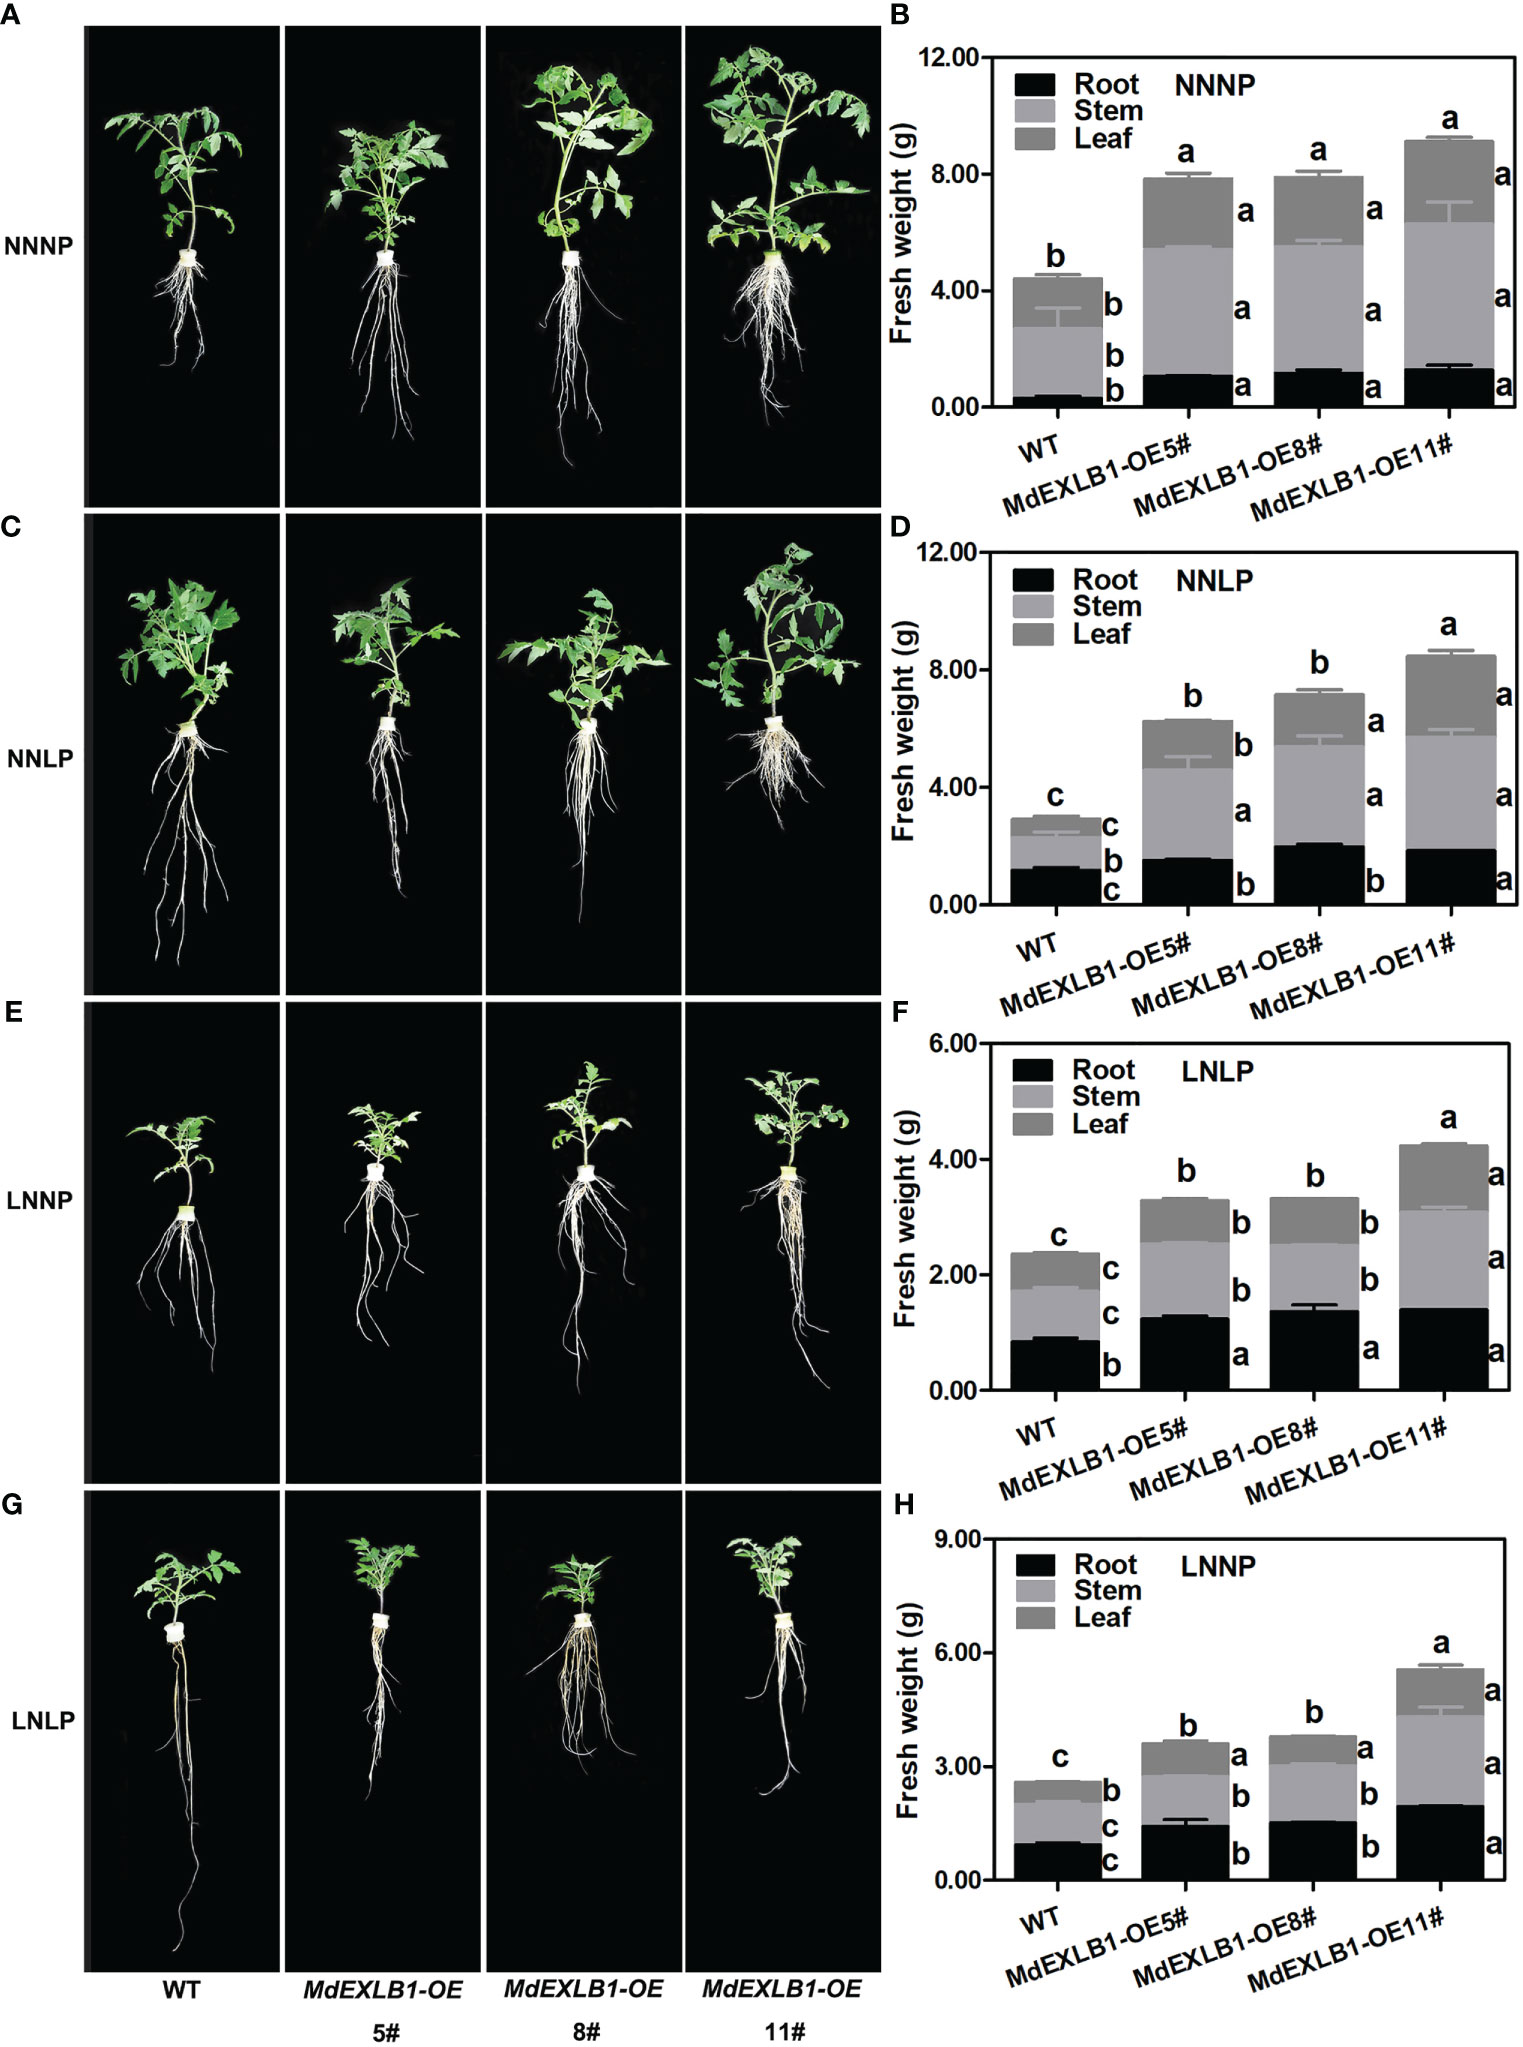
Figure 9 .MdEXLB1 positively regulated N-deficiency and Pi-deficiency tolerance in tomato (Solanum lycopersicum). (A, C, E, G), Phenotypes of MdEXLB1 overexpressing lines subjected to NNNP, NNLP, LNNP, and LNLP conditions hydroponically for 30 days. (B, D, F, H), the fresh weight of plants under different conditions. Data in (B, D, F, H) were shown as means ± SE (n = 3), and different lowercase letters above the bars indicate significant differences among different treatments (p<0.05).
In field conditions, the availability of Pi and is one of the most important limiting factors for apple development (Sun et al., 2021a; Sun et al., 2021b; Chai et al., 2022). The availability of these nutrients impacts the phenome, ionome, transcriptome, and metabolome composition of the plants (Gan et al., 2016; Sun et al., 2020b; Lv et al., 2021; Mu and Chen, 2021; Nezamivand-Chegini et al., 2022; Wen et al., 2022). The paramount relevance of the rootstock is its key role at the interface between the apple plants and soil for nutrient mining (Chauhan et al., 2020). In the present study, we observed that the aboveground growth and development of apple was inhibited by N and/or P deficiency (Figure 1), and the partitioning of carbohydrate and mineral nutrient resources to root biomass tended to increase (Figure 3A), thus leading to an increase in the root-to-shoot ratio of the hydroponically-grown dwarfing rootstock ‘M9-T337’ (Figure 1D), which was consistent with previous results (Sun et al., 2021a; Sun et al., 2021b). Generally, root development was enhanced by N and/or P deficiency, although P deficiency promoted root elongation, while N deficiency did not, and similarities existed between the root morphology under N+P deficit condition and that under P deficit and N deficit conditions, respectively, but the effect of N+P deficiency on root morphogenesis was not the accumulation of effects of P deficiency and N deficiency, and compared with P deficiency, root development was weakened under N+P deficiency (Figures 1, 2). These results suggested that the ‘M9-T337’ rootstock is highly plastic and responsive to the changing soil environment (Ma et al., 2020; Tahir et al., 2021a; Tahir et al., 2021b; Zhang et al., 2021b).
Previous studies have shown that N deficiency increased H+-ATPase activity and H+ efflux, therefore affecting lateral root (LR) development and uptake (Mlodzinska et al., 2015; Jiang et al., 2017; Lv et al., 2021). In a study of O. sativa, Wang et al. (2021b) found that H+ efflux was important for root elongation and P uptake under P deficient conditions. Moreover, Xu et al. (2020) confirmed the important role of the H+ pump in white lupin adaptation to P deficiency. To measure the concentration gradient of and H+, while preserving the integrity of the sample, NMT was used in this study (Huang et al., 2017; Lv et al., 2021). The ionome data indicated that, although the reduced net influx rate resulted in decreased total 15N accumulation in plants, N deficiency and N+P deficiency improved the 15NUE compared to a sufficient N+P supply (Figure 3). We monitored obvious H+ efflux in the roots under N-deficient and N+P-deficient conditions (Figure 3H), which resulted in a decrease in the pH of the nutrient solution (Figure S7). These results confirmed that H+ pumps stimulated by N deficiency play a crucial role in absorption of apple rootstock. The H+ efflux monitored under P deficiency implied that the H+ pumps were key players in the response to P deficiency.
N transporters (NRT) and P transporters (PHT) play important roles in plant uptake and transport of N and P, respectively (Zhang et al., 2021c; Chai et al., 2022). NRTs in higher plants include low affinity transporters encoded by some members of the NRT1/PTR (also named as NPF) family and high affinity transporters encoded by the NRT2 gene family (Tahir et al., 2021c; Misawa et al., 2022), as well as NRT1.1, a dual-affinity transporter (Ye et al., 2019). Four NTR2 transporters (NRT2.1, NRT2.2, NRT2.4, and NRT2.5) and two NRT1 transporters (NPF6.3 and NPF4.6) have root uptake activities (Lezhneva et al., 2014). In this study, 20 NRTs (NRT2.5, NRT2.7, and 18 NRT1s) were up-regulated under N deficiency, and 10 of them were also induced by N+P deficiency (Figure S5), and therefore may be high affinity transporters. Lezhneva et al. (2014) reported that NRT2.5 plays an essential role in response to severe N deficiency. NRT2.7 is a seed-specific high-affinity nitrate transporter controlling content in A. thaliana (David et al., 2014; Zheng et al., 2016). In this study, it was found that NRT2.5 and NRT2.7 may be involved in uptake of ‘M9-T337’ root under N deficiency and P deficiency, respectively (Figure S5). AtNRT1.5 drives root-to-shoot transport of and is also an indole-3-butyric acid transporter, involved in LR development (Watanabe et al., 2020; Chen et al., 2021). Gho and Jung (2019) found that AtNRT1.5 was induced by Pi deficiency in A. thaliana; they demonstrated that atnrt1.5 mutants displayed conspicuously longer PRs along with significantly reduced LR density under P deficient conditions. Therefore, NRT1.5 may also be involved in apple root architecture modification under N and/or P deficient conditions. Chai et al. (2022) found overexpression of MdNRT2.4 enhanced net H+ extrusion from the root surface and absorption. In this study, three MdNRT2.4 genes were only significantly upregulated under N+P deficient condition; thus, they may have important roles in N absorption under combined nutritional deficiencies. Additionally, 19 NRT1s were down-regulated in the root of ‘M9-T337’ under N deficiency, and 11 of them were also down-regulated under N+P-deficient conditions (Figure S5), implying they may be low affinity transporters, which do not act at low concentrations (Sinha et al., 2020). Similarly, Hu et al. (2011) found that plants repress N assimilation and save more energy for Pi acquisition under P deficiency (Figure S5), which is in agreement with our results. The low affinity transporters were down-regulated in response to P deficiency (Nezamivand-Chegini et al., 2022).
Seven PHT1s were upregulated in response to P deficiency and N+P deficiency (Figure S5). The PHT1 subfamily contains high affinity Pi transporters, which function under low P concentrations in soil (Gho and Jung, 2019). Moreover, SPX1, SPX3, and SPX5 were up-regulated under P deficiency and N+P deficiency (Figure S5). Studies have shown that most SPX subfamily members are induced by Pi deficiency in plants (Stefanovic et al., 2007; Zhang et al., 2016; Du et al., 2017; Wang et al., 2021a), and their major role is to interact with PHR1, thereby regulating the transcription of downstream PSIs (Lv et al., 2014; Dong et al., 2019). Furthermore, PHO1 was down-regulated under three treatments. According to previous studies, its homologs AtPHO1, AtPHO1;H1, and OsPHO1;2 are involved in regulating internal Pi homeostasis by transporting Pi from the root xylem to shoots (Secco and Poirier, 2010; Stefanovic et al., 2011), implying the translocation of Pi from the roots to shoot is inhibited by N and/or P deficiency. The PHTs exhibited a lower transcript level under N+P deficiency, and five PHTs (two PHT1 and three PHT4 genes) were down-regulated under N deficiency. The expression of SPXs was affected by N availability, it was speculated that deficiency may posted a negative effect on P absorption in apple dwarfing rootstock (Hu et al., 2019; Medici et al., 2019; Zhang et al., 2021e).
The number of DAMs specifically responding to N deficiency and P deficiency was fewer than the number responding to N+P deficiency (Figure 4). The number of DEGs responding specifically to P deficiency and N+P deficiency was almost same, but fewer than the number that responded to N deficiency (Figure 5). Thus, greater disturbance to metabolites occurred in response to combined nutritional deficiencies than a single nutrient deficiency, and the molecular mechanisms in response to combined nutritional deficiencies were rather complex. Several pathways involved in cell wall reprogramming were conspicuously enriched. However, ‘M9-T337’ adapts it root development differently under N and/or P deficiency, due to the variation of metabolites related to cell wall synthesis was different (Figure S2). The plant cell wall is a dynamic network composed of cellulose, hemicellulose, pectin, lignin, and multiple types of structural proteins (Lampugnani et al., 2018). Under N deficiency, the plants altered their cell wall organization and adapted their root architecture by elongating the LRs to maximize N acquisition (Sun et al., 2017a). Kumar et al. (2021) revealed that cell wall reorganization, and associated activity-related gene up-regulation, is a strategy for tolerating P deficiency in O. sativa. Cell wall synthesis, composition, and reprogramming contribute to the meticulous modulation of root architecture and plant adaptations to biotic and abiotic stress (Ogden et al., 2018).
Cellulose is a load-bearing polymer present in the plant cell wall (Zhang et al., 2021a). Cellulose synthase complexes (CESAs) are involved in the formation of both primary and secondary cell walls (Endler and Persson, 2011). The roles of different subunits of CESAs vary, with CESA4, CESA7, and CESA8 involved in secondary cell wall formation in A. thaliana (Endler and Persson, 2011). In this study, CESA4 and CESA8, which are highly homologous to AtCESA4 and AtCESA8, were highly induced by N deficiency (Figure 8). Therefore, N deficiency could increase cellulose formation in the root of ‘M9-T337’. A similar result was also reported by Nezamivand-Chegini et al. (2022). However, under P deficiency and N+P deficiency, no distinct cellulose synthesis was discerned. Hemicellulosic polysaccharides, including xylans, xyloglucans, mannans, glucomannans, and β-(1,3;1,4)-glucan, all harbor β-(1,4)-glycosyl-linked backbones with similar equatorial configurations (Zhang et al., 2021a). Xylans are the most abundant hemicellulosic polymers in vascular plants (Smith et al., 2017). IRX10 and its homolog IRX10L (members of the GT47 family), as well as IRX9, IRX9L, IRX14, and IRX14L (members of the GT43 family), are key components required for xylan backbone synthesis (Wu et al., 2010; Chen et al., 2013). IRX9, IRX10, and IRX14 are mainly involved in the extension of the backbone, while GUX1 and GUX2 are able to synthesize almost all side chains (Zhang et al., 2021a). In addition, IRX7 (a member of the GT47 family), IRX15, and its homolog IRX15L (members of the GT8 family), are also involved in xylan synthesis (Lee et al., 2009; Brown et al., 2011; Jensen et al., 2011). The transcriptome data showed that under all N deficiency, P deficiency, and N+P deficiency treatments, IRX7, IRX9, IRX10, IRX15, and its homolog IRX15L, were up-regulated, while the expression of GUX2 showed a decreasing trend under LNNP. These results suggested that xylan backbone synthesis in root of ‘M9-T337’ was enhanced by N and/or P deficiency, but side chain synthesis was inhibited by N deficiency. Xyloglucan is the most abundant primary-wall hemicellulose in all spermatophytes except grasses (Zhang et al., 2021a). XTHs are involved in the rearrangement of xyloglucans by cutting and rejoining them, causing reversible or irreversible loosening of cell walls to permit cell expansion (Nezamivand-Chegini et al., 2022). Zhang et al. (2022) reported that GmXTH38 is induced by P deficiency in both roots and leaves of soybean (Glycine max), and overexpression of GmXTH38 increases the sensitivity of LR formation under P deficiency. In this study, the transcription levels of XTHs in roots of ‘M9-T337’ were not only induced by P deficiency and N+P deficiency, but also by N deficiency (Figures 7A, 8A). These results showed that N and/or P deficiency had a role in the formation of xyloglucans in primary-wall hemicellulose of root cells, thereby mediating LR formation (Bourquin et al., 2002).
Pectins are a group of cell wall polysaccharides that possess α‐(1,4)‐linked galacturonic acids in their backbone. They play important roles in cell wall remodeling. Pectin deesterification stiffens the cell wall and prevents cell wall loosening (Hocq et al., 2017). Previous studies have shown that the enzymes involved in pectin synthesis are co-regulated together with carriers (Landi and Esposito, 2017). In addition, pectin has been demonstrated to contribute greatly to P remobilization from the cell wall. Elevated PME activity can facilitate the remobilization of P deposited in the cell wall (Zhu et al., 2016). Wu et al. (2022) found that OsPME14 overexpression increased PME activity, released more P from the root cell wall, and improved plant resistance to P deficiency. Zhu et al. (2018) reported that in O. sativa, deficiency caused higher levels of nitric oxide to accumulate in the roots and increased the activity of nitrate reductase. The nitric oxide stimulated cell wall pectin synthesis and demethylation of pectin, therefore increasing cell wall P release by increasing PME activity under P deficiency. Unlike O. sativa, N and/or P deficiency were unfavourable to the biosynthesis of cell wall pectin in the root of ‘M9-T337’ (Figures 7A, 8A), the effect of N deficiency was more significant since more PMEs, PGs, and PLs were significantly down-regulated under N deficiency (Figure 8A), suggesting that the response mechanism is unique among different species. Nevertheless, the expression of several PME genes showed an increasing trend under N and/or P deficiency (Figure 7A), thus the release of cell wall P may be increased.
Lignin is an unordered polymer composed of phenylalanine-derived aromatic monomer substances (Vanholme et al., 2019), and it is the primary structural component of thickened secondary cell walls in vascular plants (Bonawitz and Chapple, 2010). Lignin is composed of p-hydroxyphenyl units without methoxyl group (synthesized by the polymerization of p-coumaryl), guaiacyl units with one methoxyl group (synthesized by the polymerization of coniferyl), and syringyl units with two methoxyl groups (synthesized by sinapyl alcohol) (Xie et al., 2018; Gou et al., 2019). Qin et al. (2019) reported that N deficiency reduces the activity of most peroxidases, inhibits lignin biosynthesis, and lowers root solidity. Similar results were found in present study. Most PRX genes which encoded peroxidase and were involved in syringyl lignin biosynthesis were down-regulated under N deficiency and the content of coniferaldehyde and coniferyl alcohol tended to decrease (Figures 8B, 7D), therefore, N deficiency inhibited synthesis of guaiacyl units and syringyl units in the roots of apple dwarfing rootstock. However, P deficiency and N+P deficiency had no obvious inhibitory effect on guaiacyl synthesis. Additionally, in contrast to N deficiency, P deficiency and N+P deficiency posted a positive effect on the formation of syringyl units during lignin synthesis. Study has shown that overexpression of Gh4CL7 promoted lignin biosynthesis in A. thaliana, increased lignin content in plants, and promoted root elongation, thus improved drought tolerance of plants (Sun et al., 2020a). Therefore, the up-regulated 4CL genes and up-regulated syringyl units may be one of the important reasons that P deficiency and N+P deficiency promoted root elongation of ‘M9-T337’.
In summary, N and/or P deficiency enhanced the formation of hemicellulose xyloglucans, the extension of xylan backbone, and the loosening of cell wall. N deficiency increased cellulose formation, but inhibited the biosynthesis of hemicellulose xylan side chains, pectin and lignin. P deficiency and N+P deficiency posted a positive effect on the formation of syringyl units during lignin synthesis. These changes lead to different root morphogenesis under N and/or P deficient conditions.
Expansins are often regulated by nutrient stress to subsequently affect plant growth and nutrient uptake (Lee and Kim, 2013; Marowa et al., 2016; Kong et al., 2019). Liu et al. (2019) found that HvEXPA1 participates in root cell elongation and influences Al content by regulating root cell wall loosening when exposed to Al stress. Wu et al. (2022) screened 40 differentially expressed expansin genes in roots of oilseed rape (Brassica napus) in response to boron deficiency. Similar results were also reported by Nezamivand-Chegini et al. (2022). Through analyzing the similarities in the transcriptional responses in the roots under N and/or P deficit conditions, we observed up-regulation of six, two, and five expansin genes under N deficiency, P deficiency, and N+P deficiency, respectively. The content of L-tryptophan showed an increasing trend under N deficiency (Figure 7C). This amino acid is not only a precursor to auxin synthesis, but is also involved in expansin protein synthesis (Dai et al., 2013; Marowa et al., 2016). Lee and Kim (2013) reported that overexpression of EXPA17 in A. thaliana increased the density LRs treated with auxin. Under N deficiency, the recruitment of Thr101 phosphorylated NRT1.1 into the plasma membrane facilitates auxin transport, therefore root abundance increases under the action of expansins (Figures 1, 2) (Bouguyon et al., 2015; Zhang et al., 2019). Ding et al. (2021) found that P deficiency induced the expression of multiple expansin genes in roots, related to increased IAA content caused by P deficiency, thereby promoting root lengthening, which agrees with our results. In soybean, the protein product of GmPTF1, the expression of which is induced by Pi deficiency, directly binds to the E-box motif in the promoter region of the cell wall relaxation gene GmEXPB2, influencing LR formation and elongation, thereby improving P uptake efficiency (Yang et al., 2021).
Expansins break the noncovalent bonds between cellulose microfibrils and associated matrix polysaccharides and induce extension of the cell wall (Lee and Kim, 2013; Marowa et al., 2016). A drop in pH may be one of the reasons for increasing wall extension and the activity of the wall-modifying agent expansin (Figure S7) (Arsuffi and Braybrook, 2018). Phylogenetic analysis showed that different expansins from various species falling within the same clade have similar effects on plant growth and development (Marowa et al., 2016). It has been reported that overexpressing RhEXPA4 increased the abundance of LRs in transgenic A. thaliana plants (Lü et al., 2013). In this study, we observed similar phenotypes; overexpression of MdEXPA4, which is highly homologous to RhEXPA4, promoted A. thaliana LR formation and development under N+P sufficiency (Figure S5A). Moreover, compared to the WT, the tolerance to P deficiency and N+P deficiency was enhanced in transgenic A. thaliana plants. Furthermore, under N deficiency, the enhanced root system resulted in a clear benefit to the aboveground growth of the transgenic plants. Boron et al. (2015) found that overexpression of AtEXLA promoted root elongation. Moreover, a recent study showed that GmEXLB1 expression was induced in soybean under P deficiency, and overexpression of this gene improved P acquisition by regulating root elongation and architecture in A. thaliana (Kong et al., 2019), which provided a possible direction for research on the function of this gene in apple. In this study, we confirmed that overexpression of MdEXLB1, which is highly homologous to GmEXLB1 and AtEXLA2, altered the root architecture of transgenic S. lycopersicum by increasing the number and length of LRs, thereby enhancing P acquisition. Additionally, we found that MdEXLB1 was induced by N deficiency. Overexpression of MdEXLB1 also enhanced N acquisition and biomass accumulation, and thus promoted the tolerance of transgenic S. lycopersicum to N deficiency (Figures 9, 10). Further understanding of the molecular mechanisms of expansin-based responses to N and/or P deficiency may lead to insights for improving nutrient utilization efficiency in apple rootstock.
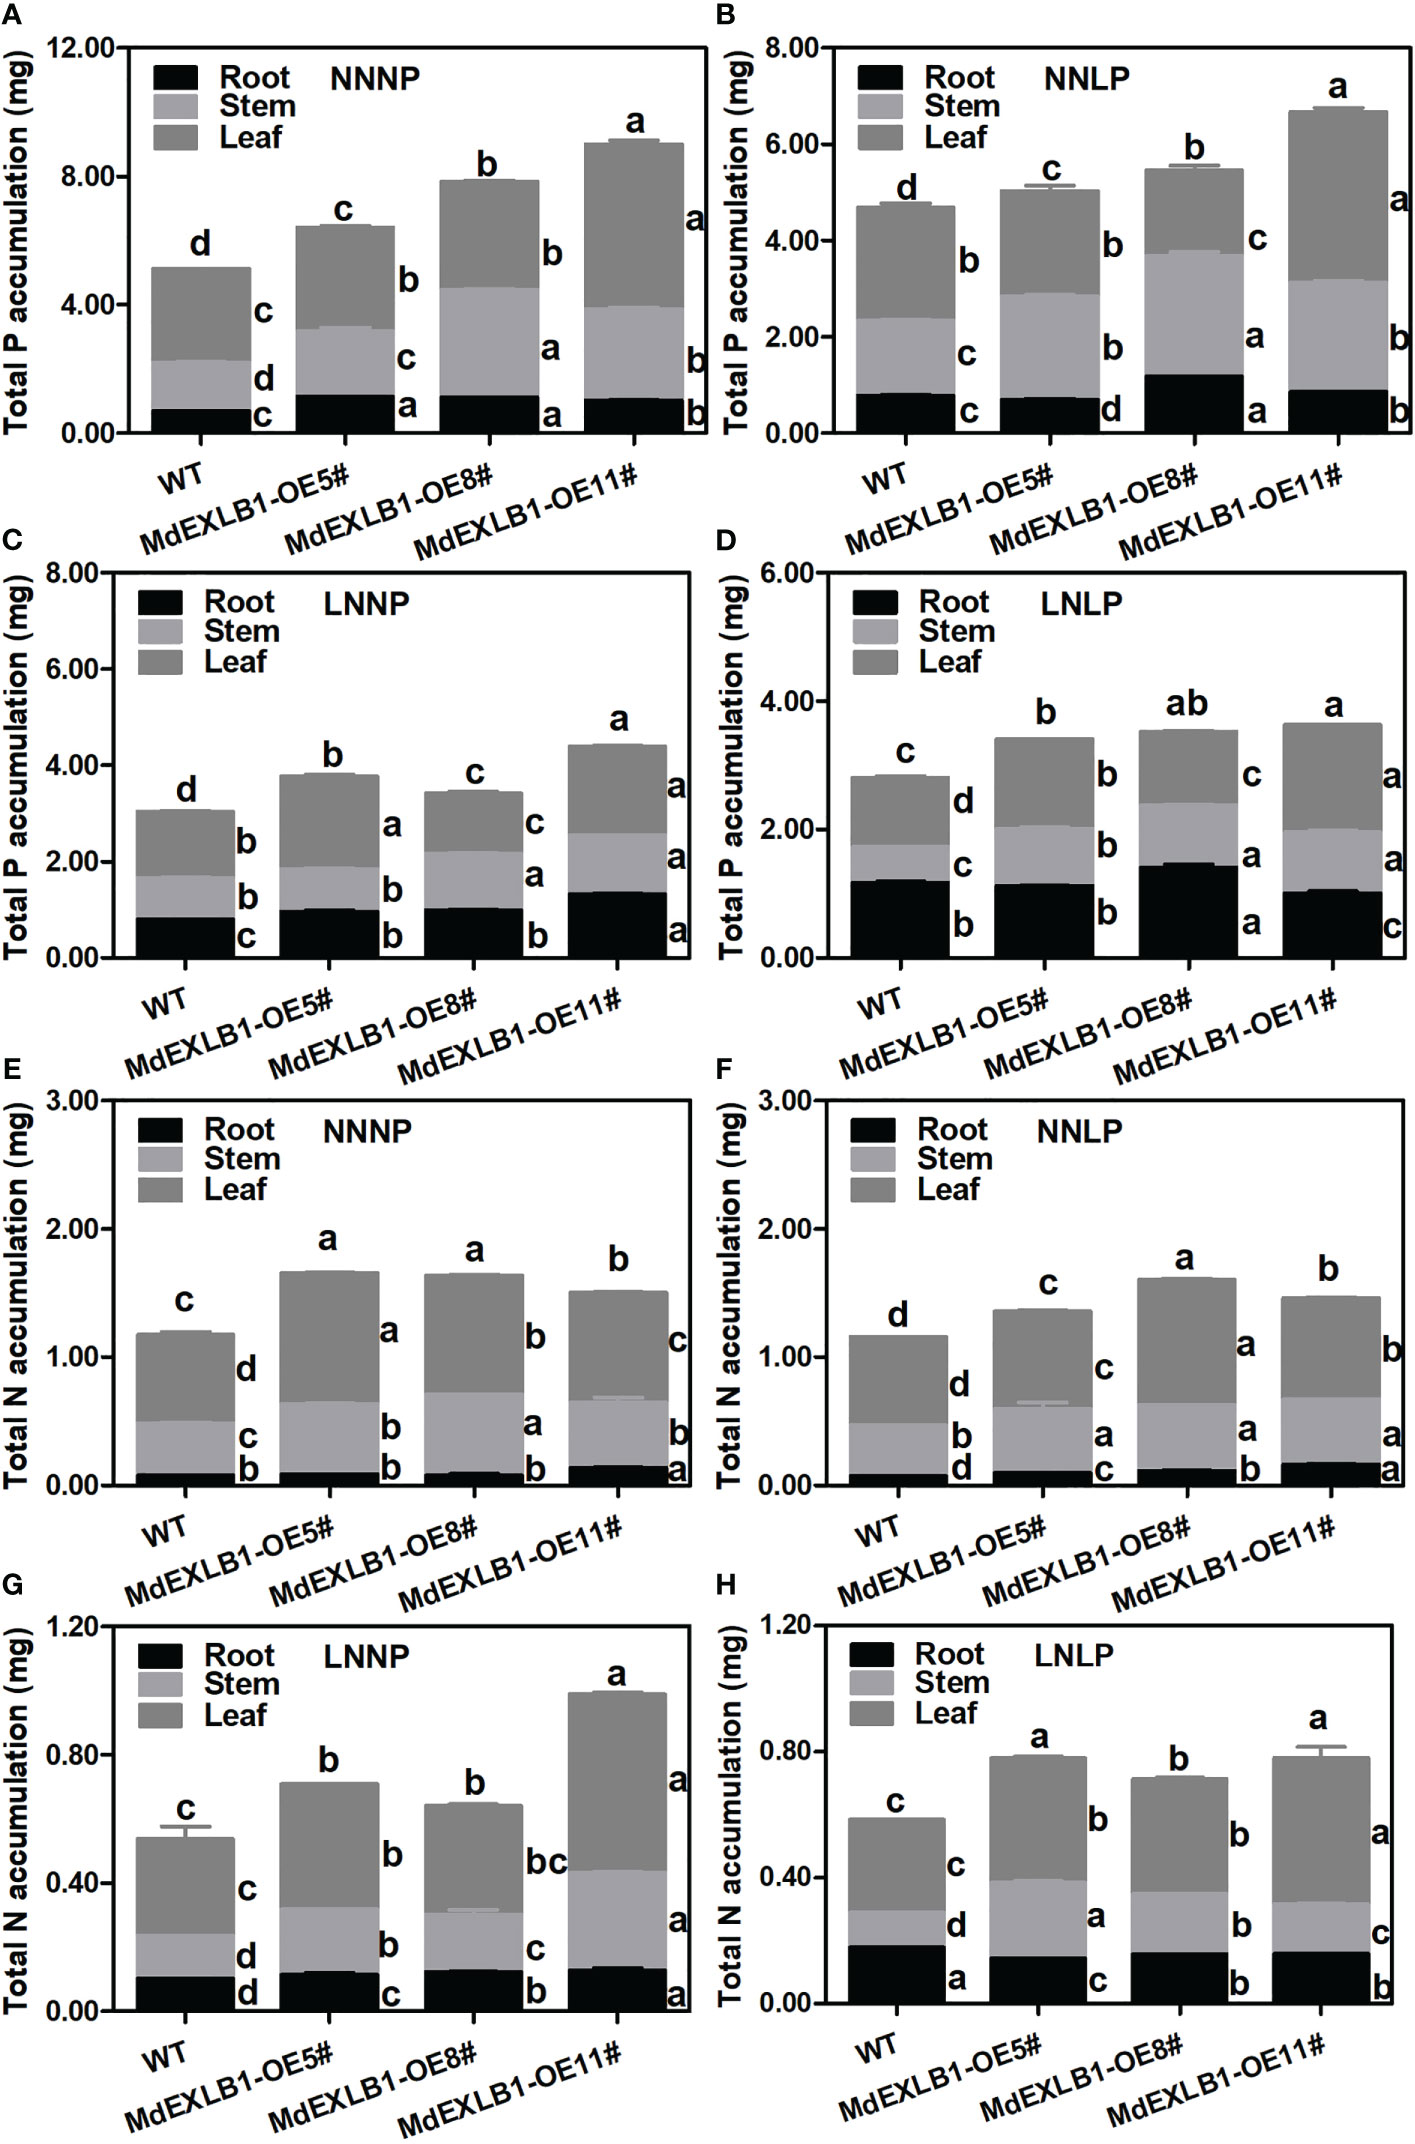
Figure 10 Total N (A–D) and total P (E–H) accumulation of WT and MdEXLB1 overexpressing lines under different N and P supply conditions. Data were shown as means ± SE (n = 3), and different lowercase letters above the bars indicate significant differences among different treatments (p < 0.05).
Our research provided detailed information on the morphological, ionic, transcriptional, and metabolic responses of apple dwarfing rootstock to different N and P supply conditions. Strategies for adaptation to N and/or P deficiency in ‘M9-T337’ included inhibiting aboveground growth, enhancing root development, improving the root-to-shoot ratio, and inducing the expression of high affinity NO3- transporter and Pi transporter genes. Further analysis indicated that alterations to root architecture under N and/or P deficiency were associated with several factors, including: (a) increased partitioning of total N and total P in root; (b) increased H+ efflux rate and (c) altered root cell wall components and structrual proteins. Expansin genes MdEXPA4 and MdEXLB1 acted as important structural genes involved in root morphogenesis of apple dwarfing rootstock. These findings may help researchers to improve root architecture and nutrient use efficiency in apple rootstock under N and/or P deficiency conditions.
The original contributions presented in the study are publicly available. This data can be found here: NCBI BioProject PRJNA936594, accession numbers SRR23527441, SRR23527440, SRR23527439, SRR23527438, SRR23527437, SRR23527436, SRR23527447, SRR23527446, SRR23527445, SRR23527444, SRR23527443, SRR23527442.
BX: Conceptualization, methodology, validation, writing—original draft preparation, data curation. YC: Conceptualization, methodology, data curation, resources, writing—review and editing, funding acquisition. YZ, AY and XL: Formal analysis. XA and CC: Supervision, project administration, funding acquisition. GK and JZ: Methodology, writing—review and editing. All authors contributed to the article and approved the submitted version.
This research was funded by the National Natural Science Foundation of China (32202413), Agricultural Science and Technology Innovation Program (No. CAAS-ASTIP-2016-RIP-02), earmarked fund for China Agriculture Research System (No. CARS-27), and Natural Science Foundation of Hebei Province (C2021204134).
The authors declare that the research was conducted in the absence of any commercial or financial relationships that could be construed as a potential conflict of interest.
All claims expressed in this article are solely those of the authors and do not necessarily represent those of their affiliated organizations, or those of the publisher, the editors and the reviewers. Any product that may be evaluated in this article, or claim that may be made by its manufacturer, is not guaranteed or endorsed by the publisher.
The Supplementary Material for this article can be found online at: https://www.frontiersin.org/articles/10.3389/fpls.2023.1120777/full#supplementary-material
Supplementary Figure 1 | Heatmap of metabolites content in the roots of ‘M9-T337’ seedlings after growth on NNNP, NNLP, LNNP, and LNLP nutrient solutions for 30 d. Group represented samples, class represented Class 1 substances classification, the different colors were the values obtained after normalisation of the relative content (red for high content, green for low content).
Supplementary Figure 2 | Histogram of KEGG classification of differential metabolites. The vertical coordinate was the name of the KEGG metabolic pathway and the horizontal coordinate was the number of metabolites annotated to that pathway and their number as a proportion of the total number of metabolites annotated on the corresponding KEGG pathway.
Supplementary Figure 3 | Venn diagrams showing the overlap among DAMs and DEGs in each of the different conditions of N and P supply screened based on conjoint analysis.
Supplementary Figure 4 | Bubble diagram showing the divergence of the KEGG pathways contained DAMs and DEGs in response to N and/or P deficiency screened based on conjoint analysis. The horizontal coordinate represents the enrichment factor (Diff/Background) of the pathway in different histologies, and the vertical coordinate represents the name of the KEGG pathway; the red-yellow-green gradient represents the change in the significance of the enrichment from high to medium to low, and is indicated by -log10(P value); and the size of the bubble represents the number of DAMs or DEGs, the larger the number, the larger the point.
Supplementary Figure 5 | Heatmap of DEGs involved in uptake and transport of N (A) and P (B) under different N and P supply conditions.
Supplementary Figure 6 | Phylogenetic relationship of expansin genes involved in root development and growth from Arabidopsis thaliana, Oryza sativa, Hordeum vulgare, Glycine max, Rosa rugosa, Triticum aestivum, Gossypium arboretum, and Malus hupehensis.
Supplementary Figure 7 | Differences in pH of nutrient solution with different N and P concentrations on Day 60.
Supplementary Figure 8 | Phenotypes of MdEXPA4 overexpressing lines subjected to NNNP, NNLP, LNNP, and LNLP conditions based on MS culture medium for two weeks were showed in A–D, respectively. Bar=1 cm. E–H, the root parameters of A. thaliana under different N and P supply conditions.
Supplementary Figure 9 | Differences in the growth and root parameters of wild-type and MdEXLB1 overexpressing lines under different N and P supply conditions.
Supplementary Figure 10 | Correlation between RNA-Seq and qRT-PCR data. Each RNA-Seq expression data was plotted against qRT-PCR data and fitted into a linear regression.
Supplementaty Table 1 | Primer names and sequences.
Supplementaty Table 2 | KEGG pathways mapped by differential genes and differential metabolites with higher PCCs.
Arsuffi, G., Braybrook, S. A. (2018). Acid growth: an ongoing trip. J. Exp. Bonty 69, 137–146. doi: 10.1093/jxb/erx390
Bonawitz, N. D., Chapple, C. (2010). The genetics of lignin biosynthesis: connecting genotype to phenotype. Annu. Rev. Genet. 44, 337–363. doi: 10.1146/annurev-genet-102209-163508
Bonneau, L., Huguet, S., Wipf, D., Pauly, N., Truong, H.-N. (2013). Combined phosphate and nitrogen limitation generates a nutrient stress transcriptome favorable for arbuscular mycorrhizal symbiosis in Medicago truncatula. New Phytol. 199, 188–202. doi: 10.1111/nph.12234
Boron, A. K., Van Loock, B., Suslov, D., Markakis, M. N., Verbelen, J.-P., Vissenberg, K. (2015). Over-expression of AtEXLA2 alters etiolated Arabidopsis hypocotyl growth. Ann. Bot. 115, 67–80. doi: 10.1093/aob/mcu221
Bouguyon, E., Brun, F., Meynard, D., Kubes, M., Pervent, M., Leran, S., et al. (2015). Multiple mechanisms of nitrate sensing by Arabidopsis nitrate transceptor NRT1.1. Nat. Plants 1, 15015. doi: 10.1038/NPLANTS.2015.15
Bourquin, V., Nishikubo, N., Abe, H., Brumer, H., Denman, S., Eklund, M., et al. (2002). Xyloglucan endotransglycosylases have a function during the formation of secondary cell walls of vascular tissues. Plant Cell 14, 3073–3088. doi: 10.1105/tpc.007773
Brown, D., Wightman, R., Zhang, Z., Gomez, L. D., Turner, S. (2011). Arabidopsis genes IRREGULAR XYLEM (IRX15) and IRX15L encode DUF579-containing proteins that are essential for normal xylan deposition in the secondary cell wall. Plant J. 66, 401–413. doi: 10.1111/j.1365-313X.2011.04501
Cai, H., Xie, W., Lian, X. (2013). Comparative analysis of differentially expressed genes in rice under nitrogen and phosphorus starvation stress conditions. Plant Mol. Biol. Rep. 31, 160–173. doi: 10.1007/s11105-012-0485-8
Carranca, C. (2012). “Nitrogen use efficiency by annual and perennial crops,” in Farming for food and water security. Ed. Lichtfouse, E. (Dordrecht: Springer).
Chai, X., Wang, X., Pi, Y., Wu, T., Zhang, X., Xu, X., et al. (2022). Nitrate transporter MdNRT2.4 interacts with rhizosphere bacteria to enhance nitrate uptake in apple rootstocks. J. Exp. Bot. 73, 6490–6504. doi: 10.1093/jxb/erac301
Chauhan, A., Ladon, T., Verma, P. (2020). Strategies for rootstock and varietal improvement in apple: a review. J. Pharmacogn. Phytochem. 9, 2513–2516.
Chen, X., Humphreys, J. L., Ru, Y., He, Y., Wu, F., Mai, J., et al. (2022a). Jasmonate signaling and remodeling of cell wall metabolism induced by boron deficiency in pea shoots. Environ. Exp. Bot. 201, 104947. doi: 10.1016/j.envexpbot.2022.104947
Chen, X., Vega-Sánchez, M. E., Verhertbruggen, Y., Chiniquy, D., Canlas, P. E., Fagerström, A., et al. (2013). Inactivation of OsIRX10 leads to decreased xylan content in rice culm cell walls and improved biomass saccharification. Mol. Plant 6, 570–573. doi: 10.1093/mp/sss135
Chen, Y., Xie, B., An, X., Ma, R., Zhao, D., Cheng, C., et al. (2022b). Overexpression of the apple expansin-like gene MdEXLB1 accelerates the softening of fruit texture in tomato. J. Integr. Agric. 21, 3578–3588. doi: 10.1016/j.jia.2022.08.030
Chen, H. F., Zhang, Q., Wang, X. R., Zhang, J. H., Ismail, A. M., Zhang, Z. H. (2021). Nitrogen form-mediated ethylene signal regulates root-to-shoot k+ translocation via NRT1.5. Plant Cell Environ. 44, 3576–3588. doi: 10.1111/pce.14182
Dai, X., Mashiguchi, K., Chen, Q., Kasahara, H., Kamiya, Y., Ojha, S., et al. (2013). The biochemical mechanism of auxin biosynthesis by an Arabidopsis YUCCA flavin-containing monooxygenase. J. Biol. Chem. 288, 1448–1457. doi: 10.1074/jbc.M112.424077
David, L. C., Dechorgnat, J., Berquin, P., Routaboul, J. M., Debeaujon, I., Daniel-Vedele, F., et al. (2014). Proanthocyanidin oxidation of Arabidopsis seeds is altered in mutant of the high-affinity nitrate transporter NRT2.7. J. Exp. Bot. 65, 885–893. doi: 10.1093/jxb/ert481
Devi, J., Kaur, E., Swarnkar, M. K., Acharya, V., Bhushan, S. (2021). De novo transcriptome analysis provides insights into formation of in vitro adventitious root from leaf explants of Arnebia euchroma. BMC Plant Biol. 21, 414. doi: 10.1186/s12870-021-03172-6
Ding, Y., Wang, Z. G., Mo, S. R., Liu, J., Xing, Y., Wang, Y. P., et al. (2021). Mechanism of low phosphorus inducing the main root lengthening of rice. J. Plant Growth Regul. 40, 1032–1043. doi: 10.1007/s00344-020-10161-w
Dong, J., Ma, G., Sui, L., Wei, M., Satheesh, V., Zhang, R., et al. (2019). Inositol pyrophosphate InsP8 acts as an intracellular phosphate signal in Arabidopsis. Mol. Plant 12, 1463–1473. doi: 10.1016/j.molp.2019.08.002
Du, H., Yang, C., Ding, G., Shi, L., Xu, F. (2017). Genome-wide identification and characterization of SPX domain-containing members and their responses to phosphate deficiency in Brassica napus. Front. Plant Sci. 8. doi: 10.3389/fpls.2017.00035
Endler, A., Persson, S. (2011). Cellulose synthases and synthesis in Arabidopsis. Mol. Plant 4, 199–211. doi: 10.1093/mp/ssq079
Epie, K. E., Etesami, M., Ondoua, R. N. (2019). Characterization and selection for phosphorus deficiency tolerance in 99 spring wheat genotypes in Montana. J. Plant Nutr. 42, 595–603. doi: 10.1080/01904167.2019.1567783
Fang, K. F., Du, B. S., Zhang, Q., Xing, Y., Cao, Q. Q., Qin, L. (2019). Boron deficiency alters cytosolic Ca2+ concentration and affects the cell wall components of pollen tubes in Malus domestica. Plant Biol. 21, 343–351. doi: 10.1111/plb.12941
Feng, Z. Q., Li, T., Wang, X., Sun, W. J., Zhang, T. T., You, C. X., et al. (2022). Identification and characterization of apple MdNLP7 transcription factor in the nitrate response. Plant Sci. 316, 111158. doi: 10.1016/j.plantsci.2021.111158
Gan, H., Jiao, Y., Jia, J., Wang, X., Li, H., Shi, W., et al. (2016). Phosphorus and nitrogen physiology of two contrasting poplar genotypes when exposed to phosphorus and/or nitrogen starvation. Tree Physiol. 36, 22–38. doi: 10.1093/treephys/tpv093
Gho, Y.-S., Jung, K.-H. (2019). Comparative expression analyses of rice and Arabidopsis phosphate transporter families revealed their conserved roles for the phosphate starvation response. Plant Breed. Biotech. 7, 42–49. doi: 10.9787/PBB.2019.7.1.42
Gou, M., Yang, X., Zhao, Y., Ran, X., Song, Y., Liu, C. (2019). Cytochrome b5 is an obligate electron shuttle protein for syringyl lignin biosynthesis in Arabidopsis. Plant Cell 31, 1344–1366. doi: 10.1105/tpc.18.00778
Han, Y.-Y., Zhou, S., Chen, Y.-H., Kong, X., Xu, Y., Wang, W. (2014). The involvement of expansins in responses to phosphorus availability in wheat, and its potentials in improving phosphorus efficiency of plants. Plant Physiol. Biochem. 78, 53–62. doi: 10.1016/j.plaphy.2014.02.016
Hannam, C., Gidda, S. K., Humbert, S., Peng, M., Cui, Y. H., Dyer, J. M., et al. (2018). Distinct domains within the NITROGEN LIMITATION ADAPTATION protein mediate its subcellular localization and function in the nitrate-dependent phosphate homeostasis pathway. Bot 96, 79–96. doi: 10.1139/cjb-2017-0149
Hocq, L., Pelloux, J., Lefebvre, V. (2017). Connecting homogalacturonan-type pectin remodeling to acid growth. Trends Plant Sci. 22, 20–29. doi: 10.1016/j.tplants.2016.10.009
Hu, B., Jiang, Z. M., Wang, W., Qiu, Y. H., Zhang, Z. H., Liu, Y. Q., et al. (2019). Nitrate-NRT1.1B-SPX4 cascade integrates nitrogen and phosphorus signalling networks in plants. Nat. Plants 5, 401–413. doi: 10.1038/s41477-019-0384-1
Hu, B., Zhu, C., Li, F., Tang, J., Wang, Y., Lin, A., et al. (2011). LEAF TIP NECROSIS1 plays a pivotal role in the regulation of multiple phosphate starvation responses in rice. Plant Physiol. 156, 1101–1115. doi: 10.1104/pp.110.170209
Huang, Y. M., Zou, Y. N., Wu, Q. S. (2017). Alleviation of drought stress by mycorrhizas is related to increased root H2O2 efflux in trifoliate orange. Sci. Rep. 7, 42335. doi: 10.1038/srep42335
Jensen, J. K., Kim, H., Cocuron, J.-C., Orler, R., Ralph, J., Wilkerson, C. G. (2011). The DUF579 domain containing proteins IRX15 and IRX15-l affect xylan synthesis in Arabidopsis. Plant J. 66, 387–400. doi: 10.1111/j.1365-313X.2010.04475.x
Jiang, S. Y., Sun, J. Y., Tian, Z. W., Hu, H., Michel, E. J. S., Gao, J. W., et al. (2017). Root extension and nitrate transporter up-regulation induced by nitrogen deficiency improves nitrogen status and plant growth at the seedling stage of winter wheat (Triticum aestivum l.). Environ. Exp. Bot. 141, 28–40. doi: 10.1016/j.envexpbot.2017.06.006
Kong, Y. B., Wang, B., Du, H., Li, W. L., Li, X. H., Zhang, C. Y. (2019). GmEXLB1, a soybean expansin-like b gene, alters root architecture to improve phosphorus acquisition in Arabidopsis. Front. Plant Sci. 10. doi: 10.3389/fpls.2019.00808
Krouk, G., Kiba, T. (2020). Nitrogen and phosphorus interactions in plants: from agronomic to physiological and molecular insights. Curr. Opin. Biotechnol. 57, 104–109. doi: 10.1016/j.pbi.2020.07.002
Kumar, S., Pallavi, Chugh, C., Seem, K., Kumar, S., Vinod, K. K., et al. (2021). Characterization of contrasting rice (Oryza sativa l.) genotypes reveals the pi-efficient schema for phosphate starvation tolerance. BMC Plant Biol. 21, 282. doi: 10.1186/s12870-021-03015-4
Lampugnani, E. R., Khan, G. A., Somssich, M., Persson, S. (2018). Building a plant cell wall at a glance. J. Cell Sci. Suppl. 131, jcs207373. doi: 10.1242/jcs.207373
Landi, S., Esposito, S. (2017). Nitrate uptake affects cell wall synthesis and modeling. Front. Plant Sci. 8. doi: 10.3389/fpls.2017.01376
Lee, H. W., Kim, J. (2013). EXPANSINA17 up-regulated by LBD18/ASL20 promotes lateral root formation during the auxin response. Plant Cell Physiol. 54, 1600–1611. doi: 10.1093/pcp/pct105
Lee, C., Teng, Q., Huang, W., Zhong, R., Ye, Z. H. (2009). The F8H glycosyltransferase is a functional paralog of FRA8 involved in glucuronoxylan biosynthesis in Arabidopsis. Plant Cell Physiol. 50, 812–827. doi: 10.1093/pcp/pcp025
Lezhneva, L., Kiba, T., Feria-Bourrellier, A. B., Lafouge, F., Boutet-Mercey, S., Zoufan, P., et al. (2014). The Arabidopsis nitrate transporter NRT2.5 plays a role in nitrate acquisition and remobilization in nitrogen-starved plants. Plant J. 80, 230–241. doi: 10.1111/tpj.12626
Li, Y., Li, Y. L., Yao, X. H., Wen, Y., Zhou, Z. X., Lei, W., et al. (2022). Nitrogen-inducible GLK1 modulates phosphate starvation response via the PHR1-dependent pathway. New Phytol. 236, 1871–1887. doi: 10.1111/nph.18499
Li, K., Liang, Y., Xing, L., Mao, J., Liu, Z., Dong, F., et al. (2018). Transcriptome analysis reveals multiple hormones, wounding and sugar signaling pathways mediate adventitious root formation in apple rootstock. Int. J. Mol. Sci. 19, 2201. doi: 10.3390/ijms19082201
Li, S., Zhang, Y., Wu, Q., Huang, J., Shen, R. F., Zhu, X. F. (2023). Decrease in hemicellulose content and its retention of iron contributes to phosphorus deficiency alleviated iron deficiency in Arabidopsis thaliana. Plant Sci. 329, 111605. doi: 10.1016/j.plantsci.2023.111605
Liu, W., Feng, X., Chen, Z.-H., Zhang, G., Wu, F. (2019). Transient silencing of an expansin HvEXPA1 inhibits root cell elongation and reduces Al accumulation in root cell wall of Tibetan wild barley. Environ. Exp. Bot. 165, 120–128. doi: 10.1016/j.envexpbot.2019.05.024
Liu, W. M., Xu, L. A., Lin, H., Cao, J. S. (2021a). Two expansin genes, AtEXPA4 and AtEXPB5, are redundantly required for pollen tube growth and AtEXPA4 is involved in primary root elongation in Arabidopsis thaliana. Genes 12, 249. doi: 10.3390/genes12020249
Liu, Y., Yan, L., Jiang, C. (2021b). Changes of antioxidant system and cell wall pectin in Poncirus trifoliate l. under calcium deficiency. J. Huazhong Agric. Univ. 39, 61–66. doi: 10.13300/j.cnki.hnlkxb.2020.01.008
Liu, X., Yang, Y., Wang, R., Cui, R., Xu, H., Sun, C., et al. (2022). GmWRKY46, a WRKY transcription factor, negatively regulates phosphorus tolerance primarily through modifying root morphology in soybean. Plant Sci. 315, 111148. doi: 10.1016/j.plantsci.2021.111148
Lü, P., Kang, M., Jiang, X., Dai, F., Gao, J., Zhang, C. (2013). RhEXPA4, a rose expansin gene, modulates leaf growth and confers drought and salt tolerance to Arabidopsis. Planta 237, 1547–1559. doi: 10.1007/s00425-013-1867-3
Lu, L., Zhang, Y. Y., Li, L., Yi, N., Liu, Y., Qaseem, M. F., et al. (2021). Physiological and transcriptomic responses to nitrogen deficiency in Neolamarckia cadamba. Front. Plant Sci. 12. doi: 10.3389/fpls.2021.747121
Lv, X., Zhang, Y., Hu, L., Zhang, Y., Zhang, B., Xia, H., et al. (2021). Low-nitrogen stress stimulates lateral root initiation and nitrogen assimilation in wheat: roles of phytohormone signaling. J. Plant Growth Regul. 40, 436–450. doi: 10.1007/s00344-020-10112-5
Lv, Q., Zhong, Y., Wang, Y., Wang, Z., Zhang, L., Shi, J., et al. (2014). SPX4 negatively regulates phosphate signaling and homeostasis through its interaction with PHR2 in rice. Plant Cell 26, 1586–1597. doi: 10.1105/tpc.114.123208
Ma, N., Dong, L., Lü, W., Lü, J., Meng, Q., Liu, P. (2020). Transcriptome analysis of maize seedling roots in response to nitrogen-, phosphorus-, and potassium deficiency. Plant Soil 447, 637–658. doi: 10.1007/s11104-019-04385-3
Marowa, P., Ding, A., Kong, Y. (2016). Expansins: roles in plant growth and potential applications in crop improvement. Plant Cell Rep. 35, 949–965. doi: 10.1007/s00299-016-1948-4
Medici, A., Marshall-Colon, A., Ronzier, E., Szponarski, W., Wang, R. C., Gojon, A., et al. (2015). AtNIGT1/HRS1 integrates nitrate and phosphate signals at the Arabidopsis root tip. Nat. Commun. 6, 6274. doi: 10.1038/ncomms7274
Medici, A., Szponarski, W., Dangeville, P., Safi, A., Dissanayake, I. M., Saenchai, C., et al. (2019). Identification of molecular integrators shows that nitrogen actively controls the phosphate starvation response in plants. Plant Cell 31, 1171–1184. doi: 10.1105/tpc.18.00656
Meychik, N., Nikolaeva, Y., Kushunina, M. (2021). The significance of ion-exchange properties of plant root cell walls for nutrient and water uptake by plants. Plant Physiol. Biochem. 166, 140–147. doi: 10.1016/j.plaphy.2021.05.048
Misawa, F., Ito, M., Nosaki, S., Nishida, H., Watanabe, M., Suzuki, T., et al. (2022). Nitrate transport via NRT2.1 mediates NIN-LIKE PROTEIN-dependent suppression of root nodulation in lotus japonicus. Plant Cell 34, 1844–1862. doi: 10.1093/plcell/koac046
Mlodzinska, E., Klobus, G., Christensen, M. D., Fuglsang, A. T. (2015). The plasma membrane h+-ATPase AHA2 contributes to the root architecture in response to different nitrogen supply. Physiol. Plant 154, 270–282. doi: 10.1111/ppl.12305
Mu, X., Chen, Y. (2021). The physiological response of photosynthesis to nitrogen deficiency. Plant Physiol. Biochem. 158, 76–82. doi: 10.1016/j.plaphy.2020.11.019
Nasr Esfahani, M., Inoue, K., Nguyen, K. H., Chu, H. D., Watanabe, Y., Kanatani, A., et al. (2021). Phosphate or nitrate imbalance induces stronger molecular responses than combined nutrient deprivation in roots and leaves of chickpea plants. Plant Cell Environ. 44, 574–597. doi: 10.1111/pce.13935
Nasr Esfahani, M., Kusano, M., Abdelrahman, M., Nguyen, K. H., Watanabe, Y., Mochida, K., et al. (2022). Differential metabolic rearrangements in the roots and leaves of Cicer arietinum caused by single or double nitrate and/or phosphate deficiencies. Plant J. 111, 1643–1659. doi: 10.1111/tpj.15913
Nezamivand-Chegini, M., Metzger, S., Moghadam, A., Tahmasebi, A., Koprivova, A., Eshghi, S., et al. (2022). Integration of transcriptomic and metabolomic analyses provides insights into response mechanisms to nitrogen and phosphorus deficiencies in soybean. Plant Sci. 326, 111498–111498. doi: 10.1016/j.plantsci.2022.111498
Nezamivand-Chegini, M., Metzger, S., Moghadam, A., Tahmasebi, A., Koprivova, A., Eshghi, S., et al. (2023). Integration of transcriptomic and metabolomic analyses provides insights into response mechanisms to nitrogen and phosphorus deficiencies in soybean. Plant Sci. 326, 111498. doi: 10.1016/j.plantsci.2022.111498
Ogden, M., Hoefgen, R., Roessner, U., Persson, S., Khan, G. A. (2018). Feeding the walls: how does nutrient availability regulate cellwall composition? Int. J. Mol. Sci. 19, 2691. doi: 10.3390/ijms19092691
Pueyo, J. J., Quiñones, M. A., Coba de la Peña, T., Fedorova, E. E., Lucas, M. M. (2021). Nitrogen and phosphorus interplay in lupin root nodules and cluster roots. Front. Plant Sci. 12. doi: 10.3389/fpls.2021.644218
Qin, L., Walk, T. C., Han, P., Chen, L., Zhang, S., Li, Y., et al. (2019). Adaption of roots to nitrogen deficiency revealed by 3D quantification and proteomic analysis. Plant Physiol. 179, 329–347. doi: 10.1104/pp.18.00716
Rennenberg, H., Herschbach, C. (2013). Phosphorus nutrition of woody plants: many questions - few answers. Plant Biol. 15, 785–788. doi: 10.1111/plb.12078
Rivai, R. R., Miyamoto, T., Awano, T., Takada, R., Tobimatsu, Y., Umezawa, T., et al. (2021). Nitrogen deficiency results in changes to cell wall composition of sorghum seedlings. Sci. Rep. 11, 23309. doi: 10.1038/s41598-021-02570-y
Secco, D., Poirier, B. Y. (2010). Characterization of the rice PHO1 gene family reveals a key role for OsPHO1;2 in phosphate homeostasis and the evolution of a distinct clade in dicotyledons. Plant Physiol. 152, 1693–1704. doi: 10.1104/pp.109.149872
Sinha, S. K., Kumar, A., Tyagi, A., Venkatesh, K., Paul, D., Singh, N. K., et al. (2020). Root architecture traits variation and nitrate-influx responses in diverse wheat genotypes under different external nitrogen concentrations. Plant Physiol. Biochem. 148, 246–259. doi: 10.1016/j.plaphy.2020.01.018
Smith, P. J., Wang, H. T., York, W. S., Pe?A, M. J., Urbanowicz, B. R. (2017). Designer biomass for next-generation biorefineries: leveraging recent insights into xylan structure and biosynthesis. Biotechnol. Biofuels 10, 286. doi: 10.1186/s13068-017-0973-z
Stefanovic, A., Arpat, A. B., Bligny, R., Gout, E., Vidoudez, C., Bensimon, M., et al. (2011). Over-expression of PHO1 in Arabidopsis leaves reveals its role in mediating phosphate efflux. Plant J. 66, 689–699. doi: 10.1111/j.1365-313X.2011.04532.x
Stefanovic, A., Ribot, C., Rouached, H., Wang, Y., Chong, J., Belbahri, L., et al. (2007). Members of the PHO1 gene family show limited functional redundancy in phosphate transfer to the shoot, and are regulated by phosphate deficiency via distinct pathways. Plant J. 50, 982–994. doi: 10.1111/j.1365-313X.2007.03108.x
Sun, X., Chen, H., Wang, P., Chen, F., Yuan, L., Mi, G. (2020b). Low nitrogen induces root elongation via auxin-induced acid growth and auxin-regulated target of rapamycin (TOR) pathway in maize. J. Plant Physiol. 254, 153281. doi: 10.1016/j.jplph.2020.153281
Sun, T., Li, M., Shao, Y., Yu, L., Ma, F. (2017b). Comprehensive genomic identification and expression analysis of the phosphate transporter (PHT) gene family in apple. Front. Plant Sci. 8. doi: 10.3389/fpls.2017.00426
Sun, S.-N. P., Xiong, X.-P., Zhang, X.-L., Feng, H.-J., Zhu, Q.-H., Sun, J., et al. (2020a). Characterization of the Gh4CL gene family reveals a role of Gh4CL7 in drought tolerance. BMC Plant Biol. 20, 125. doi: 10.1186/s12870-020-2329-2
Sun, C.-H., Yu, J.-Q., Hu, D.-G. (2017a). Nitrate: a crucial signal during lateral roots development. Front. Plant Sci. 8. doi: 10.3389/fpls.2017.00485
Sun, T., Zhang, J., Zhang, Q., Li, X., Li, M., Yang, Y., et al. (2021a). Integrative physiological, transcriptome, and metabolome analysis reveals the effects of nitrogen sufficiency and deficiency conditions in apple leaves and roots. Environ. Exp. Bot. 192, 104633. doi: 10.1016/j.envexpbot.2021.104633
Sun, T., Zhang, J., Zhang, Q., Li, X., Li, M., Yang, Y., et al. (2021b). Transcriptome and metabolome analyses revealed the response mechanism of apple to different phosphorus stresses. Plant Physiol. Biochem. 167, 639–650. doi: 10.1016/j.plaphy.2021.08.040
Tahir, M. M., Li, S. H., Mao, J. P., Liu, Y., Li, K., Zhang, X. Y., et al. (2021a). High nitrate inhibited adventitious roots formation in apple rootstock by altering hormonal contents and miRNAs expression profiles. Sci. Hortic. 286, 110230. doi: 10.1016/j.scienta.2021.110230
Tahir, M. M., Lu, Z., Wang, C., Shah, K., Li, S., Zhang, X., et al. (2021b). Nitrate application induces adventitious root growth by regulating gene expression patterns in apple rootstocks. J. Plant Growth Regul. 41, 3467–3478. doi: 10.1007/s00344-021-10527-8
Tahir, M. M., Tong, L., Fan, L., Liu, Z., Li, S., Zhang, X., et al. (2022). Insights into the complicated networks contribute to adventitious rooting in transgenic MdWOX11 apple microshoots under nitrate treatments. Plant Cell Environ. 45, 3134–3156. doi: 10.1111/pce.14409
Tahir, M. M., Wang, H., Ahmad, B., Liu, Y., Fan, S., Li, K., et al. (2021c). Identification and characterization of NRT gene family reveals their critical response to nitrate regulation during adventitious root formation and development in apple rootstock. Sci. Hortic. 275, 109642. doi: 10.1016/j.scienta.2020.109642
Tian, H., Song, H., Wu, X., Zhang, Z., Tian, H., Song, H. X., et al. (2022). The root elongation and the changes of cell wall components of rapeseed root under low nitrogen conditions. J. Hunan Agric. Univ. 48, 386–393. doi: 10.13331/j.cnki.jhau.2022.04.002
Torres-Rodriguez, J. A., Reyes-Pérez, J. J., Castellanos, T., Angulo, C., Quiñones-Aguilar, E. E., Hernandez-Montiel, L. G. (2021). A biopolymer with antimicrobial properties and plant resistance inducer against phytopathogens: chitosan. Not. Bot. Horti Agrobot. Cluj-Napoca 49, 1–15. doi: 10.15835/nbha49112231
Ueda, Y., Kiba, T., Yanagisawa, S. (2020). Nitrate-inducible NIGT1 proteins modulate phosphate uptake and starvation signalling via transcriptional regulation of SPX genes. Plant J. 102, 448–466. doi: 10.1111/tpj.14637
Valentinuzzi, F., Venuti, S., Pii, Y., Marroni, F., Cesco, S., Hartmann, F., et al. (2019). Common and specific responses to iron and phosphorus deficiencies in roots of apple tree (Malus×domestica). Plant Mol. Biol. 101, 129–148. doi: 10.1007/s11103-019-00896-w
Vanholme, R., De Meester, B., Ralph, J., Boerjan, W. (2019). Lignin biosynthesis and its integration into metabolism. Cur. Opin. Biotechnol. 56, 230–239. doi: 10.1016/j.copbio.2019.02.018
Wang, C., Fan, F., Shang, X., Zhou, Z., Ding, G. (2021a). Transcriptome-wide identification and expression profiling of SPX domain-containing members in responses to phosphorus deprivation of Pinus massoniana. Forests 12, 1627. doi: 10.3390/f12121627
Wang, Y., Li, W., Xu, X., Qiu, C., Wu, T., Wei, Q., et al. (2019b). Progress of apple rootstock breeding and its use. Hortic. Plant J. 5, 183–191. doi: 10.1016/j.hpj.2019.06.001
Wang, Q., Liu, C. H., Huang, D., Dong, Q. L., Li, P. M., Ma, F. W. (2019a). High-efficient utilization and uptake of n contribute to higher NUE of 'Qinguan' apple under drought and n-deficient conditions compared with 'Honeycrisp'. Tree Physiol. 39, 1880–1895. doi: 10.1093/treephys/tpz093
Wang, Y. F., Wang, N., Liu, S. T., Dong, A. Y., Zenda, T. N. S., Liu, X. Y., et al. (2022). Comparative proteomic analysis of two contrasting maize hybrids' responses to low nitrogen stress at the twelve leaf stage and function verification of ZmTGA gene. Genes 13, 670. doi: 10.3390/genes13040670
Wang, K., Xu, F., Yuan, W., Zhang, D., Liu, J., Sun, L., et al. (2021b). Rice G protein γ subunit qPE9-1 modulates root elongation for phosphorus uptake by involving 14-3-3 protein OsGF14b and plasma membrane h+-ATPase. Plant J. 107, 1603–1615. doi: 10.1111/tpj.15402
Wang, Q., Zhu, Y., Zou, X., Li, F., Lin, Y. (2020). Nitrogen deficiency-induced decrease in cytokinins content promotes rice seminal root growth by promoting root meristem cell proliferation and cell elongation. Cells 9, 916. doi: 10.3390/cells9040916
Watanabe, S., Takahashi, N., Kanno, Y., Suzuki, H., Aoi, Y., Takeda-Kamiya, N., et al. (2020). The Arabidopsis NRT1/PTR FAMILY protein NPF7.3/NRT1.5 is an indole-3-butyric acid transporter involved in root gravitropism. Proc. Natl. Acad. Sci. U. S. A. 117, 31500–31509. doi: 10.1073/pnas.2013305117
Wei, M., Zhang, M., Sun, J., Zhao, Y., Pak, S., Ma, M., et al. (2022). PuHox52 promotes coordinated uptake of nitrate, phosphate, and iron under nitrogen deficiency in Populus ussuriensis. J. Integr. Plant Biol. 65, 791–809. doi: 10.1111/jipb.13389
Wen, B., Gong, X., Chen, X., Tan, Q., Li, L., Wu, H. (2022). Transcriptome analysis reveals candidate genes involved in nitrogen deficiency stress in apples. J. Plant Physiol. 279, 153822. doi: 10.1016/j.jplph.2022.153822
Wu, A.-M., Hörnblad, E., Voxeur, A., Gerber, L., Rihouey, C., Lerouge, P., et al. (2010). Analysis of the Arabidopsis IRX9/IRX9-l and IRX14/IRX14-l pairs of glycosyltransferase genes reveals critical contributions to biosynthesis of the hemicellulose glucuronoxylan. Plant Physiol. 153, 542–554. doi: 10.1104/pp.110.154971
Wu, Q., Tao, Y., Zhang, X. L., Dong, X. Y., Xia, J. X., Shen, R. F., et al. (2022). Pectin methylesterases enhance root cell wall phosphorus remobilization in rice. Rice Sci. 29, 179–188. doi: 10.1016/j.rsci.2022.01.006
Wu, T., Zeng, N., Li, W., Wang, S., Xu, F., Shi, L. (2021). Genome-wide identification of the expansin gene family and differences in transcriptional responses to boron deficiency in. Brassica napusl. Plant Sci. J. 39, 59–75. doi: 10.11913/PSJ.2095-0837.2021.10059
Xiao, J. B., Xie, X. M., Li, C., Xing, G. Z., Cheng, K., Li, H., et al. (2021). Identification of SPX family genes in the maize genome and their expression under different phosphate regimes. Plant Physiol. Biochem. 168, 211–220. doi: 10.1016/j.plaphy.2021.09.045
Xie, B., An, X., Chen, Y., Cheng, C., Zhao, D., Kang, G., et al. (2022a). Response and tolerance of apple rootstocks to low nitrogen stress. J. Plant Nutr. Fert. 28, 1092–1103. doi: 10.11674/zwyf.2021546
Xie, B., An, X., Chen, Y., Cungang, C., Kang, G., Zhou, J., et al. (2022b). Response and adaptability evaluation of different apple rootstocks to continuous phosphorus deficiency. Sci. Agric. Sin. 55, 2598–2612. doi: 10.3864/j.issn.0578-1752.2022.13.010
Xie, M., Muchero, W., Bryan, A. C., Yee, K., Guo, H.-B., Zhang, J., et al. (2018). A5-enolpyruvylshikimate 3-phosphate synthase functions as a transcriptional repressor in Populus. Plant Cell 30, 1645–1660. doi: 10.1105/tpc.18.00168
Xu, W., Zhang, Q., Yuan, W., Xu, F., Muhammad Aslam, M., Miao, R., et al. (2020). The genome evolution and low-phosphorus adaptation in white lupin. Nat. Commun. 11, 1069. doi: 10.1038/s41467-020-14891-z
Yan, J., Zhu, J., Zhou, J., Xing, C., Song, H., Wu, K., et al. (2022). Using brefeldin a to disrupt cell wall polysaccharide components in rice and nitric oxide to modify cell wall structure to change aluminum tolerance. Front. Plant Sci. 13. doi: 10.3389/fpls.2022.948212
Yang, Z., Gao, Z., Zhou, H., He, Y., Liu, Y., Lai, Y., et al. (2021). GmPTF1 modifies root architecture responses to phosphate starvation primarily through regulating GmEXPB2 expression in soybean. Plant J. 107, 525–543. doi: 10.1111/tpj.15307
Yang, J., Zhao, X., Chen, Y., Li, G., Li, X., Xia, M., et al. (2022). Identification, structural, and expression analyses of SPX genes in giant duckweed (Spirodela polyrhiza) reveals its role in response to low phosphorus and nitrogen stresses. Cells 11, 1167. doi: 10.3390/cells11071167
Ye, J. Y., Tian, W. H., Jin, C. W. (2019). A reevaluation of the contribution of NRT1.1 to nitrate uptake in Arabidopsis under low-nitrate supply. FEBS Lett. 593, 2051–2059. doi: 10.1002/1873-3468.13473
Zhang, Y., Chen, H., Liang, Y., Lu, T., Liu, Z., Jin, X., et al. (2021c). Comparative transcriptomic and metabolomic analyses reveal the protective effects of silicon against low phosphorus stress in tomato plants. Plant Physiol. Biochem. 166, 78–87. doi: 10.1016/j.plaphy.2021.05.043
Zhang, X., Cui, Y., Yu, M., Su, B., Gong, W., Balu¡Ka, F. E., et al. (2019). Phosphorylation-mediated dynamics of nitrate transceptor NRT1.1 regulate auxin flux and nitrate signaling in lateral root growth. Plant Physiol. 181, 480–498. doi: 10.1104/pp.19.00346
Zhang, B. C., Gao, Y. H., Zhang, L. J., Zhou, Y. H. (2021a). The plant cell wall: biosynthesis, construction, and functions. J. Integr. Plant Biol. 63, 251–272. doi: 10.1111/jipb.13055
Zhang, Z., Li, Z., Wang, W., Jiang, Z., Guo, L., Wang, X., et al. (2021e). Modulation of nitrate-induced phosphate response by the MYB transcription factor RLI1/HINGE1 in the nucleus. Mol. Plant 14, 517–529. doi: 10.1016/j.molp.2020.12.005
Zhang, Q., Pang, X., Chen, X., Ye, J., Lin, S., Jia, X. (2020). Rain-shelter cultivation influence rhizosphere bacterial community structure in pear and its relationship with fruit quality of pear and soil chemical properties. Sci. Hortic. 269, 109419. doi: 10.1016/j.scienta.2020.109419
Zhang, X., Tahir, M. M., Li, S., Mao, J., Nawaz, M. A., Liu, Y., et al. (2021b). Transcriptome analysis reveals the inhibitory nature of high nitrate during adventitious roots formation in the apple rootstock. Physiol. Plant 173, 867–882. doi: 10.1111/ppl.13480
Zhang, Y., Wang, T., Ou, S., Li, F., Huang, L., Mai, C., et al. (2022). Identification and assessment of the role of soybean low phosphate-responsive Xyloglucan endotransglycosylases/hydrolases genes in root growth. J. Plant Nutr. Fert. 28, 1167–1181. doi: 10.11674/zwyf.2021562
Zhang, Y., Wang, Y., Wang, E., Wu, X., Zheng, Q., Han, Y., et al. (2021d). SlPHL1, a MYB-CC transcription factor identified from tomato, positively regulates the phosphate starvation response. Physiol. Plant 173, 1063–1077. doi: 10.1111/ppl.13503
Zhang, J., Zhou, X., Xu, Y., Yao, M., Xie, F., Gai, J., et al. (2016). Soybean SPX1 is an important component of the response to phosphate deficiency for phosphorus homeostasis. Plant Sci. 248, 82–91. doi: 10.1016/j.plantsci.2016.04.010
Zhao, H., Sun, S., Zhang, L., Yang, J., Wang, Z., Ma, F., et al. (2020). Carbohydrate metabolism and transport in apple roots under nitrogen deficiency. Plant Physiol. Biochem. 155, 455–463. doi: 10.1016/j.plaphy.2020.07.037
Zheng, Y., Drechsler, N., Rausch, C., Kunze, R. (2016). The Arabidopsis nitrate transporter NPF7.3/NRT1.5 is involved in lateral root development under potassium deprivation. Plant Signaling Behav. 11, e1176819. doi: 10.1080/15592324.2016.1176819
Zhu, X. F., Zhang, X. L., Dong, X. Y., Shen, R. F. (2019). Carbon dioxide improves phosphorus nutrition by facilitating the remobilization of phosphorus from the shoot cell wall in rice (Oryza sativa). Front. Plant Sci. 10. doi: 10.3389/fpls.2019.00665
Zhu, C. Q., Zhu, X. F., Wang, C., Dong, X. Y., Shen, R. F. (2018). Nitrate inhibits the remobilization of cell wall phosphorus under phosphorus-starvation conditions in rice (Oryza sativa). Planta 248, 185–196. doi: 10.1007/s00425-018-2892-z
Keywords: apple dwarfing rootstock, nitrogen and phosphorus deficiencies, root architecture, cell wall, expansin
Citation: Xie B, Chen Y, Zhang Y, An X, Li X, Yang A, Kang G, Zhou J and Cheng C (2023) Comparative physiological, metabolomic, and transcriptomic analyses reveal mechanisms of apple dwarfing rootstock root morphogenesis under nitrogen and/or phosphorus deficient conditions. Front. Plant Sci. 14:1120777. doi: 10.3389/fpls.2023.1120777
Received: 10 December 2022; Accepted: 16 May 2023;
Published: 19 June 2023.
Edited by:
Baris Uzilday, Ege University, TürkiyeReviewed by:
Hakan Terzi, Afyon Kocatepe University, TürkiyeCopyright © 2023 Xie, Chen, Zhang, An, Li, Yang, Kang, Zhou and Cheng. This is an open-access article distributed under the terms of the Creative Commons Attribution License (CC BY). The use, distribution or reproduction in other forums is permitted, provided the original author(s) and the copyright owner(s) are credited and that the original publication in this journal is cited, in accordance with accepted academic practice. No use, distribution or reproduction is permitted which does not comply with these terms.
*Correspondence: Cungang Cheng, Y2N1bmdhbmdAMTYzLmNvbQ==
†These authors have contributed equally to this work
Disclaimer: All claims expressed in this article are solely those of the authors and do not necessarily represent those of their affiliated organizations, or those of the publisher, the editors and the reviewers. Any product that may be evaluated in this article or claim that may be made by its manufacturer is not guaranteed or endorsed by the publisher.
Research integrity at Frontiers
Learn more about the work of our research integrity team to safeguard the quality of each article we publish.