 Yujie Yan
 Li Zhou
 Guangsheng Zhou
 Yu Wang
 Jiaxin Song
 Sen Zhang
 Mengzi Zhou
- 1School of Geo-Science and Technology, Zhengzhou University, Zhengzhou, China
- 2State Key Laboratory of Severe Weather, Chinese Academy of Meteorological Sciences, Beijing, China
- 3Joint Laboratory of Eco-Meteorology, Chinese Academy of Meteorological Sciences, Zhengzhou University, Zhengzhou, China
- 4College of Horticulture and Plant Protection, Henan University of Science and Technology, Luoyang, China
Boreal forests, the second continental biome on Earth, are known for their massive carbon storage capacity and important role in the global carbon cycle. Comprehending the temporal dynamics and controlling factors of net ecosystem CO2 exchange (NEE) is critical for predicting how the carbon exchange in boreal forests will change in response to climate change. Therefore, based on long-term eddy covariance observations from 2008 to 2018, we evaluated the diurnal, seasonal, and interannual variations in the boreal forest ecosystem NEE in Northeast China and explored its environmental regulation. It was found that the boreal forest was a minor CO2 sink with an annual average NEE of -64.01 (± 24.23) g CO2 m-2 yr-1. The diurnal variation in the NEE of boreal forest during the growing season was considerably larger than that during the non-growing season, and carbon uptake peaked between 8:30 and 9:30 in the morning. The seasonal variation in NEE demonstrated a “U” shaped curve, and the carbon uptake peaked in July. On a half-hourly scale, photosynthetically active radiation and vapor pressure deficit had larger impacts on daytime NEE during the growing season. However, temperature had major control on NEE during the growing season at night and during the non-growing season. On a daily scale, temperature was the dominant factor controlling seasonal variation in NEE. Occurrence of extreme temperature days, especially extreme temperature events, would reduce boreal forest carbon uptake; interannual variation in NEE was substantially associated with the maximum CO2 uptake rate during the growing season. This study deepens our understanding of environmental controls on NEE at multiple timescales and provides a data basis for evaluating the global carbon budget.
1 Introduction
Global climate change, characterized by global warming, is one of the most important issues people face today, and it is essential to significantly reduce greenhouse gas emissions to keep world temperatures 1.5°C above pre-industrial levels (Bosch et al., 2017; Tian et al., 2020; IPCC, 2021). Terrestrial ecosystems have a net carbon uptake of 3.4 ± 0.9 Pg C yr−1 from the atmosphere, playing a significant role in the global carbon cycle and reducing global warming (IPCC, 2021). Therefore, it is vital to comprehend the terrestrial ecosystems carbon budget and environmental regulations.
As one of the major terrestrial ecosystems, forests contribute nearly half of the terrestrial production and can effectively reduce CO2 accumulation in the atmosphere (Reichstein and Carvalhais, 2019). Among them, boreal forest ecosystems are the second continental biome on Earth and contain approximately 30% of all forests in terms of carbon storage (Pan et al., 2011). Boreal forests have the potential to reduce atmospheric carbon emissions by increasing carbon storage in plants, soil, and wood products and by displacing fossil fuels (Baul et al., 2017; Cintas et al., 2017). Additionally, there is evidence that the boreal forest region is one of the most rapidly warming regions globally (Walsh, 2014). Boreal forests are considered to be more vulnerable to climate change than other ecosystems in the world and are one of the critical climate tipping points of the world, where climate change may cause widespread boreal forest dieback (Bonan, 2008; Lenton et al., 2008; Gauthier et al., 2015; Venalainen et al., 2020; Mckay et al., 2022). Therefore, boreal forests are a key area for global carbon cycle research, and they have attracted increasing attention from researchers in recent years (Venier et al., 2018; Holmberg et al., 2019; Piznak and Backor, 2019; Frelich et al., 2021), but there are still debates on their carbon source/sink issues (Heijmans et al., 2004; Soloway et al., 2017). Boreal forests may function as a net CO2 source or sink at the ecosystem scale or may switch between the two states. In a study of an artificial boreal forest in Maoer Mountain, China, the forest absorbed an annual average of 575.66 g CO2 from 2008 to 2018 (Liu et al., 2021). The annual average uptake of afforested temperate white pine forest in Ontario was 382.74 g CO2 from 2003 to 2013 (Chan et al., 2018). It experienced a transformation from carbon sink to carbon source in the Manitoba boreal black spruce forest, with an annual average release of 66 g CO2 (Dunn et al., 2007). In central Sweden, the major boreal forest ecosystem was a constant CO2 source, shedding approximately 250.5 g CO2 m-2 yr-1 over a ten-year period (Hadden and Grelle, 2017). In summary, boreal forests demonstrate large spatial variations from the net ecosystem exchange perspective. Since the establishment of ChinaFlux in 2002, carbon flux observations have been conducted in diverse forests (Yu et al., 2006; Zhu et al., 2006; Yu et al., 2014; Wang et al., 2016), but there have been few reports on the original boreal forest ecosystem, except for the Genhe station in Inner Mongolia (Li and Zhang, 2015). Research on carbon flux dynamics in boreal forest ecosystems in China is still in its infancy.
Some studies have demonstrated that the factors controlling net ecosystem CO2 exchange (NEE) on different scales are quite different (Fu et al., 2017b, Wu JK et al., 2020). On half-hourly and daily scales, radiation and temperature are often considered the dominant factors in NEE variation, but precipitation and soil moisture have stronger effects on NEE in some arid regions (Park et al., 2011; Li et al., 2014; Rebane et al., 2019, Wang Y et al., 2019). NEE interannual variation (IAV) is predominantly influenced by physiological (e.g., maximum carbon uptake rate) and phenological factors (e.g., length of the growing season); however, some studies have indicated that it is strongly associated with annual mean temperature and cumulative precipitation (Oquist et al., 2014; Xu et al., 2019; Jia et al., 2021; Liu et al., 2021). Although, owing to the lack of long-term continuous high-quality observational data, there are few systematic studies on the factors influencing NEE at diverse scales in boreal forest ecosystems, and the control mechanism is still obscure (Venalainen et al., 2020).
Additionally, the boreal forest ecosystem is situated in the middle and high latitudes of the Northern Hemisphere, where rapid climate change and frequent extreme temperatures are common (Seneviratne et al., 2021). Temperature has a strong influence on plant photosynthesis, soil microbial activity, organic matter decomposition, phenology, and consequently, NEE (Horemans et al., 2020; Kang et al., 2020). When extremely high temperatures occurred in Southern Australia during the summer of 2013, the maximum daily carbon uptake of temperate forests in the region decreased, which in turn affected the cumulative NEE during the growing season (Van Gorsel et al., 2013). Net carbon uptake during the growing season decreased in 2003 due to the high temperatures in European forests. For example, carbon uptake in the growing season decreased by approximately 160 g C m-2 yr-1 in the evergreen coniferous forest of Italy (Ciais et al., 2005). In the summer of the same year, the subtropical region of East Asia also experienced extremely high temperatures, which significantly reduced forest ecosystems carbon uptake during the growing season (Saigusa et al., 2010; Wen et al., 2010). Previous discussions of the impact of extreme temperatures on NEE have majorly focused on the tropics and subtropics, whereas boreal forests have been ignored (Yuri et al., 2021). Considering that the scale and intensity of extreme temperature events may increase in the future, to accurately evaluate the carbon sink capacity of forest ecosystems, it is essential to elucidate the response characteristics of net carbon uptake of boreal forests to extreme temperatures (Meehl and Tebaldi, 2004; Shao et al., 2022).
Therefore, based on 11-year eddy covariance observations from a boreal forest ecosystem in China, this study aimed to (1) quantify the dynamic characteristics of diurnal, seasonal, and interannual variations of CO2 fluxes in the boreal forest; (2) comprehend the environmental regulations on CO2 flux changes at diverse time scales; and (3) explore the effects of extreme temperature on the boreal forest NEE.
2 Materials and methods
2.1 Site description
The research was conducted at the Research Station for Ecosystem Positioning of Chinese Northern Coniferous Forests (51°46’52”N, 126°01’04”E; 773 m a.s.l.), maintained by the Institute of Botany, the Chinese Academy of Sciences, and the Heilongjiang Huzhong National Nature Reserve Administration. The area had cold, dry winters and hot, rainy summers, with a typical continental monsoon climate. The long-term annual average air temperature (1991–2020) was -2.95°C, and the annual average precipitation was approximately 500.8 mm. Additionally, there were significant seasonal (approximately 70% of precipitation occurring in the summer) and interannual (272.4–748.8 mm) variations in precipitation. Larix gmelinii was the only dominant species at the research site, while Betula platyphylla was the primary companion tree species. Ledum palustre, Vaccinium vitis-idaea, and Rhododendron dauricum constituted most of the understory.
2.2 Eddy-covariance and supporting measurements
Using an Open Path Eddy Covariance (OPEC) system installed at 35.0 m, carbon (the net ecosystem exchange of CO2, NEE) and water fluxes were observed. The OPEC system included a 3-D sonic anemometer (CAST3, Campbell Scientific, Inc., Logan, UT, USA), which measures wind speed and virtual temperature, and an infrared gas analyzer (IGRA; LI-7500, LI-COR, Inc., Lincoln, NE, USA), which monitors changes in CO2 and water vapor densities. The sampling rate for flux data was 10 Hz.
Additionally, a quantum sensor (LI-190SB, LI-COR, Inc., Lincoln, NE, USA) and a four-component net radiometer (CNR1, Kipp & Zonen, Crop., Delft, Holland) were utilized to measure photosynthetically active radiation (PAR) and net radiation (Rn) 32 m above the ground. A thermo-hygrometer was used to measure the relative humidity (RH) and air temperature (Ta) (HMP45C, Vaisala, Inc., Helsinki, Finland). Soil temperature (Ts; 107 L, Campbell Scientific, Inc., Edmonton, Alberta, Canada) at six depths (0, 0.05, 0.1, 0.15, 0.2, and 0.3 m) and volumetric soil water content (SWC, CS616, Campbell Scientific, Inc., UT, USA) at 0.08 m were measured. A rain gauge (52203, RM Young, Inc., Traverse City, MI, USA) mounted on the top of the tower was utilized to measure precipitation (37 m). All meteorological data were collected as 30 min averages using a data logger (CR23XTD, Campbell Scientific, Inc., UT, USA).
2.3 Post-processing of eddy-covariance measurements
Half-hourly CO2 fluxes were computed and corrected from raw OPEC recordings using EddyPro 7.0.6 (LI-COR Inc., Lincoln, NE). The major post-processing procedures included spike removal, double-coordinate rotation, corrections for frequency losses and sonic temperature, corrections for density fluctuations (i.e., the Webb–Pearman–Leuning correction), and flux computation (Webb et al., 1980). It should be noted that because the infrared gas analyzer (LI-7500) surface temperature differs from the air temperature due to electronic instrument heating, solar radiation, and radiative cooling, the Burba Equation should be utilized for further correction during processing (Burba et al., 2008). Rain events, outliers (Papale et al., 2006), and nighttime data that occurred under low friction velocity (u*) circumstances were used to filter the flux data during these times. The u* threshold was estimated using the method described by Zhu et al. (2006). Using the marginal distribution sampling (MDS) technique, flux data gaps were filled (Reichstein et al., 2005). A positive (negative) NEE value indicates that the ecosystem is a carbon source (sink). The growing season usually started in early May and ended in late September; the remaining period was defined as the non-growing season.
2.4 Data analysis
The maximum CO2 uptake (MCU) and release rate (MCR) obtained from the smoothed daily NEE curves were considered as ecosystem physiological metrics (Fu et al., 2019). A Savitzky–Golay filter was applied to smoothen the daily NEE (Savitzky and Golay, 1964). The number of days with a net carbon uptake (NEE < 0 g CO2 m-2 d-1) was defined as the net CO2 uptake period (CUP).
According to the 27 extreme climate indices defined by the Expert Team on Climate Change Detection and Indices (ETCCDI) (Peterson and Manton, 2008), the relative threshold index computed from the maximum/minimum temperature in the boreal forest ecosystem growing season from 1991 to 2020 was 30°C/-4°C. Temperature extremes occur when daily maximum/minimum temperatures during the growing season are above the high threshold (30°C) or below the low thresholds (-4°C). The number of days when it occurred was defined as the number of high/low-temperature days, and the period when the number of high/low-temperature days lasted for six days or more was defined as an extreme high/low-temperature event. The effect of extreme temperatures on NEE during the growing season was characterized by the relative rate of change (α) of NEE (Tatarinov et al., 2016).
3 Result
3.1 Environmental conditions
3.1.1 Heat-related environmental factors
Ta, Ts, and PAR values of the boreal forest ecosystem demonstrated clear seasonal variations (Figure 1). The daily average Ta ranged from -34.02 to 24.11°C, and its seasonal variation was similar among different years. The daily average Ts ranged from -19.88 to 17.84°C, and its overall Ts trend was consistent with that of Ta, but the seasonal amplitude of Ts was smaller than Ta. The average Ts was higher than Ta, and the seasonal variation in Ts was smoother, exhibiting hysteresis. Ta and Ts at the end of November 2009 and January-February 2014 were lower than those in other years. The daily accumulative PAR ranged from 0.72 to 55.94 mol m-2 d-1, with a peak appearing from May to July. PAR in the growing seasons of 2011 and 2018 was usually small, which was related to excessive rainfall during the growing seasons in these years.
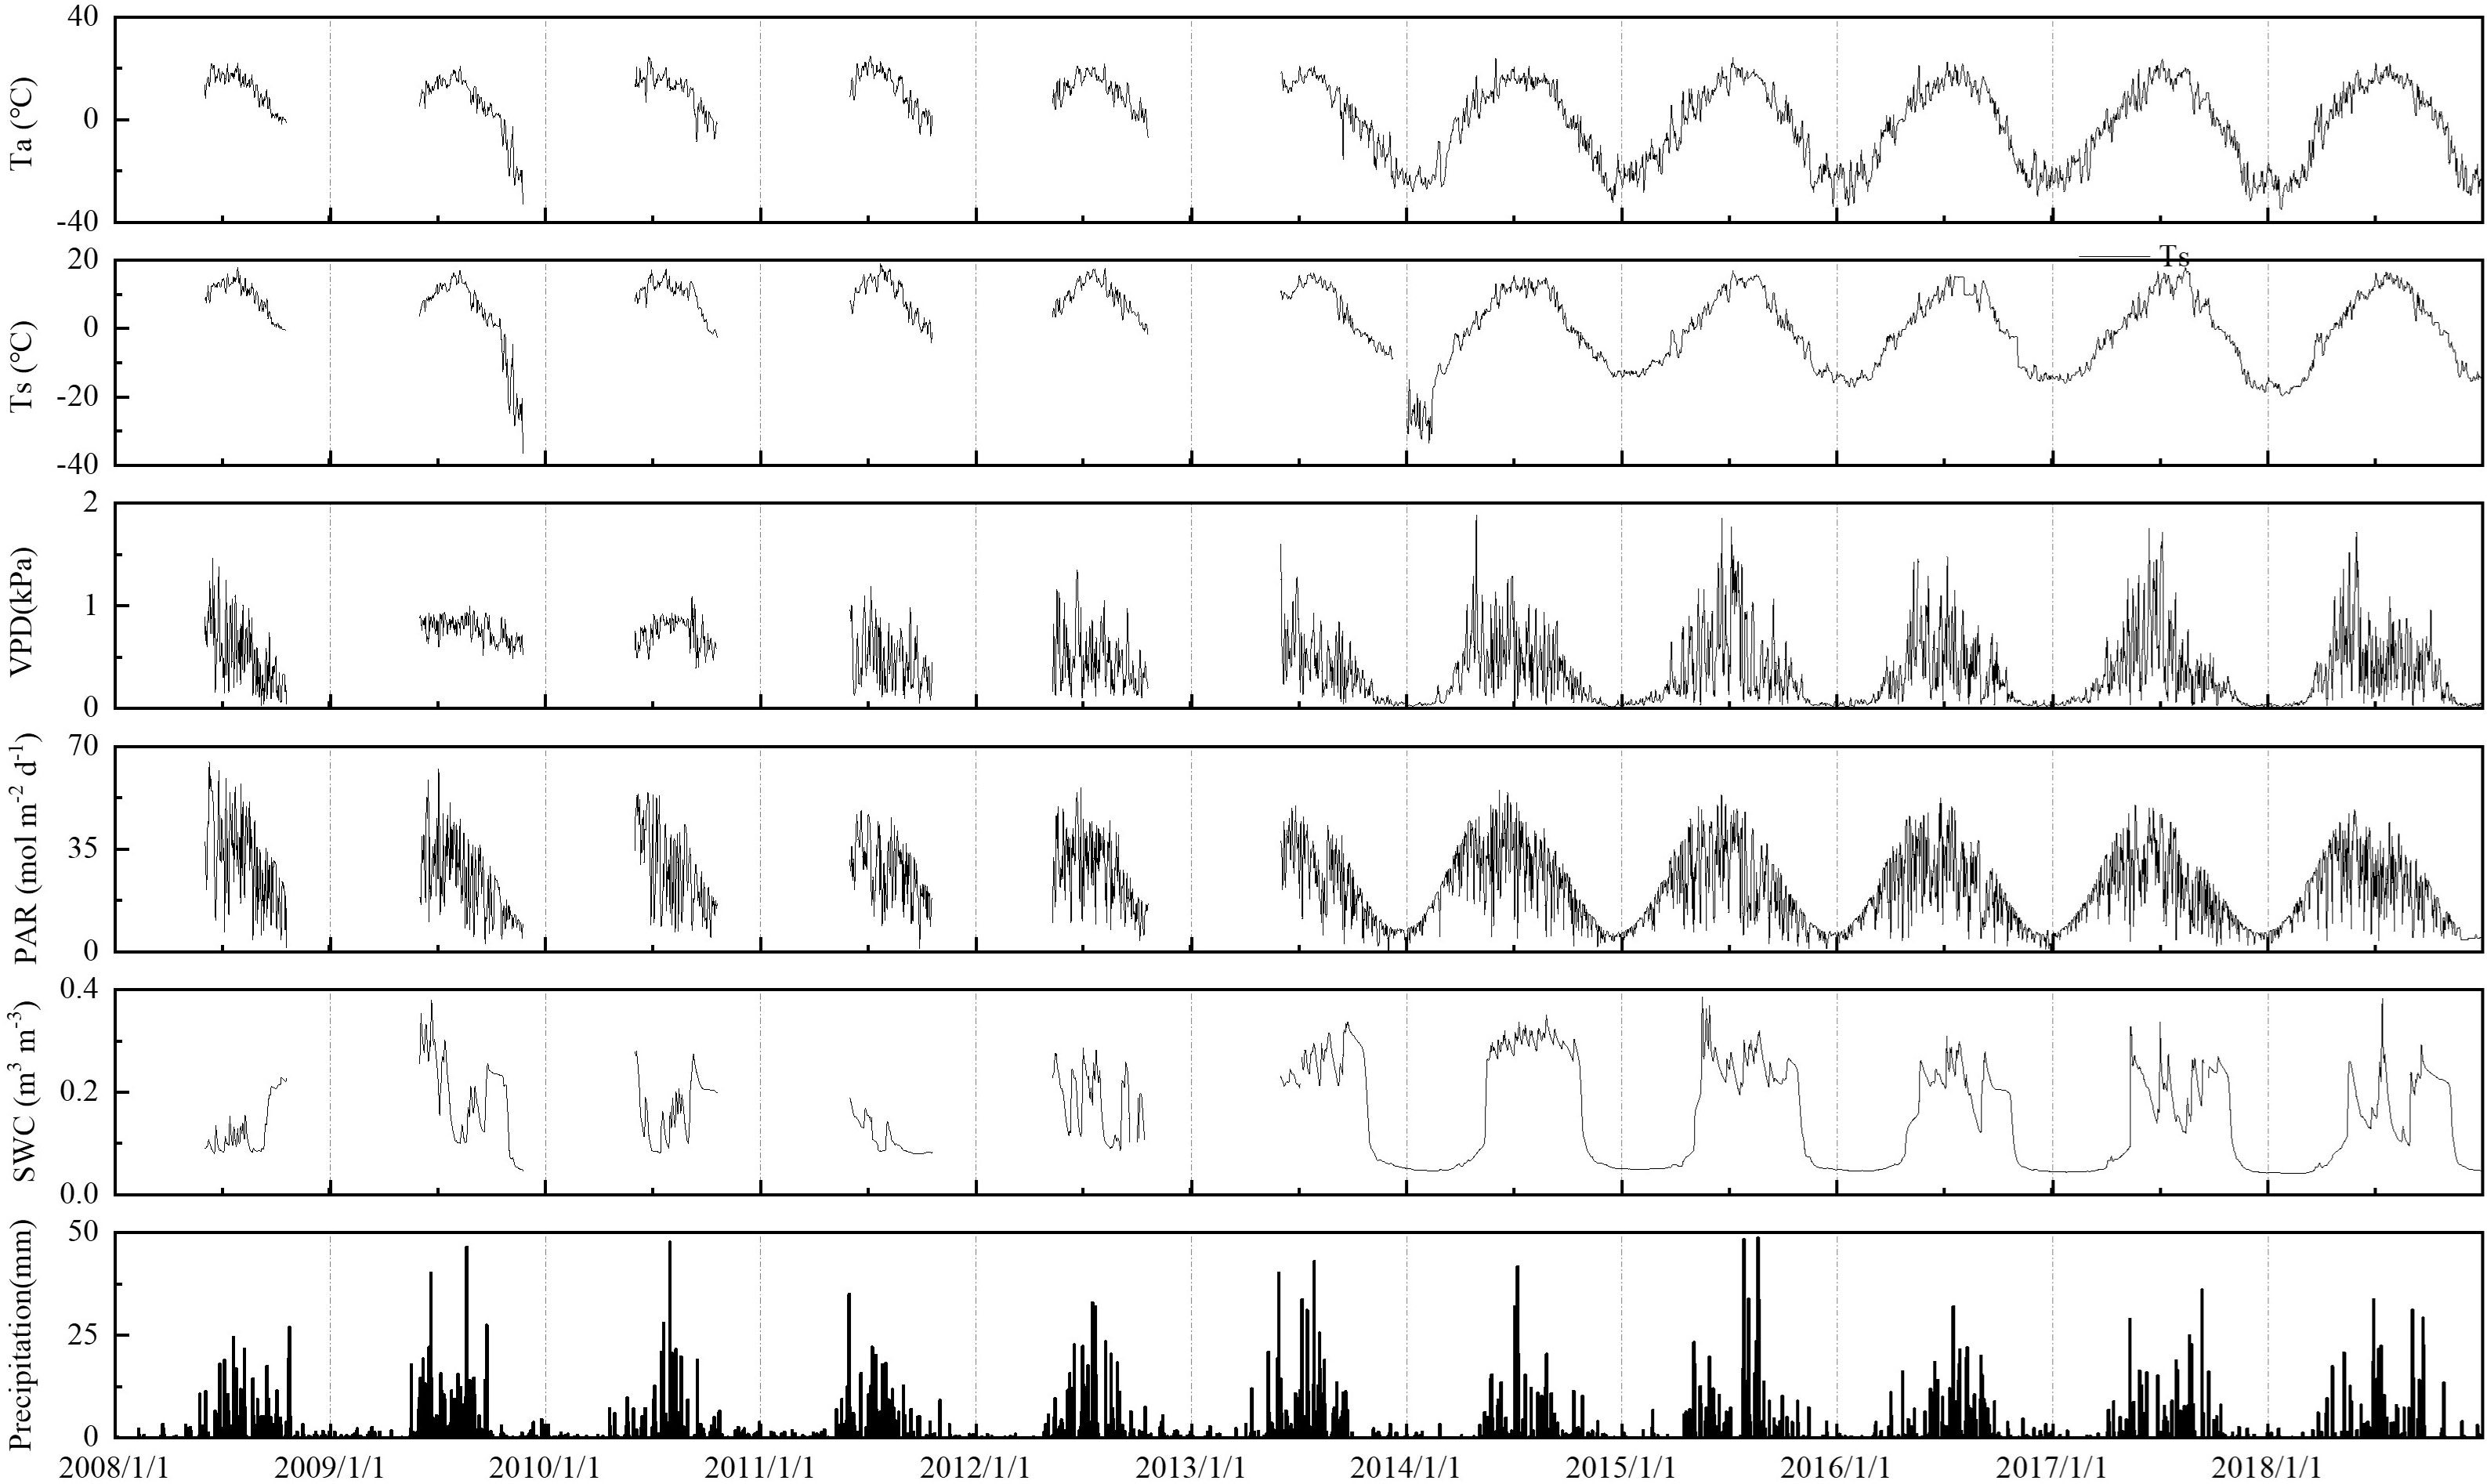
Figure 1 Dynamic changes in environmental factors in the boreal forest ecosystem. PAR, photosynthetically active radiation, VPD, vapor pressure deficit, Ta, air temperature, Ts, soil temperature, SWC, volumetric soil water content, PPT, precipitation.
3.1.2 Moisture-related environmental factors
The vapor pressure deficit (VPD) ranged from 0.13 to 1.88 kPa, and the maximum VPD value appeared from June to August. Due to heavy rains during the growing season in 2009, 2010, and 2011, the VPD was lower than 1.0 kPa. Precipitation varied greatly over the years, with more precipitation in summer, which accounted for more than 50% of the annual precipitation. The variation in the daily average SWC was closely related to precipitation and ranged from 4.1 to 34.1%. SWC in the entire growing season in 2014 remained above 25%, which was related to the greater number of rainfall days in the growing season of this year.
3.2 Diurnal variations in NEE and its environmental regulation
According to the monthly average diurnal variations in NEE, the diurnal amplitude of NEE during the growing season was noticeably higher than that in the non-growing season (Figure 2). NEE during the non-growing season demonstrated no clear diurnal variation (Figure 2A), and the boreal forest acted as a net carbon source. However, a significant diurnal pattern resembling a “U” curve (Figure 2B) was observed during the growing season, with positive values (net carbon release) at night and negative values (net carbon uptake) in the daytime. The peak of carbon uptake appeared at 8:30–9:00 in the morning, ranged from -0.03 (May) to -0.91 mg CO2 m-2 s-1 (August). The earliest time for the NEE value to switch from positive to negative was in June and July (5:30), and the longest daily carbon sequestration time (14 h) occurred in June.

Figure 2 Diurnal variations in NEE (net ecosystem CO2 exchange) on a monthly average from 2008 to 2018: (A) non-growing season, (B) growing season. Jan, January, Feb, February, Mar, March, Apr, April, Jun, June, Jul, July, Aug, August, Sep, September, Oct, October, Nov, November, Dec, December.
According to the determinative coefficient, PAR and VPD were the prominent environmental control factors, and the order of intensity of influence of each environmental factor on daytime NEE in the growing season was PAR > VPD >Ta >Ts >SWC (Table 1). The direct and indirect path coefficients of the environmental factors reflect whether the factor affects NEE majorly through direct or indirect ways. From the path coefficient value, PAR and Ta have a direct impact on NEE. The PAR direct path coefficients and Ta were -0.354 and -0.220, respectively, which were larger than their indirect path coefficients (0.016, 0.00), indicating that these two driving factors had significant effects during the daytime during the growing season. However, SWC had an indirect impact, which affected daytime NEE during the growing season by influencing other factors, but the determinative coefficient was small and the influence was not significant. There was little difference between the direct and indirect impacts of VPD and Ts. The direct and indirect path coefficients of VPD were 0.392 and -0.344, respectively, which inhibited CO2 uptake. Ts had equivalent direct and indirect effects on NEE and their combined effects contributed to CO2 uptake.
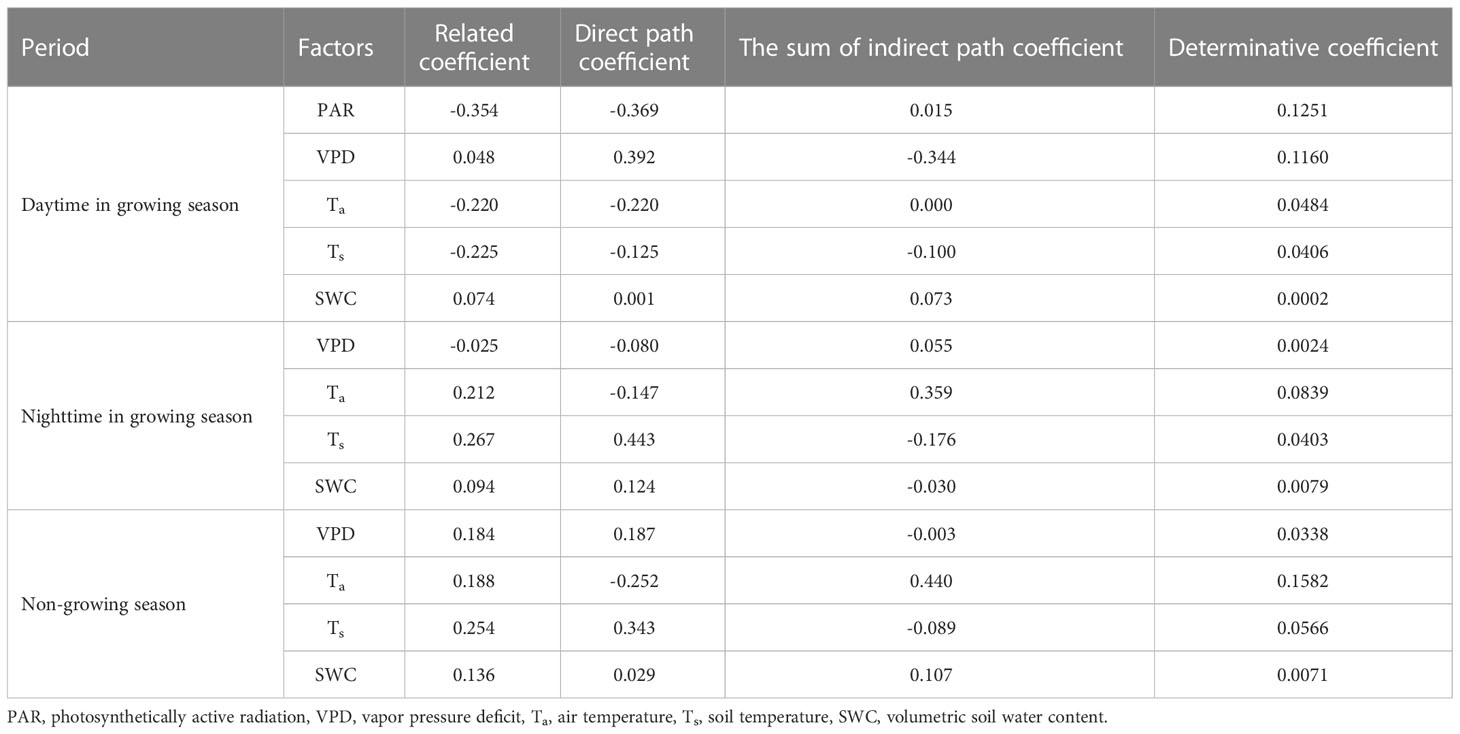
Table 1 Direct and indirect path coefficients of environmental factors on NEE (net ecosystem CO2 exchange) diurnal variation.
Temperature had the greatest impact on NEE during the growing season at night and during the non-growing season (Table 1). In general, ecosystem respiration is more active and releases more CO2 at high temperatures. According to the determinative coefficient, the effect of Ta on NEE was majorly indirect, by affecting Ts and VPD, whereas that of Ts was direct. Additionally, during the non-growing season, NEE was majorly affected by Ta and was relatively less affected by Ts.
3.3 Seasonal variations in NEE and its environmental regulation
The boreal forest station initially only observed fluxes in the growing season, and carbon fluxes have been observed throughout the year since 2014. The seasonal variations in NEE and its environmental regulation were evaluated based on data from 2014 to 2018. The seasonal variation in NEE in boreal forests demonstrated a unimodal curve (Figure 3), which indicated it to be a CO2 source during the non-growing season and a CO2 sink during the growing season. Boreal forests began to germinate in early May, and as the leaves grew, photosynthesis and respiration were both enhanced, but the respiration rate was higher than that of photosynthesis, resulting in a small CO2 emission peak (5.69 ± 1.75 g CO2 m-2 d-1) in late May. The CO2 uptake in boreal forests usually peaked in early July (-20.35 ± 2.91 g CO2 m-2 d-1). The growth of the boreal forests decelerated at the end of August, with the net carbon uptake gradually decreasing. In mid-September, boreal forests switched from carbon sinks to sources and reached their peak CO2 emissions (7.58 ± 2.08 g CO2 m-2 d-1) in late September. The plants entered dormancy from October to April of the following year and the metabolic activity of the ecosystem was minimal. During the non-growing season, there was no discernible variation in CO2 flux, with the NEE varying from 0 to 3.5 g CO2 m-2 d-1.
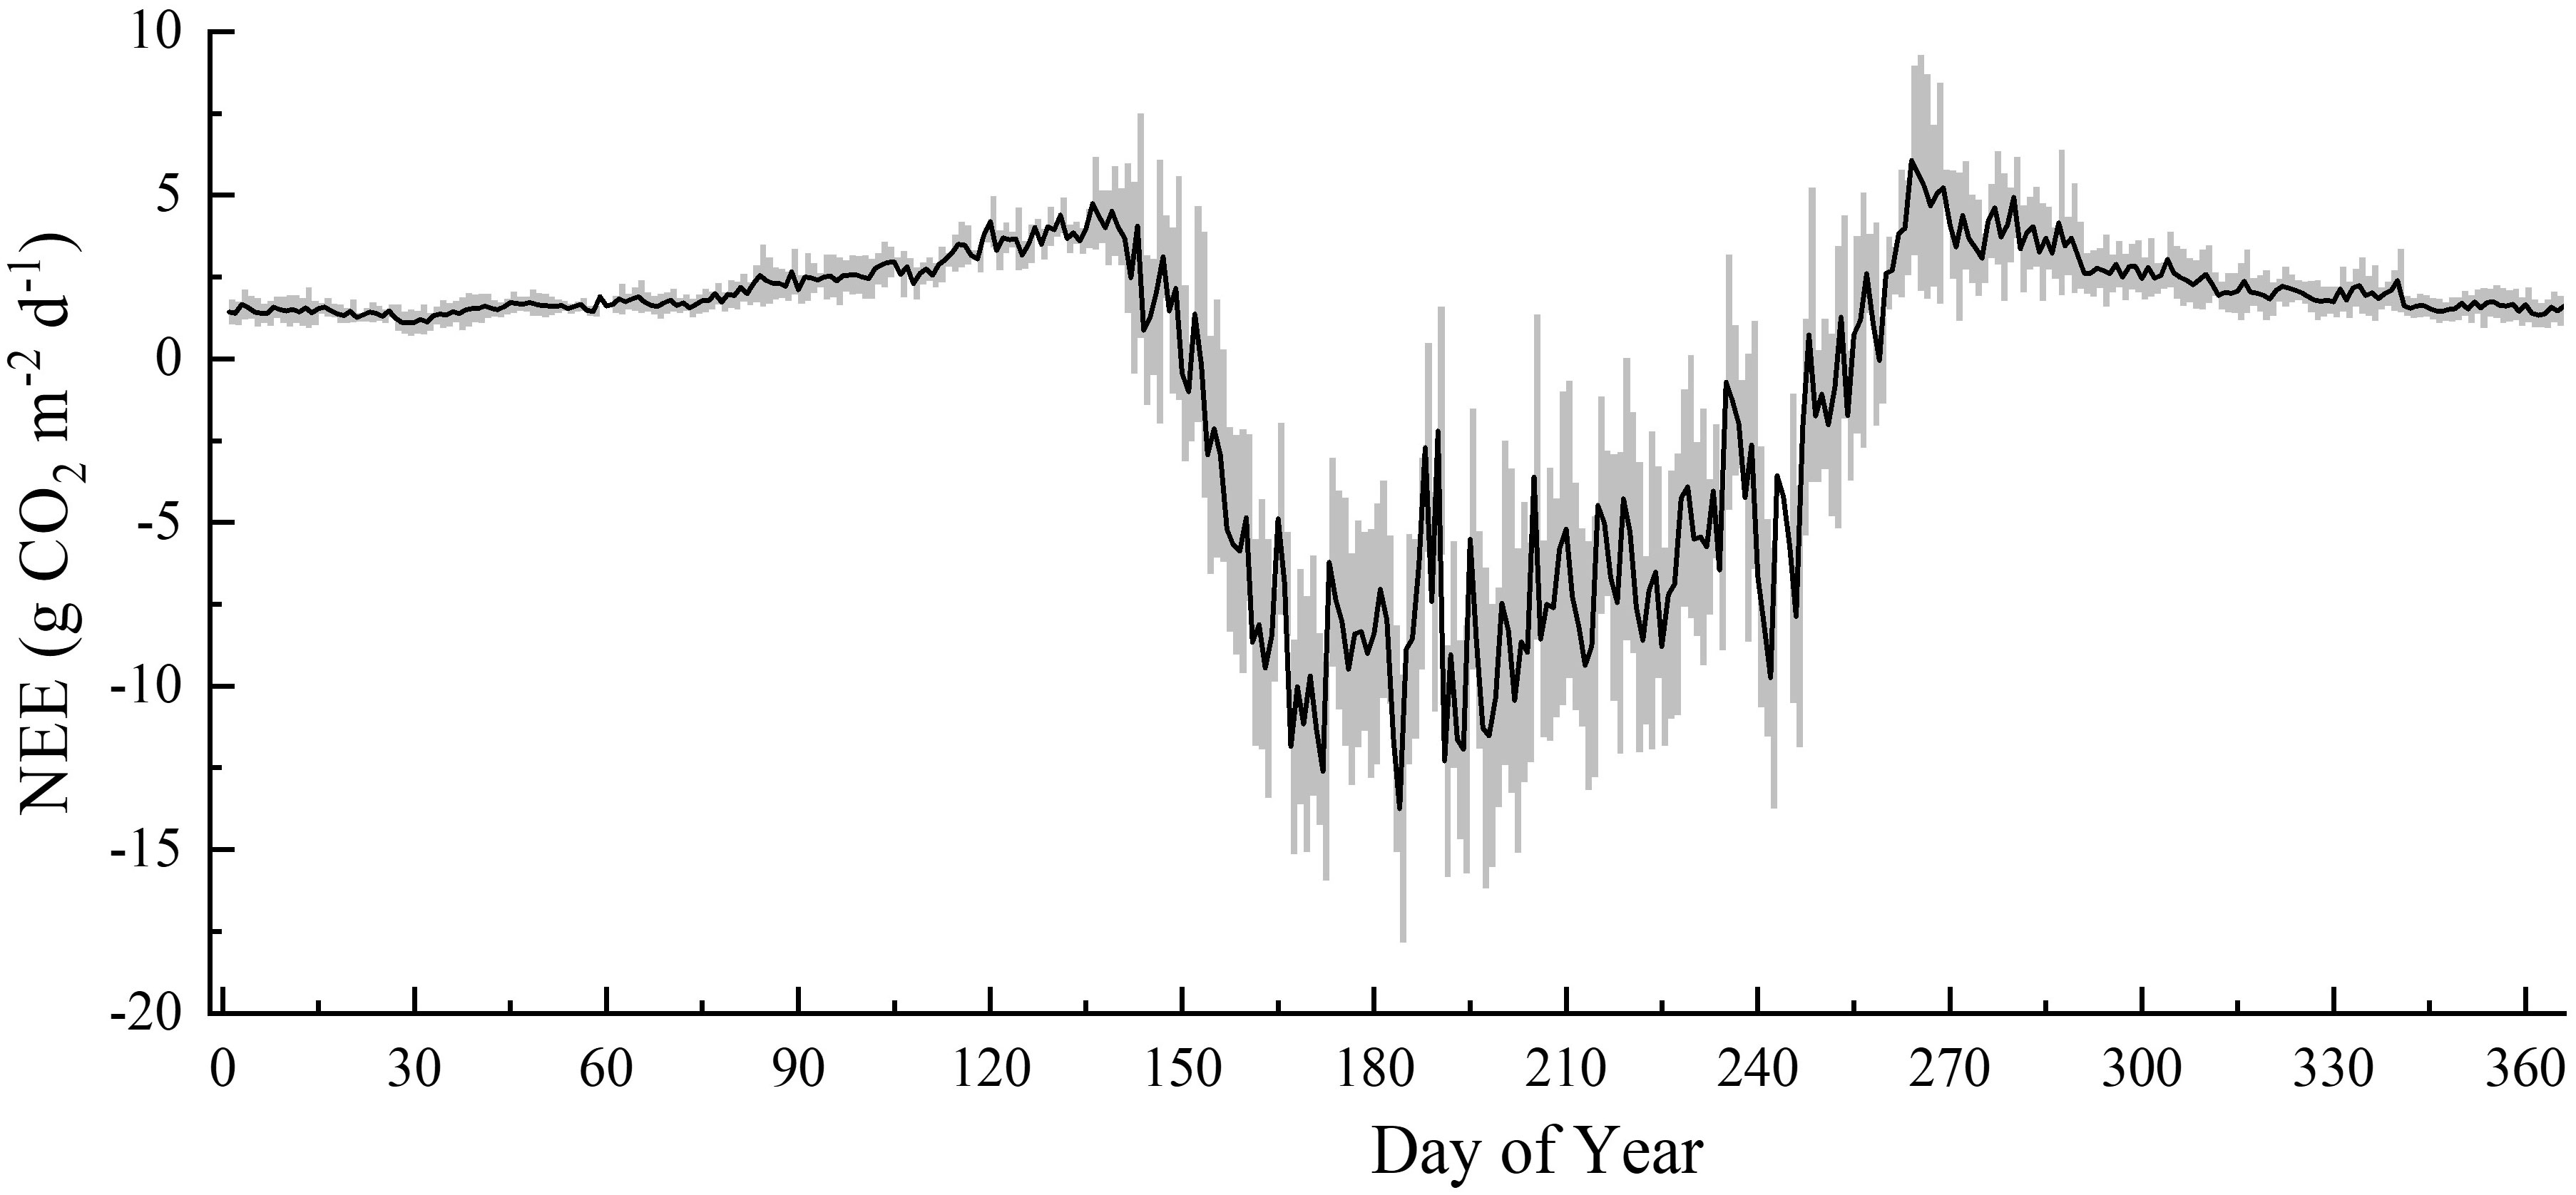
Figure 3 Average daily NEE (net ecosystem CO2 exchange) seasonal variation from 2014 to 2018.
During the growing season, Ta was the dominant controlling factor for seasonal variation in NEE in boreal forests, followed by PAR. On a daily scale, the boreal forests carbon uptake increased with increasing Ta and PAR (Table 2). Ta exerted a direct effect on the seasonal variation in NEE, whereas PAR had a greater indirect effect. During the non-growing season, the daily NEE was predominantly influenced by Ts and SWC, both of which positively encouraged CO2 release, exerting direct effects on the NEE.
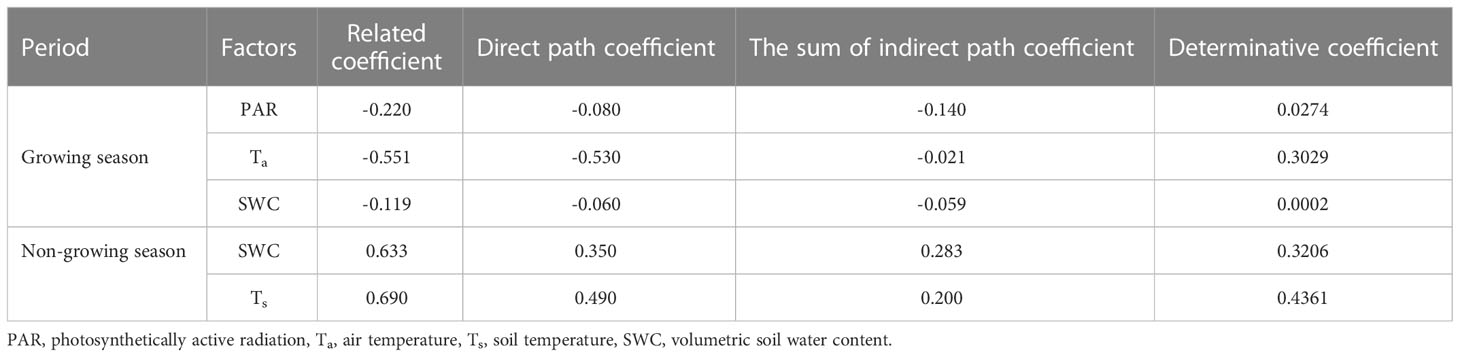
Table 2 Direct and indirect path coefficients of environmental factors on NEE (net ecosystem CO2 exchange) seasonal variation.
3.4 Interannual variations in NEE and its environmental regulation
On an annual scale, boreal forest ecosystems are carbon sinks for atmospheric CO2 (Table 3). The mean NEE accumulation in the growing season from 2008 to 2018 (2013 was excluded) was -676.01 (± 134.07) g CO2 m-2 growing season-1, and mean annual carbon budget from 2014 to 2018 was -64.01 (± 24.23) g CO2 m-2 yr-1. There were no significant relationships between the environmental factors and annual cumulative NEE. However, the yearly NEE anomalies during the growing season (NEEg) were significantly correlated with the maximum CO2 uptake rate (MCU) (p < 0.001; Figure 4A) and maximum CO2 release rate (MCR) anomalies (p < 0.01; Figure 4B) but not with the carbon uptake period (CUP) anomalies (p = 0.182; Figure 4C).
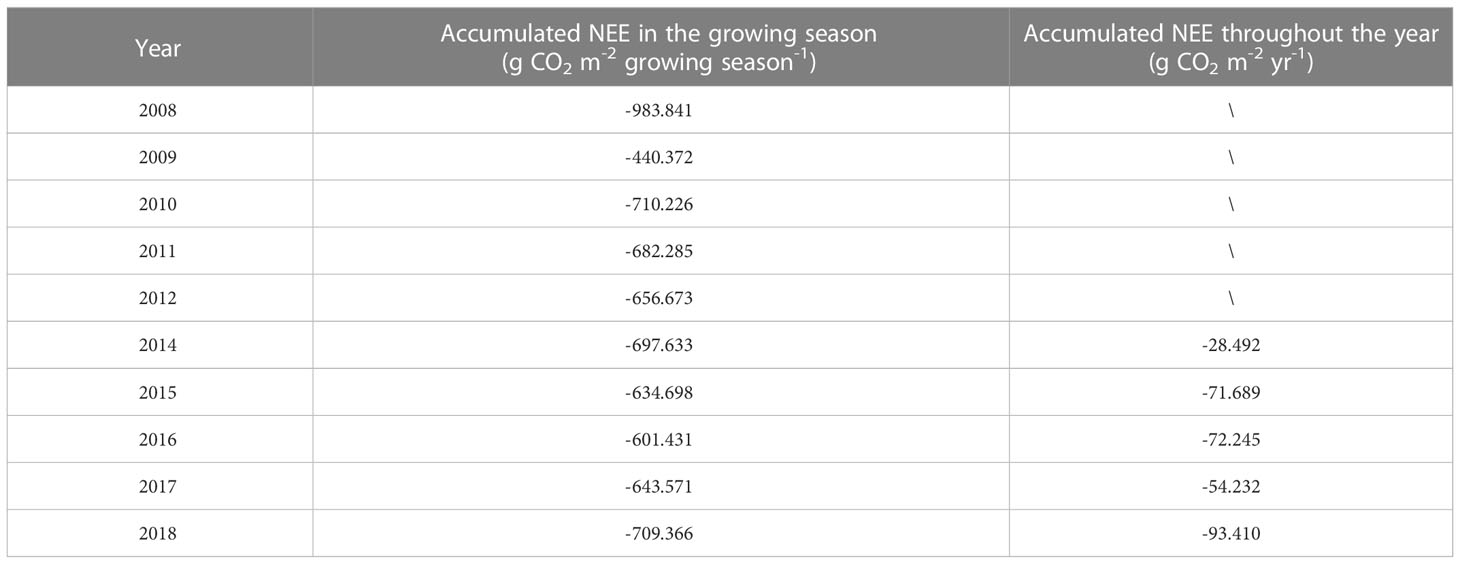
Table 3 Interannual variation in cumulative NEE (net ecosystem CO2 exchange) during the growing season and throughout the year.
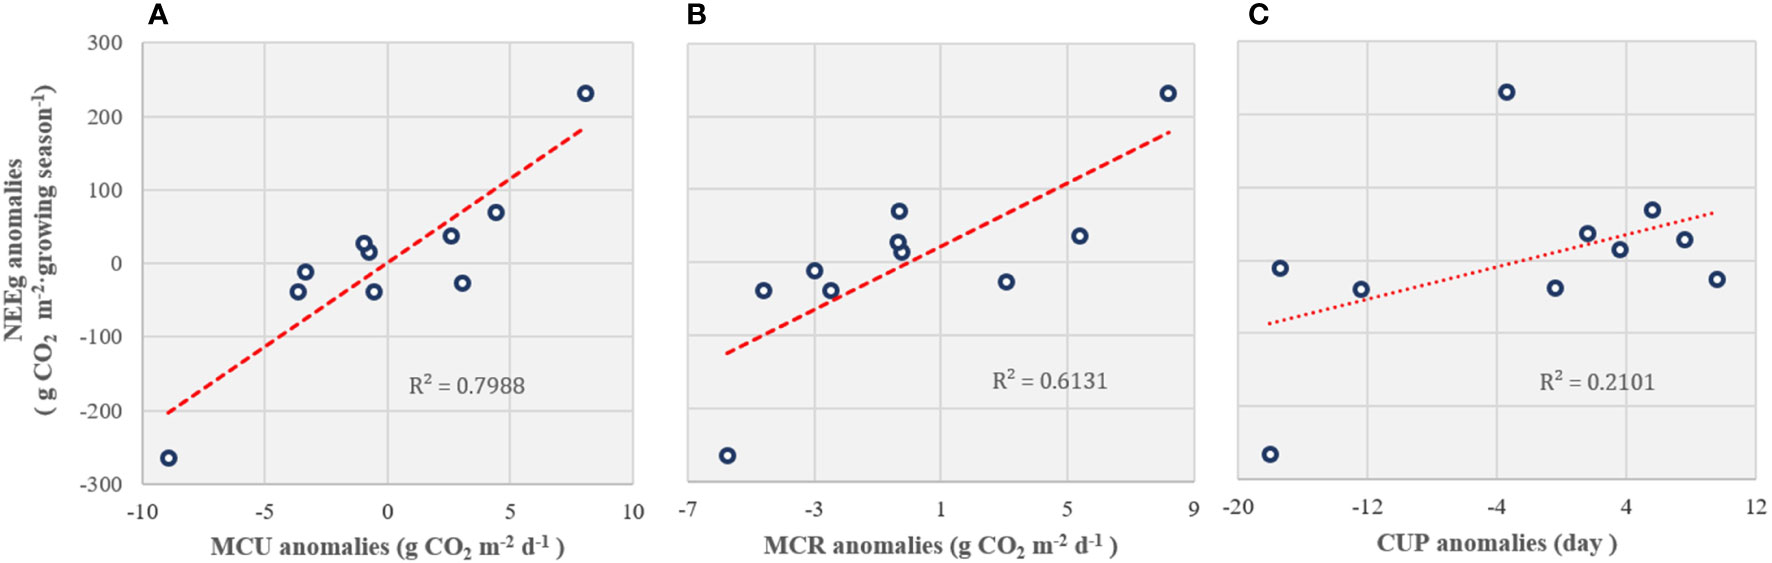
Figure 4 The relationship between the carbon flux (NEEg) anomalies during the growing season and (A) the maximum CO2 uptake rate (MCU), (B) maximum CO2 release rate (MCR), and (C) carbon uptake period (CUP) anomalies.
3.5 Impact of extreme temperature events on NEE
The boreal site experienced extremely high temperatures for 5–24 d during each growing season from 2014 to 2018 (Table 4). The cumulative growing-season NEE was found to decrease only in 2014, 2015, and 2017 when the number of extreme high-temperature days lasted long enough to form an extreme heat event. Conversely, the cumulative growing-season NEE did not decrease in 2016 and 2018, when the number of consecutive days of extremely high temperatures was insufficient to form an extreme heat event. After a short period of extreme high temperatures, the NEE recovered quickly and the cumulative NEE in the growing season increased. In comparison, the effect of extremely low temperatures on NEE was different. The occurrence of extreme low-temperature days lead to a decrease in the cumulative growing-season NEE even if it did not last long enough to constitute an extreme low-temperature event. The decreasing percentage of NEE increased with the number of extreme low-temperature days (Table 4).
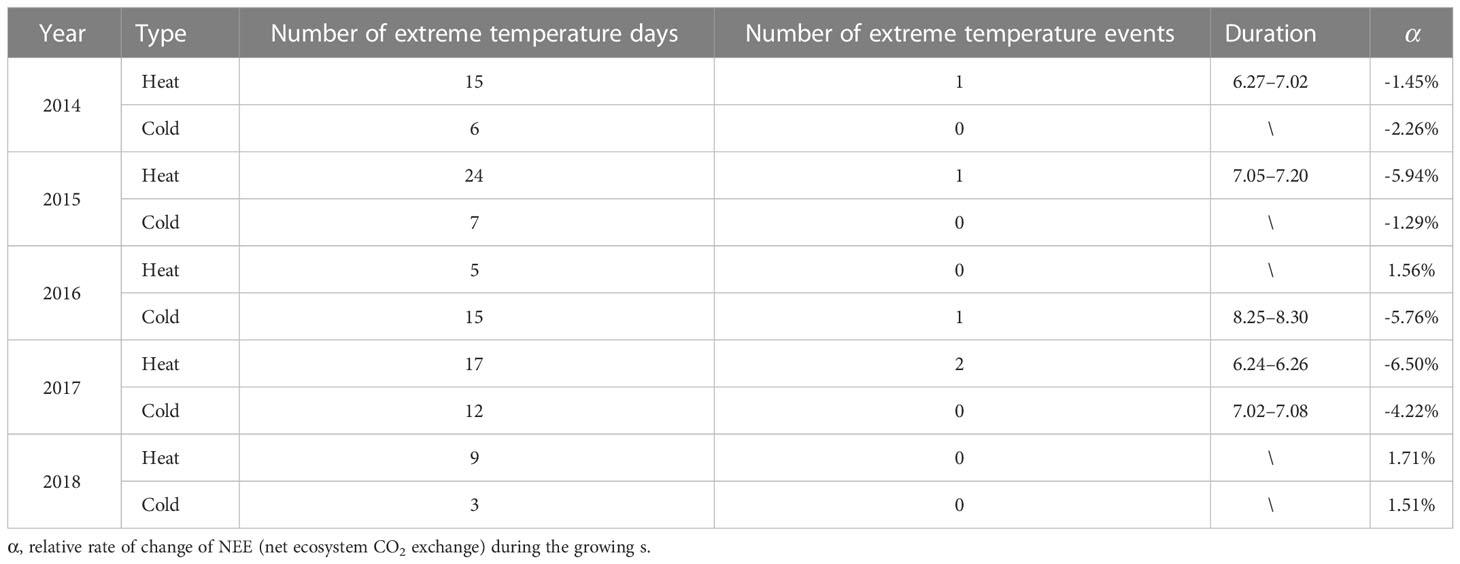
Table 4 Extreme temperature day/event and their effects on cumulative NEE (net ecosystem CO2 exchange) during the growing season.
4 Discussion
4.1 Magnitude of NEE
Owing to variations in ecosystem types, climatic conditions, and subsurface materials, NEE diurnal variation typically exhibits distinct patterns and magnitudes (Zhou et al., 2009, Wu JK et al., 2020, Zhang et al., 2020). In this study, the diurnal NEE dynamics in the boreal forest ecosystem displayed a single peak curve, and the peak CO2 uptake period occurred between 8:30 and 9:30 in the morning. This is consistent with previous studies of Korean pine and boreal-leaved mixed forests in the Changbai Mountains (Guan et al., 2006). The maximum carbon uptake rate at this research site during the growing season attained -1.068 mg CO2 m-2 s-1, which is substantially larger than those reported for a Larix gmelinii forest in Central Siberia (-0.475 mg CO2 m-2 s-1, Nakai et al., 2008), and for a hemiboreal forest ecosystem in Estonia (-0.792 mg CO2 m-2 s-1, Rebane et al., 2020), but is similar to that from a Larix gmelinii forest in Daxing’anling Mountains (-1.09 mg CO2 m-2 s-1, Li and Zhang, 2015).
In our study, the seasonal variation in NEE was a U-shaped curve with a peak from June to July, which is consistent with earlier studies (Welp et al., 2007; Gill et al., 2015; Frelich et al., 2021). However, higher temperatures (17.54°C in August 2015 and 17.33°C in August 2017 compared to the 30-year average value of 15.38°C from 1991 to 2020) and ample precipitation (221.4 mm in August 2015 and 155.6 mm in August 2017 compared to the 30-year average value of 115.1 mm from 1991 to 2020) led to the occurrence of an additional small peak in August of 2015 and 2017. In the growing season from 2008 to 2018 (2013 was excluded), the average daily NEE accumulation was -4.69 (± 13.07) g CO2 m-2 d-1, which was within the range reported in previous studies (Table 5).
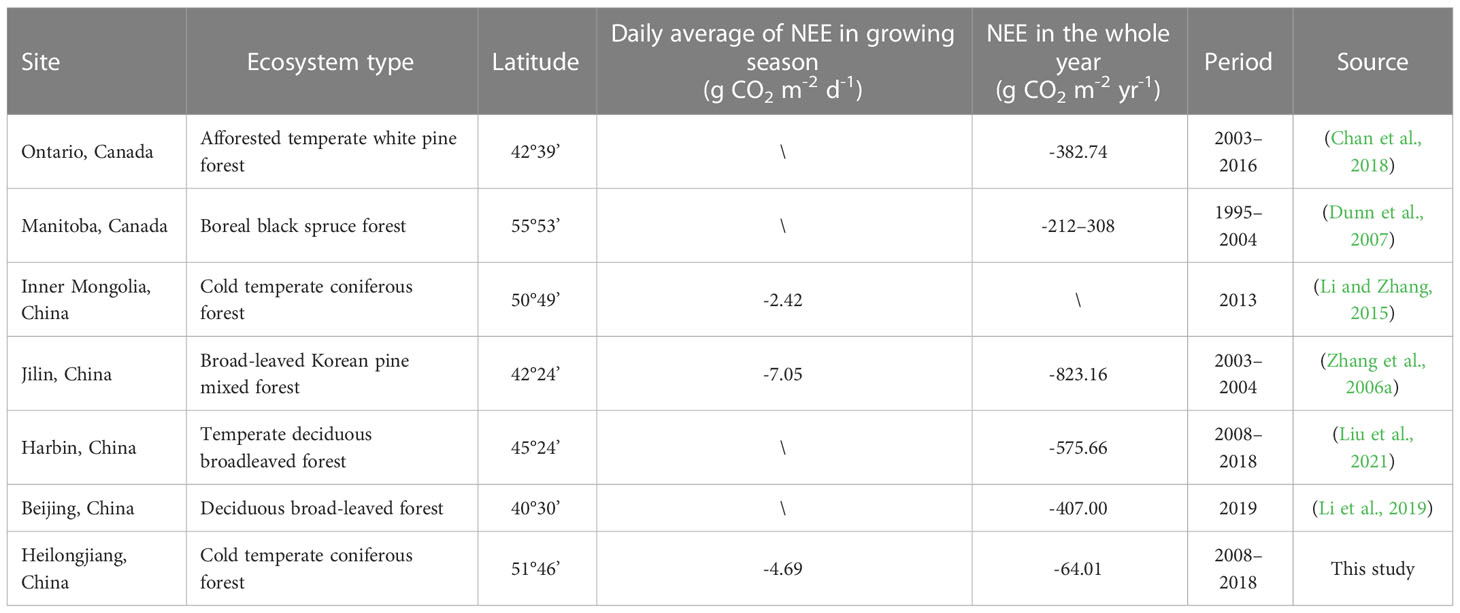
Table 5 Comparison of growing season and annual CO2 budget among diverse forest ecosystems.
The boreal forest had an annual CO2 budget of -64.01 ± 24.23 g CO2 m-2 yr-1 over the studied years, and it acted as a CO2 sink. Previous studies on the forest ecosystems annual CO2 budget had a variety of magnitude values, most of which were carbon sinks (ranging from -382.74 g to -823.16 g CO2 m-2 yr-1). A few of them shifted from a carbon source to a sink, such as the boreal black spruce forest in Manitoba, Canada (Table 5). Comparatively, the boreal forest in this study was a relatively small carbon sink, mostly due to the colder climate and shorter growing season at higher latitudes.
4.2 Environmental regulations of NEE variations
4.2.1 Effects of radiation on NEE
Radiation, particularly PAR, has a significant impact on ecosystem photosynthesis and consequently, NEE (Baldocchi, 2014; Wang Y et al., 2019). This study also demonstrated that PAR elucidated most of the variance in half-hourly daytime NEE during the growing season (Table 1) and that the Michaelis–Menten model was a good fit to the relationship between daytime NEE and PAR (r2 > 0.76, p < 0.01; details in Table 6 and Figure 5). The parameters estimated from the model, including the initial light utilization rate (α), maximum photosynthetic rate (Amax), and daytime respiration intensity (Rd), are usually used as plant photosynthetic capacity indicators. In this study, the α values ranged from 0.0009 to 0.0019 mg CO2 μmol photon-1, with its maximum value (0.0019 mg CO2 μmol photon-1) appearing in June; Amax ranged from 0.0985 to 0.4995 mg CO2 m-2 s-1, with its maximum value appearing in July (0.4995 mg CO2 m-2 s-1), Rd ranged from 0.0994 to 0.1555 mg CO2 m-2 s-1, with its maximum value appearing in June (0.1555 mg CO2 m-2 s-1). Therefore, ecosystem carbon models should take into account the seasonal dynamics of photosynthetic capacity parameters to accurately estimate the carbon budget. Among them, Amax represents photosynthesis intensity in the ecosystem under saturated light intensity and reflects the impact of biochemical processes and physiological conditions on photosynthesis in the ecosystem (Zhou et al., 2017). Amax of boreal forests in this study was lower than that in previous studies, which could account for the comparatively low yearly carbon uptake of boreal forests (Li and Zhang, 2015; Li et al., 2019; Wang Q et al., 2019).
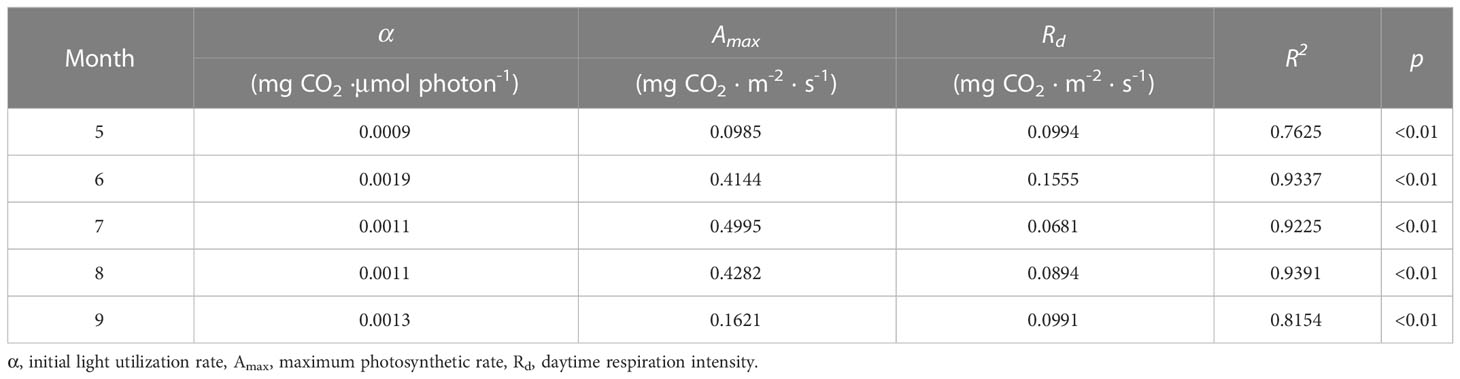
Table 6 Parameters of NEE (net ecosystem CO2 exchange) light response curves during the growing seasons in the boreal forest ecosystem.
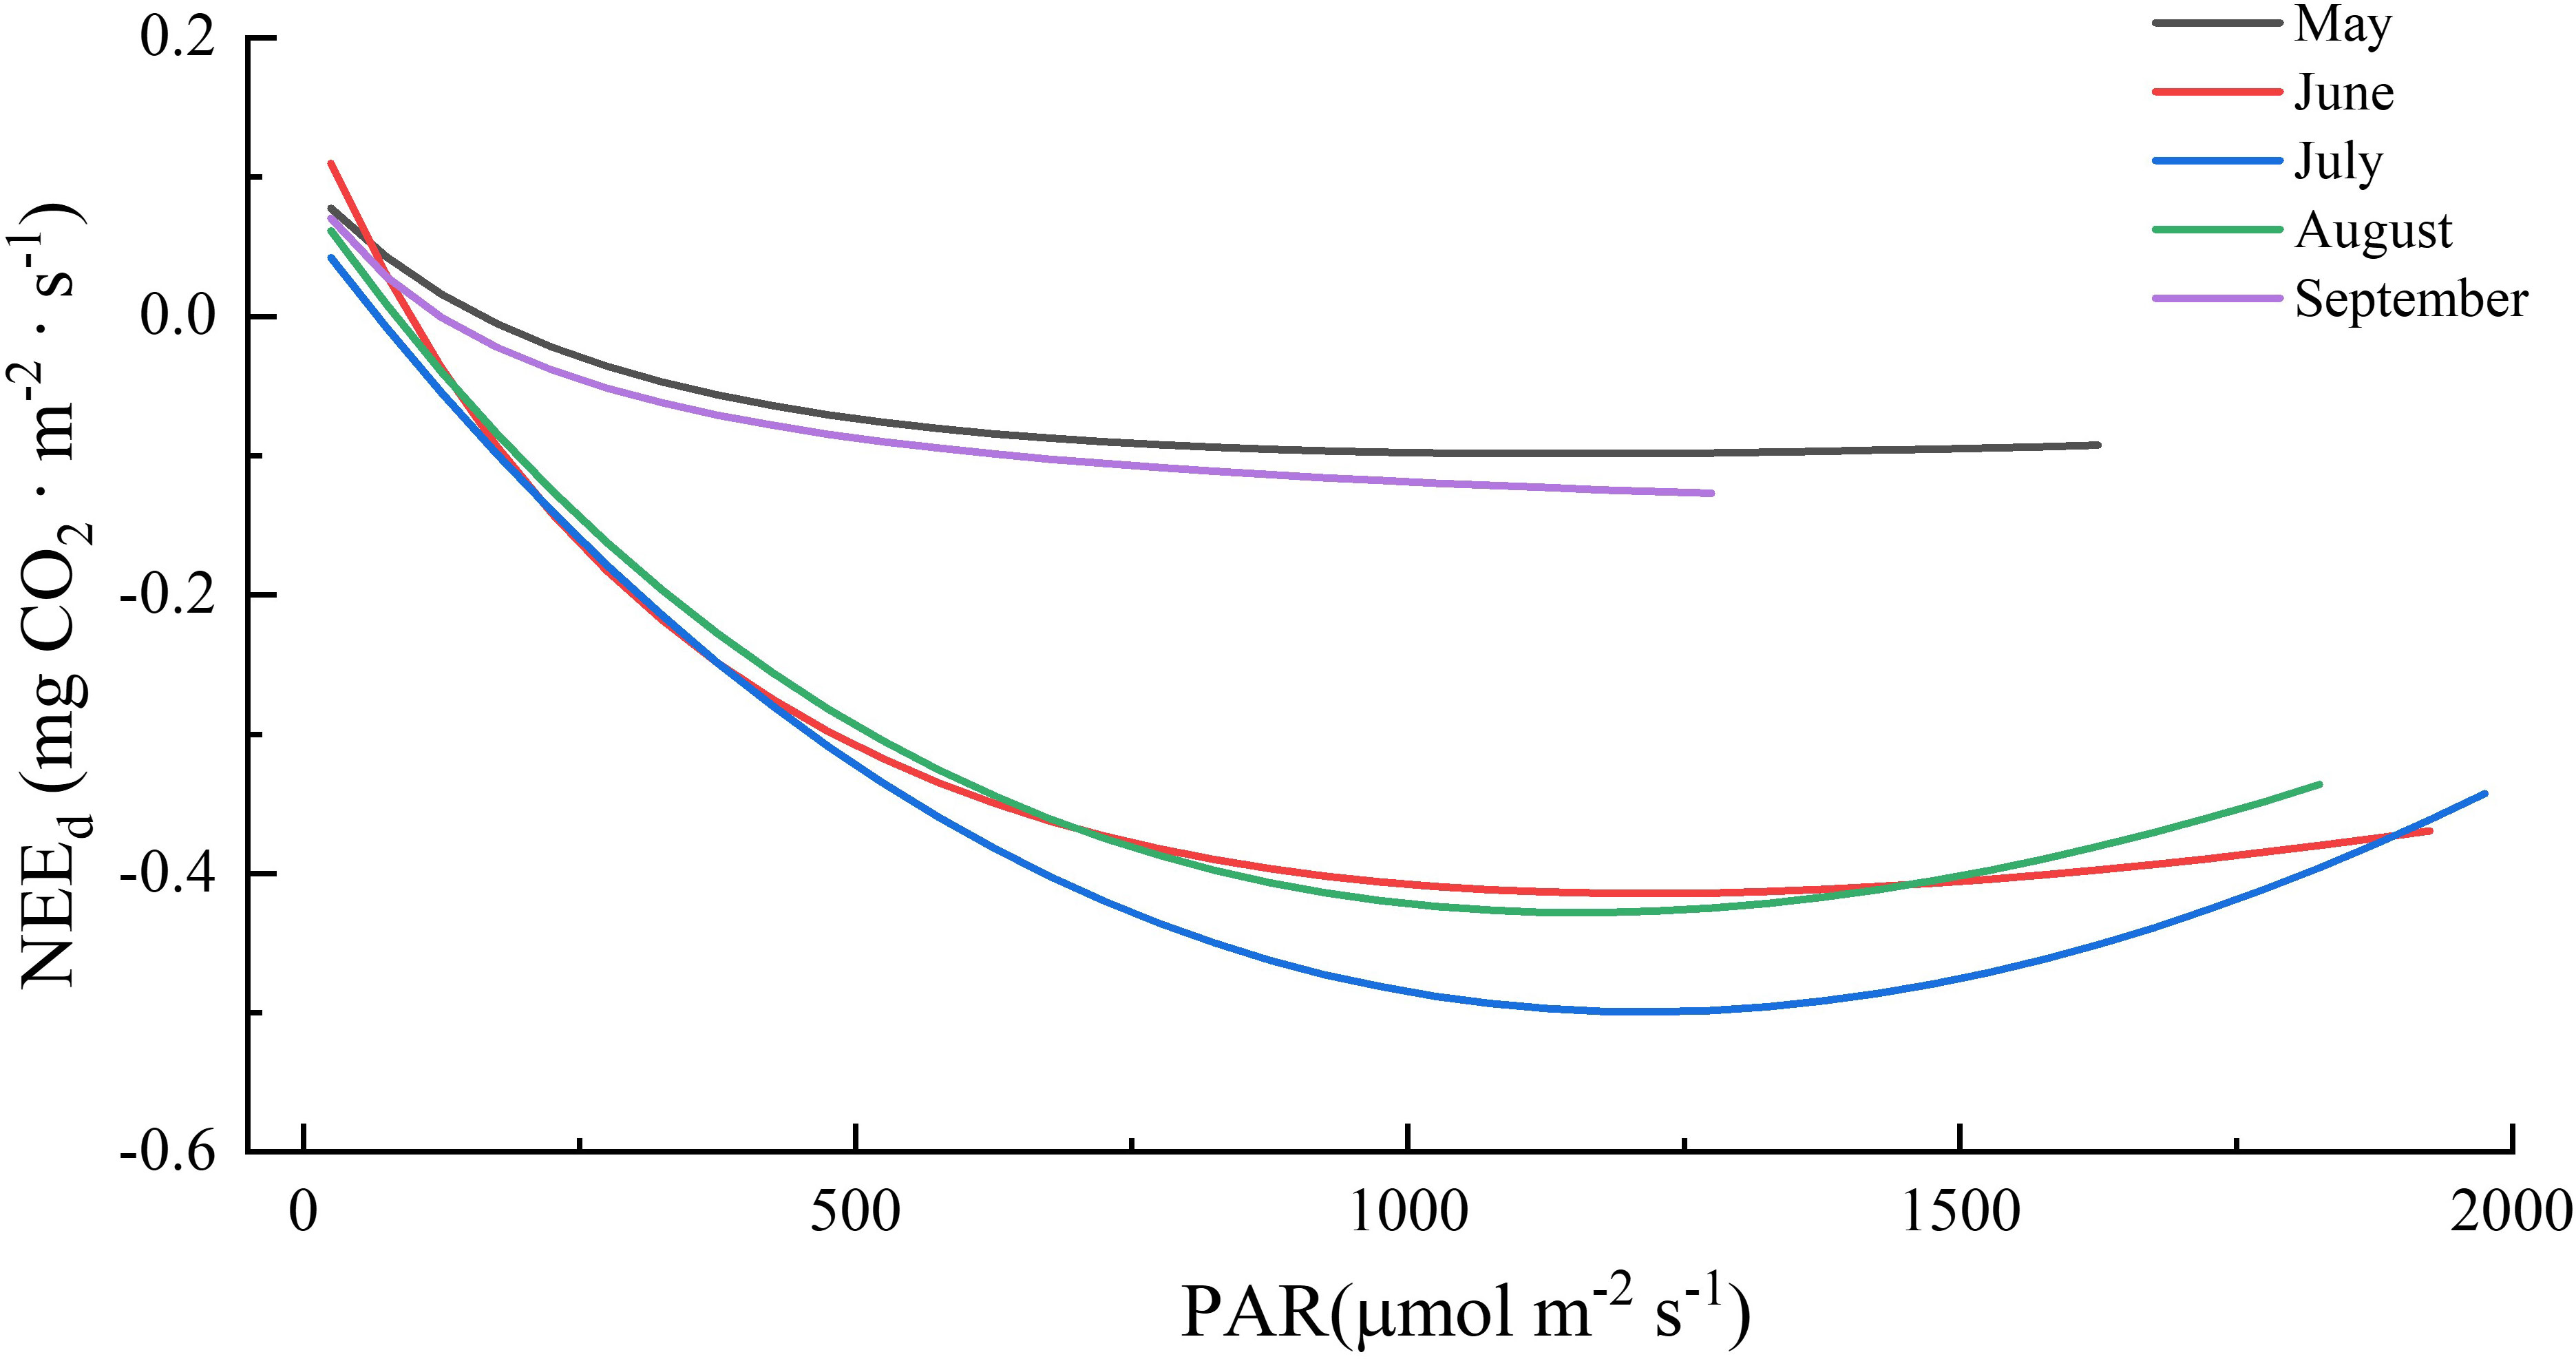
Figure 5 Responses of NEEd (net ecosystem CO2 exchange in the daytime) to photosynthetically active radiation (PAR) during the growing seasons in boreal forest ecosystem.
4.2.2 Effects of temperature on NEE
Temperature was the most important controlling factor for night NEE in the growing season and for the NEE in the non-growing season (Table 1). We determined the model parameters for each month using the Lloyd and Taylor model for simulating the response of ecosystem respiration to varying soil temperatures (Table 7). Respiration at the reference temperature (RTref) gradually increased as the temperature rose, peaking in July; except for May, wherein in the initial growth stage, the temperature sensitivity (Q10) continuously decreased as the temperature increased (Chen et al., 2010; Han and Jin, 2018). As a result, Q10 was higher during the non-growing season than during the growing season. The rapid increase in the root and rhizosphere respiration rates at the beginning of the growing season might be the cause of the increased Q10 in May (Shabaga et al., 2015).
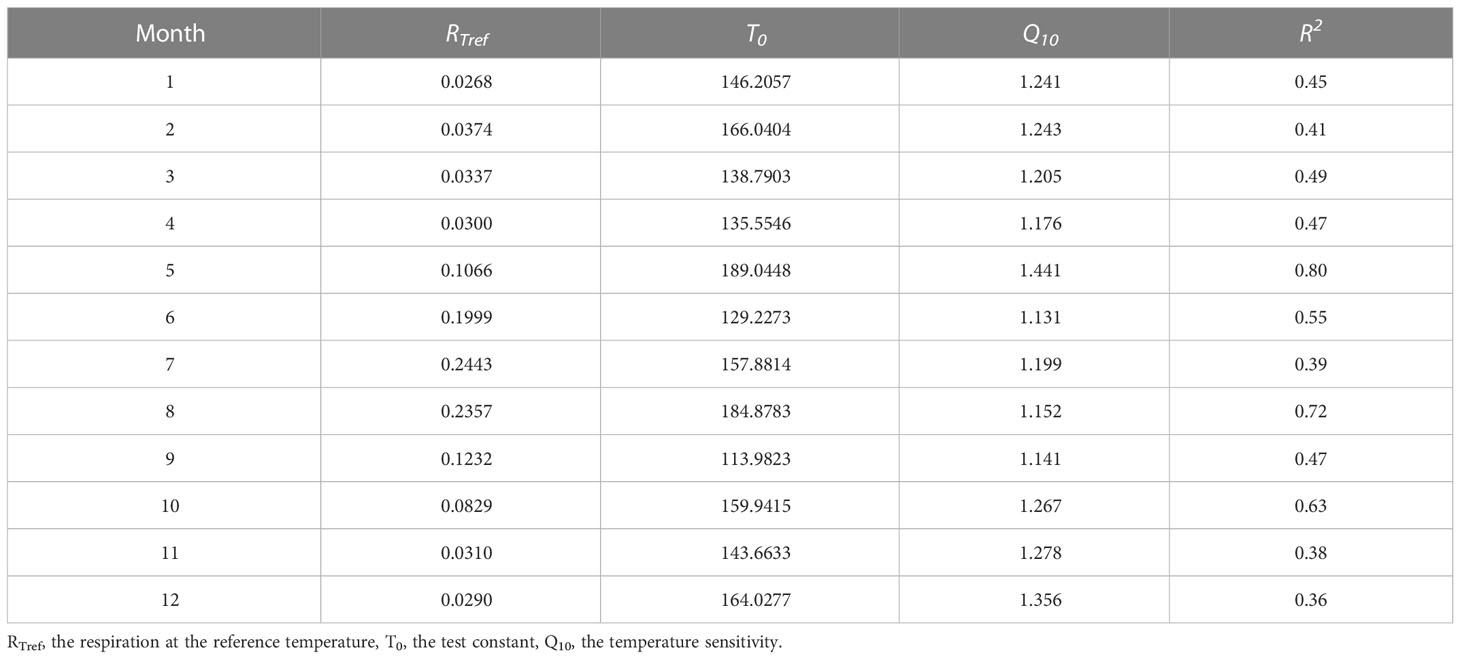
Table 7 Monthly respiration-temperature response equation parameters of boreal forest ecosystems.
4.2.3 Effects of extreme temperature on NEE
Extreme temperatures have diverse effects on ecosystem photosynthesis and respiration; the net carbon uptake in the growing season is reduced when the adverse impact on photosynthesis is greater than that on respiration (Tatarinov et al., 2016; Krasnova et al., 2022). For example, in the Qianyanzhou subtropical coniferous forest, an extreme heat event lasting 36 days resulted in a 6.7% decrease in the annual ecosystem carbon uptake (Zhang et al., 2018). In a mixed conifer-broadleaved forest in Southern Estonia, an extreme high-temperature event that lasted for 19 days in 2018 caused the forest to change from a carbon sink to a carbon source (Krasnova et al., 2022). In this study, we found that the impact of extreme temperatures on carbon uptake was related to its duration and intensity. When extreme temperature events with short durations occur, if the temperature and water conditions in the early and late stages are suitable, the forest will maintain better resilience, and the net carbon uptake will reach the original level (Ciais et al., 2005; Zhang et al., 2018). For example, in the studied boreal forest, the cumulative growing season NEE did not decrease in 2016 and 2018 when the number of consecutive days of extreme high temperatures was insufficient to form an extreme heat event. Meanwhile, given that extreme temperature events often occur together with extreme drought, it is essential to evaluate the changes in carbon uptake under the synergy of the two (Wu HD et al., 2020, Yan et al., 2020).
5 Conclusion
The boreal forest ecosystem served as a weak carbon sink with an annual average NEE accumulation (2014–2018) of -64.01 ( ± 24.23) g CO2 m-2 yr-1 and growing season average (2008–2018; 2013 was excluded) of -676.01 (± 134.07) g CO2 m-2 growing season-1. Additionally, diurnal, seasonal, and interannual variations in NEE had obvious dynamic characteristics. In the growing season, PAR was the primary controlling factor of daytime NEE on a half-hourly scale, whereas Ta dominated the seasonal NEE variation on a daily scale. Conversely, Ts consistently had the greatest effect on non-growing season NEE across the half-hourly and daily scales. The interannual variation in NEE in the growing season was significant in relation to the MCU but not to the environmental factors and CUP. Extreme temperature events can reduce boreal forests carbon uptake, and the impact of extreme temperature on carbon uptake during the growing season is related to its duration and intensity.
Data availability statement
The original contributions presented in the study are included in the article/supplementary material. Further inquiries can be directed to the corresponding authors.
Author contributions
Conceptualization, LZ and GZ; methodology, YY and LZ; investigation, JS, YY and SZ; data curation, JS MZ and YW; writing—original draft preparation, YY; funding acquisition, LZ and GZ. All authors contributed to the article and approved the submitted version.
Funding
This research was funded by National Science and Technology Basic Resources Survey Program of China, grant number 2019FY101302, National Natural Science Foundation of China, grant number 42141007, and China Meteorological Administration Innovation Development Special Project, grant number CXFZ2022P055.
Acknowledgments
The authors wish to acknowledge Bingrui Jia for the field work.
Conflict of interest
The authors declare that the research was conducted in the absence of any commercial or financial relationships that could be construed as a potential conflict of interest.
Publisher’s note
All claims expressed in this article are solely those of the authors and do not necessarily represent those of their affiliated organizations, or those of the publisher, the editors and the reviewers. Any product that may be evaluated in this article, or claim that may be made by its manufacturer, is not guaranteed or endorsed by the publisher.
References
Baldocchi, D. (2014). Measuring fluxes of trace gases and energy between ecosystems and the atmosphere - the state and future of the eddy covariance method. Global Change Biol. 20, 3600–3609. doi: 10.1111/gcb.12649
Baul, T. K., Alam, A., Ikonen, A., Strandman, H., Asikainen, A., Peltola, H., et al. (2017). Climate change mitigation potential in Boreal forests: Impacts of management, harvest intensity and use of forest biomass to substitute fossil resources. Forests 8 (11), 455. doi: 10.3390/f8110455
Bonan, G. B. (2008). Forests and climate change: Forcings, feedbacks, and the climate benefits of forests. Science 320, 1444–1449. doi: 10.1126/science.1155121
Bosch, A., Schmidt, K., HE, J. S., Doerfer, C., Scholten, T. (2017). Potential CO2 emissions from defrosting permafrost soils of the qinghai-Tibet plateau under different scenarios of climate change in 2050 and 2070. Catena 149, 221–231. doi: 10.1016/j.catena.2016.08.035
Burba, G. G., Mcdermitt, D. K., Grelle, A., Anderson, D. J., Xu, L. (2008). Addressing the influence of instrument surface heat exchange on the measurements of CO2 flux from open-path gas analyzers. Global Change Biol. 14, 1854–1876. doi: 10.1111/j.1365-2486.2008.01606.x
Chan, F. C. C., Altaf, M., Khomik, M., Brodeur, J. J., Peichl, M., Restrepo-coupe, N., et al. (2018). Carbon, water and energy exchange dynamics of a young pine plantation forest during the initial fourteen years of growth. For. Ecol. Manage. 410, 12–26. doi: 10.1016/j.foreco.2017.12.024
Chen, B. Y., Liu, S. R., Ge, J. P., Chu, J. X. (2010). Annual and seasonal variations of Q(10) soil respiration in the sub-alpine forests of the Eastern qinghai-Tibet plateau, China. Soil Biol. Biochem. 42, 1735–1742. doi: 10.1016/j.soilbio.2010.06.010
Ciais, P., Reichstein, M., Viovy, N., Granier, A., Ogee, J., Allard, V., et al. (2005). Europe-Wide reduction in primary productivity caused by the heat and drought in 2003. Nature 437, 529–533. doi: 10.1038/nature03972
Cintas, O., Berndes, G., Hansson, J., Poudel, B. C., Bergh, J., Borjesson, P., et al. (2017). The potential role of forest management in Swedish scenarios towards climate neutrality by mid century. For. Ecol. And Manage. 383, 73–84. doi: 10.1016/j.foreco.2016.07.015
Dunn, A. L., Barford, C. C., Wofsy, S. C., Goulden, M. L., Daube, B. C. (2007). A long-term record of carbon exchange in a boreal black spruce forest: means, responses to interannual variability, and decadal trends. Global Change Biol. 13, 577–590. doi: 10.1111/j.1365-2486.2006.01221.x
Frelich, L. E., Montgomery, R. A., Reich, P. B. (2021). Seven ways a warming climate can kill the southern Boreal forest. Forests 12 (5), 560. doi: 10.3390/f12050560
Fu, Z., Stoy, P. C., Luo, Y., Chen, J., Sun, J., Montagnani, L., et al. (2017b). Climate controls over the net carbon uptake period and amplitude of net ecosystem production in temperate and boreal ecosystems. Agric. For. Meteorol. 243, 9–18. doi: 10.1016/j.agrformet.2017.05.009
Fu, Z., Stoy, P. C., Poulter, B., Gerken, T., Zhang, Z., Wakbulcho, G., et al. (2019). Maximum carbon uptake rate dominates the interannual variability of global net ecosystem exchange. Global Change Biol. 25, 3381–3394. doi: 10.1111/gcb.14731
Gauthier, S., Bernier, P., Kuuluvainen, T., Shvidenko, A. Z., Schepaschenko, D. G. (2015). Boreal Forest health and global change. Science 349, 819–822. doi: 10.1126/science.aaa9092
Gill, A. L., Gallinat, A. S., Sanders-demott, R., Rigden, A. J., Gianotti, D. J. S., Mantooth, J. A., et al. (2015). Changes in autumn senescence in northern hemisphere deciduous trees: a meta-analysis of autumn phenology studies. Ann. Bot. 116, 875–888. doi: 10.1093/aob/mcv055
Guan, D. X., Wu, J. B., Han, S. J., Zhang, M., Shi, T. T. (2006). Diurnal and seasonal variation of CO2 flux above the Korean pine and Boreal-leaved mixed forest in changbai mountain. Sci. Silvae Sinicae 10, 123–1128. doi: 10.11707/j.1001-7488.20061022
Hadden, D., Grelle, A. (2017). Net CO2 emissions from a primary boreo-nemoral forest over a 10 year period. For. Ecol. And Manage. 398, 164–173. doi: 10.1016/j.foreco.2017.05.008
Han, M., Jin, G. (2018). Seasonal variations of Q10 soil respiration and its components in the temperate forest ecosystems, northeastern China. Eur. J. Soil Biol. 85, 36–42. doi: 10.1016/j.ejsobi.2018.01.001
Heijmans, M., Arp, W. T., Chapin, F. S. (2004). Carbon dioxide and water vapour exchange from understory species in boreal forest. Agric. For. Meteorol. 123, 135–147. doi: 10.1016/j.agrformet.2003.12.006
Holmberg, M., Aalto, T., Akujarvi, A., Arslan, A. N., Bergstrom, I., Bottcher, K., et al. (2019). Ecosystem services related to carbon cycling - modeling present and future impacts in Boreal forests. Front. Plant Sci. 10. doi: 10.3389/fpls.2019.00343
Horemans, J. A., Janssens, I. A., Gielen, B., Roland, M., Deckmyn, G., Verstraeten, A., et al. (2020). Weather, pollution and biotic factors drive net forest - atmosphere exchange of CO2 at different temporal scales in a temperate-zone mixed forest. Agric. For. Meteorol. 291, 108059. doi: 10.1016/j.agrformet.2020.108059
IPCC (2021). Climate change 2021: The physical science basis. contribution of working group I to the sixth assessment report of the intergovernmental panel on climate change (Cambridge, United Kingdom and New York, NY, USA: Cambridge University Press).
Jia, B., Sun, H., Shugart, H. H., Xu, Z., Zhang, P., Zhou, G. S. (2021). Growth variations of dahurian larch plantations across northeast China: Understanding the effects of temperature and precipitation. J. Environ. Manage. 292, 112739. doi: 10.1016/j.jenvman.2021.112739
Kang, X. M., Li, Y., Wang, J. Z., Yan, L., Zhang, X. D., Wu, H. D., et al. (2020). Precipitation and temperature regulate the carbon allocation process in alpine wetlands: quantitative simulation. J. Soils Sediment. 20, 3300–3315. doi: 10.1007/s11368-020-02643-x
Krasnova, A., Mander, Ü., Noe, S. M., Uri, V., Krasnov, D., Soosaar, K. (2022). Hemiboreal forests’ CO2 fluxes response to the European 2018 heatwave. Agric. For. Meteorol. 323, 109042. doi: 10.1016/j.agrformet.2022.109042
Lenton, T. M., Held, H., Kriegler, E., Hall, J. M., Lucht, W., Rahmstorf, S., et al. (2008). Tipping elements in the earth's climate system. Proc. Natl. Acad. Sci. 105 (6), 1786–1793. doi: 10.1073/pnas.0705414105
Li, R. D., Fan, Y. Q., Feng, P., Song, Z., Li, X. H. (2019). Net ecosystem carbon exchange and its affecting factors in a deciduous broad-leaved forest in songshan, Beijing, China. Chin. J. Appl. Ecol. 31 (11), 3621–3630. doi: 10.13287/j.1001-9332.202011.008
Li, X. R., Sun, X. M., Zhang, J. H., Wang, H. M., Yan, J. H. (2014). Effects of temperature on the seasonal dynamics and interannual variability of carbon flux in china's typical forests. Quat. Sci. 34, 752–761. doi: 10.3969/j.issn.1001-7410.2014.04.07
Liu, F., Wang, X., Wang, C., Zhang, Q. (2021). Environmental and biotic controls on the interannual variations in CO2 fluxes of a continental monsoon temperate forest. Agric. For. Meteorol. 296, 108232. doi: 10.1016/j.agrformet.2020.108232
Li, X. M., Zhang, Q. L. (2015). Carbon flux and its impact factors of larix gmelinii forest ecosystem during growing season. J. Northw. A F Univ. (Natural Sci. Edition) 43, 121–128. doi: 10.13207/j.cnki.jnwafu.2015.06.010
Mckay, D. I. A., Staal, A., Abrams, J. F., Winkelmann, R., Sakschewski, B., Loriani, S., et al. (2022). Exceeding 1.5 c global warming could trigger multiple climate tipping points. Science 377 (6611), eabn7950. doi: 10.1126/science.abn7950
Meehl, G. A., Tebaldi, C. (2004). More intense, more frequent, and longer lasting heat waves in the 21st century. SCIENCE 305, 994–997. doi: 10.1126/science.1098704
Nakai, Y., Matsuura, Y., Kajimoto, T., Abaimov, A. P., Yamamoto, S., Zyryanova, O. A. (2008). Eddy covariance CO2 flux above a gmelin larch forest on continuous permafrost in central Siberia during a growing season. Theor. Appl. Climatol. 93, 133–147. doi: 10.1007/s00704-007-0337-x
Oquist, M. G., Bishop, K., Grelle, A., Klemedtsson, L., Kohler, S. J., Laudon, H., et al. (2014). The full annual carbon balance of Boreal forests is highly sensitive to precipitation. Environ. Sci. Technol. Lett. 1, 315–319. doi: 10.1021/ez500169j
Pan, Y. D., Birdsey, R. A., Fang, J. Y., Houghton, R., Kauppi, P. E., Kurz, W. A., et al. (2011). A Large and persistent carbon sink in the world's forests. SCIENCE 333, 988–993. doi: 10.1126/science.1201609
Papale, D., Reichstein, M., Aubinet, M., Canfora, E., Bernhofer, C., Kutsch, W., et al. (2006). Towards a standardized processing of net ecosystem exchange measured with eddy covariance technique: algorithms and uncertainty estimation. Biogeosciences 3, 571–583. doi: 10.5194/bg-3-571-2006
Park, H., Iijima, Y., Yabuki, H., Ohta, T., Walsh, J., Kodama, Y., et al. (2011). The application of a coupled hydrological and biogeochemical model (CHANGE) for modeling of energy, water, and CO2 exchanges over a larch forest in eastern. Siberia J. Geophys. Res.-Atmos. 116, D15. 116. doi: 10.1029/2010JD015386
Peterson, T. C., Manton, M. J. (2008). Monitoring changes in climate extremes - a tale of international collaboration. Bull. Am. Meteorol. Soc. 89, 1266–1271. doi: 10.1175/2008BAMS2501.1
Piznak, M., Backor, M. (2019). Lichens affect boreal forest ecology and plant metabolism. South Afr. J. Bot. 124, 530–539. doi: 10.1016/j.sajb.2019.06.025
Rebane, S., Jõgiste, K., Kiviste, A., Stanturf, J. A., Metslaid, M. (2020). Patterns of carbon sequestration in a young forest ecosystem after clear-cutting. Forests 11, 126. doi: 10.3390/f11020126
Rebane, S., Jõgiste, K., Põldveer, E., Stanturf, J. A., Metslaid, M. (2019). Direct measurements of carbon exchange at forest disturbance sites: a review of results with the eddy covariance method. Scand. J. For. Res. 34, 585–597. doi: 10.1080/02827581.2019.1659849
Reichstein, M., Carvalhais, N. (2019). Aspects of forest biomass in the earth system: Its role and major unknowns. Surv. In Geophys. 40, 693–707. doi: 10.1007/s10712-019-09551-x
Reichstein, M., Falge, E., Baldocchi, D., Papale, D., Aubinet, M., Berbigier, P., et al. (2005). On the separation of net ecosystem exchange into assimilation and ecosystem respiration: review and improved algorithm. Global Change Biol. 11, 1424–1439. doi: 10.1111/j.1365-2486.2005.001002.x
Saigusa, N., Ichii, K., Murakami, H., Hirata, R., Asanuma, J., Den, H., et al. (2010). Impact of meteorological anomalies in the 2003 summer on gross primary productivity in East Asia. Biogeosciences 7, 641–655. doi: 10.5194/bg-7-641-2010
Savitzky, A., Golay, M. (1964). Smoothing and differentiation of data by simplified least squares procedures. Anal. Chem. 36, 1627–1639. doi: 10.1021/ac60214a047
Seneviratne, S. I., Zhang, X., Adnan, M., Badi, W., Dereczynski, C., Di Luca, A., et al. (2021). Climate change 2021: The physical science basis. contribution of working group I to the sixth assessment report of the intergovernmental panel on climate change (Cambridge, United Kingdom and New York, NY, USA: Cambridge University Press).
Shabaga, J. A., Basiliko, N., Caspersen, J. P., Jones, T. A. (2015). Seasonal controls on patterns of soil respiration and temperature sensitivity in a northern mixed deciduous forest following partial-harvesting. For. Ecol. Manage. 348, 208–219. doi: 10.1016/j.foreco.2015.03.022
Shao, H., Zhang, Y. D., Yu, Z., Gu, F. X., Peng, Z. T. (2022). The resilience of vegetation to the 2009/2010 extreme drought in southwest China. Forests 13 (6), 851. doi: 10.3390/f13060851
Soloway, A. D., Amiro, B. D., Dunn, A. L., Wofsy, S. C. (2017). Carbon neutral or a sink? uncertainty caused by gap-filling long-term flux measurements for an old-growth boreal black spruce forest. Agric. And For. Meteorol. 233, 110–121. doi: 10.1016/j.agrformet.2016.11.005
Tatarinov, F., Rotenberg, E., Maseyk, K., Ogee, J., Klein, T., Yakir, D. (2016). Resilience to seasonal heat wave episodes in a Mediterranean pine forest. New Phytol. 210, 485–496. doi: 10.1111/nph.13791
Tian, H. Q., Xu, R. T., Canadell, J. G., Thompson, R. L., Winiwarter, W., Suntharalingam, P., et al. (2020). A comprehensive quantification of global nitrous oxide sources and sinks. NATURE 586, 248–256. doi: 10.1038/s41586-020-2780-0
Van Gorsel, E., Berni, J. A. J., Briggs, P., Cabello-Leblic, A., Chasmer, L., Cleugh, H. A., et al. (2013). Primary and secondary effects of climate variability on net ecosystem carbon exchange in an evergreen eucalyptus forest. Agric. For. Meteorol. 182, 248–256. doi: 10.1016/j.agrformet.2013.04.027
Venalainen, A., Lehtonen, I., Laapas, M., Ruosteenoja, K., Tikkanen, Viiri, H., et al. (2020). Climate change induces multiple risks to boreal forests and forestry in Finland: A literature review. Global Change Biol. 26, 4178–4196. doi: 10.1111/gcb.15183
Venier, L. A., Walton, R., Thompson, I. D., Arsenault, A., Titus, B. D. (2018). A review of the intact forest landscape concept in the Canadian boreal forest: its history, value, and measurement. Environ. Rev. 26, 369–377. doi: 10.1139/er-2018-0041
Walsh, J. E. (2014). Intensified warming of the Arctic: Causes and impacts on middle latitudes. Global Planet. Change 117, 52–63. doi: 10.1016/j.gloplacha.2014.03.003
Wang, X., Wang, C., Guo, Q., Wang, J. (2016). Improving the CO2 storage measurements with a single profile system in a tall-dense-canopy temperate forest. Agric. For. Meteorol. 228-229, 327–338. doi: 10.1016/j.agrformet.2016.07.020
Wang, Q., Wang, Y. Q., Ma, C., Wang, B., Li, Y. F. (2019). Characteristics of carbon fluxes and their response to environmental factors in ecosystems of mixed coniferous and broad-leaved forests in jinyun mountain. Resour. Environ. Yangtze Basin 28 (3), 75–86. doi: CNKI:SUN:CJLY.0.2019-03-007
Wang, Y., Zhou, L., Jia, Q. Y., Ping, X. Y. (2019). Direct and indirect effects of environmental factors on daily CO2 exchange in a rainfed maize cropland-a SEM analysis with 10 year observations. Field Crops Res. 242, 107591. doi: 10.1016/j.fcr.2019.107591
Webb, E. K., Pearman, G. I., Leuning, R. (1980). Correction of flux measurements for density effects due to heat and water vapour transfer. Q. J. Of R. Meteorol. Soc. 106, 85–100. doi: 10.1002/qj.49710644707
Welp, L. R., Randerson, J. T., Liu, H. P. (2007). The sensitivity of carbon fluxes to spring warming and summer drought depends on plant functional type in boreal forest ecosystems. Agric. For. Meteorol. 147, 172–185. doi: 10.1016/j.agrformet.2007.07.010
Wen, X. F., Wang, H. M., Wang, J. L., Yu, G. R., Sun, X. M. (2010). Ecosystem carbon exchanges of a subtropical evergreen coniferous plantation subjected to seasonal drought 2003–2007. Biogeosciences 7, 357–369. doi: 10.5194/bg-7-357-2010
Wu, J. K., Wu, H., Ding, Y. J., Qin, J., Li, H. Y., Liu, S. W., et al. (2020). Interannual and seasonal variations in carbon exchanges over an alpine meadow in the northeastern edge of the qinghai-Tibet plateau, China. PloS One 15, e0228470. doi: 10.1371/journal.pone.0228470
Wu, H. D., Yan, L., Li, Y., Zhang, K., Hao, Y. B., Wang, J. Z., et al. (2020). Drought-induced reduction in methane fluxes and its hydrothermal sensitivity in alpine peatland. PeerJ 8, e8874. doi: 10.7717/peerj.8874
Xu, X. J., Du, H. Q., Fan, W. L., Hu, J. G., Mao, F. J., Dong, H. (2019). Long-term trend in vegetation gross primary production, phenology and their relationships inferred from the FLUXNET data. J. Of Environ. Manage. 246, 605–616. doi: 10.1016/j.jenvman.2019.06.023
Yan, Z. Q., Li, Y., Wu, H. D., Zhang, K., Hao, Y. B., Wang, J. Z., et al. (2020). Different responses of soil hydrolases and oxidases to extreme drought in an alpine peatland on the qinghai-Tibet plateau, China. Eur. J. Soil Biol. 99, 103195. doi: 10.1016/j.ejsobi.2020.103195
Yu, G. R., Chen, Z., Piao, S. L., Peng, C. H., Ciais, P., Wang, Q. F., et al. (2014). High carbon dioxide uptake by subtropical forest ecosystems in the East Asian monsoon region. Proc. Of Natl. Acad. Of Sci. Of United States Of America 111, 4910–4915. doi: 10.1073/pnas.1317065111
Yuri, M., Xinyue, Y., D.K., Y. (2021). Structural path analysis of extreme weather events: An application to hurricane Katrina and superstorm sandy. Appl. Geogr. 136, 102561. doi: 10.1016/j.apgeog.2021.102561
Yu, G. R., Wen, X. F., Sun, X. M., Tanner, B. D., Lee, X. H., Chen, J. Y. (2006). Overview of ChinaFLUX and evaluation of its eddy covariance measurement. Agric. And For. Meteorol. 137, 125–137. doi: 10.1016/j.agrformet.2006.02.011
Zhang, Q., Lei, H. M., Yang, D. W., Xiong, L. H., Liu, P., Fang, B. J. (2020). Decadal variation in CO2 fluxes and its budget in a wheat and maize rotation cropland over the north China plain. Biogeosciences 17, 2245–2262. doi: 10.5194/bg-17-2245-2020
Zhang, M., Wen, X. F., Zhang, L. M., Wang, H. M., Guo, Y. W., Yu, G. R. (2018). Multi-temporal scale analysis of impacts of extreme high temperature on net carbon uptake in subtropical coniferous plantation. Chin. J. Appl. Ecol. 29 (2), 421–432. doi: 10.13287/j.1001-9332.201802.015
Zhang, J. H., Yu, G. R., Han, S. J., Guan, D. X., Sun, X. M. (2006a). Seasonal and annual variation of CO2 flux above a broadleaved Korean pine mixed forest. Sci. China Ser. D-Earth Sci. 49, 63–73. doi: 10.1007/s11430-006-8063-2
Zhou, L. G., Song, Q. H., Zhang, Y. P., Fei, X. H., Deng, Y., Wu, C. S., et al. (2017). Comparison of net ecosystem exchange light-response curve fitted parameters at four types of forest ecosystems. Chin. J. Ecol. 36, 1815–1824. doi: 10.13292/j.1000-4890.201707.038
Zhou, L., Zhou, G. S., Jia, Q. Y. (2009). Annual cycle of CO2 exchange over a reed (Phragmites australis) wetland in northeast China. Aquat. Bot. 91, 91–98. doi: 10.1016/j.aquabot.2009.03.002
Keywords: net ecosystem CO2 exchange, eddy covariance, boreal forest, carbon budget, environmental controls, extreme temperature events
Citation: Yan Y, Zhou L, Zhou G, Wang Y, Song J, Zhang S and Zhou M (2023) Extreme temperature events reduced carbon uptake of a boreal forest ecosystem in Northeast China: Evidence from an 11-year eddy covariance observation. Front. Plant Sci. 14:1119670. doi: 10.3389/fpls.2023.1119670
Received: 09 December 2022; Accepted: 12 January 2023;
Published: 25 January 2023.
Edited by:
Xiaoming Kang, Chinese Academy of Forestry, ChinaReviewed by:
Fengxue Gu, Institute of Environment and Sustainable Development in Agriculture (CAAS), ChinaJunhu Dai, Institute of Geographic Sciences and Natural Resources Research (CAS), China
Copyright © 2023 Yan, Zhou, Zhou, Wang, Song, Zhang and Zhou. This is an open-access article distributed under the terms of the Creative Commons Attribution License (CC BY). The use, distribution or reproduction in other forums is permitted, provided the original author(s) and the copyright owner(s) are credited and that the original publication in this journal is cited, in accordance with accepted academic practice. No use, distribution or reproduction is permitted which does not comply with these terms.
*Correspondence: Li Zhou, emhvdWxpQGNtYS5nb3YuY24=; Guangsheng Zhou, emhvdWdzQGNtYS5nb3YuY24=