 Qiong Zhao1†
 Xiao-Shi Shi1†Tian Wang1,2Ying Chen1Rui Yang1,2
 Jiaming Mi1,2*
 Ya-Wen Zhang1*
 Yuan-Ming Zhang1
- 1College of Plant Science and Technology, Huazhong Agricultural University, Wuhan, China
- 2National Key Laboratory of Crop Genetic Improvement and National Centre of Plant Gene Research (Wuhan), Huazhong Agricultural University, Wuhan, China
Although grain size is an important quantitative trait affecting rice yield and quality, there are few studies on gene-by-environment interactions (GEIs) in genome-wide association studies, especially, in main crop (MC) and ratoon rice (RR). To address these issues, the phenotypes for grain width (GW), grain length (GL), and thousand grain weight (TGW) of 159 accessions of MC and RR in two environments were used to associate with 2,017,495 SNPs for detecting quantitative trait nucleotides (QTNs) and QTN-by-environment interactions (QEIs) using 3VmrMLM. As a result, 64, 71, 67, 72, 63, and 56 QTNs, and 0, 1, 2, 2, 2, and 1 QEIs were found to be significantly associated with GW in MC (GW-MC), GL-MC, TGW-MC, GW-RR, GL-RR, and TGW-RR, respectively. 3, 4, 7, 2, 2, and 4 genes were found to be truly associated with the above traits, respectively, while 2 genes around the above QEIs were found to be truly associated with GL-RR, and one of the two known genes was differentially expressed under two soil moisture conditions. 10, 7, 1, 8, 4, and 3 candidate genes were found by differential expression and GO annotation analysis to be around the QTNs for the above traits, respectively, in which 6, 3, 1, 2, 0, and 2 candidate genes were found to be significant in haplotype analysis. The gene Os03g0737000 around one QEI for GL-MC was annotated as salt stress related gene and found to be differentially expressed in two cultivars with different grain sizes. Among all the candidate genes around the QTNs in this study, four were key, in which two were reported to be truly associated with seed development, and two (Os02g0626100 for GL-MC and Os02g0538000 for GW-MC) were new. Moreover, 1, 2, and 1 known genes, along with 8 additional candidate genes and 2 candidate GEIs, were found to be around QTNs and QEIs for GW, GL, and TGW, respectively in MC and RR joint analysis, in which 3 additional candidate genes were key and new. Our results provided a solid foundation for genetic improvement and molecular breeding in MC and RR.
Introduction
Rice (Oryza sativa L.) is the principal food for more than half of the population in the world (Rosegrant and Cline, 2003). Effective panicle number per plant, grain number per panicle, and thousand-grain weight (TGW) are three main yield component factors (Xing and Zhang, 2010). Thus, increasing grain weight is an effective way to increase rice yield. TGW is mainly determined by grain size and grouting degree, in which the grain size is determined by grain length (GL), width (GW), and grain thickness (GT). These grain size-related traits are quantitative traits. In addition, grain size not only affects the rice yield but also affects its taste and appearance (Lou et al., 2009; Zhao et al., 2018). Therefore, it is necessary to investigate genetic mechanisms of GL, GW, and TGW.
With the completion of rice genome sequencing, more than 400 quantitative trait nucleotides (QTNs) for rice grain size in different genetic populations have been identified in previous studies (Huang et al., 2013). Among these loci, some of them have been fine-mapped, such as gw9.1 (Xie et al., 2008), qGL7 (Bai et al., 2010), qGL3-2 (Liang et al., 2021), and qGSN5 (Yuan et al., 2022a). At present, at least 22 QTLs/genes for grain size traits in rice have been cloned and functionally identified (Jiang et al., 2022), for example, GW2 (Song et al., 2007), GS2 (Duan et al., 2015), GS5 (Li et al., 2011), GS9 (Zhao et al., 2018), GS3 (Fan et al., 2006), GL3.1 (Qi et al., 2012), GL3.3 (Xia et al., 2018), qGL3 (Zhang et al., 2012), qTGW2 (Ruan et al., 2020) and qTGW3 (Hu et al., 2018) were mined by map-based cloning, while GSE5 (Duan et al., 2017) and OsSPL13 (Si et al., 2016) were detected by GWAS. Clearly, most were identified by map-based cloning, being a time-consuming work in developing near-isogenic lines. Moreover, it has been shown that the grain size is affected by environmental factors in many previous studies (Arshad et al., 2017; Bahuguna et al., 2017; Wu et al., 2022). However, few QTL-by-environment interactions (QEIs) have been identified in rice grain size. Although many QEIs have been detected in other rice traits in recent years, such as qGT9 (Rahimsoroush et al., 2021), qPC6, qPC7, and qGLU6 (Fiaz et al., 2021), they were identified by linkage analysis rather than genome-wide association studies (GWAS).
Ratoon rice has been considered as an efficient, green, and cost-saving rice cultivation mode, which has been popularized in many countries (Firouzi et al., 2018; Ziska et al., 2018; Wang et al., 2020). Compared with main crop, lower temperature after heading stage affects grain filling to reduce yield and improve quality of ratoon rice (Huang et al., 2020). However, QEIs for grain size between main crop and ratoon rice were rarely reported in previous studies, although main crop is used to identify QTNs and their candidate genes for grain size traits. More importantly, at present, most GWAS report only stable QTNs rather than QEIs, owing to the lack of feasible methodology of QEI detection in multiple environments (Kang et al., 2010; Zhang et al., 2010; Zhou and Stephens, 2012; Jiang et al., 2019b). To address this issue, Li et al. (2022a) and Li et al. (2022b) established a new compressed variance component mixed model method, namely 3VmrMLM, to identify QTNs, QEIs, and QTN-by-QTN interactions under controlling all the possible polygenic backgrounds.
To address the above issues, single environment analysis and two-environment joint analysis via 3VmrMLM (Li et al., 2022b) were used to identify QTNs and QEIs for GW, GL, and TGW in main crop (MC) and ratoon rice (RR) of 159 rice accessions with 2,017,495 SNPs. Previously reported genes around QTNs and QEIs for the three traits were mined and their candidate genes were predicted by comparative genomics and confirmed by gene haplotype analysis. In this study, we identified 202 QTNs and 3 QEIs in MC and 191 QTNs and 5 QEIs in RR, 18 previously reported genes around QTNs and two previously reported genes around QEIs were found to be truly associated with grain size in previous studies, and one of two genes around QEIs had the evidence of environmental interaction. Among 25 candidate genes identified by GO annotation and differential expression analysis, 12 were further confirmed by gene haplotype analysis, especially, four candidate genes and one candidate GEI for grain size are more important. In addition, the MC and RR datasets were jointly analyzed as well using 3VmrMLM, as a result, one, two, and one known genes were found to be around QTNs for GW, GL and TGW, respectively, 8 additional candidate genes and 2 candidate GEIs were also mined, in which 3 additional candidate genes are new and key in rice grain size related traits.
Material and methods
Plant materials and phenotyping of grain size related traits
All the 159 indica rice accessions were planted, with a randomized complete block design, in Wuhan in 2021. This experiment was replicated two times in different fields, namely environments 1 and 2. Each material was planted in one plot with 10 seedlings, row spacing was 16.7 cm × 20 cm, and one line empty between cells. At yellow ripening stage, GW (mm), GL (mm), and TGW (g) for each accession in MC and RR were measured for three times, and their averages were regarded as their trait phenotypes. GL in MC is abbreviated as GL-MC, and it is true for other traits.
Statistical analysis for the phenotypic data
The minimum, maximum, mean, standard deviation (SD), kurtosis, skewness (Sk), and coefficient of variation (CV), along with broad-sense heritability , for all the above traits were calculated by R software lme4 v1.1.28. The for each trait was calculated by , where is genetic variance, is residual variance, is the variance of genotype-by-environment interaction, l is the number of environments, and r is the number of replicates. The analysis of variance (ANOVA) for phenotypic data was conducted using the R function aov. Normal distribution test for phenotypic data was conducted using the R function shapiro.test.
Genotyping data
The genotypic data of the 159 rice accessions used in this study consisted of two parts. The genotypic datasets of 134 accessions were derived from RiceVarMap database (http://ricevarmap.ncpgr.cn/), and the DNAs of leaves were extracted to conduct 1K Genobaits to verify their authenticity. The genotypic datasets of twenty-five modern breeding cultivars were obtained by double-terminal sequencing with coverage of approximate 10× based on illumina’s Hiseq 4000 technology sequencing platform at Novogene Technology Company. Then, extract the common SNPs from the genotype dataset of 134 public database accessions and 25 modern breeding cultivars to obtain new genotypic datasets with 2,019,008 SNPs. The software plink v1.90 was used to filter all the 2,019,008 SNPs based on minimum allele frequencies (MAFs) < 0.05 and all variants with missing call rates > 10%, where sliding window distance, step length, and R2 were set as 1000 kb, 1, and 0.3, respectively. As a result, a total of 2,017,495 SNPs were used in subsequent GWAS.
Linkage disequilibrium decay and population structure
All the 2,017,495 SNPs were used to conduct linkage disequilibrium (LD) analysis using popLDdecay (https://github.com/BGIShenzhen/PopLDdecay). The LD decay was determined by plotting the r2 values against the genetic distance of a pair of loci (kb) for each chromosome. G-matrix and cluster analysis for all the 159 accessions were performed using the 2,017,495 SNPs by R package sommer v4.2.0 and amap v0.8.19, respectively. Principal component analysis (PCA) was analyzed using R function prcomp, and the first two principal components were plotted using the R package ggplot2 v3.3.6. ADMIXTURE v1.3.0 (http://dalexander.github.io/admixture) was used to determine population structure (Alexander et al., 2009), where the number of subgroups (K) was set from 1 to 10, and the K value corresponding to the minimum CV error is the most likely subgroup number.
Multi-locus genome-wide association studies for grain size related traits
A total of 2,017,495 SNPs of 159 rice accessions were used to associate with GW, GL, and TGW in two environments in MC and RR using the 3VmrMLM method and its IIIVmrMLM software (https://github.com/YuanmingZhang65/IIIVmrMLM; Li et al., 2022a; Li et al., 2022b). All parameters were set as default values. Population structure adopts the first three principal components. The K matrix was calculated using the IIIVmrMLM software. The probability threshold was set at 0.05/m = 2.48e-08 for significant QTNs and QEIs, where m was the number of markers. To reduce the loss of important candidate genes, some insignificant QTNs and QEIs with LOD score ≥ 3.0 were regarded as suggested QTNs and QEIs (Li et al., 2022a; Li et al., 2022b).
Identification of candidate genes for grain size related traits in rice
Candidate genes for grain size traits were mined based on the below steps. First, all the genes were found in the 200 kb regions of upstream and downstream around each significant QTN without previously reported gene, because the LD decay distance was 150 kb using popLDdecay. Then, RNA-seq datasets of Zhenshan 97 and Minghui 63 at endosperm 7, 14, and 21 days after pollination (https://www.ncbi.nlm.nih.gov/geo/query/acc.cgi?acc=GSE19024) were used to conduct differential expression analysis using NCBI (https://www.ncbi.nlm.nih.gov) GEO2R online tool, and the thresholds of significant difference were set as p-value < 0.05 and | Log2FC | > 1. Finally, all the differentially expressed genes (DEGs) were further analyzed by GO annotation using AgBase (https://agbase.arizona.edu), and the significant E-value was set as 10e-50. If biological process is related to the reported molecular mechanisms of grain size, the DEGs in the biological process were regarded as candidate genes.
Haplotype analysis of candidate genes
The software plink v1.90 was used to extract all the significant SNP information (P < 0.05) after single marker genome scanning within one candidate gene and its upstream 2 kb, R v4.1.3 was used to calculate its haplotypes of the candidate gene, and the 159 rice accessions were grouped based on these haplotypes. Thus, ANOVA was performed using R function aov to test the significance of the QTN-associated trait across these haplotypes at a 5% probability level.
Result
Phenotypic variation
The averages plus standard deviations of GW-MC, GL-MC, TGW-MC, GW-RR, GL-RR, and TGW-RR in 159 rice accessions in two environments were 2.44 ± 0.33 ~ 2.47 ± 0.34 (mm), 8.41 ± 0.85 ~ 8.42 ± 0.84 (mm), 23.92 ± 3.01 ~ 24.03 ± 2.98 (g), 2.38 ± 0.29 ~ 2.43 ± 0.28 (mm), 8.00 ± 0.79 ~ 8.05 ± 0.81 (mm), 21.74 ± 2.84 ~ 22.32 ± 3.09 (g), and their coefficients of variation (CV) were 13.57 ~ 13.70, 9.91 ~ 10.12, 12.40 ~ 12.58, 11.50 ~ 12.17, 9.91 ~ 10.08, and 13.04 ~ 13.83 (%), respectively, having large phenotypic variations (Supplementary Table S1). The analysis of variance was conducted and the results were listed in Supplementary Table S2. As a result, genotypes, environments, and their interactions for all the three traits in MC and RR were significant at the 0.05 probability level (Supplementary Table S2), and the of GW, GL, and TGW ranged from 96.39% to 99.07% in MC and from 90.21% to 98.37% in RR, indicating large genetic variations (Supplementary Table S1). In addition, main crop had higher trait averages than ratoon rice, especially for GL and TGW (Figure 1). The phenotypes of TGW-MC and GW-RR in two environments, GL-RR in environment 2, and TGW-RR in environment 1 were found to obey normal distribution, while GW-MC and GL-MC in two environments, and GL-RR and TGW-RR in environment 1 were found to approximately obey normal distribution (Figure 1; Supplementary Table S1).
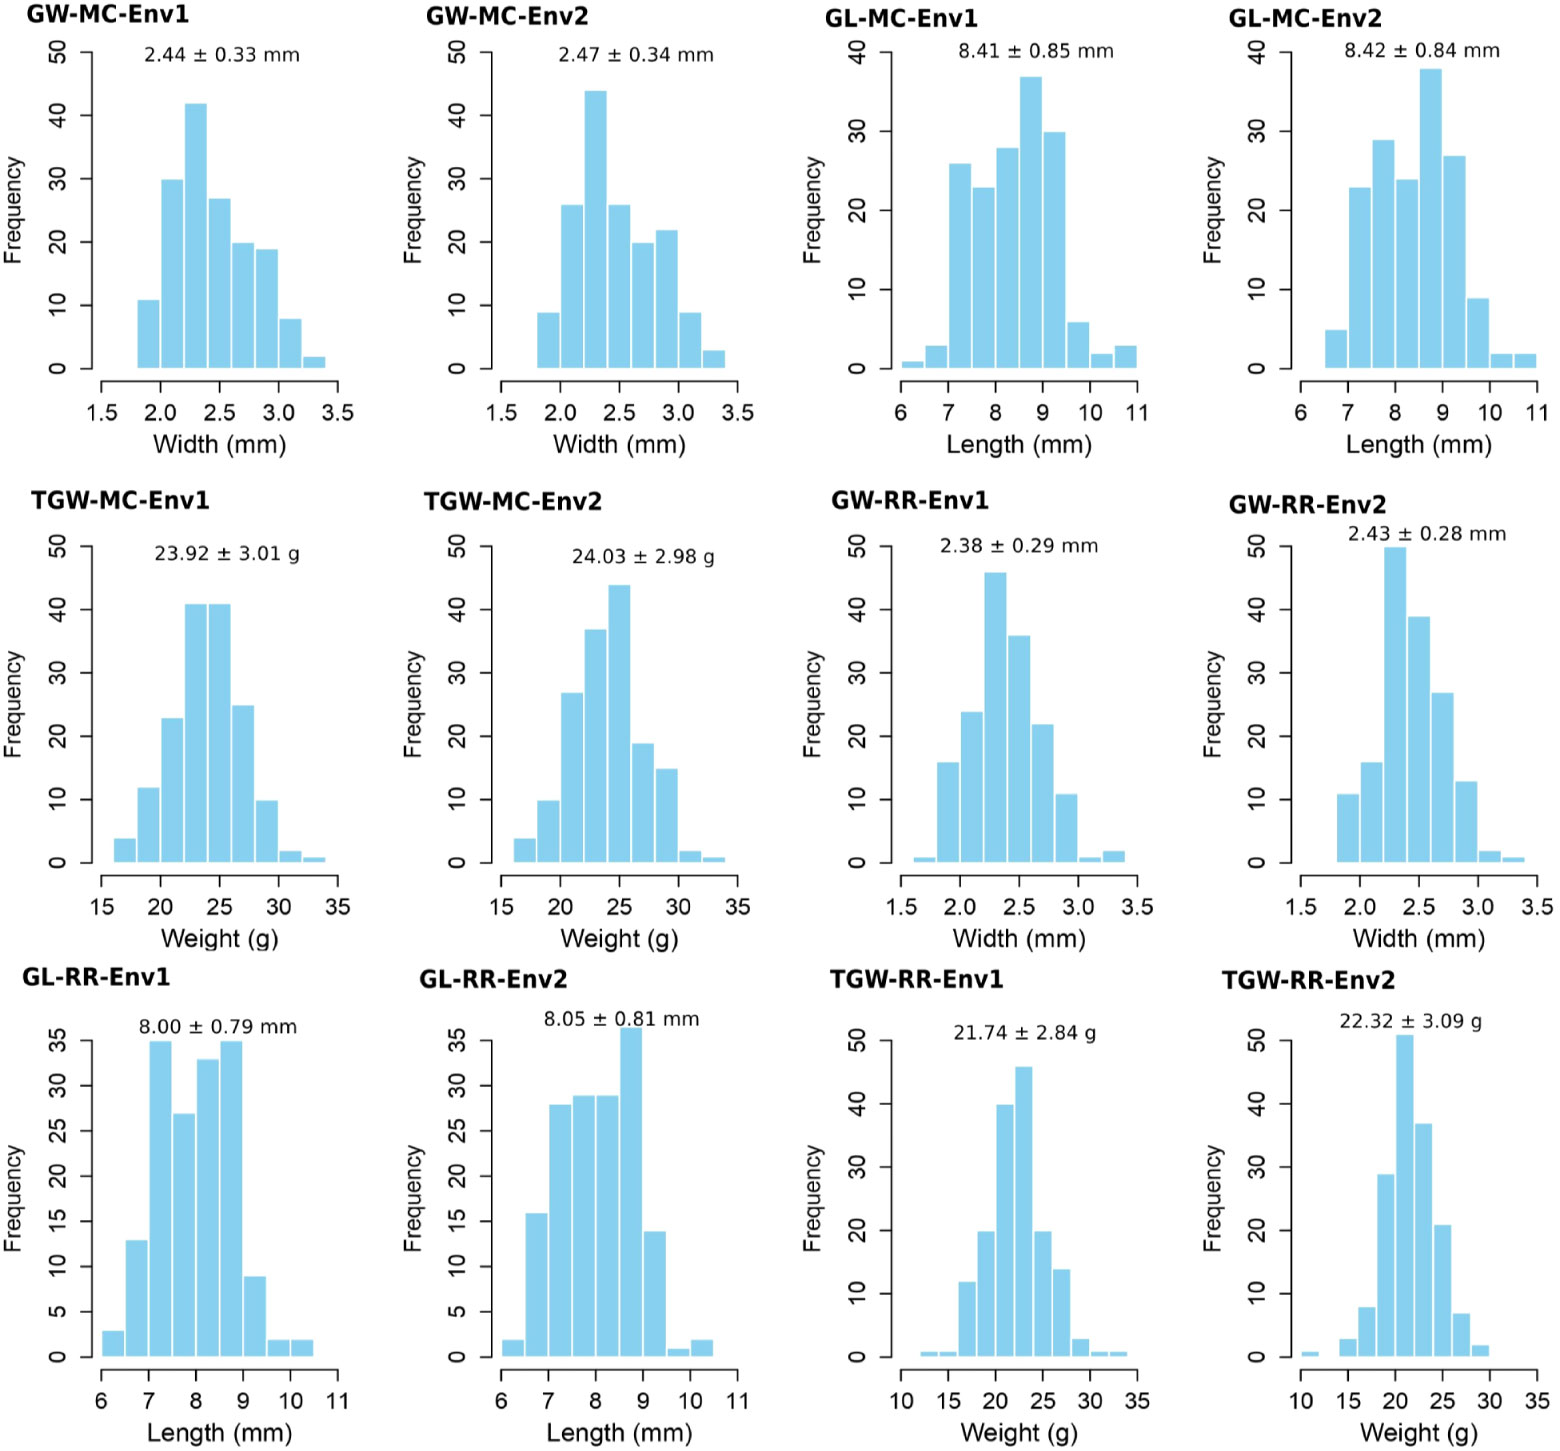
Figure 1 Phenotypic distributions for grain length (GL), grain width (GW), and thousand grain weight (TGW) of 159 accessions of main crop and ratoon rice in two environments.
Population structure and linkage disequilibrium analysis
To determine the LD decay distance, LD decay analysis was performed using all the 2,017,495 SNP markers. The r2 gradually decreases with the increase of distance. When it drops to half of the maximum value, the corresponding distance is regarded as the average distance of LD decay. In this study the LD decay distance was 150 kb, when r2 dropped to half of its maximum value (r2 = 0.3) (Figure 2C).
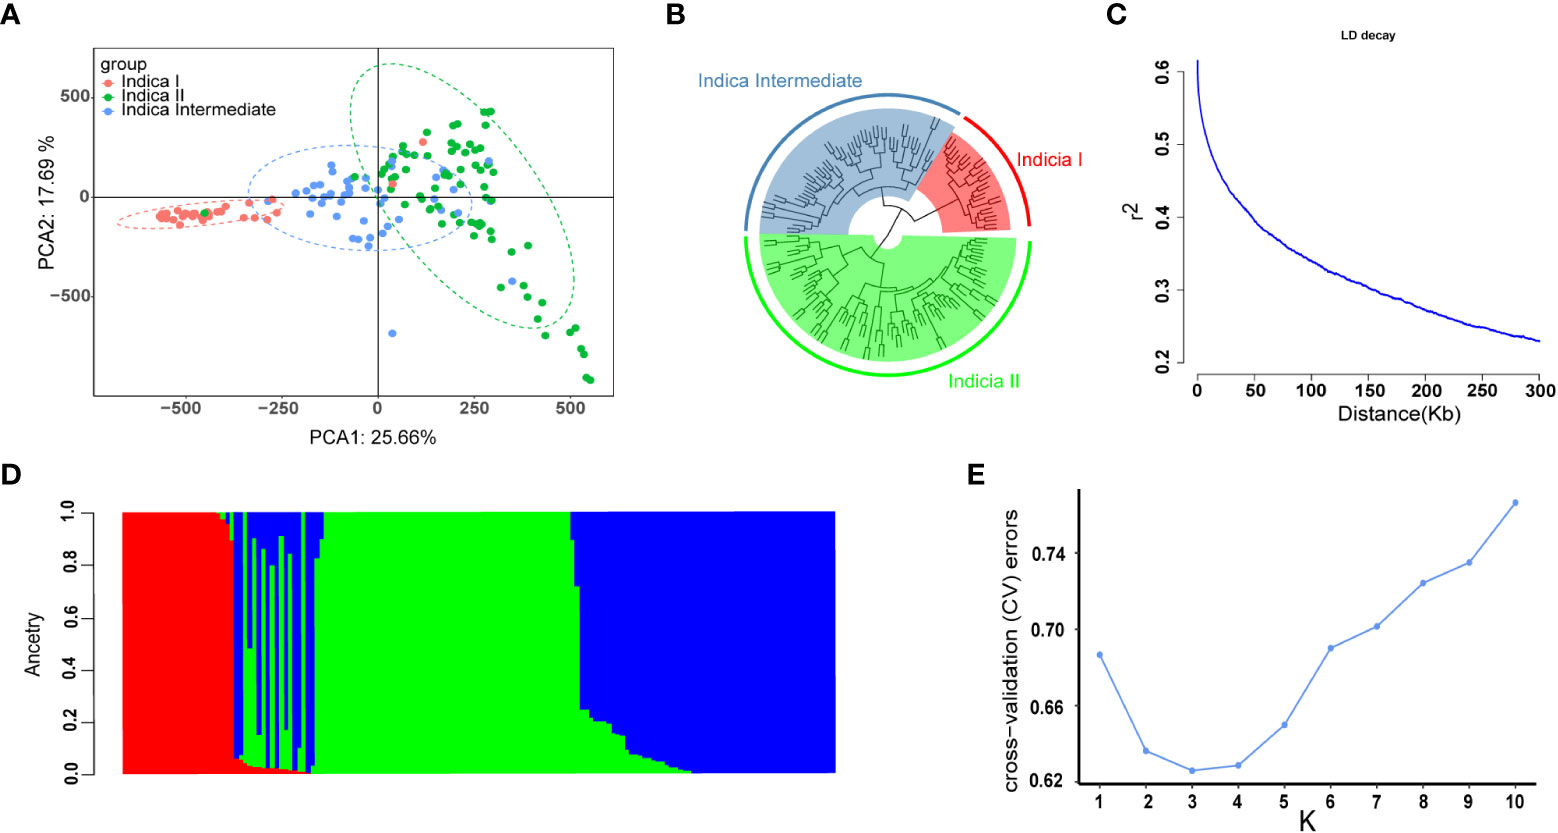
Figure 2 Population structure and LD decay of 159 rice accessions. (A) Principal component analysis (PCA) of the association panel. (B) Cluster analysis results of 159 rice accessions with 2,017,495 SNPs. (C) The entire genome LD decay of the population. (D) Population structure estimates (K = 3), the areas of the three colors illustrate the proportion of each subgroup. (E) cross-validation (CV) error line graph of subgroups (K = 3).
The number of sub-populations was determined by principal component analysis (PCA), population structure analysis, and cluster analysis. The results were showed in Figure 2. In PCA, the first two principal components separated all the 159 accessions into three subgroups: indica I, indica II, and indicia Intermediate (Figure 2A). In population structure analysis via the ADMIXTURE software, cross-validation (CV) error is the lowest when the number of subgroups is three (Figures 2D, E), which is consistent with that in cluster analysis (Figure 2B). Thus, the first three principal components were used in genome-wide association studies.
Identification of QTNs and QEIs in main crop and ratoon rice
Identification of QTNs and QEIs when two environments in MC or RR were separately and jointly analyzed via 3VmrMLM
The 3VmrMLM method, implemented by its IIIVmrMLM software, was used to identify QTNs and QEIs for the three traits in this study. As a result, we identified 64, 71, and 67 QTNs for GW, GL and TGW in main crop, respectively, and 72, 63, and 56 QTNs for GW, GL, and TGW in ratoon rice, respectively (Supplementary Tables S3–S20). Among these QTNs for the above three traits in MC, there were 18, 17, and 13 significant QTNs and 2, 1, and 3 suggested QTNs in environment 1, there were 10, 18, and 17 significant QTNs and 2, 2, and 1 suggested QTNs in environment 2 (Supplementary Tables S3–S5, S9–S11), and there were 27, 32, and 27 significant QTNs and 5, 1, and 3 suggested QTNs detected in multi-environment joint analysis (Supplementary Tables S15–S17). In ratoon rice, there were 16, 13, and 16 significant QTNs and 4, 3, and 2 suggested QTNs in environment 1, there were 20, 13, and 12 significant QTNs and 0, 3, and 4 suggested QTNs in environment 2 (Supplementary Tables S6–S8, S12–S14), and there were 29, 29, and 20 significant QTNs and 3, 2, and 2 suggested QTNs in multi-environment joint analysis (Supplementary Tables S18–S20). More importantly, one GL and two TGW QEIs were detected in main crop, and two GW, two GL, and one TGW QEIs were detected in ratoon rice (Supplementary Tables S15–S20).
Identification of QTNs and QEIs when the MC and RR datasets were jointly analyzed in each environment via 3VmrMLM
The MC and RR datasets in each environment were jointly analyzed using the IIIVmrMLM software. As a result, 34, 35, and 42 QTNs and 7, 1, and 14 QEIs were identified for GW, GL, and TGW, respectively (Supplementary Tables S29–S34). Among these QTNs and QEIs, there were 32, 30, and 37 significant QTNs, 2, 5, and 5 suggested QTNs, 4, 0, and 10 significant QEIs, and 3, 1, and 4 suggested QEIs for GW, GL, and TGW, respectively.
Known genes around QTNs and QEIs
Known genes were searched within 200 kb upstream and downstream regions of QTNs and QEIs. Among the QTNs and QEIs, 3, 4, and 7 known genes were found in main crop to be truly associated with the above three traits, respectively, and 2, 4, and 4 known genes were found in ratoon rice to be truly associated with the above three traits, respectively. Among these known genes, 4 were simultaneously found in main crop and ratoon rice, and 3 were found across multiple traits. 3, 5, and 9 known genes were found to be around significant QTNs and QEIs for the above three traits, respectively, and 0, 1, and 2 known genes were found to be around suggested QTNs for the above three traits, respectively (Tables 1, 2).
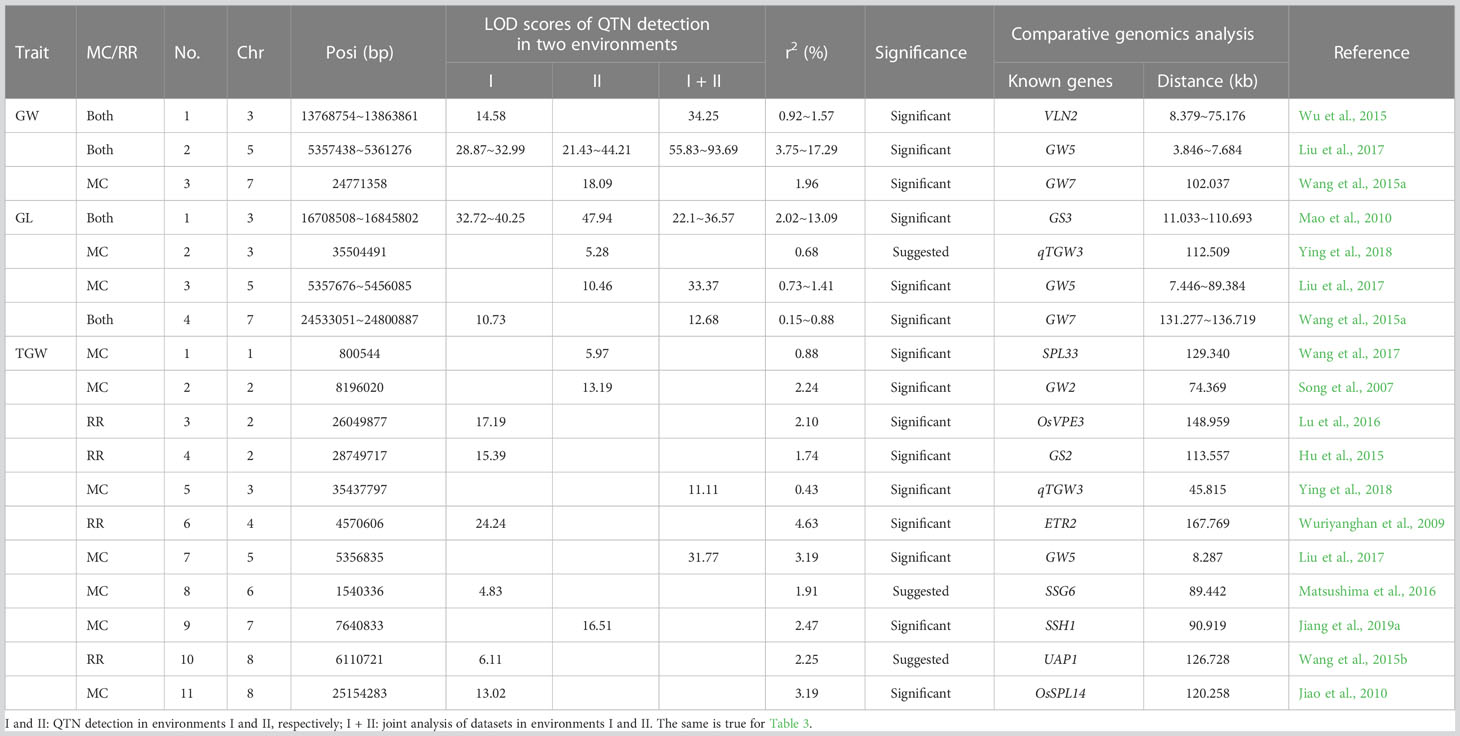
Table 1 Known genes around QTNs for grain length (GL), grain width (GW), and thousand grain weight (TGW) in main crop (MC) and ratoon rice (RR).
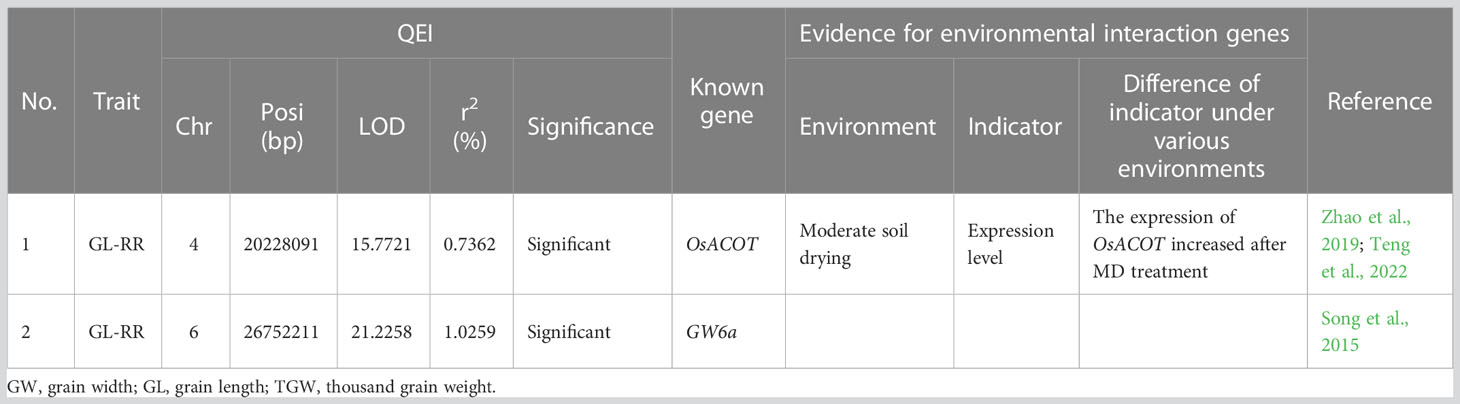
Table 2 Two known genes around QEIs for rice grain size traits in ratoon rice (RR) and the evidence of gene-by-environment interactions.
Around the above QTNs, some known genes were simultaneously mined in single-environment analysis and two-environment joint analysis. GW5 was identified to be associated with GW-MC and GW-RR in two single-environment analyses and two-environment joint analysis, VLN2 was identified to be associated with GW-MC in two-environment joint analysis and GW-RR in the first environment analysis (Figures 3A–C; Supplementary Figure 1), GS3 was found to be associated with GL-MC and GL-RR in two single-environment analysis and two-environment joint analysis, and GW5 was found to be associated with GL-MC in the second environment analysis and two-environment joint analysis (Supplementary Figures 2A–C, 3). For TGW, all known genes were separately detected in a single-environment analysis or two-environment joint analysis (Supplementary Figures 4A–C, 5).
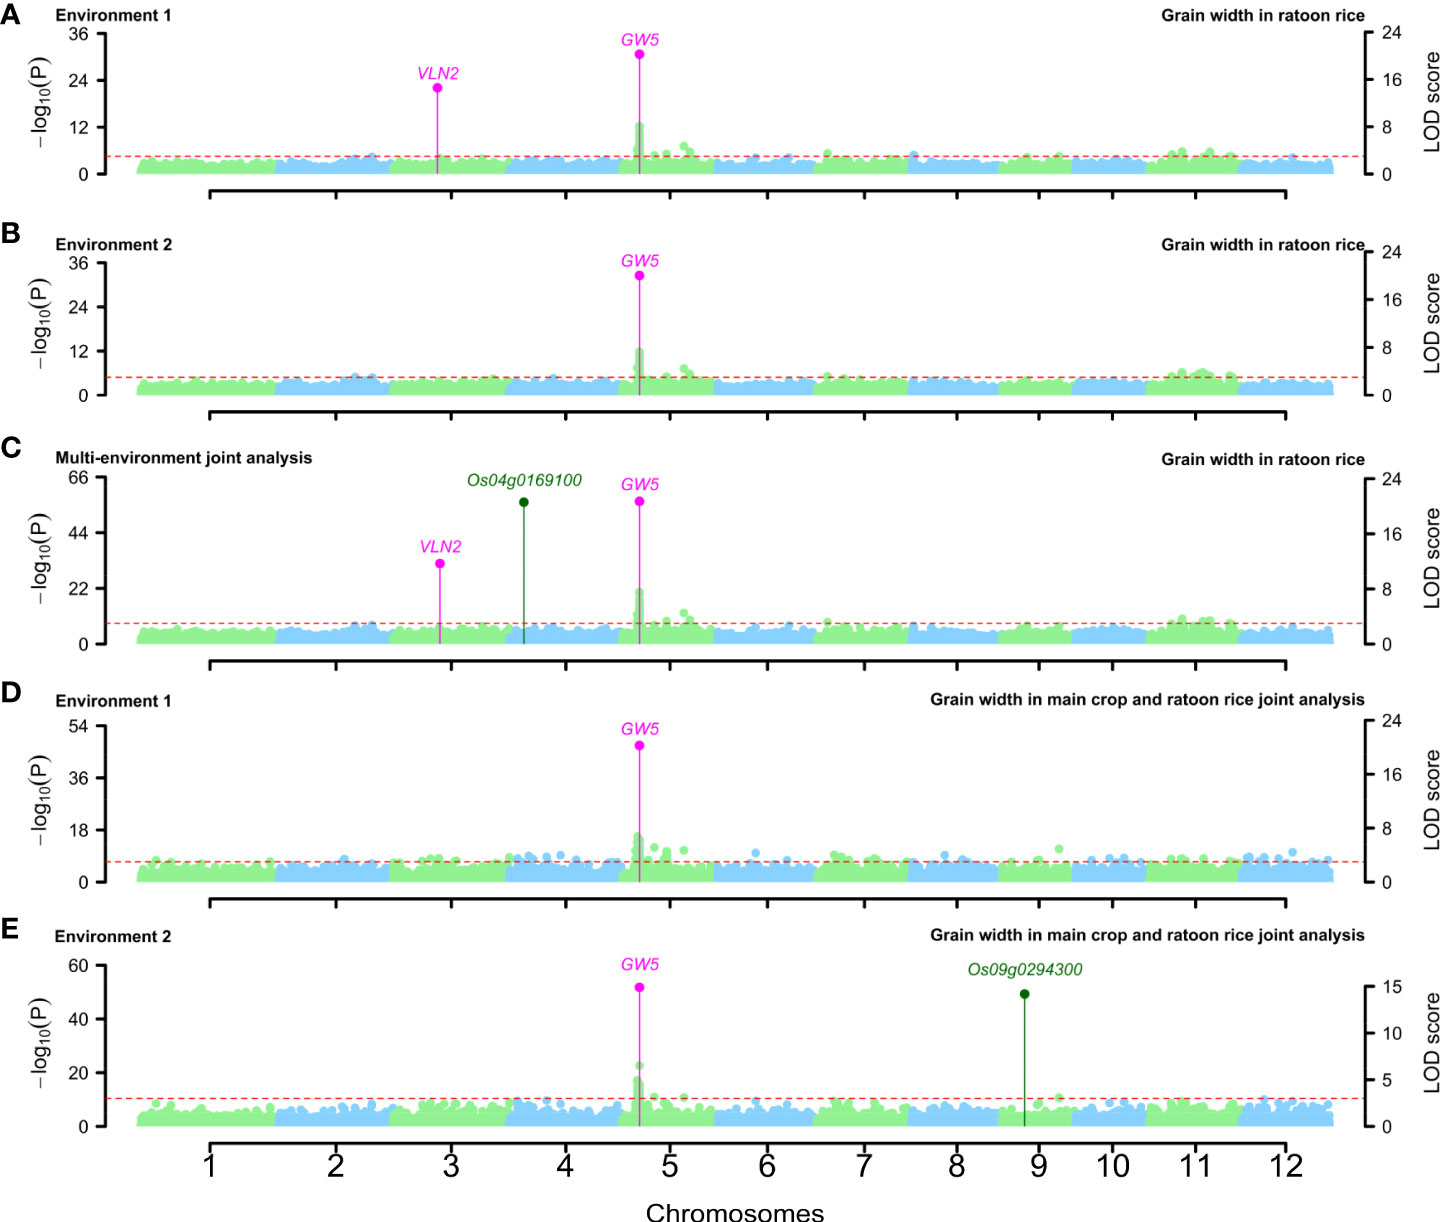
Figure 3 Manhattan plots for grain width in ratoon rice (A–C) and grain width in the joint analysis of main crop and ratoon rice (D, E). Known genes around QTNs were marked with magenta color, and candidate genes around QTNs were marked with dark green color.
Around the above QEIs, two known genes, OsACOT and GW6a, for GL-RR were mined (Table 2). Among the two known genes, OsACOT was found to be interacted with environments. In detail, its expression level under moderate soil drying treatment was higher than that under well-watered control (Teng et al., 2022) (Table 2).
In the joint analysis of the MC and RR datasets, 1, 2, and 1 known genes were found to be around significant QTNs and to be truly associated with GW, GL, and TGW, respectively (Supplementary Tables S35; Figures 3D, E; Supplementary Figures 2, 4D, E). Among these known genes, most of them were consistent with the above known genes, such as GW5, GS3, and qTGW3, but PGL2 was found only in the MC and RR joint analysis.
Prediction of candidate genes
Around other QTNs without known genes, all the genes within 200 kb upstream and downstream regions were used to conduct differential expression analysis. All the differential expression genes (DEGs) were used to conduct gene annotation analysis. In gene annotation analysis, the significant biological processes were mainly included the below categories: cytokinin, abscisic acid and other plant hormone metabolism (e.g., Os02g0197600, Os02g0621300, Os02g0626100, and Os02g0178800), protein ubiquitination (Os07g0166800), sucrose starch metabolism (Os04g0169100, Os12g0112500, and Os08g0205900), protein phosphorylation (Os02g0126400, and Os03g0717700), and endosperm development (Os02g0538000, Os12g0277500, and Os01g0280500) (Supplementary Tables S21, S22), which are highly consistent with the previously reported regulatory pathways in Zuo and Li (2014); Cai et al. (2018), and Li et al. (2019). These genes were regarded as candidate genes. As a result, there were 10, 7 and 1 candidate genes for GW, GL and TGW in main crop, respectively, and 8, 4, and 3 candidate genes for GW, GL and TGW in ratoon rice, respectively (Supplementary Tables S21, S22).
For candidate genes for GW, Os02g0126400 and Os03g0717700 were predicted to be related to protein phosphorylation, Os02g0178800 and Os03g0592500 were predicted to respond to abscisic acid, Os02g0197600 was found to be related to cytokinin, Os07g0166800 was found to be related to the process of protein ubiquitination, Os02g0538000 and Os12g0277500 were found to be associated with embryonic development at the end of seed dormancy, and Os08g0205900 and Os04g0169100 were predicted to be related to sucrose metabolism and starch synthesis metabolism, respectively.
For candidate genes for GL, Os02g0197600, Os02g0621300, Os02g0626100, Os04g0514800, and Os03g0108600 were predicted to respond to cytokinin, abscisic acid, gibberellin, auxin, and ethylene, respectively, Os01g0280500 and Os02g0538000 were found to affect embryonic development, and Os04g0169100 and Os12g0112500 were predicted to be related to starch synthesis. In Wuriyanghan et al. (2009), Os04g0169100 was reported to affect the ethylene sensitivity of seeds to substantially enhance TGW of mutant. Here there is one issue pending, that is, whether the TGW increase is caused by the GL increase.
For candidate genes for TGW, Os02g0621300 was predicted to be related to response to abscisic acid, Os03g0411500 was predicted to be related to photosynthesis, Os03g0607400 was predicted to be related to positive regulation of unidimensional cell growth, and Os05g0445900 was predicted to participate in DNA demethylation, which is consistent with that in Zhou et al. (2021), in detail, Os05g0445900 encodes rice DNA glycosylase, and the mutation of DNG701 can lead to embryo retardation or abortion of part seeds (Zhou et al., 2021).
For the DEG Os03g0737000 (P=7.77E-03, log2FC=-1.29) around the QEI of chr3-30340995 for GL-MC, Os03g0737000 was predicted to be related to “response to salt stress” (Table 3). In the future, new experiments are necessary to explore these novel gene-trait and GEI-trait associations.
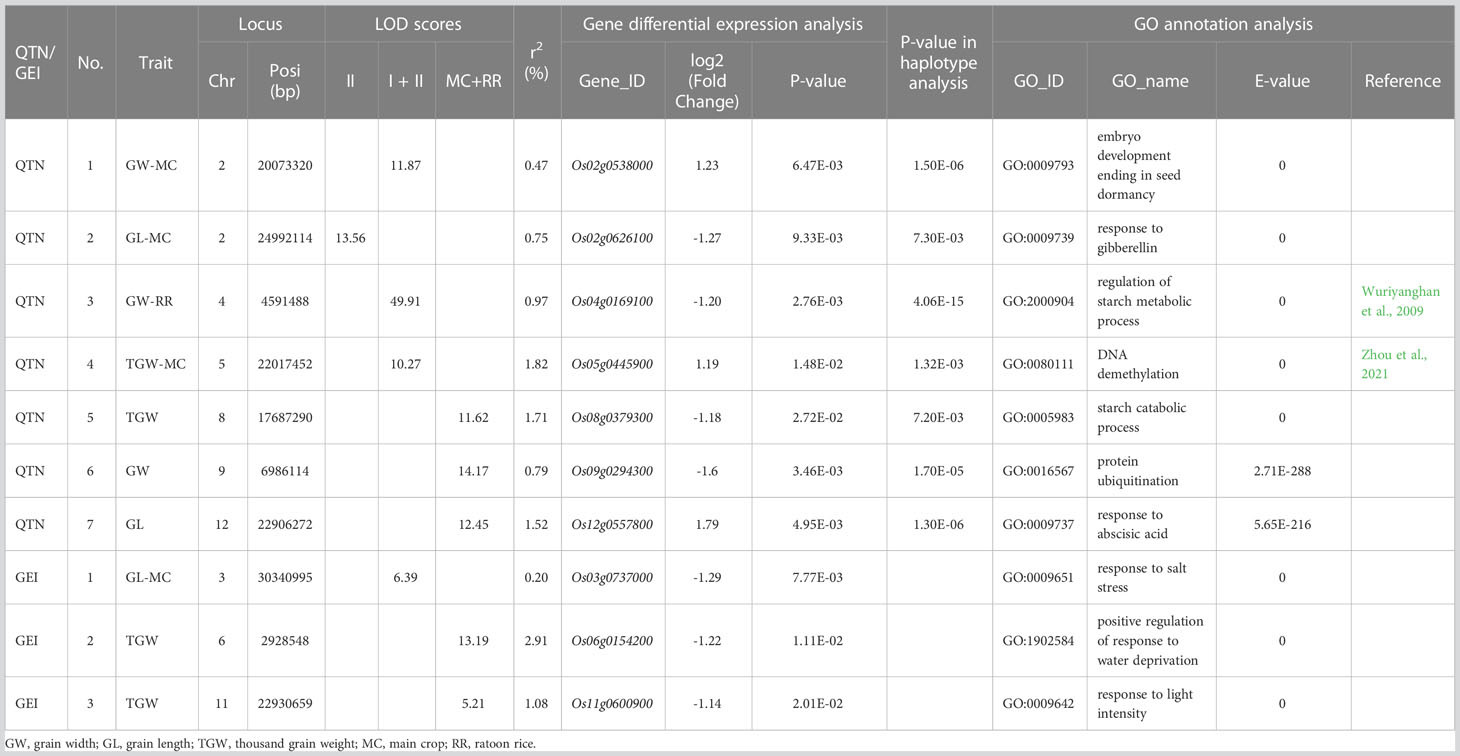
Table 3 Key candidate genes and gene-by-environment interactions for grain size related traits in rice.
In the joint analysis of the MC and RR datasets, there were 22 candidate genes around QTNs to be responsible for the above three traits, but only two were consistent with the above 25 candidate genes (Supplementary Table S36). The significant biological processes of these candidate genes were mainly included the below categories: plant hormone metabolic pathway (e.g., Os02g0126400, Os05g0563400, and Os12g0288000), protein phosphorylation (Os03g0838100, Os08g0200500, and Os05g0514200), embryo development (Os02g0538000 and Os08g0428100), and protein ubiquitination (Os09g0294300 and Os12g0111500). In addition, we also mined two additional DEGs for TGW around QEIs, among which Os06g0154200 was predicted to be related to “positive regulation of response to water deprivation” and Os11g0600900 was predicted to be related to “response to light intensity” (Table 3).
Haplotype analysis
To further verify the reliability of candidate genes, we conducted haplotype analysis. As a result, 12 of the above 25 candidate genes had significant differences among the phenotypes of the traits corresponding to the haplotypes of each gene (Figure 4). Among the 12 significant candidate genes, 7, 3, and 3 were found to be associated with GW, GL, and TGW, respectively, of which there are 6, 3, and 1 significant candidate genes in main crop and 2, 0, and 2 significant candidate genes in ratoon rice (Figure 4). Os08g0205900 for GW was mined in both MC and RR, and Os02g0621300 was found in both GL and TGW (Figure 4). It should be noted that 8 of 22 candidate genes, which were mined in the MC and RR joint analysis, were significant in haplotype analysis, and the eight genes were different from the 12 significant candidate genes in the above haplotype analysis (Figure 4).
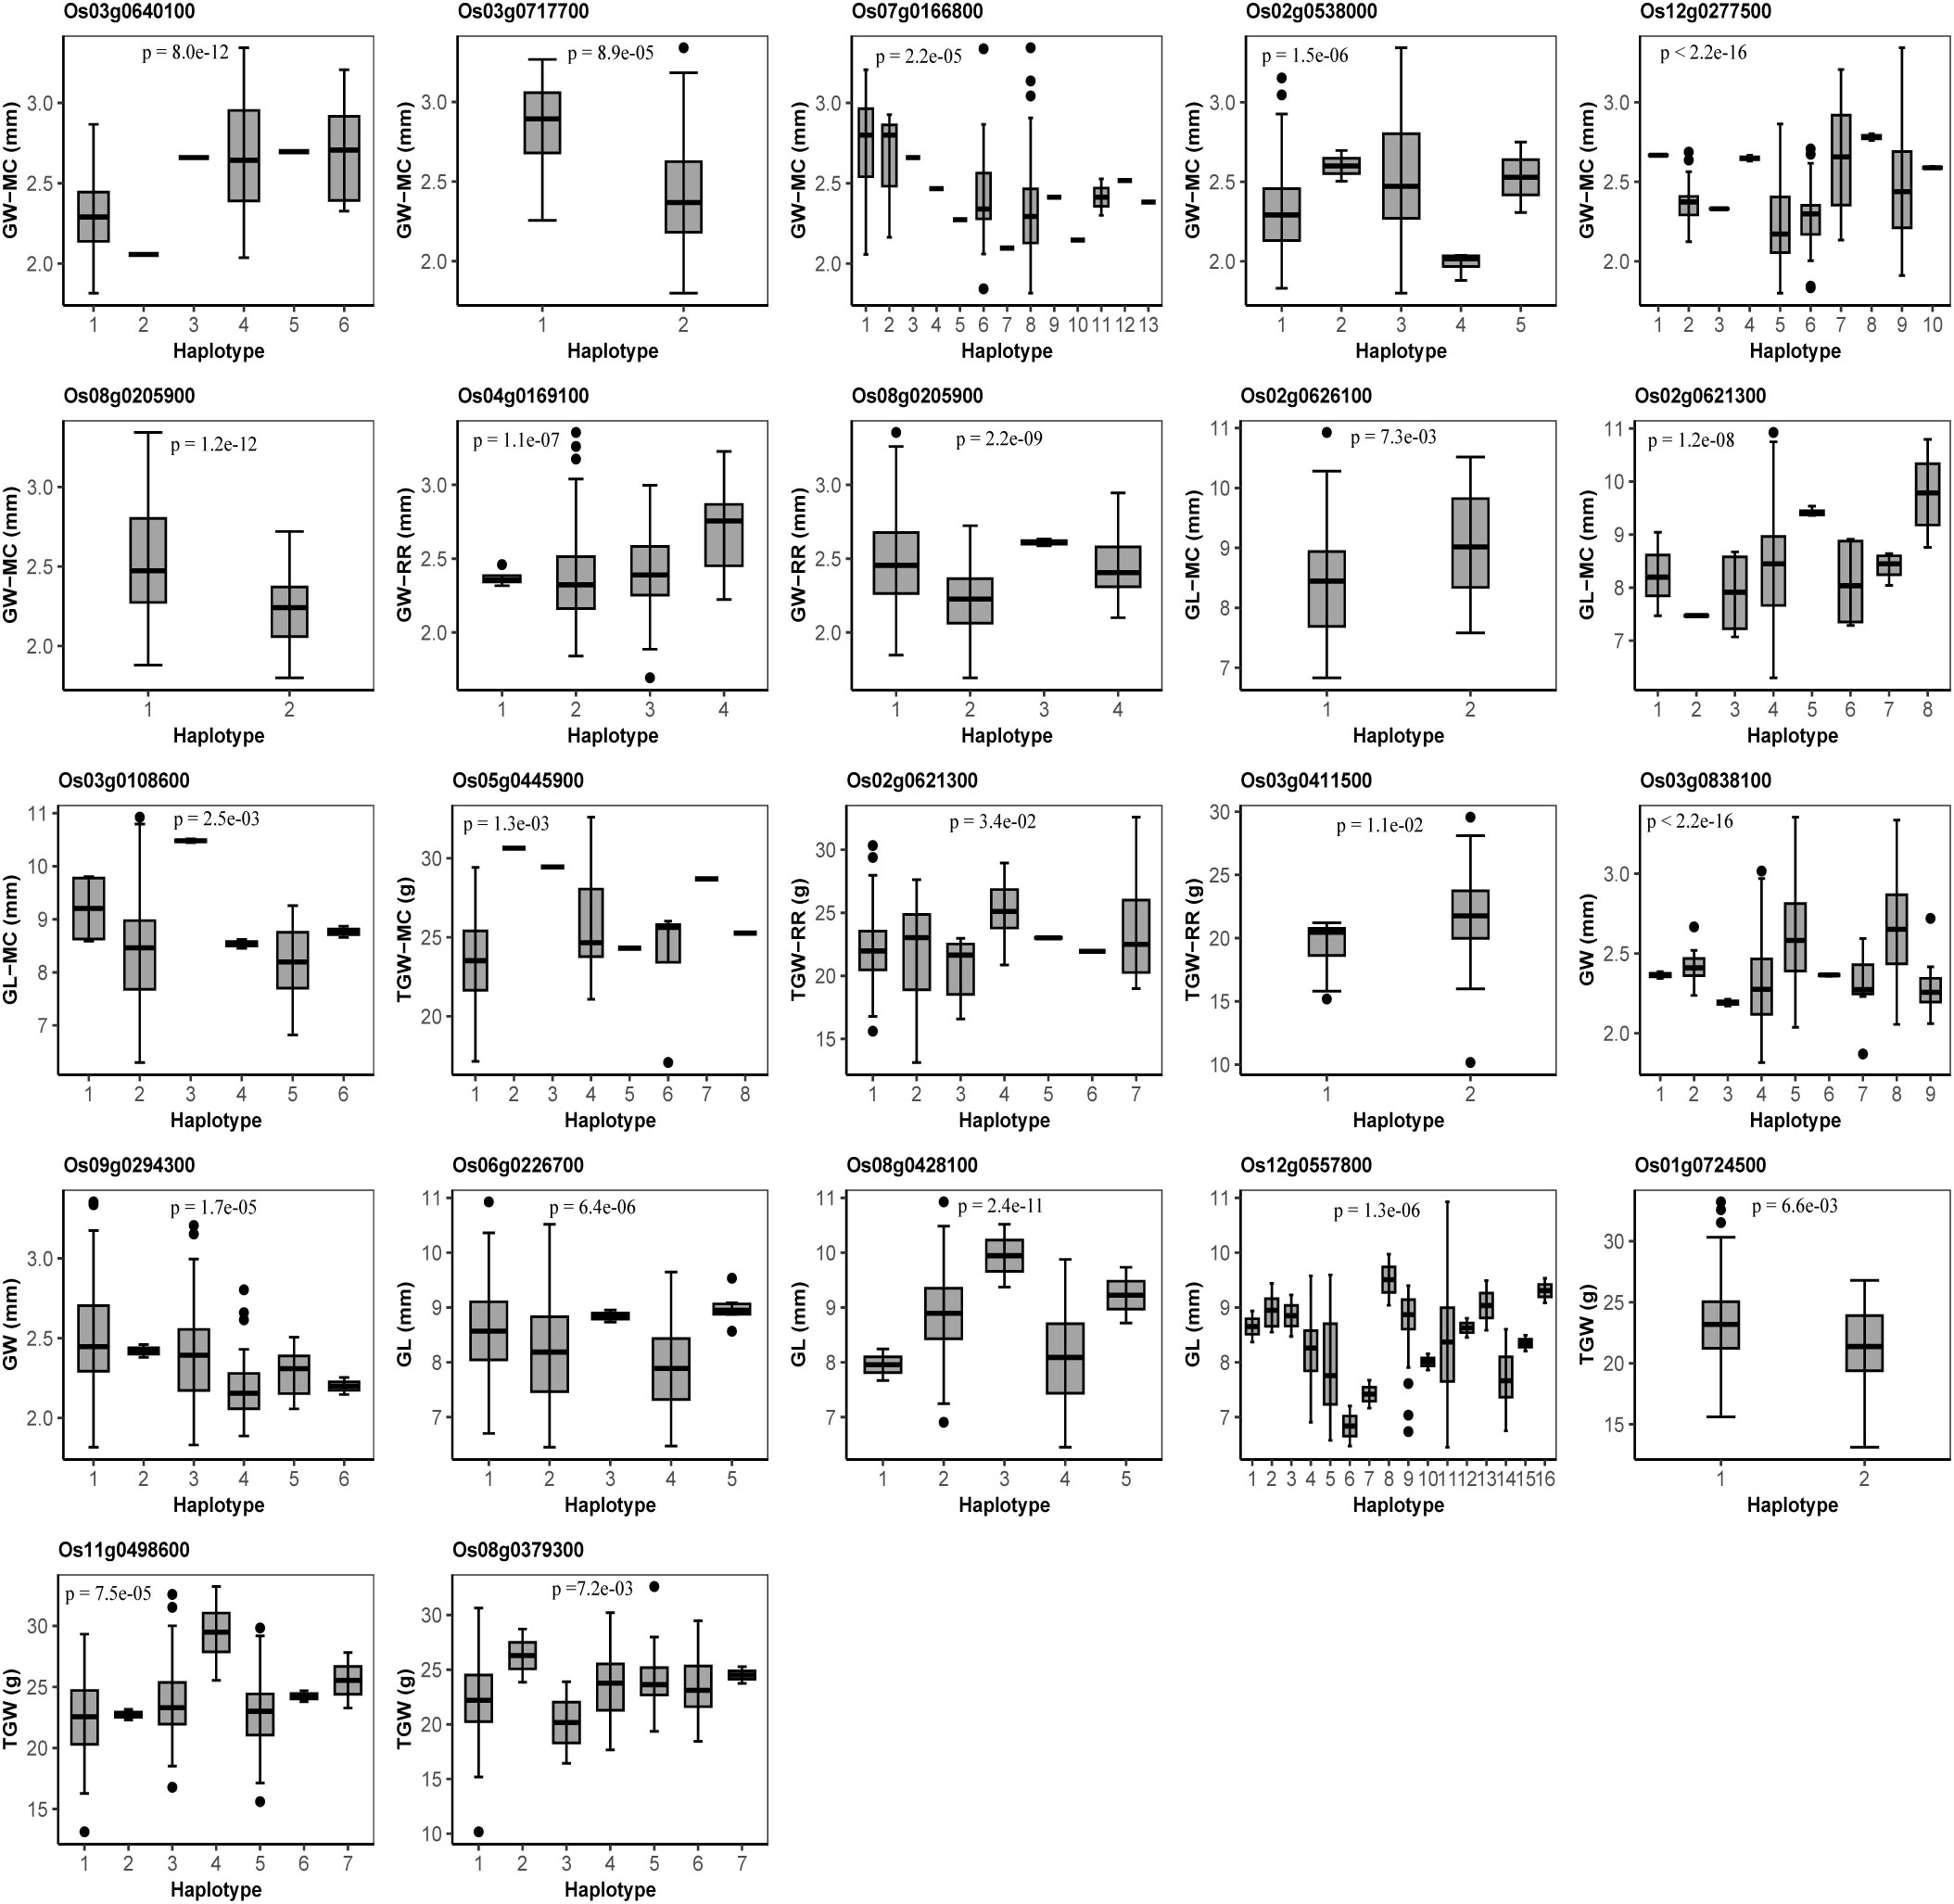
Figure 4 Haplotype analysis for candidate genes for grain width (GW), grain length (GL) and thousand grain weight (TGW) in main crop (MC), ratoon rice (RR), and the joint analyses of MC and RR. The P-values indicate the significance of trait averages across gene haplotypes for GW, GL, and TGW in one-way ANOVA.
Discussion
To address the studies on gene-by-environmental interactions, especially, across main crop and ratoon rice, in this study we conducted genome-wide association studies for GW, GL, and TGW using 3VmrMLM. As a result, a total of 202 QTNs and 3 QEIs in main crop, and 191 QTNs and 5 QEIs in ratoon rice were identified. Around these QTNs and QEIs, 18 and 2 known genes were found to be truly associated with the grain size related traits, in which 4 were common across main crop and ratoon rice, and 12 candidate genes were mined through differential expression analysis, GO annotation, and haplotype analysis, in which one was common across main crop and ratoon rice. More importantly, four key candidate genes around QTNs were predicted, in which two were new and all identified in main crop. In addition, we identified a new candidate GEI Os03g0737000, which was predicted to be related “response to salt stress”. In the joint analysis of the MC and RR datasets, furthermore, 8 additional candidate genes and two additional GEIs were minded, and 3 of 8 additional candidate genes were new and key for grain size related traits in this study.
Comparison of QTNs, QEIs, known genes, and candidate genes across main crop and ratoon rice
Ratoon rice is a new mode of rice planting, which can effectively save costs and increase benefits (Shen et al., 2021). Although it is generally accepted that RR has higher quality than MC, there are still many controversies in the studies on grain size related traits (Alizadeh and Habibi, 2016; Huang et al., 2020; Yuan et al., 2022b).
In this study, 64, 71, and 64 QTNs and 0, 1 and, 2 QEIs in MC, and 72, 63 and 56 QTNs and 2, 2, and 1 QEIs in RR were identified to be associated with GW, GL and TGW, respectively. Among these QTNs, 4 known genes were commonly detected in main crop and ratoon rice to be truly associated with grain size related traits, including GW5 and VLN2 for GW, and GS3 and GW7 for GL (Table 1). Some known genes were found only in main crop or ratoon rice, such as qTGW3, SPL33, and OsSPL14 were detected only in main crop, and OsVPE3, GS2, ETR2, and UPA1 were found only in the ratoon rice (Table 1). Among all the candidate genes, one was commonly found in main crop and ratoon rice, and 12 were detected only in main crop or ratoon rice (Figure 4). No common QEIs were detected between main crop and ratoon rice.
Based on the above results, main crop can detect more known genes (14), candidate genes (10) and candidate GEIs (1) than ratoon rice (8, 4, and 0). Although some known and candidate genes can be commonly found in main crop and ratoon rice, there are still some specific candidate genes in main crop or ratoon rice. In the independent and joint analyses of the MC and RR datasets, most candidate genes and candidate GEIs were different across the two analyses. This indicated that more known and candidate genes and GEIs can be identified while the datasets in main crop and ratoon rice are simultaneously or jointly analyzed.
Key candidate genes for GW, GL, and TGW in rice
The candidate genes were mined by expression and GO annotation analysis, and further validated through haplotype analysis. In this study we identified five new and key candidate genes that were predicted to be closely related to the three traits, among which 3 were mined to be around QTNs in the MC and RR joint analysis (Table 3), the evidence was as below.
Os02g0626100 for GL-MC, and Os02g0538000 for GW-MC were differentially expressed. In GO annotation analysis, the two genes were annotated as “response to gibberellin”, and “embryo development ending in seed dormancy”, respectively, in which these biological processes are highly consistent with metabolic pathways of important grain size traits in rice (Li et al., 2018; Li et al., 2020; Jiang et al., 2022). In haplotype analysis, significant GL/GW differences were observed across 2 and 5 haplotypes from 1 and 11 significant SNPs within the two genes and their 2 kb upstream. Thus, the two genes may be important candidate genes for GL/GW.
In the same way, Os08g0379300 for TGW, Os09g0294300 for GW, and Os12g0557800 for GL were found to be DEGs around the QTNs in the MC and RR joint analysis. In GO annotation analysis, the three gene were predicted to be related to “starch catabolic process”, “protein ubiquitination”, and “response to abscisic acid”, respectively, which have been confirmed to be important regulatory pathways of rice grain size (Li et al., 2008; Choi et al., 2018; Gao et al., 2021). In haplotype analysis, significant TGW/GW/GL difference was observed across 7, 6, and 16 haplotypes from 6, 6, and 16 significant SNPs within the genes and their 2 kb upstream. Thus, the three genes may be important candidate genes for TGW/GW/GL.
In addition, two candidate genes have been reported to be related to rice seed development. In Wuriyanghan et al. (2009), Os04g0169100, identified for GW-RR in this study, significantly increased TGW of mutants by increasing the sensitivity of seeds to ethylene. In Zhou et al. (2021), the mutant of Os05g0445900, identified for TGW-MC in this study, participated in DNA methylation process causing the endosperm of some seeds to be stunted or aborted.
Identification of known and candidate GEIs for grain size traits in rice
Around the QEIs, OsACOT for GL-RR has been confirmed to be differentially expressed under two soil moisture treatments (Teng et al., 2022; Table 2).
Around QEIs in the independent analysis of MC or RR, Os03g0737000 for GL-MC was found to be differentially expressed, and its biological process in GO annotation was predicted to be related to salt stress. We speculate that Os03g0737000 may be affected by environmental factors, such as different salt treatments. Around QEIs detected in the MC and RR joint analysis, Os06g0154200 and Os11g0600900 for TGW were found to be differentially expressed, and the biological processes in their GO annotations were predicted to be related to water deprivation and light intensity, respectively. Thus, we speculate that Os06g0154200 may be affected by the moisture content of the environment and Os11g0600900 may be affected by the intensity of external light. The molecular functions of above three candidate GEIs need to be verified by subsequent molecular biology experiments.
Comparison of known genes across two types of interval lengths
To investigate the effect of interval length on mining known genes, two types of interval lengths were compared. One was 200 kb upstream and downstream regions of QTNs and QEIs, which was determined based on LD decay distance, while another was 1000 kb for QTNs and 1500 kb for QEIs. The results are listed in Table 1 and Supplementary Table S37. As a result, 3, 4, 7, 2, 2, and 4 known genes around QTNs and 0, 0, 0, 0, 2, and 0 known genes around QEIs were found to be located on their corresponding 200 kb upstream and downstream regions and to be truly associated with GW-MC, GL-MC, TGW-MC, GW-RR, GL-RR, and TGW-RR, respectively, while 6, 7, 21, 7, 6, and 16 known genes for the above six traits were found to be located on 1000 kb upstream and downstream regions of QTNs, and 0, 0, 1, 2, 2, and 0 known genes for the above six traits were found to be located on 1500 kb upstream and downstream regions of QEIs. This indicates that large intervals can find more known genes. Thus, it is very important to determine a suitable interval length in mining known genes.
Comparison of QTNs, QEIs, and known genes across various population structures
To investigate the effect of population structure on genome-wide association studies, we compared the results from evolutionary population structure (Liu et al., 2020), Q matrix, and PCA in this study. As a result, 323, 283, and 393 QTNs, 9, 6, 8 QEIs, and 11, 12, and 20 known genes were identified from evolutionary population, Q matrix and PCA, respectively (Supplementary Tables S23–S28). Clearly, the PCA result is the best, followed by evolutionary population, and the worst is the Q matrix result in this study. Thus, population structure is an important parameter in genome-wide association study.
Data availability statement
The genotypic datasets of 134 rice accessions can be downloaded from the NCBI under accession numbers PRJNA171289 and PRJEB6180, the phenotype values of grain size traits can be downloaded from figshare (https://doi.org/10.6084/m9.figshare.21957449.v1), RNA-seq data from endosperm tissue of Zhenshan 97 and Minghui 63 are available in the NCBI Gene Expression Omnibus (GEO) database under the accession number GSE19024, and further inquiries can be directed to JMM (bWptQG1haWwuaHphdS5lZHUuY24=).
Author contributions
Y-WZ and JMM managed the research. JMM was in charge of research experiments. TW and RY measured trait phenotypes and marker genotypes. QZ, X-SS, and YC analyzed datasets and mined candidate genes. QZ wrote the draft. Y-MZ, Y-WZ, and J-MM revised the manuscript. All authors contributed to the article and approved the submitted version.
Funding
This work was supported by the National Natural Science Foundation of China (32200500 and 32070557), the Hubei Key R&D Program (2021BBA225 and 2020BBA031), the Natural Science Foundation of Hubei Province (2022CFB780), and Postdoctoral Innovative Research Position of Hubei Province.
Conflict of interest
The authors declare that the research was conducted in the absence of any commercial or financial relationships that could be construed as a potential conflict of interest.
Publisher’s note
All claims expressed in this article are solely those of the authors and do not necessarily represent those of their affiliated organizations, or those of the publisher, the editors and the reviewers. Any product that may be evaluated in this article, or claim that may be made by its manufacturer, is not guaranteed or endorsed by the publisher.
Supplementary material
The Supplementary Material for this article can be found online at: https://www.frontiersin.org/articles/10.3389/fpls.2023.1119218/full#supplementary-material
References
Alexander, D. H., Novembre, J., Lange, K. (2009). Fast model-based estimation of ancestry in unrelated individuals. Genome Res. 19, 1655–1664. doi: 10.1101/gr.094052.109
Alizadeh, M. R., Habibi, F. (2016). A comparative study on the quality of the main and ratoon rice crops. J. Appl. Bot. Food Qual. 39, 669–674. doi: 10.1111/jfq.12250
Arshad, M. S., Farooq, M., Asch, F., Krishna, J. S. V., Prasad, P. V. V., Siddique, K. H. M. (2017). Thermal stress impacts reproductive development and grain yield in rice. Plant Physiol. Biochem. 115, 57–72. doi: 10.1016/j.plaphy.2017.03.011
Bahuguna, R. N., Solis, C. A., Shi, W., Jagadish, K. S. (2017). Post-flowering night respiration and altered sink activity account for high night temperature-induced grain yield and quality loss in rice (Oryza sativa L.). Physiol. Plant 159, 59–73. doi: 10.1111/ppl.12485
Bai, X., Luo, L., Yan, W., Kovi, M. R., Zhan, W., Xing, Y. (2010). Genetic dissection of rice grain shape using a recombinant inbred line population derived from two contrasting parents and fine mapping a pleiotropic quantitative trait locus qGL7. BMC Genet. 11, 16. doi: 10.1186/1471-2156-11-16
Cai, Y., Li, S., Jiao, G., Sheng, Z., Wu, Y., Shao, G., et al. (2018). OsPK2 encodes a plastidic pyruvate kinase involved in rice endosperm starch synthesis, compound granule formation and grain filling. Plant Biotechnol. J. 16, 1878–1891. doi: 10.1111/pbi.12923
Choi, B. S., Kim, Y. J., Markkandan, K., Koo, Y. J., Song, J. T., Seo, H. S. (2018). GW2 functions as an E3 ubiquitin ligase for rice expansin-like 1. Int. J. Mol. Sci. 19, 1904. doi: 10.3390/ijms19071904
Duan, P., Ni, S., Wang, J., Zhang, B., Xu, R., Wang, Y., et al. (2015). Regulation of OsGRF4 by OsmiR396 controls grain size and yield in rice. Nat. Plants 2, 15203. doi: 10.1038/nplants.2015.203
Duan, P., Xu, J., Zeng, D., Zhang, B., Geng, M., Zhang, G., et al. (2017). Natural variation in the promoter of GSE5 contributes to grain size diversity in rice. Mol. Plant 10, 685–694. doi: 10.1016/j.molp.2017.03.009
Fan, C., Xing, Y., Mao, H., Lu, T., Han, B., Xu, C., et al. (2006). GS3, a major QTL for grain length and weight and minor QTL for grain width and thickness in rice, encodes a putative transmembrane protein. Theor. Appl. Genet. 112, 1164–1171. doi: 10.1007/s00122-006-0218-1
Fiaz, S., Sheng, Z. H., Zeb, A., Barman, H. N., Shar, T., Ali, U., et al. (2021). Analysis of genomic regions for crude protein and fractions of protein using a recombinant inbred population in rice (Oryza sativa L.). J. Taibah Univ. Sci. 15, 579–588. doi: 10.1080/16583655.2021.1991733
Firouzi, S., Nikkhah, A., Aminpanah, H. (2018). Resource use efficiency of rice production upon single cropping and ratooning agro-systems in terms of bioethanol feedstock production. Energy 150, 694–701. doi: 10.1016/j.energy.2018.02.155
Gao, Q., Zhang, N., Wang, W. Q., Shen, S. Y., Bai, C., Song, X. J. (2021). The ubiquitin-interacting motif-type ubiquitin receptor HDR3 interacts with and stabilizes the histone acetyltransferase GW6a to control the grain size in rice. Plant Cell 33, 3331–3347. doi: 10.1093/plcell/koab194
Huang, R., Jiang, L., Zheng, J., Wang, T., Wang, H., Huang, Y., et al. (2013). Genetic bases of rice grain shape: So many genes, so little known. Trends Plant Sci. 18, 218–226. doi: 10.1016/j.tplants.2012.11.001
Huang, J., Pan, Y., Chen, H., Zhang, Z., Fang, C., Shao, C., et al. (2020). Physiochemical mechanisms involved in the improvement of grain-filling, rice quality mediated by related enzyme activities in the ratoon cultivation system. Field Crops Res. 258, 107962. doi: 10.1016/j.fcr.2020.107962
Hu, Z., Lu, S. J., Wang, M. J., He, H., Sun, L., Wang, H., et al. (2018). A novel QTL qTGW3 encodes the GSK3/SHAGGY-like kinase OsGSK5/OsSK41 that interacts with OsARF4 to negatively regulate grain size and weight in rice. Mol. Plant 11, 736–749. doi: 10.1016/j.molp.2018.03.005
Hu, J., Wang, Y., Fang, Y., Zeng, L., Xu, J., Yu, H., et al. (2015). A rare allele of GS2 enhances grain size and grain yield in rice. Mol. Plant 8, 1455–1465. doi: 10.1016/j.molp.2015.07.002
Jiang, L., Ma, X., Zhao, S., Tang, Y., Liu, F., Gu, P., et al. (2019a). The APETALA2-like transcription factor SUPERNUMERARY BRACT controls rice seed shattering and seed size. Plant Cell 31, 17–36. doi: 10.1105/tpc.18.00304
Jiang, H., Zhang, A., Liu, X., Chen, J. (2022). Grain size associated genes and the molecular regulatory mechanism in rice. Int. J. Mol. Sci. 23, 3169. doi: 10.3390/ijms23063169
Jiang, L., Zheng, Z., Qi, T., Kemper, K. E., Wray, N. R., Visscher, P. M., et al. (2019b). A resource-efficient tool for mixed model association analysis of large-scale data. Nat. Genet. 51, 1749–1755. doi: 10.1038/s41588-019-0530-8
Jiao, Y., Wang, Y., Xue, D., Wang, J., Yan, M., Liu, G., et al. (2010). Regulation of OsSPL14 by OsmiR156 defines ideal plant architecture in rice. Nat. Genet. 42, 541–544. doi: 10.1038/ng.591
Kang, H. M., Sul, J. H., Service, S. K., Zaitlen, N. A., Kong, S. Y., Freimer, N. B., et al. (2010). Variance component model to account for sample structure in genome-wide association studies. Nat. Genet. 42, 348–354. doi: 10.1038/ng.548
Liang, P., Wang, H., Zhang, Q., Zhou, K., Li, M., Li, R., et al. (2021). Identification and pyramiding of QTLs for rice grain size based on short-wide grain CSSL-Z563 and fine-mapping of qGL3-2. Rice 14, 35. doi: 10.1186/s12284-021-00477-w
Li, Y., Fan, C., Xing, Y., Jiang, Y., Luo, L., Sun, L., et al. (2011). Natural variation in GS5 plays an important role in regulating grain size and yield in rice. Nat. Genet. 43, 1266–1269. doi: 10.1038/ng.977
Li, N., Xu, R., Duan, P., Li, Y. (2018). Control of grain size in rice. Plant Reprod. 31, 237–251. doi: 10.1007/s00497-018-0333-6
Li, N., Xu, R., Li, Y. (2019). Molecular networks of seed size control in plants. Annu. Rev. Plant Biol. 70, 435–463. doi: 10.1146/annurev-arplant-050718-095851
Li, M., Zhang, Y. W., Xiang, Y., Liu, M. H., Zhang, Y. M. (2022b). IIIVmrMLM: The r and c++ tools associated with 3VmrMLM, a comprehensive GWAS method for dissecting quantitative traits. Mol. Plant 15, 1251–1253. doi: 10.1016/j.molp.2022.06.002
Li, M., Zhang, Y. W., Zhang, Z. C., Xiang, Y., Liu, M. H., Zhou, Y. H., et al. (2022a). A compressed variance component mixed model for detecting QTNs and QTN-by-environment and QTN-by-QTN interactions in genome-wide association studies. Mol. Plant 15, 630–650. doi: 10.1016/j.molp.2022.02.012
Li, Y., Zheng, L., Corke, F., Smith, C., Bevan, M. W. (2008). Control of final seed and organ size by the DA1 gene family in Arabidopsis thaliana. Gene Dev. 22, 1331–1336. doi: 10.1101/gad.463608
Li, Q. F., Zhou, Y., Xiong, M., Ren, X. Y., Han, L., Wang, J. D., et al. (2020). Gibberellin recovers seed germination in rice with impaired brassinosteroid signalling. Plant Sci. 293, 110435. doi: 10.1016/j.plantsci.2020.110435
Liu, J., Chen, J., Zheng, X., Wu, F., Lin, Q., Heng, Y., et al. (2017). GW5 acts in the brassinosteroid signalling pathway to regulate grain width and weight in rice. Nat. Plants 3, 17043. doi: 10.1038/nplants.2017.43
Liu, J. Y., Zhang, Y. W., Han, X., Zuo, J. F., Zhang, Z., Sang, H., et al. (2020). An evolutionary population structure model reveals pleiotropic effects of GmPDAT for traits related to seed size and oil content in soybean. J. Exp. Bot. 71, 6988–7002. doi: 10.1093/jxb/eraa426
Lou, J., Chen, L., Yue, G., Lou, Q., Mei, H., Xiong, L., et al. (2009). QTL mapping of grain quality traits in rice. J. Cereal Sci. 50, 145–151. doi: 10.1016/j.jcs.2009.04.005J
Lu, W., Deng, M., Guo, F., Wang, M., Zeng, Z., Han, N., et al. (2016). Suppression of OsVPE3 enhances salt tolerance by attenuating vacuole rupture during programmed cell death and affects stomata development in rice. Rice 9, 65. doi: 10.1186/s12284-016-0138-x
Mao, H., Sun, S., Yao, J., Wang, C., Yu, S., Xu, C., et al. (2010). Linking differential domain functions of the GS3 protein to natural variation of grain size in rice. Proc. Natl. Acad. Sci. U. S. A. 107, 19579–19584. doi: 10.1073/pnas.1014419107
Matsushima, R., Maekawa, M., Kusano, M., Tomita, K., Kondo, H., Nishimura, H., et al. (2016). Amyloplast membrane protein SUBSTANDARD STARCH GRAIN6 controls starch grain size in rice endosperm. Plant Physiol. 170, 1445–1459. doi: 10.1104/pp.15.01811
Qi, P., Lin, Y. S., Song, X. J., Shen, J. B., Huang, W., Shan, J. X., et al. (2012). The novel quantitative trait locus GL3.1 controls rice grain size and yield by regulating Cyclin-T1;3. Cell Res. 22, 1666–1680. doi: 10.1038/cr.2012.151
Rahimsoroush, H., Nazarian-Firouzabadi, F., Chaloshtari, M. H. (2021). Identification of main and epistatic QTLs and QTL through environment interactions for eating and cooking quality in Iranian rice. Euphytica 217, 25. doi: 10.1007/s10681-020-02759-8
Rosegrant, M. W., Cline, S. A. (2003). Global food security: Challenges and policies. Science 302, 1917–1919. doi: 10.1126/science.1092958
Ruan, B., Shang, L., Zhang, B., Hu, J., Wang, Y., Lin, H., et al. (2020). Natural variation in the promoter of TGW2 determines grain width and weight in rice. New Phytol. 227, 629–640. doi: 10.1111/nph.16540
Shen, X., Zhang, L., Zhang, J. (2021). Ratoon rice production in central China: Environmental sustainability and food production. Sci. Total Environ. 764, 142850. doi: 10.1016/j.scitotenv.2020.142850
Si, L., Chen, J., Huang, X., Gong, H., Luo, J., Hou, Q., et al. (2016). OsSPL13 controls grain size in cultivated rice. Nat. Genet. 48, 447–456. doi: 10.1038/ng.3518
Song, X. J., Huang, W., Shi, M., Zhu, M. Z., Lin, H. X. (2007). A QTL for rice grain width and weight encodes a previously unknown RING-type E3 ubiquitin ligase. Nat. Genet. 39, 623–630. doi: 10.1038/ng2014
Song, X. J., Kuroha, T., Ayano, M., Furuta, T., Nagai, K., Komeda, N., et al. (2015). Rare allele of a previously unidentified histone H4 acetyltransferase enhances grain weight, yield, and plant biomass in rice. Proc. Natl. Acad. Sci. U. S. A. 112, 76–81. doi: 10.1073/pnas.1421127112
Teng, Z., Chen, Y., Yuan, Y., Peng, Y., Yi, Y., Yu, H., et al. (2022). Identification of microRNAs regulating grain filling of rice inferior spikelets in response to moderate soil drying post-anthesis. Crop J. 10, 962–971. doi: 10.1016/j.cj.2021.11.004
Wang, W. Q., He, A. B., Jiang, G. L., Sun, H. J., Jiang, M., Man, J. G., et al. (2020). Chapter four - ratoon rice technology: A green and resource-efficient way for rice production. Adv. Agron. 159, 135–167. doi: 10.1016/bs.agron.2019.07.006
Wang, S., Lei, C., Wang, J., Ma, J., Tang, S., Wang, C., et al. (2017). SPL33, encoding an eEF1A-like protein, negatively regulates cell death and defense responses in rice. J. Exp. Bot. 68, 899–913. doi: 10.1093/jxb/erx001
Wang, S., Li, S., Liu, Q., Wu, K., Zhang, J., Wang, S., et al. (2015a). The OsSPL16-GW7 regulatory module determines grain shape and simultaneously improves rice yield and grain quality. Nat. Genet. 47, 949–954. doi: 10.1038/ng.3352
Wang, Z., Wang, Y., Hong, X., Hu, D., Liu, C., Yang, J., et al. (2015b). Functional inactivation of UDP-n-acetylglucosamine pyrophosphorylase 1 (UAP1) induces early leaf senescence and defence responses in rice. J. Exp. Bot. 66, 973–987. doi: 10.1093/jxb/eru456
Wu, C., Cui, K., Fahad, S. (2022). Heat stress decreases rice grain weight: Evidence and physiological mechanisms of heat effects prior to flowering. Int. J. Mol. Sci. 23, 10922. doi: 10.3390/ijms231810922
Wuriyanghan, H., Zhang, B., Cao, W. H., Ma, B., Lei, G., Liu, Y. F., et al. (2009). The ethylene receptor ETR2 delays floral transition and affects starch accumulation in rice. Plant Cell 21, 1473–1494. doi: 10.1105/tpc.108.065391
Wu, S., Xie, Y., Zhang, J., Ren, Y., Zhang, X., Wang, J., et al. (2015). VLN2 regulates plant architecture by affecting microfilament dynamics and polar auxin transport in rice. Plant Cell 27, 2829–2845. doi: 10.1105/tpc.15.00581
Xia, D., Zhou, H., Liu, R., Dan, W., Li, P., Wu, B., et al. (2018). GL3.3, a novel QTL encoding a GSK3/SHAGGY-like kinase, epistatically interacts with GS3 to produce extra-long grains in rice. Mol. Plant 11, 754–756. doi: 10.1016/j.molp.2018.03.006
Xie, X., Jin, F., Song, M. H., Suh, J. P., Hwang, H. G., Kim, Y. G., et al. (2008). Fine mapping of a yield-enhancing QTL cluster associated with transgressive variation in an Oryza sativa × O. rufipogon cross. Theor. Appl. Genet. 116, 613–622. doi: 10.1007/s00122-007-0695-x
Xing, Y., Zhang, Q. (2010). Genetic and molecular bases of rice yield. Annu. Rev. Plant Biol. 61, 421–442. doi: 10.1146/annurev-arplant-042809-112209
Ying, J. Z., Ma, M., Bai, C., Huang, X. H., Liu, J. L., Fan, Y. Y., et al. (2018). TGW3, a major QTL that negatively modulates grain length and weight in rice. Mol. Plant 11, 750–753. doi: 10.1016/j.molp.2018.03.007
Yuan, H., Gao, P., Hu, X., Yuan, M., Xu, Z., Jin, M., et al. (2022a). Fine mapping and candidate gene analysis of qGSN5, a novel quantitative trait locus coordinating grain size and grain number in rice. Theor. Appl. Genet. 135, 51–64. doi: 10.1007/s00122-021-03951-7
Yuan, S., Yang, C., Yu, X., Zheng, C., Xiao, S., Xu, L., et al. (2022b). On-farm comparison in grain quality between main and ratoon crops of ratoon rice in hubei province, central China. J. Sci. Food Agric. 102, 7259–7267. doi: 10.1002/jsfa.12091
Zhang, Z., Ersoz, E., Lai, C. Q., Todhunter, R. J., Tiwari, H. K., Gore, M. A., et al. (2010). Mixed linear model approach adapted for genome-wide association studies. Nat. Genet. 42, 355–360. doi: 10.1038/ng.546
Zhang, X., Wang, J., Huang, J., Lan, H., Wang, C., Yin, C., et al. (2012). Rare allele of OsPPKL1 associated with grain length causes extra-large grain and a significant yield increase in rice. Proc. Natl. Acad. Sci. U. S. A. 109, 21534–21539. doi: 10.1073/pnas.1219776110
Zhao, D. S., Li, Q. F., Zhang, C. Q., Zhang, C., Yang, Q. Q., Pan, L. X., et al. (2018). GS9 acts as a transcriptional activator to regulate rice grain shape and appearance quality. Nat. Commun. 9, 1240. doi: 10.1038/s41467-018-03616-y
Zhao, Y. F., Peng, T., Sun, H. Z., Teotia, S., Wen, H. L., Du, Y. X., et al. (2019). miR1432-OsACOT (Acyl-CoA thioesterase) module determines grain yield via enhancing grain filling rate in rice. Plant Biotechnol. J. 17, 712–723. doi: 10.1111/pbi.13009
Zhou, S., Li, X., Liu, Q., Zhao, Y., Jiang, W., Wu, A., et al. (2021). DNA Demethylases remodel DNA methylation in rice gametes and zygote and are required for reproduction. Mol. Plant 14, 1569–1583. doi: 10.1016/j.molp.2021.06.006
Zhou, X., Stephens, M. (2012). Genome-wide efficient mixed-model analysis for association studies. Nat. Genet. 44, 821–824. doi: 10.1038/ng.2310
Ziska, L. H., Fleisher, D. H., Linscombe, S. (2018). Ratooning as an adaptive management tool for climatic change in rice systems along a north-south transect in the southern Mississippi valley. Agr. Forest. Meteorol. 263, 409–416. doi: 10.1016/j.agrformet.2018.09.010
Keywords: rice, grain size, QTN, QTN-by-environment interaction, ratoon rice, 3VmrMLM
Citation: Zhao Q, Shi X-S, Wang T, Chen Y, Yang R, Mi J, Zhang Y-W and Zhang Y-M (2023) Identification of QTNs, QTN-by-environment interactions, and their candidate genes for grain size traits in main crop and ratoon rice. Front. Plant Sci. 14:1119218. doi: 10.3389/fpls.2023.1119218
Received: 09 December 2022; Accepted: 13 January 2023;
Published: 02 February 2023.
Edited by:
Jianlong Xu, Institute of Crop Sciences (CAAS), ChinaReviewed by:
Chenwu Xu, Yangzhou University, ChinaLongbiao Guo, China National Rice Research Institute (CAAS), China
Dali Zeng, Zhejiang Agriculture and Forestry University, China
Copyright © 2023 Zhao, Shi, Wang, Chen, Yang, Mi, Zhang and Zhang. This is an open-access article distributed under the terms of the Creative Commons Attribution License (CC BY). The use, distribution or reproduction in other forums is permitted, provided the original author(s) and the copyright owner(s) are credited and that the original publication in this journal is cited, in accordance with accepted academic practice. No use, distribution or reproduction is permitted which does not comply with these terms.
*Correspondence: Ya-Wen Zhang, eWF3ZW5AbWFpbC5oemF1LmVkdS5jbg==; Jiaming Mi, bWptQG1haWwuaHphdS5lZHUuY24=
†These authors have contributed equally to this work