 Min Shen1,2Chuang Cai1*Lian Song1Jiangbo Qiu3Chuanqi Ma1,2Dongming Wang1,2Xinyue Gu1,2Xiong Yang1,2Wei Wei1,2Ye Tao1,2Jishuang Zhang1,2Gang Liu1Chunwu Zhu1*
- 1State Key Laboratory of Soil and Sustainable Agriculture, Institute of Soil Science, Chinese Academy of Sciences, Nanjing, China
- 2University of Chinese Academy of Sciences, Beijing, China
- 3School of Environmental and Civil Engineering, Jiangnan University, Wuxi, China
Sheath blight (ShB), caused by Rhizoctonia solani, is one of the major threats to rice (Oryza sativa L.) production. However, it is not clear how the risk of rice ShB will respond to elevated CO2 and temperature under future climate change. Here, we conducted, field experiments of inoculated R. solani under combinations of two CO2 levels (ambient and enriched up to 590 μmol mol-1) and two temperature levels (ambient and increased by 2.0°C) in temperature by free-air CO2 enrichment (T-FACE) system for two cultivars (a susceptible cultivar, Lemont and a resistant cultivar, YSBR1). Results indicate that for the inoculation of plants with R. solani, the vertical length of ShB lesions for cv. Lemont was significantly longer than that for cv. YSBR1 under four CO2 and temperature treatments. The vertical length of ShB lesions was significantly increased by elevated temperature, but not by elevated CO2, for both cultivars. The vertical length of ShB lesions under the combination of elevated CO2 and elevated temperature was increased by 21–38% for cv. Lemont and by -1–6% for cv. YSBR1. A significant increase in MDA level was related to a significant increase in the vertical length of ShB lesions under the combination of elevated CO2 and elevated temperature. Elevated CO2 could not compensate for the negative effect of elevated temperature on yield of both cultivars under future climate change. Rice yield and biomass were further decreased by 2.0–2.5% and 2.9–4.2% by an increase in the severity of ShB under the combination of elevated CO2 and elevated temperature. Thus, reasonable agronomic management practices are required to improve both resistance to ShB disease and grain yield for rice under future climate change.
1 Introduction
Rice (Oryza sativa L.), one of the most important food crops, serves as the staple food for approximately 67% of the world population (Senapati et al., 2022). Sheath blight (ShB), caused by Rhizoctonia solani Kühn (Thanatephorus cucumeris (Frank) Donk), is a potentially devastating rice disease in all temperate and tropical rice production regions, especially in irrigated production systems (Gangopadhyay and Chakrabarti, 1982; Lee and Rush, 1983; Ou, 1985; Dath, 1990; Rush and Lee, 1992; Rodrigues et al., 2001). The disease was first reported in Japan in 1910 and has subsequently spread to almost all rice-growing area in the world (Rush and Lee, 1992; Senapati et al., 2022). Economic losses in rice yields up to 58% have reportedly been demonstrated, due to widespread occurrence (Chahal et al., 2003).
Meteorological factors, such as air temperature, could directly influence the growth of R. solani in the field (Castilla et al., 1996; Thind et al., 2008; Biswas et al., 2011; Bhukal et al., 2015; Senapati et al., 2022). Correlation analysis showed that high air temperature associated with high relative humidity in the forenoon is a major predisposing factor for the development of ShB in rice (Castilla et al., 1996; Biswas et al., 2011). Maximum spread of ShB was observed in a temperature range of 25–30°C and relative humidity of 80–100%, and a maximum temperature around 34°C and a minimum temperature around 26°C were found to be favorable for the dispersal of ShB after its establishment in the field (Thind et al., 2008; Biswas et al., 2011; Bhukal et al., 2015; Senapati et al., 2022). Among the meteorological factors, atmospheric CO2 concentration and air temperature have been increasing rapidly, and probably the CO2 level will reach 500–1000 μmol mol-1 and the air temperature will increase by 1.0–3.7°C by the end of this century (Ciais et al., 2013). Increased air temperatures are expected to have a significant impact on plant diseases (Chakraborty et al., 2000; Chakraborty, 2001). Manning and Tiedermann (1995) pointed out that elevated CO2 increased plant size and canopy density, and thus the canopy microclimate favored the development of various diseases. Elevated CO2 had no effect on the incidence of the panicle blast phase of the disease, but increased the incidence of naturally sheath blight in rice (Kobayashi et al., 2006). Meanwhile, Kobayashi et al. (2006) suggested that the impacts of global increase in atmospheric CO2 on crop production in the future must take into account in the increased risks of the plant to diseases. However, it is still unclear whether elevated CO2 and temperature will increase the severity of rice ShB under future climate conditions and thus lead to rice yield losses.
The T- FACE (temperature by free- air CO2 enrichment) system can best mimic the elevated CO2 and temperature conditions of future climates and provides a unique opportunity to evaluate the “real” effects of elevated CO2 and/or temperature on rice ShB risk, as this system allows crops and R. solani to be grown under elevated CO2 and temperature condition in natural and fully open fields. Kobayashi et al. (2006) reported that FACE (free-air CO2 enrichment) system used in the field without any enclosures, could minimize the artificial effect that is inevitable with the enclosure approach. Thompson and Drake (1994) found that the severity of rust in Scirpus olneyi plants may have been lower in the enclosed chambers, such as growth chambers and cabinets, than in the field plots, considering the barrier that the enclosed chambers present. In addition, enclosures alter microclimate for the plants and may change the responses of plant to elevated CO2 (McLeod and Long, 1999). The effects of elevated CO2 and temperature on crop growth response also differed greatly between studies in enclosed chambers and T-FACE (Long et al., 2004; Long et al., 2006), which may result in different responses of rice ShB to elevated CO2 and temperature. This is because growth of R. solani needs certain carbon and nitrogen sources provided by rice plants (Chen et al., 2002; Wang et al., 2004). However, the responses of rice ShB to elevated CO2 and temperature have not yet been quantified in T-FACE systems.
Susceptibility of rice to R. solani can be affected by rice morphological parameters, such as plant height, stem thickness and tiller angle, length and width of flag leaf, days to heading and planting density (Senapati et al., 2022). Some studies found that the susceptibility of rice to R. solani was also related to rice physiological parameters, such as carbohydrate metabolism, phenolic compounds, flavonoids, lignin, membrane lipid peroxidation (MDA) level and POD, PPO and SOD activities (Ertani et al., 2011; Zuo et al., 2014a; Zuo et al., 2014b; Molla et al., 2020). Previous studies found that elevated CO2 increased the number of tillers per plant, which increased the likelihood of ShB disease spread between more densely packed neighbouring plants (Kobayashi et al., 2006). Moreover, elevated CO2 was reported to reduce leaf nitrogen content, but increase the C:N ratio, total phenolics and tannins, which probably reduced disease severity (Eastburn et al., 2011). In addition, elevated temperature accelerated plant growth and developmental rates, which modified canopy architecture and affected pathogen development (Pangga et al., 2013).
The main objectives of this study are: (i) to analyze whether elevated CO2 and temperature increase ShB disease severity in rice, (ii) if so, which morphological and physiological parameters are associated with the increase in ShB disease severity, and (iii) to what extent growth and yield losses are caused by the increase in ShB disease severity. To this end, ShB lesion length, morphological and physiological parameters, above-ground biomass, and grain yields were therefore assessed for two rice cultivars, cvs Lemont and YSBR1 over two growing seasons under T- FACE environments. Of the two cultivars, cv. Lemont is a ShB disease susceptible variety, while cv. YSBR1 is a ShB disease resistant variety. Therefore, we also aim to investigate whether there is any difference between the two cultivars in terms of the effects of elevated CO2 and temperature on severity of ShB disease. Such information would provide the basis for selecting rice cultivars to reduce yield losses caused by ShB disease and to ensure food security under future climates with elevated CO2 and temperature.
2 Materials and methods
2.1 Experiment site and detailed conditions of the T-FACE system
Field experiments were conducted in the T-FACE system, established in Kangbo village (31°30’N, 120°33’E), Guli Township, Changshu Municipality, Jiangsu, China. The area is located in the centre of the Tai Lake Plain, and has a subtropical monsoon climate. The T-FACE system had twelve octagonal plots located in different sites with similar soils and agronomic history (Liu et al., 2014; Zhang et al., 2015; Cai et al., 2016) (Figures 1A, B). More detailed information of the T-FACE system was described by Cai et al. (2016); Cai et al., 2018; Cai et al. (2019). Four treatments designed, one with targeted atmospheric CO2 up to 590 μmol mol-1 during daytime (C+T), one with canopy temperature warming 2.0°C above ambient (CT+), and one with combined CO2 enrichment and warming (C+T+), with an untreated plot with ambient condition as control (CT). Each treatment was set three replications (Figures 1A, B). Daily data for air temperature (sensor: HMP155A; Campbell Scientific Inc., Logan, UT, USA) and global solar radiation (sensor: LI190SB; Li-COR Inc., Lin-coln, NE, USA) under ambient condition were recorded by the weather station at the experimental site, using the CR1000 Campbell datalogger (Campbell Scientific Inc.). Information of the daytime and nighttime increases in canopy temperature implemented under CT+ and C+T+, and the daytime increase in CO2 concentration implemented under C+T and C+T+ were also record by using the CR1000 Campbell datalogger (Table 1). Meanwhile, information on weather conditions such as mean daily air temperature and global solar radiation under ambient conditions, and level of nitrogen (N) application over the entire rice growing cycle under four CO2 and temperature treatments are summarized in Table 1.
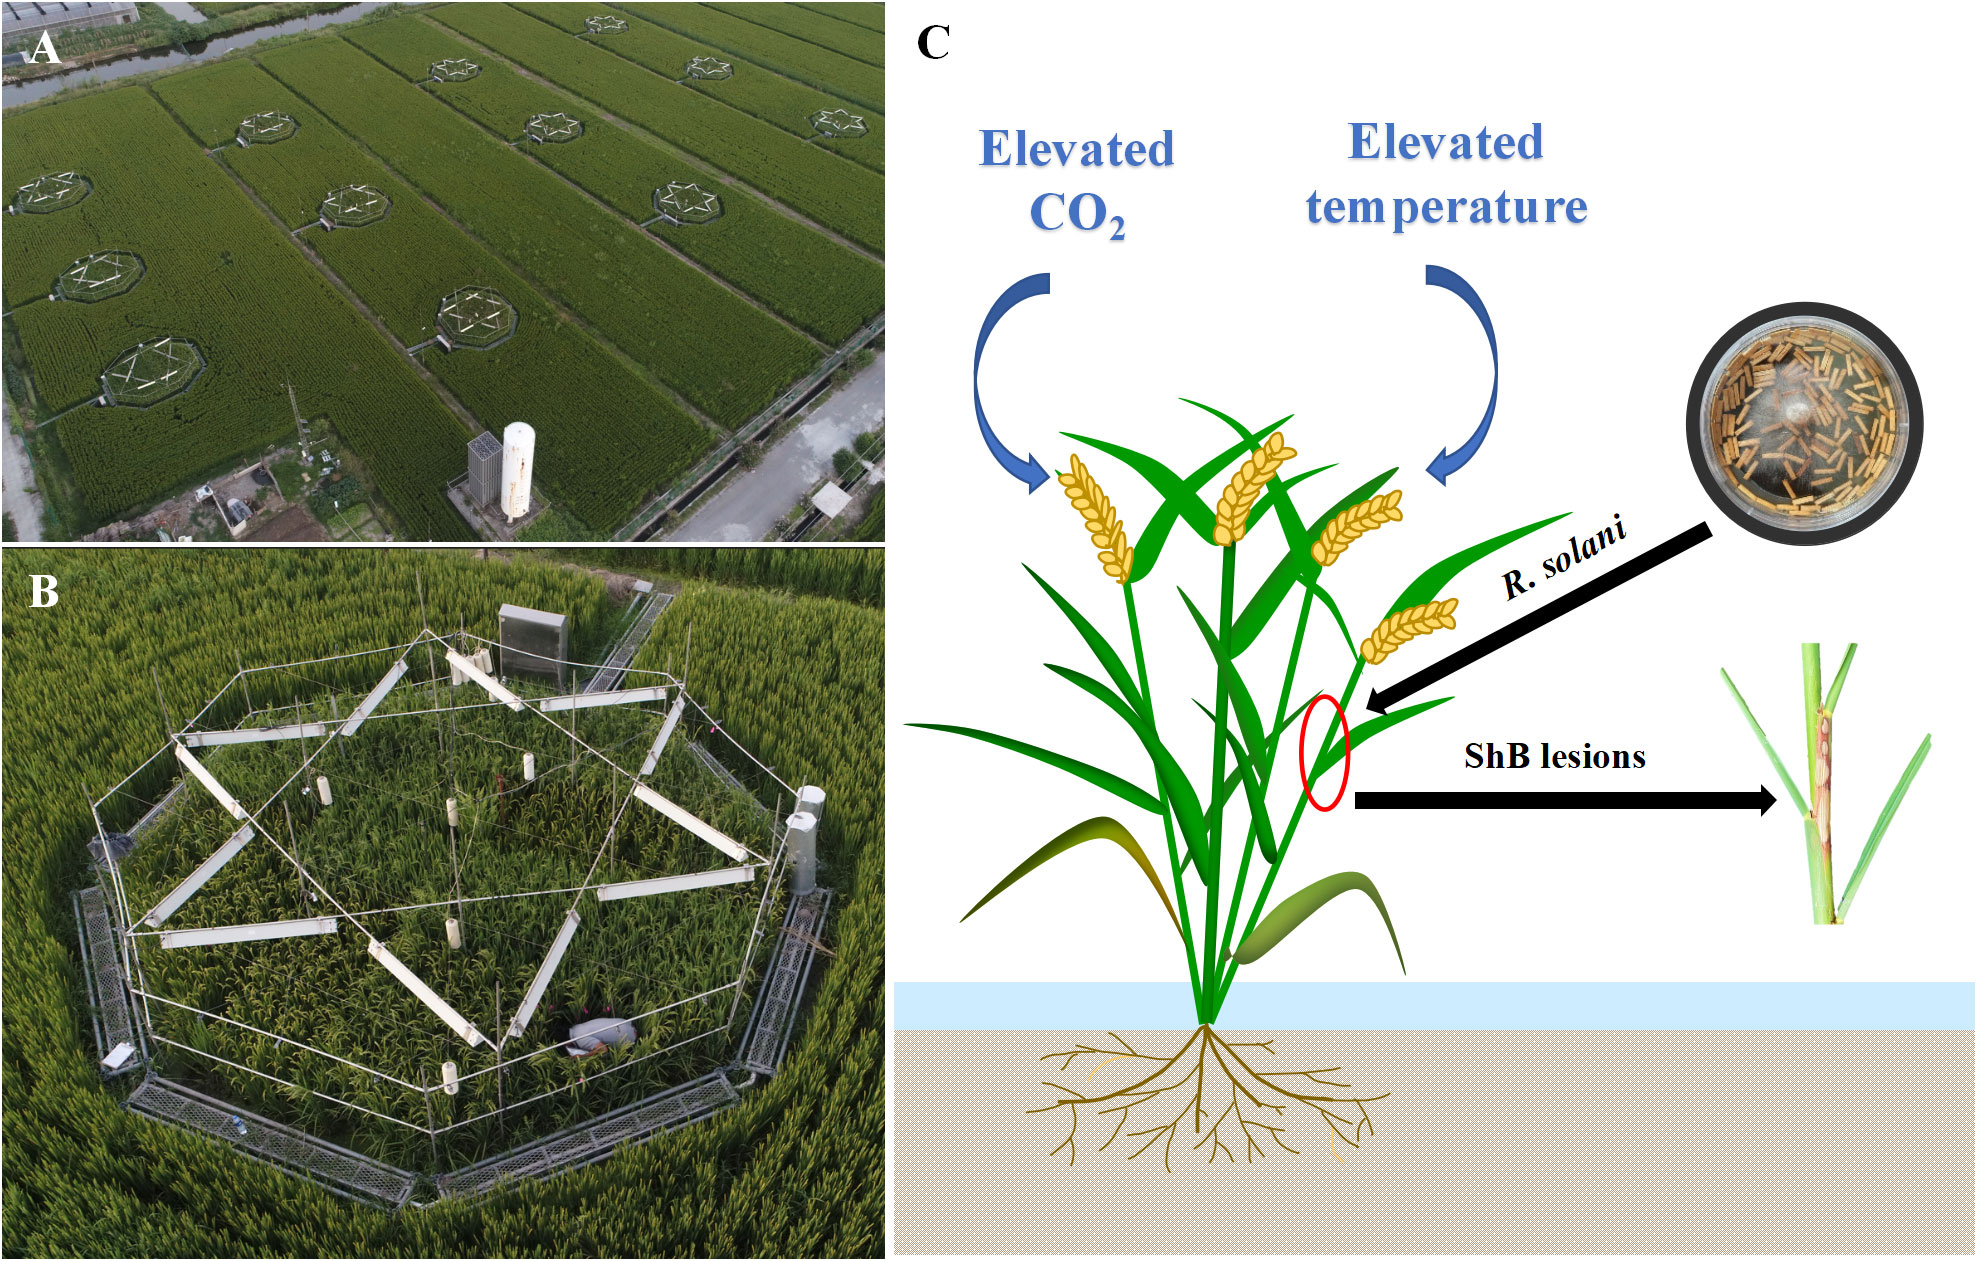
Figure 1 (A, B) In this T-FACE experiment, four treatments were designed with twelve octagonal plots: two CO2 levels (ambient and enriched up to 590 μmol mol-1) and two temperature levels (ambient and increased by 2.0°C). Each treatment was set three repetitions. (C) For inoculation experiment, the inoculum with R. solani was placed 1 cm depth inside the third sheath from top, then plant was infected forming ShB lesions.
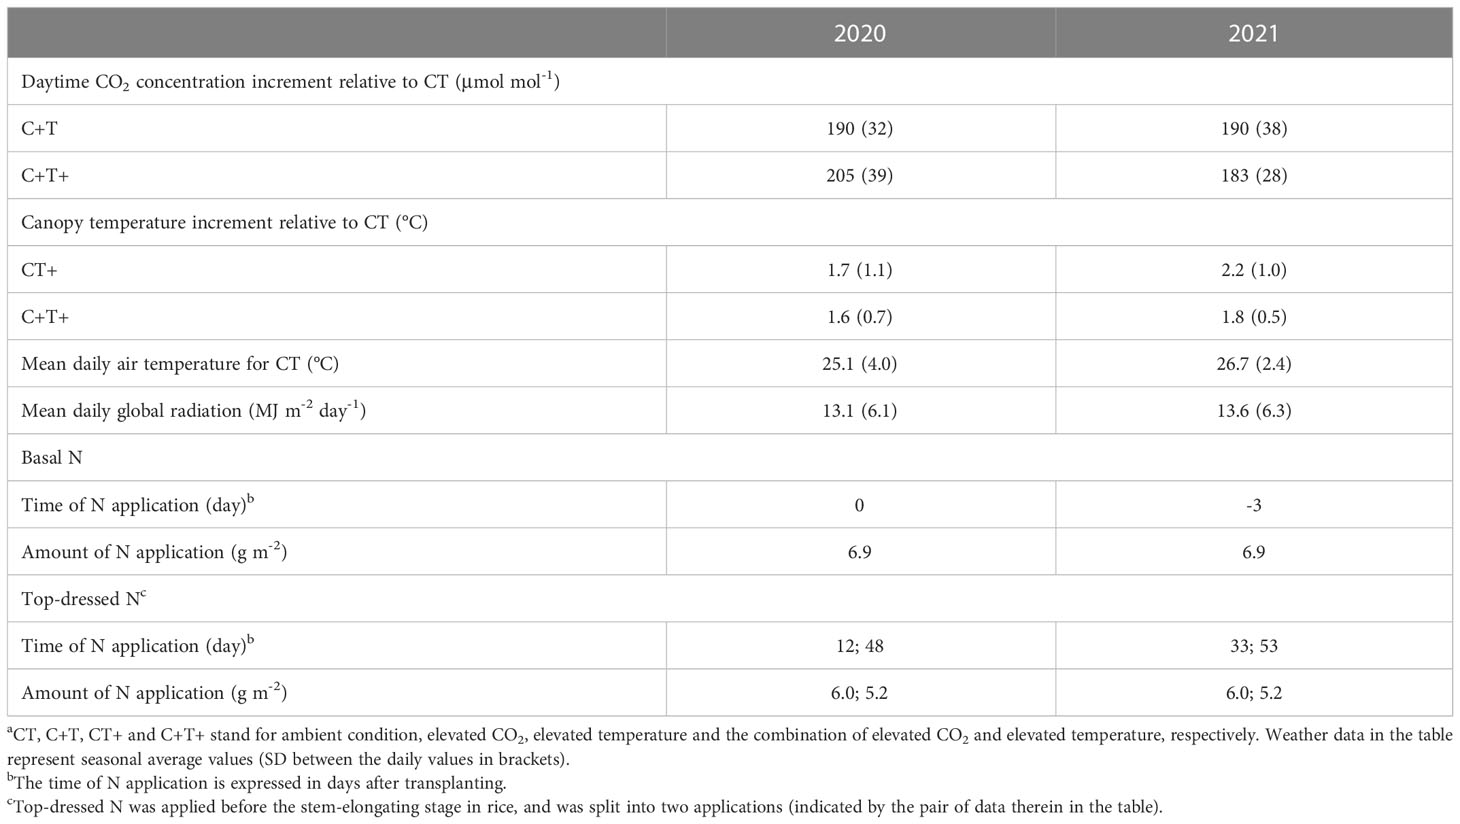
Table 1 Summary of environment conditions in T-FACE experiments of 2020 and 2021a.
2.2 Crop cultivation
In the 2020 and 2021 rice experimental seasons, two rice cultivars cvs Lemont (a japonica subspecies), and YSBR1 (an indica subspecies), were grown in field. Cv. Lemont is susceptible to rice ShB, while cv. YSBR1 shows high resistance to rice ShB (Zuo et al., 2009; Xue et al., 2016). For cvs Lemont and YSBR1, seeds were first germinated in the field under the same ambient condition. And then three-leaf-stage seedings were manually transplanted at a density of two seedings per hill for both two cultivars on June 22 (2020) and June 26 (2021). The spacing between hills was set at 16.7 cm × 25 cm for both two cultivars (equivalent to 24 hills m-2).
2.3 Pathogen inoculation and lesion survey
For ShB fungus inoculation, the YN-7 isolate, R. solani with moderate pathogenicity was used in this study and several previous studies (Zuo et al., 2008; Zhu et al., 2014; Chen et al., 2016; Xue et al., 2016). Briefly, autoclaved, truncated, thin matchsticks with a length of 1.0 cm and a width of 2 mm were incubated with YN-7 on potato dextrose broth (PDB) medium for 3 to 4 days in the dark at 28°C, based on Zou et al. (2000). Secondly, the woody matchsticks colonized by the ShB fungus were used as the inoculum, according to Xue et al. (2016). Then, the inoculation in the field was conducted at the booting stage of rice (Wang et al., 2011; Zuo et al., 2013). Each treatment was planted in three plots (replicates) and 48 hills in 2 m2 were planted in each plot for both cultivars cvs Lemont and YSBR1. Half of each plot under four CO2 and temperature treatments was used for inoculation. In each subplot for inoculation, two rice cultivars were planted in six rows, with 8 hills/row, and the central 12 hills for each cultivar were inoculated with the inoculum of R. solani. Inoculum of R. solani was placed 1 cm depth inside the third sheath, counting from top to bottom without changing the sheath-stem holding status for three main stems per hill, according to Zuo et al. (2013) (Figure 1C). In both 2020 and 2021 T-FACE experiments, inoculation of R. solani was performed on August 17 (at the booting stage). Disease severity was represented by the vertical length of ShB lesions referring to the total length of lesions with inoculated stem in the vertical direction (Zuo et al., 2009). The lesion length was measured with a ruler on August 21, 23 and September 4, 2020, and August 21, 23, 25 and September 4, 2021.
2.4 Plant sampling and data collection
2.4.1 Measurement of morphological parameters
For plants of both cultivars in uninoculated area of each subplot, we measured their morphological parameters including tiller number (TN), plant height (PH), flag leaf length (FLL), flag leaf width (FLW), stem diameter (SSD), stem wall thickness (SWT) and specific leaf weight (SLW) on Aug. 26, 2021. For each cultivar, we counted tiller number for 12 hills in each subplot. Then PH was measured from the soil surface to the tips of the tallest flag leaves of each hill with five replicates in each subplot. FLL and FLW were measured as the length and widest length with five flag leaves as replicates in each subplot. SSD and SWT were measured with cross type by using vernier caliper with five main stems as replicates in each subplot. SLW was calculated as the ratio of dry weight to flag leaf area with five flag leaves as replications in each subplot.
Then, three representative hills of each subplot were selected and destructively sampled on August 26, 2021. The samples were separated into leaves and stems (including leaf sheaths). Three fresh leaf sheaths from each subplot were stored at -20 °C and then plant parts were oven-dried (DHG-9240A, China) at 105°C for 30 minutes and then at 80°C until constant weight. Firstly, the wax content of sheath (WCS) was measured by cutting the fresh leaf sheath into pieces, placing 2.0 g (W) in a beaker, adding 30 ml of chloroform, and soaking for 1 minute. Finally, the soaking solution was filtered to the weighed beaker (W1) into the fume hood until the chloroform volatilization was completed, and the constant beaker (W2) was weighed again. The following formula was used to calculate the wax content of sheath:
where W is the weight of sample, W1 is the weighed beaker mass (g), and W2 is the mass of beaker after chloroform volatilization (g) (Zhou et al., 2007; Zuo et al., 2014b).
In addition, a dry sample (0.5g) of fine powder was placed in a beaker, 12 ml of HNO3 and 3 ml HClO4 were added into each beaker including three empty ones (control), and then soaked overnight. Next day, all beakers were placed on a heating plate and the digestion temperature was set at 220 °C to digest the fine powder. When the solution layer was boiled to be clarified, the temperature was set to 300 °C to remove the excess acid. The cooling remaining solution was transferred into a 50 ml volumetric bottle and pure deionized water was added up to 50 ml. Finally, the Si content of leaf and stem was determined by High Performance Liquid Chromatography Inductively Couple Plasma Mass Spectrometry (HPLC-ICP-MS, 7700X, Agilent, Palo Alto, California, USA).
2.4.2 Determination of physiological parameters
Physiological parameters, including carbohydrate and phenolic metabolites, membrane lipid peroxidation and antioxidant enzymes of the stems, were determined for inoculated and uninoculated areas under four CO2 and temperature treatments in 2021 T-FACE experiment. As the infection of R. solani formed the lesions on the stems and rapid development of lesion length occurred at the early stage of inoculation, we collected the fresh samples of inoculated and uninoculated stems (including leaf sheaths) and stored at -80°C on August 26 (10 days after inoculation) for determinations of these physiological parameters.
2.4.2.1 Carbohydrate metabolites
Soluble sugar, starch and cellulose contents of stems were determined. Some carbohydrates can provide some carbon nutrition for R. solani (Wang et al., 2004). Firstly, the soluble sugar content of fresh stems was determined using the anthrone colorimetry method as described by Fairbairn (1953). Essentially, 0.2 g of fresh stem was cut into pieces and placed in a tube with 10 ml pure water, then the solution was boiled twice for 30 minutes. The solution was filtered and washed several times and fixed into a 50 ml volumetric flask. The next, 0.5 ml solution was taken and 1.5 ml pure water was added for determination, 0.5 ml anthrone and 5 ml sulphuric acid were added and mixed well. Finally, the solution was subjected to color-reaction at 100°C for 1 minute, and then was placed at room temperature for 10 –15 minutes to cool down, and the optical density was measured at 620 nm by using UV-Visible Spectrophotometer (Thermo Evolution 201, Waltham, MA, USA). The content of soluble sugar was expressed as percentage of fresh weight (% FW).
Secondly, the starch of stems was determined by acid hydrolysis method using the kit (G0507W, Suzhou Grace Bio-technology Co., LTD, Suzhou, China) (Luo et al., 2020). The frozen samples of stems were grounded to powder in liquid nitrogen, and 0.1 g sample was added to 1 mL of 80% ethanol and extracted at 80 °C water bath for 30 minutes, the extraction buffer was centrifuged at 3000 rpm for 5 minutes at room temperature. The extraction was decomposed into glucose, and then the glucose content was determined by anthrone colorimetry. Then the determination wavelength is 620 nm by UV-Visible Spectrophotometer (Thermo Evolution 201, Waltham, MA, USA). The content of starch was expressed as percentage of fresh weight (% FW).
Finally, the cellulose content of stems was determined using the kit (G0715W, Suzhou Grace Bio-technology Co. LTD, Suzhou, China) based on hydrolysis and dehydration of cellulose into furfural compounds, which can react with anthrone (Fan et al., 2021). Briefly, 0.1 g of fresh sample was weighed, and 1.5 mL of 80% ethanol was added to grind the homogenate. The extraction was taken at 50 °C in water bath for 20 minutes and took out the running water and cooled it. Then the extraction buffer was centrifuged at 12000 rpm at 25 °C for 10 minutes and discarded the supernatant to keep the sediment. The sediment was added 1mL acetone to centrifuge at 12000 rpm at 25 °C for 10 minutes and the supernatant was discarded to keep the sediment. Then the starch was removed from sediment and acid buffer was added. The mixed solution was centrifuged at 8000 rpm at 25 °C for 5 minutes, and the anthrone reagent was added to the supernatant. The optical density of solution was measured at 620 nm by using UV-Visible Spectrophotometer (Thermo Evolution 201, Waltham, MA, USA). The content of cellulose was expressed as percentage of fresh weight (% FW).
2.4.2.2 Phenolic metabolites
Total phenol, flavonoid and lignin contents of the stems were determined. Firstly, total phenol content of stems was determined colorimetrically using the Folin-Ciocalteau’s method (Aires et al., 2011; Goufo et al., 2014), with modifications. The 60% methanol extract was mixed with FC reagent and developed with 7.5% Na2CO3. The mixture was shaken vigorously, and then heated at 45 °C for 15 minutes. The absorption value was measured at 760 nm by using a UV-Visible Spectrophotometer (Thermo Evolution 201, Waltham, MA, USA), to obtain the total phenol content of each sample. The content of total phenol was expressed in microgram gallic acid equivalents (GAE) per gram of fresh weight (μg g-1 FW).
Secondly, the flavonoid content of the stems is determined using a colorimetric method (Aires et al., 2011; Goufo et al., 2014), i.e., in alkaline nitrite solution, flavonoids and aluminum ions form a red complex with a characteristic absorption peak at 510 nm. The sample was weighed in 0.1 g of fresh stem, and ground and homogenized by adding 1.5 ml of 60% ethanol. Then the extraction buffer was shake at 60 °C for 2 hours and centrifuged at 12000 rpm at 25 °C for 10 minutes. Each extract was determined using 5% NaNO2 and 10% AlCl3. Then 1 mol L-1 NaOH and water were sequentially added. The reaction solution was vortex-mixed and the absorbance measured immediately at 510 nm with a spectrophotometer (Thermo Evolution 201, Waltham, MA, USA). Measurements were calibrated using a standard curve of prepared catechin solution, and the flavonoid content was expressed as mg of catechin equivalents per gram of fresh weight of stem (mg g-1 FW).
Thirdly, the lignin content of stems was determined using a kit (G0708W, Suzhou Grace Bio-technology Co. LTD, Suzhou, China) according to the manufacturer’s instructions, based on acetylation of lignin phenolic hydroxyl group (Fan et al., 2021). Briefly, an appropriate amount of the tissue sample was taken for drying and grinding, and passed it through 40 mesh sieves. Then, 1.5 mg of sieved powder tissue was mixed with 1.5 ml of 80% ethanol, and mixed well by vortex shaking. The solution was placed in a 50 °C water bath for 20 minutes, and the supernatant was taken out and cooled down, 12000 rpm and 25 °C for 10 minutes. The supernatant was discarded and the sediment was retained. The sediment was dried at 95 °C for standby. The UV-Visible Spectrophotometer (Thermo Evolution 201, Waltham, MA, USA) was preheated for 30 minutes by setting the temperature to 25 °C, and set the wavelength at 280 nm. The absorbance value at 280 nm is positively related to the lignin content. The content of lignin was expressed as percentage of dry weight (% DW).
2.4.2.3 Membrane lipid peroxidation and antioxidant enzymes
Malondialdehyde (MDA) level, antioxidant enzymes including superoxide dismutase (SOD), peroxidase (POD), and polyphenol oxidase (PPO) activities in fresh stems was determined, the method of plant enzyme-linked immunosorbent was employed. Firstly, the concentration of protein in the stems was determined by bicinchoninic acid method using the BCA assay method (Beyotime Biotechnology, Haimen, China). Under alkaline conditions, the protein reduced Cu2+ to Cu+. Cu+ and bicinchoninic acid reagent formed a purple complex. The concentration of the protein can be calculated by the absorbance at 562 nm by spectrophotometer.
The next 0.5 g of fresh plant tissue was homogenized with 4.5 ml phosphate buffer (0.1 mol L-1, pH7.4) at 4°C. Then the crude extract was centrifuged at 3000 rpm for 20 minutes at 4°C and the supernatant was collected to measure MDA level, SOD, POD and PPO enzyme activities of stems by corresponding plant enzyme-linked immunosorbent assay (ELISA) kits (JL22715, JL22719, JL22742, and JL22725, Jianglai Biotechnology, Shanghai, China), respectively, according to the manufacturer’s instructions. Briefly, 40 μl of sample diluent was added to the sample hole to be measured on the enzyme coated plate and 10 μl of samples was added to be tested. 100 μl of enzyme labeled reagent was added to each hole. The plate was sealed with a sealing film and then incubated at 37 °C for 60 minutes. Each hole was filled with detergent and then discarded. Color developing agents were added into each hole in turn, shaken gently and mixed well, and put in the dark at 37 °C for 15 minutes. 50 μl of termination liquid was added to each hole. Finally, the absorbance of each hole was measured in sequence at 450 nm by using microplate reader (Multiskan Sky, Thermo, Waltham, MA, USA). The MDA level was expressed by as nanomole per gram protein (nmol mg-1 pro) and the SOD, POD and PPO activities were expressed as active unit per gram protein (U mg-1 pro).
2.5 Grain yield and above-ground biomass of rice
At maturity, four representative hills of both cvs Lemont and YSBR1 were harvested from inoculated and uninoculated areas in each plot, and then the grain yields and above-ground biomass of plants were determined.
2.6 Statistical analysis
Statistical analysis of the data was performed with SPSS 26 (IBM, USA), and the Pearson correlation test and graphs were generated by Origin 2022 (OriginLab Corporation, USA). Three-way analysis of variance (ANOVA) was used to examine the individual and combined effects of year, CO2 and temperature on the vertical length of rice ShB lesions, and the individual and combined effects of variety, CO2 and temperature on physiological parameters. Four-way analysis of variance (ANOVA) was used to examine the individual and combined effects of variety, inoculation, CO2 and temperature on physiological parameters. Mean comparisons (least significant difference) were used to reveal the difference in data between CO2 and temperature treatments. All results reported as significant had a P< 0.05.
3 Results
3.1 Vertical length of rice ShB lesions
The vertical length of rice ShB lesions for YSBR1 (a resistant cultivar) was notably shorter than that for Lemont (a susceptible cultivar) under the four CO2 and temperature treatments in both 2020 and 2021 (Figure 2).
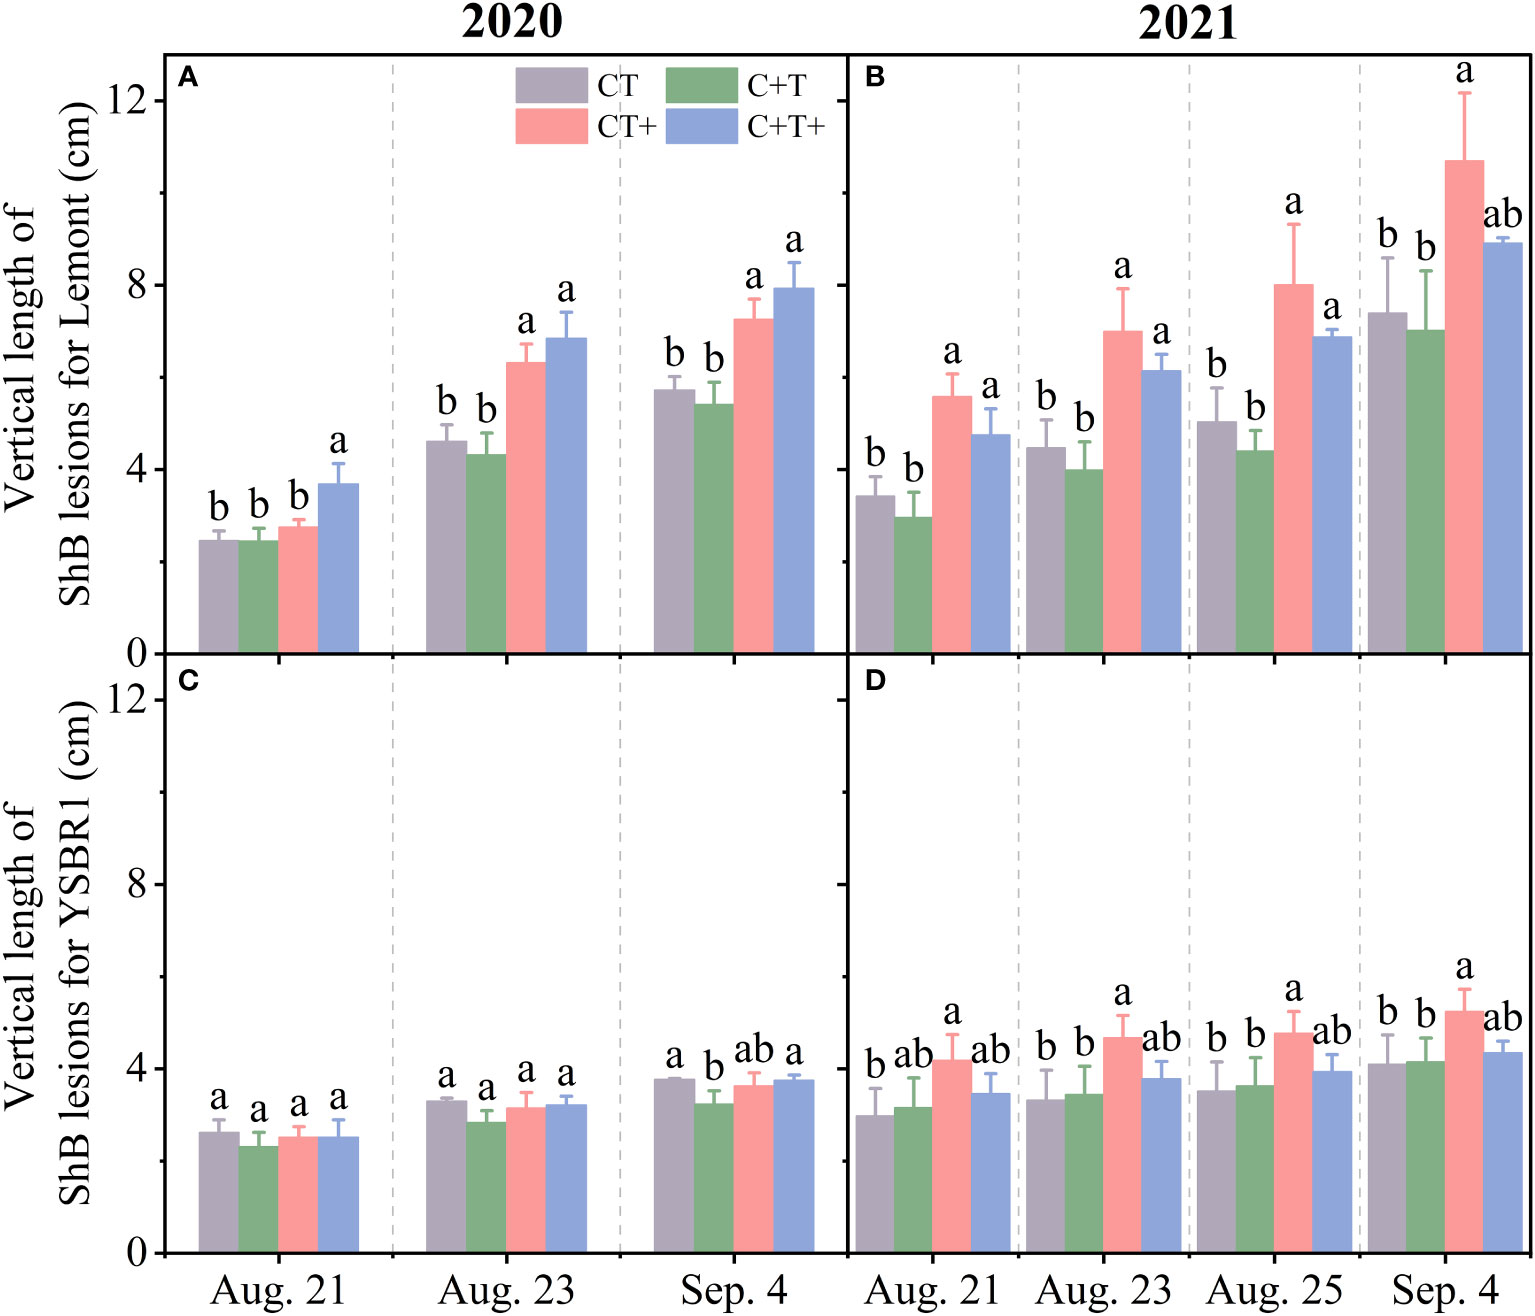
Figure 2 The vertical length of ShB lesions for inoculated plants of cvs Lemont (A, B) and YSBR1 (C, D) under ambient condition (CT), elevated CO2 (C+T), elevated temperature (CT+) and the combination of elevated CO2 and elevated temperature (C+T+) in the T-FACE experiments of 2020 and 2021. Each data represents the mean value of three replications (with bars for ± standard errors of the mean). Different letters above the bars in the same time of each parameter indicate statistically significant differences (p< 0.05).
However, the effects of year, CO2, temperature and their combinations on vertical length of ShB lesions were similar between the two cultivars. The vertical length of ShB lesions measured on August 21, 23 and September 4 for both cultivars were significantly longer in 2021 than in 2020 (Table 2 and Figure 2). Elevated CO2 had no significant effect on vertical length of ShB lesions for both cultivars at all measurement dates (Table 2, Figure S2). In contrast, elevated temperature significantly increased vertical length of ShB lesions for both cultivars at all measurement dates (Table 2; Figure S2). In addition, we observed significant interaction effects between year and CO2, between year and temperature on vertical length of ShB lesions for cv. Lemont on August 21 (Table 2 and Figures 2A, B), and significant interaction effect among year, CO2 and temperature on vertical length of ShB lesions for cv. YSBR1 on August 23 and September 4 (Table 2 and Figures 2C, D).
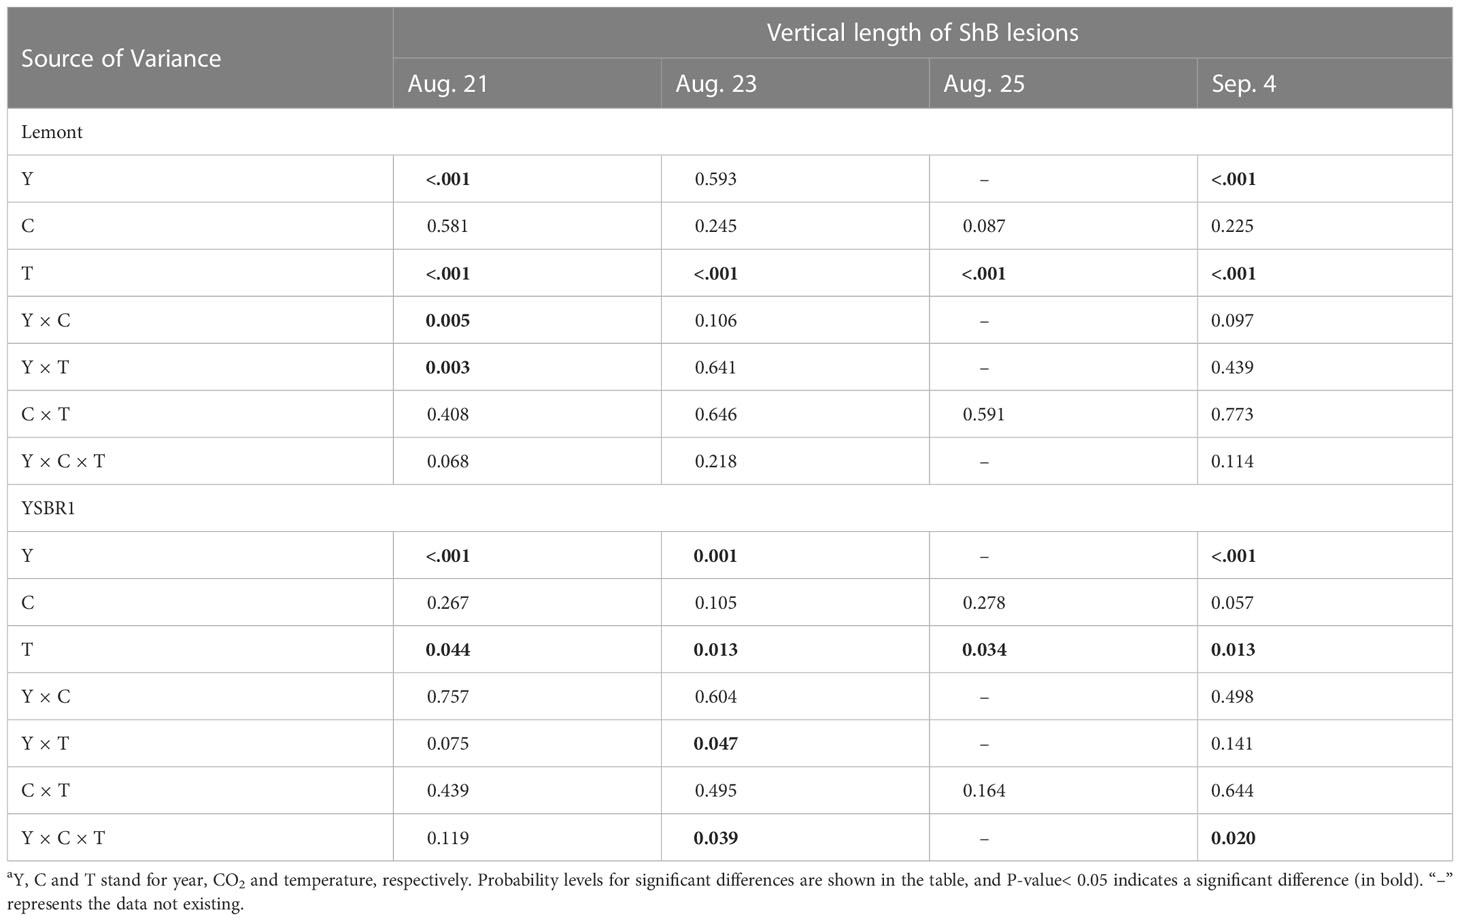
Table 2 Summary of analysis of variance (ANOVA) for the influence of year, CO2 and temperature on the dynamic change of vertical length of ShB lesions for cvs Lemont and YSBR1 in 2020 and 2021a.
3.2 Morphological parameters and their relationships to vertical length of ShB lesions
There were also significant differences between cv. Lemont and cv. YSBR1 in most morphological parameters of uninoculated plants under the four CO2 and temperature treatments (Table 3). Plant height (PH), flag leaf length (FLL), special leaf weight (SLW) and wax content of sheath (WCS) of cv. Lemont were significantly lower than those of cv. YSBR1 (Table 3). However, flag leaf width (FLW), stem wall thickness (SWT) and Si content of leaf (Si-L) of cv. Lemont were significantly higher than those of cv. YSBR1 (Table 3).
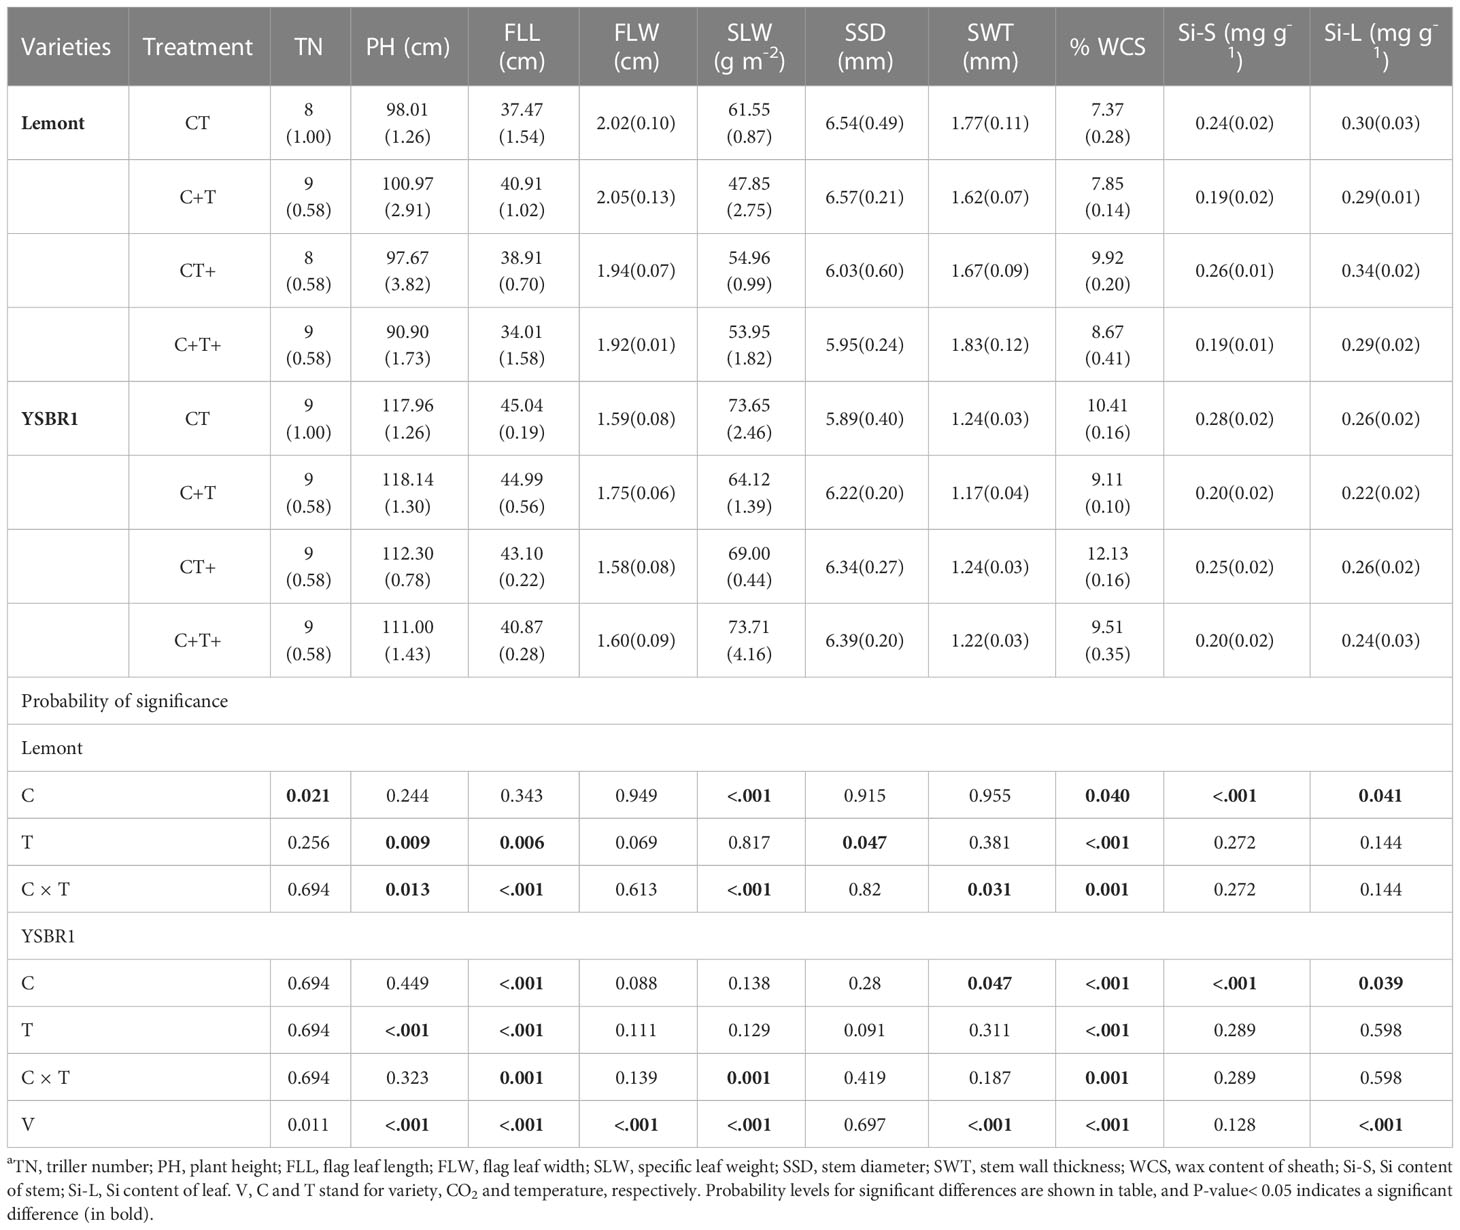
Table 3 Morphological parameters (SD between brackets) of uninoculated plants of cvs Lemont and YSBR1 at the booting stage under ambient condition (CT), elevated CO2 (C+T), elevated temperature (CT+), and the combination of elevated CO2 and elevated temperature (C+T+) in 2021a.
Elevated CO2 significantly increased tiller number (TN) for cv. Lemont, but significantly decreased FLL, SWT, SLW, WCS, Si content of stem (Si-S) and Si-L for cv. Lemont and/or cv. YSBR1 (Table 3). Elevated temperature significantly increased WCS for both cultivars, but significantly decreased PH, FLL and stem diameter (SSD) for cv. Lemont and/or cv. YSBR1 (Table 3). In addition, there were significant interaction effects between CO2 and temperature on PH, FLL, SLW, SWT and WCS for cv. Lemont and/or cv. YSBR1 (Table 3).
We used Pearson correlation analysis to make clear which morphological parameters were correlated with vertical length of ShB lesions for cvs Lemont and YSBR1 under the four CO2 and temperature treatments. For cv. Lemont, vertical length of ShB lesions was significantly positive correlated with WCS and Si-L, but significantly negative correlated with FLW and SSD under the four CO2 and temperature treatments (Figure S3A). For cv. YSBR1, we also observed a significantly positive relationship between vertical length of ShB lesions and WCS under the four CO2 and temperature treatments (Figure S3B).
3.3 Physiological parameters and their relationships to vertical length of ShB lesions
There were also significant differences between cv. Lemont and cv. YSBR1 in most physiological parameters of inoculated and uninoculated plants under the four CO2 and temperature treatments (Table 4). Soluble sugar content of stems in cv. Lemont was significantly higher than that in cv. YSBR1 (Table 4 and Figure S4). However, starch, cellulose, total phenol, flavonoid, lignin contents, MDA level, SOD, POD and PPO activities of stems in cv. Lemont were significantly lower than those in cv. YSBR1 (Table 4 and Figures S4–6).
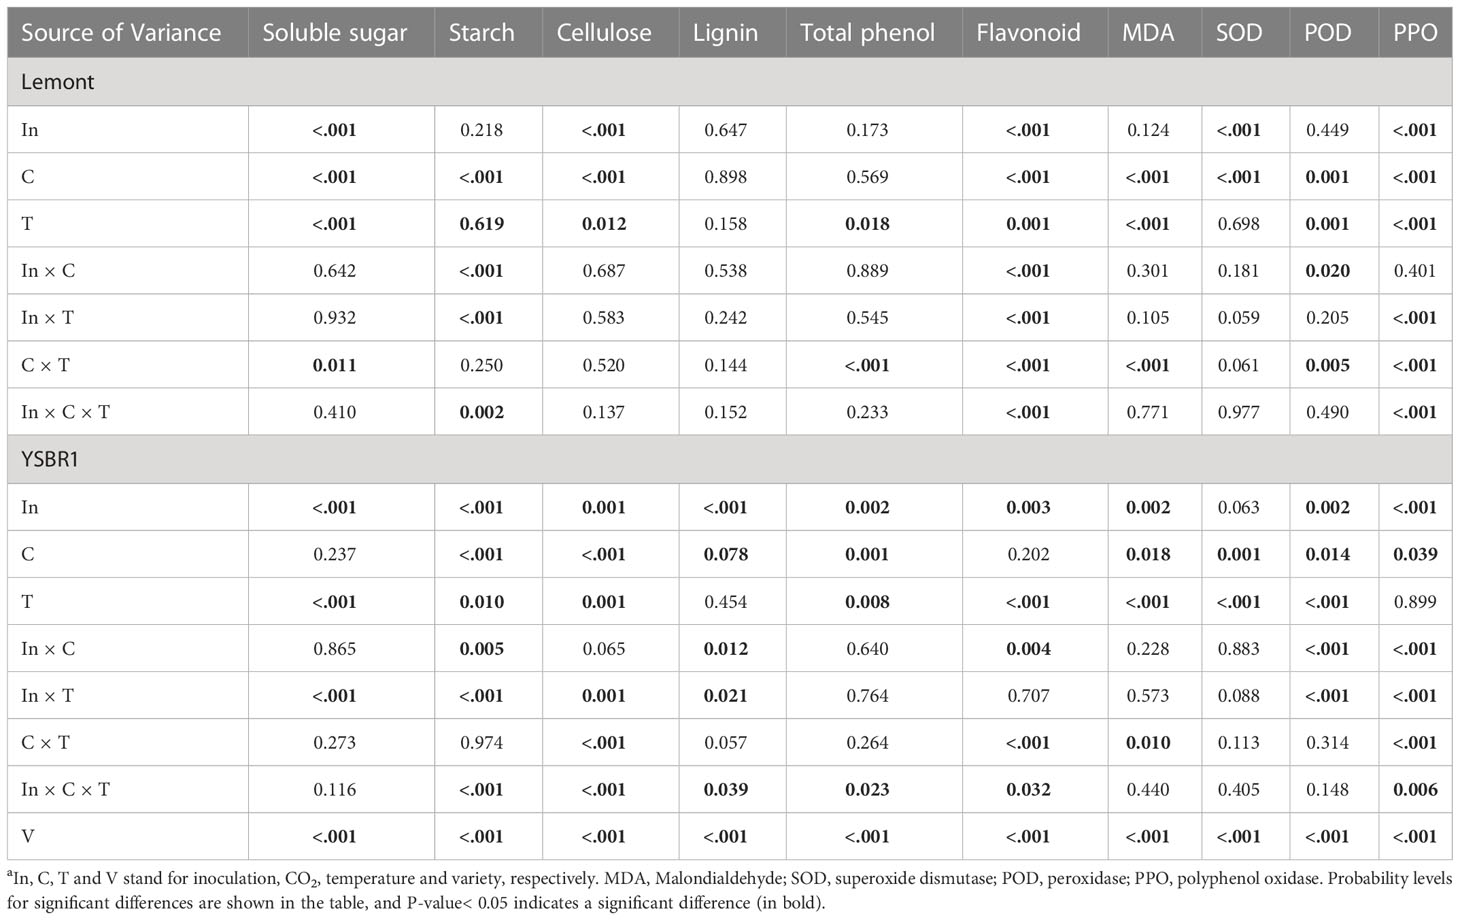
Table 4 Summary of analyses of variance (ANOVA) for the influence of inoculation, CO2 and temperature on physiological parameters in stems of cvs Lemont and YSBR1 in 2021a.
The effects of inoculation, CO2, temperature and their combinations on most physiological parameters were also significant for cvs Lemont and YSBR1 (Table 4). Inoculation of R. solani significantly increased total phenol and flavonoid contents, SOD activity and MDA level of stems for cv. Lemont and/or cv. YSBR1, but significantly decreased soluble sugar, starch, lignin and cellulose contents and POD activity of stems for cv. Lemont and/or cv. YSBR1 (Table 4 and Figures S4–6). However, the effect of inoculation treatment on PPO activity of stems was opposite between the two cultivars (Table 4 and Figure S6). Elevated CO2 significantly increased soluble sugar, starch and cellulose contents of stems for cv. Lemont and/or cv. YSBR1, but significantly decreased lignin and total phenol contents, and PPO activity of stems for cv. Lemont and/or cv. YSBR1 (Table 4 and Figures S4–6). However, the effects of elevated CO2 on MDA level, SOD and POD activities of stems were opposite between the two cultivars (Table 4 and Figure S6). Elevated temperature significantly increased soluble sugar and total phenol contents, and MDA level of stems for both cultivars, but significantly decreased starch, cellulose and flavonoid contents, and PPO activity of stems for cv. Lemont and/or YSBR1 (Table 4 and Figures S4–6). However, the effect of elevated temperature on POD activity of stems differed between the two cultivars (Table 4 and Figure S6). In addition, we observed significant interaction effects among inoculation, CO2 and temperature on starch, lignin, cellulose, total phenol and flavonoid contents, and PPO activity of stems for cv. Lemont and/or cv. YSBR1 (Table 4). There were significant interaction effects between inoculation and CO2 on starch, lignin and flavonoid contents, POD and PPO activities for cv. Lemont and/or cv. YSBR1 (Table 4). Significant interaction effects between inoculation and temperature on soluble sugar, starch, lignin, cellulose and flavonoid contents, and POD and PPO activities of stems were observed for cv. Lemont and/or cv. YSBR1 (Table 4). Significant interactions between CO2 and temperature for soluble sugar, cellulose, total phenol and flavonoid contents, MDA level, POD and PPO activities of stems were observed for cv. Lemont and/or cv. YSBR1 (Table 4).
Pearson correlation analysis showed that for cv. Lemont, the vertical length of ShB lesions was significantly positive correlated with starch content and MDA level of stems (Figures 3A, C, E), but significantly negative correlated with cellulose and flavonoid contents of stems (Figures 3A, D, F). For cv. YSBR1, the vertical length of ShB lesions was also significantly positive correlated with MDA level of stems (Figures 3B, G), but significantly negative correlated with SOD activity of stems (Figures 3B, H).
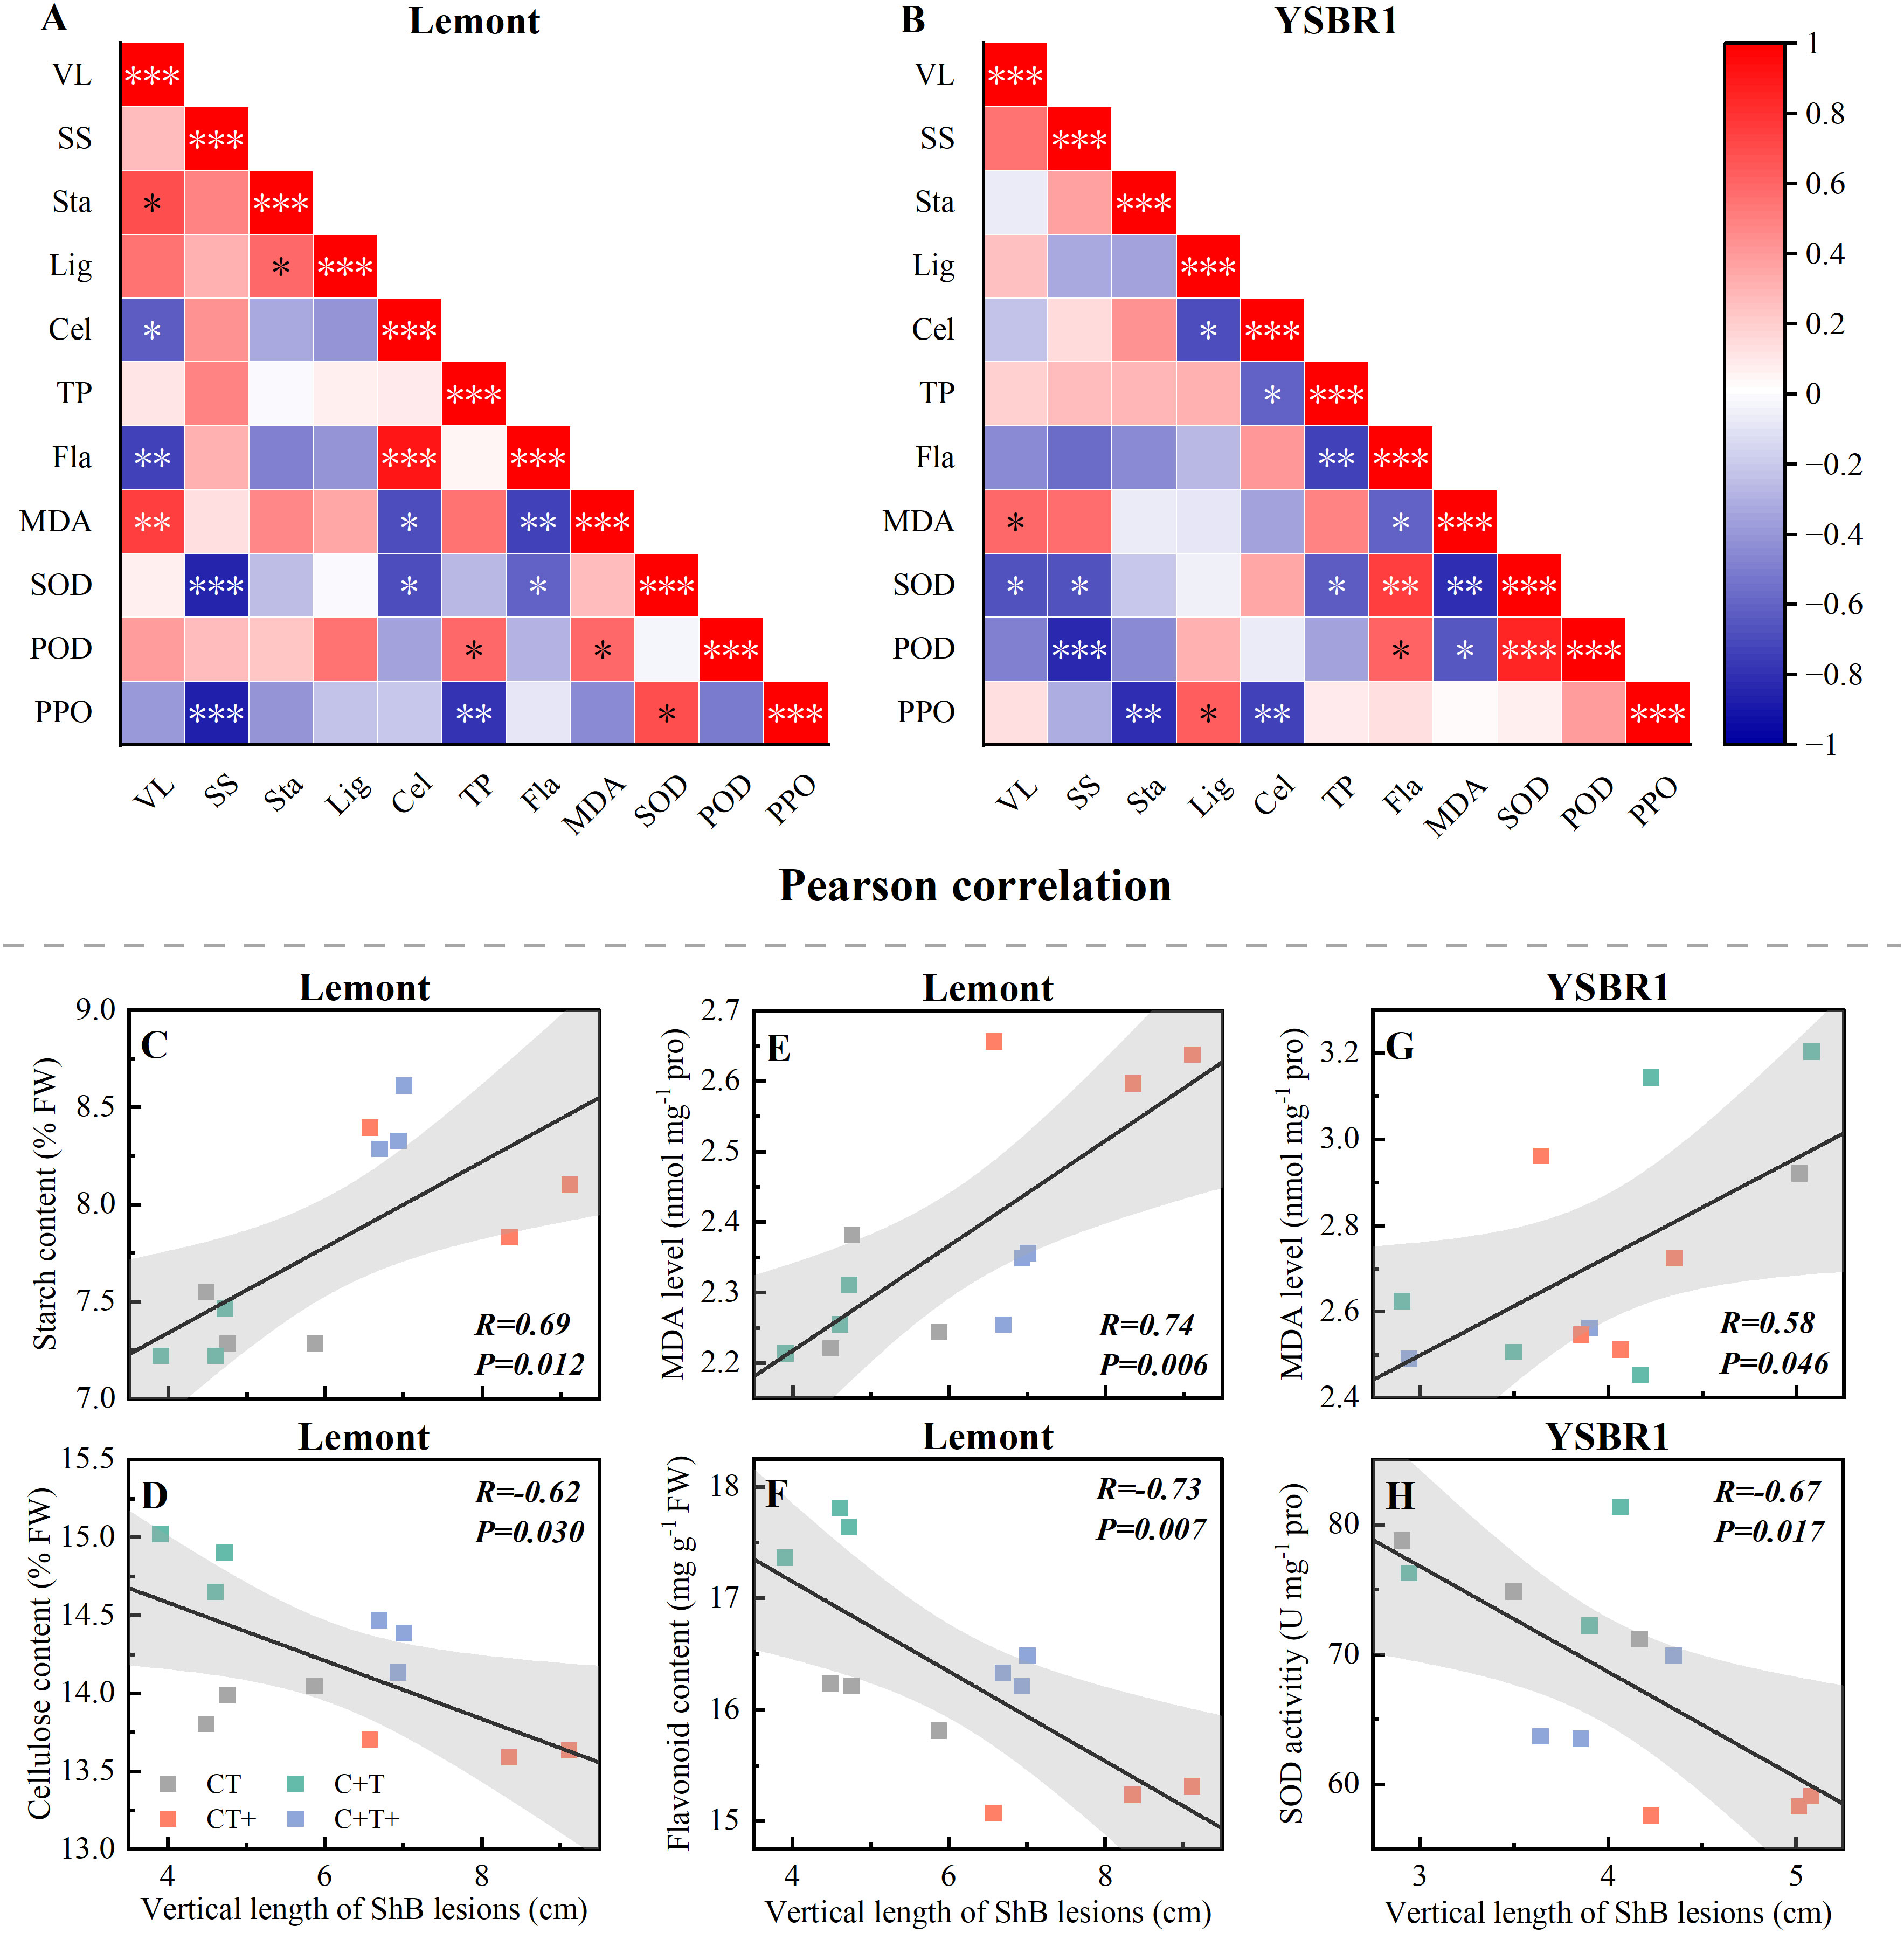
Figure 3 (A, B) Pearson correlation R2 of vertical length of ShB lesions and physiological parameters in inoculated stems of cvs Lemont (A) and YSBR1 (B) under ambient condition (CT), elevated CO2 (C+T), elevated temperature (CT+), and the combination of elevated CO2 and elevated temperature (C+T+) in T-FACE experiments of 2021. VL, vertical length of ShB lesions; SS, soluble sugar; Sta, starch; Lig, lignin; Cel, cellulose; TP, total phenol; Fla, flavonoid; MDA, malondialdehyde; SOD, superoxide dismutase; POD, peroxidase; PPO, polyphenol oxidase. *p< = 0.05, **p< = 0.01, ***p< = 0.001. (C-H) Individual measures, regression line, correlation coefficient R2, confidence interval (95%), and P-value for cv. Lemont (C) Sta vs VL, (D) Cel vs VL, (E) MDA vs VL, (F) Fla vs VL, and cv. YSBR1 (G) MDA vs VL, (H) SOD vs VL.
3.4 Above-ground biomass and grain yield
There was a significant interaction effect between CO2 and temperature on above-ground biomass for cvs Lemont and YSBR1 (Table 5). Elevated CO2 significantly increased grain yield and above-ground biomass for both cultivars (Table 5). However, elevated temperature significantly decreased grain yield for both cultivars (Table 5 and Figure 4). Compared with ambient condition, the combination of elevated CO2 and elevated temperature decreased grain yield of uninoculated plants by 7.5% for cv. Lemont, and by 3.2% for cv. YSBR1. Thus, for uninoculated plants of the two cultivars, elevated CO2 could not compensate for the negative effect of elevated temperature on grain yield.
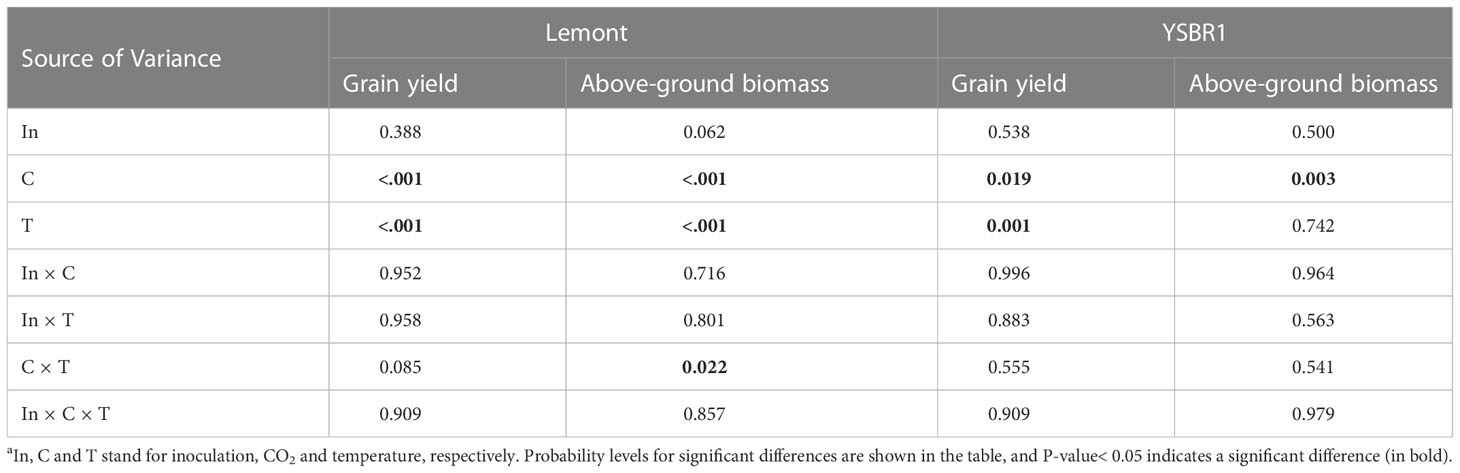
Table 5 Summary of analysis of variance (ANOVA) for the influence of inoculation, CO2 and temperature on above-ground biomass and grain yield of cvs Lemont and YSBR1 in 2021a.
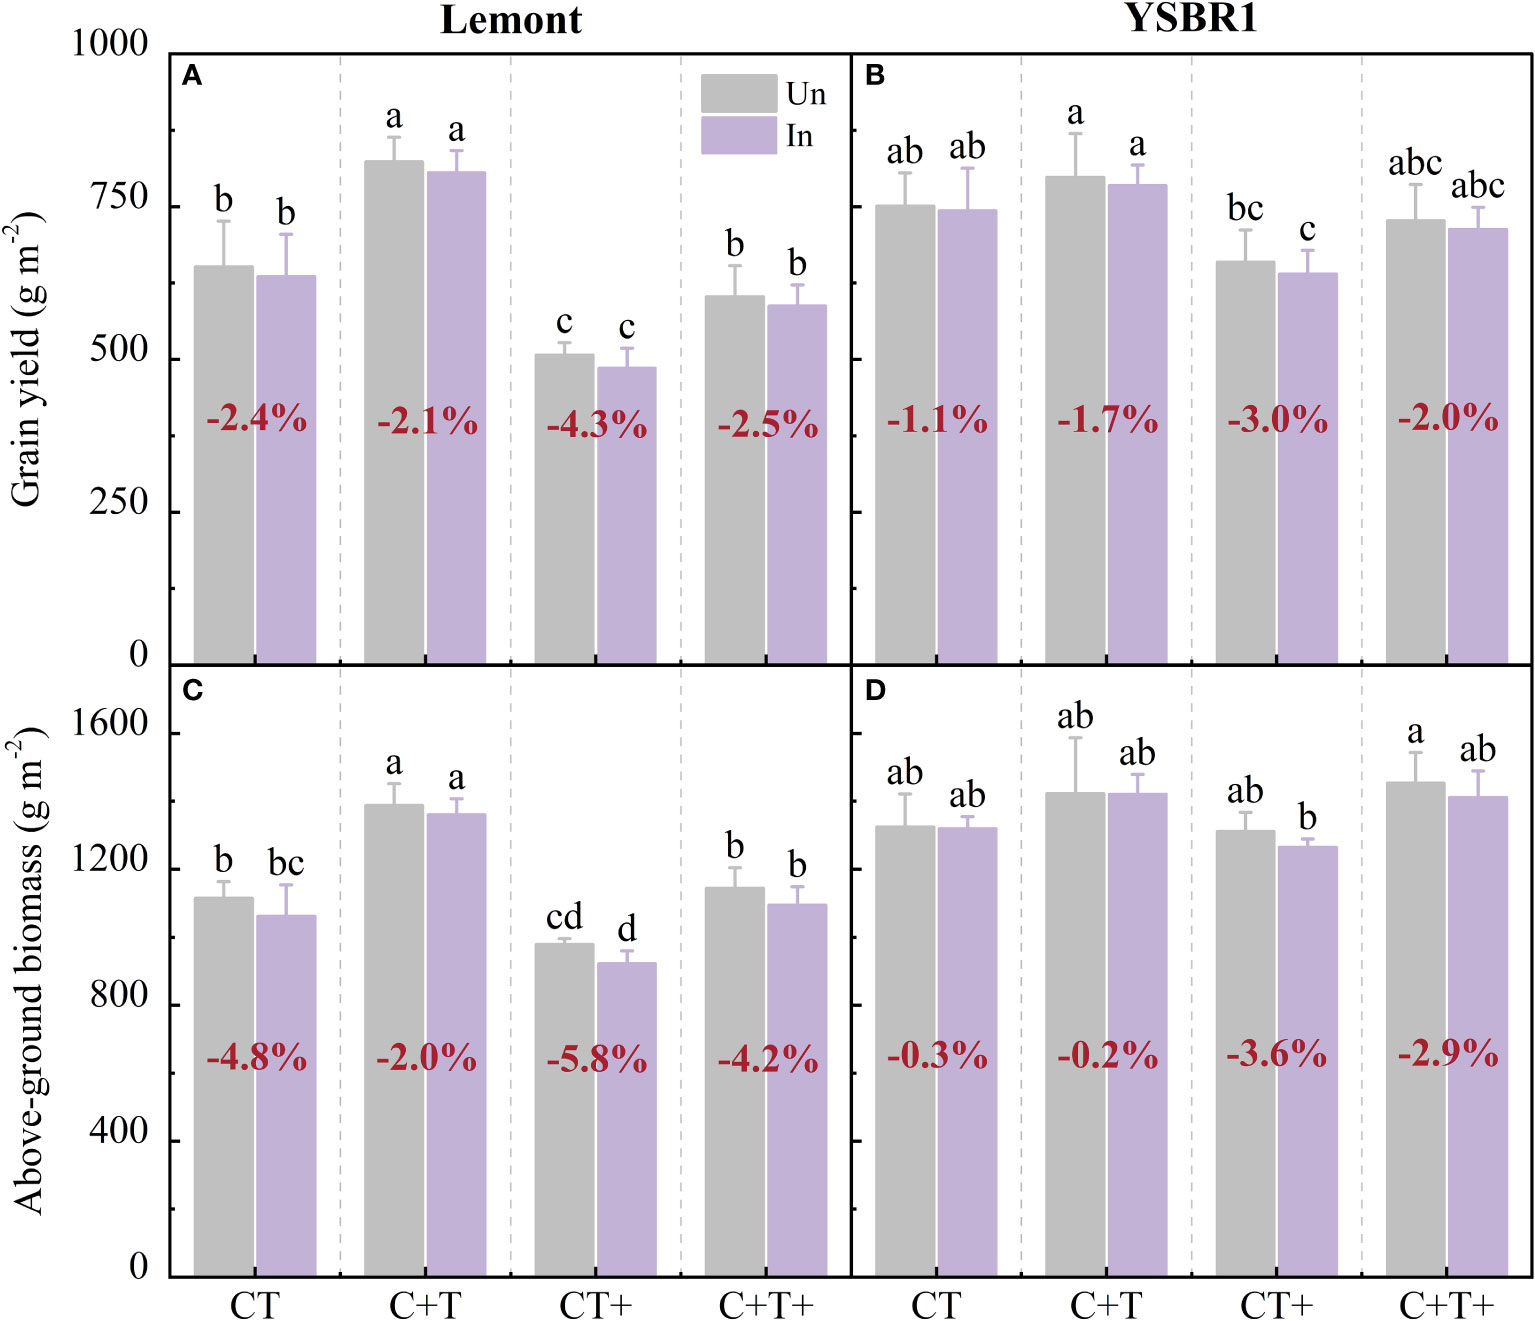
Figure 4 Grain yield and above-ground biomass at maturity for inoculation (In) and uninoculation (Un) of cvs Lemont (A, C) and YSBR1 (B, D) under ambient condition (CT), elevated CO2 (C+T), elevated temperature (CT+) and the combination of elevated CO2 and elevated temperature (C+T+) in the T-FACE experiments of 2021. Different letters above the bars in the same time of each parameter indicate statistically significant differences (p< 0.05). The bold number in red for each treatment in (A, B) is the average reduced ratio in grain yield of inoculated to uninoculated plants, and in (C, D) is the average reduced ratio in above-ground biomass of inoculated to uninoculated plants.
Inoculated plants with R. solani further decreased above-ground biomass and grain yield of both cultivars under elevated temperature and the combination of elevated CO2 and elevated temperature. Compared with uninoculated plants, inoculated plants with R. solani decreased above-ground biomass and grain yield by 5.8–4.3% for cv. Lemont and by 3.6–3.0% for cv. YSBR1 under elevated temperature, and by 4.2–2.5% for cv. Lemont and by 2.9–2.0% for cv. YSBR1 under the combination of elevated CO2 and elevated temperature (Figure 4).
4 Discussion
4.1 Elevated CO2 and temperature affect the risk of ShB severity
Previous studies found that indica cultivars exhibited higher level of resistance to ShB than japonica cultivars (Zuo et al., 2008; Sharma et al., 2009; Jia et al., 2012; Molla et al., 2020). This was consistent with our results that for inoculated plants with R. solani, the vertical length of ShB lesions in cv. YSBR1 (indica) was shorter than that in cv. Lemont (japonica) under four CO2 and temperature treatments in 2020 and 2021 (Figure 2 and Figure S2). Thus, growing indica subspecies with high resistance to ShB may reduce the severity of ShB under future climate change. In addition, we found that there was a significant difference between years in the vertical length of ShB disease in both cultivars under four CO2 and temperature treatments (Figure 2 and Table 2). The vertical length of ShB lesions was much longer in both cultivars in 2021 under four CO2 and temperature treatments than in 2020 (Figure 2 and Table 2).
Elevated CO2 has been reported to increase the horizontal spread of ShB, but not upward spread of the ShB lesions (Kobayashi et al., 2006). Eastburn et al. (2011) suggested that elevated CO2 increases leaf number, leaf area, canopy size and density, and alters canopy temperature and microclimate humidity, which may promote fungal diseases. However, our results showed that elevated CO2 had no significant effect on the vertical length of ShB disease in both cvs YSBR1 and Lemont in 2020 and 2021 (Figure 2 and Table 2). In contrast, elevated temperature significantly increased the vertical length of ShB lesion in both cultivars at all measurement dates in both years (Figure 2 and Table 2). Previous studies showed that the increased air temperatures had a significant effect on plant diseases (Chakraborty et al., 2000; Chakraborty, 2001). Higher temperatures were positively correlated with an overall increase in spot blotch severity, particularly nighttime temperatures (Sharma et al., 2007). Our results showed that 19 days after inoculation (September 4) in both years, C+T+ increased vertical length of lesions by 20.5–38.4% for cv. Lemont and by -0.5–5.8% for cv. YSBR1, compared with CT. Thus, the combination of elevated CO2 and elevated temperature under future climate change largely increase the risk of rice ShB, especially for ShB susceptible rice cultivars.
4.2 Exploring factors that affect ShB severity under CO2 and temperature treatments
Among meteorological factors, high air temperature combined with high relative humidity in the forenoon is one of major factors to predispose ShB development in rice (Castilla et al., 1996; Biswas et al., 2011). Maximum dispersal of ShB was observed in a temperature range of 25–30°C and relative humidity of 80–100%, and a maximum temperature around 34°C and a minimum temperature around 26°C were found to be favorable for ShB dispersal after its establishment in the field (Thind et al., 2008; Biswas et al., 2011; Bhukal et al., 2015; Senapati et al., 2022). In our study, the average daily air temperature after inoculation in 2021 was 0.8°C lower than in 2020, while the average relative humidity after inoculation in 2021 was 9% higher than in 2020 (Figure S1). The higher relative humidity after inoculation may be related to the greater vertical length of ShB lesions in 2021 than in 2020 for cvs Lemont and YSBR1 under four CO2 and temperature treatments (Figure S1 and Table 2).
Many studies have investigated which morphological and physiological parameters were related to susceptibility to ShB in rice under ambient conditions, but with inconsistent results (Zou et al., 2000; Pinson et al., 2005; Ma et al., 2006; Willocquet et al., 2012; Zuo et al., 2014b; Dey et al., 2016; Sathe et al., 2021; Senapati et al., 2022). The wax layer is the first barrier for plants, and has the function of resisting pathogen invasion in the natural environment (Jetter and Schaffer, 2001; Chen et al., 2003). Disease resistance is positively correlated with stem thickness under artificial inoculation of R. solani (Dey et al., 2016). Some studies of artificial inoculation showed higher Si content in rice suppressed lesion development, resulting in increased resistance to R. solani (Rodrigues et al., 2003a; Rodrigues et al., 2003b; Schurt et al., 2014; Sathe et al., 2021). Rice plants respond to R. solani infecting, by activating various signaling pathways and producing antimicrobial compounds to prevent it from colonizing (Senapati et al., 2022). Some studies suggest that carbohydrate metabolism is the major area of metabolic changes when rice responses to the R. solani attack (Karmakar et al., 2019; Molla et al., 2020). Flavonoids produced from phenolic metabolism provide resistance to pathogens (Ertani et al., 2011) and SOD activity, as a key enzyme, provides initial resistance information (Zhang et al., 2006). Our results found that plant height, flag leaf length, specific leaf weight and wax content of sheath were significantly higher in cv. YSBR1 than in cv. Lemont under four CO2 and temperature treatments (Table 3). In addition, the starch, cellulose, total phenol, flavonoid and lignin contents, SOD, POD and PPO activities of stems in cv. YSBR1 were significantly higher than those in cv. Lemont under all treatments (Table 4 and Figures S4–6). These results can be used to explain that the vertical length of ShB lesions in cv. YSBR1 (indica) was shorter than that in cv. Lemont (japonica) under four CO2 and temperature treatments in 2020 and 2021 (Figure 2). Zuo et al. (2014b) also found that overall antimicrobial compounds were higher in YSBR1 under ambient conditions than Lemont.
Pearson correlation analysis showed that the vertical length of ShB lesions was significantly positively correlated with wax content of sheath in both cultivars and with Si content of stems in cv. Lemont, but significantly negatively correlated with flag leaf width or stem diameter in cv. Lemont under four CO2 and temperature treatments (Figure S3). In addition, the vertical length of ShB lesions was significantly positively correlated with MDA level of inoculated stems in both cultivars under four CO2 and temperature treatments (Figure 3). Our results showed that elevated temperature (CT+ and C+T+) significantly increased MDA level of stems in both cultivars (Table 4 and Figure 3), consistent with Bamagoos et al. (2021). Inoculation treatments significantly increased MDA level of stems in cv. YSBR1. Overall, higher MDA level of stems may be related to longer vertical length of ShB for inoculated plants of both cultivars under elevated temperature (CT+ and C+T+).
4.3 The losses of biomass and yield were correlated with the severity of ShB
The saprophytic nature of R. solani and the broad host range of pathogen have led to the spread and persistence of the fungus in all rice-producing areas (Lee and Rush, 1983). Reportedly, the pathogen of R. solani has spread in almost all rice growing areas in the world and economic losses of up to 58% in rice yield have been revealed (Chahal et al., 2003; Molla et al., 2020). Inoculation significantly increased the sheath blight severity and incidence, and caused yield losses ranging from 4% in moderately susceptible to 21% in highly susceptible rice plants (Groth and Bond, 2007). Wu et al. (2013) found that artificial inoculation at panicle initiation stage done to achieve uniform disease development would significantly increase ShB severity and cause yield reduction from 12.1% to 48.6% in all experimental seasons. Meanwhile, Wu et al. (2013) also concluded that sheath blight infestation reduced rice yield mainly by decreasing biomass production. Our results showed that for uninoculation of plants, the combination of elevated CO2 and elevated temperature decreased grain yield by 3.2–7.5% for cvs Lemont and YSBR1. Inoculation with R. solani further decreased grain yield by 3.0–4.3% under elevated temperature, and by 2.0–2.5% under the combination of elevated CO2 and elevated temperature (Figure 4). Thus, elevated CO2 could not offset the negative effects of elevated temperature on rice yield under future climate change. The combination of elevated CO2 and elevated temperature further reduced rice yield by increasing ShB severity.
Our previous study showed that improving nitrogen uptake before heading and selecting heat-tolerant varieties are crucial in minimizing rice yield loss caused by the combination of elevated CO2 and elevated temperature under future climate change (Cai et al., 2016). However, Savary et al. (1995) found that the use of high doses of nitrogen fertilizer and the adoption of semi-dwarf high-yielding varieties led to a sharp increase in the incidence of sheath blight disease. In double-rice cultivation, short-stature and early-maturing varieties were usually used, the incidence of sheath blight was usually higher than in single-rice cultivation (Sharma et al., 1995; Wang, 2006). In the absence of effective host plant resistance against R. solani, the management of sheath blight disease is largely managed through the use of chemicals, such as fungicides (Naik et al., 2017). Meanwhile, the use of a single chemical with the same application over a long period of time leads to the development of resistance in the fungus (Uppala and Zhou, 2018). The chemical control method has an advantage of reducing disease incidence, spread and increasing yield, but it also has several disadvantages, such as environmental hazards (Senapati et al., 2022). Therefore, reasonable agronomic management practices are required to improve both ShB disease resistance and grain yield of rice under future climate change.
5 Conclusion
This study was first to explore the effects of elevated CO2 and temperature on the severity of rice ShB using the T-FACE system. Our results showed that elevated temperature, but not elevated CO2, significantly increased the vertical length of rice ShB lesions for both susceptible and resistant cultivars (cvs Lemont and YSBR1). The risk of rice ShB severity was increased under the combination of elevated CO2 and elevated temperature for both cultivars. A significant increase in MDA level of stems may be related to a significant increase in the vertical length of ShB lesions under the combination of elevated CO2 and elevated temperature. Elevated CO2 could not offset the negative effect of elevated temperature on rice yields under future climate change. The combination of elevated CO2 and elevated temperature further reduced rice yields by increasing ShB severity. High resistant variety and reasonable agronomic managements are needed to decrease the risk of ShB disease and increase grain yield of rice under future climate change.
Data availability statement
The raw data supporting the conclusions of this article will be made available by the authors, without undue reservation.
Author contributions
MS and CZ conceived and designed the experiment; MS, JQ, CM, DW, LS, WW, XG, XY, YT, JZ and GL performed the experiment; MS and CC analyzed data and wrote the manuscript; CC and LS revised the manuscript. All authors contributed to the article and approved the submitted version.
Funding
This research was supported by Key-Area Research and Development Program of Guangdong Province, China (No. 2020B0202010006), “0-1” original innovation project of the Chinese Academy of Sciences (ZDBS-LY-DQC020), Carbon Neutral special fund for Scientific and Technological Innovation of Jiangsu Province (BM2022002), Carbon Peaking and Carbon Neutrality Special Fund for Science and Technology from Nanjing Science and Technology Bureau (20221103), Key Research and Development Program of Jiangsu Province (BE2022308), National Natural Science Foundation of China (32001191), National Natural Science Foundation of China (32171591).
Acknowledgments
The authors gratefully acknowledge the enduring contributions of Dr. Genxing Pan and Dr. Xiaoyu Liu who established and supervised the T-FACE system since 2011. The authors gratefully acknowledge the contributions of Dr. Shimin Zuo (Key Laboratory of Crop and Physiology of Jiangsu Province, College of Agriculture, Yangzhou University) who provided the seeds of cvs Lemont and YSBR1, and the YN-7 isolate of R. solani for this study.
Conflict of interest
The authors declare that the research was conducted in the absence of any commercial or financial relationships that could be construed as a potential conflict of interest.
Publisher’s note
All claims expressed in this article are solely those of the authors and do not necessarily represent those of their affiliated organizations, or those of the publisher, the editors and the reviewers. Any product that may be evaluated in this article, or claim that may be made by its manufacturer, is not guaranteed or endorsed by the publisher.
Supplementary material
The Supplementary Material for this article can be found online at: https://www.frontiersin.org/articles/10.3389/fpls.2023.1115614/full#supplementary-material
References
Aires, A., Fernandes, C., Carvalho, R., Bennett, R. N., Saavedra, M. J., Rosa, E. A. (2011). Seasonal effects on bioactive compounds and antioxidant capacity of six economically important brassica vegetables. Molecules 16 (8), 6816–6832. doi: 10.3390/molecules16086816
Bamagoos, A., Alharby, H., Fahad, S. (2021). Biochar coupling with phosphorus fertilization modifies antioxidant activity, osmolyte accumulation and reactive oxygen species synthesis in the leaves and xylem sap of rice cultivars under high-temperature stress. Physiol. Mol. Biol. Plants 27 (9), 2083–2100. doi: 10.1007/s12298-021-01062-7
Bhukal, N., Singh, R., Mehta, N. (2015). Progression and development of sheath blight of rice in relation to weather variables. J. Mycol. Plant Pathol. 45, 166–172.
Biswas, B., Dhaliwal, L. K., Chahal, S. K., Pannu, P. P. S. (2011). Effect of meteorological factors on rice sheath blight and exploratory development of a predictive model. Indian J. Agric. Sci. 81, 256–260. doi: 10.1016/j.agsy.2010.09.001
Cai, C., Li, G., Di, L. J., Fu, L., Guo, X. H., Struik, P. C., et al. (2019). The acclimation of leaf photosynthesis of wheat and rice to seasonal temperature changes in T-FACE environments. Glob. Change Biol. 00, 1–18. doi: 10.1111/gcb.14830
Cai, C., Li, G., Yang, H. L., Yang, J. H., Liu, H., Struik, P. C., et al. (2018). Do all leaf photosynthesis parameters of rice acclimate to elevated CO2, elevated temperature, and their combination, in FACE environments? Glob. Change Biol. 24, 1685–1707. doi: 10.1111/gcb.13961
Cai, C., Yin, X. Y., He, S. Q., Jiang, W. Y., Si, C. F., Struik, P. C., et al. (2016). Responses of wheat and rice to factorial combinations of ambient and elevated CO2 and temperature in FACE experiments. Glob. Change Biol. 22, 856–874. doi: 10.1111/gcb.13065
Castilla, N. P., Leano, R. M., Elazhour, F. A., Teng, P. S., Savary, S. (1996). Effects of plant contact inoculation pattern, leaf wetness regime and nitrogen supply on the efficiency in rice sheath blight. J. Phytopathol. 144 (4), 187–192. doi: 10.1111/j.1439-0434.1996.tb01512.x
Chahal, K. S., Sokhi, S. S., Rattan, G. S. (2003). Investigations on sheath blight of rice in punjab. Indian Phytopathol. 56 (1), 22–26.
Chakraborty, S. (2001). “Effects of climate change,” in Plant pathologist’s pocketbook. Eds. Waller, J. M., JM, L., SJ, W. (Wallingford, UK: CABI), 203–207.
Chakraborty, S., Tiedemann, A. V., Teng, P. S. (2000). Climate change: potential impact on plant diseases. Environ. pollut. 108, 317–326. doi: 10.1016/s0269-7491(99)00210-9
Chen, X. J., Chen, Y., Zhang, L. N., Xu, B., Zhang, J. H., Chen, Z. X., et al. (2016). Overexpression of OsPGIP1 enhances rice resistance to sheath blight. Plant Dis. 100 (2), 388–395. doi: 10.1094/pdis-03-15-0305-re
Chen, X. B., Goodwin, S. M., Virgina, L. B., Liu, X. L., Jenks, M. A. (2003). Cloning and characterization of the WAX2 gene of arabidopsis involved in cuticle membrane and wax production. Plant Cell 15, 1170–1185. doi: 10.1105/tpc.010926
Chen, L., Li, X. F., Ding, K. J., Tan, G. J., Guan, H. J., Li, S. H. (2002). Effects of nitrogen sources on rice sheath blight fungus. J. Anhui Agric. Sci. 30 (2), 240–243.
Ciais, P., Sabine, C., Bala, G., Bopp, L., Brovkin, V., Canadell, J. (2013). “Carbon and other biogeochemical cycles,” in Climate change 2013: the physical science basis. contribution of working group Ⅰ to the fifth assessment report of the intergovernamental panel on climate change. Eds. Tignor, M., Allen, S. K., Boschung, J., Nauels, A., Xia, Y., Bex, V., Midgley, P. M. (New York, NY, USA: Cambridge University Press, Cambridge, UK), 465–570.
Dath, A. P. (1990). Sheath blight disease of rice and its management (New Delhi: Associated Publishing Company).
Dey, S., Badri, J., Prakasam, V., Bhadana, V. P., Eswari, K. B., Laha, G. S., et al. (2016). Identification and agro-morphological characterization of rice genotypes resistant to sheath blight. Australas. Plant Pathol. 45, 145–153. doi: 10.1007/s13313-016-0404-9
Eastburn, D. M., McElrone, A. J., Bilgin, D. D. (2011). Influence of atmospheric and climatic change on plant-pathogen interactions. Plant Pathol. 60 (1), 54–69. doi: 10.1111/j.1365-3059.2010.02402.x
Ertani, A., Schiavon, M., Altissimo, A., Franceschi, C., Nardi, S. (2011). Phenol-containing organic substances stimulate phenylpropanoid metabolism in Zea mays. J. Plant Nutr. Soil Sci. 174 (3), 496–503. doi: 10.1002/jpln.201000075
Fan, F. H., Zhou, Z. J., Qin, H. J., Tan, J. H., Ding, G. J. (2021). Exogenous brassinosteroid facilitates xylem development in Pinus massoniana seedlings. Int. J. Mol. Sci. 22 (14), 7615. doi: 10.3390/ijms22147615
Goufo, P., Pereira, J., Figueiredo, N., Oliveira, M. B. P., Carranca, C., Rosa, E. A., et al. (2014). Effect of elevated carbon dioxide (CO2) on phenolic acids, flavonoids, tocopherols, tocotrienols, γ-oryzanol and antioxidant capacities of rice (Oryza sativa l.). J. Cereal Sci. 59 (1), 15–24. doi: 10.1016/j.jcs.2013.10.013
Groth, D. E., Bond, J. A. (2007). Effects of cultivars and fungicides on rice sheath blight, yield, and quality. Plant Dis. 91 (12), 1647–1650. doi: 10.1094/pdis-91-12-1647
Jetter, R., Schaffer, S. (2001). Dynamic change of the epicuticular wax film during leaf development. Plant Physiol. 126 (4), 1725–1737. doi: 10.1104/pp.126.4.1725
Jia, L. M., Yan, W. G., Zhu, C. S., Agrama, H. A., Jackson, A., Yeater, K., et al. (2012). Allelic analysis of sheath blight resistance with association mapping in rice. PloS One 7 (3), e32703. doi: 10.1371/journal.pone.0032703
Karmakar, S., Datta, K., Molla, K. A., Gayen, D., Das, K., Sarkar, S. N., et al. (2019). Proteo-metabolomic investigation of transgenic rice unravels metabolic alterations and accumulation of novel proteins potentially involved in defence against Rhizoctonia solani. Sci. Rep. 9 (1), 10461. doi: 10.1038/s41598-019-46885-3
Kobayashi, T., Ishiguro, K., Nakajima, T., Kim, H. Y., Okada, M., Kobayashi, K. (2006). Effects of elevated atmospheric CO2 concentration on the infection of rice blast and sheath blight. Phytopathology 96 (4), 425–431. doi: 10.1094/phyto-96-0425
Lee, F. N., Rush, M. C. (1983). Rice sheath blight: A major rice disease. Plant Dis. 67, 829–832. doi: 10.1094/PD-67-829
Liu, Y., Li, M., Zheng, J., Li, L. Q., Zhang, X. H., Zheng, J. F., et al. (2014). Short-term responses of microbial community and functioning to experimental CO2 enrichment and warming in a Chinese paddy field. Soil Boil. Biochem. 77, 58–68. doi: 10.1016/j.soilbio.2014.06.011
Long, S. P., Ainsworth, E. A., Leakey, A. D. B., Nosberger, J., Ort, D. R. (2006). Food for thought: Lower-than-expected crop yield stimulation with rising CO2 concentration. Science 312 (5782), 1918–1921. doi: 10.1126/SCIENCE.1114722
Long, S. P., Ainsworth, E. A., Rogers, A., Ort, D. R. (2004). Rising atmospheric carbon dioxide: plants FACE the future. Annu. Rev. Plant Biol. 55 (1), 591–628. doi: 10.1146/annurev.arplant.55.031903.141610
Luo, D., Jia, Z. Q., Cheng, Y., Zou, X. L., Lv, Y. (2020). Genome-wide analysis of the β-amylase gene family in Brassica l. crops and expression profiles of BnaBAM genes in response to abiotic stresses. Agronomy 10 (12), 1855. doi: 10.3390/agronomy10121855
Manning, W. J., Tiedermann, A. V. (1995). Climate change: potential effects of increased atmospheric carbon dioxide (CO2), ozone (O3), and ultraviolet-b (UVB) radiation on plant diseases. Environ. pollut. 88, 219–245. doi: 10.1016/0269-7491(95)91446-r
Ma, J. F., Tamai, K., Yamaji, N., Mitani, N., Konishi, S., Katsuhara, M., et al. (2006). A silicon transporter in rice. Nature 440, 688–691. doi: 10.1038/nature04590
McLeod, A. R., Long, S. P. (1999). Free-air CO2 enrichment (FACE) in global change research: A review. Adv. Ecol. Res. 28, 1–56. doi: 10.1016/S0065-2504(08)60028-8
Molla, K. A., Karmakar, S., Molla, J., Bajaj, P., Varshney, R. K., Datta, S. K., et al. (2020). Understanding sheath blight resistance in rice: the road behind and the road ahead. Plant Biotechnol. J. 18, 895–915. doi: 10.1111/pbi.13312
Naik, R. G., Jayalakshmi, K., Naik, T. B. (2017). Efficacy of fungicides on the management of sheath blight of rice. Int. J. Curr. Microbiol. App. Sci. 6, 611–614. doi: 10.20546/ijcmas.2017.609.075
Pangga, I. B., Hanan, J., Chakraborty, S. (2013). Climate change impacts on plant canopy architecture: implications for pest and pathogen management. Eur. J. Plant Pathol. 135 (3), 595–610. doi: 10.1007/s10658-012-0118-y
Pinson, S. R. M., Capdevielle, F. C., Oard, J. H. (2005). Confirming QTLs and finding additional loci conditioning sheath blight resistance in rice using recombinant inbred lines. Crop Sci. 45 (2), 503–510. doi: 10.2135/cropsci2005.0503
Rodrigues, F.Á., Datnoff, L. E., Korndörfer, G. H., Seebold, K. W., Rush, M. C. (2001). Effect of silicon and host resistance on sheath blight development in rice. Plant Dis. 85 (8), 827–832. doi: 10.1094/pdis.2001.85.8.827
Rodrigues, F.Á., Vale, F. X. R., Datnoff, L. E., Prabhu, A. S., Korndörfer, G. H. (2003a). Effect of rice growth stages and silicon on sheath blight development. Phytopathology 93 (3), 256–261. doi: 10.1094/phyto.2003.93.3.256
Rodrigues, F.Á., Vale, F. X. R., Korndörfer, G. H., Prabhu, A. S., Datnoff, L. E., Oliveira, A. M. A., et al. (2003b). Influence of silicon on sheath blight of rice in Brazil. Crop Protect. 22 (1), 23–29. doi: 10.1016/s0261-2194(02)00084-4
Rush, M. C., Lee, F. N. (1992). “Sheath blight,” in Compendium of rice diseases. Eds. Webster, R. K., Gunnell, P. S. (St. Paul, MN: APS Press), 22–23.
Sathe, A. S., Kumar, A., Mandlik, R., Raturi, G., Sonah, H. (2021). Role of silicon in elevating resistance against sheath blight and blast diseases in rice (Oryza sativa l.). Plant Physiol. Biochem. 166, 128–139. doi: 10.1016/j.plaphy.2021.05.045
Savary, S., Castilla, N. P., Elazegui, F. A., Mclaren, C. G., Teng, P. S. (1995). Direct and indirect effects of nitrogen supply and disease source structure on rice sheath blight spread. Phytopathology 85 (9), 959–965. doi: 10.1094/Phyto-85-959
Schurt, D. A., Cruz, M. F. A., Nascimento, K. J. T., Marta, C. C. F., Rodrigues, F. A. (2014). Silicon potentiates the activity of defense enzymes in the leaf sheaths of rice plants infected by Rhizoctonia solani. Trop. Plant Pathol. 39, 457–463. doi: 10.1590/S1982-56762014000600007
Senapati, M., Tiwari, A., Sharma, N., Chandra, P., Bashyal, B. M., Ellur, R. K., et al. (2022). Rhizoctonia solani kühn pathophysiology: Status and prospects of sheath blight disease management in rice. Front. Plant Sci. 13. doi: 10.3389/fpls.2022.881116
Sharma, N. R., Akanda, S. I., Shahjahan, A. K. M. (1995). Development of sheath blight in short, tall, early and late maturing rice cultivars. Bangl. J. Bot. 24 (2), 143–146.
Sharma, R. C., Duveiller, E., Ortiz-Ferrara, G. (2007). Progress and challenge towards reducing wheat spot blotch threat in the Eastern gangetic plains of south Asia: is climate change already taking its toll? Field Crops Res. 103 (2), 109–118. doi: 10.1016/j.fcr.2007.05.004
Sharma, A., McClung, A. M., Pinson, S. R., Kepiro, J. L., Shank, A. R., Tabien, R. E., et al. (2009). Genetic mapping of sheath blight resistance QTLs within tropical rice cultivars. Crop Sci. 49, 256–264. doi: 10.2135/cropsci2008.03.0124
Thind, T. S., Mohan, C., Sharma, V. K., Raj, P., Arora, J. K., Singh, P. P. (2008). Functional relationship of sheath blight of rice with crop age and weather factors. Plant Dis. Res. 23 (1), 34–40.
Thompson, G. B., Drake, B. G. (1994). Insects and fungi on a C3 sedge and on a C4 grass exposed to elevated CO2 concentrations in open-top chambers in the field. Plant Cell Environ. 17, 1161–1167. doi: 10.1111/j.1365-3040.1994.tb02014.x
Uppala, S., Zhou, X. G. (2018). Field efficacy of fungicides for management of sheath blight and narrow brown leaf spot of rice. Crop Prot. 104, 72–77. doi: 10.1016/j.cropro.2017.10.017
Wang, Y. Q. (2006). Analysis on the occurrence and development of rice diseases and insects in China. Chin. Agric. Sci. Bull. 22, 343–347. doi: 10.3969/j.issn.1000-6850.2006.02.094
Wang, B., Sun, D. C., Lv, C. J. (2004). Effects of different carbon and nitrogen nutritions on Rhizoctonia solani. J. Anhui Tech. Teachers Coll. 18 (6), 18–21.
Wang, Z. B., Zuo, S. M., Li, G., Chen, X. J., Chen, Z. X., Zhang, Y. F., et al (2011). Study of resistance of rice to sheath blight at adult plant stage. J. Jilin Agric. Univ. 33 (2), 144–150. doi: CNKI:22-1100/S.201103
Willocquet, L., Noel, M., Hamilton, R. S., Savary, S. (2012). Susceptibility of rice to sheath blight: an assessment of the diversity of rice germplasm according to genetic groups and morphological traits. Euphytica 183, 227–241. doi: 10.1007/s10681-011-0451-9
Wu, W., Liao, Y. C., Shah, F., Nie, L. X., Peng, S. B., Cui, K. H., et al. (2013). Plant growth suppression due to sheath blight and the associated yield reduction under double rice-cropping system in central China. Field Crops Res. 144, 268–280. doi: 10.1016/j.fcr.2013.01.012
Xue, X., Cao, Z. X., Zhang, X. T., Wang, Y., Zhang, Y. F., Chen, Z. X., et al. (2016). Overexpression of OsOSM1 enhances resistance to rice sheath blight. Plant Dis. 100, 1634–1642. doi: 10.1094/pdis-11-15-1372-re
Zhang, Y., Chen, X. M., Zhang, C. C., Pan, G. X., Zhang, X. H. (2015). Availability of soil nitrogen and phosphorus under elevated CO2 and temperature in the taihu lake region, China. J. Plant Nutr. Soil Sc 177, 343–348. doi: 10.1002/jpln.201200526
Zhang, G. L., Dai, Q. G., Zhang, H. C. (2006). Silicon application enhances resistance to sheath blight (Rhizoctonia solani) in rice. J. Plant Physiol. Mol. Biol. 32 (5), 600–606. doi: 10.3321/j.issn:1671-3877.2006.05.015
Zhou, X. Y., Chen, X. B., Xu, X. L., Liu, A. L., Gao, G. B. (2007). On comparison of extraction methods of epicuticular wax and content of rice leaves. J. Hunan Agric. Univ. (Natural Sciences) 33 (3), 273–276. doi: 10.13331/j.cnki.jhau.2007.03.005
Zhu, Y. J., Zuo, S. M., Chen, Z. X., Chen, X. G., Li, G., Zhang, Y. F., et al. (2014). Identification of two major rice sheath blight resistance QTLs, qSB1-1HJX74 and qSB11HJX74, in field trials using chromosome segment substitution lines. Plant Dis. 98, 1112–1121. doi: 10.1094/pdis-10-13-1095-re
Zou, J. H., Pan, X. B., Chen, Z. X., Xu, J. Y., Lu, J. F., Zhai, W. X., et al. (2000). Mapping quantitative trait loci controlling sheath blight resistance in two rice cultivars (Oryza sativa l.). Theor. Appl. Genet. 101, 569–573. doi: 10.1007/s001220051517
Zuo, S. M., Chen, X. J., Chen, H. Q., Yan, X. U., Zhang, J. H., Chen, Y., et al. (2014a). Defense response and physiological difference of rice cultivars with different sheath blight resistance levels to the toxins produced by Rhizoctonia solani. Chin. J. Rice Sci. 28 (5), 551–558. doi: 10.3969/j.issn.1001-7216.2014.05.013
Zuo, S. M., Wang, Z. B., Chen, X. J., Gu, F., Zhang, Y. F., Chen, Z. X., et al. (2009). Evaluation of resistance of a novel rice line YSBR1 to sheath blight. Acta Agron. Sin. 35 (4), 608–614. doi: 10.1016/S1875-2780(08)60075-9
Zuo, S. M., Yin, Y. J., Pan, C. H., Chen, Z. X., Zhang, Y. F., Gu, S. L., et al. (2013). Fine mapping of qSB-11LE, the QTL that confers partial resistance to rice sheath blight. Theor. Appl. Genet. 126, 1257–1272. doi: 10.1007/s00122-013-2051-7
Zuo, S. M., Zhang, L., Wang, H., Yin, Y. J., Zhang, Y. F., Chen, Z. X., et al. (2008). Prospect of the QTL-qSB-9Tq utilized in molecular breeding program of japonica rice against sheath blight. J. Genet. Genomics 35, 499–505. doi: 10.1016/s1673-8527(08)60068-5
Keywords: Oryza sativa L., sheath blight, Rhizoctonia solani, free-air CO2 enrichment, elevated temperature, T-FACE, yield
Citation: Shen M, Cai C, Song L, Qiu J, Ma C, Wang D, Gu X, Yang X, Wei W, Tao Y, Zhang J, Liu G and Zhu C (2023) Elevated CO2 and temperature under future climate change increase severity of rice sheath blight. Front. Plant Sci. 14:1115614. doi: 10.3389/fpls.2023.1115614
Received: 04 December 2022; Accepted: 12 January 2023;
Published: 26 January 2023.
Edited by:
Jianping Lu, Zhejiang University, ChinaReviewed by:
Longbiao Guo, China National Rice Research Institute (CAAS), ChinaShulin Zhang, Anhui Agricultural University, China
Copyright © 2023 Shen, Cai, Song, Qiu, Ma, Wang, Gu, Yang, Wei, Tao, Zhang, Liu and Zhu. This is an open-access article distributed under the terms of the Creative Commons Attribution License (CC BY). The use, distribution or reproduction in other forums is permitted, provided the original author(s) and the copyright owner(s) are credited and that the original publication in this journal is cited, in accordance with accepted academic practice. No use, distribution or reproduction is permitted which does not comply with these terms.
*Correspondence: Chuang Cai, chaungcai@issas.ac.cn; Chunwu Zhu, cwzhu@issas.ac.cn