 Jie He
 Jia Hui Shirin Gan
 Lin Qin
94% of researchers rate our articles as excellent or good
Learn more about the work of our research integrity team to safeguard the quality of each article we publish.
Find out more
ORIGINAL RESEARCH article
Front. Plant Sci., 15 February 2023
Sec. Crop and Product Physiology
Volume 14 - 2023 | https://doi.org/10.3389/fpls.2023.1106394
This article is part of the Research TopicPlant Biology for Indoor Vertical Farming: A Multi-Discipline Approach to Controlled Environment AgricultureView all 7 articles
Portulaca oleracea L. (known as purslane), is a nutritious facultative C4 halophyte. Recently, it has been successfully grown indoors under LED lightings by our team. However, basic understanding about the impacts of light on purslanes are lacking. This study aimed to investigate the effects of light intensity and duration on productivity, photosynthetic light use efficiency, nitrogen metabolism and nutritional quality of indoor grown purslanes. All plants were grown in 10% artificial seawater hydroponically under different photosynthetic photon flux densities (PPFDs) and durations and thus different daily light integrals (DLI). They are, L1 (240 µmol photon m-2 s-1, 12 h, DLI = 10.368 mol m-2 day-1); L2 (320 µmol photon m-2 s-1, 18 h, DLI = 20.736 mol m-2 day-1); L3 (240 µmol photon m-2 s-1, 24 h, DLI = 20.736 mol m-2 day-1); L4 (480 µmol photon m-2 s-1, 12 h, DLI = 20.736 mol m-2 day-1), respectively. Compared to L1, higher DLI promoted root and shoot growth and thus increased shoot productivity by 2.63-,1.96-, 3.83-folds, respectively for purslane grown under L2, L3, L4. However, under the same DLI, L3 plants (continuous light, CL) had significantly lower shoot and root productivities compared those with higher PPFDs but shorter durations (L2 and L4). While all plants had similar total chlorophyll and carotenoid concentrations, CL (L3) plants had significantly lower light use efficiency (Fv/Fm ratio), electron transport rate, effective quantum yield of PSII, photochemical- and non-photochemical quenching. Compared to L1, higher DLI with higher PPFDs (L2 and L4) increased leaf maximum nitrate reductase activity while longer durations increased leaf concentrations and total reduced nitrogen. There were no significant differences in leaf total soluble protein, total soluble sugar and total ascorbic acid concentrations in both leaf and stem regardless of light conditions. However, L2 plants had the highest leaf proline concentration but leaf total phenolic compounds concentration was higher in L3 plants instead. Generally, L2 plants had the highest dietary minerals such as K, Ca, Mg and Fe among the four different light conditions. Overall, L2 condition is the most suitable lighting strategy in enhancing productivity and nutritional quality of purslane.
To enhance food security in Singapore, it has been proposed to build our capability and capacity to locally produce 30% of our nutritional needs by 2030 (Singapore Food Agency, 2020). Utilisation of seawater to grow nutritious halophyte vegetables could be a strategy to solve the problem of water shortage in Singapore as halophytes do not compete fresh water with glycophytes. Furthermore, due to the limited available land, we are also developing vertical growth systems to produce vegetables under LED lightings (He et al., 2020b; He et al., 2021; He et al., 2022). Portulaca oleracea L. (known as purslane) is one of the most nutritious halophytes owing to its high content of antioxidants (Lim and Quah, 2007; Uddin et al., 2012; Alam et al., 2014). Purslane is a C4 halophyte, which performs CAM under drought (Ferrari et al., 2020) and salt stress (He et al., 2021). Recently, we have successfully grown purslane indoors using vertical farming systems with different saline nutrient solutions. In our study, all purslane plants were grown under a photosynthetic photo flux density (PPFD) of 200 μmol m-2 s-1 (12 h), supplied by red-LED to blue-LED ratio of 2.2 (defined as LED R/B 2.2). Our findings suggest that a 100 mM of NaCl is the most suitable saline condition to grow purslane in order to achieve higher productivity and better quality using our indoor farming systems (He et al., 2021).
For vertical farming, most studies are using different combinations of LED light spectra at low PPFD between 150 to 300 µmol m-2 s-1 (He et al., 2018; Palmer and van Iersel, 2020). It has been reported that photosynthetic performance, shoot and root biomass accumulation decreased in low light condition (Yang et al., 2018; He and Qin, 2022). For instance, Yang et al. (2018) concluded that light intensity directly affects the expression of photosynthetic proteins which regulate the synthesis of photosynthetic pigments, photosynthetic electron transport and Calvin cycle in soybean (Glycine max L. Merr.). Using three different vegetables namely Kai Lan (Brassica alboglabra), Nai Bai (B. chinensis L.) and mizuna (B. juncea var. japonica), we (He and Qin, 2022) carried out comparative studies under different LED spectral qualities and quantities. All plants had much higher shoot fresh weight (FW) under a PPFD of 500 µmol m-2 s-1 than under a PPFD of 300 µmol m-2 s-1 regardless of LED combinations. These results suggest that not only LED quality but also intensity is important to enhance shoot productivity (Nájera and Urrestarazu, 2019).
Both light intensity and duration (photoperiod) determine daily light integral, DLI (mol m-2 day-1), which describes the number of photosynthetically active photons that are delivered to a specific area over a 24-hour period. Many plant growth traits are better related to DLI than to instantaneous PPFD levels at any given time (Poorter et al., 2019). Under artificial light conditions, the light intensity and photoperiod can be varied to determine the optimal DLI used to improve not only crop productivity but also nutritional quality. For instance, sweet basil (Ocimum basilicum) grown under higher DLIs of 12.9, 16.5, or 17.8 mol m-2 day-1 had higher shoot FW, photosynthesis, stomatal conductance and transpiration than under lower DLI of 9.3 mol m-2 day-1. It was also found increases in soluble sugar and phenolic contents in basil plants grown under higher DLIs than under lower DLIs (Dou et al., 2018). In the study of hydroponically grown lettuce (Lactuca sativa L. cv. Ziwei), there was a positive linear correlation between DLI and leaf biomass with increasing tDLI from 6.48 to 17.28 mol m-2 day-1 (Zhang et al., 2018). These results suggested that a low PPFD could be compensated for a longer photoperiod at the same DLI which could be achieved either by a long duration with a low P PFD or by a short duration with a high PPFD. However, in another study with two different lettuce cultivars, Kelly et al. (2020) reported that specific PPFD and photoperiod combinations can have different effects on plant growth as well as the nutritional quality.
Continuous lighting (CL) maximizes the light duration while minimizes the light intensity at the same DLI. The application of CL in a vertical indoor farm is considered an effective method to save both lighting and cooling costs (Ohyama et al., 2005). However, the effects of CL on plants could be either positive such as increased productivity and enhanced quality (Zha et al., 2019; Elkins and van Iersel, 2020; Proietti et al., 2021) or negative such as induced leaf chlorosis and accelerated senescence (Demers and Gosselin, 2000; Sysoeva et al., 2010; Velez-Ramirez et al., 2011; Shimomura et al., 2020). Compared with 16 h, Zha et al. (2019) found that a greater shoot biomass and antioxidant such as reduced ascorbate and dehydroascorbate contents without leaf injury in hydroponic lettuce were obtained under CL at the same PPFD of 200 µmol m-2 s-1 provided by red and blue LEDs. In another study with lettuce, Elkins and van Iersel (2020) reported that there are correlations among PPFD, photoperiod, DLI and photosynthetic light use efficiency measured by electron transport through photosystem II (PS II). They found that the total electron transport through PS II would increase if the same DLI was provided at a lower PPFD over 24 hours. In the study with rocket plants (Eruca vesicaria L.), CL enhanced yield and nutritional quality measured by pigments, antioxidant compounds. However, nitrate (NO3-) was significantly reduced in rocket leaves grown under CL. This result implies that CL may increase nitrate reductase activity (NRA) and the reduction of (Proietti et al., 2021). In the study of medicinal plant, Nasturtium (Tropaeolum majus L.) under the same DLI but different photoperiods with different PPFDs, Xu et al. (2021) found that leaf biomass, concentrations of secondary metabolites, and light use efficiency increased under the CL compared to the 16-h treatment. However, Demers and Gosselin (2000) reported that yield and chlorophyll (Chl) concentration decreased when tomato and sweet pepper plants were subjected to CL. The negative effects of CL on certain species may be due to the photooxidative damage caused by CL. Shimomura et al. (2020) reported that the highest antioxidant content such as chlorogenic acid (CGA) of lettuce was obtained under the CL treatment, suggesting that CGA protected plants from photooxidative damage caused by CL.
Compositions and concentrations of bioactive compounds of purslane can be affected by both light intensity and photoperiod (Palaniswamy et al., 2001; Petropoulos et al., 2016). Given that purslane is a C4 plant, it is able to adapt to high light conditions via the C4 photosynthetic pathway (Gonnella et al., 2010). Under high light intensities, C4 plants have higher photosynthetic rates and higher productivity than C3 plants (Pearcy and Ehleringer, 1984). It was reported that purslane can thrive in various light intensities as well as different photoperiods (Singh, 1972; Koch and Kennedy, 1980; Ferrari et al., 2020). However, a very little research has been done on the effects of light intensity, duration and DLI on growth, physiological performance and nutritional quality of purslane grown indoors. Our hypothesis is that high light intensity and higher DLI could enhance productivity and improve nutritional quality of C4 purslane grown indoors. We also tested if the same DLI was provided at a lower PPFD through CL could increase productivity and enhance nutritional quality compare to those plants grown with the same DLI under higher PPFDs but shorter durations. The findings of the study could provide lighting strategy for purslane growers to enhance its productivity and nutritional quality through the selection of light intensity and duration.
Seeds of purslane (P. oleracea L. cv. POR – 2936) were used in this study. Seedlings were inserted into polyurethane cubes after germination for 4 days. All seedlings were placed under a PPFD of 100 μmol m−2 s−1 supplied by high-pressure sodium lamps for 4 weeks before transplanting onto indoor hydroponic systems. Plants were then grown in 10% artificial seawater (ASW) with full strength nutrient solution. To make up a 10% ASW, a salinity of 3.3 ppt was prepared by dissolving 28.8g of Red Sea Salt® (Red Sea Fish Pharm Ltd., Eilat, Israel; www.redseafish.com) in 8 L full strength nutrient solution. The conductivity of and the pH of the nutrient solutions were 2.2 ± 0.2 mS cm−1 and 6 ± 0.2, respectively. The plants were grown under four different light intensities and durations: L1 (240 µmol photon m-2 s-1, 12 h, DLI = 10.368 mol m-2 day-1); L2 (320 µmol photon m-2 s-1, 18 h, DLI = 20.736 mol m-2 day-1); L3 (240 µmol photon m-2 s-1, 24 h, DLI = 20.736 mol m-2 day-1); L4 (480 µmol photon m-2 s-1, 12 h, DLI = 20.736 mol m-2 day-1). The same LED spectral quality with red/blue LED ratios of 2.2 (WR-16W, Beijing Lighting Valley Technology Co., Ltd., China) was used for all the different light conditions. The light spectral distribution was reported by He et al. (2021). The room temperature and relative humidity were 25°C/23°C and 60%/80% (day/night) respectively.
After removing the polyurethane cubes, the roots were spread out in a tray of water. The roots were first scanned using the WIN MAC RHIZO scanner. Subsequently, the WIN MAC RHIZO V 3.9 programme was used to analyse the root morphological parameters including total root length, number of root tips, total root surface area and average root diameter.
On day 8 and 16 after transplanting, the whole plants were harvested. After removing the polyurethane cubes from the roots, shoot (leaf and stem) and root were separated for FW measurements. The total leaf number was recorded before determining the total leaf area (TLA) of each plant using leaf area meter (WinDIAS3 Image Analysis system). To obtain DW, shoot and roots were wrapped separately in aluminium foils and dried in the oven at 80°C for 4 days. Specific leaf area (SLA) was calculated using leaf area (cm2)/leaf dry weight (g) (Hunt et al., 2002).
Fv/Fm ratios (maximum potential quantum efficiency of PSII) of dark-adapted attached leaves were measured using the Plant Efficiency Analyser (Hansatech Instruments Ltd, England) during mid-photoperiod. The ETR, ΔF/Fm’, qP and NPQ were determined from detached leaf using the IMAGING PAM MAXI (Walz, Effeltrich, Germany) at 25°C in the laboratory. The details of Fv/Fm ratio, ETR, ΔF/Fm′, qP and NPQ measurements were described by He et al. (2011).
Leaf samples (0.05 g) were harvested on day 12 after transplanting and soaked in 5 ml of N, N-dimethylformamide in the dark for 48 h at 4°C (Wellburn, 1994). The absorbance was read at wavelength of 480, 647 and 664 nm, respectively. The concentrations of Chl a, b, and Car were calculated according to Wellburn (1994).
Plant samples were dried at 80°C for 4 days. Dried samples (0.01 g) were grounded with 10 ml deionised water and were then incubated at 37°C for two hours. Sample turbidity was then removed by vacuum filtering the mixture through a 0.45 µm-pore-diameter membrane. The flow injection analyser (Model Quikchem 800, Lachat Instruments Inc., Milwaukee, USA) was used to measures concentration through the reduction of NO3- to nitrite ( ) when the sample passes through a copperized cadmium column. was diazotized with sulphanilamide and coupled with N-(1-naphthyl) ethylenediamine dihydrochloride resulting in a magenta water-soluble dye that was read at 520 nm. TRN content was determined by Kjeldahl digestion of 0.05 g of dried samples and a Kjeldahl tablet in 5 ml of concentrated sulphuric acid for 60 min at 350°C. After digestion, TRN concentration was quantified by Kjeltec 8400 analyzer (Foss Tecator AB, Höganäs, Sweden) through titration.
The frozen sample stored at −80°C was powdered in liquid nitrogen and ground with 4 ml of ice-cold extractiPon buffer with the presence of 0.2 g/g FW PVPP. The extraction buffer included 0.25 M Tris-HCl (pH 8.5), 3 mM dithiothreitol (DTT), 10 µM flavin adenine dinucleotide (FAD), 1 µM sodium molybdate, 1 mM Ethylenediamine-tetra-aceticacid (EDTA). The extracts were centrifuged at 18,000 g for 20 min at 4°C. The supernatant was used to determine the NRA immediately.
In vitro NADH:NRA assay was derived from Kaiser and Huber (1997) with modification. The NRact was determined by assaying NR either with Mg2+ (10 mM), or with EDTA (15 mM). In all cases, the total reaction medium was 700 µl which contained 50 mM Hepes-KOH (pH 7.5), 1 mM DTT, 10 µM FAD, 10 mM KNO3, 0.2 mM NADH, NR extraction, and 10 mM MgCl2 or 15 mM EDTA. The reaction was started by adding of 100 – 200 µl NR extraction. Incubation was performed at 25°C for 20 min, and the reaction was then terminated by the addition of an equal volume (700µl) of Sulfanilamide (1%(w/v) in 3 N HCl) and the naphthylethylens-diamine dihydrochloride (0.02% w/v). After 30 min at room temperature, the absorbance was read at wavelength of 540nm. The blank was identical to the samples, but the NR extracts were boiled for 5 min before the addition. NRAmax was expressed as µmol nitrite () h-1 g-1 FW. The NRact is defined as the activity measured in the presence of 10 mM MgCl2 divided by the activity measured in the presence of 15 mM EDTA (expressed as a percentage).
The details of leaf TSP extraction were described in He et al. (2017a). The frozen samples (1 g) were powdered in liquid nitrogen and ground with 6 ml of extraction buffer [100 mM Bicine-KOH (pH 8.1), 20 mM MgCl2, 2% PVP]. The mixture was centrifuged at 35,000 rpm for 30 min at 4°C using a Beckman ultracentrifuge Optima XL-100K. 1 ml aliquot of the supernatant was mixed with 4 ml of 80% cold acetone before centrifuging at 3500 rpm for 10 min. The precipitate was dissolved in 1 ml of 1 M NaOH. The concentration of leaf TSP was determined according to Lowry et al. (1951).
Dried plant tissues of 0.01 g were added to 4 ml of 80% ethanol and heated in a 65°C water bath for 30 min. The homogenate was centrifuged at 4000 rpm for 5 min before collecting the supernatant. The pellet was resuspended with another 2 ml of 80% ethanol and the process was repeated twice. TSS concentration was determined at 490 nm using a spectrophotometer (UV-2550 Shimadzu, Japan) according to Dubois et al. (1956).
The same amount of froze plant tissues (0.5 g) was used to extract proline, ASC and TPC, separately. The details of extraction processes for these three phytochemicals were described in He et al. (2020b). The proline assay was modified from Bates et al. (1973). The absorbance of proline extract was measured at 520 nm. For ASC and TPC, the absorbances were determined at 524nm and 765 nm, respectively based on Leipner et al. (1997) and Ragaee et al. (2006). All absorbances were measured using a spectrophotometer (UV-2550 Shimadzu, Japan).
Dried samples (0.2 g) were digested in 4 ml of 65% nitric acid using UltraWAVE single reaction chamber microwave digestion system (Milestone, US). The digested solution was diluted with Milli-Q water to a final volume of 25 ml. The Optima 8300 ICP-OES (Inductively Coupled Plasma Optical Emission Spectrophotometer) and Syngistix software (Perkin Elmer, US) were used to measure and calculate the concentrations of dietary minerals.
One-way (ANOVA) was used to test for significant differences among the different treatments. Tukey’s multiple comparison tests were carried out to discriminate among the means of the different groups (MINITAB 19).
Root morphology was analysed 8 days after transplanting and the results are shown in Figure 1. The total root length, total root surface area and total number of root tips of L2 (320 µmol photon m-2 s-1, 18 h, DLI of 20.736 mol m-2 day-1) and L4 (480 µmol photon m-2 s-1, 12 h, DLI of 20.736 mol m-2 day-1) plants were similar but significantly greater than those of L1 (240 µmol photon m-2 s-1, 12 h, DLI of 10.368 mol m-2 day-1) and L3 plants (240 µmol photon m-2 s-1, 24 h, DLI of 20.736 mol m-2 day-1). (Figures 1A–C). There were no significant differences in average root diameter among light treatments (Figure 1D).
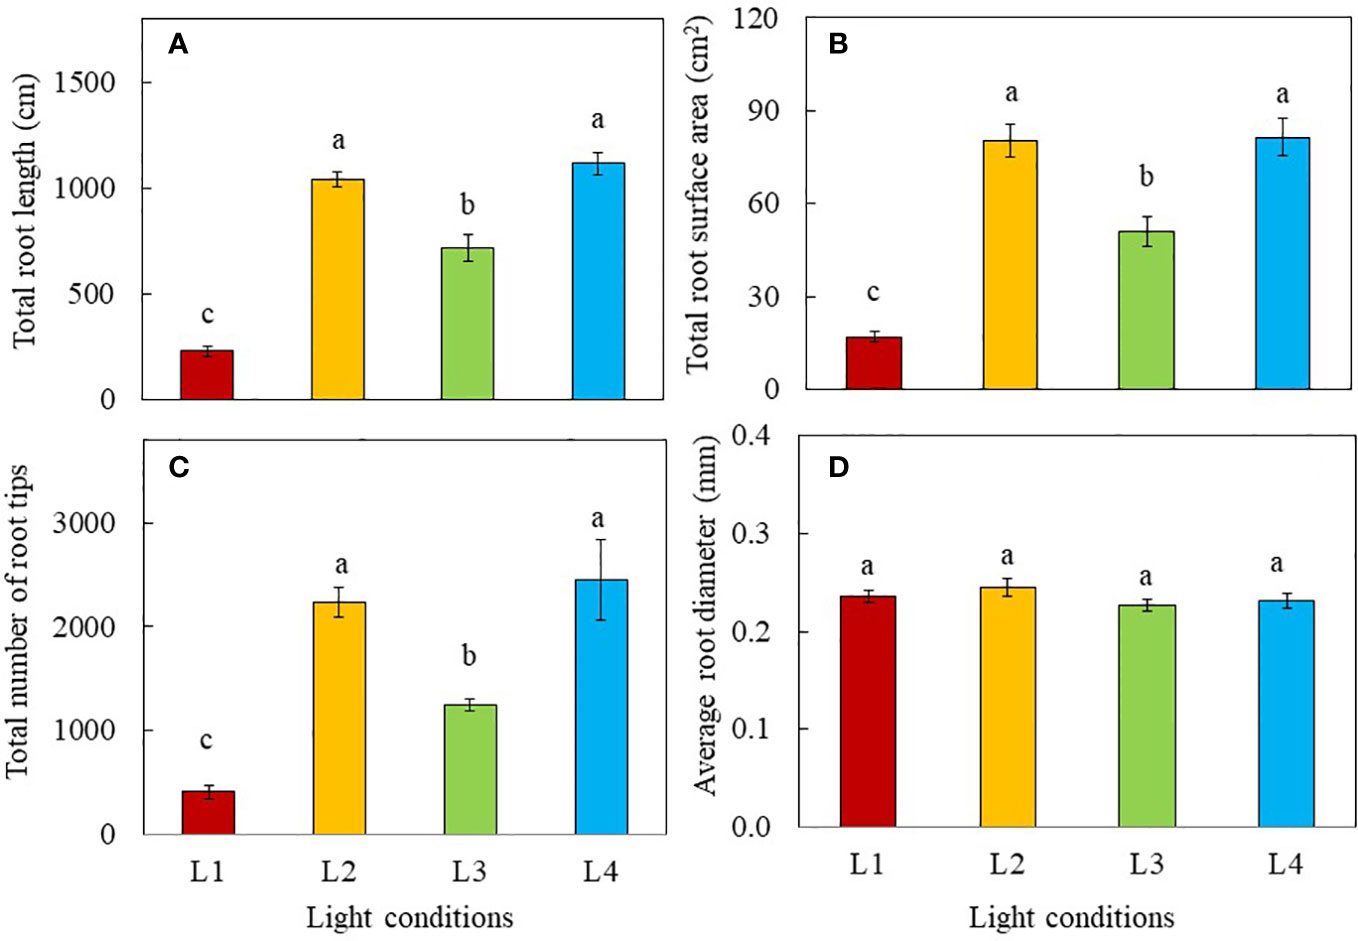
Figure 1 Total root length (A), total root surface area (B), total number of root tips (C) and average root diameter (D) of purslane grown under different light treatments for 8 days. Values are means ± standard errors. Means with different letters are statistically different (p<0.05; n =5) as determined by Tukey’s multiple comparison test. L1 (240 µmol photon m-2 s-1, 12 h, DLI = 10.368 mol m-2 day-1); L2 (320 µmol photon m-2 s-1, 18 h, DLI = 20.736 mol m-2 day-1); L3 (240 µmol photon m-2 s-1, 24 h, DLI = 20.736 mol m-2 day-1); L4 (480 µmol photon m-2 s-1, 12 h, DLI = 20.736 mol m-2 day-1).
On day 8 after transplanting, the shoot FW (Figure 2A) and DW (Figure 2B) as well as root FW (Figure 2C) were significantly higher in L2 and L4 plants than L1 and L3 plants. For root DW, L2, L3 and L4 plants were similar but significantly higher than that of L1 plants (Figure 2D). At the early stage of 8 days after transplanting, L1 plants grown under the lowest PPFD with the shortest photoperiod with the lower DLI of 10.368 mol m-2 day-1 had the lowest shoot and root productivity compared to those of plants grown under higher PPFD with same duration (L4) or higher PPFD with longer duration (L2 and L3 but with the same DLI of 20.736 mol m-2 day-1). Grown under the same DLI, L2, and L4 plants with non-CL had significantly higher shoot and root productivity than L3 plants with CL. On day 16 after transplanting, however, L4 plants had the highest values for shoot and root productivity, followed by L2 and L3 plants. The L1 plants had the lowest values but no significant differences were observed between L2 and L3 plants (Figures 2A–D). The lowest shoot FW and DW of L1 plants were mainly due to the lowest branch number, stem height and total number of leaves as well as the smallest total leaf area compared to those of L2, L3 and L4 plants (Figure 3). It was noted that the shoot/root FW ratio of L1 plants was the highest on day 8 and 16 after transplanting, almost twice the value than the other groups (Figure 2E). On day 8 after transplanting, the shoot/root DW ratio was the highest in L1 plants and the lowest in L3 plants, while shoot/root DW ratios of L2 and L4 plants did not significantly differ. On day 16 after transplant, no significant differences in shoot/root DW ratios were found among light treatments (Figure 2F).
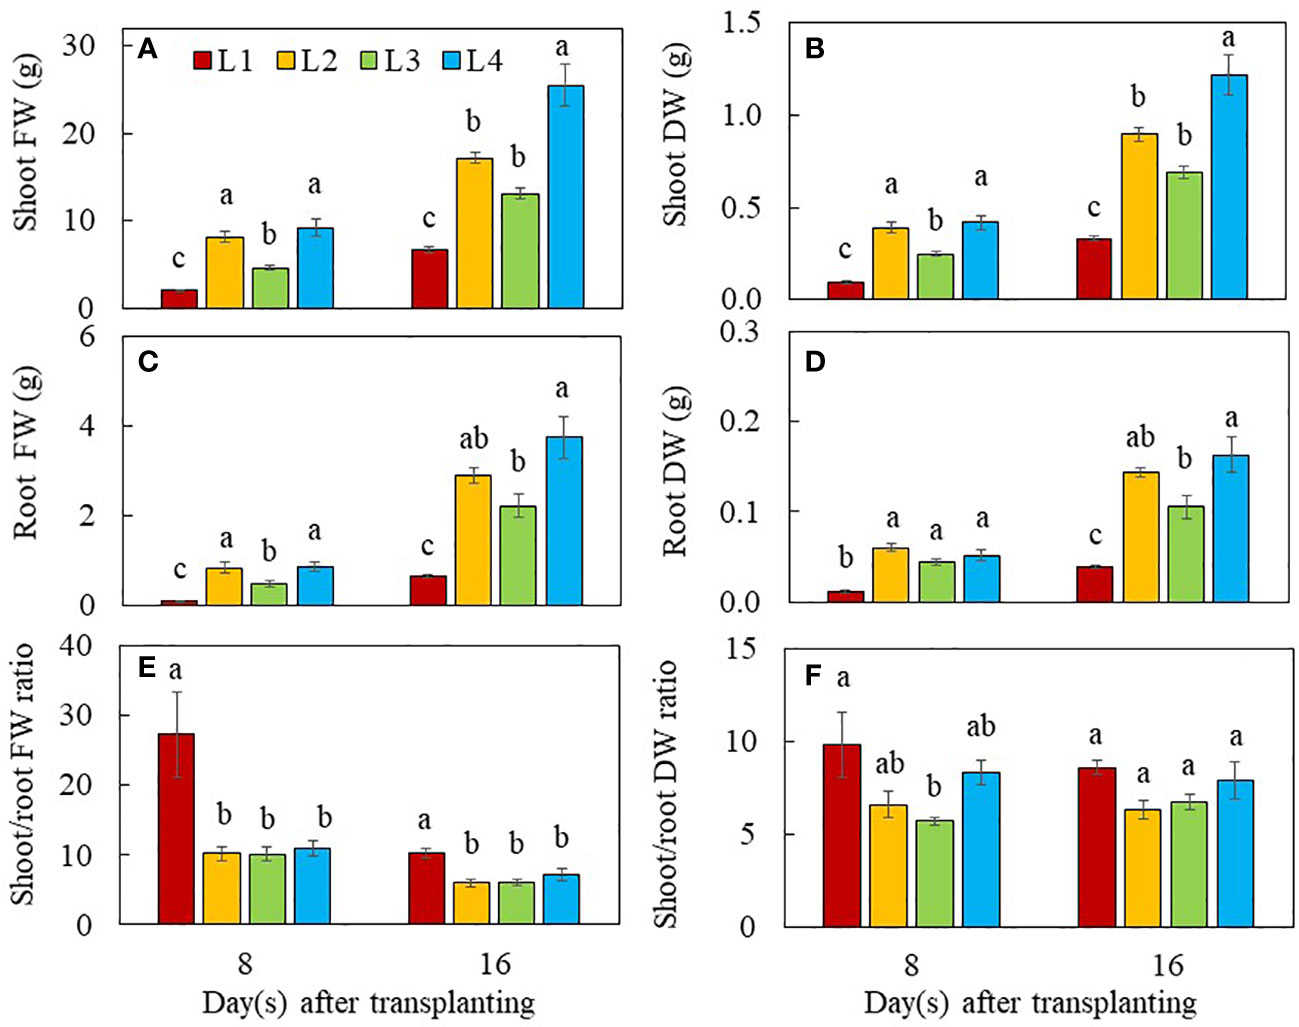
Figure 2 Shoot FW (A), shoot DW (B), root FW (C), root DW (D), shoot/root FW ratio (E) and shoot/root DW ratio (F) of purslane grown under different light conditions for 8 and 16 days. Values are means ± standard errors. Means with different letters are statistically different (p<0.05; n =5) as determined by Tukey’s multiple comparison test for each day. Refer to Figure 1 for the different conditions of L1, L2, L3 and L4.
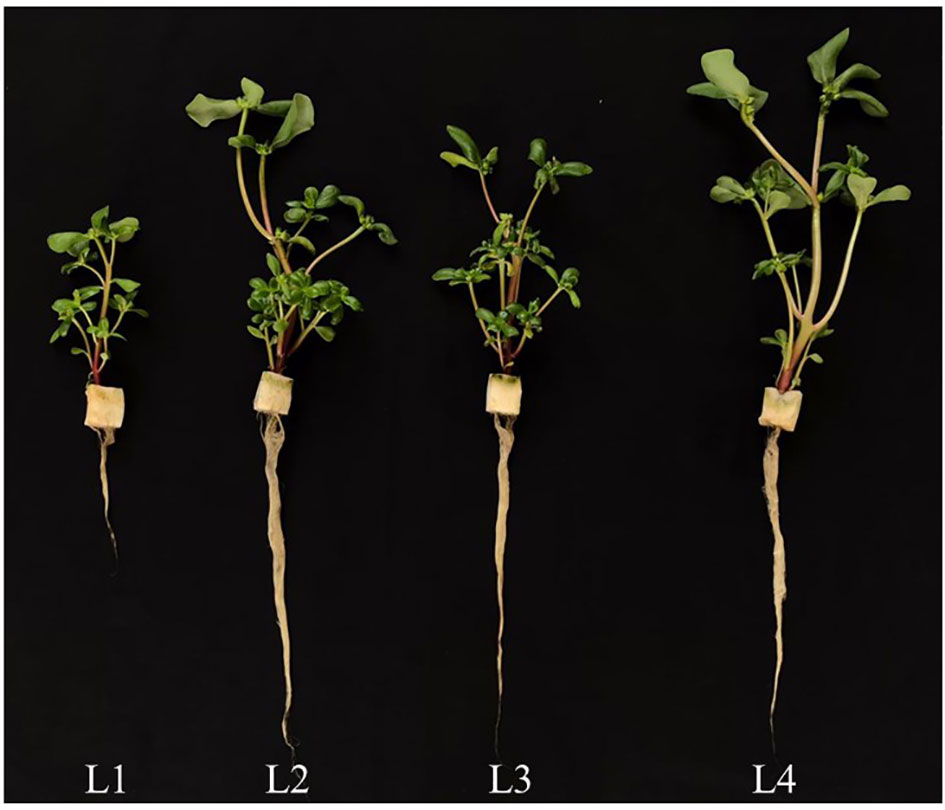
Figure 3 Purslane plants grown indoors hydroponically under LED lighting (R/B ratio of 2.2) with different light intensities and durations for 16 days. Refer to Figure 1 for the different conditions of L1, L2, L3 and L4.
The leaf number of L1 plants was significantly lower than all other groups on both day 8 and 16 after transplant (Figure 4A), indicating that plants with higher DLI increased leaf number regardless of light intensity and duration. On day 8 after transplanting, the total leaf area (TLA) was significantly higher in L2, L3 and L4 plants than in L1 plants. On day 16 after transplanting, however, L4 had the highest TLA, followed by L2 and L3, with L1 plants having the lowest values. The TLA of L3 plants did not significantly differ from L2 plants on day 16 after transplanting (Figure 4B). The SLA was the highest in L1 and L4 plants, followed by L2, with L3 plants having the lowest values on day 8 and 16 after transplanting. On day 8 after transplant, the SLA of L1 and L2 plants did not significantly differ (Figure 4C).
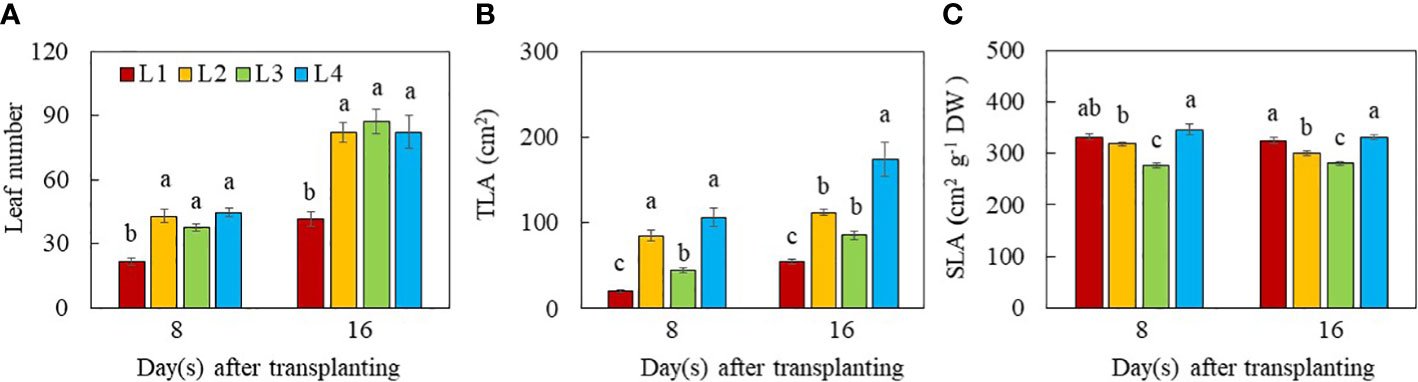
Figure 4 Leaf number (A), TLA (B) and SLA (C) of purslane grown under different light conditions for 8 and 16 days. Values are means ± standard errors. Means with different letters are statistically different (p<0.05; n =5) as determined by Tukey’s multiple comparison test for each day. Refer to Figure 1 for the different conditions of L1, L2, L3 and L4.
The total Chl, total Car concentrations and the Chl a/b ratio were not significantly different among the different light treatments (Figures 5A–C). However, the Chl/Car ratio of L3 plants grown under CL condition was significantly lower than that of all other three light treatments (Figure 5D).
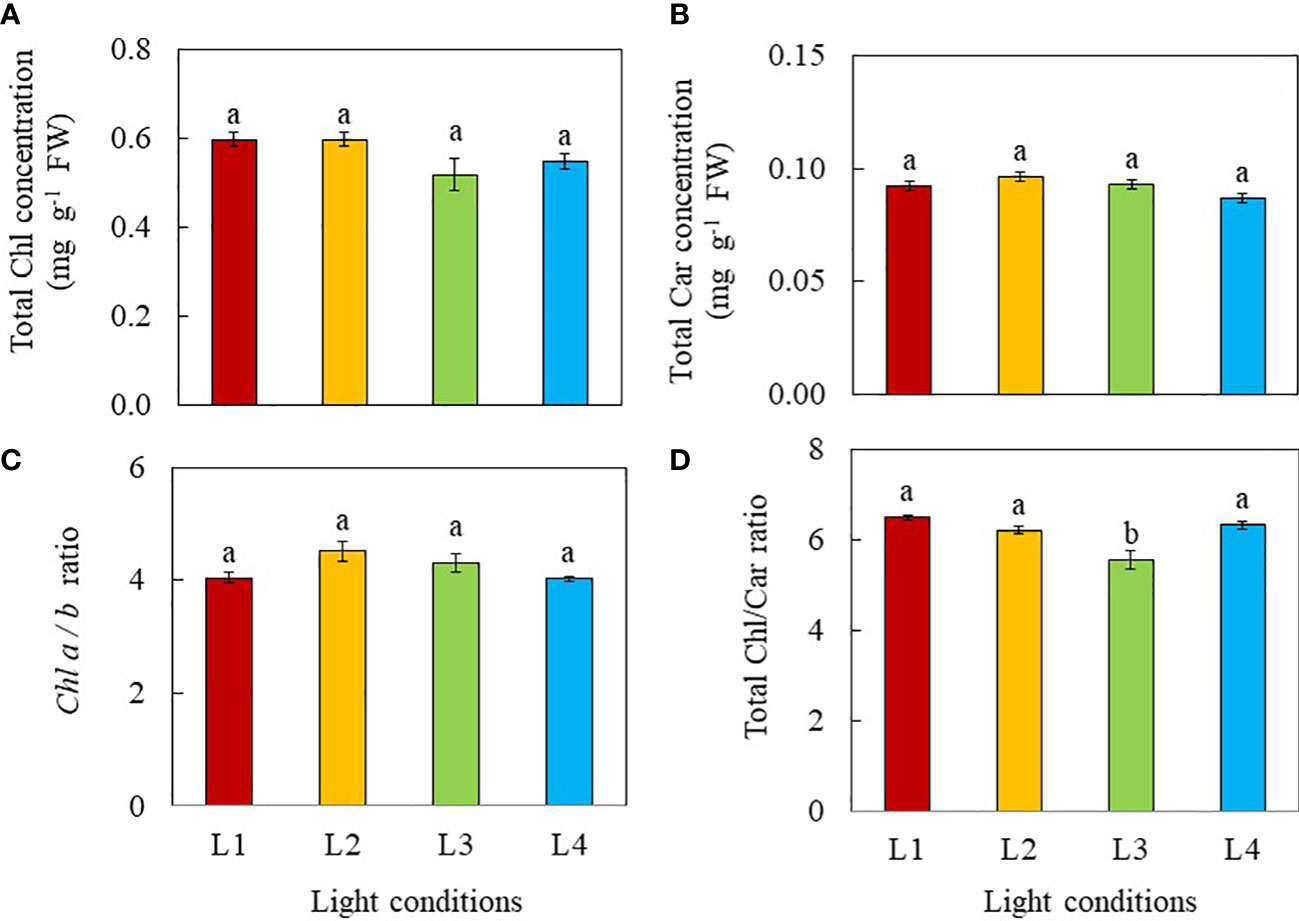
Figure 5 Total Chl concentration (A), total Car concentration (B), Chl a/b ratio (C) and total Chl/Car ratio (D) of purslane grown under different light conditions for 12 days. Values are means ± standard errors. Means with different letters are statistically different (p<0.05; n =5) as determined by Tukey’s multiple comparison test. Refer to Figure 1 for the different conditions of L1, L2, L3 and L4.
During mid-photoperiod, the Fv/Fm ratios of L1, L2 and L4 plants were around or close to 0.8 and the Fv/Fm ratios of L2 plants was significantly higher than the Fv/Fm ratio of L3 plants. The Fv/Fm ratio of 0.754 for L3 plants, indicates mild light stress resulting from CL (Figure 6A). Measured at a PPFD of 1076 m-2 s-1, ETR, ΔF/Fm’ and qP were the highest in L2 plants, followed by L1 and L4 plants and the lowest values were found in L3 plants (Figures 6B–D). However, at a PPFD of 1076 m-2 s-1, NPQ values were the highest in plants grown under L4, followed by L2 and L1 with L3 having the lowest value (Figure 6E).
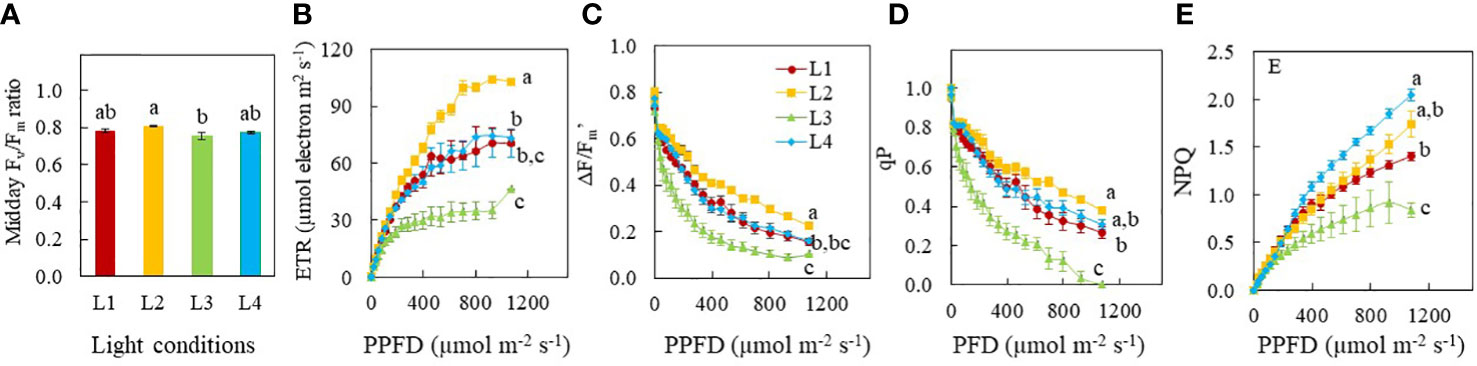
Figure 6 Fv/Fm ratio (A) of Purslane (n=8) grown under different light treatments for 9 days. Light response curves of ETR (B), ΔF/Fm’ (C), qP (D) and NPQ (E) of purslane (n=5) grown under different light conditions for 12 days. Values are means ± standard errors. Means with different letters are statistically different (p<0.05) as determined by Tukey’s multiple comparison test. Refer to Figure 1 for the different conditions of L1, L2, L3 and L4.
The effects of light conditions on N metabolism were studied by the measurements of (Figure 7A) and TRN concentrations in leaf, stem and root (Figure 7B). as well as NRA in leaf and stem (Figure 8). The leaf TSP was also determined (Figure 7C). For all light treatments, NO3- concentration was lower in the leaves than the stem and roots. Leaf NO3- concentration was the highest in L3 plants and the lowest in L1 and L4 plants. Leaf NO3- concentration in plants grown under L2 did not significantly differ from the other groups. There were no significant differences in stem NO3- concentration among the plants grown under different light treatments. The root NO3- concentration of plants grown under L4 was significantly lower than that of all other light treatments (Figure 7A). All plants had similar TRN concentration in their stems. For leaves, the TRN concentrations were significantly higher in L2 and L3 leaves than those of L1 and L4 leaves. For the roots, L1 plants had significantly higher TRN than L3 plants which TRN concentration was not significantly different from those of L2 and L4 plants (Figure 7B). There were no significant differences in leaf TSP concentration among purslane grown under different light conditions (Figure 7C).
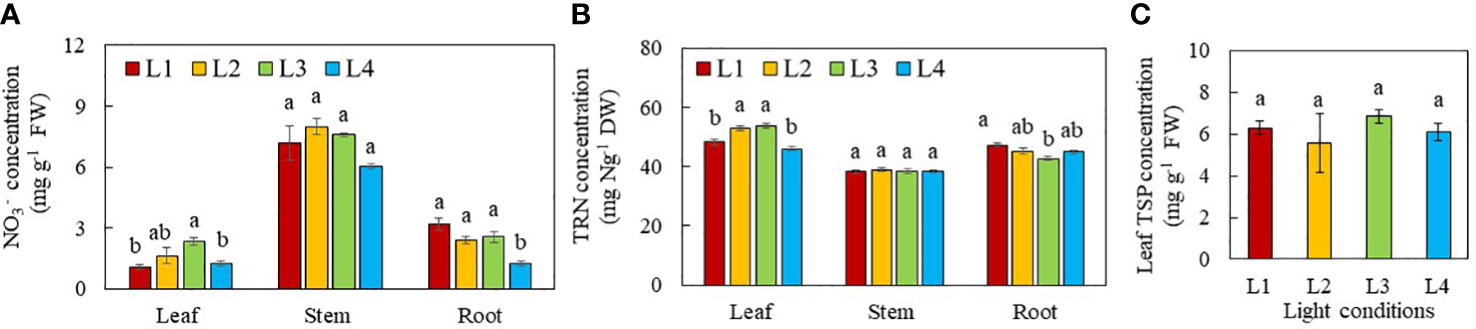
Figure 7 NO3- (A), TRN (B) and TSP (C) concentrations of purslane grown under different light conditions for 13 days. Values are means ± standard errors. Means with different letters are statistically different (p<0.05; n =4) as determined by Tukey’s multiple comparison test for each plant organ. Refer to Figure 1 for the different conditions of L1, L2, L3 and L4.
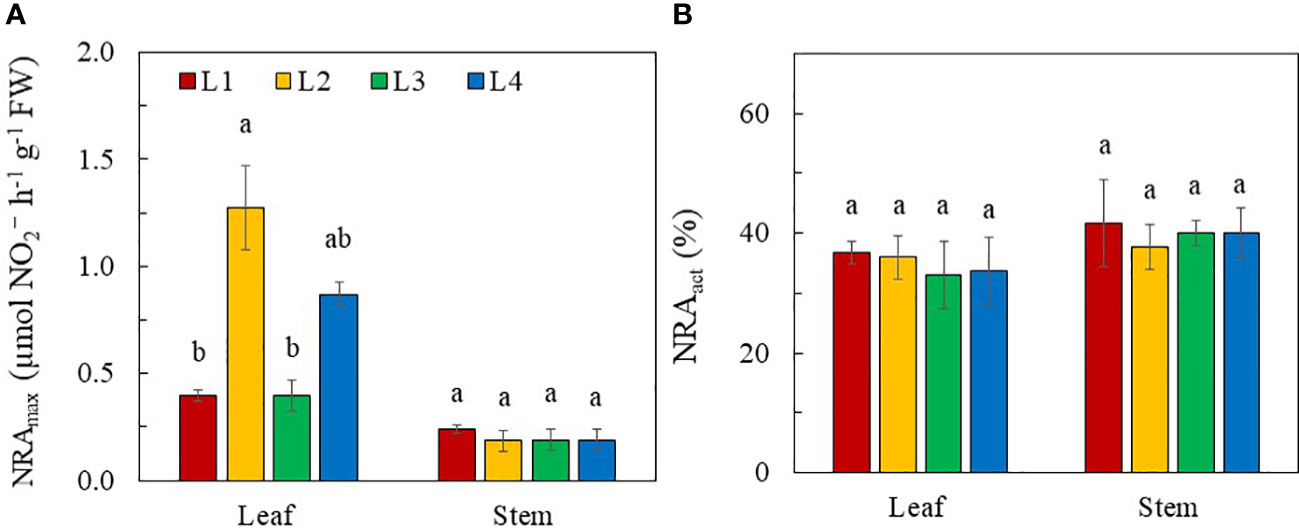
Figure 8 NRAmax (A) and NRact (B) of purslane grown under different light conditions for 14 days. Values are means ± standard errors. Means with different letters are statistically different (p<0.05; n =3) as determined by Tukey’s multiple comparison test for each plant organ. Refer to Figure 1 for the different conditions of L1, L2, L3 and L4.
All plants had higher NRAmax in the leaves compared to the stems. NRAmax was hardly detected in the roots. Leaf NRAmax was much higher in L2 and L4 plants than those in L1 and L3 plants although statistically there was no significant difference in leaf NRAmax between L3 and L4 plants. All plants had a similar stem NRA regardless of light conditions (Figure 8A). The NRact was not correlated with NRAmax in leaves as there were no significant differences in NRact in both leaves and stems among plants grown under different light treatments (Figure 8B).
Proline, TSS, total ASC and TPC concentrations were higher in the leaves than the stems regardless of light conditions (Figure 9). Leaf proline concentrations were higher in L2 and L4 plants than in L3 plants. L1 plants had the lowest leaf proline concentration. Stem proline concentration in L1 plants was the lowest compared to other groups (Figure 9A). For both leaf and stem, no significant differences in TSS (Figure 9B) and total ASC (Figure 9C) concentrations were observed among the plants grown under different light conditions. Leaf TPC concentration was higher in L3 plants than other groups, while leaf TPC in L4 plants did not significantly differ from other groups. For stems, the TPC concentration was higher in L3 and L1 plants than those of L2 and L4 plants (Figure 9D).
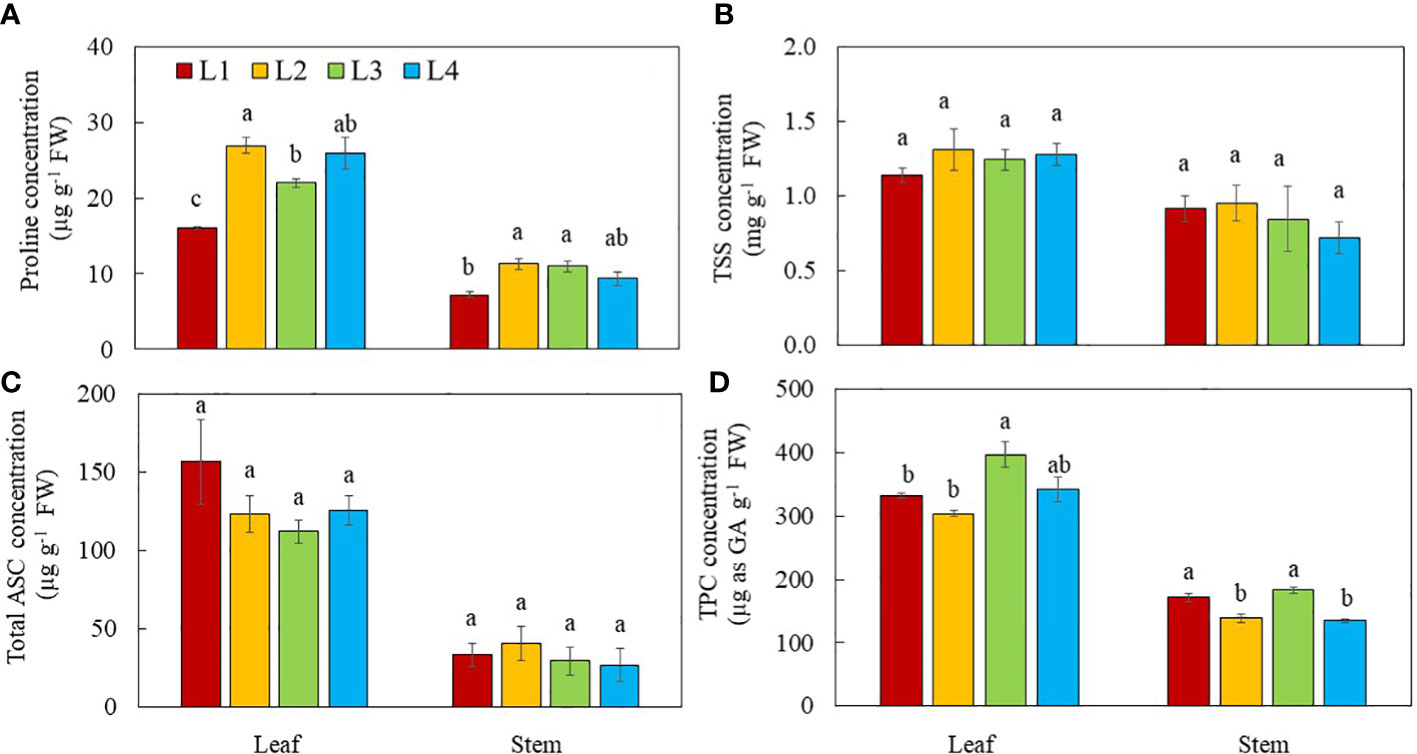
Figure 9 Proline (A), TSS (B), total ASC (C) and TPC (D) of purslane grown under different light conditions for 14 days. Values are means ± standard errors. Means with different letters are statistically different (p<0.05; n =4) as determined by Tukey’s multiple comparison test for each plant organ. Refer to Figure 1 for the different conditions of L1, L2, L3 and L4.
With the exception of K, a higher concentration of Ca, Mg and Fe were found in the leaves compared to those of stems for all plants (Figure 10). Stem contained a higher concentration of K, almost double the values found in the leaves. Both leaf and stem K concentrations were significantly lower in L3 plants compared to other groups (Figure 10A). Leaf Ca concentration in L1 plants was significantly lower compared to those of L2, L3 and L4 plants. Stem Ca concentration was the highest in plants grown under L3 and L4, followed by L2 and the lowest value was found in L1 plants (Figure 10B). For the leaf Mg, L1 plants had significantly lower concentration compared to other groups. Stem Mg concentration was the highest in plants grown under L3 followed by L2, L4 and L1 conditions (Figure 10C). Leaf Fe concentration was the highest in L2 plants, followed by L4 plants, with L1 and L3 plants having the lowest values. Stem Fe concentration was the highest in L3 plants and lowest in L1 plants, while values of L2 and L4 plants did not significantly differ (Figure 10D).
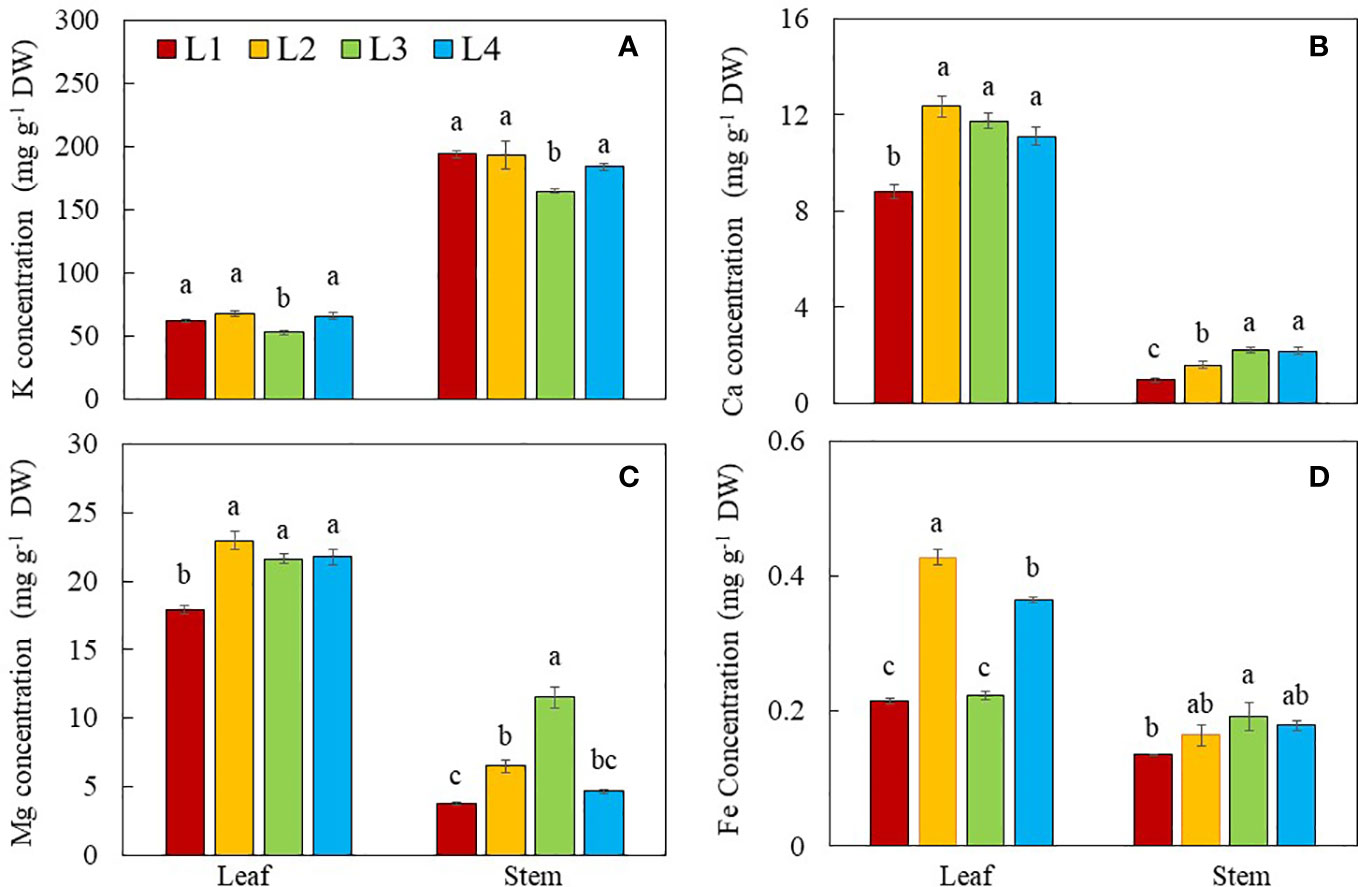
Figure 10 Dietary minerals, K (A), Ca (B), Mg (C) and Fe (D) concentrations of purslane grown under different light conditions for 14 days. Values are means ± standard errors. Means with different letters are statistically different (p<0.05; n =4) as determined by Tukey’s multiple comparison test for each plant organ. Refer to Figure 1 for the different conditions of L1, L2, L3 and L4.
The aerial parts of the plant have naturally been the main focus in many studies of interactions of plants with light, given that such interactions happen mostly above-ground. However, light provides not only energy to plants in their production of sugars through photosynthesis, but also provides information such as light signaling via sugars (Kircher and Schopfer, 2012; Zheng et al., 2019), and phytohormones for root development (Swarup et al., 2008; Costigan et al., 2011). In the “Update on light signaling and root development”, van Gelderen et al. (2018) concluded that light quality and duration impact root physiology and development. In this study, the total root length, total root surface area and total number of root tips were similarly but significantly higher in L2 and L4 plants grown under higher PPFDs compared to those of L3 and L1plants (Figures 1A–C). Root morphology is modulated by signals such as photosynthates, phytohormones and more recently, proteins, transmitted across long-distance from aboveground tissues (Lee et al., 2017; van Gelderen et al., 2018). In the presnt study, purslane grown under higher PPFD and higher DLI had larger root system could be resulted from higher amounts of sugars transported to the roots promoting their development (Kircher and Schopfer, 2012; Zheng et al., 2019). Furthermore, high light induced the synthesis of auxin in young leaves. Auxin is polarly transported to the roots and promotes primary and lateral roots development (Swarup et al., 2008; Costigan et al., 2011). Although L3 plants were exposed to the same amount of DLI (20.736 mol m-2 day-1) as those of L2 and L4, they had shorter total root length, smaller total root surface area and fewer number of root tips than those of L2 and L4 plants (Figures 1A–C). This could be due to CL exposure which may result in a sustained increase in cytosolic hexose, triggering starch accumulation in leaves. This inhibits triosephosphate exporting out from the chloroplast to be utilised for growth and development (Demers and Gosselin, 2000), limiting not only root but also shoot biomass accumulation in L3 plants. This speculation was supported by the lower shoot FW and DW, and root FW (Figures 2A–C) as well stem height (Figure 3) of L3 plants compared to those of L2 and L4 plants on day 8 after transplant. It also further exemplifies the influence of light levels and CL on the productivity of both shoot and root. On day 16 after transplant, L4 plants under the highest PPFD had the highest values of growth parameters, followed by L2 and L3, with L1 grown under the lowest PPFD and shortest photoperiod and thus lower DLI having the lowest values (Figures 2A–D). This result suggests that light intensity is a more significant factor affecting plant productivity at a later stage of development of C4 purslane. On day 8 and 16 after transplanting, the shoot/root FW ratio of L1 plants was the highest (Figure 2E), a trend which was also observed in the shoot/root DW ratios of L1 plants 8 days after transplant (Figure 2F). These results imply that more biomass is allocated to the shoots to increase light acquisition (Garnier, 1991). On day 16 after transplanting, no significant differences in shoot/root DW ratios were found in plants grown under different light conditions. This result implies that the effect of low DLI on shoot/root resource allocation is more significant at the early growth stage in L1 plants which were grown under lower DLI.
Leaf growth and development is also regulated by light intensity and photoperiod and thus DLI (Dou et al., 2018; Yan et al., 2019; Camejo et al., 2020; He and Qin, 2020). It was reported that lower light intensity and shorter photoperiod resulted in lower leaf number (Camejo et al., 2020) and smaller total leaf area (Dou et al., 2018). In this study, L1 plants grown under the lowest PPFD and shorter photoperiod had the lowest leaf number and smallest TLA compared to those L2, L3 and L4 plants at both growth stages (Figure 4A, B). These results also suggest that an increase in light radiation for L2, L3 and L4 plants compared to L1 plants by increasing DLI could result in the increases of leaf number and TLA at both growth stages. Growing green butterhead lettuce and red oakleaf lettuce under DLIs from 6.9–15.6 mol m−2 d−1 under PPFDs of 120 to 270 μmol m–2 s–1 for durations of 16 to 24 h, Kelly et al. (2020) reported that shoot FW and DW, leaf width and number of leaves increased with increasing DLI for both cultivars, irrespective of PPFD and photoperiod combinations. In the study with plantlets of sweet potato (cv. Beniharuka), leaf number was not significantly affected with increasing PPFD from 150 to 350 μmol m-2 s-1 (He et al., 2020a). However, the TLA of sweet potato plantlets exhibited an increasing trend, but it decreased when the PPFD was greater than 250 μmol m-2 s-1. These results suggest that a too low or too high PPFD inhibited leaf expansion. Similar result was also reported by Pennisi et al. (2020) in lettuce and basil. However, no difference in TLA or leaf area per leaf were observed among the different photoperiod treatments in either lettuce or mizuna while both species had greater light interception and the quantum yield of PSII with longer photoperiods (Palmer and van Iersel (2020). These results suggest that leaf morphological traits must be due to the differences in the percentage of light interception. We have previously reported that productivity of lettuce plants under different combinations of LED spectra was associated with leaf traits (He et al., 2019). Pennisi et al. (2020) observed a reduction of SLA of basil grown under increased PPFD associated with thicker and larger leaves, which was also reported by Dou et al. (2018) in basil plants. In this study, L1 and L4 plants grown under the lowest and the highest PPFD, respectively for the same photoperiod (12 h), had similar higher SLA compared to L2 and L3 plants while SLA was the lowest in L3 plants at both growth stages (Figure 4C). This result suggests that increased PPFD greater than 240 μmol m-2 s-1, did not affected the leaf thickness. However, when exposed to longer photoperiod (L2 and L3), plants increase the thickness of leaves by synthesising more palisade cell layers to prevent light damage caused by excessive light energy (Wentworth et al., 2006). Depending on species, the SLA and aboveground biomass could be either negatively or positively correlated (Liu et al., 2017). Although L3 plants had lower SLA (Figure 4C) or thicker leaves, their smaller TLA (Figure 4B) and shorter stem (Figure 3) resulted in lower shoot productivity (Figure 2A).
Summing up, the above discussion suggests that light intensity, duration and DLI all play important roles in enhancing plant growth and productivity in both early and later stages of growth (Dou et al., 2018; Zhang et al., 2018; Poorter et al., 2019; Kelly et al., 2020). In the study with lettuce, Kelly et al. (2020) reported that at a higher DLI with lower PPFD and longer photoperiod increased growth more than a higher PPFD and shorter photoperiod. However, in this study, under the same DLI, the C4 purslane grown under L4 condition with higher PPFD and shorter photoperiod had higher shoot FW compared to those grown under L2 condition with lower PPFD and longer photoperiod for 16 days. Furthermore, under the same DLI, CL (L3) with lower PPFD had lower productivity compared to L2 and L4 conditions which had higher PPFDs but shorter photoperiods. Controversial results such as CL promoted growth were reported in lettuce (Zha et al., 2019), medicinal plant, Nasturtium (Xu et al., 2021) and rocket plants (Proietti et al. (2021). The effectiveness of CL seems depending on plant species as well as the light intensity, duration and dynamic LED lighting strategies (Pham and Chun, 2020; Shao et al., 2022). Recently, Shao et al. (2022) reported that lettuce (Lactuca sativa L. cv. ‘Zishan’) plants accumulated more biomass under one CL (red and blue). However, with the alternation of temporally overlapped red and blue light biomass accumulation decreased with the increase of alternating light frequency.
Multiple studies have demonstrated that light intensity, photoperiod and thus DLI influence the synthesis of photosynthetic pigments (Lefsrud et al., 2006; Dou et al., 2018; He et al., 2020a; Kelly et al., 2020; Proietti et al., 2021). Longer photoperiods as well as higher DLI increase plant growth by increasing leaf area and Chl and Car concentrations in kale (Lefsrud et al., 2006) and Chl concentrations in lettuce (Kelly et al., 2020). For sweet potato seedlings, as a PPFD increased from 150 to 250 μmol m-2 s-1, an increasing trend was observed in total Chl and Car concentrations. However, grown under a PPFD of 350 μmol m-2 s-1, sweet potato seedlings had lower total Chl concentration compared to other conditions (He et al., 2020a). Both Chl and Car of rocket plants were increased by CL irrespective of the light spectrum (Proietti et al., 2021). Dou et al. (2018) reported that high DLIs resulted in lower total Chl concentration on the basis of leaf FW and higher Chl a/b ratios while sweet basil plants adapted to lower DLIs increased Chl synthesis to maximise light capture. In the present study, no significant differences were found in total Chl, total Car concentrations, and the Chl a/b ratio among the different light treatments (Figure 5A, B, C). Thus, effects of DLI on photosynthetic pigments are species dependent. However, Chl/Car ratio of L3 plants was significantly lower than those of all other groups (Figure 5D) due to a higher proportion of Car. It is well known that Car function to dissipate excess energy through the xanthophyll cycle to protect the plants from photodamage (Demmig-Adams and Adams, 1996). L3 plants grown under CL conditions had lower Fv/Fm ratios,<0.8 (Figure 6A), indicating of photoinhibition may have occurred in these plants (Rosenqvist and van Kooten, 2003).
Photosynthetic pigments catch light energy which is used for the light reactions to drive photosynthetic electron transfer (Fromme et al., 2003). Plant growth depends on not only light interception but also photosynthetic light use efficiency (Palmer and van Iersel, 2020). Generally, higher Chl concentration increases light absorption which are associated with higher ETR and the effective quantum yield of PSII (ΔF/Fm’ or ΦPSII) (He and Qin, 2020; Kelly et al., 2020). Both ETR and ΔF/Fm’ are useful indicators of non-cyclic electron transport for overall photosynthesis (Maxwell and Johnson, 2000; Fu et al., 2012). The greatest ETR and ΦPSII were found in Romaine lettuce grown under a PPFD of 200 μmol m−2 s−1 compared to the others grown under PPFDs which was either lower or higher than 200 μmol m−2 s−1 for a same photoperiod of 14 h. These results imply that low and high light intensity and DLI partially account for a reduction of photosynthetic light use efficiency (Fu et al., 2012). Theoretically, only increasing the photoperiod can enhance the net daily photosynthesis after reaching the light saturation point. For example, with increasing PPFD, the ФPSII decreased linearly with DLI increasing from 8.6–20.2 mol m−2 d−1 (He et al., 2020a). That is why increasing the photoperiod increased plant growth but increasing PPFD did not (Kelly et al., 2020). Elkins and van Iersel (2020) also found that the total electron transport through PS II would increase if the same DLI was provided at a lower PPFD over 24 h. However, in the present study, ETR and ΔF/Fm’ were the lowest in L3 plants while L2 plants had the highest readings followed by L4 and L1 plants under a PPFD of 1076 m-2 s-1, (Figures 6B–D) despite all plants had similar levels of total Chl and Chl a/b ratio (Figures 5A, C). This result further supported the fact that L3 plants grown under CL had experienced light stress. It was reported that hyperaccumulation of starch in response to CL may lead to an over-reduction of electron acceptors. This generates high concentrations of reactive oxygen species (ROS), resulting in oxidation of cellular components, decreasing the efficiency of photosynthetic systems (Haque et al., 2015). Under optimal growth conditions, large amount of absorbed light is used to drive photosynthesis, defined as qP or small portion of light dissipated as heat, termed as NPQ. Generally, with the increase of light intensity, qP gradually declines while NPQ gradually increases. In this study, measured under a PPFD of 1076 m-2 s-1, both qP and NPQ values of L1, L2 and L4 plants were significantly higher than L3 plants grown under CL (Figures 6D, E). Higher values of NPQ in L2 and L4 plants compared to that of L1 plants, allowing for excess light energy to be dissipated as heat, conferring photoprotection with higher qP (Müller et al., 2001). Although ETR was lower in L3 plants compared to those of L1, L2 and L4 plants, the total electron transport through PS II would increase for L3 plants under CL (Elkins and van Iersel, 2020). Furthermore, over-reduction of electron acceptors beyond the capacity of NPQ may result from hyperaccumulation of starch in response to L3 plants grown under CL (Haque et al., 2015). Both qP and NPQ values decreased simultaneously in L3 plants demonstrating that utilisation of excess light energy absorbed by leaves of L3 plants through photochemical quenching and heat dissipation decreased in parallel. Thus, more excess energy may be used to generate ROS, which mitigated photoinhibition to certain extent. However, continuous excess light energy and ROS accumulation could destroy photosynthetic apparatus.
Light is a critical factor affecting NO3- uptake and N metabolism in plants (Bian et al., 2015). A key step of the NO3- assimilation pathway is the reduction of NO3- to , catalysed by NR in the cytosol (Mokhele et al., 2012). In this study, NO3- assimilation occurred primarily in the leaves of purslane as they had the highest NRAmax under all light conditions compared to the stems (Figure 8A). This likely resulted in a lower NO3- (Figure 7A) and higher TRN concentration (Figure 7B) in the leaves than other plant organs. Light intensity has remarkable impacts on reduction in plants. High light intensity promotes NRA (He et al., 2017b). In this study, all stems had similar NRAmax while leaf NRAmax of purslane was significantly higher in L2 (320 µmol photon m-2 s-1) and L4 plants (480 µmol photon m-2 s-1) than L1 and L3 plants (240 µmol photon m-2 s-1) (Figure 8A). Under high light, carbohydrate accumulation upregulates mRNA transcription of NR, increasing NRA (Lillo, 1994) and upregulating assimilation. In this study, L2 and L4 plants were exposed to higher PPFDs while L2 and L3 plants were subjected to longer photoperiods (18 and 24h respectively) than L1 and L4 plants (both 12h). In the dark, NO3- is generally stored in the vacuoles of the leaves. Only upon light exposure are the stored remobilised into the cytosol by increased NRA (He et al., 2017b). A decrease in photoperiod could limit the export of NO3- into the cytosol of the leaves for the first reaction of NO3- assimilation which could decrease leaf TRN concentration of L1 and L4 plants (Figure 7B). Despite having a lower leaf NRAmax (Figure 8A), higher leaf NO3- (Figure 7A) and TRN concentration (Figure 7B) in L3 plant, may result from continuously uptake, transport and assimilation of under CL condition. The lower leaf NRAmax in L3 plants could be a result of NR degradation by photooxidation (Schuster and Mohr 1990; Shimomura et al., 2020) upon CL exposure. However, Proietti et al. (2021) found that CL significantly reduced NO3- concentration in rocket leaves, suggesting that CL may increase the NRA and the reduction of NO3-. Higher levels of carbohydrates accumulated in rocket leaves under CL, may provide a carbon skeleton for nitrogen metabolism, affecting NR at both transcription and translation levels (Bian et al., 2015). While significant differences in leaf NRAmax of purslane were found among the different light conditions, the NRact of both leaf and stem did not significantly differ (Figure 8B), suggesting that NRAmax was not correlated with NRact. In the second reaction of NO3- assimilation, is further reduced to which are utilised to synthesise amino acids and then proteins (Mokhele et al., 2012). Although leaf TRN concentrations were different in plants grown under different light conditions, the leaf TSP concentration was similar (Figure 7C). This suggests that while a decrease in photoperiod of L1 and L4 plants can lead to a decrease in TRN concentrations, reduced TRN concentrations are not low enough to induce N deficiency and disrupt protein synthesis in these plantsaab30C2022$.
Special vegetable crops can be cultivated indoors through manipulation of lighting environments to increase the levels of bioactive compounds which can be used as functional foods (Kelly et al., 2022). Purslane used in this study is one of the best candidate crops as it has high content of antioxidants such as proline, ASC and TPC as well as soluble sugars (Uddin et al., 2012; Fernández-Poyatos et al., 2021; He et al., 2021; Pires et al., 2021). Proline which has antioxidant role is greatly accumulated in purslane under abiotic stress, especially osmotic and oxidative stresses (He et al., 2021). In this study, leaf proline concentration was higher in purslane grown under higher DLI such as L2, L3, and L4 compared to those of L1 plants (Figure 9A). Proline biosynthesis is linked to photosynthesis (Alvarez et al., 2022). This was further supported by the finding that under the same DLI, proline concentrations of purslane grown under higher PPFDs of L2 and L4 conditions were higher than under the lower PPFD of L3 conditions. Lowered photosynthetic efficiency measured by lower ETR, ΔF/Fm’ and qP in L3 plants (Figures 6B–D) can result in decrease in proline concentrations. It was found that proline concentration is much higher in purslane leaves than in stems. It was also noticed that proline concentrations of both leaves and stems were higher in the plants with higher DLI regardless of light intensity and photoperiods (Figure 9A). For both leaf and stem, no significant differences in TSS were observed among the different light conditions (Figure 9B). Zhang et al. (2018) reported that higher light intensity could lead to higher sugar concentration in lettuce. Study with lettuce plants, Song et al. (2020) found that soluble sugars increased from 150 μmol m−2 s−1 to 350 μmol m−2 s−1 and then decreased at 450 μmol ·m−2 s−1. Plants grown under CL conditions could have higher concentrations of insoluble sugars which is mainly starch (Demers and Gosselin, 2000). Since starch concentration was not measured in this study, future studies could focus on the effects of different light intensities and durations on purslane starch concentration. In this study, total ASC and TPC were higher in the leaves than the stems under all light treatments (Figure 9C, D) suggesting that purslane leaves are of higher nutritional value. It was reported that higher light intensity could lead to higher content of vitamin C (ASC) in lettuce (Zhang et al., 2018). Under the same DLI, Proietti et al. (2021) found that CL significantly enhanced the ASC concentration in the leaves of rocket plants. However, in this study, all purslane plants had similar total ASC concentration in both leaves and stems (Figure 9C) regardless of light conditions. Dou et al. (2018) reported that sweet basil (Ocimum basilicum) grown under higher DLIs had higher TPC contents than under lower DLIs. In this study, under the same DLI, purslane grown under L3 with CL also had the higher TPC than L2 and L4 plants in both leaves and stems (Figure 9D).
Apart from its rich phytochemicals, purslane is also considered a good source of natural dietary minerals such as K, Ca, Mg and Fe (Alvarez et al., 2022). With the exception of K (Figure 10A), higher concentrations of Ca, Mg and Fe were found in the leaves as compared to the stems under all light conditions (Figure 10B–D). L1 plants grown under the lower DLI with lower intensity and shorter photoperiod had lower leaf Ca, Mg and Fe concentrations compared to other light treatments. In the study with ten different leafy vegetables, Colonna et al. (2016) reported that higher concentrations of K, Ca and Mg were observed under low light intensity than high intensity. However, the K concentration in both leaves and stems of L1plants were similar to those of L2 and L4 plants, which were significantly higher than that of L3 plants. It was reported that the uptake of macro- and micronutrients depends on both species and PPFD. For example, the concentrations of N, P, K, B decreased while the concentrations of Mg, Fe and Mn increased with increasing PPFD in perennial cover crop legumes (Baligar et al., 2020). The differential effects of PPFD and DLI on the mineral nutrient uptake exemplify that other lighting conditions such as light quality could have some effect on the uptake and allocation of specific dietary minerals. For instance, in the study with okra (Abelmoschus esculentus L.), red light at 635 nm enhanced the accumulations of Ca and Mg while the highest N content was found in the plants grown under green light and blue light, respectively at 522 nm and 455 nm (Degni et al., 2021). The effects of light intensity, quality, photoperiod and DLI on dietary mineral accumulation and the mechanisms involved are still largely unknown. This merits a further study on the effect of light conditions on dietary minerals in purslane.
Compared to 10.368 mol m-2 day-1 (L1 condition), an overall two times increase in DLI, 20.736 mol m-2 day-1 (L2, L3 and L4 conditions) through either increasing light intensity and/or extending photoperiod, displayed positive effects on the growth characteristics of purslane. Under the same higher DLI (20.736 mol m-2 day-1), L2 condition is the most suitable lighting strategy for enhancing productivity and quality of purslane. At an early stage of development, light treatments L2 (320 µmol photon m-2 s-1, 18 h) and L4 (480 µmol photon m-2 s-1, 12 h) exerted the most positive effects on purslane productivity. At later stages, light treatment L4 was observed to be the most favourable. However, given that high light intensity is often costly and difficult to maintain, the L2 treatment would be more preferable. L3 treatment with continuous light (240 µmol photon m-2 s-1, 24 h photoperiod), however, resulted in lower shoot and root growth compared to L2 and L4 conditions under the same DLI. A lowered photosynthetic efficiency, as indicated by the lowered ETR, ΔF/Fm’ and qP values, was also observed in L3 plants. Thus, L3 treatment may not be favourable for the productivity of purslane. Purslane grown under L2 treatment had the highest concentration of proline, ASC and TSS in the leaves and stems, suggesting that purslane grown under L2 treatment is the most nutritious. Furthermore, leaf dietary minerals such as K, Ca, Mg and Fe concentrations were the highest in purslane grown under L2 compared to the other conditions. No clear trends were observed in stem dietary mineral concentrations among purslane plants grown under the different light conditions. Nevertheless, the results of this study provide growers of purslane a better understanding of the optimal light conditions to enhance its productivity and quality.
The original contributions presented in the study are publicly available. This data can be found here: https://researchdata.nie.edu.sg/dataverse/he-jie.
JH initiated and funded the expenses for the project. JH and LQ planned the experiments and carried out some parts of the experiments. SG carried out most measurements, analysed the data and plotted the graphs under supervision of JH and LQ. JH wrote the 1st draft of the manuscript. JH and LQ revised the manuscript. All authors contributed to the article and approved the submitted version.
This project was funded by the teaching materials’ vote of National Institute of Education, Nanyang Technological University, Singapore.
The authors declare that the research was conducted in the absence of any commercial or financial relationships that could be construed as a potential conflict of interest.
All claims expressed in this article are solely those of the authors and do not necessarily represent those of their affiliated organizations, or those of the publisher, the editors and the reviewers. Any product that may be evaluated in this article, or claim that may be made by its manufacturer, is not guaranteed or endorsed by the publisher.
Alam, M. A., Juraimi, A. S., Rafii, M. Y., Hamid, A. A., Aslani, F., Hasan, M. M., et al. (2014). Evaluation of antioxidant compounds, antioxidant activities and mineral composition of 13 collected purslane (Portulaca oleracea l.) accessions. BioMed. Res. Int. 2014, 1–10. doi: 10.1155/2014/296063
Alvarez, M. E., Savouré, A., Szabados, L. (2022). Proline metabolism as regulatory hub. Trends Plant Sci. 27, 39–55. doi: 10.1016/j.tplants.2021.07.009
Baligar, V. C., Elson, M. K., He, Z., Li, Y., Paiva, A., de., Q. (2020). Light intensity effects on the growth, physiological and nutritional parameters of topical perennial legume cover crops. Agronomy 10, 1515. doi: 10.3390/agronomy10101515
Bates, L. S., Waldren, R. P., Teare, I. D. (1973). Rapid determination of free proline for water-stress studies. Plant Soil 39, 205–207. doi: 10.1007/BF0001806
Bian, Z. H., Yang, Q. C., Liu, W. K. (2015). Effects of light quality on the accumulation of phytochemicals in vegetables produced in controlled environments: a review. J. Sci. Food Agr. 95, 869–877. doi: 10.1002/jsfa.6789
Camejo, D., Frutos, A., Mestre, T. C., Piñero, M. C., Rivero, R. M., Martínez, V. (2020). Artificial light impacts the physical and nutritional quality of lettuce plants. Hortic. Environ. Biotechnol. 61, 69–82. doi: 10.1007/s13580-019-00191-z
Colonna, E., Rouphael, Y., Barbieri, G., De Pascale, S. (2016). Nutritional quality of ten leafy vegetables harvested at two light intensities. Food Chem. 199, 702–710. doi: 10.1016/j.foodchem.2015.12.068
Costigan, S. E., Warnasooriya, S. N., Humphries, B. A., Montgomery, B. L. (2011). Root-localized phytochrome chromophore synthesis is required for photoregulation of root elongation and impacts root sensitivity to jasmonic acid in arabidopsis. Plant Physiol. 157, 1138–1150. doi: 10.1104/pp.111.184689
Degni, B. F., Dibi, W. G., Jérémie., D. S., Zoueu, T. (2021). Effect of light spectrum on growth, development, and mineral contents of okra (L.). Open Agric. 6, 276–285. doi: 10.1515/opag-2021-0218
Demers, D. A., Gosselin, A. (2000). Growing greenhouse tomato and sweet pepper under supplemental lighting: optimal photoperiod, negative effects of long photoperiod and their causes. Acta Hortic. 580, 83–88. doi: 10.17660/ActaHortic.2002.580.9
Demmig-Adams, B., Adams, W. W. (1996). The role of xanthophyll cycle carotenoids in the protection of photosynthesis. Trends Plant Sci. 1, 21–26. doi: 10.1016/S1360-1385(96)80019-7
Dou, H., Niu, G., Gu, M., Masabni, J. G. (2018). Responses of sweet basil to different daily light integrals in photosynthesis, morphology, yield, and nutritional quality. HortScience 53, 496–503. doi: 10.21273/HORTSCI12785-17
Dubois, M., Gilles, K. A., Hamilton, J. K., Rebers, P. A., Smith, F. (1956). Colorimetric method for determination of sugars and related substances. Anal. Chem. 28, 350–356. doi: 10.1021/ac60111a017
Elkins, C., van Iersel, M. W. (2020). Longer photoperiods with the same daily light integral increase daily electron transport through photosystem II in lettuce. Plants 9, 1172. doi: 10.3390/plants9091172
Fernández-Poyatos, M. D. P., Llorent-Martínez, E. J., Ruiz-Medina, A. (2021). Phytochemical composition and antioxidant activity of Portulaca oleracea: Influence of the steaming cooking process. Foods 10, 94. doi: 10.3390/foods10010094
Ferrari, R. C., Cruz, B. C., Gastaldi, V. D., Storl, T., Ferrari, E. C., Boxall, S. F., et al. (2020). Exploring C4–CAM plasticity within the Portulaca oleracea complex. Sci. Rep. 10, 14237. doi: 10.1038/s41598-020-71012-y
Fromme, P., Melkozernov, A., Jordan, P., Krauss, N. (2003). Structure and function of photosystem I: interaction with its soluble electron carriers and external antenna systems. FEBS Lett. 555, 40–44. doi: 10.1016/S0014-5793(03)01124-4
Fu, W., Li, P., Wu, Y. (2012). Effects of different light intensities on chlorophyll fluorescence characteristics and yield in lettuce. Scientia Hort 135, 45–51. doi: 10.1016/j.scienta.2011.12.004
Garnier, E. (1991). Resource capture, biomass allocation and growth in herbaceous plants. Trends Ecol. Evol. 6, 126–131. doi: 10.1016/0169-5347(91)90091-B
Gonnella, M., Charfeddine, M., Conversa, G., Santamaria, P. (2010). Purslane: a review of its potential for health and agricultural aspects. Eur. J. Plant Sci. Biotechnol. 4, 131–136.
Haque, M. S., Kjaer, K. H., Rosenqvist, E., Ottosen, C.-O. (2015). Continuous light increases growth, daily carbon gain, antioxidants, and alters carbohydrate metabolism in a cultivated and a wild tomato species. Front. Plant Sci. 6. doi: 10.3389/fpls.2015.00522
He, J., Chua, E. L., Qin, L. (2020b). Drought does not induce crassulacean acid metabolism (CAM) but regulates photosynthesis and enhances nutritional quality of Mesembryanthemum crystallinum. PloS One 15, e0229897. doi: 10.1371/journal.pone.0229897
He, Y. N., Peng, J. S., Cai, Y., Liu, D. F., Guan, Y., Yi, H. Y., et al. (2017b). Tonoplast-localized nitrate uptake transporters involved in vacuolar nitrate efflux and reallocation in Arabidopsis. Sci Rep. 7, 6417. doi: 10.1038/s41598-017-06744-5
He, J., Qin, L. (2020). Growth and photosynthetic characteristics of sweet potato (Ipomoea batatas) leaves grown under natural sunlight with supplemental LED lighting in a tropical greenhouse. J. Plant Physiol. 252, 153239. doi: 10.1016/j.jplph.2020.153239
He, J., Qin, L. (2022). Microclimate control to increase productivity and nutritional quality of leafy vegetables in a cost-effective manner. Agric. Biol. Eng. 15, 55–61. doi: 10.25165/j.ijabe.20221503.7367
He, J., Qin, L., Alahakoon, P. K. D. T., Chua, B. L. J., Choong, T. W., Lee, S. K. (2018). LED-integrated vertical aeroponic farming system for vegetable production in Singapore. Acta Hortic. 1227, 599–606. doi: 10.17660/ActaHortic.2018.1227.76
He, J., Qin, L., Chong, E. L. C., Choong, T. W., Lee, S. K. (2017a). Plant growth and photosynthetic characteristics of mesembryanthemum crystallinum grown aeroponically under different blue- and red-LEDs. Front. Plant Sci. 8. doi: 10.3389/fpls.2017.00361
He, J., Qin, L., Chow, W. S. (2019). Impacts of LED spectral quality on leafy vegetables: Productivity closely linked to photosynthetic performance or associated with leaf traits? Int. J. Agric. Biol. Eng. 12, 16–25. doi: 10.25165/j.ijabe.20191206.5178
He, J., Qin, L., Koh, J. Q. (2022). LED spectral quality and NaCl salinity interact to affect growth, photosynthesis and phytochemical production of Mesembryanthemum crystallinum. Funct. Plant Biol. 49, 483–495. doi: 10.1071/FP20375
He, J., Tan, B. H. G., Qin, L. (2011). Source-to-sink relationship between green leaves and green pseudobulbs of C3 orchid in regulation of photosynthesis. Photosynthetica 49, 209–218. doi: 10.1007/s11099-011-0023-1
He, D., Yan, Z., Sun, X., Yang, P. (2020a). Leaf development and energy yield of hydroponic sweet potato seedlings using single-node cutting as influenced by light intensity and LED spectrum. J. Plant Physiol. 254, 153274. doi: 10.1016/j.jplph.2020.1532
He, J., You, X., Qin, L. (2021). High salinity reduces plant growth and photosynthetic performance but enhances certain nutritional quality of C4 halophyte Portulaca oleracea l. grown hydroponically under different LED lighting. Front. Plant Sci. 12. doi: 10.3389/fpls.2021.651341
Hunt, R., Causton, D. R., Shipley, B., Askew, A. P. (2002). A modern tool for classical plant growth analysis. Ann. Bot. 90, 485–488. doi: 10.1093/aob/mcf214
Kaiser, W. M., Huber, S. C. (1997). Correlation between apparent activation state of nitrate reductase (NR), NR hysteresis and degradation of NR protein. J. Exp. Bot. 48, 1367–1374. doi: 10.1093/jxb/48.7.1367
Kelly, N., Choe, D., Meng, Q., Runkle, E. S. (2020). Promotion of lettuce growth under an increasing daily light integral depends on the combination of the photosynthetic photon flux density and photoperiod. Sci. Hortic. 272, 109565. doi: 10.1016/j.scienta.2020.109565
Kelly, N., Vaštakaitė-Kairienė, V., Runkle, E. S. (2022). “Chapter 18 - indoor lighting effects on plant nutritional compounds,” in Plant factory basics, applications and advances. Eds. Kozai, T., Niu, G., Masabni, J. (London: Academic Press), 329–349. doi: 10.1016/B978-0-323-85152-7.00013-6
Kircher, S., Schopfer, P. (2012). Photosynthetic sucrose acts as cotyledon derived long-distance signal to control root growth during early seedling development in Arabidopsis. Proc. Natl. Acad. Sci. U. S. A. 109, 11217–11221. doi: 10.1073/pnas.1203746109
Koch, K., Kennedy, R. A. (1980). Characteristics of crassulacean acid metabolism in the succulent C4 dicot L. Plant Physiol. 65, 193–197. doi: 10.1104/pp.65.2.193
Lee, H. J., Park, Y. J., Ha, J. H., Baldwin, I. T., Park, C. M. (2017). Multiple routes of light signaling during root photomorphogenesis. Trends Plant Sci. 22, 803–812. doi: 10.1016/j.tplants.2017.06.009
Lefsrud, M. G., Kopsell, D. A., Augé, R. M., Both, A. J. (2006). Biomass production and pigment accumulation in kale grown under increasing photoperiods. HortSci 41, 603–606. doi: 10.21273/HORTSCI.41.3.603
Leipner, J., Fracheboud, Y., Stamp, P. (1997). Acclimation by suboptimal temperature diminishes photooxidative damage in maize leaves. Plant Cell Environ. 20, 366–372. doi: 10.1046/j.1365-3040.1997.d01-76.x
Lillo, C. (1994). Light regulation of nitrate reductase in green leaves of higher plants. Physiol. Plant 90, 616–620. doi: 10.1111/j.1399-3054.1994.tb08822.x
Lim, Y. Y., Quah, E. P. L. (2007). Antioxidant properties of different cultivars of Portulaca oleracea. Food Chem. 103, 734–740. doi: 10.1016/j.foodchem.2006.09.025
Liu, M., Wang, Z., Li, S., Lü., X., Wang, X., Han, X. (2017). Changes in specific leaf area of dominant plants in temperate grasslands along a 2500-km transect in northern China. Sci. Rep. 7, 10780. doi: 10.1038/s41598-017-11133-z
Lowry, O. H., Rosebrough, N. J., Farr, A. L., Randall, R. J. (1951). Protein measurement with Folin-phenol reagent. J. Biol. Chem. 193, 265–275.
Maxwell, K., Johnson, G. N. (2000). Chlorophyll fluorescence – a practical guide. J. Expt. Bot. 51, 659–668. doi: 10.1093/jexbot/51.345.659
Mokhele, B., Zhan, X., Yang, Z., Zhang, X. (2012). Review: Nitrogen assimilation in crop plants and its affecting factors. Can. J. Plant Sci. 92, 399–405. doi: 10.4141/CJPS2011-135
Müller, P., Li, X. P., Niyogi, K. K. (2001). Non-photochemical quenching. a response to excess light energy. Plant Physiol. 125, 1558–1566. doi: 10.1104/pp.125.4.1558
Nájera, C., Urrestarazu, M. (2019). Effect of the intensity and spectral quality of LED light on yield and nitrate accumulation in vegetables. HortSci 54, 1745–1750. doi: 10.21273/HORTSCI14263-19
Ohyama, K., Manabe, K., Omura, Y. (2005). Potential use of a 24-hour photoperiod (continuous light) with alternating air temperature for production of tomato plug transplants in a closed system. HortScience 40, 374–377. doi: 10.21273/HORTSCI.40.2.374
Palaniswamy, U. R., McAvoy, R. J., Bible, B. (2001). Omega-3 fatty acid concentration in purslane (Portulaca oleraceae) is altered by photosynthetic photon flux. J. Amer. Soc Hortic. Sci. 126, 537–543. doi: 10.21273/JASHS.126.5.537
Palmer, S., van Iersel, M. W. (2020). Increasing growth of lettuce and mizuna under sole-source LED lighting using longer photoperiods with the same daily light integral. Agronomy 10, 1659. doi: 10.3390/agronomy10111659
Pearcy, R. W., Ehleringer, J. (1984). Comparative ecophysiology of C3 and C4 plants. Plant Cell Environ. 7, 1–13. doi: 10.1111/j.1365-3040.1984.tb01194.x
Pennisi, G., Pistillo, A., Orsini, F., Cellini, A., Spinelli, F., Nicola, S., et al. (2020). Optimal light intensity for sustainable water and energy use in indoor cultivation of lettuce and basil under red and blue LEDs. Sci. Hortic. 272, 109508. doi: 10.1016/j.scienta.2020.109508
Petropoulos, S., Karkanis, A., Martins, N., Ferreira, I. C. F. R. (2016). Phytochemical composition and bioactive compounds of common purslane (Portulaca oleracea l.) as affected by crop management practices. Trends Food Sci. Technol. 55, 1–10. doi: 10.1016/j.tifs.2016.06.010
Pham, D. M., Chun, C. (2020). Growth and leaf injury in tomato plants under continuous light at different settings of constant and diurnally varied photosynthetic photon flux densities. Sci. Hortic. 269, 109347. doi: 10.1016/j.scienta.2020.109347
Pires, A., Agreira, S., Ressurreição, S., Marques, J., Guiné, R., Barroca, M. J. (2021). A. sea surslane as an emerging food crop: nutritional and biological studies. Appl. Sci. 11, 7860. doi: 10.3390/app11177860
Poorter, H., Niinemets, Ü., Ntagkas, N., Siebenkäs, A., Mäenpää, M., Matsubara, S., et al. (2019). A meta-analysis of plant responses to light intensity for 70 traits ranging from molecules to whole plant performance. New Phytol. 223, 1073–1105. doi: 10.1111/nph.15754
Proietti, S., Moscatello, S., Riccio, F., Downey, P., Battistelli, A. (2021). Continuous lighting promotes plant growth, light conversion efficiency, and nutritional quality of Eruca vesicaria (L.) cav. in controlled environment with minor effects due to light quality. Front. Plant Sci. 12. doi: 10.3389/fpls.2021.73011
Ragaee, S., Abdel-Aal, E. M., Noaman, M. (2006). Antioxidant activity and nutrient composition of selected cereals for food use. Food Chem. 98, 32–38. doi: 10.1016/j.foodchem.2005.04.039
Rosenqvist, E., van Kooten, O. (2003). “Chlorophyll fluorescence: a general description and nomenclature,” in Practical applications of chlorophyll fluorescence in plant biology (Boston, MA: Springer), 31–77.
Schuster, C., Mohr, H. (1990). Appearance of nitrite-reductase mRNA in mustard seedling cotyledons is regulated by phytochrome. Planta 181, 327–334. doi: 10.1007/BF00195884
Shao, M., Liu, W., Zhou, C., Wang, Q., Li, B. (2022). Alternation of temporally overlapped red and blue light under continuous irradiation affected yield, antioxidant capacity and nutritional quality of purple-leaf lettuce. Sci. Hortic. 295, 110864. doi: 10.1016/j.scienta.2021.110864
Shimomura, M., Yoshida, H., Fujiuchi, N., Ariizumi, T., Ezura, H., Fukuda, N. (2020). Continuous blue lighting and elevated carbon dioxide concentration rapidly increase chlorogenic acid content in young lettuce plants. Sci. Hortic. 272, 109550. doi: 10.1016/j.scienta.2020.109550
Singapore Food Agency (2020) Annual report 2019/20. Available at: https://www.sfa.gov.sg/docs/default-source/publication/annualreport/sfa-ar-2019-2020.pdf (Accessed 23 September 2022).
Singh, K. P. (1972). Effect of different photoperiods on growth and flowering in Portulaca oleracea l. Curr. Sci. 41, 573–574.
Song, J., Huang, H., Hao, Y., Song, S., Zhang, Y., Su, W., et al. (2020). Nutritional quality, mineral and antioxidant content in lettuce affected by interaction of light intensity and nutrient solution concentration. Sci. Rep. 10, 2796. doi: 10.1038/s41598-020-59574-3
Swarup, K., Benková, E., Swarup, R., Casimiro, I., Péret, B., Yang, Y., et al. (2008). The auxin influx carrier LAX3 promotes lateral root emergence. Nat. Cell Biol. 10, 946–954. doi: 10.1038/ncb1754
Sysoeva, M., Markovskaya, E., Shibaeva, T. (2010). Plants under continuous light: A review. Plant Stress 4, 5–17.
Uddin, K., Juraimi, A. S., Ali, E., Ismail, M. R. (2012). Evaluation of antioxidant properties and mineral composition of purslane (Portulaca oleracea l.) at different growth stages. Int. J. Mol. Sci. 13, 10257–10267. doi: 10.3390/ijms13081025
van Gelderen, K., Kang, C., Pierik, R. (2018). Light signaling, root development, and plasticity. Plant Physiol. 176, 1049–1060. doi: 10.1104/pp.17.01079
Velez-Ramirez, A. I., Van Ieperen, W., Vreugdenhil, D., Millenaar, F. F. (2011). Plants under continuous light. Trends Plant Sci. 16, 310–318. doi: 10.1016/j.tplants.2011.02.003
Wellburn, A. R. (1994). The spectral determination of chlorophylls a and b, as well as carotenoids, using various solvents with spectrophotometers of different resolution. J. Plant Physiol. 144, 307–313. doi: 10.1016/s0176-1617(11)81192-2
Wentworth, M., Murchie, E. H., Gray, J. E., Villegas, D., Pastenes, C., Pinto, M., et al. (2006). Differential adaptation of two varieties of common bean to abiotic stress: II. acclimation of photosynthesis. J. Exp. Bot. 57, 699–709. doi: 10.1093/jxb/erj061
Xu, W., Lu, N., Kikuchi, M., Takagaki, M. (2021). Continuous lighting and high daily light integral enhance yield and quality of mass-produced nasturtium (Tropaeolum majus l.) in plant factories. Plants 10, 1203. doi: 10.3390/plants10061203
Yang, F., Feng, L., Liu, Q., Wu, X., Fan, Y., Raza, A. M., et al. (2018). Effect of interactions between light intensity and red-to- far-red ratio on the photosynthesis of soybean leaves under shade condition. environ. Exp. Bot. 150, 79–87. doi: 10.1016/j.envexpbot.2018.03.008
Yan, Z. N., He, D. X., Niu, G., Zhai, H. (2019). Evaluation of growth and quality of hydroponic lettuce at harvest as affected by the light intensity, photoperiod and light quality at seedling stage. Sci. Hortic. 248, 138–144. doi: 10.1016/j.scienta.2019.01.002
Zhang, X., He, D., Niu, G., Yan, Z., Song, J. (2018). Effects of environment lighting on the growth, photosynthesis, and quality of hydroponic lettuce in a plant factory. Int. J. Agric. Biol. Eng. 11, 33–40. doi: 10.25165/j.ijabe.20181102.3420
Zha, L., Zhang, Y., Liu, W. (2019). Dynamic responses of ascorbate pool and metabolism in lettuce to long-term continuous light provided by red and blue LEDs. Environ. Exp. Bot. 163, 15–23. doi: 10.1016/j.envexpbot.2019.04.003
Keywords: C4 halophyte, light intensity and duration, photosynthetic light-use efficiency, nitrogen metabolism, nutritional quality, productivity, root morphology
Citation: He J, Gan JHS and Qin L (2023) Productivity, photosynthetic light-use efficiency, nitrogen metabolism and nutritional quality of C4 halophyte Portulaca oleracea L. grown indoors under different light intensities and durations. Front. Plant Sci. 14:1106394. doi: 10.3389/fpls.2023.1106394
Received: 23 November 2022; Accepted: 09 January 2023;
Published: 15 February 2023.
Edited by:
Leo Marcelis, Wageningen University and Research, NetherlandsReviewed by:
Athanasios Koukounaras, Aristotle University of Thessaloniki, GreeceCopyright © 2023 He, Gan and Qin. This is an open-access article distributed under the terms of the Creative Commons Attribution License (CC BY). The use, distribution or reproduction in other forums is permitted, provided the original author(s) and the copyright owner(s) are credited and that the original publication in this journal is cited, in accordance with accepted academic practice. No use, distribution or reproduction is permitted which does not comply with these terms.
*Correspondence: Jie He, amllLmhlQG5pZS5lZHUuc2c=
Disclaimer: All claims expressed in this article are solely those of the authors and do not necessarily represent those of their affiliated organizations, or those of the publisher, the editors and the reviewers. Any product that may be evaluated in this article or claim that may be made by its manufacturer is not guaranteed or endorsed by the publisher.
Research integrity at Frontiers
Learn more about the work of our research integrity team to safeguard the quality of each article we publish.