 Wei Wang
 Jiamin Zhao1,2
 Zhen Xing
 Xiangtao Wang
94% of researchers rate our articles as excellent or good
Learn more about the work of our research integrity team to safeguard the quality of each article we publish.
Find out more
ORIGINAL RESEARCH article
Front. Plant Sci., 06 April 2023
Sec. Functional Plant Ecology
Volume 14 - 2023 | https://doi.org/10.3389/fpls.2023.1092872
This article is part of the Research TopicPatterns, Functions, and Processes of Alpine Grassland Ecosystems under Global Change.View all 76 articles
Understanding vegetation C, N, and P stoichiometry helps us not only to evaluate biogeochemical cycles and ecosystem functions but also to predict the potential impact of environmental change on ecosystem processes. The foliar C, N, and P stoichiometry in Northern Tibetan grasslands, especially the controlling factors, has been highlighted in recent years. In this study, we have collected 340 plant samples and 162 soil samples from 54 plots in three grassland types, with the purpose of evaluating the foliar C, N, and P stoichiometry and underlying control factors in three grassland types along a 1,500-km east-to-west transect in the Northern Tibetan Plateau. Our results indicated that the averaged foliar C, N, and P concentrations were 425.9 ± 15.8, 403.4 ± 22.2, and 420.7 ± 30.7 g kg−1; 21.7 ± 2.9, 19.0 ± 2.3, and 21.7 ± 5.2 g kg−1; and 1.71 ± 0.29, 1.19 ± 0.16, and 1.59 ± 0.6 g kg−1 in the alpine meadow (AM), alpine steppe (AS), and desert steppe (DS) ecosystems, respectively. The foliar C and N ratios were comparable, with values of 19.8 ± 2.8, 20.6 ± 1.9, and 19.9 ± 5.8 in the AM, AS, and DS ecosystems, respectively. Both the C/P and N/P ratios are the lowest in the AM ecosystem, with values of 252.2 ± 32.6 and 12.8 ± 1.3, respectively, whereas the highest values of 347.3 ± 57.0 and 16.2 ± 3.2 were obtained in the AS ecosystem. In contrast, the soil C, N, C/P, and N/P values decreased from the AM to DS ecosystem. Across the whole transects, leaf C, N, and P stoichiometry showed no obvious trend, but soil C and N concentrations showed an increasing trend, and soil P concentrations showed a decreasing trend with the increasing longitude. Based on the general linear model analysis, the vegetation type was the dominant factor controlling the leaf C, N, and P stoichiometry, accounting for 42.8% for leaf C, 45.1% for leaf N, 35.2% for leaf P, 52.9% for leaf C/N, 39.6% for leaf C/P, and 48.0% for leaf N/P; the soil nutrients and climate have relatively low importance. In conclusion, our results supported that vegetation type, rather than climatic variation and soil nutrients, are the major determinants of north Tibet grassland leaf stoichiometry.
Elemental stoichiometry can reflect the interactions between plants and soil and link biogeochemical cycles to physiological constraints (Sterner and Elser, 2002). Carbon (C), nitrogen (N), and phosphorus (P) are generally considered to be key macronutrients of all organisms that play vital roles in metabolism and ecosystem nutrient cycling (Elser et al., 2000; Elser et al., 2010). The shifts in C, N, and P contents and their ratios are considered to be crucial because they not only are closely related to the plant growth rate and photosynthesis but also act as indicators of the whole ecosystem limited by N or P (Hall et al., 2005; Wieder et al., 2015). Thus, understanding the foliar C, N, and P stoichiometry can help to predict the potential effects of environmental change on ecosystem processes, such as atmospheric N and P deposition and grassland degradation (Wang et al., 2017; Wang XG. et al., 2020; Yue et al., 2017).
Over the past decades, increasing attention has been paid to the C, N, and P stoichiometry in plants and soils at different scales (Reich and Oleksyn, 2004; Han et al., 2005; Tao et al., 2016; Wang XG. et al., 2020; Liu et al., 2021). It was proven that elemental stoichiometry is correlated with geographic and climatic variables (Wu et al., 2012; Sardans et al., 2015; Fan et al., 2016; Hu et al., 2017; Gong et al., 2018; Zhang et al., 2018; Wang et al., 2021). Many studies have been conducted to explain factors influencing plant ecological stoichiometry. More and more biotic and abiotic factors had been used to explain the changes in leaf C, N, and P stoichiometry, such as degradation light (Zhu et al., 2020), solar radiation (Sun et al., 2019), elevation (Zhao et al., 2018), and slope aspect (Cao et al., 2020). The balance and stoichiometric ratios of C, N, and P in vegetation and soil can be affected by drought (Delgado-Baquerizo et al., 2013; Wang et al., 2019, Wang Y. et al., 2020). Drought has direct effects on plant physiological characteristics. On the one hand, increasing aridity might decrease the plant nutrient uptake and transport (Bista et al., 2018); on the other hand, plant nutrient concentrations might increase to maintain the physiological metabolism under drought conditions (Griffiths and Parry, 2002). However, it had been founded that the climatic factors exerted limited influence on leaf N and P concentrations (He et al., 2008). The reason might be that the variation of leaf N and P largely depends on plant species and that plant nutrients largely depend on the identity of the species experiencing drought stress (Bertiller et al., 2005).
Several hypotheses have been proposed to explain the plant’s ecological stoichiometry (Tian et al., 2021). The temperature–biogeochemistry, temperature–plant physiology, and soil substrate age hypotheses have been used to explain the spatial variations in plant ecological stoichiometry (Reich & Oleksyn, 2004). Considering that the ecosystems in Tibet are at high altitudes, experience low temperatures, and have young soil ages, the foliar N and P concentrations in these areas might be high. The species composition hypothesis suggests that differences in species or life type composition affect the spatial patterns of the stoichiometric characteristics of plant leaves (Reich & Oleksyn, 2004). A similar phenomenon was observed east of the Tibetan Plateau (Zhao et al., 2018). Although the plant C, N, and P stoichiometry has been investigated in different regions across Qinghai–Tibet (Hong et al., 2014; Cai et al., 2019; Wang Y. et al., 2020), knowledge of the variations in the plant C, N, and P stoichiometry in different grassland ecosystems in north Tibet as well as the influencing factors remains limited.
The Tibetan Plateau is highly sensitive to climate change and is mainly covered by grassland (Tan et al., 2010). In north Tibet grassland, plant species declined significantly coupled with annual precipitation amounts from east to west. There are three types of grassland in those areas: alpine meadow (AM), alpine steppe (AS), and desert steppe (DS). On the one hand, grassland degradation is widespread here caused by climate change (Wang Y. et al., 2020; Shi et al., 2022); on the other hand, the restoration and treatment of degraded grasslands were widely carried out in those areas (Chen et al., 2020). This situation means that the shifting and changing of different grassland types in the Qinghai–Tibet Plateau are occurring nowadays. However, the differences between the foliar C, N, and P stoichiometry and control factors between different grasslands in this area remain unexplored. This may result in some biases in the prediction of the biogeochemical cycles under global change in the Qinghai–Tibet Plateau. In this study, we investigated the C, N, and P concentrations and C:N:P ratios of plants as well as topsoil (0–20 cm) across Northern Tibetan Plateau grassland transects. We aimed to answer the following questions: 1) What are the characteristics of the C, N, and P stoichiometry in three typical grassland ecosystems across North Tibetan grassland transects? (2) What are the control factors associated with the C:N:P stoichiometry in these ecosystems? (3) Are the control factors of stoichiometric characteristics in different grasslands consistent?
This study was conducted along a 1,500-km east-to-west transect in the North Tibetan Plateau (30°–34°N, 79°–95°E). This transect contains three typical types of grassland: AM, AS, and DS. We classified the grassland types based on the dominant species. The dominant species in AM and AS are Kobresia and grass (such as Stipa purpurea and Stipa capillacea), respectively. The dominant species in DS are Christolea crassifolia, Ajania fruticulosa, Krascheninnikovia ceratoides, and Stipa glareosa. Eighteen sampling sites were selected for each grassland type (Figure 1).
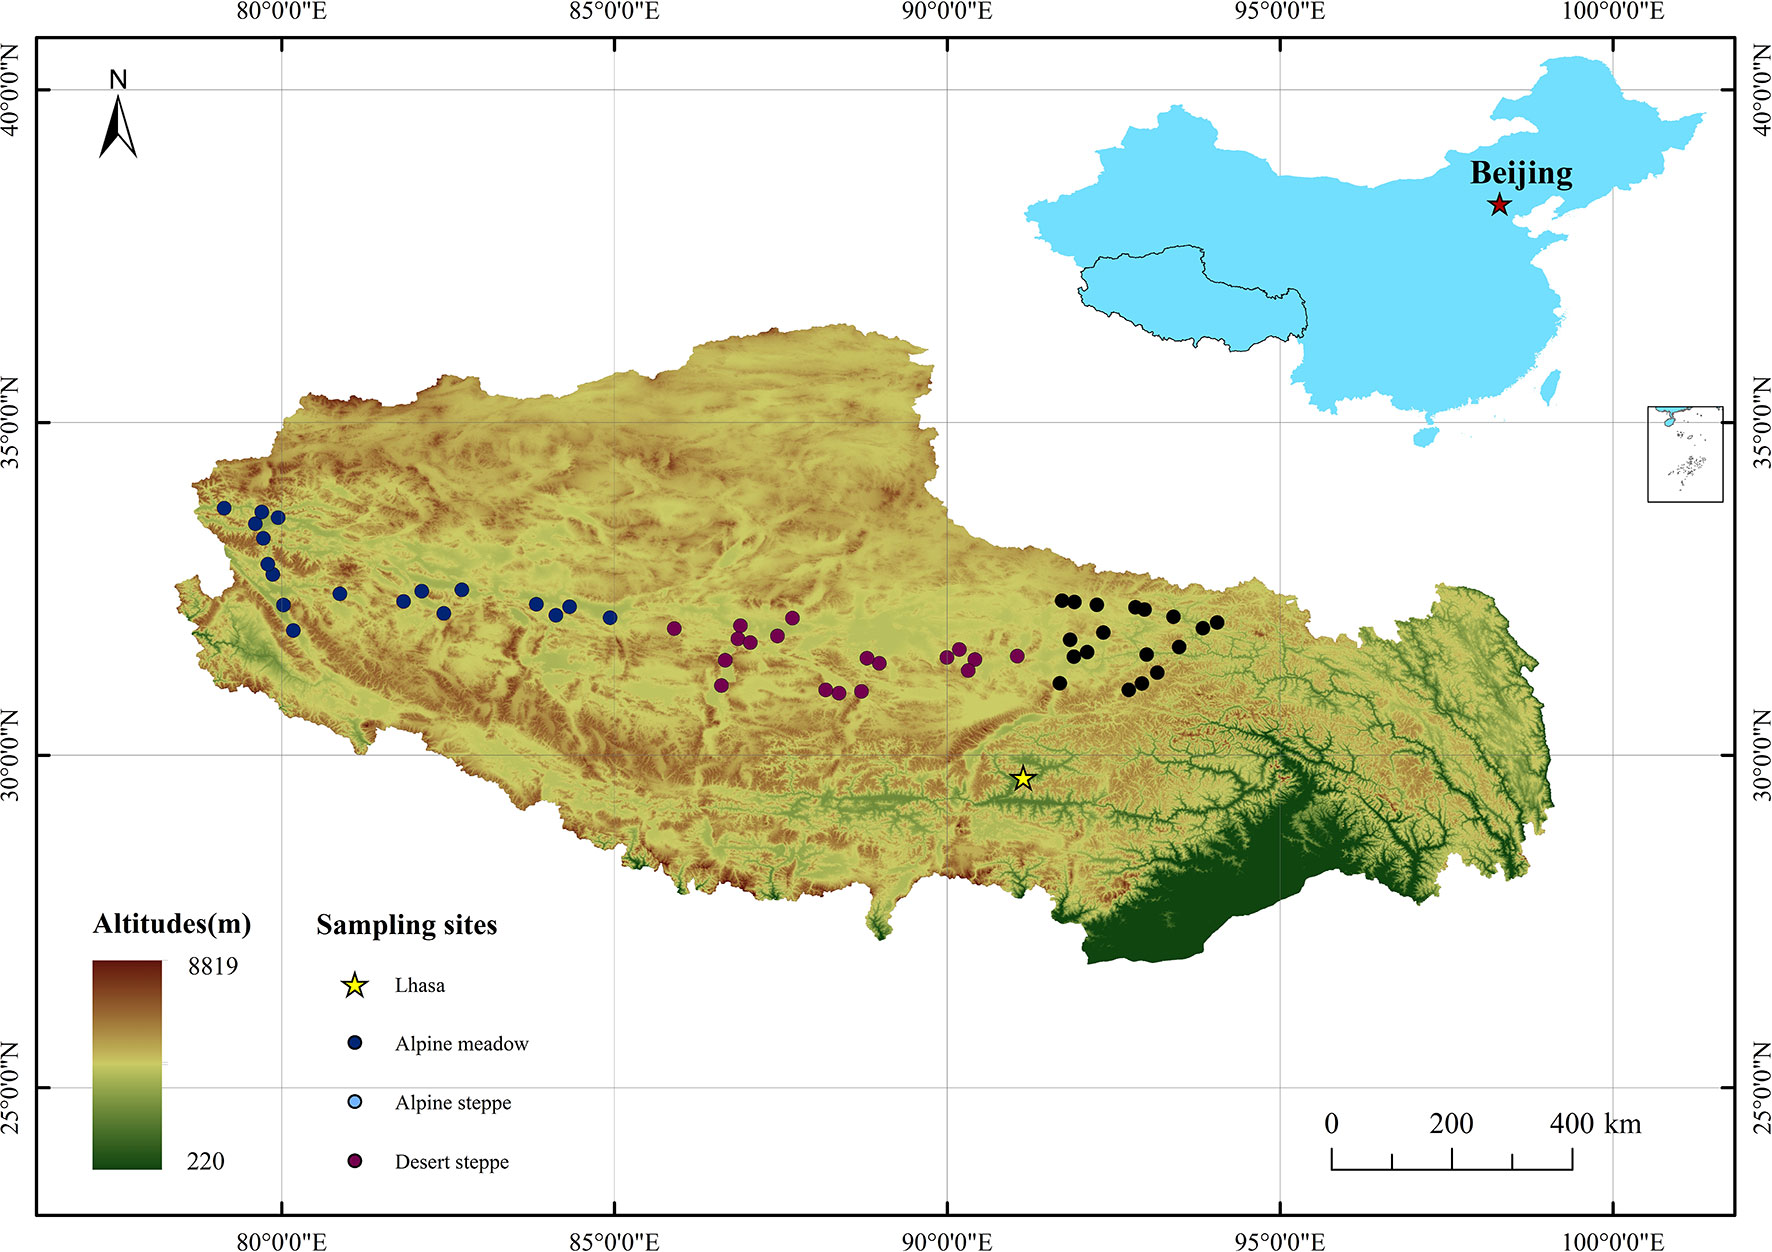
Figure 1 Location of the sampling sites.
Plant samples were harvested by hand during the near-peak biomass period in August 2020. The samples were obtained from flat areas with uniform vegetation. Foliar samples were collected according to previous studies (Wang et al., 2022). During the leaf collection period, only mature leaves free from pests and diseases were harvested and placed in an envelope. Each plant species was collected over the largest possible area. For each species, leaves from a minimum of 50 individual plants were collected. In addition, each species with a leaf fresh weight of not less than 500 g was harvested. Rare species were not harvested because of their low numbers and biomass. In total, 340 plant samples were collected from 54 sampling sites.
Five replicates of 0–20-cm soil columns were collected and mixed into one sample using a stainless steel boring auger. Three soil samples were collected from each sampling site. In total, 162 soil samples were collected from 54 sampling sites. The spatial geographical coordinates of each site were obtained using GPS (CaiTu C86, HuaChengBeiDou, China). The collected samples were placed in plastic bags and taken to the laboratory.
In the laboratory, samples of plant leaves were washed with tap water to remove dust and impurities, rinsed with ionized water, oven-dried at 120°C for 1 h, and then oven-dried at 70°C until the mass was constant. Dry leaves were ground using a ball mill (vibration ball mill GT300, Beijing Grinder Instrument Co., Ltd., Beijing, China) and stored in a Ziploc bag prior to the C, N, and P analyses. All soil samples were air-dried in the laboratory. Before the analysis, soil samples were sieved through a 0.5-mm sieve to remove stones, litter, and plant roots and then stored in a Ziploc prior to the C, N, and P analyses.
The C, N, and P determination methods for both plants and soil followed those specified by Bao (2000). Briefly, the organic C (C) content was analyzed using the potassium dichromate–sulfuric acid oxidation method. The total N (TN) content was determined using Kjeldahl digestion. The total P (TP) content was colorimetrically determined using the ammonium molybdate method.
All plant samples from different grasslands were used for C, N, and P distribution frequency calculations. First, the geometric means of leaf C:N:P stoichiometry were calculated for all species at a sampling site. Then, the arithmetic means of leaf C:N:P stoichiometry were calculated based on previously calculated geometric means in 18 sampling sites from different grasslands.
General linear models (GLMs) were used for ANOVA according to previous studies (He et al., 2008). Explanatory terms were related to climatic variables ((mean annual precipitation (MAP), mean annual temperature (MAT), soil nutrients (soil C concentrations (SC), soil N concentrations (SN), and soil P concentrations (SP)), and soil available nutrient (soil available N concentration (AN) and soil available P concentrations (AP)), and species. In addition, leaf traits were log-10 transformed prior to analysis. MAT data were obtained from http://data.tpdc.ac.cn/zh-hans/data/ (Du and Yi, 2019). The MAP was obtained from http://data.tpdc.ac.cn/zh-hans/data/ (Fang, 2019).
Spearman’s correlation analysis was used to evaluate the correlations between soil, plant nutrients, and climate factors. Statistical analyses were performed using SPSS 26.0 (SPSS Inc., Chicago, IL, USA), Origin 2019b (OriginLab Co., Northampton, MA, USA).
The leaf C, N, and P contents of all species in different grasslands ranged at 292.8–536.4, 6.03–35.9, and 0.42–2.98 g kg−1 in this work, respectively. The element ratios varied greatly, with a range of 10.9–45.6 for C:N, 176.3–696.4 for C:P, and 4.83–27.2 for N:P in this work (Figure 2).
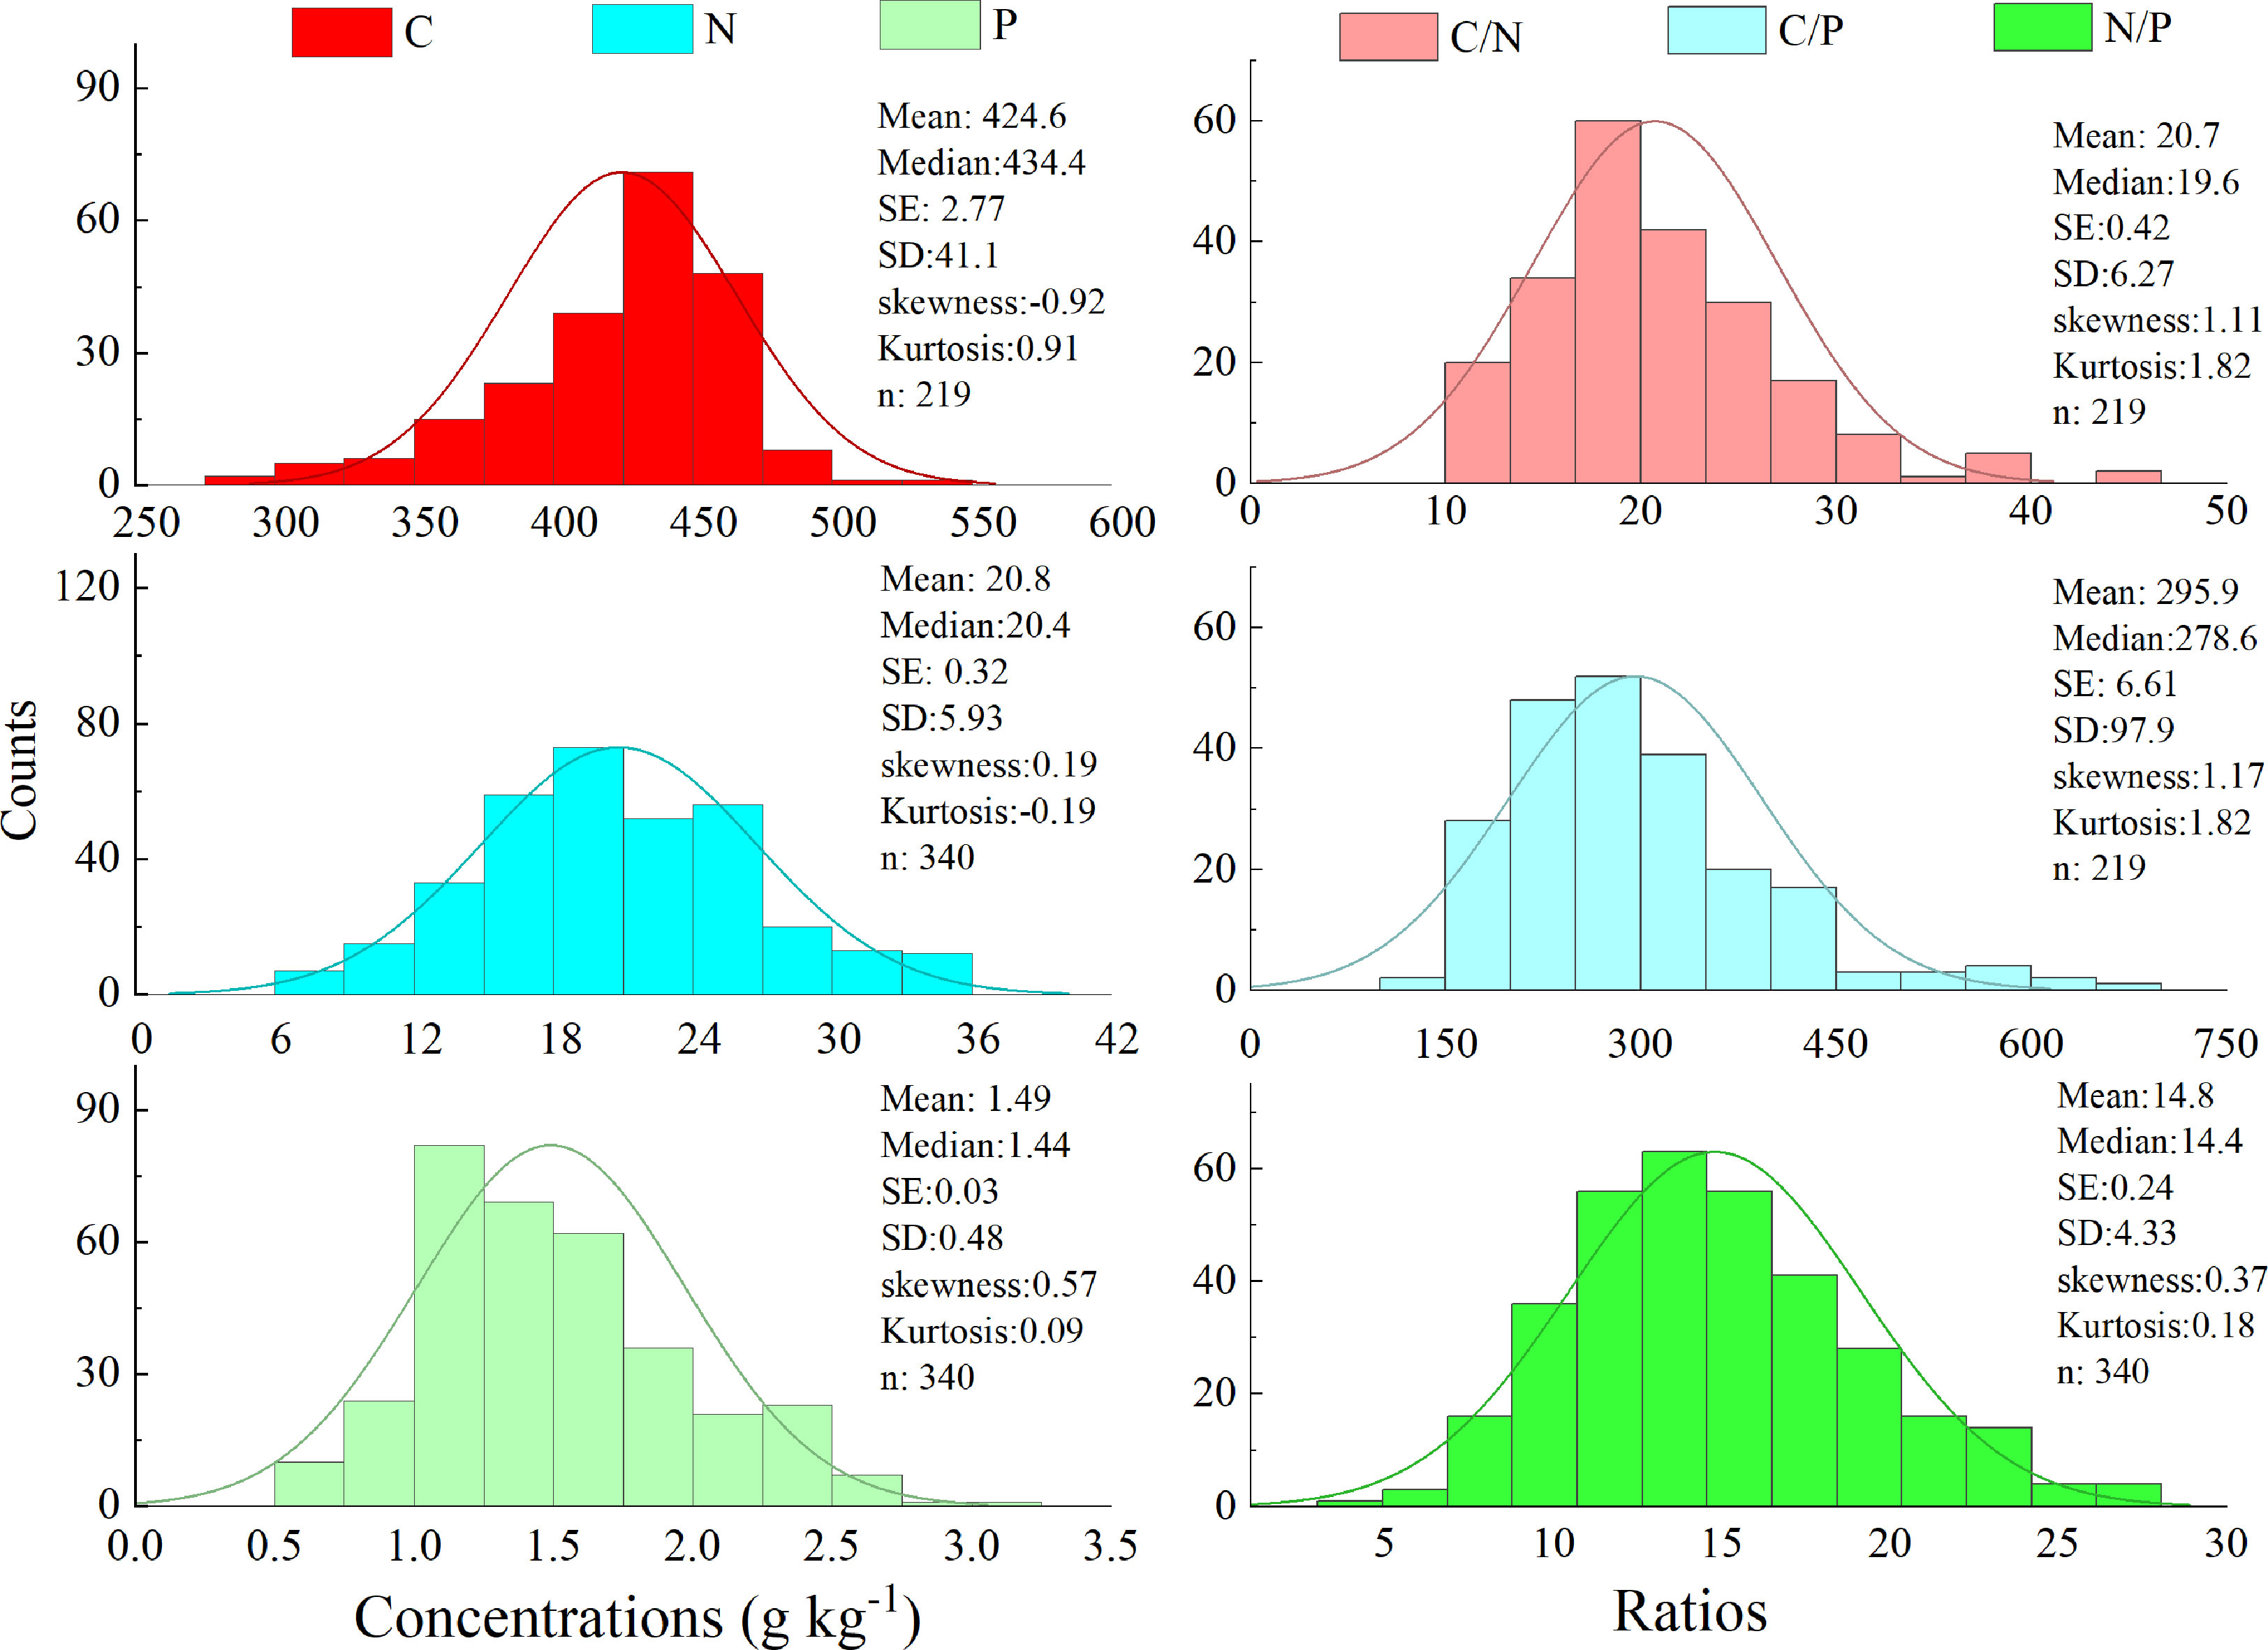
Figure 2 Frequency of the foliar C, N, and P stoichiometry in study area.
The foliar C concentrations in AM, AS, and DS were 425.9 ± 15.8, 403.4 ± 22.2, and 420.7 ± 30.7 g kg−1, respectively; the foliar N concentrations were 21.7 ± 2.9, 19.0 ± 2.3, and 21.7 ± 5.2 g kg−1, respectively; and the foliar P concentrations were 1.71 ± 0.29, 1.19 ± 0.16, and 1.59 ± 0.6 g kg−1, respectively. The foliar C, N, and P concentrations in the AS were the lowest. The foliar C and N ratios were comparable, with values of 19.8 ± 2.8, 20.6 ± 1.9, and 19.9 ± 5.8 in the AM, AS, and DS, respectively. The foliar C and P ratio in the AS is the highest, with a value of 347.3 ± 57.0. The foliar N and P ratio in the AS is the highest, with a value of 16.2 ± 3.2 (Figure 3).
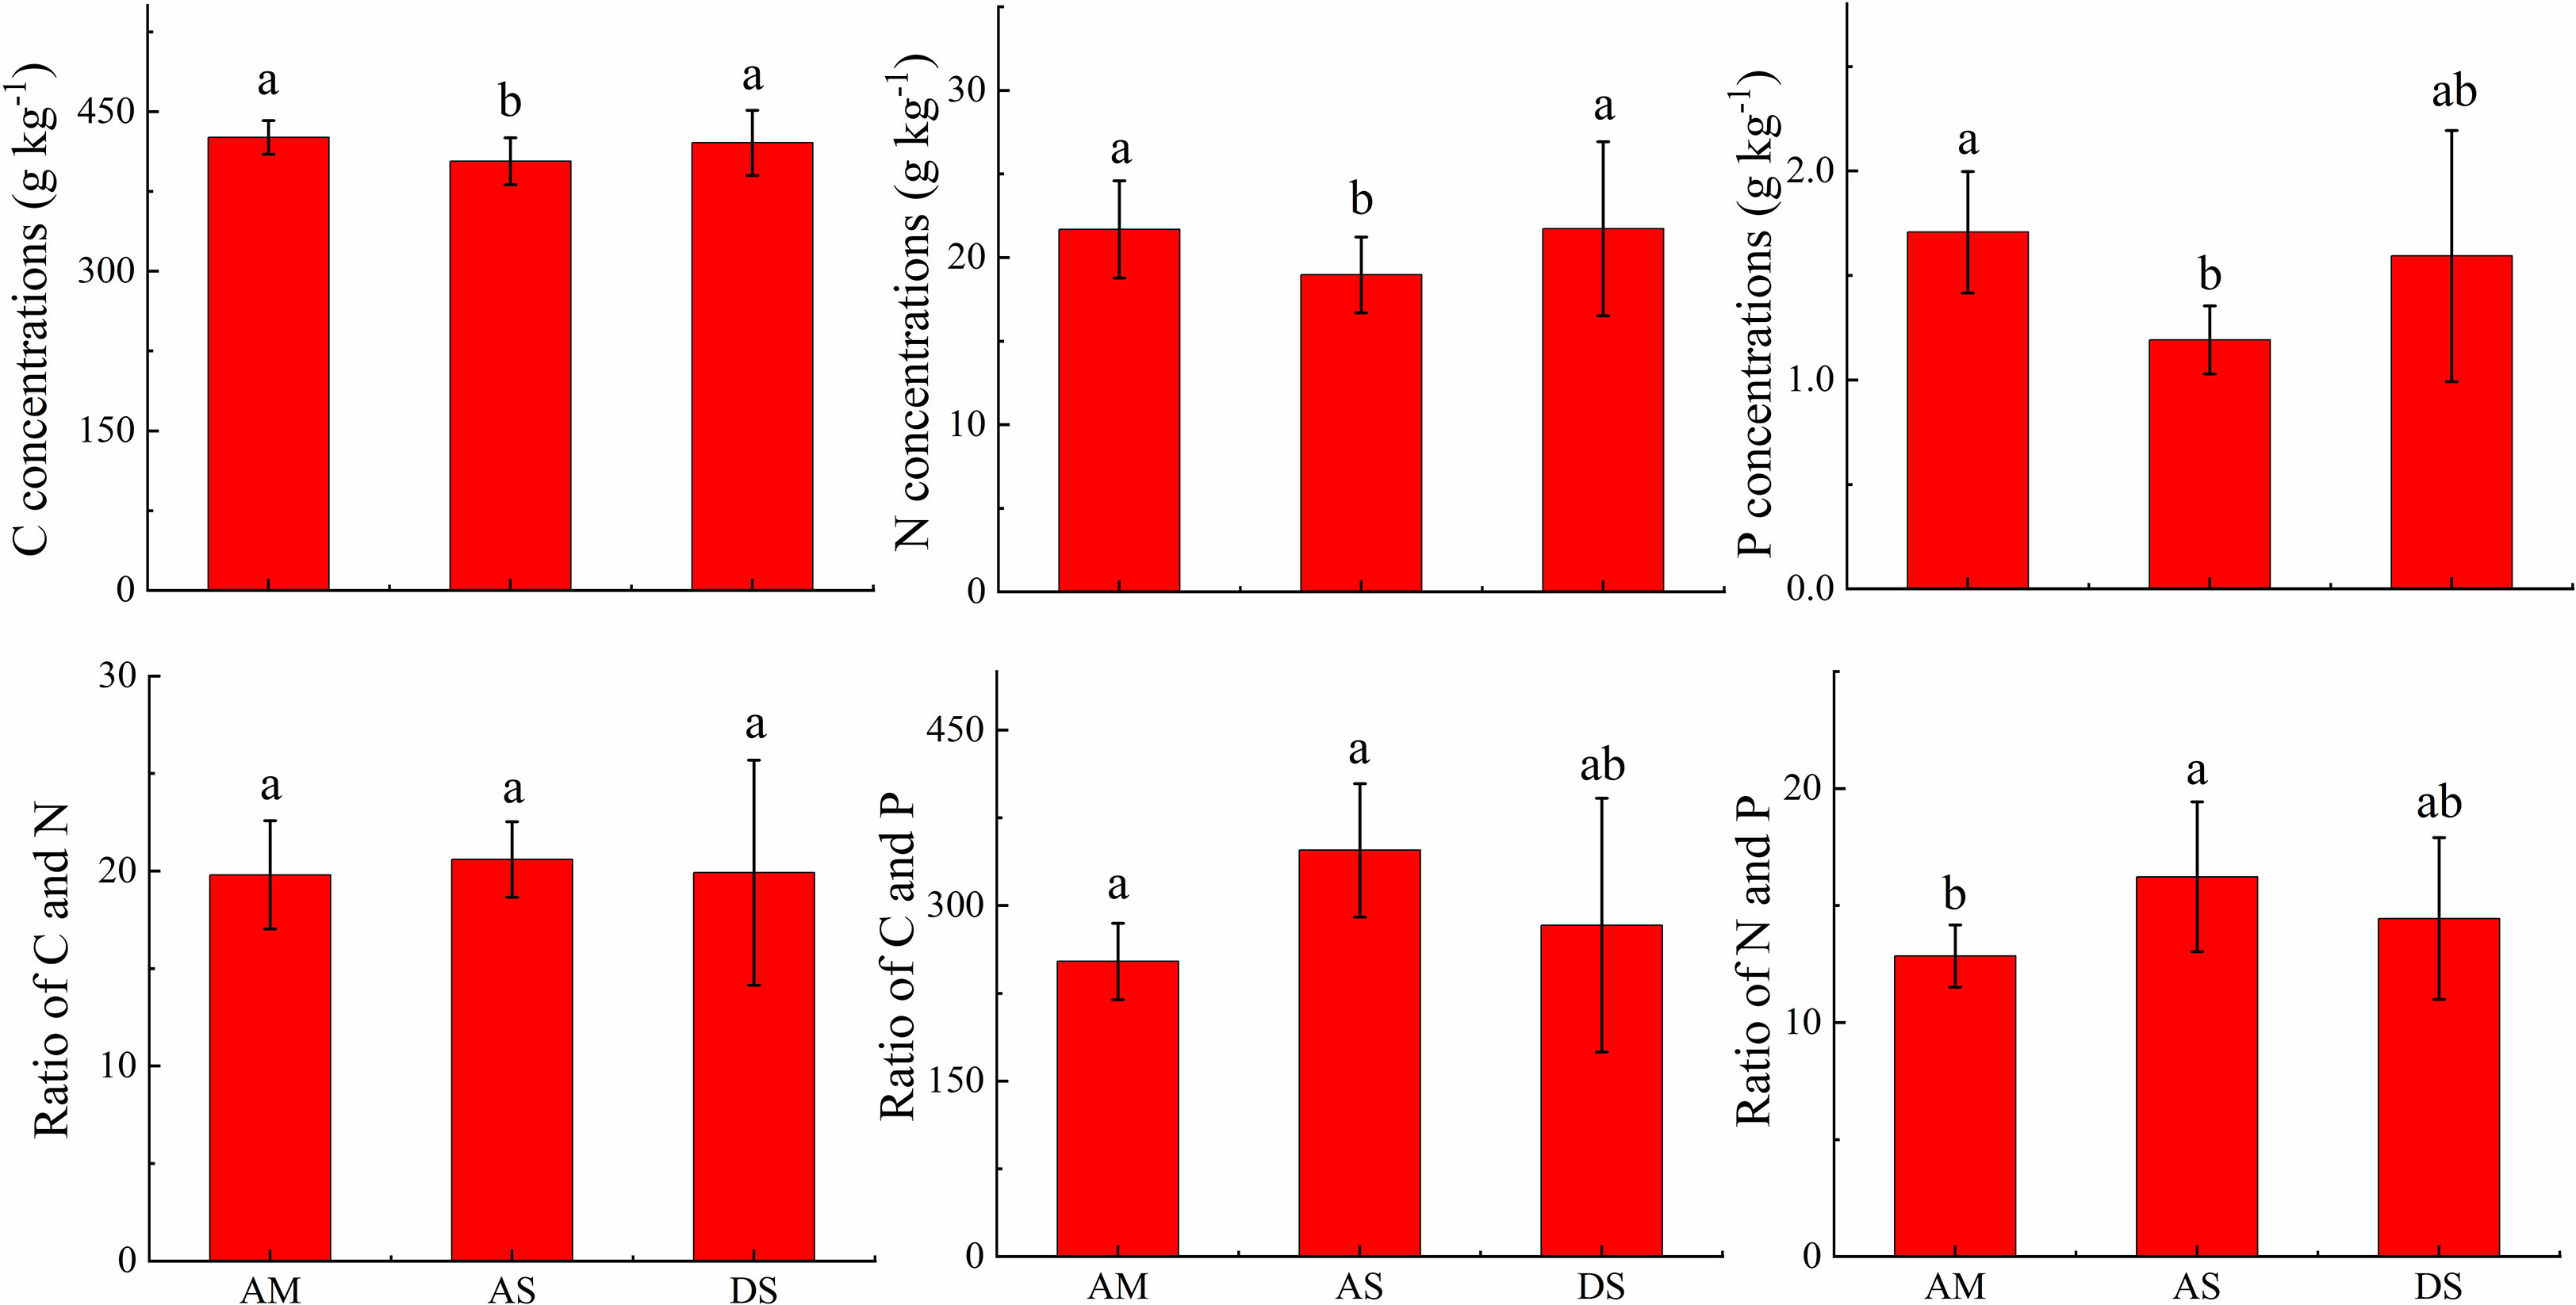
Figure 3 Comparison of foliar C, N, and P stoichiometry in different grassland types. Different letters above the column means the differences was significant at 0.05 level.
The soil C concentrations were 26.5 ± 9.8, 10.7 ± 2.3, and 5.26 ± 2.05 g kg−1, whereas the soil N concentrations were 2.69 ± 1.1, 1.24 ± 0.23, and 0.62 ± 0.25 g kg−1 in the AM, AS, and DS, respectively. In addition, both soil C and N concentrations were significantly lower in the AS. The soil P concentrations were 0.43 ± 0.09, 0.32 ± 0.06, and 0.56 ± 0.17 g kg−1 in the AM, AS, and DS ecosystems, respectively. The soil C and N ratio was the highest in the AM, with a value of 10.2 ± 2.2. The values in the AS and DS ecosystems were comparable. The soil C and P ratio was the highest in the AM, with a value of 60.1 ± 15.0. The foliar N and P ratio was the highest in the AS, with a value of 6.01 ± 1.3 (Figure 4).
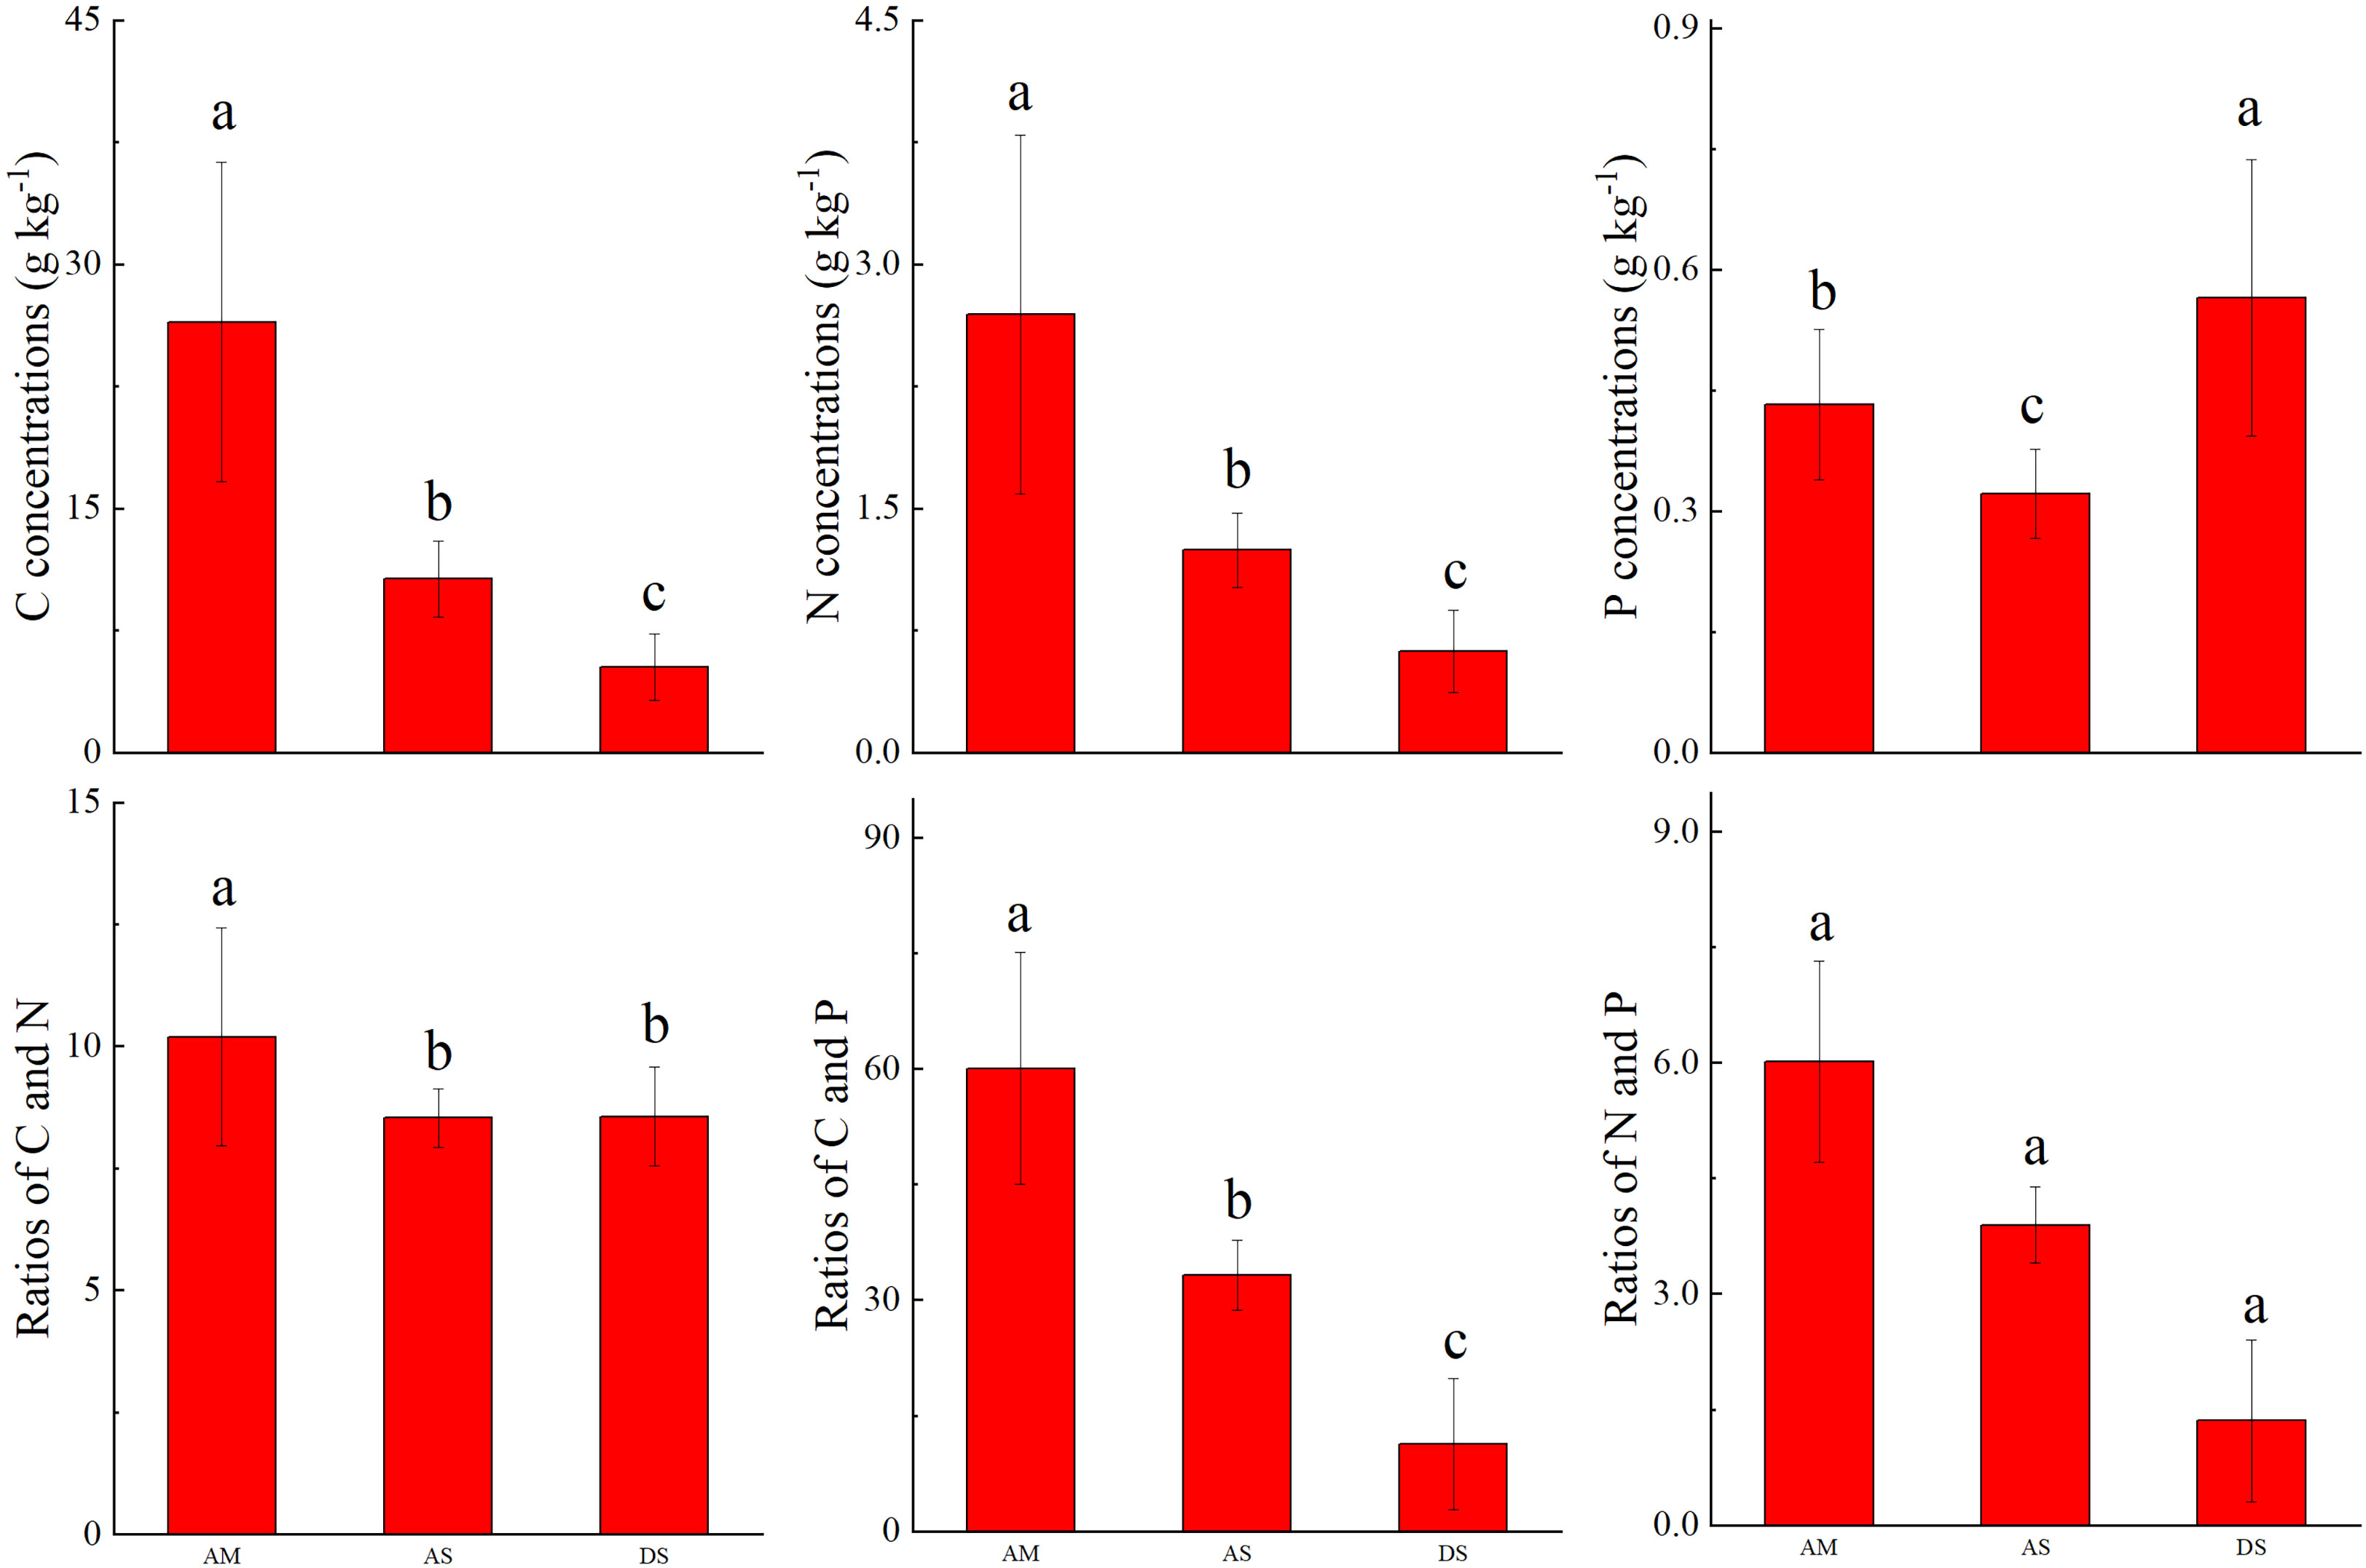
Figure 4 Comparison of soil C, N, and P stoichiometry in different grassland types. Different letters above the column means the differences was significant at 0.05 level.
Considering the grassland types were changed with longitude changing, the longitude patterns of leaf and soil C, N, and P stoichiometry were analyzed. Results showed that no obvious trend was observed of the foliar C, N, and P concentrations and foliar C/N, C/P, and N/P, yet soil C and N concentrations showed an increasing trend, and soil P concentrations showed a decreasing trend with the increasing of longitude, soil C/P. In addition, N/P dramatically increased with the increase in longitude (Figure 5).
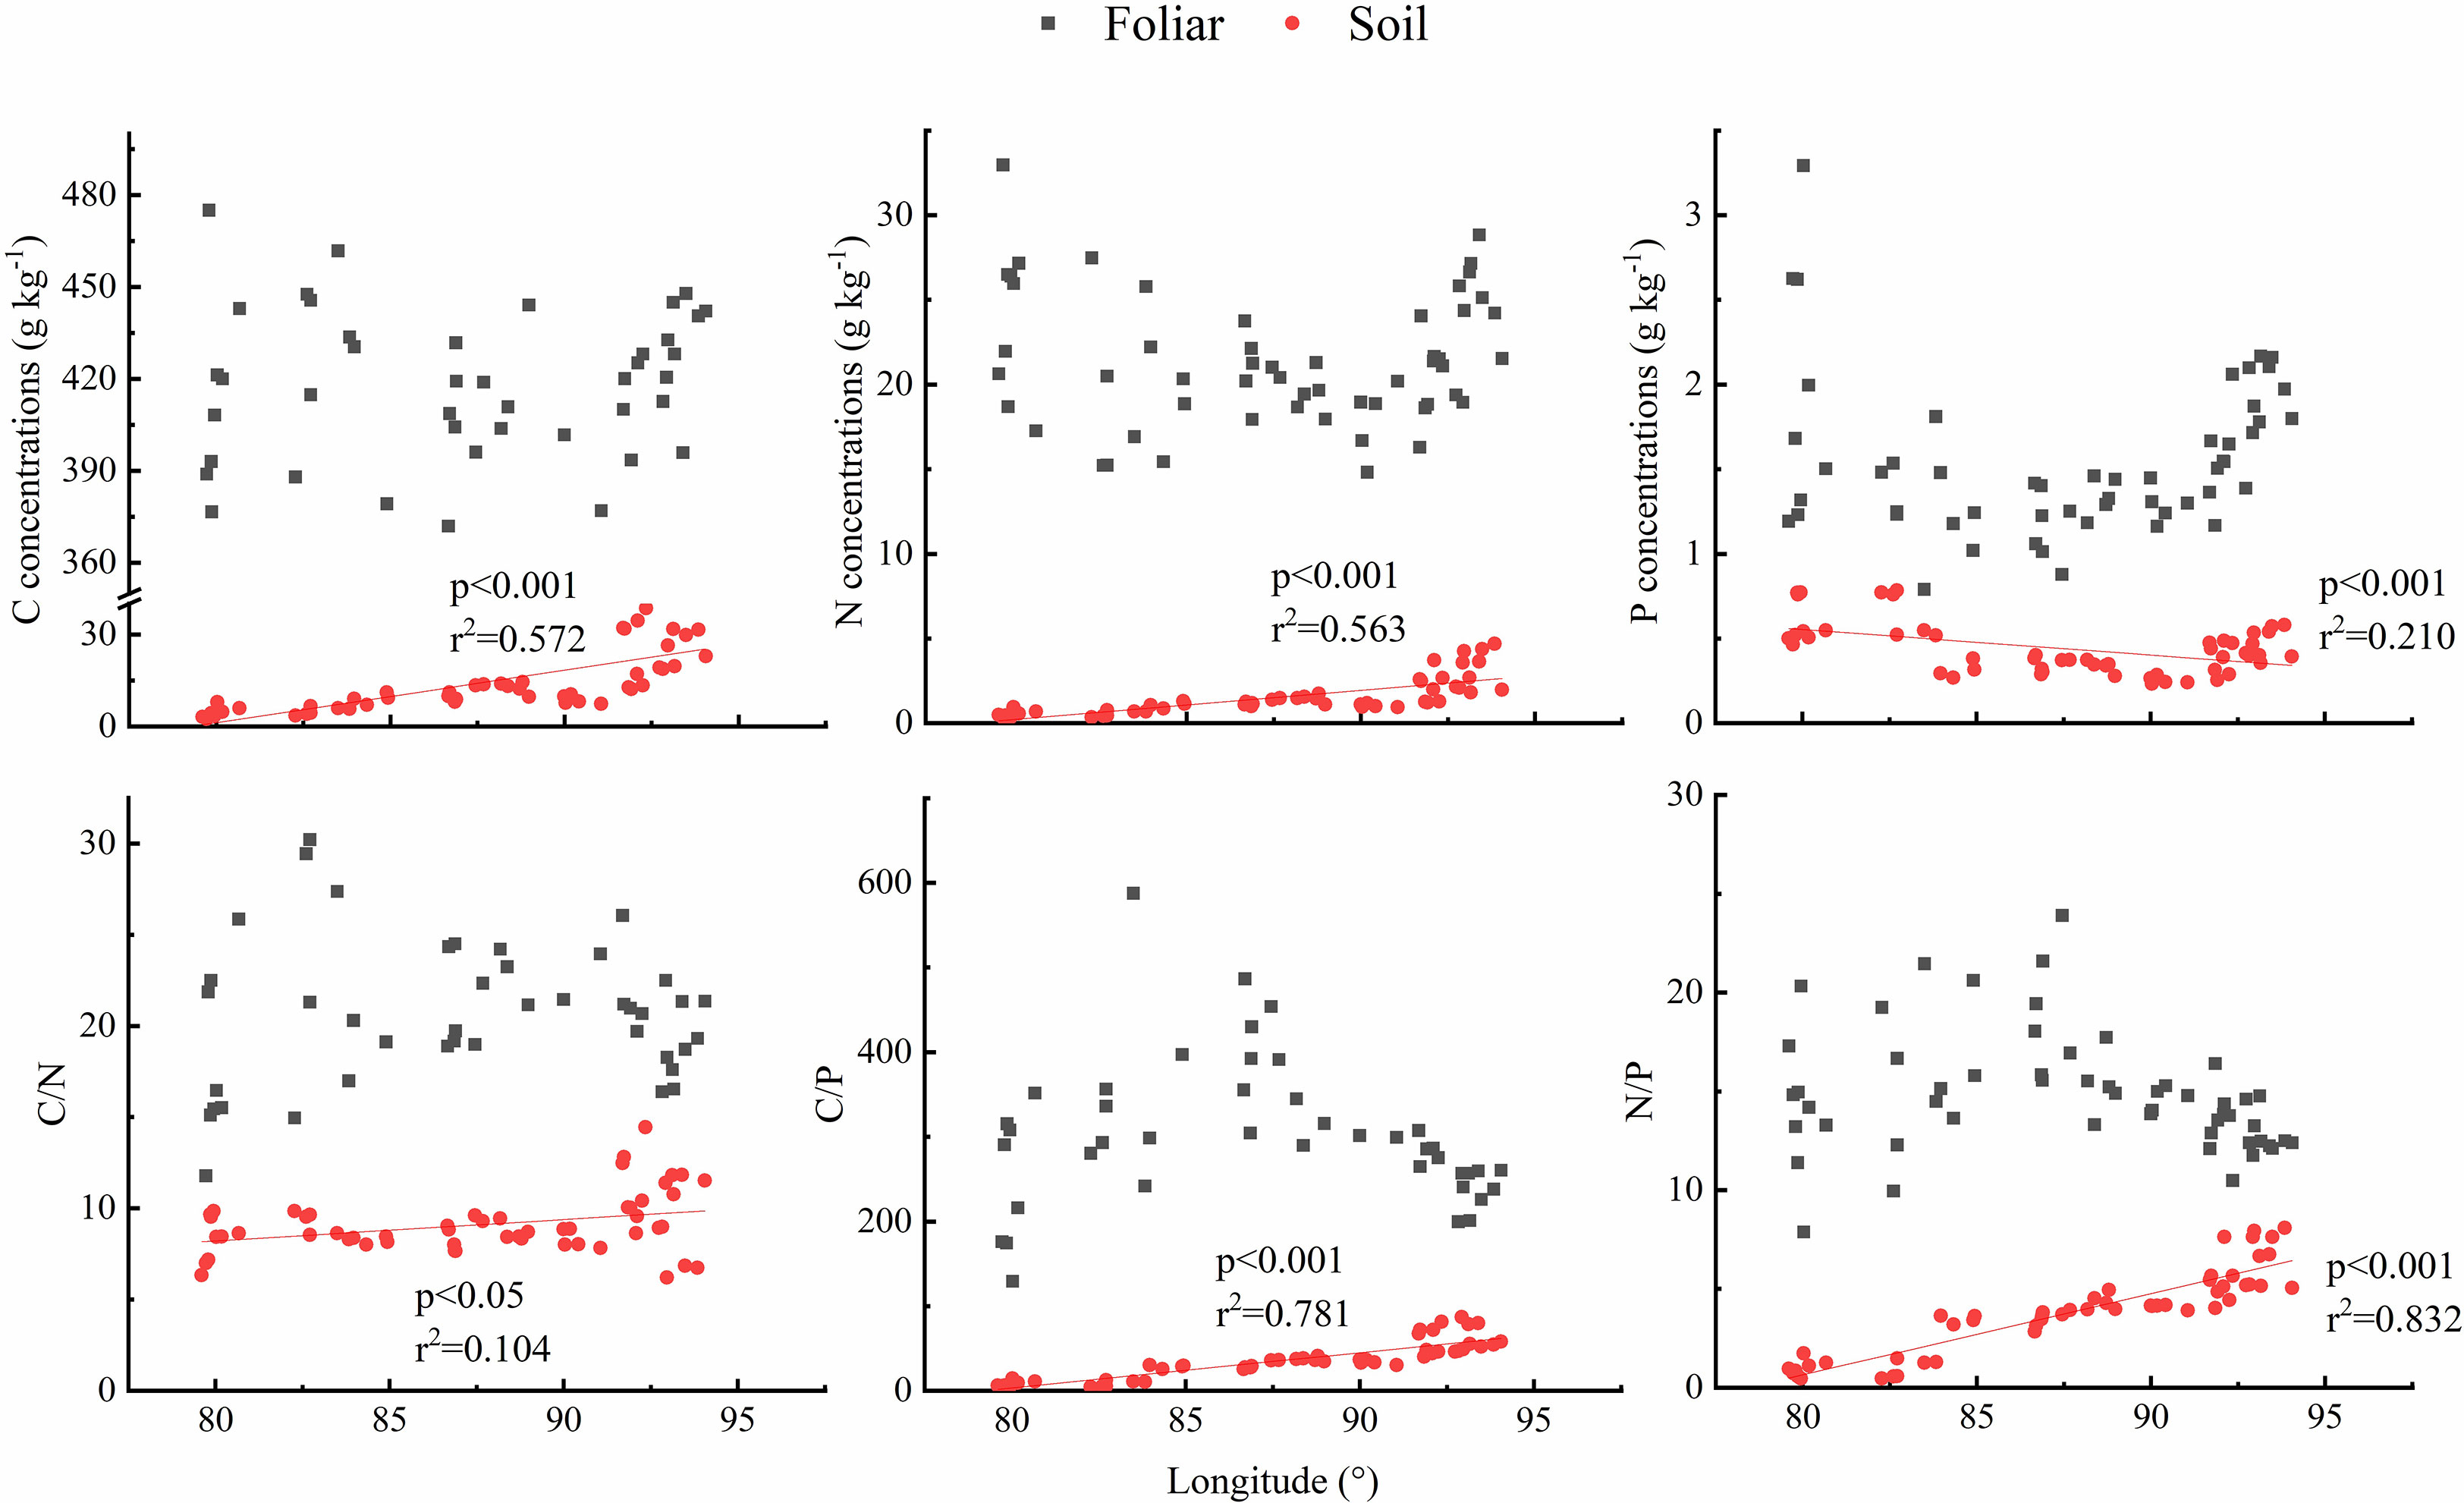
Figure 5 Longitude pattern of foliar and soil C, N, and P stoichiometry across north Tibet grassland.
In the AM, foliar C concentrations (C) were positively correlated with the soil available N (AN) at 0.05, and the soil C, N, and P concentrations were significantly positive (Table S2). In the AS, C showed significant positive correlations with AN, foliar N concentrations (N) showed positive correlations with soil P concentrations (SP), and soil C, N, and P concentrations were significantly positive (Table S3). In the DS, C showed a significantly positive relationship with AN, and N showed a positive correlation with SN at a 0.05 level. Soil C was significantly positively correlated with soil N, but no correlation was observed between soil C and soil P (Table S4).
The results of the GLM showed that species (vegetation type) were the dominant factors of the six leaf C:N:P traits, accounting for 42.8% for leaf C, 45.1% for leaf N, 35.2% for leaf P, 52.9% for leaf C:N, 39.6% for leaf C:P, and 48.0% for leaf N:P. The contributions of other factors (MAP, MAT, SC, SN, SP, AN, and AP) to leaf C:N:P traits were all limited (Table 1).
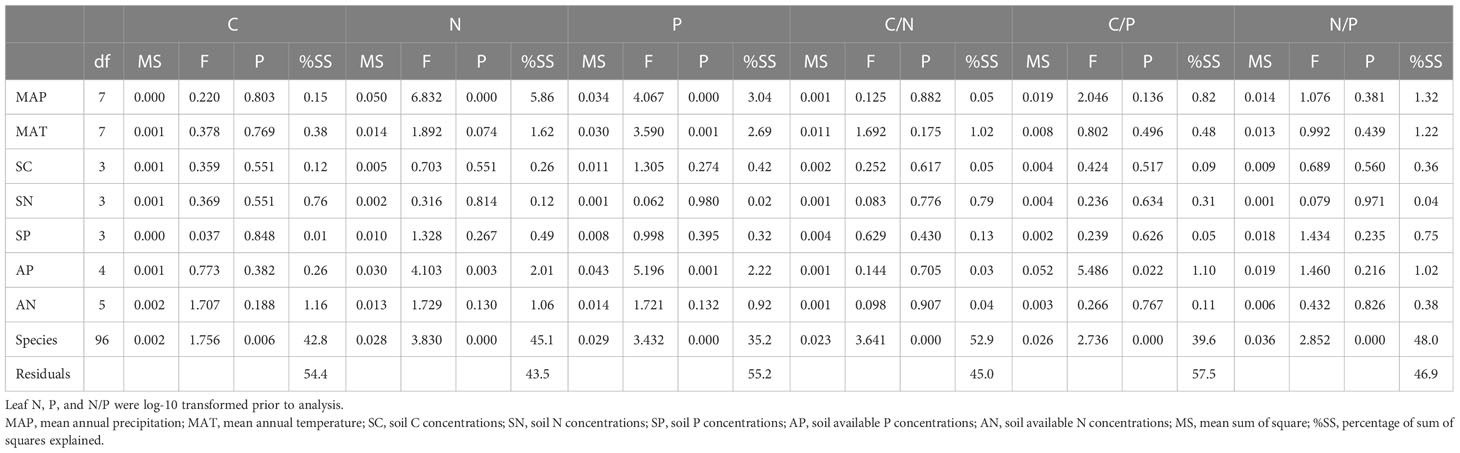
Table 1 Summary of the general linear models for the effect of environmental variations.
Foliar C concentrations have a significantly higher stoichiometric homeostasis than other nutrients (Zhang et al., 2020). Similar results were obtained in this study (Figure 3). The standard deviations of foliar C concentrations in the three ecosystems were low. The average foliar C concentrations in the AM and DS ecosystems were comparable, whereas they were slightly lower in the AS ecosystem (Figure 3). In addition, the foliar C concentrations ranged from 405.2 to 424.5 g kg−1, which is close to the result for Northern Tibet reported by Ma et al. (2019).
Foliar N and P concentrations have been widely investigated in China’s grasslands. Han et al. (2005) reported that terrestrial ecosystems were P-poor based on the plant N and P stoichiometry. As shown in Table 2, compared with the average foliar N and P concentrations in global flora, the foliar N concentrations were at a high level and foliar P concentrations were generally at a low level in most studies carried out in China. Similar results were observed in this study; the foliar N concentrations were comparable to the average global values, whereas the foliar P concentrations of all three types of grassland were lower than the average global values (Table 2).
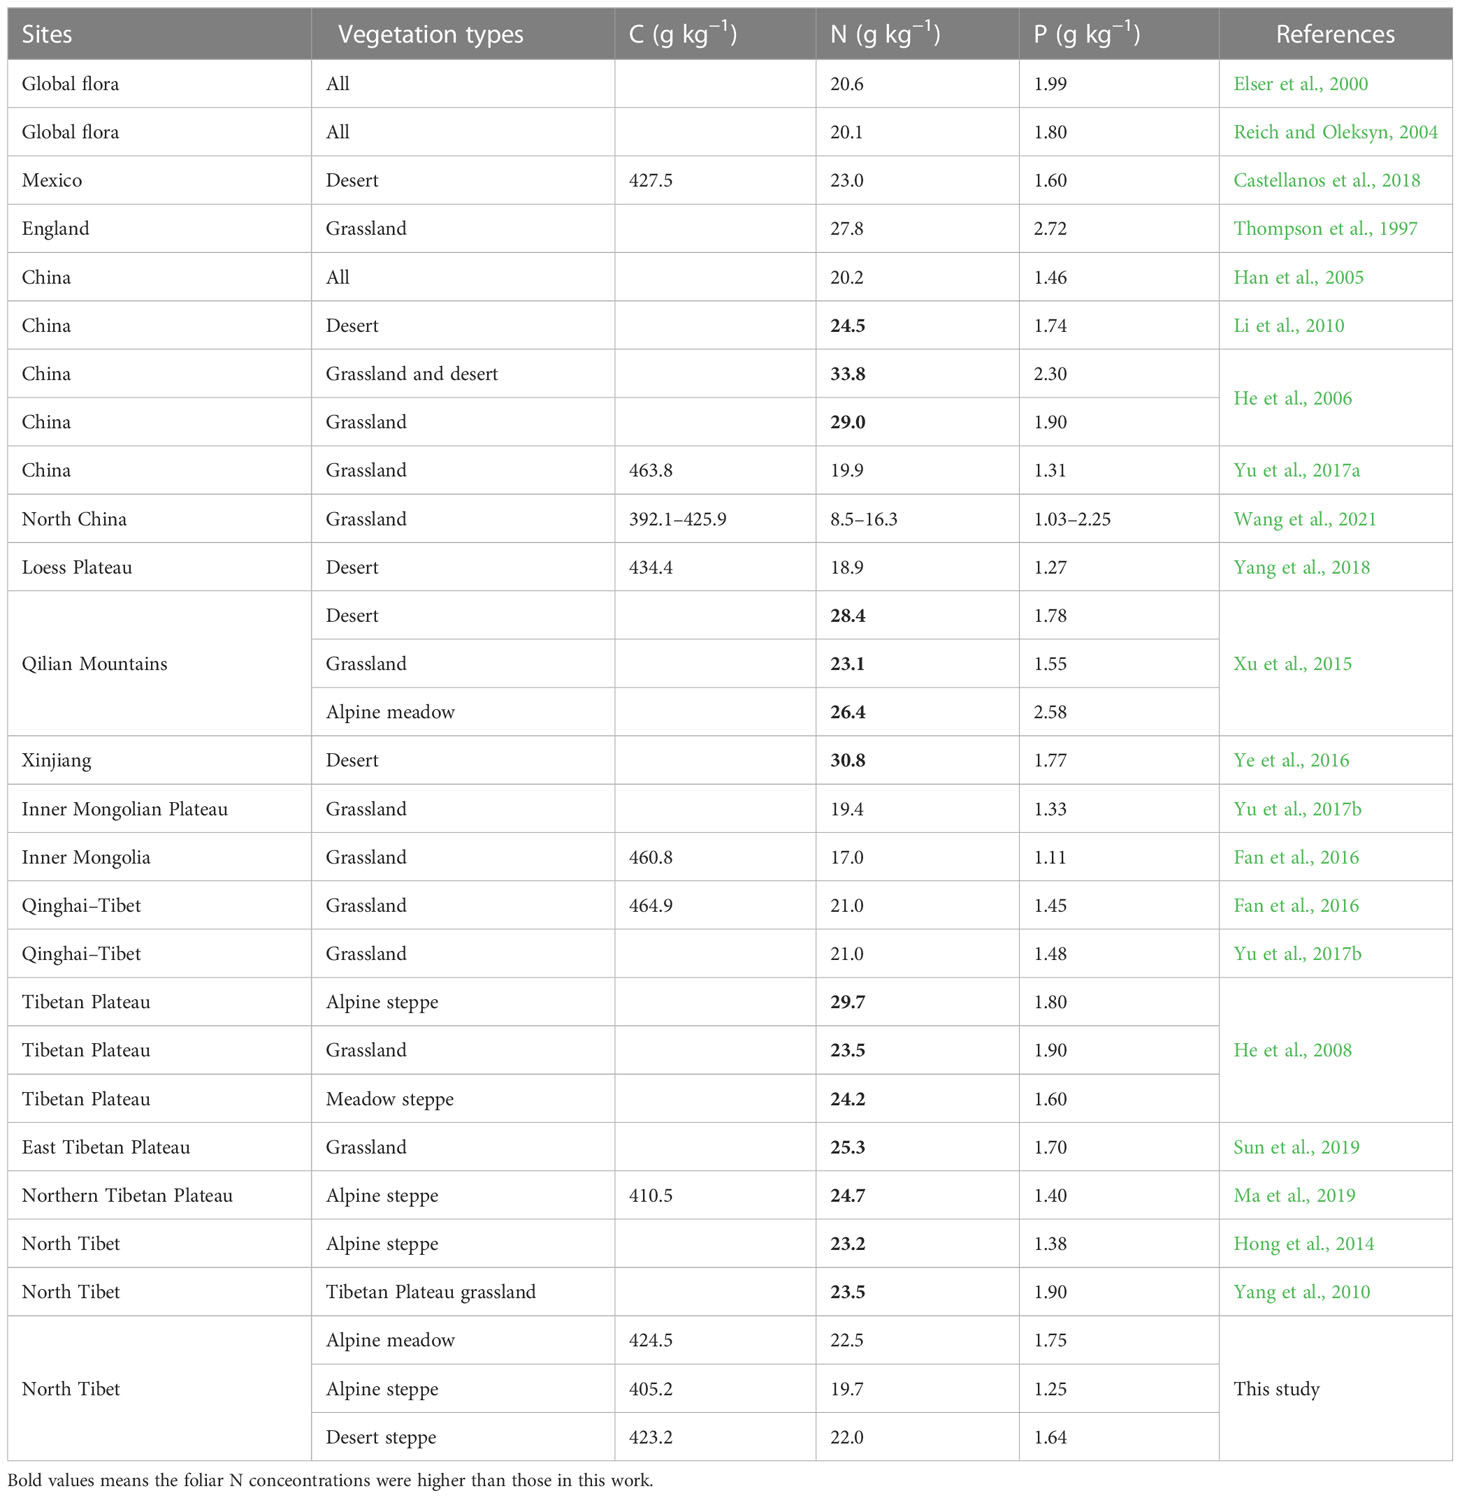
Table 2 Comparison of foliar C, N, and P concentrations among different grasslands.
In Tibetan grassland ecosystems, foliar N concentrations ranged from 21.0 to 29.7 g kg−1, whereas foliar P concentrations ranged from 1.38 to 1.90 g kg−1 (Table 2). Additionally, foliar P concentrations varied considerably in the three grassland types, with the value being higher in AM and lower in AS. The high foliar P concentrations in the AM ecosystem can be explained by the amount of precipitation. P is primarily derived from the weathering of soil inorganic components and the degradation of organic matter (Aerts and Chapin, 1999). Precipitation, which may amplify the P availability in soil by facilitating litter decomposition in arid regions, is at a high level in AM ecosystems (Table S1). Similar results were observed in the Qinglian Mountains (Xu et al., 2015).
For the same transect, He et al. (2006; 2008). reported that variations in the foliar N and P concentrations were mainly influenced by geographic and between-species variations. The results of this study show that the vegetation type was the most important control factor (Table 1). Furthermore, low foliar P concentrations and high C/P ratios were observed in the AS ecosystem in this work (Figure 4). The reason might be that the leaf nitrogen and phosphorus stoichiometry commonly differ at the family level and that low foliar N and P concentrations have existed in both Gramineae and Cyperaceous (Tian et al., 2018). Meanwhile, the dominant species were Gramineae and Cyperaceous in the AS ecosystem, and the foliar N and P concentrations were at a low level in both in this work (Appendix Figure 1).
C concentrations were relatively weakly correlated with other nutrients in the same organ (Zhang et al., 2020). In this study, the foliar C concentration was not correlated with the foliar N and P contents in the three grassland types. The reason might be that foliar C concentrations are relatively stable in the leaf (Figure 3) (Zhang et al., 2020), but foliar N and P concentrations varied largely due to biological or abiotic factors (Table 1). For example, plant nutrient concentrations might increase to maintain the physiological metabolism under drought conditions (Griffiths and Parry, 2002). In this work, the foliar N and P concentrations were high in the DS ecosystem than those in the AS ecosystem, whereas foliar C concentrations were comparable in those two ecosystems (Figure 3). As a result, the correlation between leaf C and N concentrations was poor, as well as foliar C and P concentrations. A similar result was observed for the Hexi Corridor (Zhang et al., 2020).
Generally, the leaf N and P concentrations are positively correlated in field environments (Gusewell, 2004). Similar results were obtained in this study (Appendix Figure 2). However, a correlation between the foliar N and P concentrations was not observed in the AS ecosystem (Table S3). The reason might be that plant N and P could be more strongly coupled in humid conditions than in arid environments across alpine grasslands (Zhou et al., 2020).
The foliar C of AN showed positive correlations in all three grasslands in this study. The reason might be that these ecosystems are limited by N (Xie et al., 2020). Interestingly, a negative correlation was observed between foliar and soil N in the DS (Table S4). This might be because the soil N concentration is mainly influenced by N-fixing microbes (Houlton et al., 2018). In the DS ecosystem, soil N is relatively low because of poor environmental conditions (Figure 4, Table S1). However, in drought environments, plants tend to increase nutrient concentrations to maintain their physiological metabolism. Consequently, a negative correlation between foliar N and soil N was observed in the drought environment.
There is no doubt that the Qinghai–Tibet Plateau has a high altitude and low temperature; consequently, its soil is young and rich in P (Wang et al., 2013). As MAP increases, soil AP may show an increasing trend because precipitation amount can amplify the P availability (Aerts and Chapin, 1999). In this study, leaf P concentrations were positively correlated to MAP (Table S5). Meanwhile, vegetations tend to increase the foliar nutrient concentrations in low-temperature environments, and both leaf N and P concentrations show increasing trends as temperature increased when the annual temperature is below 5°C (Reich and Oleksyn, 2004). Leaf N concentrations were positively correlated to MAT in this work.
The foliar N and P concentrations vary greatly depending on several factors (e.g., climate, soil nutrient pool, and vegetation types). The results of this study show that the foliar C, N, and P concentrations decreased significantly from AM to AS. This can be explained by the biogeochemical hypothesis, which states that the concentrations of N and P in plant tissues are controlled by the availability of soil N and P; thus, the concentrations of N and P in plant tissues are highly correlated with those in the soil (McGroddy et al., 2004; Reich and Oleksyn, 2004). As shown in Figure 2, the soil N and P concentrations decreased dramatically from AM to AS. Furthermore, the leaf P concentrations increased with the precipitation because the increase in the precipitation may amplify the P availability in soil by facilitating the decomposition of litter in arid regions (Aerts and Chapin, 1999). The precipitation amounts were higher in the AM than in AS in the research areas (Table S1). The vegetation type was the dominant factor affecting foliar C, N, and P concentrations (Table 1), which differed in the two grasslands. The foliar C, N, and P concentrations increase from AS to DS. The soil N and P concentrations significantly decrease from AS to DS. This can be explained by the plant physiology hypothesis, which refers to the increase in the foliar N and P concentrations to offset the decrease in the plant metabolic rate when the ambient temperature decreases (Reich and Oleksyn, 2004) as well as in arid environments (Cunningham et al., 1999; Wright et al., 2005).
The C, N, and P stoichiometry is commonly used to evaluate nutrient limitations in ecosystems (Liu et al., 2021; Wang et al., 2021; Zhang et al., 2021). In general, high C:N and low N:P ratios were considered to be N-limited, whereas high C:P and N:P ratios were considered to be P-limited. The C:P and N:P ratios were the highest in the three grasslands because the foliar P concentrations in the AS ecosystem were low. This indicates that a P limitation might exist in the AS ecosystem of the Qinghai–Tibet Plateau. In addition, Koerselman (1996) suggested that the leaf N:P ratio can be used to reveal N limitations (N:P ratio < 14) or P limitations (N:P ratio > 16) in the ecosystem. In this study, the foliar N and P ratios were determined to be 13.1, 16.8, and 14.8 in the AM, AS, and DS ecosystems, respectively. The leaf N:P ratio in the AS ecosystem is above 16, suggesting that those areas might be restricted by P, whereas the ratio was below 14 in the AM ecosystem, suggesting that those areas might be restricted by N in the Northern Tibetan Plateau grassland.
Our result agreed that the between-species variation, rather than climatic variation, is the major determinant of grassland foliar stoichiometry at the biome level (He et al., 2008). This difference in response of leaf C, N, and P stoichiometry to environmental factors caused by vegetation type changes may be the main reason for the weak interpretation of environmental factors to leaf C, N, and P stoichiometry in the whole Northern Tibet transects.
Although soil nutrients, MAP, and MAT were commonly used to explain the spatial variations of leaf C, N, and P stoichiometry (Zhao et al., 2018; Wang et al., 2021), in the Qinghai–Tibet Plateau, the environmental factors may be more complex, such as light, solar radiation, elevation, and drought, which are important factors affecting the leaf C, N, and P stoichiometry (Zhao et al., 2018; Sun et al., 2019; Wang et al., 2022). Not all environmental factors were examined in this study, which may result in biases in the results of this study. Therefore, it is of great significance to understand the effects of environmental factors on leaf C, N, and P stoichiometry in different communities on the Qinghai–Tibet Plateau. More comprehensive and systematic studies needed to be conducted in the future.
In this study, the plant and soil C, N, and P stoichiometry and its driving forces in different grassland types in Tibet were investigated. The foliar C, N, and P concentrations in AM and DS ecosystems were comparable, whereas these values were the lowest in the AS ecosystem. The foliar C and N ratios of the three types of grassland are comparable. The foliar C and P ratios are the highest and lowest in the AS and AM ecosystems, respectively. The foliar N and P ratios are the highest in the AS and the lowest in the AM. In addition, the AM ecosystem might be limited by N, and the AS ecosystem might be limited by P in Northern Tibetan grassland ecosystems. Across the whole transects, vegetation species was the dominant factor that control the leaf C, N, and P stoichiometry. Our results suggested that between-species variation, rather than climatic variation and soil nutrients, is the major determinant of north Tibet grassland leaf stoichiometry.
The raw data supporting the conclusions of this article will be made available by the authors, without undue reservation.
WW designed the experiments. WW, JZ, ZX, and XW conducted the experiments. WW and ZJ made the figures. WW wrote the manuscript. All authors contributed to the article and approved the submitted version.
This work was funded by the National Natural Science Foundation of China (42067036) and the Natural Science Foundation of Tibet Autonomous Region Department and Agriculture and Animal Husbandry University (XZ202101ZR0023G).
The authors declare that the research was conducted in the absence of any commercial or financial relationships that could be construed as a potential conflict of interest.
All claims expressed in this article are solely those of the authors and do not necessarily represent those of their affiliated organizations, or those of the publisher, the editors and the reviewers. Any product that may be evaluated in this article, or claim that may be made by its manufacturer, is not guaranteed or endorsed by the publisher.
The Supplementary Material for this article can be found online at: https://www.frontiersin.org/articles/10.3389/fpls.2023.1092872/full#supplementary-material
Aerts, R., Chapin, F. S. (1999). The mineral nutrition of wild plants revisited: A re-evaluation of processes and patterns. Adv. Ecol. Res. 30, 1–67. doi: 10.1016/s0065-2504(08)60016-1
Bao, S. D. (2000). Soil agro-chemistrical analysis. 3rd ed. (China Agriculture Science and Technique Press).
Bertiller, M. B., Sain, C. L., Carrera, A. L., Vargas, D. N. (2005). Patterns of nitrogen and phosphorus conservation in dominant perennial grasses and shrubs across an aridity gradient in Patagonia, Argentina. J. Arid. Environ. 62, 209–223. doi: 10.1016/j.jaridenv.2004.11.011
Bista, D. R., Heckathorn, S. A., Jayawardena, D. M., Mishra, S., Boldt, J. K. (2018). Effects ofdrought on nutrient uptake and the levels of nutrient-uptake proteins in roots of drought-sensitive and tolerant grasses. Plants 7, 28. doi: 10.3390/plants7020028
Cai, Q., Ding, J. X., Zhang, Z. L., Hu, J., Wang, Q. T., Yin, M. Z., et al. (2019). Distribution patterns and driving factors of leaf c, n and p stoichiometry of coniferous species on the eastern qinghai-xizang plateau, China. Chin. J. Plant Ecol. 43, 1048–1060. doi: 10.17521/cjpe.2019.0221
Cao, J. J., Wang, X. Y., Adamowski, J. F., Biswas, A., Liu, C. F., Chang, Z. Q., et al. (2020). Response of leaf stoichiometry of oxytropis ochrocephala to elevation and slope aspect. Catena 194, 104772. doi: 10.1016/j.catena.2020.104772
Castellanos, A. E., Llano-Sotelo, J. M., Machado-Encinas, L. I., López-Piña, J. E., Romo-Leon, J. R., Sardans, J., et al. (2018). Foliar c, n, and p stoichiometry characterize successful plant ecological strategies in the sonoran desert. Plant Ecol. 219, 775–788. doi: 10.1007/s11258-018-0833-3
Chen, H., Ju, P. J., Zhang, J., Wang, Y. Y., Zhu, Q. A., Yan, L., et al. (2020). Attribution analyses of changes in alpine grasslands on the qinghai-Tibetan plateau. Chin. Sci. Bull. 65, 2406–2418. doi: 10.1360/TB-2019-0619
Cunningham, S. A., Summerhayes, B., Westoby, M. (1999). Evolutionary divergences in leaf structure and chemistry, comparing rainfall and soil nutrient gradients. Ecol. Monogr. 69, 569–588. doi: 10.1890/0012-9615(1999)069
Delgado-Baquerizo, M., Maestre, F. T., Gallardo, A., Bowker, M. A., Wallenstein, M. D., Quero, J. L., et al. (2013). Decoupling of soil nutrient cycles as a function of aridity in global drylands. Nature 502 (7473), 672–676. doi: 10.1038/nature12670
Elser, J. J., Fagan, W. F., Denno, R. F., Dobberfuhl, D. R., Folarin, A., Huberty, A., et al. (2000). Nutritional constraints in terrestrial and freshwater food webs. Nature 408, 578–580. doi: 10.1038/35046058
Elser, J. J., Fagan, W. F., Kerkhoff, A. J., Swenson, N. G., Enquist, B. J. (2010). Biological stoichiometry of plant production: metabolism, scaling and ecological response to global change. New Phytol. 186, 593–608. doi: 10.1111/j.1469-8137.2010.03214.x
Fan, J. W., Harris, W., Zhong, H. P. (2016). Stoichiometry of leaf nitrogen and phosphorus of grasslands of the inner Mongolian and qinghai-Tibet plateaus in relation to climatic variables and vegetation organization levels. Ecol. Res. 31, 821–829. doi: 10.1007/s11284-016-1392-5
Fang, H. (2019). “Monthly temperature grid data set of qinghai Tibet plateau, (2000-2015),” in National Tibetan plateau data center. Available at: https://data.tpdc.ac.cn/zh-hans/data/566f6d56-bdc2-4c7e-83d5-ee168319f722.
Gong, X., Xu, Z., Lu, W., Tian, Y., Liu, Y., Wang, Z., et al. (2018). Spatial patterns of leaf carbon, nitrogen, and phosphorus stoichiometry of aquatic macrophytes in the arid zone of northwestern China. Front. Plant Sci. 9. doi: 10.3389/fpls.2018.01398
Griffiths, H., Parry, M. A. (2002). Plant responses to water stress. Ann. Bot. 89, 801–802. doi: 10.1093/aob/mcf159
Gusewell, S. (2004). N : P ratios in terrestrial plants: variation and functional significance. New Phytol. 164 (2), 243–266. doi: 10.1111/j.1469-8137.2004.01192.x
Hall, S. R., Smith, V. H., Lytle, D. A., Leibold, M. A. (2005). Constraints on primary producer n : P stoichiometry along n : P supply ratio gradients. Ecology 86, 1894–1904. doi: 10.1111/j.1469-8137.2004.01192.x
Han, W. X., Fang, J. Y., Guo, D. L., Zhang, Y. (2005). Leaf nitrogen and phosphorus stoichiometry across 753 terrestrial plant species in China. New Phytol. 168, 377–385. doi: 10.1111/j.1469-8137.2005.01530.x
He, J. S., Fang, J. Y., Wang, Z., Guo, D., Flynn, D. F., Geng, Z. (2006). Stoichiometry and large-scale patterns of leaf carbon and nitrogen in the grassland biomes of China. Oecologia 149, 115–122. doi: 10.1007/s00442-006-0425-0
He, J. S., Wang, L., Flynn, D. F., Wang, X. P., Ma, W. H., Fang, J. Y. (2008). Leaf nitrogen: phosphorus stoichiometry across Chinese grassland biomes. Oecologia 155, 301–310. doi: 10.1007/s00442-007-0912-y
Hong, J. T., Wang, X. D., Wu, J. B. (2014). Stoichiometry of root and leaf nitrogen and phosphorus in a dry alpine steppe on the northern Tibetan plateau. PloS One 9, e109052. doi: 10.1371/journal.pone.0109052
Houlton, B. Z., Morford, S. L., Dahlgren, R. A. (2018). Convergent evidence for widespread rock nitrogen sources in earth's surface environment. Science 360, 58–62. doi: 10.1126/science.aan4399
Hu, Y. K., Zhang, Y. L., Liu, G. F., Pan, X., Yang, X. J., Li, W. B., et al. (2017). Intraspecific n and p stoichiometry of phragmites australis: geographic patterns and variation among climatic regions. Sci. Rep. 7, 43018. doi: 10.1038/srep43018
Koerselman, W., Meuleman, A. (1996). The vegetation N:P ratio: a new tool to detect the nature of nutrient limitation. J. Appl. Ecol. 33 (6), 1441–1450. doi: 10.2307/2404783
Li, Y. L., Mao, W., Zhao, X. Y., Zhang, T. H. (2010). Leaf nitrogen and phosphorus stoichiometry in typical desert and decertified regions, north China. Environ. Sci. 31 (8), 1716–1725. doi: 10.13227/j.hjkx.2010.08.001
Liu, J., Gou, X., Zhang, F., Bian, R., Yin, D. C. (2021). Spatial patterns in the c: N: P stoichiometry in qinghai spruce and the soil across the qilian mountains, China. Catena 196, 104814. doi: 10.1016/j.catena.2020.104814
Ma, X. X., Hong, J. T., Wang, X. D. (2019). C:N:P stoichiometry of perennial herbs’ organs in the alpine steppe of the northern Tibetan plateau. J. Mt. Sci. 16 (9), 2039–2047. doi: 10.1007/s11629-018-5299-1
McGroddy, M. E., Daufresne, T., Hedin, L. O. (2004). Scaling of c: N: P stoichiometry in forests worldwide: Implications of terrestrial redfield-type ratios. Ecology 85 (9), 2390–2401. doi: 10.1890/03-0351
Reich, P. B., Oleksyn, J. (2004). Global patterns of plant leaf n and p in relation to temperature and latitude. Proc. Natl. Acad. Sci. U.S.A. 101, 11001–11006. doi: 10.1890/03-0351
Sardans, J., Alonso, R., Janssens, I. A., Carnicer, J., Vereseglou, S., Rillig, M. C., et al. (2015). Foliar and soil concentrations and stoichiometry of nitrogen and phosphorous across. Funct. Ecol. 30 (5), 676–689. doi: 10.1111/1365-2435.12541
Shi, M. M., Wang, Z., Zhou, B. R., Yang, X. G., Sun, W. J. (2022). Characteristics of grassland degradation and its relationship with climate factors on qinghai-Tibetan plateau, China. Chin. J.Appl. Ecol 33 (12), 3271–3278. doi: 10.13287/j.1001-9332.202212.002
Sterner, R. W., Elser, J. J. (2002). Ecological stoichiometry: The biology of elements from molecules to the biosphere (Princeton: Princeton University Press).
Sun, J., Liu, B., You, Y., Li, W., Liu, M., Shang, H., et al. (2019). Solar radiation regulates the leaf nitrogen and phosphorus stoichiometry across alpine meadows of the Tibetan plateau. Agr. For. Meteorol. 271, 92–101. doi: 10.1016/j.agrformet.2019.02.041
Tan, K., Ciais, P., Piao, S., Wu, X., Tang, Y., Vuichard, N., et al. (2010). Application of the ORCHIDEE global vegetation model to evaluate biomass and soil carbon stocks of qinghai-Tibetan grasslands. Glob. Biogeochem. Cy. 24, GB1013. doi: 10.1029/2009GB003530
Tao, Y., Wu, G., Zhang, Y., Zhou, X. (2016). Leaf n and p stoichiometry of 57 plant species in the karamori mountain ungulate nature reserve, xinjiang, China. J. Arid. Land 8, 935–947. doi: 10.1007/s40333-016-0019-6
Thompson, K., Parkinson, J. A., Band, S. R., Spencer, R. E. (1997). A comparative study of leaf nutrient concentrations in a regional herbaceous flora. New Phytol. 136, 679–689. doi: 10.1046/j.1469-8137.1997.00787.x
Tian, D., Yan, Z. B., Niklas, K. J., Han, W. X., Kattge, J., Reich, P. B., et al (2018). Global leaf nitrogen and phosphorus stoichiometry and their scaling exponent[J]. Natl. Sci. Rev. 5 (05), 728–739.
Tian, D., Yan, Z. B., Fang, J. Y. (2021). Review on characteristics and main hypotheses of plant ecological stoichiometry. Chin. J. Plant Ecol. 45 (7), 682–713. doi: 10.17521/cjpe.2020.0331
Wang, R., Goll, D., Balkanski, Y., Hauglustaine, D., Boucher, O., Ciais, P., et al. (2017). Global forest carbon uptake due to nitrogen and phosphorus deposition from 1850 to 2100. Glob. Chang. Biol. 23, 4854–4872. doi: 10.1111/gcb.13766
Wang, M., Gong, Y., Lafleur, P., Wu, Y. (2021). Patterns and drivers of carbon, nitrogen and phosphorus stoichiometry in southern china's grasslands. Sci. Total Environ. 785, 147201. doi: 10.1016/j.scitotenv.2021.147201
Wang, X. G., Lü, X. T., Dijkstra, F. A., Zhang, H. Y., Wang, X. B., Wu, Y. N., et al. (2019). Changes of plant N:P stoichiometry across a 3000-km aridity transect in grasslands of northern China. Plant Soil 443, 107–119. doi: 10.1007/s11104-019-04211-w
Wang, X. G., Lü, X. T., Zhang, H. Y., Dijkstra, F. A., Jiang, Y. G., Wang, X. B., et al. (2020). Changes in soil c: N: P stoichiometry along an aridity gradient in drylands of northern China. Geoderma 361, 114087. doi: 10.1016/j.geoderma.2019.114087
Wang, Y., Ren, Z., Ma, P., Wang, Z., Niu, D., Fu, H., et al. (2020). Effects of grassland degradation on ecological stoichiometry of soil ecosystems on the qinghai-Tibet plateau. Sci. Total Environ. 722, 137910. doi: 10.1016/j.scitotenv.2020.137910
Wang, J. L., Zhong, Z. M., Wang, Z. H., Chen, B. X., Zhang, X. Z., Shen, Z. X., et al. (2013). Soil N/P ratio distribution characteristics of alpine grassland ecosystem in qinghai-Tibet plateau. Chin. J. Appl. Ecol. 24 (12), 3399–3406. doi: 10.13287/j.1001-9332.2013.0572
Wang, W., Zhao, J. M., Xing, Z. (2022). Spatial patterns of leaf nitrogen and phosphorus stoichiometry across southeast to central Tibet. J. Mt. Sci. 19 (9), 2651–2663.
Wieder, W. R., Cleveland, C. C., Smith, W. K., Todd-Brown, K. (2015). Future productivity and carbon storage limited by terrestrial nutrient availability. Nat. Geosci. 8, 441–444. doi: 10.1038/Ngeo2413
Wright, I. J., Reich, P. B., Cornelissen, J. H. C., Falster, D. S., Groom, P. K., Hikosaka, K., et al. (2005). Modulation of leaf economic traits and trait relationships by climate. Global Ecol. Biogeogr. 14, 411–421. doi: 10.1111/j.1466-822x.2005.00172.x
Wu, T. G., Dong, Y., Yu, M. K., Wang, G. G., Zeng, D. H. (2012). Leaf nitrogen and phosphorus stoichiometry of quercus species across China. For. Ecol. Manage. 284, 116–123. doi: 10.1016/j.foreco.2012.07.025
Xie, D., Zhao, B., Wang, S., Duan, L. (2020). Benefit of china's reduction in nitrogen oxides emission to natural ecosystems in East Asia with respect to critical load exceedance. Environ. Int. 136, 105468. doi: 10.1016/j.envint.2020.105468
Xu, S. J., Fan, X. Y., Wang, L. L., Zhang, X. F., An, L. Z. (2015). The patterns of nitrogen and phosphorus stoichiometry across communities along altitudinal gradients in qilian mountains. China. Biochem. Syst. Ecol. 62, 58–65. doi: 10.1016/j.bse.2015.07.037
Yang, K., Huang, J. H., Dong, D., Ma, W. H., He, J. S. (2010). Canopy leaf n and p stoichiometry in grassland communities of qinghai-Tibetan plateau, China. Chin. J. Plant Ecol. 34 (1), 17–22. doi: 10.3773/j.issn.1005-264x.2010.01.004
Yang, Y., Liu, B. R., An, S. S. (2018). Ecological stoichiometry in leaves, roots, litters and soil among different plant communities in a desertified region of northern China. Catena 166, 328–338. doi: 10.1016/j.catena.2018.04.018
Ye, T., Wu, G. L., Zhang, Y. M., Zhou, X. B. (2016). Leaf n and p stoichiometry of 57 plant species in the karamori mountain ungulate nature reserve, xinjiang, China. J. Arid Land 8, 935–947.
Yu, H. L., Fan, J. W., Harris, W., Li, Y. Z. (2017b). Relationships between below-ground biomass and foliar N:P stoichiometry along climatic and altitudinal gradients of the Chinese grassland transect. Plant Ecol. 218, 661–671. doi: 10.1007/s11258-017-0719-9
Yu, H. L., Fan, J. W., Li, Y. Z. (2017a). Foliar carbon, nitrogen, and phosphorus stoichiometry in a grassland ecosystem along the Chinese grassland transect. Acta Ecol. Sin. 37, 133–139. doi: 10.1016/j.chnaes.2017.06.005
Yue, K., Fornara, D. A., Yang, W., Peng, Y., Li, Z., Wu, F., et al. (2017). Effects of three global change drivers on terrestrial C:N:P stoichiometry: a global synthesis. Glob. Chang. Biol. 23, 2450–2463. doi: 10.1111/gcb.13569
Zhang, H., Guo, W. H., Yu, M. K., Wang, G. G., Wu, T. G. (2018). Latitudinal patterns of leaf n, p stoichiometry and nutrient resorption of metasequoia glyptostroboides along the eastern coastline of China. Sci. Total Environ. 618, 1–6. doi: 10.1016/j.scitotenv.2017.11.030
Zhang, K., Li, M., Su, Y., Yang, R. (2020). Stoichiometry of leaf carbon, nitrogen, and phosphorus along a geographic, climatic, and soil gradients in temperate desert of hexi corridor, northwest China. J. Plant Ecol. 13, 114–121. doi: 10.1093/jpe/rtz045
Zhang, J., Li, M., Xu, L., Zhu, J., Dai, G., He, N. (2021). C: N: P stoichiometry in terrestrial ecosystems in China. Sci. Total Environ. 795, 148849. doi: 10.1016/j.scitotenv.2021.148849
Zhao, W. Q., Reich, P. B., Yu, Q. N., Zhao, N., Yin, C. Y., Zhao, C. Z., et al. (2018). Shrub type dominates the vertical distribution of leaf c: N : P stoichiometry across an extensive altitudinal gradient. Biogeosciences 15, 2033–2053. doi: 10.5194/bg-15-2033-2018
Zhou, T. C., Sun, J., Liu, M., Shi, P. L., Zhang, X. B., Sun, W., et al. (2020). Coupling between plant nitrogen and phosphorus along water and heat gradients in alpine grassland[J]. Sci. Total Environ. 701, 134660. doi: 10.1016/j.scitotenv.2019.134660
Zhu, D., Hui, D., Wang, M., Yang, Q., Yu, S. (2020). Light and competition alter leaf stoichiometry of introduced species and native mangrove species. Sci. Total Environ. 738, 140301. doi: 10.1016/j.scitotenv.2020.140301
Comparison of foliar N and P concentrations at family level.
The correlation between foliar N and P in different ecosystems (A: AM ecosystem; B: AS ecosystem; C: DS ecosystem; D: all sample).
Keywords: C, N, and P stoichiometry, plant and soil, grassland type, influence factors, North Tibetan Plateau
Citation: Wang W, Zhao J, Xing Z and Wang X (2023) Characteristics and drivers of plant C, N, and P stoichiometry in Northern Tibetan Plateau grassland. Front. Plant Sci. 14:1092872. doi: 10.3389/fpls.2023.1092872
Received: 08 November 2022; Accepted: 14 March 2023;
Published: 06 April 2023.
Edited by:
Shiliang Liu, Beijing Normal University, ChinaReviewed by:
Miao Liu, China Agricultural University, ChinaCopyright © 2023 Wang, Zhao, Xing and Wang. This is an open-access article distributed under the terms of the Creative Commons Attribution License (CC BY). The use, distribution or reproduction in other forums is permitted, provided the original author(s) and the copyright owner(s) are credited and that the original publication in this journal is cited, in accordance with accepted academic practice. No use, distribution or reproduction is permitted which does not comply with these terms.
*Correspondence: Wei Wang, eHp3YW5nd2VpQHh6YS5lZHUuY24=
Disclaimer: All claims expressed in this article are solely those of the authors and do not necessarily represent those of their affiliated organizations, or those of the publisher, the editors and the reviewers. Any product that may be evaluated in this article or claim that may be made by its manufacturer is not guaranteed or endorsed by the publisher.
Research integrity at Frontiers
Learn more about the work of our research integrity team to safeguard the quality of each article we publish.