
94% of researchers rate our articles as excellent or good
Learn more about the work of our research integrity team to safeguard the quality of each article we publish.
Find out more
ORIGINAL RESEARCH article
Front. Plant Sci. , 09 March 2023
Sec. Plant Abiotic Stress
Volume 14 - 2023 | https://doi.org/10.3389/fpls.2023.1091644
This article is part of the Research Topic Light, Clock, Flowering, and Hormone Pathways in Attaining Abiotic Stress Tolerance View all 6 articles
 Alena Patnaik1,2
 Aman Kumar1,2Anshuman Behera1,2
 Gayatri Mishra1†Subrat Kumar Dehery3
 Madhusmita Panigrahy1,2Anath Bandhu Das3
 Kishore C. S. Panigrahi1,2*†
GIGANTEA (GI) is a plant-specific nuclear protein that plays a pleiotropic role in the growth and development of plants. GI’s involvement in circadian clock function, flowering time regulation, and various types of abiotic stress tolerance has been well documented in recent years. Here, the role of GI in response to Fusarium oxysporum (F. oxysporum) infection is investigated at the molecular level comparing Col-0 WT with the gi-100 mutant in Arabidopsis thaliana. Disease progression, photosynthetic parameters, and comparative anatomy confirmed that the spread and damage caused by pathogen infection were less severe in gi-100 than in Col-0 WT plants. F. oxysporum infection induces a remarkable accumulation of GI protein. Our report showed that it is not involved in flowering time regulation during F. oxysporum infection. Estimation of defense hormone after infection showed that jasmonic acid (JA) level is higher and salicylic acid (SA) level is lower in gi-100 compared to Col-0 WT. Here, we show that the relative transcript expression of CORONATINE INSENSITIVE1 (COI1) and PLANT DEFENSIN1.2 (PDF1.2) as a marker of the JA pathway is significantly higher while ISOCHORISMATE SYNTHASE1 (ICS1) and NON-EXPRESSOR OF PATHOGENESIS-RELATED GENES1 (NPR1), the markers of the SA pathway, are downregulated in the gi-100 mutants compared to Col-0 plants. The present study convincingly suggests that the GI module promotes susceptibility to F. oxysporum infection by inducing the SA pathway and inhibiting JA signaling in A. thaliana.
The transition from a vegetative to a reproductive phase in plants is influenced by several factors including light, temperature, age, and hormones. Photoperiodic flowering occurs when this transition is influenced by light and fine-tuned by diurnal and circadian regulatory mechanisms (de Montaigu et al., 2010; Sanchez and Kay, 2016). GIGANTEA (GI) is one of the crucial circadian clock output components in plants (Fowler et al., 1999; Kim et al., 2013). GI gene was first discovered in Arabidopsis because mutations in it delayed flowering response to inductive photoperiods with little variation in short days (SDs) (Rédei, 1962; Fowler et al., 1999). In Arabidopsis thaliana, a single copy of GI contains 14 exons that code for a 127-kDa protein with 1,173 amino acids (Park et al., 1999). GI is reported to be a nuclear protein with a nuclear localization sequence between residues 543 and 783 in the core 241-amino-acid region (Huq et al., 2000). GI structural homology reveals that it lacks any conserved protein domains (David et al., 2006; Mishra and Panigrahi, 2015). GI is diurnally regulated, and its transcript and protein levels are strictly controlled by the circadian clock (Patnaik et al., 2022). Any change in the components of the circadian clock has been demonstrated to alter the transcription of GI. Furthermore, despite overexpressing the GI protein with a constitutive promoter, its abundance follows a cyclic pattern of aggregation under long days (LDs) and SDs, indicating an additional layer of regulation on the protein expression at the post-transcriptional level (David et al., 2006; Yu et al., 2008). The ubiquitin E3 ligase activity of CONSTITUTIVE PHOTOMORPHOGENIC 1 (COP1) controls the post-transcriptional regulation of the GI protein, which leads to its degradation by the 26S proteasome machinery.
In vascular plants, GI is evolutionarily conserved and plays an important role in a variety of physiological responses. The role of GI in photoperiodic flowering has been thoroughly studied, where it is required to increase the transcription of CONSTANS (CO) and FLOWERING LOCUS T (FT) (Fornara et al., 2009). The degradation of repressors from the DOF family of transcriptional regulators, known as CYCLING DOF FACTORS (CDFs), is necessary for the stimulation of CO and FT expression under LD conditions. In the afternoon, GI forms a complex with the blue light-absorbing FLAVIN-BINDING KELCH REPEAT F-BOX 1 (FKF1), an F-box protein, which degrades the DOF transcriptional repressors, allowing CO transcription leading to flowering under LD conditions (Imaizumi et al., 2005; Sawa et al., 2007; Kim et al., 2013). Other blue light circadian photoreceptors like LOV KELCH protein 2 (LKP2) and ZEITLUPE (ZTL) interact and stabilize GI (Kim et al., 2007). This regulates the appropriate development and resilience of the circadian clock in plants (Somers et al., 2000; Kim et al., 2007; Fornara et al., 2009; Baudry et al., 2010). In recent times, GI has been shown to act as a co-chaperone in A. thaliana’s circadian clock, facilitating the maturation of ZTL (Cha et al., 2017).
Different abiotic stresses, such as cold, drought, salt, and oxidative stress, are regulated by GI in the plants. The level of GI transcript is increased during cold stress, inducing cold acclimation in A. thaliana via a C-repeat binding protein (CBF)-independent route (Fowler and Thomashow, 2002). In contrast, another finding states that cold responsive gene (COR) mRNA expression is higher in gi mutants than in Col–0 WT, and this is likely to be responsible for promoting freezing tolerance in gi mutant plants, implying an additional overlay in regulating transcription of the cold response pathway in gi mutant plants (Fornara et al., 2015). GI is shown to play a crucial role in drought tolerance too. Drought resistance is improved by GI via the abscisic acid (ABA)-dependent drought escape mechanism (Riboni et al., 2013) besides its inhibitory role in salinity stress tolerance. It inhibits Salt Overly Sensitive (SOS1) and Na+/H+ anti-porter channels by binding directly to SOS2. Furthermore, while salt stress has no effect on GI transcription, it reduces the protein stability (Kim et al., 2013). When it comes to oxidative stress tolerance, the GI functions as an inhibitor (Riboni et al., 2013). The absence of GI promotes the constitutive production of SUPEROXIDE DISMUTASE (SOD) and ASCORBATE PEROXIDASE (APX) genes, and therefore, gi mutants are resistant to oxidative stress caused by H2O2 (Riboni et al., 2013). Although gi mutants have been reported to provide resistance to Fusarium oxysporum (F. oxysporum) infection compared to wild-type plants in A. thaliana , the molecular mechanism is still unknown.
F. oxysporum is a soil-borne hemi-biotrophic fungal pathogen, which is the causative pathogen for vascular wilt disease in plants (Michielse and Rep, 2009; Lyons et al., 2015a). It begins its disease cycle as a biotroph, infecting the root system, which gradually spreads up to the vasculature, where it secretes phototoxic chemicals, causing wilting. This necrotrophic pathogen eventually causes necrosis, plant senescence, and death (Czymmek et al., 2007; Cole et al., 2014; Lyons et al., 2015a). To combat pathogen invasion, plants use a variety of defense mechanisms. The host response to Fusarium infection has been found to be regulated by ABA, ethylene, and auxin that improve vulnerability to this disease, while gibberellic acid (GA) was thought to influence jasmonic acid (JA)/salicylic acid (SA) signaling (Anderson et al., 2004; Kidd et al., 2011; Pantelides et al., 2013). In A. thaliana, the jasmonate (JA) signaling pathway contributes both positively and negatively to resistance against F. oxysporum. JA receptor mutants like coi1 have evoked resistance to F. oxysporum (Thatcher et al., 2009), but bioactive jasmonates produced during infection have been found to cause senescence of the host (Cole et al., 2014). SA improves resistance to F. oxysporum during the biotrophic phase of infection (Edgar et al., 2006; Cole et al., 2014). SA-deficient sid2 mutant is more susceptible to Fusarium wilt than the WT (Diener and Ausubel, 2005). Late-flowering mutants, such as gi-1, mediator 8 (med8), phytochrome and flowering time1 (pft1), auxin response factor 2 (arf2), and myc2, have also been found to promote resistance to F. oxysporum in plants (Kidd et al., 2009; Gangappa and Chattopadhyay, 2010; Lyons et al., 2015a; Lyons et al., 2015b), implying a role of flowering genes in modulating the defense pathways in plants. Despite plenty of studies that describe possible functions of GI in abiotic stress response, little is known about its involvement in biotic stress tolerance (Lyons et al., 2015a; Kundu and Sahu, 2021; Singh, 2022).
Biotic stress is also reported to be important in modulating the flowering transition (Kazan and Lyons, 2016), pointing to a possible link between GI and biotic stress tolerance. Thus, exploration on the role of GI on disease defense mechanism of plant is very important in global climate changing scenario. We demonstrated the role of GI in F. oxysporum induced biotic stress tolerance of A. thaliana through transcript expression analysis of JA and SA pathway genes in gi-100 mutants besides confocal microscopy of root cortical cell morphology, stomatal anomalies during fungal progression, disease severity, PS II activity changes in relation to Chl a fluorescence, and thermal imaging of internal leaf temperature behaviors in the presence and absence of GI.
The seeds of A. thaliana Columbia 0 (Col-0) ecotype, mutant, and overexpressor lines of GI, i.e., gi-100, gi-1, GI::GI-TAP, and 35S::GI (Berns et al., 2014), respectively, were vernalized at 4°C for 48 h in pots containing soil followed by growth under white light in controlled plant growth chambers (Model No-AR36, Percival, USA) until the end of the experiment. As all the genotypes used in this study vary substantially in their growth, morphology, and flowering time (Mishra and Panigrahi, 2015), an initial growth period of 15 days under LD conditions (i.e., 16 h light and 8 h dark, 22°C) was adapted (Figure 1A) to obtain a synchronized growth morphology among them with comparable number of rosette leaves (Figure 1B, upper panel) before fungal inoculation. On day 16, plants were shifted to SD conditions (8 h light and 16 h dark, 22°C) and all the sampling as well as experiments were done under SD conditions to focus the study mainly in the vegetative stage of the plant (Figure 1A). An entrainment period of 5 days was imposed immediately after shifting the plants to SD before the fungal inoculation on 20 days. At the time of infection, all the three genotypes (Col-0, gi-100, and gi-1) had nearly 14 ± 2 rosette leaves (Figure 1B).
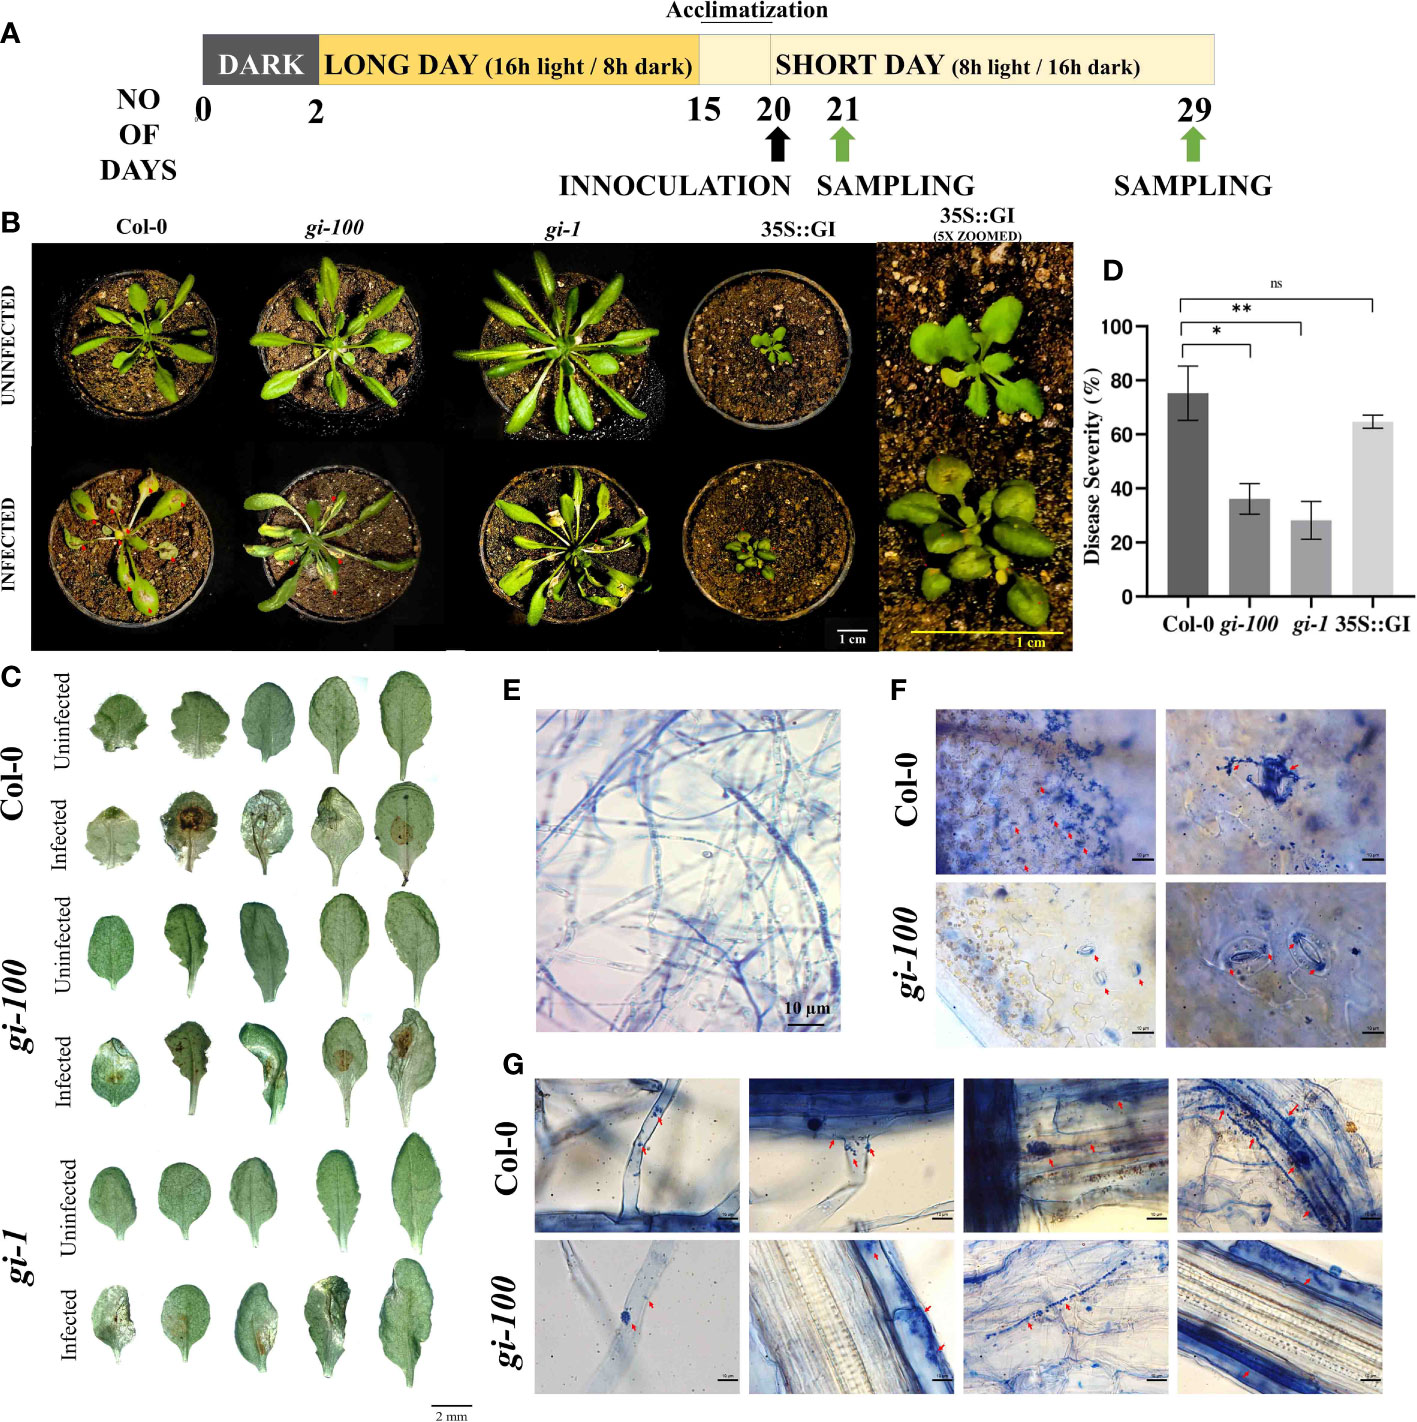
Figure 1 Effect of F. oxysporum infection on GIGANTEA (GI) in Arabidopsis thaliana. (A) Schematic representation of light treatment, plant growth conditions, and sample harvest. (B) Plant in pots infected with wilt disease caused by F. oxysporum. Columbia-0 (Col-0), gigantea mutant (gi-100, gi-1), and overexpressed GI (35S::GI) plants after 9 and 5 days post inoculation (DPI), respectively. (C) Leaf morphology of Col-0, gi-100, and gi-1 mutant plants after 9 DPI infected with F. oxysporum. The leaves of infected and uninfected plants were excised 9 DPI and were photographed using a Carl Zeiss stereo microscope. (D) Disease progression after F. oxysporum inoculation in Col-0 and gi-100 was interpreted as in disease severity percentage (area in square meters of necrosis). The disease severity was analyzed using ImageJ software as described in Materials and methods. (E) Viability of fungal hyphae of F. oxysporum was reclaimed by staining with trypan blue before infection. (F) Fungal invasion in Col-0 and gi-100 stained with trypan blue in leaf mesophyll cells in the upper row and lower row, respectively. Magnification is indicated on the top right of each figure. (G) Progression of fugal hyphae from lateral hair cells to tap root cells (left to right) in Col-0: upper row and gi-100: lower row visualized at 100×. Data presented as mean ± SE. Student’s paired t-test was used to evaluate significant differences and compared between Col-0 and gi-100 plants. *p < 0.05, **p < 0.01, ns, Non-significant.
The pure culture of F. oxysporum was taken by aseptically punching out 5 mm of F. oxysporum fungal colony from stock. It was allowed to grow for 15 days in a 250-ml conical flask containing 100 ml of potato dextrose broth (PDB) along with the inoculum, in a shaker maintained at 25°C and 60 rpm (Patnaik et al., 2022). After the incubation period, the culture and the fungal mycelia were separated using a sterile nylon cloth, and the density of the conidial suspension was counted using a hemocytometer until it reached a concentration of ~ 6.5 ×10⁶ spores/ml. Few drops of this suspension culture were taken and stained with trypan blue solution to ensure the viability and to visualize the structure of fungal hyphae (Figure 1E).
Three-week-old plants were infected with the F. oxysporum culture either at the roots by dropping ~200 µl of the conidial suspension in pots or ~10 µl of inoculum on the adaxial surface of the leaves at dawn. Plants with a similar amount of PDB medium without fungal culture was used as the control. To better ensure the pathogenicity, the infection was induced both in the root and leaves of the plant. A similar method of leaf infection caused by F. oxysporum has already been reported in Wang et al. (2021). Incidences of the spread of the disease as necrotic lesions were first observed on the fifth day of infection (data not shown). Leaves from infected and uninfected plants were sampled 24 hours post infection (HPI) and 9 days post infection (DPI) at ZT-0, as many defense-related genes were highly induced at dawn (de Leone et al., 2020). The experiments were repeated three times with similar results.
The leaves of the infected and uninfected plants after 9 DPI were studied using a Carl Zeiss stereo microscope (Model number: Stereo Discovery. V20) equipped with 5.8× magnification and an Axiocam 305 camera to obtain the total area of infection. Disease severity percentage was calculated using ImageJ (version: ImageJ 1.53a). Ten different morphologically similar leaves were chosen from six plants of each category to analyze the disease severity. The experiment was repeated three individual times.
Plant tissues (roots and leaves) were snap frozen with liquid nitrogen and immediately stored at −80°C until further use. Total RNA was extracted from ~500 mg of plant samples using the RNeasy Plant Mini Kit (supplied by Qiagen, Cat #74136). One microgram of total RNA was used to obtain cDNA using Reverse Transcription Super-mix (supplied by Bio-Rad, Cat #1708840). For relative transcript levels, quantitative RT-PCR (qRT-PCR) was carried out using the Bio-Rad laboratories’ CFX384 Touch™ Real-time detection system, following the manufacturer’s instructions and iTaq™ universal SYBR green super mix as done previously (Kumar, 2021). Primer Quest tool (Integrated DNA Technologies, Inc., USA) was used to design gene-specific primers used in qRT-PCR (Table S1). All reactions were carried out in hardshell 384-well PCR plates (supplied by Bio-Rad, Cat #HSP3805). ACTIN was used to normalize transcript levels. Absolute expression is calculated according to the 2–ΔΔCt method (Pfaffl, 2001). The qRT-PCR reactions were done in triplicate from three biological replicates. Data are presented as the mean ± SEM.
For western blot analysis, the leaf samples of the GI::GI-TAP line were collected after 24 HPI at ZT-8 of the photoperiod. The GI::GI-TAP transgenic line has an endogenous GI promoter tagged with a Tandem Affinity Purification reporter (David et al., 2006). For the detection of the GI protein, the above-mentioned line was taken instead of Col-0, as GI protein levels at ZT-8 under SD conditions in Col-0 were barely detectable. The leaves were crushed in a mortar and pestle using liquid nitrogen. Total protein was extracted from 100 mg of leaf sample using the protocol according to Khaleda et al. (2017). and further used for quantification, SDS-PAGE, and western blotting. The quantification of the protein was done by amido black assay (Panigrahy, 2004). SDS denaturing 8% gels were prepared according to Panigrahy (2004). Nearly 25 µg of protein for each sample was loaded in acrylamide gels and run for approximately 2.5 h at 80 V until the protein ladder was completely separated followed by transferring onto PVDF membranes (Immobilon-P; EMD Millipore) for Western blotting using the semi-dry transfer system (Bio-Rad, model #1703940). The membrane was blotted against anti-GI monoclonal primary antibody (unpublished data) overnight at 4°C followed by incubation with secondary antibody anti-rabbit polyclonal HRP (supplied by Sigma Aldrich, Cat #A0545-1ML) for 2 h at room temperature. Detection was done using ECL substrate reagent (supplied by Bio-Rad, Cat #1705060). ImageJ software was used for densitometric quantification of Western blot and normalization with the loading controls against Coomassie brilliant blue staining. The experiment was reproduced thrice with biological replicates.
Leaves were fixed with FAA (formalin–acetic–alcohol) substituted with methanol (45% methanol, 10% formaldehyde, 5% glacial acetic acid, and 40% distilled water) using a portable vacuum pump for 15–20 min. During the initial 15 min of fixation, the vacuum was drawn and released several times to properly preserve the cell organelles. Roots were incubated at 96°C for 1 min in 10% (w/v) KOH (Banhara et al., 2015; Mishra et al., 2018). Roots were stained with propidium iodide (PI) (1:1,000 v/v phosphate buffer). The plant tissues were incubated with 10% KOH for 30 min followed by 15 min incubation with alkaline H2O2. The tissues were then exposed to 2% HCl for 2 min. Trypan blue (0.1%) was used to visualize root cell wall morphology after fungal invasion. Fluorescent DNA stains such as DAPI (4′,6-diamidino-2-phenylindole) (1:1,000 v/v phosphate buffer) and acridine orange (0.1%) were used for staining the viable nuclei of stomatal guard cells.
A phase contrast microscope (Model #59556, Nikon, Japan) equipped with a digital sight DS-Fi1 camera (Nikon) was used for imaging. For confocal microscopy, a confocal microscope system (Leica SP8, Leica Application Suite*3.5.5.19976) operating on an inverted microscope (DMI8), equipped with 63× NA 1.3 glycerol immersion lenses (Leica, Wetzlar, Germany), was used for imaging. High-resolution Z stack images were recorded with fourfold line averaging and a 1.00-μm step size. Along with concurrent transmitted light images, fluorescence images were collected from 420–500, 500–550, and 620–650 nm using excitation at 405, 488, and 552 nm, respectively. All image series were captured with the same imaging conditions. Image intensities were quantified from image stacks in ImageJ (FIJI installation of version 1.47v, National Institute of Health, Bethesda, MD, USA). Images were prepared according to standard brightness and contrast settings in Photoshop (version CS4, Adobe Systems, San Jose, CA, USA) and ImageJ.
The effect of F. oxysporum on photosynthetic electron transport in Col-0 and gi-100 mutant lines of A. thaliana was estimated through OJIP transient analysis to analyze the photosystem activities under stress conditions. The chlorophyll fluorescence was measured in the top 3rd leaf using a Multifunction Plant Efficiency Analyzer (M-PEA, Hansatech Instruments Ltd, UK). White actinic light of 3,000 μmol photons m−2 s−1 was used for the fluorescence induction, which was recorded at wavelengths of approximately 685 nm. The energy fluxes were calculated as per the equations of the JIP-test using Image Lab Biolyzer HP3 software. The plant leaves were allowed to acclimatize to dark conditions for at least 30 min before the fluorescence signal was measured. The measurements were taken in the middle of the upper surface of fully developed leaves. The translated values of biophysical parameters of OJIP transients like the quantum yields (φPo, φRo, φDo, and ψEo), specific activities per reaction center (ABS/RC, DIo/RC, Tro/RC, Eto/RC, and REo/RC), performance indexes (PIs), and structure–function indexes (VJ, SM, and N) were plotted based on Strasser et al. (2004). Abbreviations of the formulas used are compiled in Table S2. Measurements were done in at least 10 different plants for each treatment with three leaves from each plant. The OJIP curve was created using the mean values in each condition.
The uninfected and infected plants 9 DPI were used for studying the plant temperature. The plants were kept in a dark room keeping the FLUKE Infrared Camera (Model No: Ti450 PRO) equidistant, i.e., 40 cm away from the plants. The thermal images were analyzed using the SMART VIEW software version 4.8. Twenty different parts of the plant showing the highest temperature were specifically selected using the software, and the temperatures were noted. Temperatures from a minimum of 10 plants from each biological replicate were analyzed and averaged to generate leaf temperature data.
The plant leaf samples (~300 mg) were collected at 24 HPI using liquid nitrogen and grounded using tissue-lyser (Tissuelyser II manufactured by Retsch, Qiagen) and kept in a lyophilizer overnight. Defense phytohormones were estimated according to Vadassery et al. (2012) with some modifications. Briefly, lyophilized samples (~20 mg) were extracted in 1 ml of methanol containing 40 ng ml−1 of D6-JA (HPC Standards GmbH, Cunners dorf, Germany), 40 ng ml−1 of D4-SA, 40 ng ml−1 of D6-ABA, and 8 ng ml−1 of JA [13C6] isoleucine conjugate as internal standards. The homogenized samples were mixed in a shaker for 30 min and centrifuged at 14,000 rpm for 20 min at 4°C. The supernatants were collected, and the homogenates were again extracted with 500 µl of methanol and centrifuged. The supernatants were taken out and mixed with the previous extracts. All steps were performed at 4°C. The combined extracts were subjected to vacuum evaporation at ambient temperature and re-suspended in 500 µl of methanol. Samples were analyzed on an Exion LC (Sciex ®) UHPLC system using formic acid (0.05%) in water as mobile phase A and acetonitrile as mobile phase B. Separation was attained on a Zorbax Eclipse XDB-C 18 column (50 × 4.6 mm, 1.8 µm, Agilent) coupled with a triple Quadrupole-trap MS/MS system (Sciex 6500+) in negative ionization mode. The flow rate was 1 ml min−1 and the elution profile was as follows: 0–0.5 min: 5% B; 0.5–9.5 min: 5% to 42% B; 9.5–9.51 min: 42% to 100% B; 9.51–12 min: 100% B and 12.1–15 min: 5% B. Scheduled multiple-reaction monitoring (MRM) is used to precisely observe analyte parent ion → product ion with a detection window of 60 s according to Vadassery et al. (2012). Phytohormones were quantified relative to the signal of their corresponding internal standard’s concentrations.
All the statistical analyses used in this study were performed using GraphPad Prism version 8.0.1. For the test of significant differences, two-way ANOVA with multiple comparison (Tukey and Sidak) and Student’s unpaired t-test were used to analyze grouped column graphs. Error bars represent the standard error of the mean (SEM).
The report of GI’s involvement in susceptibility of Arabidopsis to the hemi-biotrophic fungus Bipolaris sorokiniana (Kundu and Sahu, 2021) prompted us to investigate GI function in plant defense against other pathogens, particularly the soilborne fungus F. oxysporum, which infects Arabidopsis at the vegetative stage. In this study, the probable role of GI in plant defense during the Fusarium–Arabidopsis association was investigated using a T-DNA insertion mutant of GI, i.e., gi-100 (Huq et al., 2000).
At 9 DPI, the gi-100 mutant plants were found to be more resistant to wilt disease infection with greener and expanded leaves as compared to the Col-0 plants. The effect of F. oxysporum on another gi mutant such as gi-1 has been carried out and similar results were obtained. The plants showed disease resistivity upon F. oxysporum infection (Figure 1B), whereas the line overexpressing GI, i.e., 35S::GI, showed susceptibility to the wilt disease with less expanded and turgid leaves (Figure 1B). The disease severity percentage indicating the disease progression in the gi-100 and gi-1 mutants was significantly (p ≤ 0.05) slower than in the Col-0 plants, with the area of necrotic lesions (red arrows) in the Col-0 plants being significantly higher (nearly double) than in the gi-100 mutants after 9 DPI (Figures 1C, D). Following 9 DPI, necrosis was also apparent on the leaves of the gi-100, gi-1, and Col-0 plants. Hence, all further analyses were carried out with gi-100 plants. Trypan blue staining in leaf mesophyll cells of Col-0 (Figure 1F, upper panel) and gi-100 (Figure 1F, lower panel) showed that non-viable cells are significantly higher in Col-0 than in gi-100. Here, we showed that the invasion of this root-borne fungus even through the stomata confirmed the infection through leaf. The fungal progression in Col-0 (Figure 1G, upper panel, right to left) and gi-100 (Figure 1G, lower panel, right to left) roots from lateral root hair cells through the epidermal cells and tap root cells could visualize the gradual spread of the disease. These results clearly indicated that the progression of the disease was significantly less in gi-100 compared to wild type.
As the absence of GI affected the severity of wilt disease, the transcript abundance and protein accumulation of GI before and after F. oxysporum infection at 24 HPI were studied to investigate the scenario at the molecular level. After 24 HPI, nearly a twofold rise in the level of GI transcript was observed in Col-0 leaf samples (Figure 2A). For protein levels, GI::GI-TAP was used to mimic the GI levels in Col-0 WT. In the immunoblot analysis of GI at 24 HPI following F. oxysporum infection, the protein abundance of GI was nearly double that of the uninfected samples (Figures 2B, C). These results confirmed that F. oxysporum infection causes an increase in GI protein, which may lead to susceptibility in A. thaliana.
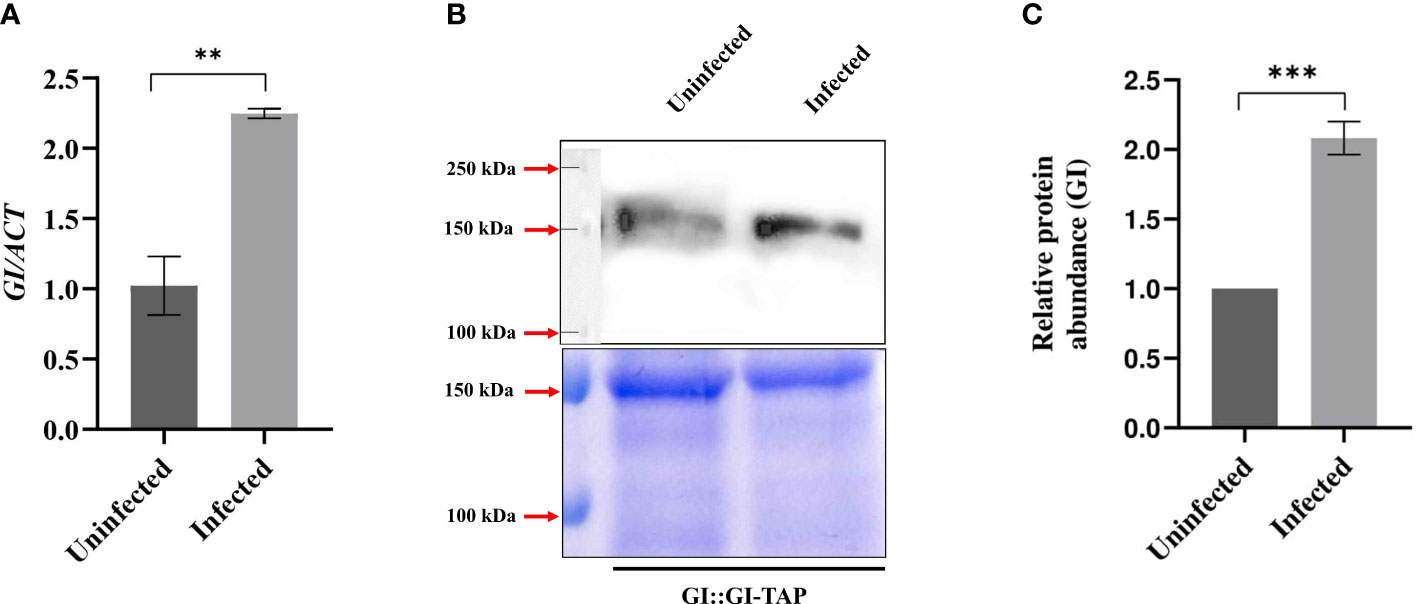
Figure 2 Transcript and protein levels of GIGANTEA after F. oxysporum infection. (A) Quantitative RT-PCR results showing GI transcript abundance in uninfected (0 HPI) and 24 HPI in Col-0 leaf samples. Transcript abundance in Col-0 uninfected at 24 HPI was taken as 1 to calculate the relative transcript level of GI. ACTIN was used to normalize transcript levels. (B) Immunoblot detection and (C) relative protein levels of GI in the uninfected and infected GI::GI-TAP leaf samples. (B) Bottom panels show SDS-PAGE stained with Coomassie brilliant blue (CBB). Top panel shows the PVDF membrane blotted against anti-GI monoclonal primary antibody raised in rabbit (unpublished data) and further incubated with secondary antibody anti-rabbit polyclonal HRP for 2 h at room temperature. Detection was done using ECL substrate. The corresponding loading control is shown by CBB-stained gel. (C) For relative protein levels, ImageJ software was used for densitometric quantification of Western blot and normalization with the loading controls against CBB staining. Calculations were done by taking protein abundance in uninfected conditions at 0 HPI as 100%. The qRT-PCR reactions were done in triplicate from three biological replicates. Data are presented as mean ± SE. To evaluate significant differences, Student’s unpaired t-test was used to compare between uninfected and infected Col-0 plants. **p < 0.01, ***p < 0.001.
As any kind of biotic or abiotic stress alters the flowering and reproductive ability of a plant, the flowering phenotype of Col-0 plants was studied with or without F. oxysporum infection. Flowering time is reciprocally related with the total number of rosette leaves in A. thaliana (Mishra and Panigrahi, 2015). Moreover, GI has been demonstrated to control and regulate photoperiodic flowering in A. thaliana by upregulating the expression of FT gene (Wang et al., 2011). Col-0 plants flower with ~17 ± 2 leaves at the time of bolting (Figures 3A–C). Col-0 plants could not survive the infection with 70% lethality by 15 DPI. However, the Col-0 plants that could survive showed early flowering phenotype with ~12 ± 3 leaves at the time of bolting (Figures 3A–C). The uninfected gi-100 plants show delayed flowering with 50 ± 2 rosette leaves at the time bolting. Even in the gi-100 plants, F. oxysporum infection induced 30% lethality. However, in gi-100-infected plants, the flowering time was unaltered with similar number of rosette leaves as compared to their respective uninfected plants. These results indicated that during F. oxysporum infection, GI had minimal or no role in flowering time regulation. During plant–pathogen interactions, the expression of flowering regulatory genes including FLOWERING LOCUS T (FT) and FLC is known to be altered (Wang et al., 2011). Hence, the transcript expression of FT at 0 HPI and 24 HPI in Col-0 and gi-100 was studied using the qRT-PCR approach. After infection, FT expression in Col-0 plants suddenly increased to >2-fold at 24 HPI. The expression of FT in gi-100 was 0.79-fold lower than that of Col-0 plants under uninfected conditions (Figure 3D). At 24 HPI, the FT expression in gi-100 plants was further reduced to ~2.9-fold. Together, these results indicated that the flowering time phenotype in gi-100 might be regulated by several factors in addition to FT expression.
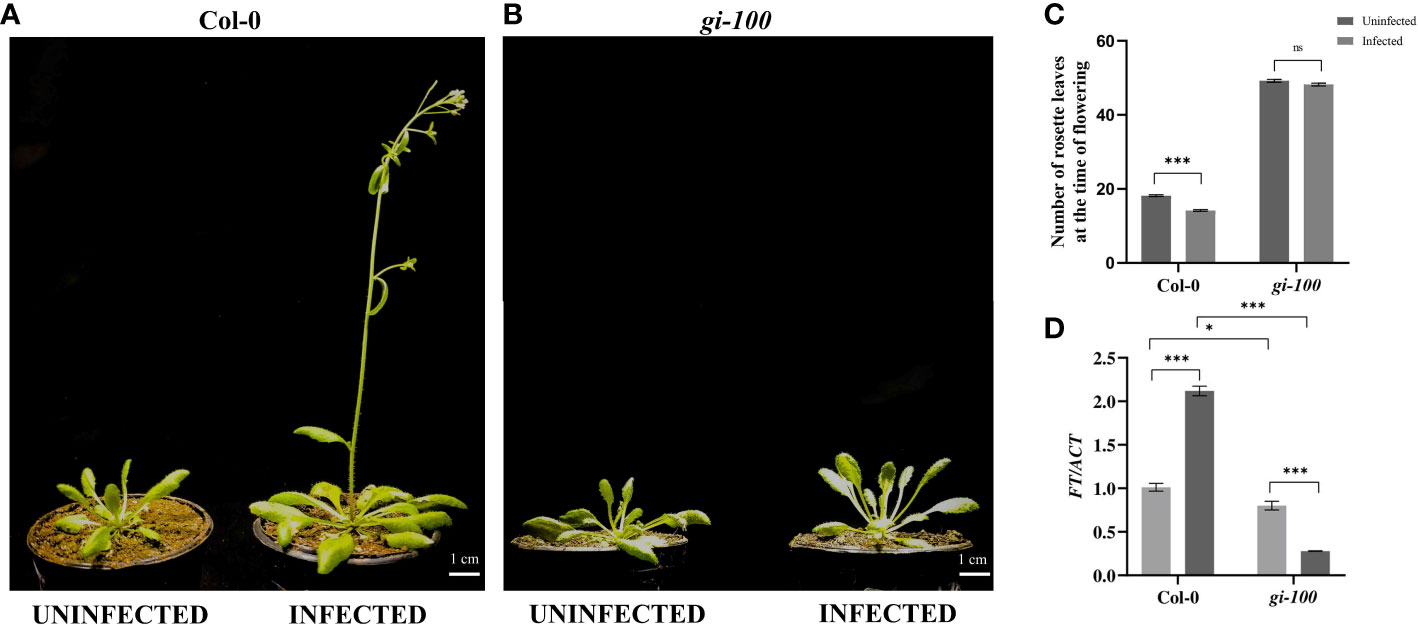
Figure 3 Analysis of flowering time phenotype in the F. oxysporum-infected Col-0 plants (A) Phenotype of 29-day mature Col-0 and (B) gi-100 plants that were infected with F. oxysporum (9 DPI) and uninfected plant as control. (C) Number of rosette leaves in Col-0 and gi-100 at the time of flowering. (D) Transcript expression analysis of FT gene using RT-qPCR after 24 HPI in Col-0 and gi-100. ACTIN was used to normalize transcript levels. The qRT-PCR reactions were done in triplicate from three biological replicates. Two-way analysis of variance (ANOVA) using Tukey’s multiple comparisons test was performed with the help of GraphPad Prism to test for significance among the dataset, *p < 0.05, ****p < 0.001. ns, Non-significant.
To understand the molecular basis of resistance of gi-100 plants to F. oxysporum infection, transcript expressions of genes of JA and SA signaling pathway were studied. JA and SA signaling are the primary respondents for conferring resistance to wilt disease during the biotrophic and necrotic phases of infection, respectively, with F. oxysporum (Edgar et al., 2006; Cole et al., 2014). Under uninfected conditions, the levels of ISOCHORISMATE SYNTHASE 1 (ICS1) are low in Col-0 whereas it was ~2.3-fold induced in gi mutants. While there was a negligible increase in the transcript levels of ICS1, the SA biosynthesis gene in Col-0 plants after 24 HPI, it was drastically down (~6-fold) in the gi-100 (Figure 4A) at the same time point. NON-EXPRESSOR OF PATHOGENESIS-RELATED GENES 1 (NPR1) is involved in SA-mediated growth regulation by controlling cell division and expansion (Vanacker et al., 2001; Ushio et al., 2020; Wang et al., 2020; Li et al., 2022). The transcript expression of NPR1 showed a ~0.6-fold increase in the Col-0 and a significant reduction of ~2-fold in the gi-100 plant samples with infection (Figure 4B). PATHOGEN RESPONSIVE GENE 1 (PR1) is a well-known pathogenesis-related protein family, and its accumulation is SA-dependent and linked to SAR (van Loon and van Strien, 1999; van Loon et al., 2006; Yang et al., 2018). In general, PR1 is associated with defense against biotrophs or hemi-biotrophs (Glazebrook, 2005; Yang et al., 2018). PATHOGEN RESPONSIVE GENE 1 (PR1) transcript levels were decreased to ~4-fold in Col-0 after F. oxysporum infection (Figure 4C). To identify the downstream regulatory components that might be involved in controlling the expression of PR1 upon Fusarium infection, the transcript accumulation of transcription factor TGACG SEQUENCE-SPECIFIC BINDING PROTEIN 2 (TGA2) was investigated. The endogenous levels of TGA2 in gi-100 were found to be ~7.3-fold less than that of the Col-0 plants under uninfected conditions. However, 24 HPI, TGA2 transcript expression levels reduced to 79% in the Col-0 samples. In contrast, in the gi-100 samples, it increased by ~1.8-fold of its corresponding starting amount (Figure 4D). These results indicated an opposite trend of gene regulation of TGA2 in the gi-100 as compared to the Col-0. PHYTOALEXIN DEFFICIENT 4 (PAD4) is an essential component in the modulation of phytoalexin biosynthesis in response to a range of bacterial and fungal diseases; hence, it is widely used to ameliorate plant resistance against pathogen infections (Cui et al., 2017). Similar to TGA2, the PAD4 endogenous transcript levels were also significantly less in the gi-100 plants before infection. While the PAD4 transcript levels increase to ~1.15-fold in Col-0 at 24 HPI, it showed a minimal decrease in the gi-100 leaves, nearly ~1-fold (Figure 4E). Thus, PAD4 regulation in gi-100 also seemed to be in contrast to that in Col-0. These results indicated that SA pathway genes were contrastingly regulated in the gi-100 samples post-infection as compared with their Col-0 counterparts. Moreover, the SA pathway was found to be positively regulated in gi-100 after infection. Quantification of SA hormone in gi-100 and Col-0 plants after 24 HPI was carried out to further investigate the basis of these results. The endogenous SA amount was found to be ~2.1-fold higher in the gi-100 plants compared to the Col-0 plants before infection. However, after F. oxysporum infection, while the SA amounts increased significantly to 0.5-fold in Col-0 plants, it was decreased to nearly half, i.e., ~2.2-fold, in the gi-100 plant samples (Figure 4F). These results further confirmed that GI positively regulates the SA pathway genes during response to F. oxysporum infection.
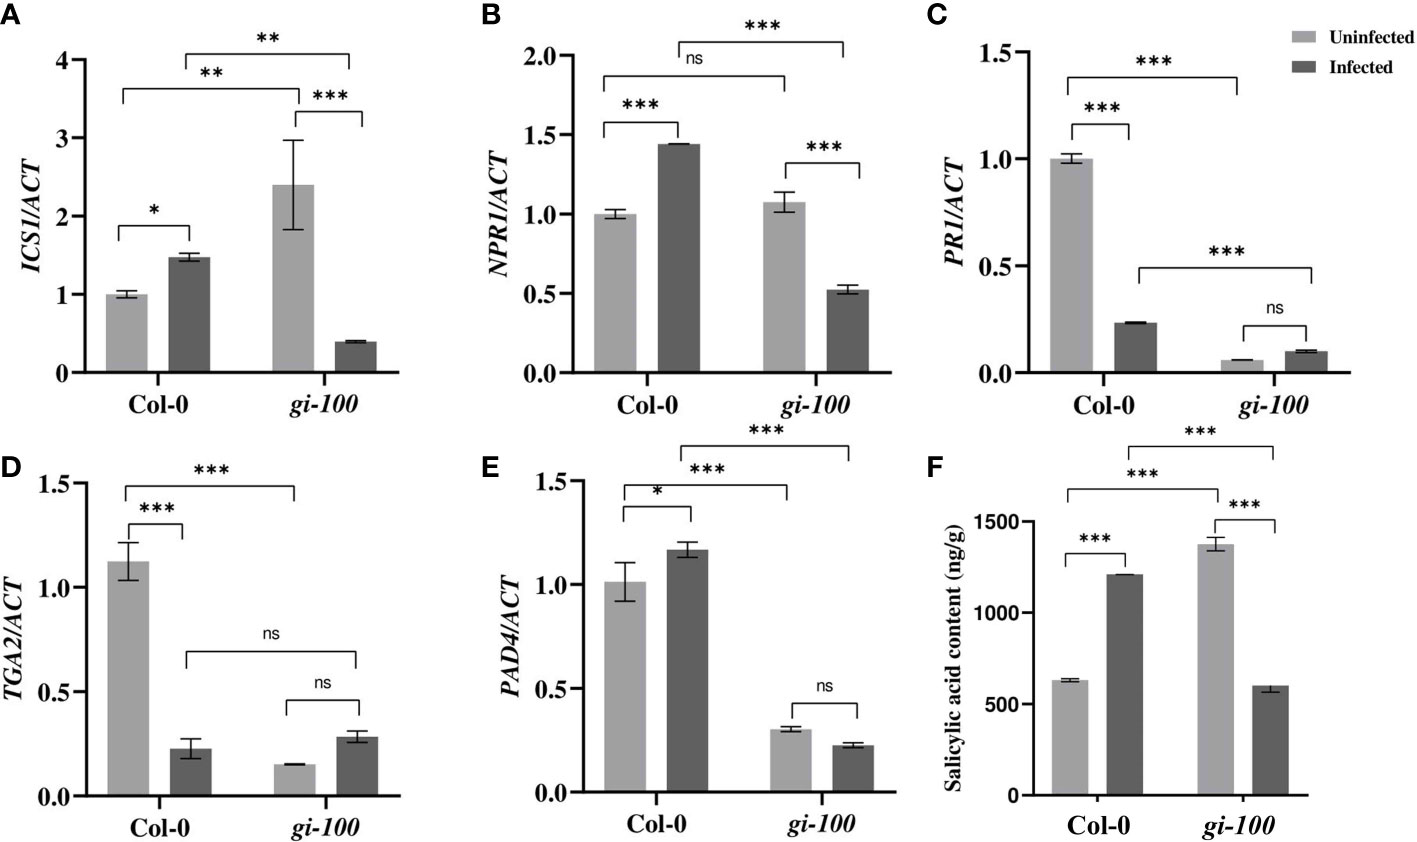
Figure 4 Involvement of the salicylic acid pathway during F. oxysporum infection in gi-100 plant infection. (A–E) Transcript expression validation using RT-qPCR and (F) quantitative profiling of salicylic acid amount at 24 DPI by F. oxysporum were done in gi-100 and Col-0 lines of A thaliana. (A) ISOCHORISMATE SYNTHASE 1 (ICS1), (B) NON-EXPRESSOR OF PATHOGENESIS-RELATED GENES 1 (NPR1), (C) PATHOGEN RESPONSIVE GENE 1 (PR1), (D) TGACG SEQUENCE-SPECIFIC BINDING PROTEIN 2 (TGA2), and (E) PAD4. ACTIN were used to normalize transcript levels. Determination of (F) salicylic acid (SA) amount. For SA quantification, D4-salicylic acid was taken as standard. Values are presented as mean ± SE. The qRT-PCR reactions were done in triplicate from three biological replicates. Two-way analysis of variance (ANOVA) using Sidak’s multiple comparisons test was performed with the help of GraphPad Prism to test for significance among the dataset, *p < 0.05. **p < 0.01, ***p < 0.001. ns, Non-significant.
Having known about regulation of the SA pathway genes, JA pathway genes were also investigated. CORONATINE INSENSITIVE 1 (COI1) act as a co-receptor in the perception of jasmonyl-(L)-isoleucine (JA-Ile) (Ruan et al., 2019). Though the amounts of JA were comparable between the Col-0 and gi-100 plants before infection, its regulation was the opposite 24 HPI. There was not much difference in the expression of COI1 in Col-0 samples; however, it showed a ~3.4-fold increase in gi-100 after infection (Figure 5A). The PLANT DEFENSIN1.2 (PDF1.2) is known as an important regulator of the JA signaling pathway (Ruan et al., 2019). Relative expression levels of PDF1.2 were significantly increased in both the Col-0 and gi-100 samples by ~10-fold and ~7-fold, respectively (Figure 5B), indicating a probable inhibition due to GI in the JA pathway. Further confirmation of the above results was done by quantification of JA and JA isoleucine (JA-ile) in gi-100 and Col-0 leaf samples 24 HPI. After F. oxysporum infection, both the JA and the JA-ile plant hormone amounts showed opposite trends in Col-0 compared to the gi-100 samples; i.e., while Col-0 samples showed ~4-fold and ~1.5-fold decrease, gi-100 samples had ~6.5 and ~2.3-fold increase, respectively (Figures 5C, D). These results confirmed that GI negatively regulates JA pathway genes to confer resistance against F. oxysporum infection.
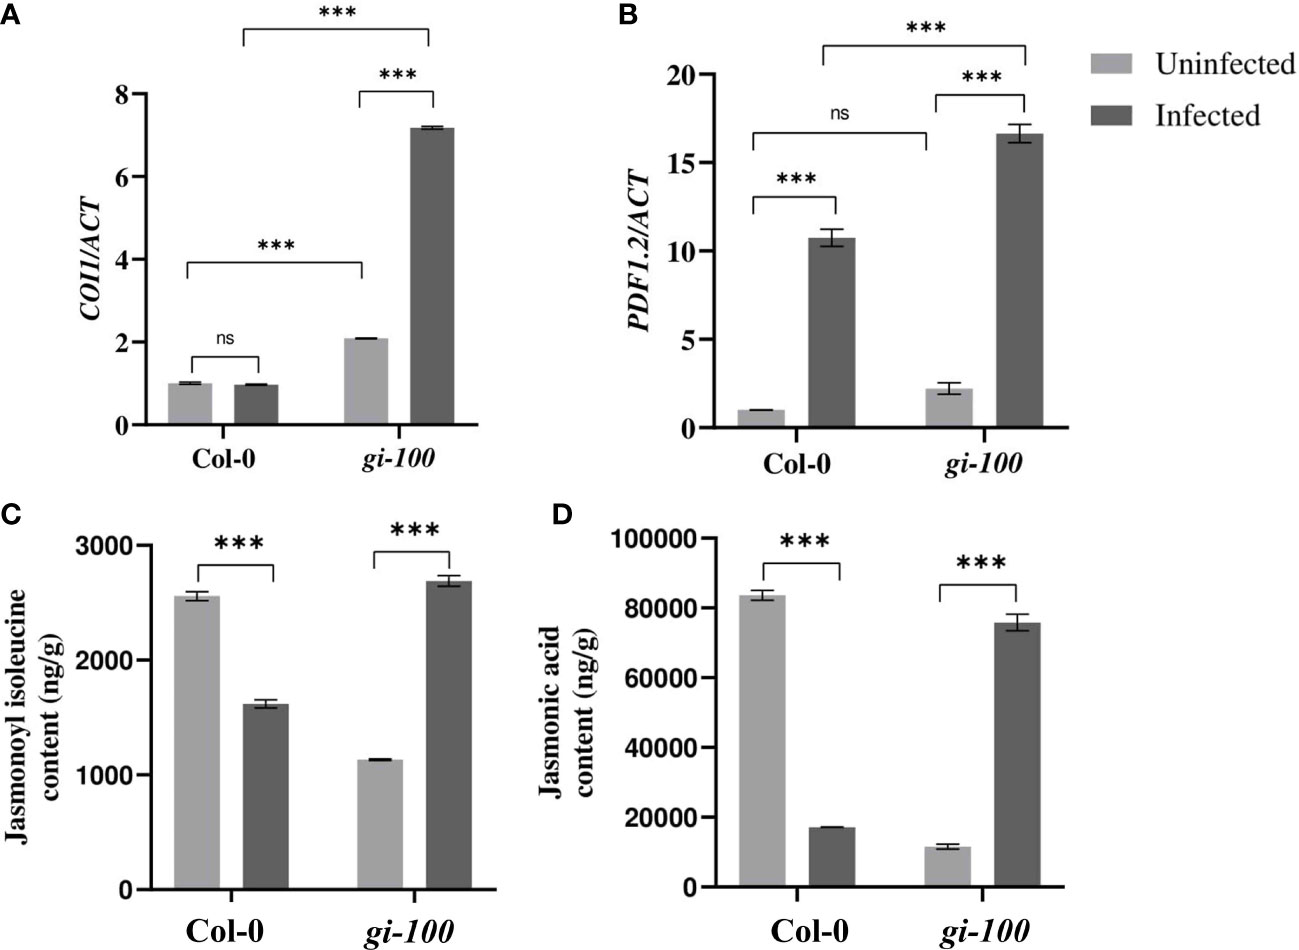
Figure 5 Involvement of the jasmonic acid pathway during F. oxysporum infection in gi-100 plants. (A, B) Transcript expression validation using RT-qPCR and (C, D) quantitative profiling of jasmonic acid and jasmonyl-(L)-isoleucine amount at 24 DPI by F. oxysporum were done in gi-100 and Col-0 leaf samples. (A, B) Relative transcript levels of (A) CORONATINE INSENSITIVE 1 (COI1) and (B) PLANT DEFENSIN1.2 (PDF1.2). ACTIN was used to normalize transcript levels. Determination of (C) jasmonic acid hormone and (D) jasmonyl-(L)-isoleucine JA-ile amounts. For JA and JA-ile quantification, D6-jasmonic acid and jasmonic acid-[13C6] isoleucine conjugate were taken as standard. The qRT-PCR reactions were done in triplicate from three biological replicates.Values are expressed as mean ± SD. Two-way analysis of variance (ANOVA) using Sidak’s multiple comparisons test was performed with the help of GraphPad Prism to test for significance among the dataset, ***p < 0.001. ns, Non-significant.
Moreover, it was also found that the ABA content was also ~1.6-fold higher in gi-100 plants than the minimal change observed in the Col-0 plants 24 HPI (Figure S2A). Oxylipins are a new class of signals that enhance virulence in plants under biotic stress tolerance (Reverberi et al., 2012). The endogenous oxylipin amount was less in the gi-100 samples before infection, but increased 24 HPI in both the Col-0 and gi-100 plant samples irrespective of the genotype (Figure S2B). This result suggested that gi-100 mutants were highly resistant to F. oxysporum infection, probably due to lower oxylipin synthesis in gi-100 mutants. The increase in oxylipin content in Col-0 plants suggests that having GI in the host increased vulnerability by increasing oxylipin content in plants following F. oxysporum infection.
To further investigate the extent of F. oxysporum infection under our experimental regime and to determine the changes caused by the pathogen infection and its colonization strategy, confocal microscopy was carried out in the root cells of Col-0 and gi-100 at 9 DPI. Roots inoculated with F. oxysporum strain revealed several deformities in the epidermal cell walls in both Col-0 and gi-100 both in confocal microscopy (Figures 6A, B, E, F) and after trypan blue staining (Figure S2). The damage in the epidermal root cells of gi mutants was least compared to Col-0 (Figures 6B, F). The root cap cells (columella cells, Wachsman et al., 2015) showed structural irregularities in cell shape of infected root tissues in both genotypes, which were fewer in gi-100 as compared to Col-0 (Figures 6C, D, G, H). These results indicated that the damage in the root cap cells induced by F. oxysporum infection was less in gi-100 plants than in Col-0 plants. This structural disorganization could be due to the mycotoxins produced by the fungus after infection (Perincherry et al., 2019).
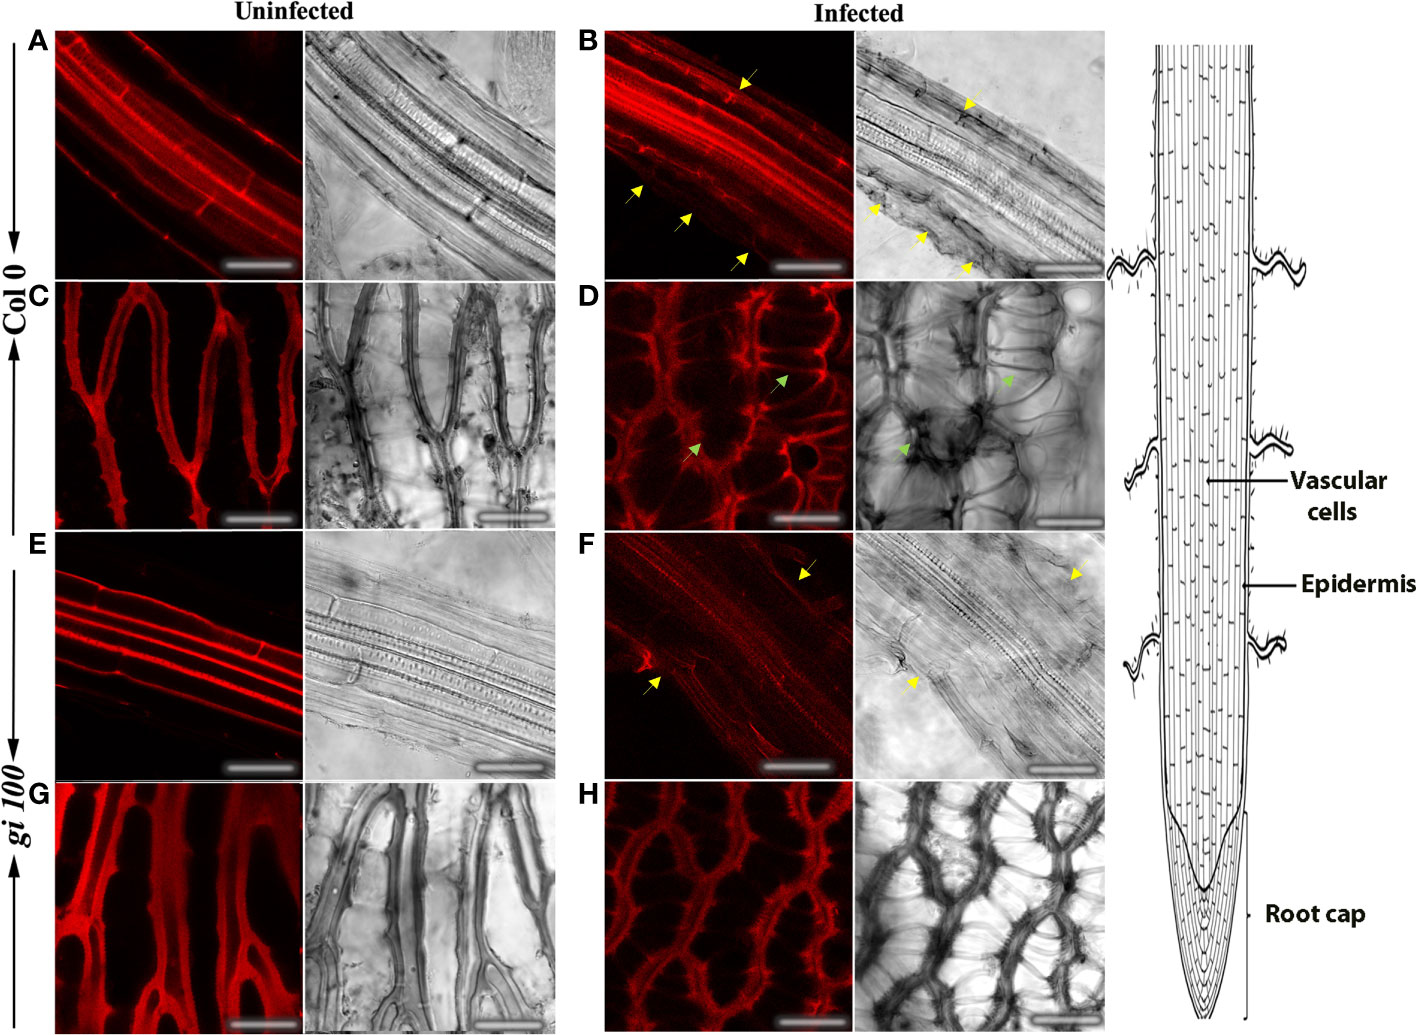
Figure 6 Effect of F. oxysporum infection on root cells in Arabidopsis thaliana using propidium iodide. Concurrent confocal fluorescence and transmitted light images of uninfected and infected roots from Col-0 (A–D) and gi-100 (E–H) at 9-DPI stained with propidium iodide. Epidermal cell wall showed structural deformities in infected Col-0 (B) and gi-100 (F) (yellow arrows). Columella cells showed structural irregularities in cell shape of infected Col-0 (green arrows in D). Scale bar, 100 μm.
Number of stomata was higher in the gi-100 than the Col-0 uninfected leaf cells. However, the stomatal density was reduced in cases of both Col-0 and gi-100 upon F. oxysporum infection (Figure 7). The structural changes in the cell wall of stomata guard cells and disintegration of nuclei were observed in the guard cell of Col-0-infected leaves as an indication of cell death (Figure 7). Nevertheless, intact guard cell with nuclei could be visualized in the gi-100-infected leaves (Figure 7). These observations in the stomatal guard cells were reclaimed with acridine orange staining, which stains the cell wall of stomatal guard cells (Figure S3).
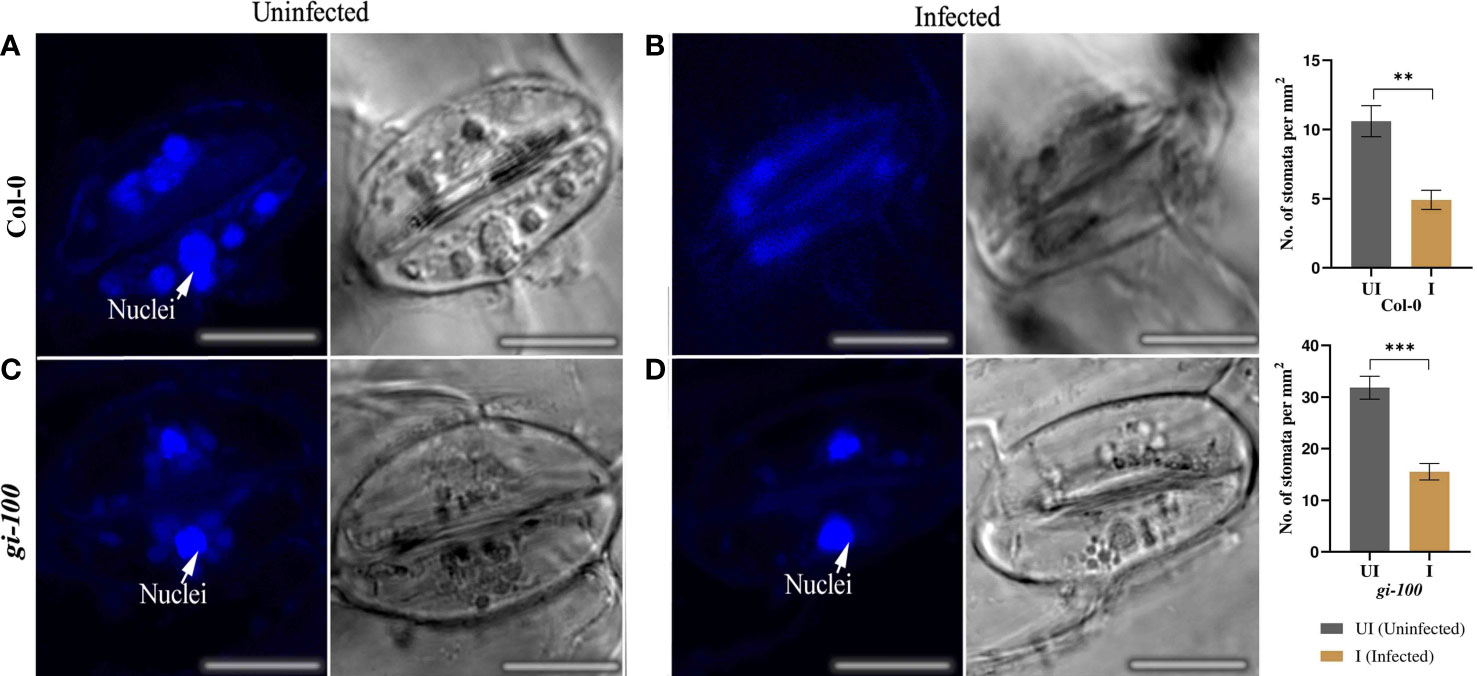
Figure 7 Effect of F. oxysporum infection on stomatal density and integrity in Col-0 and gi-100 plants. Concurrent confocal fluorescence and transmitted light images of uninfected (A, C) and infected (B, D) Arabidopsis leaves at 9 DPI and labeled with DAPI stain for visualizing the nuclei. Nuclei are marked with arrows. Number of stomata was counted from the images taken during microscopy and calculated per unit area. Scale bar, 100 µm. Values in the graphs are expressed as mean ± SE. Two-way analysis of variance (ANOVA) using Sidak’s multiple comparisons test was performed with the help of GraphPad Prism to test for significance among the dataset,**p < 0.01, ***p < 0.001.
To attain a deeper understanding of photosynthetic parameters, a Chl a fluorescent transient curve was generated from Col-0 and gi-100 lines, 24 HPI with F. oxysporum. In the J-I phase, a significant decrease was observed in infected Col-0 and gi-100 lines where Col-0 showed minimum fluorescent signals, which was also continued in the I-P phase. However, gi-100 showed a steady increase of Chl a fluorescence from J-P and reached the level of uninfected plants (Figure 8). Infection of plants with F. oxysporum significantly decreased Chl F levels at J-step (Vj) in Col-0 and gi-100 lines as compared to their respective control (untreated) but was slightly higher in gi-100 than in Col-0 plants. A significant increase of Chl F in I (Vi) with the infected gi-100 plants was recorded as compared to Col-0-infected plants at P (Vp) phases (Figure 8B).

Figure 8 Effect of F. oxysporum on Chl a fluorescence. Col-0 WT and gi-100 leaves were incubated at 24 DPI with the Multifunction Plant Efficiency Analyzer (M-PEA) (Hansatech Instruments Ltd, UK) for obtaining chlorophyll. (A) Fluorescence intensity on OJIP transient curve. (B) Spider plot for Col-0 and gi-100 lines of A. thaliana plants 24 DPI with F. oxysporum with their respective control. Values are expressed as mean ± SD. Two-way analysis of variance (ANOVA) using Sidak’s multiple comparisons test was performed with the help of GraphPad Prism. *p < 0.05. **p < 0.01, ns, Non-significant.
As phytochrome B has been shown to act as a thermosensor (Legris et al., 2016) and GI is involved in the phytochrome signaling responses (Huq et al., 2000), the involvement of GI in controlling a plant’s internal temperature was investigated and compared among the infected and uninfected plants to determine the effect of F. oxysporum infection (Figure 9). The average leaf temperature of gi-100 plants was ~1.1°C (p < 0.05) higher than that of Col-0 plants (Figure 9B). The average leaf temperature of both Col-0 and gi-100 plants decreased insignificantly due to F. oxysporum (Figure 9A). This result indicated that GI probably has a role in maintaining the lower internal temperature of Col-0 plants.
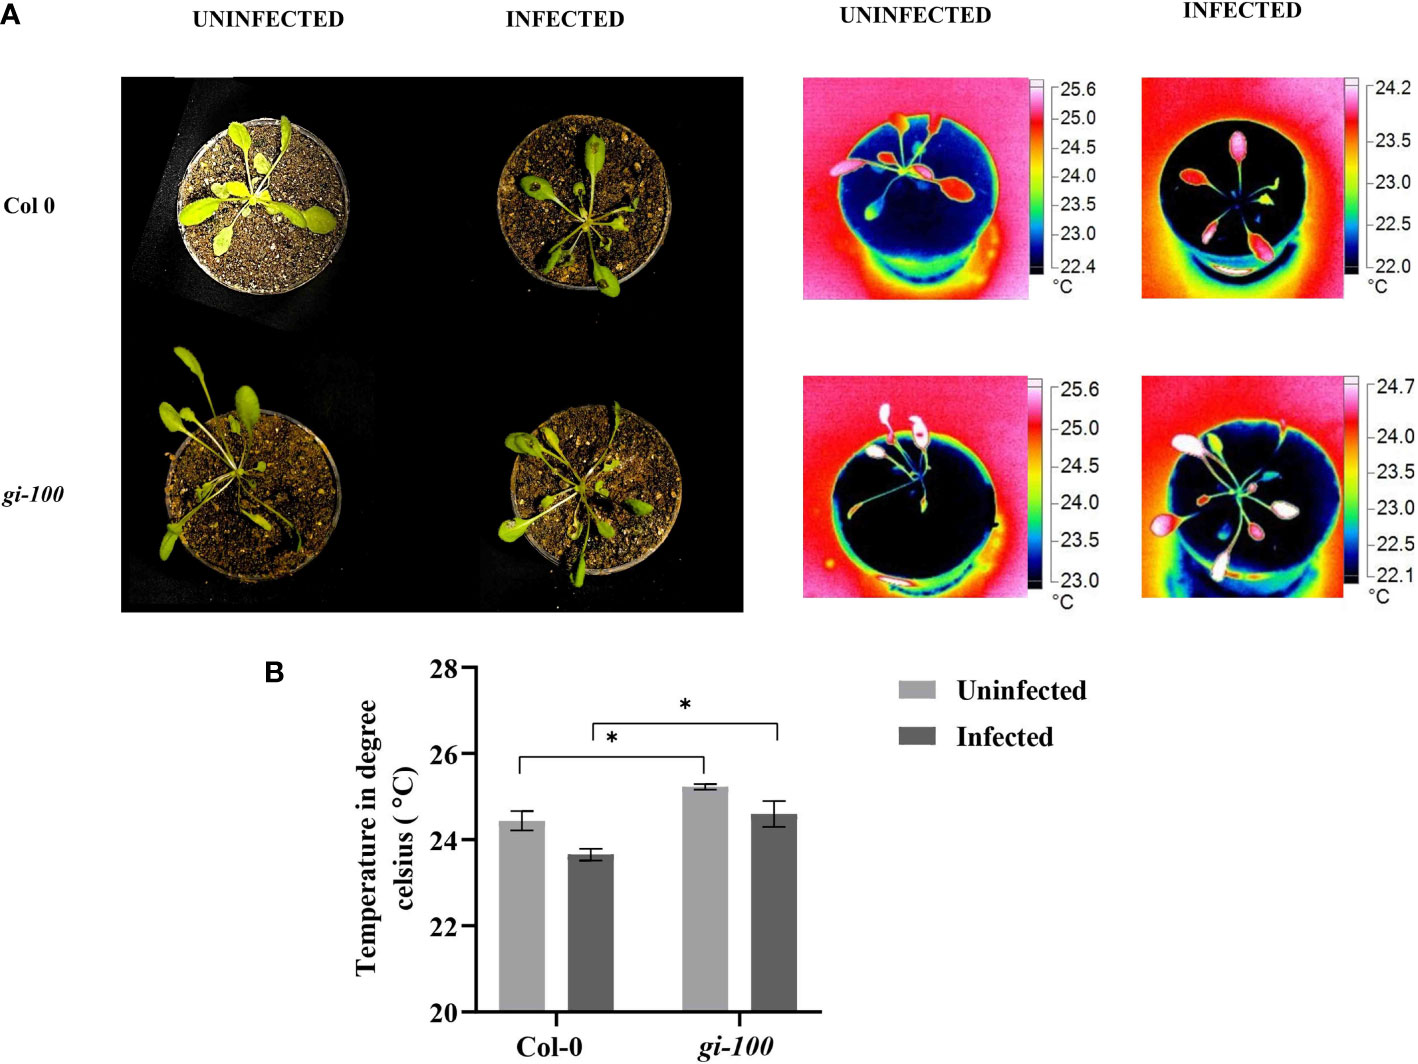
Figure 9 Leaf internal temperature analysis in Col-0 and gi-100. (A) Representative images of Col-0 and gi-100 plants without and with F. oxysporum infection at 9 DPI. The pictures were taken with a FLUKE infrared camera and analyzed using the SMART VIEW software as described in Materials and methods. (B) Leaf internal temperature from a minimum of at least 10 plants of Col-0 and gi-100 was taken. Leaf surface showing highest temperatures were selectively chosen. Values are expressed as mean ± SD. Two-way analysis of variance (ANOVA) using Sidak’s multiple comparisons test was performed with the help of GraphPad Prism *p < 0.05.
GI is ubiquitously present in plants at all stages of development (Mishra and Panigrahi, 2015), suggesting that it is involved in various physiological activities including flowering time regulation (Park et al., 1999), light signaling (Martin-Tryon et al., 2007), starch accumulation (Eimert et al., 1995), circadian clock control (Park et al., 1999), transpiration (Sothern et al., 2002; Tseng et al., 2004), chlorophyll accumulation (Kurepa et al., 1998), and miRNA processing (Jung et al., 2007). In plants, GI has also been demonstrated to regulate abiotic stressors such as drought (Riboni et al., 2013), cold (Cao et al., 2005; Fornara et al., 2015), salt (Kim et al., 2013), and oxidative stress (Kurepa et al., 1998), although its involvement in pathogen attack is yet unknown. Recent research reveals that during a fungal pathogen infection, Bipolaris sorokiniana, GI targets the SA pathway in Arabidopsis and wheat, making the plant more susceptible to the disease (Kundu and Sahu, 2021). GI, a photoperiodic pathway regulator, also improves susceptibility to F. oxysporum, according to RNA-seq data analysis (Lyons et al., 2015a; Lyons et al., 2015b). The Atgi-1 and Atgi-2 mutants are resistant to F. oxysporum infection (Lyons et al., 2015a; Lyons et al., 2015b); however, the mechanism behind this is still unknown.
In this study, we have demonstrated the causative mechanism of involvement of GI in F. oxysporum-induced wilt disease. Progression of the disease was confirmed by the visible disease symptoms on the leaves at 6 DPI, which is also supported by previous findings (Lyons et al., 2015a). Our study claimed that though the mode of infection in F. oxysporum is commonly known to be root borne (Jones and Dangl, 2006), it can also induce pathogenicity through leaf infections under laboratory conditions. The integrative growth approach of the initial 15 days of LD conditions followed by the rest of the study under SD conditions was done to attain a synchronized growth morphology with comparable number of rosette leaves in all the three genotypes used in the study. Following F. oxysporum inoculation, we noticed an increase in the expression of GI and FT in Col-0. Our findings showed that F. oxysporum infection causes early flowering in Col-0 plants and unaltered flowering in gi-100 plants. These results suggested that GI may not play a primary role in flowering time regulation during infection. Despite the decrease in FT expression to nearly half at 24 HPI, the flowering time was unaltered in gi-100 plants. This observation indicated that the flowering time could be regulated by other factors in gi-100 plants and warrants the study of the expression of FT and other related factors at the time of bolting after pathogen infection. Nevertheless, our observation of decrease in FT expression in gi-100 uninfected plants is supported by a similar observation in gi-1 (Kim et al., 2013).
We hypothesized that the GI-mediated disease mechanism is blue light-dependent since GI is related to blue light receptors such as ZEITLUPE (ZTL), FLAVIN-BINDING, KELCH REPEAT, F-BOX 1 (FKF1), and LOV KELCH PROTEIN 2 (LKP2) for its function (Cha et al., 2017). G-BOX BINDING FACTOR 1 (GBF1), a blue light-induced transcription factor, has recently been found to have a positive effect on disease tolerance in recent studies (Giri et al., 2017). To further study the mechanism by which GI induces susceptibility during F. oxysporum infection, we have checked the accumulation of SA, JA, and ABA phytohormones. Our finding suggests that during F. oxysporum infection, GI inhibits the JA pathway and ABA accumulation while stimulating the SA pathway. DELLA protein regulates plant pathogen defense in Arabidopsis, according to recent research. Furthermore, the GI protein has been demonstrated to regulate gibberellic acid signaling by stabilizing the DELLA protein (Nohales and Kay, 2019). More studies can shed light on the GI–DELLA interaction and its involvement in plant pathogen response.
F. oxysporum, being a hemi-biotrophic pathogen, expands its hyphae in the host cells during the initial days of infection and subsequently produces mycotoxins, which kill the host plant (Lagopodi et al., 2002). Hence, any kind of macroscopic lesions or aberrations is not visible on the plant during the initial phase of infection. Concurrently, we did not observe any phenotypic changes in A. thaliana during the initial phase of infection, i.e., 1 to 4 DPI. However, at 9 DPI, the Col-0 WT plants displayed a susceptible phenotype to the disease with at least 60% of leaf area under necrosis. Since the fungal hyphae are known to invade the plant’s root system through the root hairs (Lagopodi et al., 2002; Banhara et al., 2015) and block the vascular bundles of the plant, we investigated the root cells of the infected and uninfected plants using confocal microscopy. PI followed by trypan blue stain was used to stain the plant cell walls to determine the extent of fungal infection in the root cells. Noticeable structural changes could be observed in the infected epidermal cells as compared with the uninfected epidermal root cells in both Col-0 and gi-100 plants at 9 DPI. The epidermal cells of Col-0 were found to be ruptured to a greater extent than gi mutants. This could be due to the mycotoxins produced by the pathogen. However, staining the fungal hyphae with trypan blue at a later stage of infection could not be done due to the ruptured cells and overlapping of vascular root cells on the root cap cells. Moreover, plugging in the vascular bundles was found specifically in the Col-0 plants, which was probably the primary reason for the Col-0 plants’ susceptibility to the disease. The nuclei in stomatal guard cells were also observed to be disintegrated in Col-0, indicating cell death, whereas the nuclei in guard cells were intact even after infection, confirming the resistivity of the plant towards F. oxysporum infection.
Phytochrome B was recently reported to act as a thermosensor due to its temperature sensing property in plants (Legris et al., 2016). We presume the interplay of Phy-B signaling and involvement of PHYTOCHROME INTERACTING FACTORs (PIF-4, PIF-7) module in this process. GI is known to control phytochrome signaling during hypocotyl elongation in A. thaliana (Huq et al., 2000). This prompted us to investigate the plant’s internal temperature during F. oxysporum infection in the presence and absence of GI. The noble finding of higher temperature in the gi-100 plants regardless of F. oxysporum infection indicated that GI plays a role in controlling plants’ internal temperature. A similar report of weakened plant immune defense during a rise in temperature has been shown (Bosman, 2022; Kim et al., 2022). Hence, integrating both results, it could be suggested that the influence of light and temperature on the host–pathogen association in plants may be mediated by GI. Based on the findings of the present study, we propose a model in which GI acts as a negative regulator of defense signaling in Arabidopsis and can contribute to the susceptibility to wilt disease (Figure 10). Explicitly, Fusarium infection in Col-0 induces GI expression and accumulation, resulting in the reduced endogenous JA amount followed by the reduced JA-ile (active form) amount. Consequently, a decrease in the accumulation of COI1 transcript level, which is unable to bind to JA-ile, forms a complex with JAZs. The JAZs act as a repressor to inhibit PDF 1.2. This eventually leads the plant to become susceptible to Fusarium infection. On the other hand, the susceptibility of Col-0 to the vascular wilt disease caused by the F. oxysporum was found to be positively regulated by the SA pathway. Therefore, in gi mutants, the SA content as well as the ICS1 transcript levels are high under uninfected conditions. After the plant was attacked by the pathogen, there was an increased transcript expression of PAD4, which corroborated with the fact that GI binds with the PAD4 intronic region upon pathogen infection (Singh, 2022). The level of ICS1 transcript increased, as a result of which the amount of SA metabolites also increased in the plant. The NPR1 transcript levels were also elevated after the pathogen infection. However, the transcript levels of TGA2, a transcription factor, decreased in the presence of GI in Col-0 after infection. TGA bZIP factors can function as either repressors or activators, or both. In the absence of SA stimulation, TGA2 binds to the PR-1 promoter and inhibits transcription. NPR1 binds to TGA2 at the promoter in SA-stimulated cells, masking TGA2’s repressor domain. In an SA-dependent manner, the protein complex activates transcription. TGA2 thus acts as a repressor or a coactivator in this context (Rochon et al., 2006). However, in our case, the transcription level of TGA2 was low after pathogen infection, as result of which the complex formation of NPR1 and TGA2 is hindered. This might be due to the fact that some fungal toxins are secreted by the pathogen and prevent the NPR1 to mask the TGA’s repressor domain. It was also observed that the PR1 transcript (SA defense responsive gene) significantly decreased in Col-0 WT. In contrast, gi mutation causes the release of this positive suppression of pathogen-induced SA signaling, resulting in increased resistance of gi 100 plants. As a result, we conclude that the GI module promotes susceptibility to F. oxysporum infection by promoting the SA pathway and inhibiting the JA pathway in A. thaliana.
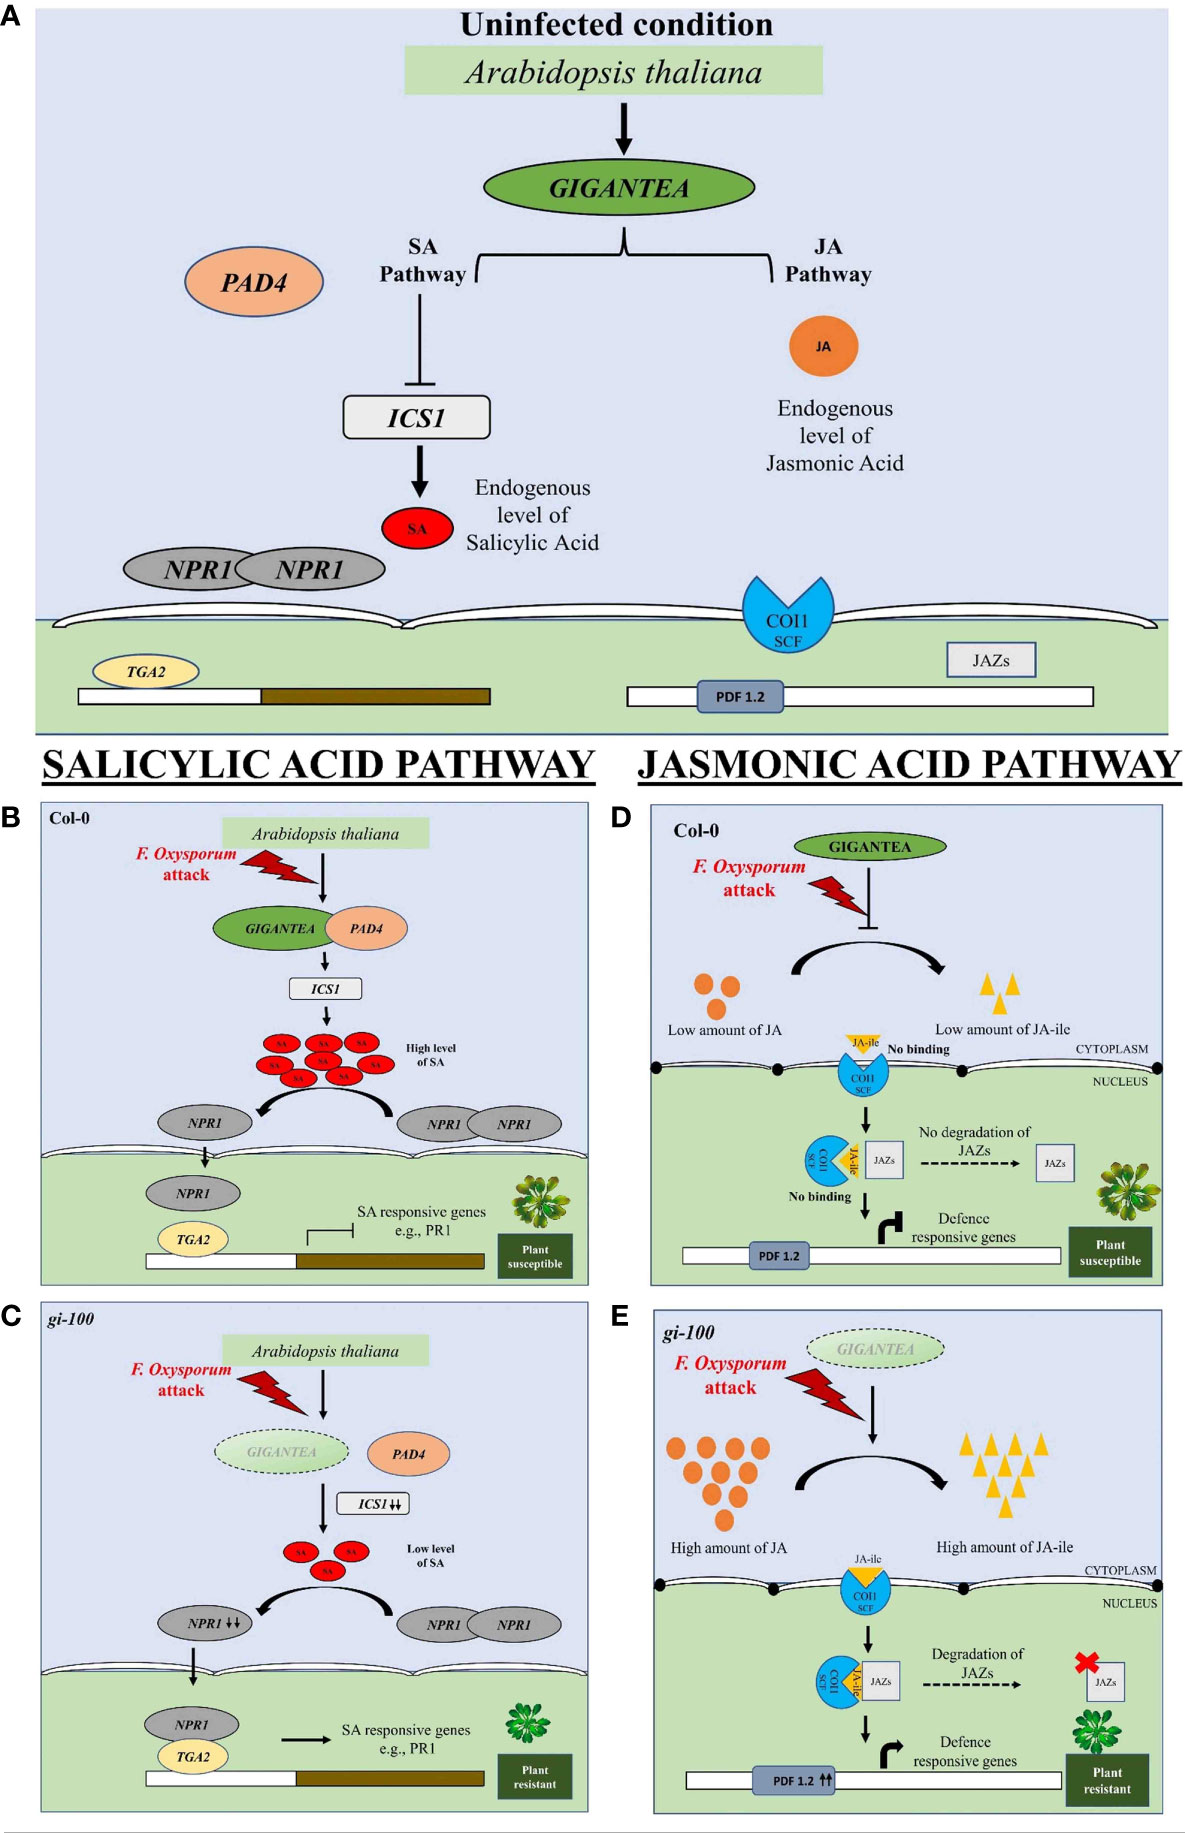
Figure 10 Diagrammatic representation of involvement of GIGENTEA, jasmonic acid, and salicylic acid pathway genes for eliciting pathogen response to F. oxysporum infection in Arabidopsis thaliana. (A) Under uninfected condition, jasmonic and salicylic acid levels and GI are at endogenous levels. The levels of ICS1 are low due to its inhibition. The dimerized form of NPR1 is unable to move into the nucleus and bind to any TF for defense response. Similarly, the JA pathway is also uninduced. (B) Salicylic acid pathway: When F. oxysporum infects wild-type Col-0 plants, increased GIGANTEA (GI) accumulation results in GI binding to PAD4, followed by increased SA accumulation. However, when infected, NPR1 is unable to bind to the transcription factor TGA2, limiting the expression of defense-related genes, i.e., PR1. (D) In the absence of GI, the SA pathway is reversed upon F. oxysporum infection, making the plant more resistant to the disease. (C) Jasmonic acid pathway: Increased GI expression and accumulation, on the other hand, results in less JA-ile in Col-0 (active form). Subsequently, there is a reduction in the transcript level of COI1, which does not bind to JA-ile and thus cannot form a complex with JAZs. JAZs functions as a repressor, inhibiting PDF 1.2. This eventually makes the plant vulnerable to Fusarium infection. (E) On the contrary, in the absence of GI, the accumulation of JA-ile is high and it provides resistance to the plant upon F. oxysporum infection.
The present study significantly contributes to understanding the involvement of the circadian clock component GIGENTEA in controlling biotic stress response during the pathogen infection by F. oxysporum in A. thaliana. This is one of the few reports that explores the molecular mechanisms and involvement of GI for biotic stress tolerance (specifically against F. oxysporum infection, which causes vascular wilt disease in Columbia-0 wild-type plants). Disease resistance in gi-100 for the said disease is positively regulated by modulating JA pathway genes [i.e., CORONATINE INSENSITIVE 1 (COI1) and PLANT DEFENSIN 1.2 (PDF1.2)]. In addition, our report also reveals the involvement of ABA, SA pathways genes, and oxylipins in this response. Though GI promotes early flowering under controlled conditions, our report also showed that it is not involved in flowering time regulation during F. oxysporum infection. This is the first study to report that GI is involved in maintaining lower temperatures of plants, as gi-100 plants maintained a higher temperature irrespective of the pathogen infection. The findings of this study can be useful in building stronger strategies for improving crop yield in fields in case of F. oxysporum infection by manipulating the genes of JA and salicylic pathways.
The original contributions presented in the study are included in the article/Supplementary Material. Further inquiries can be directed to the corresponding author.
The experiments were conceived and designed by KP and AP. The experiments were carried out and data were analyzed by AP and AK. The pathogen was grown, samples were collected, and the plants were infected by AP, AK, AB, SD, GM, and AD. The manuscript was written by AP, MP, and KP, and the figures were finalised by AP, MP and KP. All authors contributed to the article and approved the submitted version.
We would like to express our gratitude to SERB (Fund Number-EMR/2014/000533) awarded to KP and NISER, DAE for providing research funding.
We are grateful to the Department of Atomic Energy, Government of India, NISER, and Utkal University, Bhubaneswar for providing the experimental facility at the institute. We thank Dr. George Coupland, Max Planck Institute, Germany for providing us the seeds and Dr. Mrunmaya Giri, KIIT University for reading the manuscript. Furthermore, we would also like to thank the Metabolomics facility at NIPGR for carrying out the defense hormone quantification.
The authors declare that the research was conducted in the absence of any commercial or financial relationships that could be construed as a potential conflict of interest.
All claims expressed in this article are solely those of the authors and do not necessarily represent those of their affiliated organizations, or those of the publisher, the editors and the reviewers. Any product that may be evaluated in this article, or claim that may be made by its manufacturer, is not guaranteed or endorsed by the publisher.
The Supplementary Material for this article can be found online at: https://www.frontiersin.org/articles/10.3389/fpls.2023.1091644/full#supplementary-material
Supplementary Figure 1 | Effect of F. oxysporum infection on root cells morphology. Longitudinal root tissue sections from uninfected and 9-DPI were stained with trypan blue for epidermal cell wall morphology. Epidermal cell wall of vascular cells showed structural changes in infected Col-0 and gi-100 root cells. Arrow pointing to ruptured epidermis in B, D. Scale bar 100 µm.
Supplementary Figure 2 | Determination of Abscisic acid and Oxylipins after F. oxysporum in Col 0 and gi-100 plants. Determination of endogenous ABA (A) and oxylipins (B) amount at 9-DPI by F. oxysporum in gi-100 as well as Col-0 leaf samples. Data points represent mean ± SD. Two-way analysis of variance (ANOVA) using Sidak’s multiple comparisons test was performed with the help of GraphPad prism *p<0.05. **p<0.01, ***p<0.001.
Supplementary Figure 3 | Effect of F. oxysporum infection on stomatal number and integrity in Col-0 and gi-100 plants. Concurrent confocal fluorescence and transmitted light images of uninfected and infected Arabidopsis leaves were taken which were labelled with Acridine orange. Arrow points to the nuclei of guard cells in uninfected Col-0 and infected gi-100 lines. Scale bar 100 µm.
Anderson, J. P., Badruzsaufari, E., Schenk, P. M., Manners, J. M., Desmond, O. J., Ehlert, C., et al. (2004). Antagonistic interaction between abscisic acid and jasmonate-ethylene signaling pathways modulates defense gene expression and disease resistance in arabidopsis. Plant Cell 16, 3460–3479. doi: 10.1105/tpc.104.025833
Banhara, A., Ding, Y., Kühner, R., Zuccaro, A., Parniske, M. (2015). Colonization of root cells and plant growth promotion by piriformospora indica occurs independently of plant common symbiosis genes. Front. Plant Sci. 6. doi: 10.3389/fpls.2015.00667
Baudry, A., Ito, S., Song, Y. H., Strait, A. A., Kiba, T., Lu, S., et al. (2010). F-box proteins FKF1 and LKP2 act in concert with ZEITLUPE to control arabidopsis clock progression. Plant Cell 22, 606–622. doi: 10.1105/tpc.109.072843
Berns, M. C., Nordström, K., Cremer, F., Tóth, R., Hartke, M., Simon, S., et al. (2014). Evening expression of arabidopsis GIGANTEA is controlled by combinatorial interactions among evolutionarily conserved regulatory motifs. Plant Cell 26 (10), 3999–4018. doi: 10.1105/tpc.114.129437
Bosman, A. (2022) Plant immune defenses are weakened by rising temperatures. Available at: https://www.earth.com/news/plant-immune-defenses-are-weakened-by-rising-temperatures/.
Cao, S., Ye, M., Jiang, S. (2005). Involvement of GIGANTEA gene in the regulation of the cold stress response in arabidopsis. Plant Cell Rep. 24, 683–690. doi: 10.1007/s00299-005-0061-x
Cha, J. Y., Kim, J., Kim, T. S., Zeng, Q., Wang, L., Lee, S. Y., et al. (2017). GIGANTEA is a co-chaperone which facilitates maturation of ZEITLUPE in the arabidopsis circadian clock. Nat. Commun. 8, 3. doi: 10.1038/s41467-016-0014-9
Cole, S. J., Yoon, A. J., Faull, K. F., Diener, A. C. (2014). Host perception of jasmonates promotes infection by fusarium oxysporum formae speciales that produce isoleucine- and leucine-conjugated jasmonates. Mol. Plant Pathol. 15, 589–600. doi: 10.1111/mpp.12117
Cui, H., Gobbato, E., Kracher, B., Qiu, J., Bautor, J., Parker, J. E. (2017). A core function of EDS1 with PAD4 is to protect the salicylic acid defense sector in arabidopsis immunity. New Phytol. 213 (4), 1802–1817. doi: 10.1111/nph.14302
Czymmek, K. J., Fogg, M., Powell, D. H., Sweigard, J., Park, S. Y., Kang, S. (2007). In vivo time-lapse documentation using confocal and multi-photon microscopy reveals the mechanisms of invasion into the arabidopsis root vascular system by fusarium oxysporum. Fungal Genet. Biol. 44, 1011–1023. doi: 10.1016/j.fgb.2007.01.012
David, K. M., Armbruster, U., Tama, N., Putterill, J. (2006). Arabidopsis GIGANTEA protein is post-transcriptionally regulated by light and dark. FEBS Lett. 580 (5), 1193–1197. doi: 10.1016/j.febslet.2006.01.016
de Leone, M. J., Hernando, C. E., Mora-García, S., Yanovsky, M. J. (2020). It’s a matter of time: the role of transcriptional regulation in the circadian clock-pathogen crosstalk in plants. Transcription 11 (3–4), 100–116. doi: 10.1080/21541264.2020.1820300
de Montaigu, A., Tóth, R., Coupland, G. (2010). Plant development goes like clockwork. Trends Genet. 26, 296–306. doi: 10.1016/j.tig.2010.04.003
Diener, A. C., Ausubel, F. M. (2005). RESISTANCE TO FUSARIUM OXYSPORUM 1, a dominant arabidopsis disease-resistance gene, is not race specific. Genetics 171, 305–321. doi: 10.1534/genetics.105.042218
Edgar, C. I., McGrath, K. C., Dombrecht, B., Manners, J. M., Maclean, D. C., Schenk, P. M., et al. (2006). Salicylic acid mediates resistance to the vascular wilt pathogen fusarium oxysporum in the model host arabidopsis thaliana. Australas. Plant Pathol. 35, 581–591. doi: 10.1071/AP06060
Eimert, K., Wang, S. M., Lue, W. I., Chen, J. (1995). Monogenic recessive mutations causing both late floral initiation and excess starch accumulation in arabidopsis. Plant Cell 7 (10), 1703–1712. doi: 10.1105/tpc.7.10.1703
Fornara, F., de Montaigu, A., Sánchez-Villarreal, A., Takahashi, Y., ver Loren Van Themaat, E., Huettel, B., et al. (2015). The GI-CDF module of arabidopsis affects freezing tolerance and growth as well as flowering. Plant J. 81, 695–706. doi: 10.1111/tpj.12759
Fornara, F., Panigrahi, K. C. S., Gissot, L., Sauerbrunn, N., Rühl, M., Jarillo, J. A., et al. (2009). Arabidopsis DOF transcription factors act redundantly to reduce CONSTANS expression and are essential for a photoperiodic flowering response. Dev. Cell 17, 75–86. doi: 10.1016/j.devcel.2009.06.015
Fowler, S., Lee, K., Onouchi, H., Samach, A., Richardson, K., Morris, B., et al. (1999). GIGANTEA: a circadian clock-controlled gene that regulates photoperiodic flowering in arabidopsis and encodes a protein with several possible membrane-spanning domains. EMBO J 18 (17), 4679–4688. doi: 10.1093/emboj/18.17.4679
Fowler, S., Thomashow, M. F. (2002). Arabidopsis transcriptome profiling indicates that multiple regulatory pathways are activated during cold acclimation in addition to the CBF cold response pathway. Plant Cell 14, 1675–1690. doi: 10.1105/tpc.003483
Gangappa, S. N., Chattopadhyay, S. (2010). MYC2, a bHLH transcription factor, modulates the adult phenotype of SPA1. Plant Signal Behav. 5, 1650–1652. doi: 10.4161/psb.5.12.13981
Giri, M. K., Singh, N., Banday, Z. Z., Singh, V., Ram, H., Singh, D., et al. (2017). GBF1 differentially regulates CAT2 and PAD4 transcription to promote pathogen defense in arabidopsis thaliana. Plant J. 91, 802–815. doi: 10.1111/tpj.13608
Glazebrook, J. (2005). Contrasting mechanisms of defense against biotrophic and necrotrophic pathogens. Annu. Rev. Phytopathol. 43, 205–227. doi: 10.1146/annurev.phyto.43.040204.135923
Huq, E., Tepperman, J. M., Quail, P. H. (2000). GIGANTEA is a nuclear protein involved in phytochrome signaling in arabidopsis. Proc. Natl. Acad. Sci. U.S.A. 97 (17), 9789–9794. doi: 10.1073/pnas.170283997
Imaizumi, T., Schultz, T. F., Harmon, F. G., Ho, L. A., Kay, S. A. (2005). Plant science: FKF1 f-box protein mediates cyclic degradation of a repressor of CONSTANS in arabidopsis. Sci. (1979) 309, 293–297. doi: 10.1126/science.1110586
Jones, J. D. G., Dangl, J. L. (2006). The plant immune system. Nature 444(7117), 323–329. doi: 10.1038/nature05286
Jung, J. H., Seo, Y. H., Seo, P. J., Reyes, J. L., Yun, J., Chua, N. H., et al. (2007). The GIGANTEA-regulated microRNA172 mediates photoperiodic flowering independent of CONSTANS in arabidopsis. Plant Cell 19 (9), 2736–2748. doi: 10.1105/tpc.107.054528
Kazan, K., Lyons, R. (2016). The link between flowering time and stress tolerance. J. Exp. Bot. 67, 47–60. doi: 10.1093/jxb/erv441
Khaleda, L., Cha, J. Y., Kim, M. G., Kim, W. Y. (2017). Production and characterization of polyclonal antibody against arabidopsis GIGANTEA, a circadian clock controlled flowering time regulator. J. Plant Biol. 60, 622–629. doi: 10.1007/s12374-017-0305-7
Kidd, B. N., Edgar, C. I., Kumar, K. K., Aitken, E. A., Schenk, P. M., Manners, J. M., et al. (2009). The mediator complex subunit PFT1 is a key regulator of jasmonate-dependent defense in arabidopsis. Plant Cell 21, 2237–2252. doi: 10.1105/tpc.109.066910
Kidd, B. N., Kadoo, N. Y., Dombrecht, B., Tekeoğlu, M., Gardiner, D. M., Thatcher, L. F., et al. (2011). Auxin signaling and transport promote susceptibility to the root-infecting fungal pathogen fusarium oxysporum in arabidopsis. / 733 MPMI 24, 733–748. doi: 10.1094/MPMI
Kim, W. Y., Ali, Z., Park, H. J., Park, S. J., Cha, J. Y., Perez-Hormaeche, J., et al. (2013). Release of SOS2 kinase from sequestration with GIGANTEA determines salt tolerance in arabidopsis. Nat. Commun. 4 (1), 1352. doi: 10.1038/ncomms2357
Kim, J. H., Castroverde, C. D. M., Huang, S., Li, C., Hilleary, R., Seroka, A., et al. (2022). Increasing the resilience of plant immunity to a warming climate. Nature 607 (7918), 339–344. doi: 10.1038/nature06132
Kim, W. Y., Fujiwara, S., Suh, S. S., Kim, J., Kim, Y., Han, L., et al. (2007). ZEITLUPE is a circadian photoreceptor stabilized by GIGANTEA in blue light. Nature 449, 356–360. doi: 10.1038/nature06132
Kim, J., Geng, R., Gallenstein, R. A., Somers, D. E. (2013). The f-box protein ZEITLUPE controls stability and nucleocytoplasmic partitioning of GIGANTEA. Development 140 (19), 4060–4069. doi: 10.1242/dev.096651
Kim, Y., Han, S., Yeom, M., Kim, H., Lim, J., Cha, J. Y., et al. (2013). Balanced nucleocytosolic partitioning defines a spatial network to coordinate circadian physiology in plants. Dev. Cell 26, 73–85. doi: 10.1016/j.devcel.2013.06.006
Kumar, A. (2021) Optimization of soil parameters and cost effective way of growing arabidopsis thaliana from an Indian perspective SILVER NANOPARTICLE view project INTERNATIONAL CONFERENCE OF PLANT DEVELOPMENTA view project. Available at: https://www.researchgate.net/publication/351123678.
Kundu, P., Sahu, R. (2021). GIGANTEA confers susceptibility to plants during spot blotch attack by regulating salicylic acid signalling pathway. Plant Physiol. Biochem. 167, 349–357. doi: 10.1016/j.plaphy.2021.02.006
Kurepa, J., Smalle, J., van Montagu, M., Inzé, D. (1998). Oxidative stress tolerance and longevity in arabidopsis: the late-flowering mutant gigantea is tolerant to paraquat. Plant J. 14 (6), 759–764. doi: 10.1046/j.1365-313x.1998.00168.x
Lagopodi, A. L., Ram, A. F. J., Lamers, G. E. M., Punt, P. J., van den Hondel, C. A. M. J. J., Lugtenberg, B. J. J., et al. (2002). Novel aspects of tomato root colonization and infection by fusarium oxysporum f. sp. radicis-lycopersici revealed by confocal laser scanning microscopic analysis using the green fluorescent protein as a marker. Mol. Plant Microbe Interact. 15 (2), 172–179. doi: 10.1094/MPMI.2002.15.2.172
Legris, M., Klose, C., Burgie, E. S., Rojas, C. C., Neme, M., Hiltbrunner, A., et al. (2016). Phytochrome b integrates light and temperature signals in arabidopsis. Science 1979 354 (6314), 897–900. doi: 10.1126/science.aaf5656
Li, A., Sun, X., Liu, L. (2022). Action of salicylic acid on plant growth. Front. Plant Sci. 13. doi: 10.3389/fpls.2022.878076
Lyons, R., Rusu, A., Stiller, J., Powell, J., Manners, J. M., Kazan, K. (2015a). Investigating the association between flowering time and defense in the arabidopsis thaliana-fusarium oxysporum interaction. PloS One 10 (6), e0127699. doi: 10.1371/journal.pone.0127699
Lyons, R., Stiller, J., Powell, J., Rusu, A., Manners, J. M., Kazan, K. (2015b). Fusarium oxysporum triggers tissue-specific transcriptional reprogramming in arabidopsis thaliana. PloS One 10 (4), e0121902. doi: 10.1371/journal.pone.0121902
Martin-Tryon, E. L., Kreps, J. A., Harmer, S. L. (2007). GIGANTEA acts in blue light signaling and has biochemically separable roles in circadian clock and flowering time regulation. Plant Physiol. 143 (1), 473–486. doi: 10.1104/pp.106.088757
Michielse, C. B., Rep, M. (2009). Pathogen profile update: Fusarium oxysporum. Mol. Plant Pathol. 10, 311–324. doi: 10.1111/j.1364-3703.2009.00538.x
Mishra, G., Collings, D. A., Altaner, C. M. (2018). Cell organelles and fluorescence of parenchyma cells in eucalyptus bosistoana sapwood and heartwood investigated by microscopy. N Z J. For Sci. 48(1), 1–10. doi: 10.1186/s40490-018-0118-6
Mishra, P., Panigrahi, K. C. (2015). GIGANTEA - an emerging story. Front. Plant Sci. 6. doi: 10.3389/fpls.2015.00008
Nohales, M. A., Kay, S. A. (2019). GIGANTEA gates gibberellin signaling through stabilization of the DELLA proteins in arabidopsis. Proc. Natl. Acad. Sci. U.S.A. 116, 21893–21899. doi: 10.1073/pnas.1913532116
Panigrahy, M. (2004). Characterisation of mutants involved in Phytochrome A nuclear import and signal transduction (Doctoral dissertation, Freiburg (Breisgau), Univ., Diss., 2004).
Pantelides, I. S., Tjamos, S. E., Pappa, S., Kargakis, M., Paplomatas, E. J. (2013). The ethylene receptor ETR1 is required for fusarium oxysporum pathogenicity. Plant Pathol. 62, 1302–1309. doi: 10.1111/ppa.12042
Park, D. H., Somers, D. E., Kim, Y. S., Choy, Y. H., Lim, H. K., Soh, M. S., et al. (1999). Control of circadian rhythms and photoperiodic flowering by the arabidopsis GIGANTEA gene. Sci. (1979) 285 (5433), 1579–1582. doi: 10.1126/science.285.5433.1579
Patnaik, A., Alavilli, H., Rath, J., Panigrahi, K. C. S., Panigrahy, M. (2022). Variations in circadian clock organization & function: A journey from ancient to recent. Planta 256 (5), 91. doi: 10.1007/s00425-022-04002-1
Perincherry, L., Lalak-Kánczugowska, J., Stepién, L. (2019). Fusarium-produced mycotoxins in plant-pathogen interactions. Toxins (Basel) 11 (11), 664. doi: 10.3390/toxins11110664
Pfaffl, M. W. (2001). A new mathematical model for relative quantification in real-time RT–PCR. Nucleic Acids Res. 29 (9), e45–e45. doi: 10.1093/nar/29.9.e45
Rédei, G. P. (1962). Supervital mutants of Arabidopsis. Genetics 47 (4), 443. doi: 10.1093/genetics/47.4.443
Reverberi, M., Fabbri, A. A., Fanelli, C. (2012). Oxidative stress and oxylipins in plant-fungus interaction. Biocommunication of Fungi 273–290. doi: 10.1007/978-94-007-4264-2_18
Riboni, M., Galbiati, M., Tonelli, C., Conti, L. (2013). GIGANTEA enables drought escape response via abscisic acid-dependent activation of the florigens and SUPPRESSOR of OVEREXPRESSION of CONSTANS11[c][w]. Plant Physiol. 162, 1706–1719. doi: 10.1104/pp.113.217729
Rochon, A., Boyle, P., Wignes, T., Fobert, P. R., Després, C. (2006). The coactivator function of arabidopsis NPR1 requires the core of its BTB/POZ domain and the oxidation of c-terminal cysteines. Plant Cell 18, 3670–3685. doi: 10.1105/tpc.106.046953
Ruan, J., Zhou, Y., Zhou, M., Yan, J., Khurshid, M., Weng, W., et al. (2019). Jasmonic acid signaling pathway in plants. Int. J. Mol. Sci. 20 (10), 2479. doi: 10.3390/ijms20102479
Sanchez, S. E., Kay, S. A. (2016). The plant circadian clock: From a simple timekeeper to a complex developmental manager. Cold Spring Harb. Perspect. Biol. 8 (12), a027748. doi: 10.1101/cshperspect.a027748
Sawa, M., Nusinow, D. A., Kay, S. A., Imaizumi, T. (2007). FKF1 and GIGANTEA complex formation is required for day-length measurement in arabidopsis. Science 318 (5848), 261–265. doi: 10.1126/science.1146994
Singh, A. (2022). GIGANTEA regulates PAD4 transcription to promote pathogen defense against hyaloperonospora arabidopsidis in arabidopsis thaliana. Plant Signal Behav. 17 (1), 2058719. doi: 10.1080/15592324.2022.2058719
Somers, D. E., Schultz, T. F., Milnamow, M., Kay, S. A. (2000). ZEITLUPE encodes a novel clock-associated PAS protein from arabidopsis. Cell 101 (3), 319–329. doi: 10.1016/S0092-8674(00)80841-7
Sothern, R. B., Tseng, T. S., Orcutt, S. L., Olszewski, N. E., Koukkari, W. L. (2002). GIGANTEA and SPINDLY genes linked to the clock pathway that controls circadian characteristics of transpiration in arabidopsis. Chronobiology Int. 19 (6), 1005–1022. doi: 10.1081/CBI-120015965
Strasser, R. J., Tsimilli-Michael, M., Srivastava, A. (2004). Analysis of the chlorophyll a fluorescence transient. Advances in Photosynthesis and Respiration 1–47. doi: 10.1007/978-1-4020-3218-9_12
Thatcher, L. F., Manners, J. M., Kazan, K. (2009). Fusarium oxysporum hijacks COI1-mediated jasmonate signaling to promote disease development in arabidopsis. Plant J. 58, 927–939. doi: 10.1111/j.1365-313X.2009.03831.x
Tseng, T. S., Salomeé, P. A., McClung, C. R., Olszewski, N. E. (2004). SPINDLY and GIGANTEA interact and act in arabidopsis thaliana pathways involved in light responses, flowering, and rhythms in cotyledon movements. Plant Cell 16 (6), 1550–1563. doi: 10.1105/tpc.019224
Ushio, F., Ezaki, K., Horiguchi, G., Seo, M., Kanno, Y., Kamiya, Y., et al. (2020). Suppression of class i compensated cell enlargement by xs2 mutation is mediated by salicylic acid signaling. PloS Genet. 16 (6), e1008873. doi: 10.1371/journal.pgen.1008873
Vadassery, J., Reichelt, M., Hause, B., Gershenzon, J., Boland, W., Mithöfer, A. (2012). CML42-mediated calcium signaling coordinates responses to spodoptera herbivory and abiotic stresses in arabidopsis. Plant Physiol. 159, 1159–1175. doi: 10.1104/pp.112.198150
Vanacker, H., Lu, H., Rate, D. N., Greenberg, J. T. (2001). A role for salicylic acid and NPR1 in regulating cell growth in arabidopsis. Plant J. 28 (2), 209–216. doi: 10.1046/j.1365-313X.2001.01158.x
van Loon, L. C., Rep, M., Pieterse, C. M. J. (2006). Significance of inducible defense-related proteins in infected plants. Annu. Rev. Phytopathol. 44, 135–162. doi: 10.1146/annurev.phyto.44.070505.143425
van Loon, L. C., van Strien, E. A. (1999). The families of pathogenesis-related proteins, their activities, and comparative analysis of PR-1 type proteins. Physiol. Mol. Plant Pathol. 55 (2), 85–97. doi: 10.1006/pmpp.1999.0213
Wachsman, G., Sparks, E. E., Benfey, P. N. (2015). Genes and networks regulating root anatomy and architecture. New Phytol. 208 (1), pp.26–pp.38. doi: 10.1111/nph.13469
Wang, G. F., Seabolt, S., Hamdoun, S., Ng, G., Park, J., Lu, H. (2011). Multiple roles of WIN3 in regulating disease resistance, cell death, and flowering time in arabidopsis. Plant Physiol. 156 (3), 1508–1519. doi: 10.1104/pp.111.176776
Wang, W., Withers, J., Li, H., Zwack, P. J., Rusnac, D. V., Shi, H., et al. (2020). Structural basis of salicylic acid perception by arabidopsis NPR proteins. Nature 586 (7828), 311–316. doi: 10.1038/s41586-020-2596-y
Wang, C., Zhang, H., Wang, S., Mao, S. (2021). Leaf spot of hosta ventricosa caused by fusarium oxysporum in China. PeerJ 9, e12581. doi: 10.7717/peerj.12581
Yang, G., Tang, L., Gong, Y., Xie, J., Fu, Y., Jiang, D., et al. (2018). A cerato-platanin protein SsCP1 targets plant PR1 and contributes to virulence of sclerotinia sclerotiorum. New Phytol. 217 (2), 739–755. doi: 10.1111/nph.14842
Keywords: GIGANTEA, Arabidopsis thaliana, Fusarium oxysporum, plant-pathogen interaction, salicylic acid, jasmonic acid, circadian clock, flowering
Citation: Patnaik A, Kumar A, Behera A, Mishra G, Dehery SK, Panigrahy M, Das AB and Panigrahi KCS (2023) GIGANTEA supresses wilt disease resistance by down-regulating the jasmonate signaling in Arabidopsis thaliana. Front. Plant Sci. 14:1091644. doi: 10.3389/fpls.2023.1091644
Received: 07 November 2022; Accepted: 13 February 2023;
Published: 09 March 2023.
Edited by:
Mohammad Irfan, Cornell University, United StatesReviewed by:
Celine Caseys, University of California, Davis, United StatesCopyright © 2023 Patnaik, Kumar, Behera, Mishra, Dehery, Panigrahy, Das and Panigrahi. This is an open-access article distributed under the terms of the Creative Commons Attribution License (CC BY). The use, distribution or reproduction in other forums is permitted, provided the original author(s) and the copyright owner(s) are credited and that the original publication in this journal is cited, in accordance with accepted academic practice. No use, distribution or reproduction is permitted which does not comply with these terms.
*Correspondence: Kishore C. S. Panigrahi, cGFuaWdyYWhpQG5pc2VyLmFjLmlu
†Present addresses: Gayatri Mishra, Department of Biology, University of Utah, Salt Lake, UT, United States
Kishore C. S. Panigrahi, Guest Professor of Deutsche Forschungsgemeinschaft (DFG, German Research Foundation), Mercator Fellow, Heinrich Heine University (HHU), Duesseldorf, Germany
Disclaimer: All claims expressed in this article are solely those of the authors and do not necessarily represent those of their affiliated organizations, or those of the publisher, the editors and the reviewers. Any product that may be evaluated in this article or claim that may be made by its manufacturer is not guaranteed or endorsed by the publisher.
Research integrity at Frontiers
Learn more about the work of our research integrity team to safeguard the quality of each article we publish.