 Jianjun Li1*
 Xiaopei Chang1Qian Huang1Pengfei Liu1Xiting Zhao1
 Fengmei Li2Yungang Wang3
 Cuifang Chang4*
- 1Green Medicine Biotechnology Henan Engineering Laboratory, Engineering Technology Research Center of Nursing and Utilization of Genuine Chinese Crude Drugs in Henan Province, College of Life Science, Henan Normal University, Xinxiang, China
- 2School of Life Science and Basic Medicine, Xinxiang University, Xinxiang, China
- 3Foresty Seeding Service Station of XinXiang, Xinxiang, Henan, China
- 4State Key Laboratory Cell Differentiation and Regulation, College of Life Science, Henan Normal University, Xinxiang, China
Introduction: The flower buds of Lonicera japonica Thunb. are widely used in Chinese medicine for their anti-inflammatory properties, and they have played an important role in the fight against SARS COVID-19 and other major epidemics. However, due to the lack of scientific and accurate variety identification methods and national unified standards, scattered and non-standardized management in flower bud production has led to mixed varieties that have caused significant difficulties in the cataloging and preservation of germplasm resources and the identification, promotion, and application of new L. japonica varieties.
Methods: In this study, we evaluated the population structure, genetic relationships, and genetic fingerprints of 39 germplasm resources of Lonicera in China using simplified genome sequencing technology.
Results: A total of 13,143,268 single nucleotide polymorphisms (SNPs) were identified. Thirty-nine samples of Lonicera were divided into four subgroups, and the population structure and genetic relationships among existing Lonicera germplasm resources were determined using principal component analysis, population structure analysis, and phylogenetic tree analysis. Through several stringent selection criteria, 15 additional streamlined, high-quality DNA fingerprints were filtered out of the validated 50 SNP loci and verified as being able to effectively identify the 39 Lonicera varieties.
Discussion: To our knowledge, this is the first comprehensive study measuring the diversity and population structure of a large collection of Lonicera varieties in China. These results have greatly broadened our understanding of the diversity, phylogeny, and population structure of Lonicera. The results may enhance the future analysis of genetic diversity, species identification, property rights disputes, and molecular breeding by providing a scientific basis and reference data for these efforts.
Introduction
Lonicera japonica Thunb. a perennial semi-evergreen twining shrub of the Caprifoliaceae family, is native to China and is primarily distributed in temperate regions of the northern hemisphere, with smaller numbers in Japan and Korea. The honeysuckle flower is a dry flower bud or open flower of L. japonica and is rich in organic acids, flavonoids (Li et al., 2021), volatile oils, and other components. It can reduce fever and remove toxins without causing gastrointestinal issues (Li, 2020). Especially in China, honeysuckle flower has played an important role in the treatment of SARS COVID-19 and other major epidemics (Ren et al., 2022).
Before 2014, the National Pharmacopoeia Commission of China regarded Flos Lonicerae as a classification under L. japonica (Li et al., 2020). The 2015 edition of the Chinese Pharmacopoeia detailed the differences between L. japonica and Flos Lonicerae regarding medicinal history, sources, characteristics, chemical components, and other aspects. The medicinal source of honeysuckle flower is L. japonica, and the medicinal sources of Flos Lonicerae include Lonicera macranthoides Hand.-Mazz., Lonicera hypoglauca Miq., Lonicera confusa DC., and Lonicera fulvotomentosa Hsu et S.C.Cheng. (Zhu et al., 2021). However, it is worth noting that compared with the three Flos Lonicerae, L. hypoglauca, L. confusa, and L. fulvotomentosa, L. macranthoides currently has more mature cultivation varieties with the largest number of plantings and the widest planting area, which is more recognized and accepted by the public (Zhang et al., 2022). In the research on Flos Lonicerae, people usually choose L. macranthoides as the research object rather than L. hypoglauca, L. confuse, and L. fulvotomentosa (Yao et al., 2022).
With increasing market recognition of L. japonica and L. macranthoides germplasm and the continuous optimization and improvement of breeding technology, the number of Lonicera varieties is increasing (Hu et al., 2022). A total of 39 varieties of L. japonica and L. macranthoides were authorized or registered in China in April 2022 (Lan, 2017). Most of these varieties are propagated with cuttings and have strong adaptability with no strict soil or climate needs. Sandy loam with a thick soil layer is the best substrate, as it provides an extremely cold-resistant medium (Li et al., 2022). However, due to the lack of standardized management regulations and decentralized management, the Lonicera germplasm resources are poorly organized, and there are unclear genetic relationships among varieties. These problems not only lead to intellectual property disputes between varieties but also make it very difficult to catalog and preserve the germplasm resources of Lonicera and cultivate new varieties for a wide range of applications. Therefore, accurate and efficient variety identification technology is needed for breeding new high-quality Lonicera varieties, and this makes variety identification increasingly important in the breeding industry. At present, the identification of Lonicera germplasm is limited to morphological and chemical fingerprint analyses. For example, methods such as high-performance liquid chromatography (HPLC) (Liu et al., 2019) and Fourier transform infrared spectroscopy (FTIR) (Nikzad-Langerodi et al., 2017) have been used to analyze Lonicera index components in most studies.
DNA molecular marker technology is widely used in the identification of plant varieties due to its advantages of being free from environmental and species restrictions, its simple operation, and its ability to identify uniform and abundant loci as well as strong polymorphism. In plant biology, simple sequence repeat (SSR) and single nucleotide polymorphism (SNP) markers have been used to construct fingerprint databases, identify genetic relationships, construct genetic maps, and isolate and clone diverse genes of Nicotiana tabacum L. (Wang et al., 2021a), Brassica oleracea var. italica (Shen et al., 2021), Lagenaria siceraria (Mol.) Standl. (Wang et al., 2021b), Triticum aestivum L. (Li et al., 2018), Camellia sinensis L. (Karunarathna et al., 2021), Beta vulgaris L. (Schneider et al., 2007), and Ipomoea batatas (L.) Lam. (Wang et al., 2010), and other species. Shao et al. (2020) performed genetic detection on 113 olive germplasm resources using eight pairs of SSR fluorescence markers. Zhang et al. (2021) conducted molecular identification and DNA barcode construction of Dracaena germplasm resources from Liliaceae. (Wang et al., 2021a, b) constructed core SNPs to identify calabash germplasm resources using SNP markers, thereby providing data support for the molecular marker-assisted breeding of calabash varieties. SSR and SNP molecular markers have the advantages of rich marker polymorphism, good experimental repeatability, easy standardization of data, clear distribution of marker sites, and mature technology; they are the only recommended markers used to construct a DNA fingerprint database in the Biological and Molecular Marker Technology (BMT) Molecular Test Guidelines of the International Union for the Protection of New Plant Varieties (UPOV) and the General Principles of DNA Fingerprinting Methods for Plant Variety Identification in China (NY/T 2594-2016) (Hayward et al., 2015; Li et al., 2020).
Compared with SSR markers, SNP markers are abundant in number and display greater polymorphism; they are easily detected and convenient for statistical analysis, and they can be identified via high-throughput automated detection (Pei et al., 2015). With the continuous improvement of next-generation sequencing (NGS) technology, the development and detection of SNP sites have become simple and efficient. However, in the field of Lonicera variety identification, only Peng et al. (2010) designed a pair of allele-specific primers for PCR analysis of nrDNA ITS sequences and successfully distinguished the authenticity of five L. japonica species. Xu et al. (2015) used SSR technology to construct SSR fingerprints in Excel format for six different types of L. japonica, providing the earliest data support for variety identification. In addition, there have been no studies on the identification of Lonicera varieties based on DNA molecular markers (Jiang et al., 2013). The SNP molecular marker technology used in this study refers to the DNA sequence polymorphism caused by the variation of a single base in the genomic DNA sequence (Gazendam et al., 2022). In recent years, an increasing number of studies have used SNP molecular marker technology to identify varieties. DNA fingerprinting technology, with the advantages of being fast and accurate, is a powerful tool for identifying varieties and strains and has been widely used in the diversity and purity identification of many crops (Freixas-Coutin et al., 2019). Therefore, SNP molecular markers are regarded as the most important and promising DNA molecular markers in plant biological research (Azizi et al., 2021).
In this study, 39 Lonicera germplasm resources were used for Illumina NovaSeq sequencing. The results were compared with the reference genome to screen and mine SNP core markers and interpret their genetic relationships, genetic diversity, and population structure. In addition, a DNA fingerprint of Lonicera was constructed to efficiently and cheaply distinguish different species and varieties of Lonicera. The results provide a scientific basis and a data reference for genetic diversity analysis, variety identification, and molecular breeding of Lonicera (Supplementary Figure 1).
Materials and methods
Plant materials
Considering that L. macranthoides in Flos Lonicerae has many cultivated varieties, a wide planting area, and more stable and representative genetic characters. In contrast, L. hypoglauca, L. confuse, and L. fulvotomentosa currently have no cultivated varieties, and there are few wild varieties with low representativeness and other factors. In this experiment, L. macranthoides was selected as the representative of Flos Lonicerae. The experiment was conducted with 39 wild and cultivated varieties of L. japonica and L. macranthoides existing in China. There were 35 varieties of L. japonica and four varieties of L. macranthoides (Figure 1). The specific variety information is shown in Table 1. For each germplasm accession, seven vigorous plants were randomly selected at the seedling stage, and young leaf samples totaling 5 g were collected on tinfoil, frozen immediately in liquid nitrogen, and transported to the laboratory, where they were stored at −80°C until they were used for DNA extraction.
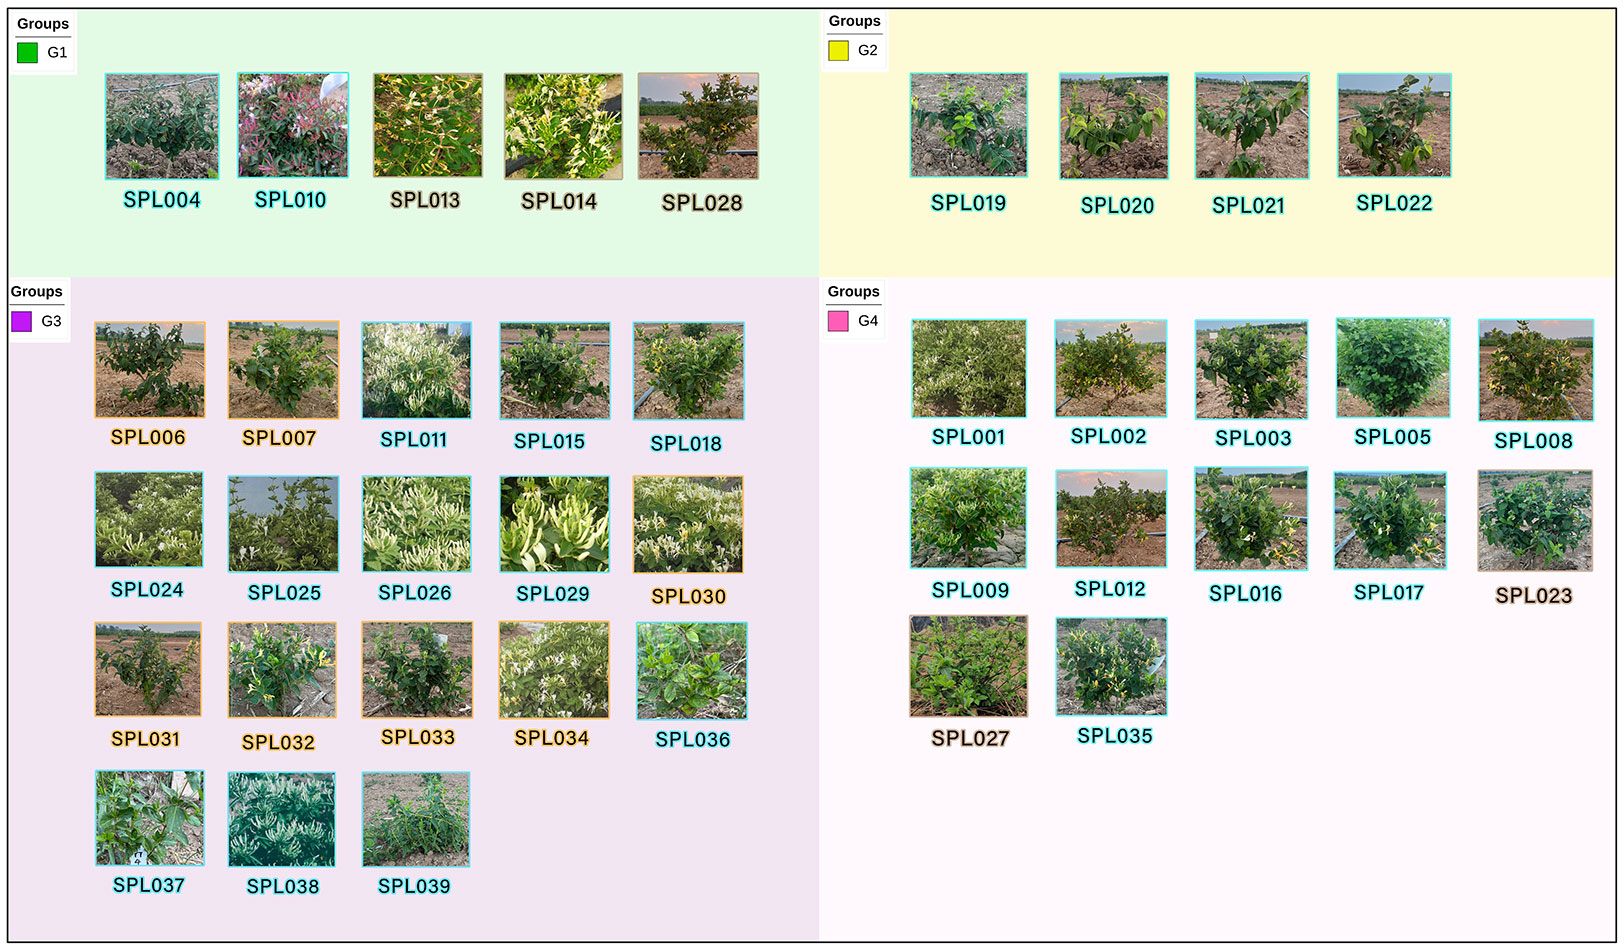
Figure 1 Simplified genome sequencing of 39 wild and cultivated varieties of L. japonica and L. macranthoides in China. Groups G1, G3, and G4 are L. japonica and Group G2 is L. macranthoides. Blue represents cultivar, orange represents wild, and brown represents crossbreed.
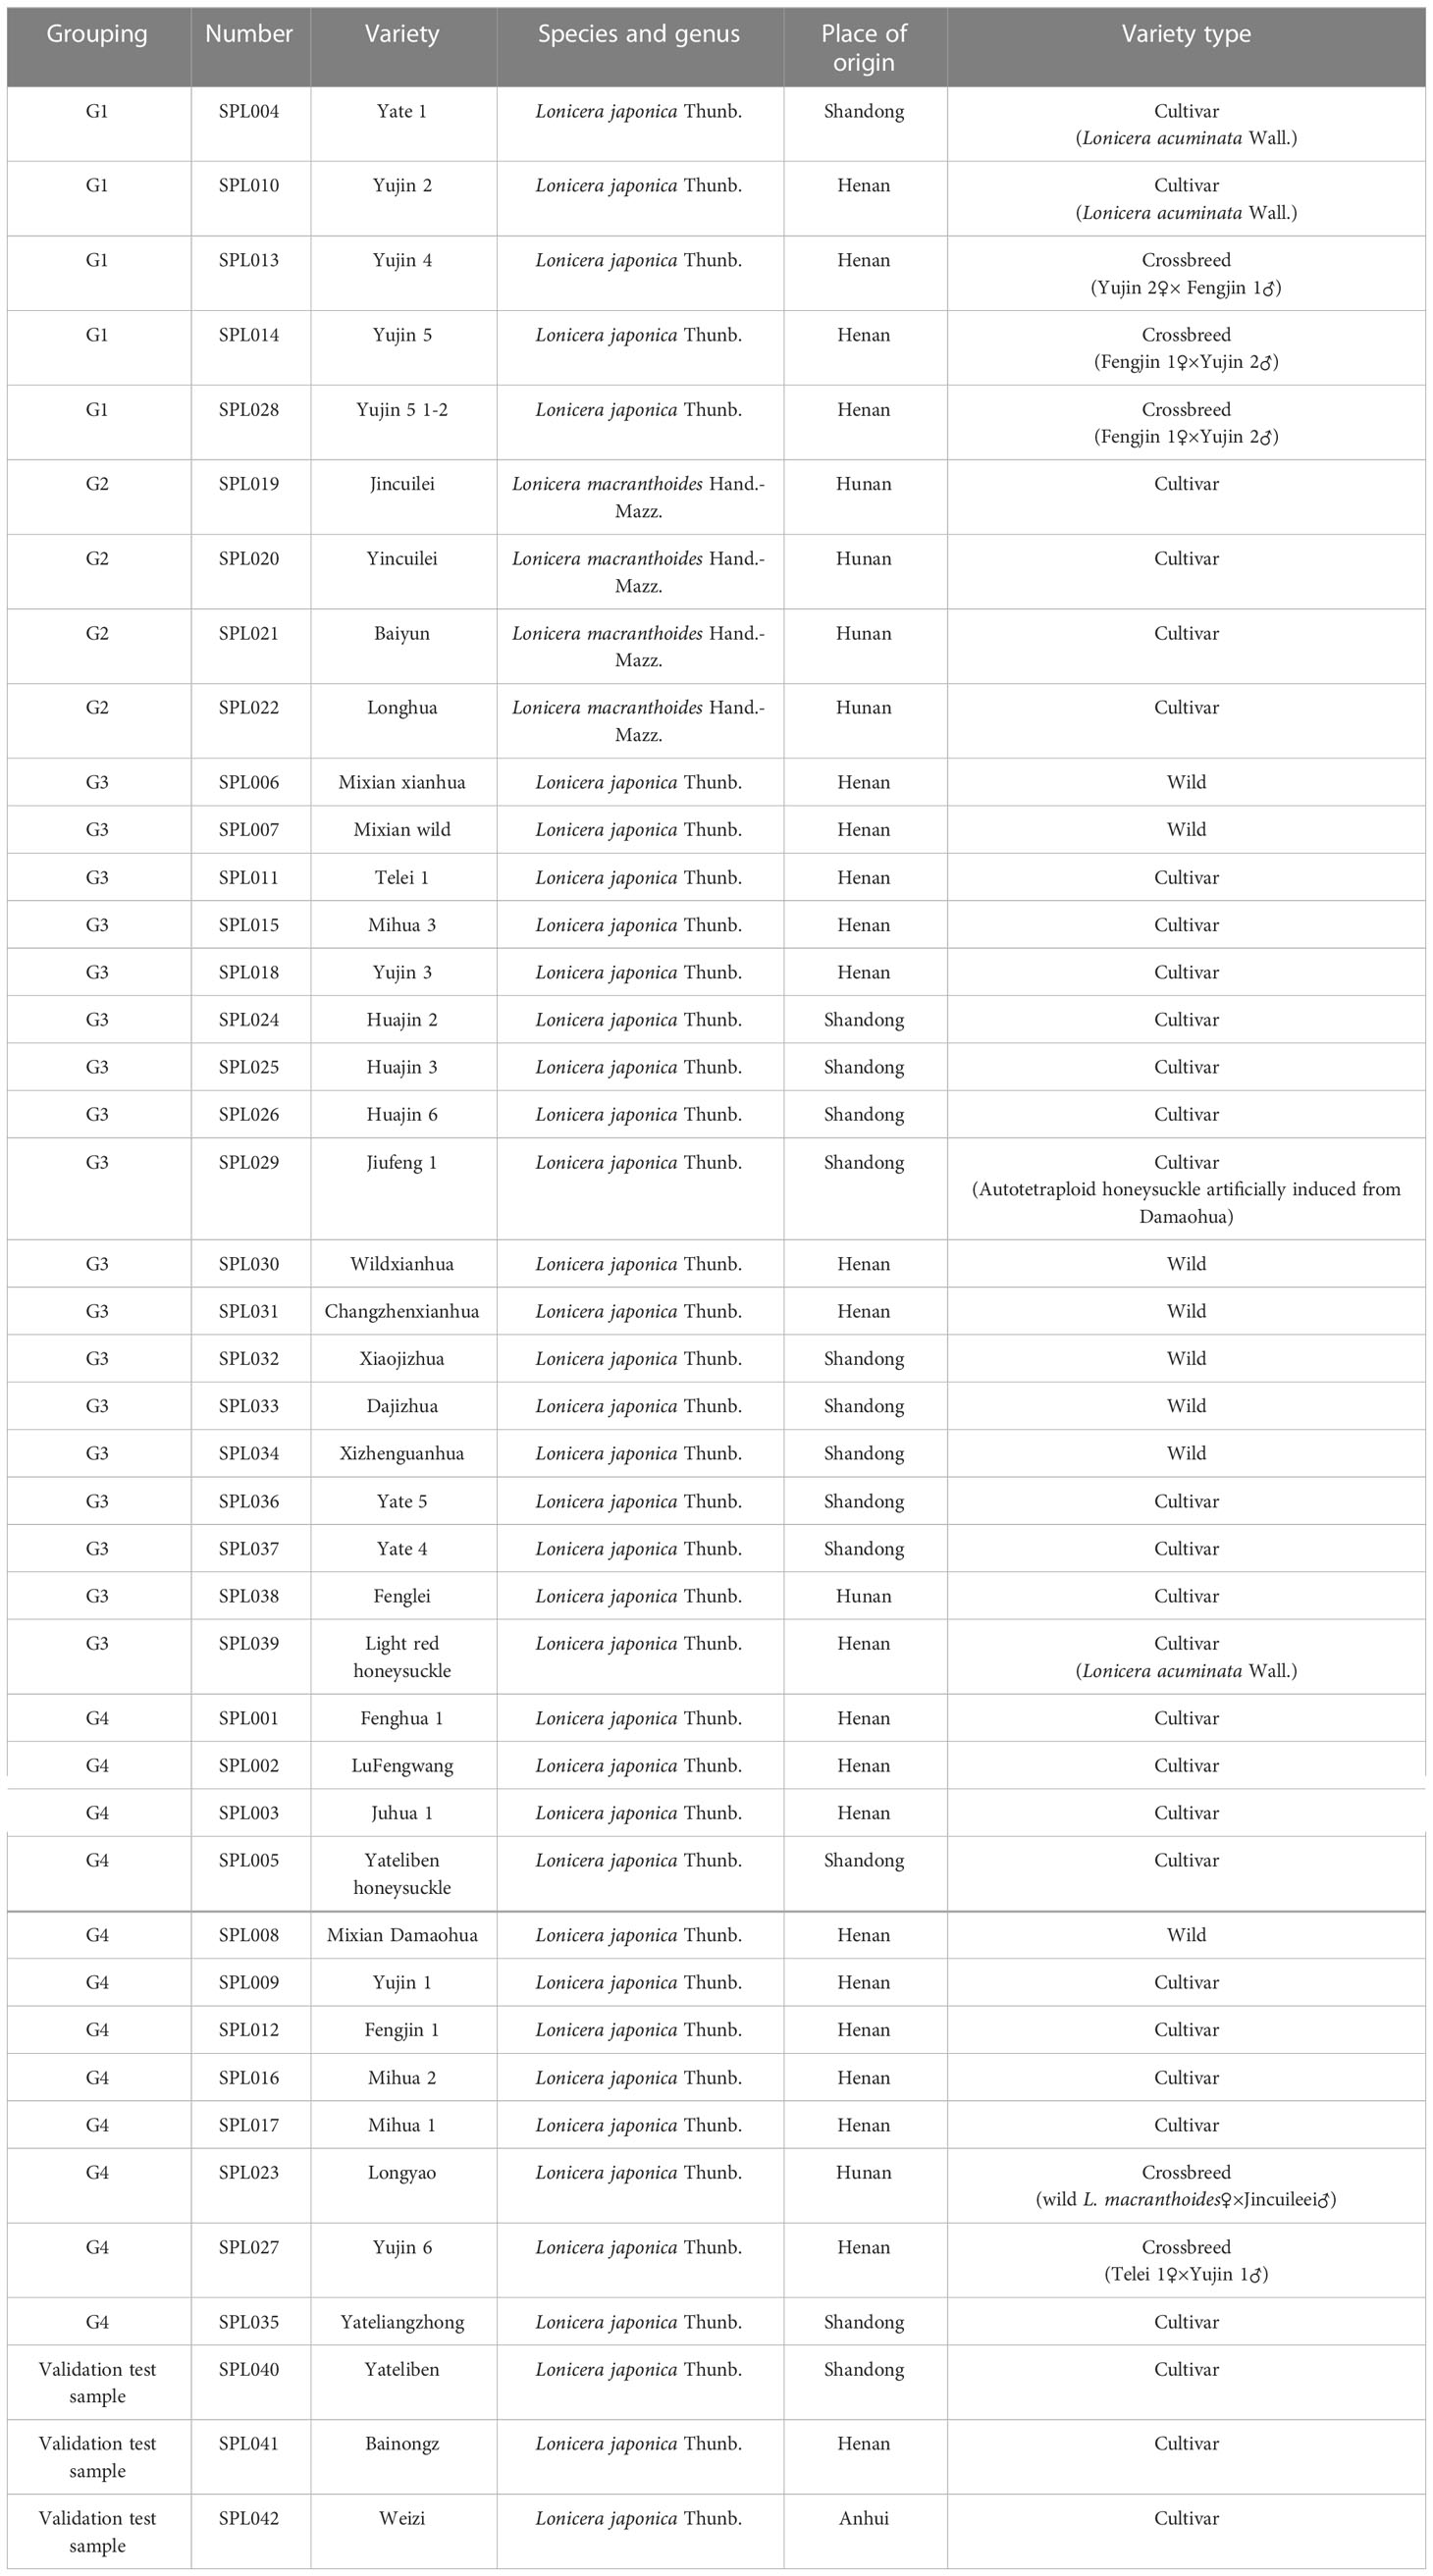
Table 1 Main information on 39 samples.
DNA extraction and library construction
After grinding the leaf samples, genomic DNA was extracted using a Plant Genomic DNA Kit (TIANGEN, China), and the quality and concentration of DNA were measured using a NanoDrop2000 UV spectrophotometer (Thermo Fisher, Waltham, MA, USA). Then, a paired-end library with a length range of 300–500 bp was constructed via double-digested (ddRAD) library construction of qualified sample DNA. First, 500 ng of genomic DNA was reacted with 0.6U EcoRI (NEB), T4 DNA ligase (NEB), ATP (NEB), and EcoRI connectors (including index sequences of differentiated samples) at 37°C for 3 h and annealed at 65°C for 1 h. The restriction enzyme NlaIII (NEB) and the NlaIII connector were then added and allowed to react for 3 h at 37 °C. After the reaction, the endonuclease was inactivated at 65°C for 30 min in a polymerase chain reaction (PCR) amplifier. Digested products of 400–600 bp were recovered via agarose gel electrophoresis and quantified using Qubit 3.0 (Life Technology). After mixing 39 samples in equal quantities, an Illumina TruSeq kit was used to construct a DNA library of the mixed products (Hanania et al., 2004).
Simplified genome sequencing and reference genome alignment
An Illumina NovaSeq 6000 PE150 was used for sample sequencing after library construction, and data quality control was performed on the original sequenced reads (Dellaporta et al., 2016). Fastp software (version: 0.20.0) was used to remove reads with an unknown base number N <5, reads with a length of bases <50%, quality value <5, connector sequences, and other low-quality sequences to obtain clean data. The detailed parameters were set to -q5 -n5. Burrows–Wheeler Aligner (BWA, 0.7.17-R1188) was then used to compare the sequenced reads with the reference genome (Byers et al., 2012). The reference genome used was the GWHAAZE000,000,000 genome Fasta (L. Lonicera) (download website: https://ngdc.cncb.ac.cn/search/?dbId=gwh&q=SAMC097356), and the parameters were set as -M -R. The insert size and coverage depth of each sample were counted, and variation was detected by comparing the positions of clean reads on the reference genome (Chao et al., 2009). Then, the same files generated by the comparison were converted to bam format using Samtools software (version: 1.9). Finally, Picard MarkDuplicates (version 2.21.2) was used to detect duplicate tags, and high-quality reads were retained for subsequent analysis.
SNP analysis
The Genome Analysis Toolkit software (GATK) (https://gatk.broadinstitute.org/hc/en-us; version 4.1.4.1) HaplotypeCaller function was used to call variable outliers. The FilterVCF function was used to filter low-quality mutation sites to obtain the final SNP site set and obtain SNP statistics (Huang et al., 2013). The genome file and the structure annotation gff file were used to annotate the variable outliers using the eff mode in the snpEff software (version 4.3t) (Pariasca-Tanaka et al., 2015). SNPs and INDELs were screened according to the following criteria (Elbasyoni et al., 2018): average sequencing depth ≥5× (Davey et al., 2011), minor allele frequency (MAF) ≥0.05, information integrity ≥0.70, SNP quality value Q ≥30, QD <2.0, MQ <40.0, FS >60.0, SOR >6.0, MQRankSum <−12.5, and ReadPosRankSum <−8.0 (Angel et al., 2012).
Genetic diversity and population structure analysis
Based on the high-quality SNPs obtained, GCTA software (version 1.92.1, http://cnsgenomics.com/software/gcta/#Overview) was used to perform principal component analysis (PCA) (Abdelhafez et al., 2019) with the following parameter settings: – make grm – autosome (Gong et al., 2016). The maximum likelihood (ML) method in FastTree software (version 2.1.9) was used to construct an evolutionary tree of 39 Lonicera samples (Saxena et al., 2012). Finally, admixture software (Sorkheh et al., 2007) (version 1.3.0) was used to analyze the population genetic structure (Jaganathan et al., 2015).
Fingerprint construction
DNA fingerprint construction was performed based on the high-quality SNPs obtained (Xu et al., 2017). As few markers as possible were used to identify as many varieties as possible to achieve the purposes of simplicity, efficiency, and economy (Wang et al., 2009). Fifty core markers with a high detection rate and significant amounts of polymorphism that could distinguish all varieties were screened out based on the size of the polymorphic information content (PIC) value and distribution frequency (Pavana et al., 2012), and then a DNA fingerprint was constructed. Furthermore, the 15 leanest SNP combinations were further screened out (Jones and Mackay, 2015) to identify Lonicera varieties with lower costs and faster speeds.
Verification of SNP locus authenticity
Primers for the 15 SNP loci were designed using Primer Premier 5 software (Table 2), and the DNA of the validation test sample was extracted to conduct PCR. The parameters were set as follows: length, 18–30 bp; Tm value, 55–65 degrees; and GC content, 40%–70%. The primers were synthesized by Sangon Bioengineering Co., Ltd. (Shanghai, China). Four samples were randomly selected from 39 known samples, and three unknown samples were added (Table 1). A total of seven verification DNA samples were selected as templates for PCR amplification. The total volume of the PCR mixture was 25 μl, containing 1 μl DNA template (100 ng/μl), 1 μl each of Primer F and Primer R (10 pmol/L), 0.2 μl Taq Plus DNA polymerase (5 U/μl), 2.5 μl 10× PCR buffer with Mg2+, and 1 μl dNTP (10 mM). The PCR reaction program involved pre-denaturation at 95°C for 5 min, denaturation at 94°C for 30 s, annealing for 30 s to 63°C, and extension at 72°C for a total of 30 s; this was repeated for 30 cycles, after which there was a final extension at 72°C for 10 min before storage at 4°C. After PCR amplification, 5 μl of PCR products were taken and subjected to 1% agarose gel electrophoresis at 150 V and 100 mA. After 10–20 min of observation, the target PCR band was cut from the gel, recovered, and then sequenced using 3730XL. The sequencing data were searched in the results group, and sequence analysis software SnapGene was used for analysis. Finally, SeqMan software was used to observe the peak map to test the reproducibility, genetic stability, and specificity of 15 SNPs.
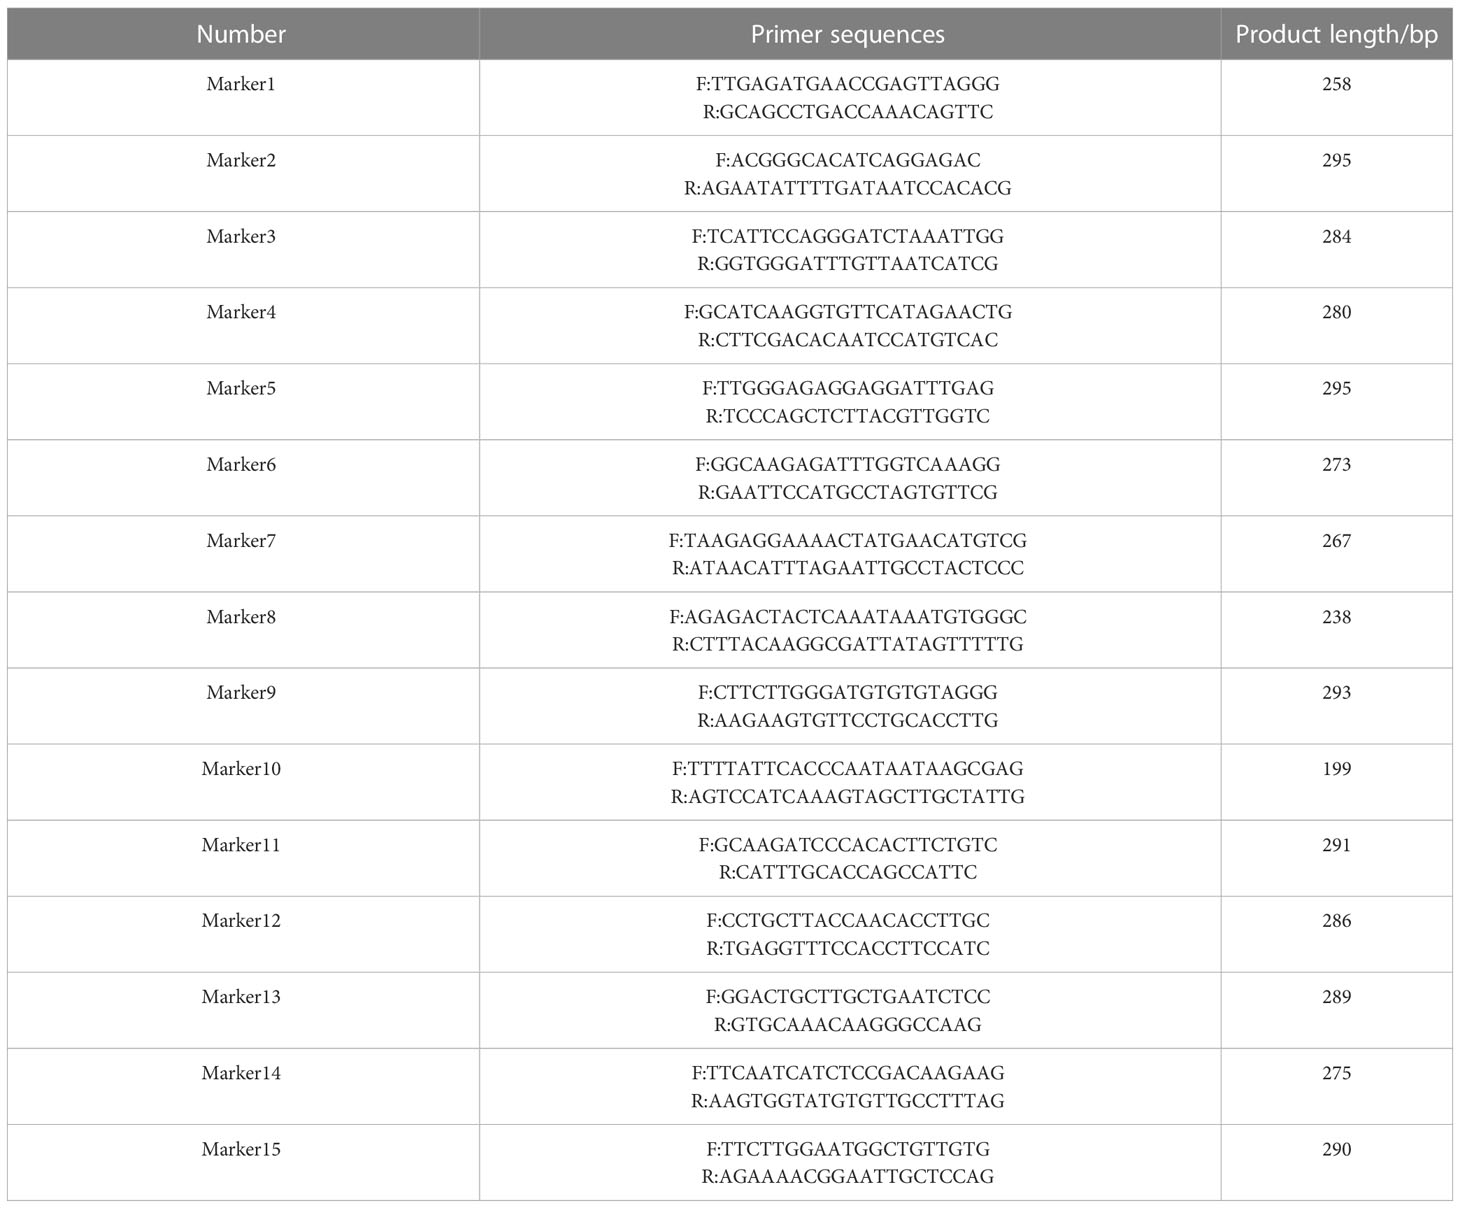
Table 2 Primer information.
Results
Simplified genome sequencing and reference genome alignment
The sequencing of 39 Lonicera samples on the Illumina NovaSeq 6000 PE150 yielded a total of 84.88 Gb of clean data, and Q30 reached more than 93.25% per sample (Table 3). The obtained clean reads were mapped to the reference genome, and the mapping efficiency reached 99.38% (Table 4).
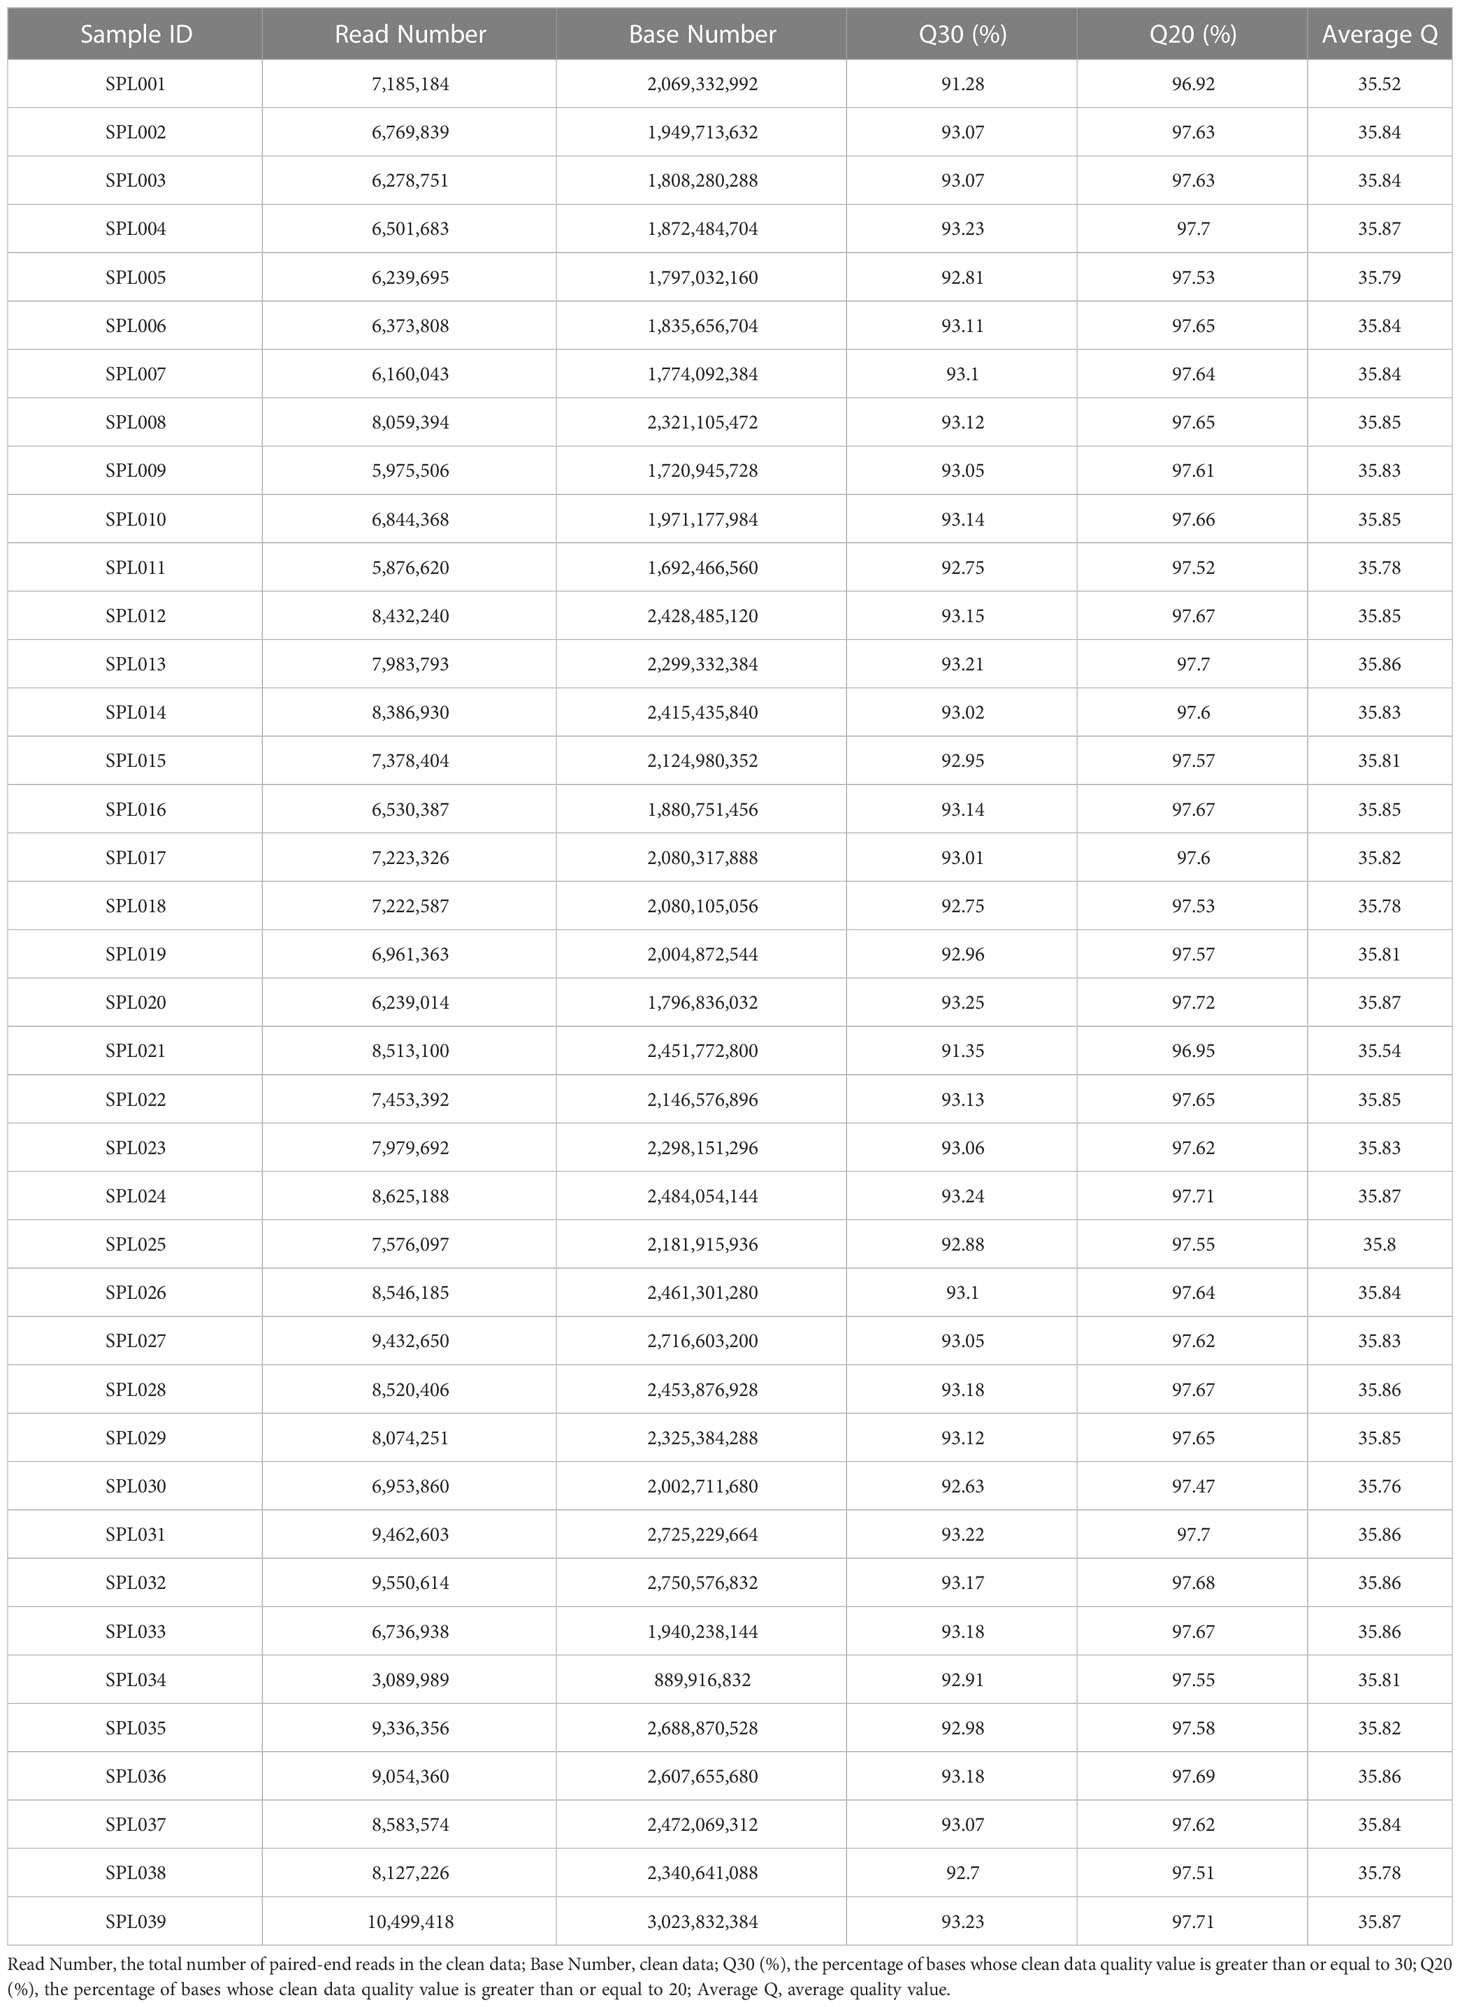
Table 3 Evaluation of sample sequencing data.
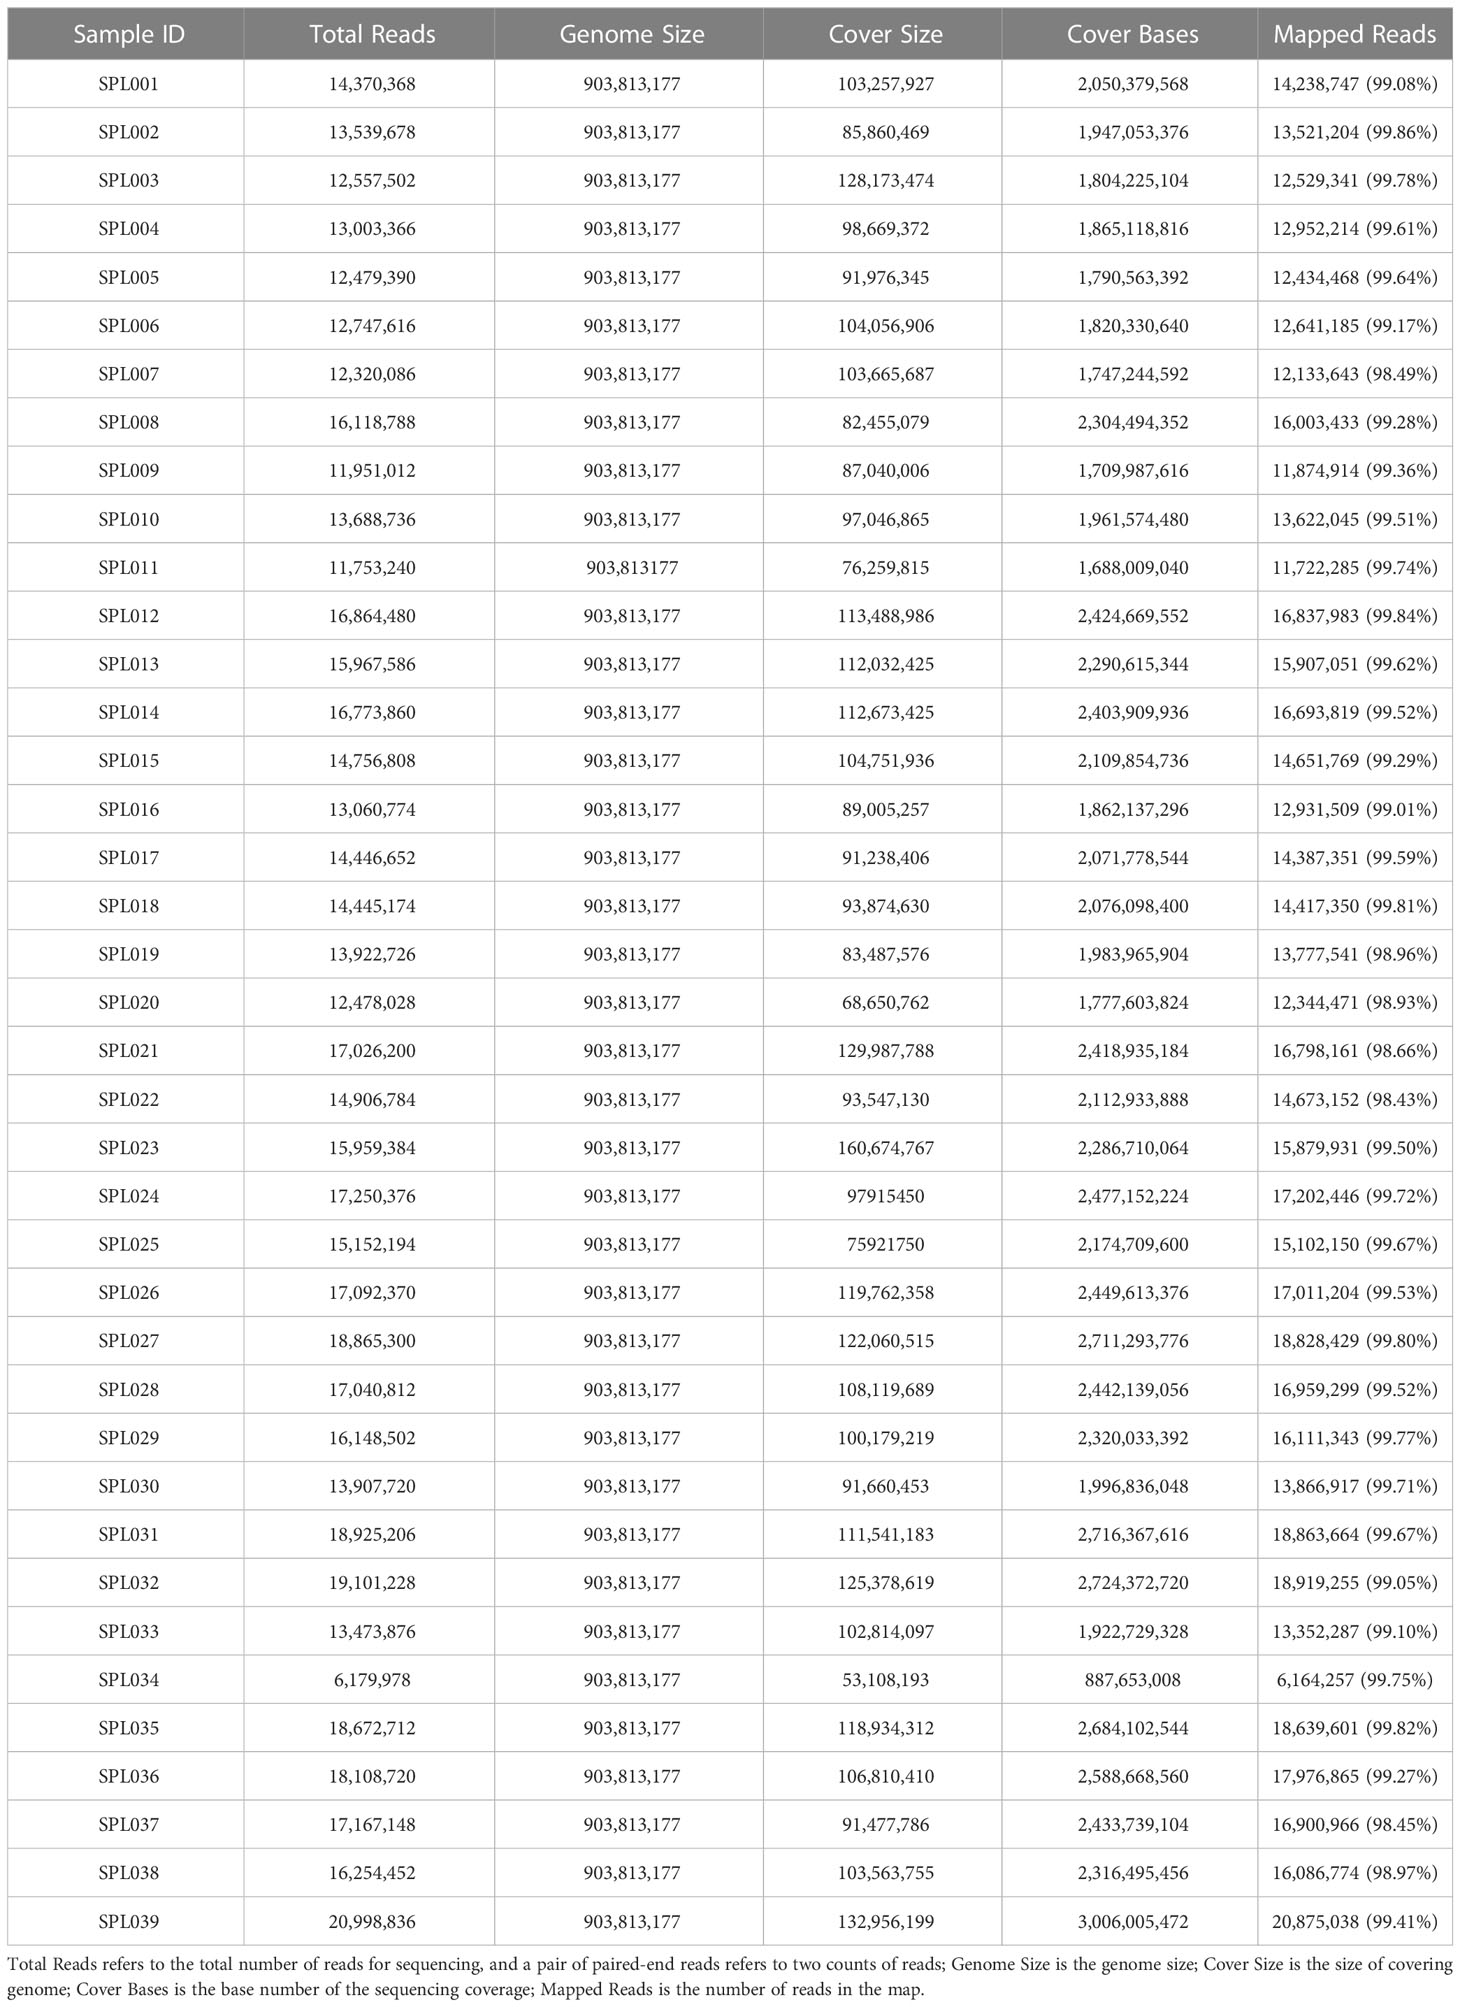
Table 4 Statistics of sample map results.
Selection and identification of high-quality SNPs
After sequencing, GATK software detected many SNP variants in 39 Lonicera samples; sequencing generated a total of 13,143,268 SNPs (Figure 2A). A total of 3,374,929 filtered SNPs were obtained, distributed on nine chromosomes (Figure 2B). Finally, the SNP distribution map on each chromosome was drawn according to the number and density of SNPs (Figure 2C). There were about 400,000 SNPs on chromosome GWHAAZE000000000 1 and 600,000 SNPs on chromosome GWHAAZE000000000 2. For chromosomes GWHAAZE000000000 3 to 9, the numbers of SNPs on these six chromosomes were similar, and there were about 300,000 SNPs on each chromosome.
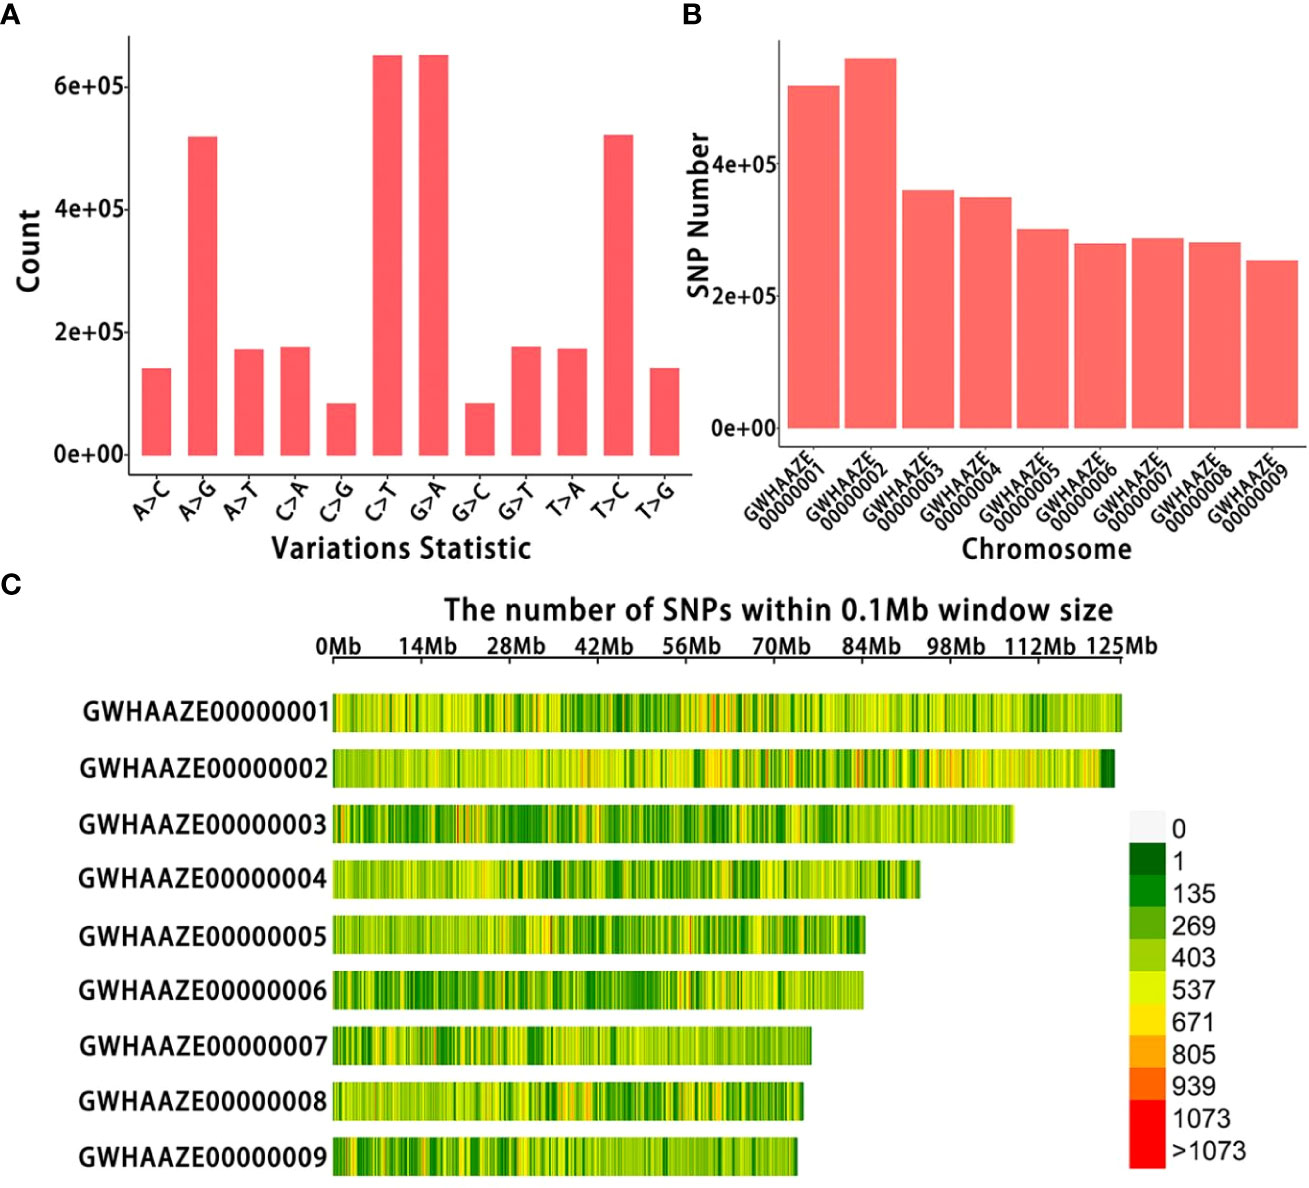
Figure 2 Single nucleotide polymorphism (SNP) identification of 39 Lonicera samples. (A) Number of SNP types. The horizontal axis represents the different types of SNP mutations, and the vertical axis represents the number of mutations. (B) Number of SNPs on each chromosome. The horizontal axis represents the chromosome number, and the vertical axis represents the number of SNPs. (C) SNP density distribution on each chromosome. The horizontal axis represents the chromosome length, and the vertical axis represents the chromosome number. Different colors represent the number of SNPs in different regions.
Genetic relationships and population structure analysis
The PCA of high-quality SNPs screened from 39 Lonicera samples was conducted using GCTA software. L. macranthoides samples from Hunan were clearly clustered on one side (Figure 3A and Table 1), while L. japonica samples from the same species were clustered on the other side (Figure 3B and Table 1). For the two clusters classified by species, detailed clustering classification was further conducted according to a variety of characteristics of different Lonicera samples. For example, honeysuckle varieties with red flower buds were clustered together. Crossbred samples were completely clustered together. Admixture software was used to analyze the population structure of the 39 Lonicera samples. The cross-validation error rate was the lowest when K = 4, a result that was consistent with the variety characteristics and source classification of the 39 Lonicera samples (Figure 3C and Table 1). The 39 Lonicera germplasm resources were divided into four subgroups (Figures 3D, E).
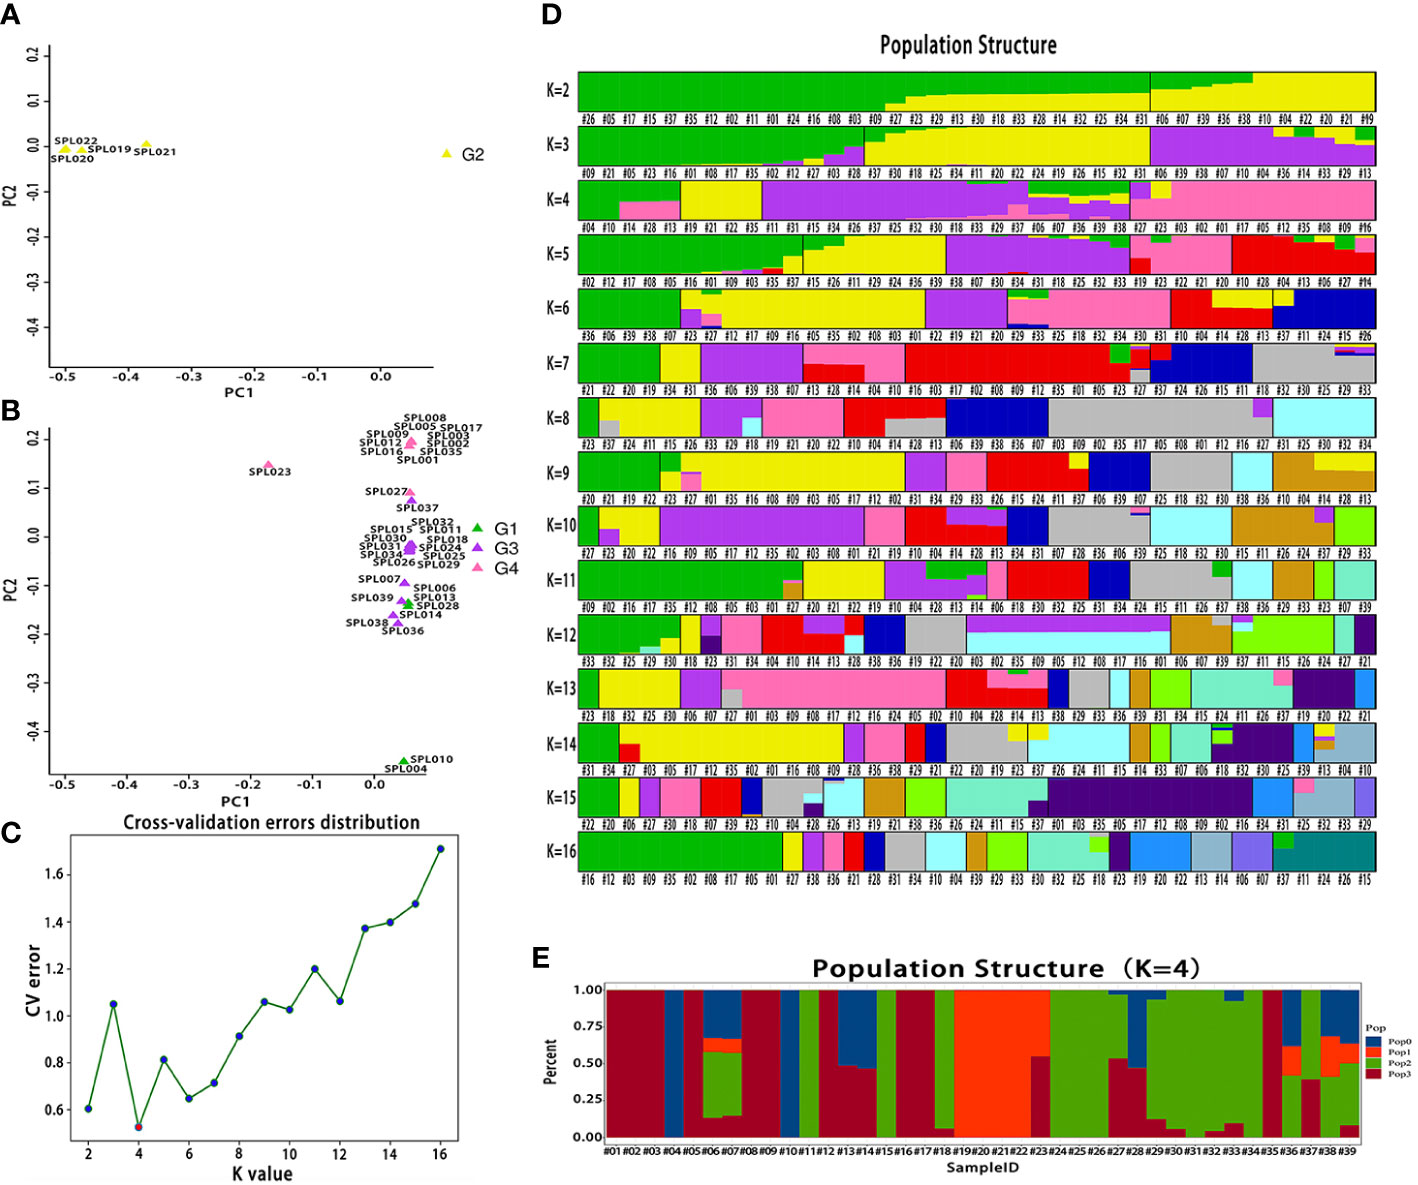
Figure 3 Bioinformatic analysis of 39 Lonicera varieties based on single nucleotide polymorphisms (SNPs). (A) A two-dimensional diagram of principal component analysis (PCA). (B) The cross-validation error rate corresponding to different K values. (C) Population structure of 39 Lonicera varieties at different K values. The K value represents the cross-validation error rate. (D) Population structure of 39 Lonicera samples when K = 4.
Finally, FastTree software was used to construct an evolutionary tree, and the 39 Lonicera samples were clustered into four groups (Figure 4), consistent with the results of the PCA and the population structure analysis. In addition, through further analysis, we found that the four clusters also had high similarity in phenotype, species, and origin. Each group was supported by a high bootstrap value.
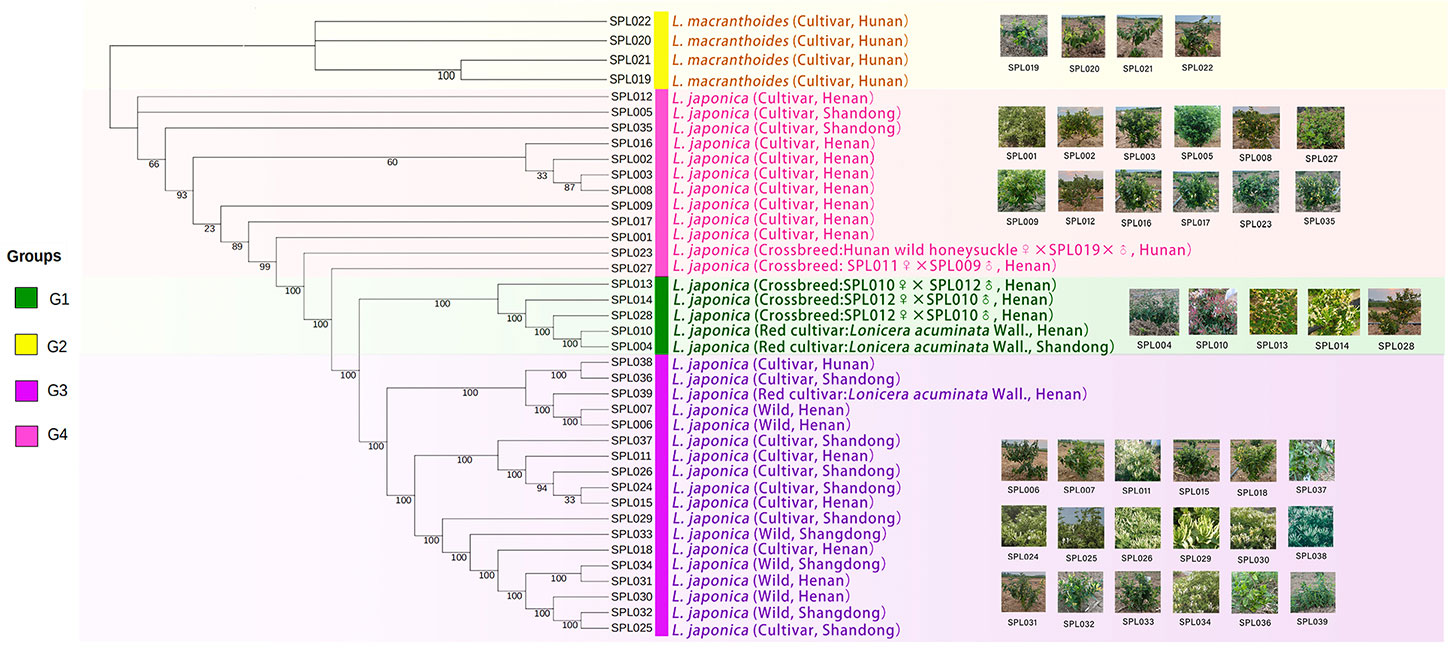
Figure 4 Phylogenetic tree of 39 Lonicera varieties. G1 is a L. japonica variety with red and light red flower buds; outgroup G2 is L. macranthoides; G3 is mainly wild L. japonica from Shandong and Henan; and G4 is a mature and highly recognized L. japonica in the current market. The text annotation in the figure is: species name (species type, origin).
Construction of a DNA fingerprint
Based on the results of simplified sequencing, SNP loci with a PIC value greater than 0.30 that were uniformly distributed on nine chromosomes were screened as the core loci for the construction of the Lonicera variety fingerprint. Finally, 50 SNP loci were selected for constructing the fingerprint, and all varieties were distinguished (Figure 5A). Among the 50 core SNPs, loci Markers 8, 17, 23, and 32 had the highest PIC value of 0.38. Marker 4 had the lowest PIC value of 0.30. The average PIC value was 0.35, indicating moderate polymorphism. Using this set of core SNP loci combinations, 39 samples of Lonicera were compared in pairs. The statistical results for the number of different loci between the samples showed many different loci between each pair. To quickly and cheaply distinguish Lonicera varieties, in this study we screened out the combination with the minimum number of SNPs that could distinguish 39 Lonicera varieties from the obtained 50 core loci; we obtained the most simplified SNP combination that contained 15 SNPs distributed on eight chromosomes (Figure 5B). When using the combination of 15 SNPs to distinguish samples, there was at least one different SNP between each of the two samples that could effectively distinguish the 39 Lonicera varieties.
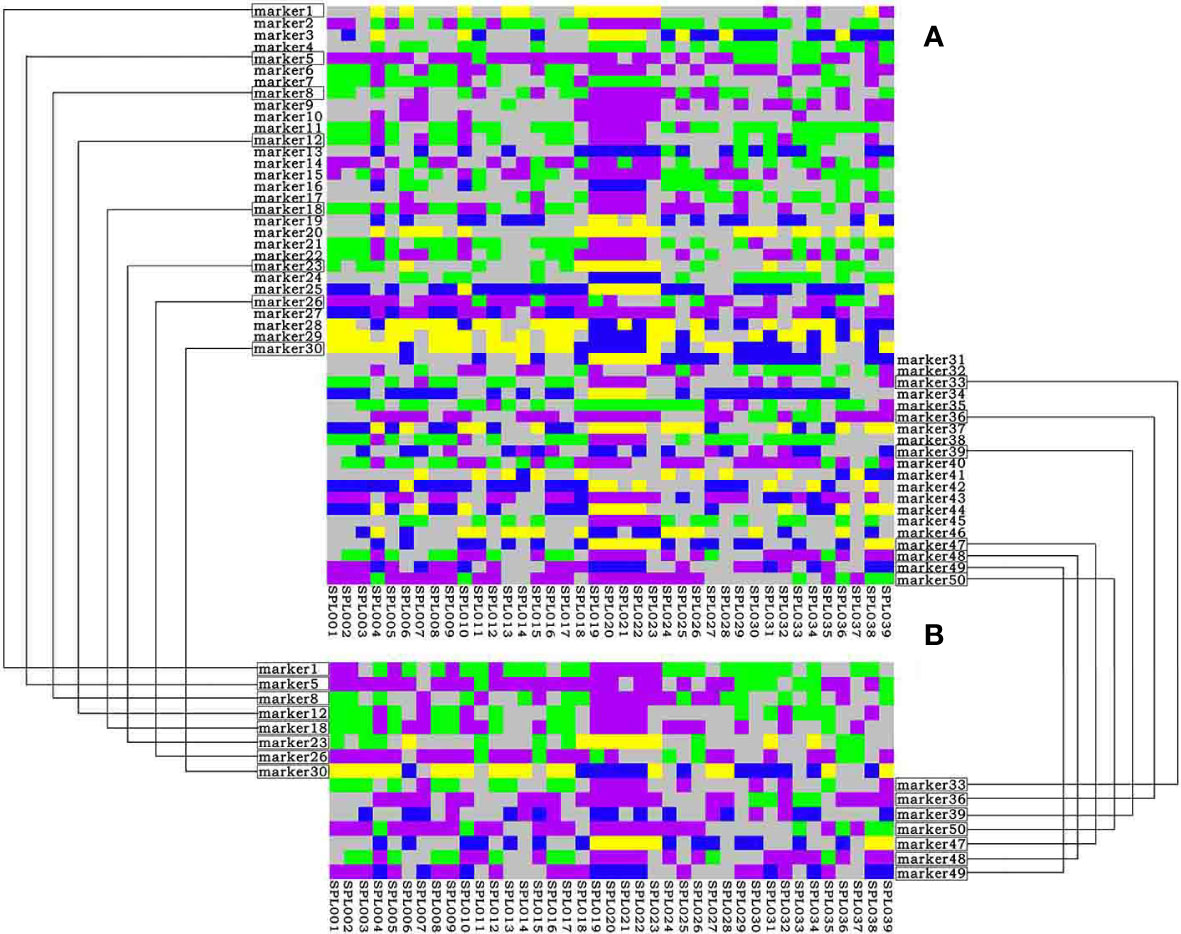
Figure 5 DNA fingerprinting of 39 Lonicera samples. (A) DNA fingerprint is composed of 50 single nucleotide polymorphisms (SNPs). (B) DNA fingerprint composed of 15 SNPs. Homozygous genotypes C/C, A/A, T/T, and G/G are represented by yellow, green, blue, and purple, respectively; heterozygous genotypes are represented by gray; deletion genotypes are represented by white.
Some Lonicera samples could only be distinguished based on one SNP. For example, “Longhua” (SPL022), “Yincuilei” (SPL019), and “Jincuilei” (SPL020) could only be distinguished by Marker 7; “Yujin 2” (SPL010) and “Yate 1” (SPL004) could only be distinguished by Marker 6. “Yujin 5” (SPL014) and “Yujin 5 1-2” (SPL028) could only be distinguished by Marker 11. These results also illustrate that it is difficult to develop fingerprints against the background of complex and chaotic genetic relationships in L. japonica germplasm.
Verification of SNP loci and genetic stability of honeysuckle
We randomly selected four samples, “Yujin 1,” “Yujin 2,” “Mixian Damaohua,” and “Telei 1,” from a set of 39 samples to verify the reproducibility of SNPs. Fifteen SNPs had the same site specificity as the previous test results (Table 5), with a clear and clutter-free locus peak map, 100% reproducibility, and ideal results. Next, we tested the genetic stability of 2-, 5-, 7-, 8-, 9-, and 10-year-old plants of “Yujin No. 1.” The results showed that the genetic stability of honeysuckle of the same variety in different years was as high as 97.33% (Table 6). Finally, three new varieties, “Yateliben,” “Bainong 2,” and “Weizi,” were added to verify the specificity of 15 SNP loci (Table 7). The results showed that 15 SNP loci could effectively distinguish the genotypes of the newly added varieties (Supplementary Figure 2).
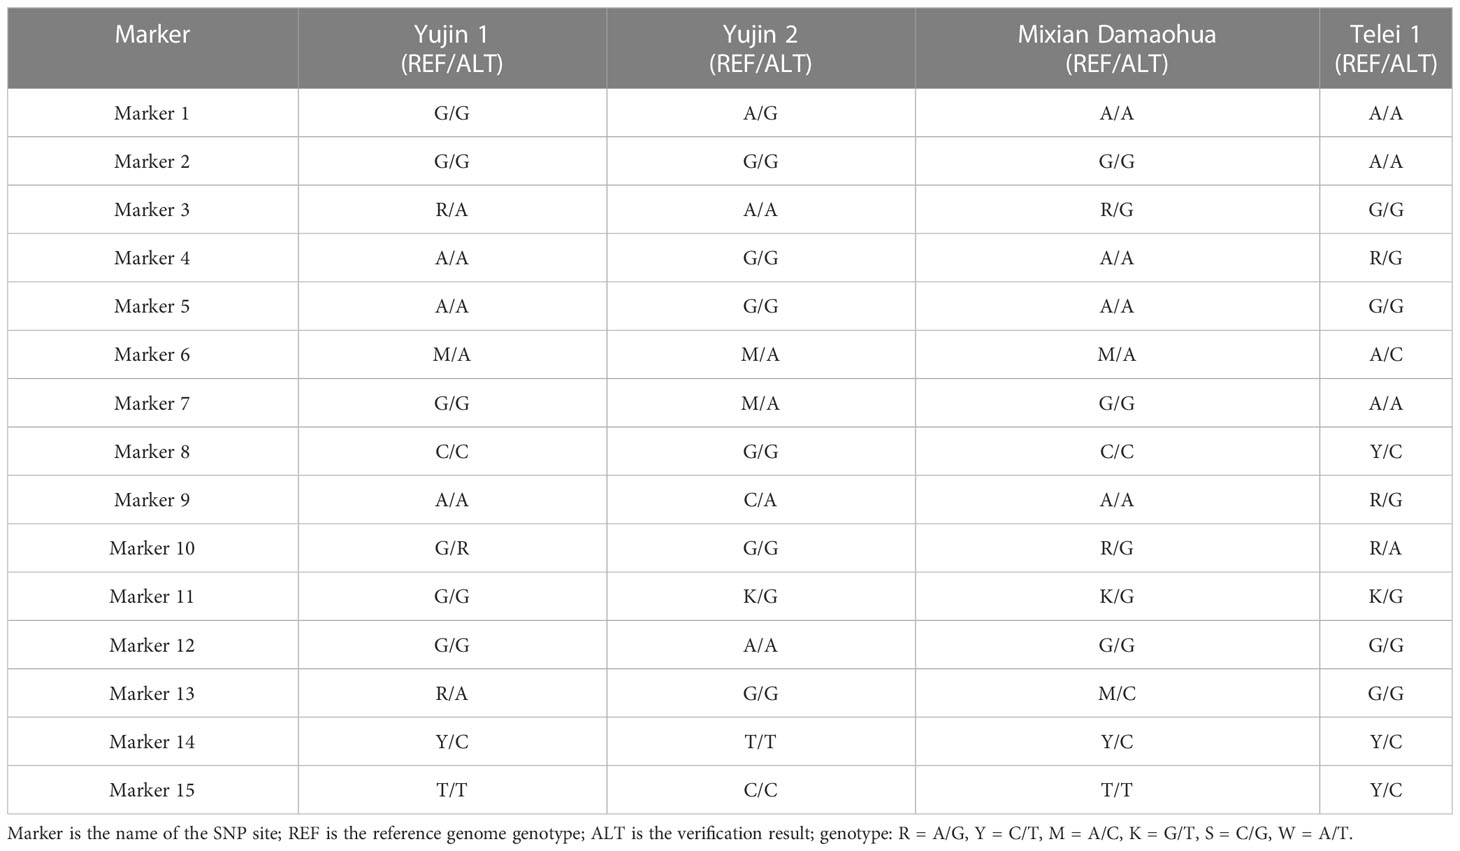
Table 5 Verification results of 15 single nucleotide polymorphism (SNP) sites.
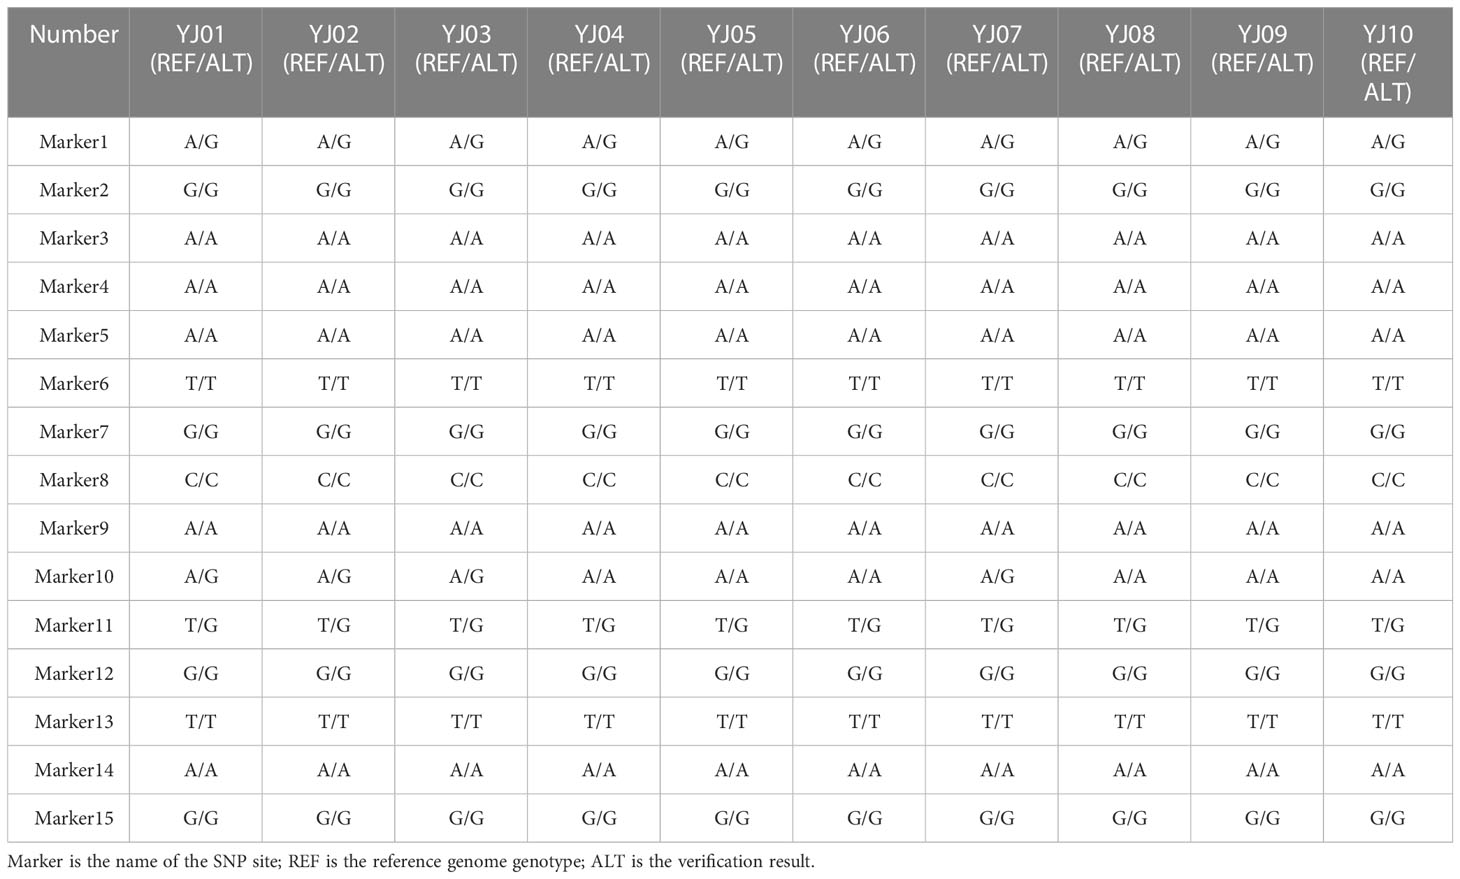
Table 6 L. japonica genetic stability test.
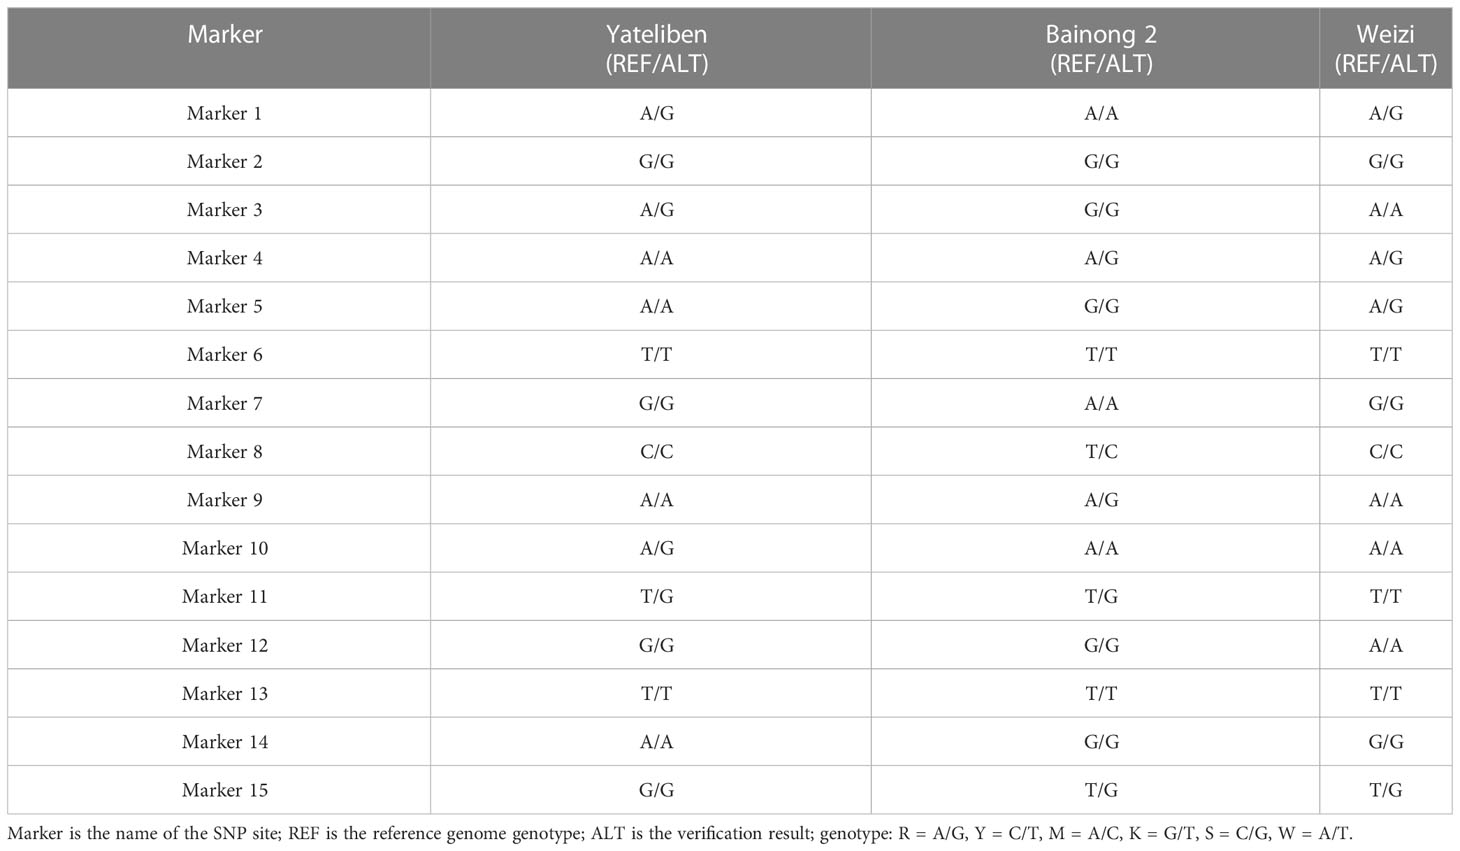
Table 7 Fifteen single nucleotide polymorphism (SNP) site specificity verification.
Discussion
SNP-based genetic relationships among the Lonicera
As the original and major producer of Lonicera, China has three main production areas: Fengqiu in Henan Province, Julu in Hebei Province, and Pingyi in Shandong Province (Song, 2020). The planting area of L. japonica in 2022 reached 1,066.7 km2 (Lv, 2020; Ma et al., 2022), with an annual output value of nearly 10 billion CNY (Liu, 2021; Liu, 2022). At present, many Lonicera varieties have been widely planted, but there has been a lack of standardized and decentralized management. Therefore, it was necessary to clarify the genetic relationship and population structure of existing Lonicera varieties.
The 2015 Edition of the Chinese Pharmacopoeia details the differences between L. japonica and Flos Lonicerae in medicinal history, sources, characteristics, chemical components, and other aspects, showing that Flos Lonicerae is classified as L. macranthoides, L. hypoglauca, L. confusa, and L. fulvotomentosa. L. macranthoides is more recognized because of its easy cultivation, large number of plants, and wide planting area. Lu et al. (2017) established the fingerprints of five batches of L. japonica and three batches of L. macranthoides using proton nuclear magnetic resonance (1H-NMR) that provided a basis for the quality control analysis of L. japonica and L. macranthoides. Ren et al. (2022) used microscopy and thin-layer chromatography (TLC) to evaluate the quality of L. japonica varieties in Henan, Hebei, Shandong, and other areas and concluded that the index components of Shandong L. japonica were the highest. This work provided a scientific basis for the selection of raw materials for honeysuckle decoctions. Deng et al. (2021) conducted a comparative study on tree-shaped and wild-type L. japonica using HPLC fingerprints and found that wild L. japonica contained more chemical components, while tree-shaped L. japonica was more consistent. Li et al. (2020) conducted a comparative analysis of the characteristics and pharmacological effects of L. japonica and L. macranthoides, providing data support for their application in traditional Chinese medicine. The related studies focused on Lonicera in the early stages; most of the studies on the germplasm focused on morphological analysis, index component differences, and quality evaluation among varieties, while there was almost no research on the genetic relationships and population structure of Lonicera species and varieties.
In this study, 39 existing Lonicera germplasm resources in China were collected and divided into four subgroups via simplified sequencing, PCA, population structure analysis, and evolutionary tree construction. Subgroup I contains the red variety L. acuminata of L. japonica. Subgroup II contained L. macranthoides. Subgroup III comprises the main, wild, and hybrid varieties of L. japonica from Shandong and Henan. Subgroup IV contained cultivars of L. japonica that comprised varieties with high yields, strong resistance to pests and diseases, and good characteristics that have been recognized on the current market, for example, SPL009, SPL002, SPL003, and other varieties. Based on these results, it should be clear that the lineages of wild Lonicera species were extremely complex, while the lineages of systematically bred L. japonica were relatively simple. For example, “Mixian xianhua” (SPL006), “Mixian wild” (SPL007), and “Mixian Damaohua” (SPL039) are wild varieties of L. japonica with extremely complex genetic relationships. In the population structure analysis, they all had ancestral lines from the four subgroups. However, the genetic relationship between “Yujin 1” (SPL009) and “Yate liangzhong” (SPL035) was simple and derived from one pedigree. After further analysis, this study also clarified the controversial genetic relationship of “Longyao” (SPL023), a variety produced in Hunan, as belonging to L. macranthoides. However, our results confirmed that “Longyao” (SPL023) was a cross-species hybrid of a female parent L. japonica and a male parent L. macranthoides, which explained why it simultaneously had the pedigree of two subgroups in the PCA and population structure analysis. The genetic relationship of “Yujin 6” (SPL027) was further clarified, and the results showed that it was crossbred from the female parent “Telei 1” (SPL011) and the male parent “Yujin 1” (SPL009). This finding well explained its position in Group IV of the evolutionary tree. In addition, four other hybrids were used in this study. Population structure analysis showed that all hybrids have genetic genes from their parents, which was largely consistent with expectations. At present, this research group is conducting a more in-depth analysis of hybrid characteristics.
Identification of 39 Lonicera germplasm resources by SNP fingerprints
Different from most previous studies focusing on honeysuckle morphology and quality evaluation (Li et al., 2022), the present study focused on aspects including analyzing the population structure of L. japonica, excavating the differences among varieties of L. japonica, and using SNP to distinguish varieties of L. japonica. This work can not only explain the population relationships of existing Lonicera germplasm resources but can also further clarify the genetic relationships between Lonicera varieties. These results provide a favorable reference and a basis for the management of Lonicera germplasm resources and have important significance for the breeding of new Lonicera varieties in the future.
In this study, SNP molecular marker technology and DNA fingerprinting technology were used; 3,374,929 SNPs were obtained from 39 samples of Lonicera; 50 core SNPs with a strong ability to identify Lonicera germplasm were screened; and DNA fingerprints were constructed. A fingerprint map constructed with 50 core SNP markers effectively identified and distinguished differences among different species and varieties of Lonicera. In addition, this study further filtered out 15 SNPs as the most compact site combination. The DNA fingerprints constructed based on the 15 SNP loci were used to detect different Lonicera samples, and ≥1 different locus was found in each Lonicera variety that could be used to distinguish different species and varieties rapidly, accurately, and at a low cost.
Considering the extremely complex genetic background of Lonicera germplasm, this study conducted further research on varieties that had several different loci ≤1 in the fingerprints of 15 SNP loci. After further analysis, it was found that these varieties not only had high repeatability in DNA fingerprints but also had high similarity in origin, species, and characteristics. For example, “Mihua 1” (SPL017) and “Fengjin 1” (SPL012) were introduced and domesticated from “Mixian Damaohua” (SPL008). The varieties “Longhua” (SPL022), “Jincuilei” (SPL020), and “Yincuilei” (SPL019) originated from Hunan Province and were L. macranthoides “Yujin 2” (SPL010) and “Yate 1” (SPL004) had purplish red flower buds and were red varieties of L. japonica. “Yujin 5” (SPL014) and “Yujin 5 1-2” (SPL028) were both hybrids, and their parents were the same varieties (Table 1). Therefore, it was concluded that when the difference in the DNA fingerprint between two varieties is ≤1 locus, it means that the two varieties have certain similarity in species, origin, parents, flower color, etc., which is very likely to be two identical or similar varieties.
Reliability and stability of Lonicera SNP fingerprints
To verify the reliability of the DNA fingerprints comprising 15 SNP loci, four samples were randomly selected from the original 39 samples, and 15 SNP loci were analyzed via PCR and Sanger sequencing. The 15 SNP verification results were completely consistent with the previous test results. Subsequently, genetic analysis was conducted on 10 honeysuckle samples of the same variety from different years. The results showed that the genetic stability of these honeysuckle samples was extremely strong, reaching 97.33%, a level that was consistent with the characteristics of honeysuckle as a vegetatively propagated plant. However, it is worth noting that the genotypes of the two-year-old samples “J01,” “YJ02,” and “YJ03” and the five-year-old sample “YJ07” changed from A/A to A/G in Marker 10, a result that may have been related to the second allele of the SNP. However, as a vegetatively propagated plant, the genetic traits of honeysuckle are very stable, and the probability of genetic mutation between the same varieties is very low; thus, this phenomenon was most likely caused by the duality of SNP sites. Finally, three new varieties verified the specificity of SNPs, further demonstrating the reliability of the SNPs and DNA fingerprints developed in this study.
In general, the verification results of the 15 SNP loci and the genetic stability of honeysuckle were in line with expectations; the analysis not only confirmed that the 15 SNP loci constituted the authenticity and reliability of DNA fingerprints but also verified the high genetic stability of honeysuckle, providing a data reference and theoretical support for the identification of honeysuckle germplasm and the SNP fingerprint identification method.
Data availability statement
The original contributions presented in the study are publicly available. This data can be found here: NCBI, PRJNA895242.
Author contributions
JL conceived of the project. JL and XC designed the experiments. XC performed most of the experiments. QH assisted in preparing seedlings for experiments. PL and XZ helped overcome technical difficulties in SNP site validation. CC, XZ, FL, and YW assisted in analyzing the data. JL, XC, and CC interpreted the data generated in the figures and wrote the manuscript. All authors contributed to the article and approved the submitted version.
Funding
This work was supported by the Science and Technology Major Project of Xinxiang City (ZD2020002),the 2022 Provincial Financial Forest Germplasm Resources Construction Project Honeysuckle Germplasm Resources Construction, the Key project at central government level: The ability establishment of sustainable use for valuable Chinese medicine resources (2060302), and the Postgraduate Education Reform and Quality Improvement Project of Henan Province (YJS2023JD33).
Acknowledgments
We thank the staff of Nanjing Genepioneer Biotechnologies Co., Ltd. for their support in the simplified genome sequencing and SNP analyses. We also thank the staff of Sangon Bioengineering (Shanghai) Co., Ltd. for their support in the verification and analysis of the SNP sites.
Conflict of interest
The authors declare that the research was conducted in the absence of any commercial or financial relationships that could be construed as a potential conflict of interest.
Publisher’s note
All claims expressed in this article are solely those of the authors and do not necessarily represent those of their affiliated organizations, or those of the publisher, the editors and the reviewers. Any product that may be evaluated in this article, or claim that may be made by its manufacturer, is not guaranteed or endorsed by the publisher.
Supplementary material
The Supplementary Material for this article can be found online at: https://www.frontiersin.org/articles/10.3389/fpls.2023.1080691/full#supplementary-material
References
Abdelhafez, O. H., Othman, E. M., Fahim, J. R., Desoukey, S. Y., Abdelmohsen, U. R. (2019). Metabolomics analysis and biological investigation of three malvaceae plants. Phytochemical Anal. PCA 31 (2), 204–214 doi: 10.1002/pca.2883 doi: 10.1002/pca.2883
Angel, F., Athanson, B., Koepke, T., Carolina, F., Dhingra, A., Oraguzie, N. (2012). Genetic diversity and relatedness of sweet cherry (Prunus avium l.) cultivars based on single nucleotide polymorphic markers. Front. Plant Sci. 3, 279–286. doi: 10.3389/fpls.2012.00116
Azizi, M., Han, Y. L., Abu-Bakar, N. (2021). Integration of advanced technologies for plant variety and cultivar identification. J. Biosci. 46, 91. doi: 10.1007/s12038-021-00214-x
Byers, R. L., Harker, D. B., Yourstone, S. M., Maughan, P. J., Udall, J. A. (2012). Development and mapping of SNP assays in allotetraploid cotton. Theor. Appl. Genet. 124, 1201–1214. doi: 10.1007/s00122-011-1780-8
Chao, S., Zhang, W., Akhunov, E., Sherman, J., Ma, Y., Luo, M.-C., et al. (2009). Analysis of gene-derived SNP marker polymorphism in US wheat (Triticum aestivum l.) cultivars. Mol. Breed. 2009, 23, 23–33. doi: 10.1007/s11032-008-9210-6
Davey, J. W., Hohenlohe, P. A., Etter, P. D., Boone, J. Q., Catchen, J. M., Blaxter, M. L. (2011). Genome-wide genetic marker discovery and genotyping using next-generation sequencing. Nat.rev.genet 12, 499–510. doi: 10.1038/nrg3012
Dellaporta, S., Fragoso, C., Heffelfinger, C., Morena, M. (2016). Flexible and scalable genotyping-by-sequencing strategies for population studies. BMC Genomics 15, 979. doi: 10.1186/1471-2164-15-979
Deng, H. S., Li, X. L., Zhao, Y. M., Wang, X. J., Yang, W. Y., He, B., et al. (2021). Comparative study on HPLC fingerprints of tree honeysuckle and wild honeysuckle. J. Northwest A F Univ. (Natural Sci. edition) 49, 130–138+145. doi: 10.13207/j.cnki.jnwafu
Elbasyoni, I., Lorenz, A. J., Guttieri, M., Frels, K., Baenziger, P. S., Poland, J., et al. (2018). A comparison between genotyping-by-sequencing and array-based scoringof SNPs for genomic prediction accuracy in winter wheat. Plant Sci. 270, 123–130. doi: 10.1016/j.plantsci.2018.02.019
Freixas-Coutin, J. A., An, S., Postman, J., Bassil, N. V., Yates, B., Shukla, M., et al. (2019). Development of a reliable Corylus sp. reference database through the implementation of a DNA fingerprinting test. Planta 249, 1863–1874. doi: 10.1007/s00425-019-03131-4
Gazendam, I., Mojapelo, P., Bairu, M. W. (2022). Potato cultivar identification in south africa using a custom SNP panel. Plants (Basel) 11 (12), 1546. doi: 10.3390/plants11121546
Gong, D., Huang, L., Xu, X., Wang, C., Ren, M., Wang, C., et al. (2016). Construction of a high-density SNP genetic map in flue-cured tobacco based on SLAF-seq. Mol. Breed. 36, 100. doi: 10.1007/s11032-016-0514-7
Hanania, U., Velcheva, M., Sahar, N., Perl, A. (2004). An improved method for isolating high-quality DNA fromVitis vinifera nuclei. Plant Mol. Biol. Rep. 22, 173–177. doi: 10.1007/BF02772724
Hayward, A. C., Tollenaere, R., Dalton, M. J., Batley, J. (2015). Molecular marker applications in plants. Methods Mol. Biol. 21245, 13–27. doi: 10.1007/978-1-4939-1966-6_2
Hu, K. J., Wang, H. N., Yuan, H. F. (2022). Brief analysis on the research progress of honeysuckle in China. J. Hebei North Univ. (Natural Sci. edition) 38, 38–42.
Huang, S., Deng, L., Guan, M., Li, J., Wei, H. (2013). Identification of genome-wide single nucleotide polymorphisms in allopolyploid crop brassica napus. BMC Genomics 14, 717. doi: 10.1186/1471-2164-14-717
Jaganathan, D., Thudi, M., Kale, S., Azam, S., Roorkiwal, M., Gaur, P. M., et al. (2015). Genotyping-by-sequencing based intra-specific genetic map refines a ''QTL-hotspot" region for drought tolerance in chickpea. Mol. Genet. Genomics 290, 559–571. doi: 10.1007/s00438-014-0932-3
Jiang, C., Yuan, Y., Chen, M., Huang, L. (2013). Molecular authentication of multi-species honeysuckle tablets. Genet. Mol. Res. 12, 4827–4835. doi: 10.4238/2013.October.22.2
Jones, H., Mackay, I. (2015). Implications of using genomic prediction within a high-density SNP dataset to predict DUS traits in barley. TAG. theoretical and applied genetics. Theoretische und angewandte Genetik 128 (12), 2461–2470. doi: 10.1007/s00122-015-2601-2
Karunarathna, K. H. T., Mewan, K. M., Weerasena, O.V.D.S.J., Perera, S. A. C. N., Edirisinghe, E. N. U. (2021). A functional molecular marker for detecting blister blight disease resistance in tea (Camellia sinensis l.). Plant Cell Rep. 40, 351–359. doi: 10.1007/s00299-020-02637-6
Lan, Z. L. (2017). Collection and quality evaluation of traditional honeysuckle germplasm resources (Zhejiang Province: Lishui Forestry Research Institute).
Li, R. E. (2020). Study on the character identification and pharmacological action of honeysuckle and flos lonicerae. Clin. Res. Traditional Chin. Med. 12 (15), 118–119+136.
Li, M. D., Ao, D. M., Chen, J., Liu, S., Xu, C. Q., Xu, R., et al. (2020). Research progress on identification and quality evaluation of Lonicera japonica thunb. China Med. Herald 17, 29–32.
Li, F. M., Chen, L. X., Li, J. J., Zhang, M., Qi, Y. T., Xu, X., et al. (2021). Discovery and bioinformatics analysis of chlorogenic acid gene in lonicera japonica. Mol. Plant Breed., 1–10.
Li, L., Tan, Z. W., Yu, Y. L., Dong, W., Lu, D. D., Yang, H. Q., et al. (2022). Research progress of honeysuckle germplasm resources and variety selection. Anhui Agric. Sci. 50 (17), 1–4.
Li, C. X., Xu, W. G., Guo, R., Zhang, J. Z., Qi, X. L., Hu, L., et al. (2018). Molecular marker assisted breeding and genome composition analysis of zhengmai 7698, an elite winter wheat cultivar. Rep 8, 322. doi: 10.1038/s41598-017-18726-8
Li, J. J., Yu, X. J., Shan, Q. R., Shi, Z. B., Li, J. H., Zhao, X. T., et al. (2022). Ntegrated volatile metabolomic and transcriptomic analysis provides insights into the regulation of floral scents between two contrasting varieties of lonicera japonica. Front. Plant Sci. 13, 989036. doi: 10.3389/fpls.2022.989036
Liu, Y. J. (2022). The development of agricultural products promotes the revitalization of county economy – a case study of honeysuckle industry in fengqiu county, henan province. Guangdong Sericulture 56, 130–132.
Liu, D. P. (2021). Present situation, existing problems and countermeasures of honeysuckle industry development in jingyuan county. Agric. Sci. Technol. Inf. 23, 77–78+83.
Liu, H., Zhu, S., Liu, Q., Zhang, Y. (2019). Spectrum-effect relationship study between HPLC fingerprints and antioxidant of honeysuckle extract. BioMed. Chromatogr. 33, e4583. doi: 10.1002/bmc.4583
Lu, F. L., Wang, L., Yan, X. J., Chen, Y. Y., Li, D. P. (2017). Identification of l. japonica and l. macranthoides by ~ 1H-NMR fingerprints. Proprietary Chin. Med. 39, 222–224.
Lv, C. F. (2020). Research on honeysuckle development strategy based on SWOT theory. Trop. Agric. Eng. 44, 32–36.
Ma, Z., Lv, S. Y., Shen, J. D., Quan, H. L., Li, M. (2022). Present situation and countermeasures of honeysuckle industry development in nanyang city. Agric. Sci. Technol. communication, 19–21.
Nikzad-Langerodi, R., Ortmann, S., Pferschy-Wenzig, E. M., Bochkov, V., Zhao, Y. M., Miao, J. H., et al. (2017). Assessment of anti-inflammatory properties of extracts from honeysuckle (Lonicera sp. L., caprifoliaceae) by ATR-FTIR spectroscopy. Talanta 175, 264–272. doi: 10.1016/j.talanta.2017.07.045
Pariasca-Tanaka, J., Lorieux, M., He, C., Mccouch, S., Thomson, M. J., Wissuwa, M. (2015). Development of a SNP genotyping panel for detecting polymorphisms in oryza glaberrima/O. sativa interspecific crosses. Euphytica 201, 67–78. doi: 10.1007/s10681-014-1183-4
Pavana, J. H., Ashish, K., Ramachandra, V. P., Andrew, F., Jessica, A. S., Siva, K. C., et al. (2012). Large-Scale development of cost-effective SNP marker assays for diversity assessment and genetic mapping in chickpea and comparative mapping in legumes. Plant Biotechnol. J. 10, 716–732. doi: 10.1111/j.1467-7652.2012.00710.x
Pei, L., Guo, M., Wang, C., Liu, X., Quan, Z. (2015). An overview of SNP interactions in genome-wide association studies. Brief. Funct. Genom. 14(2), 143–155. doi: 10.1093/bfgp/elu036
Peng, X., Li, W., Wang, W., Bai, G. (2010). Identification of Lonicera japonica by PCR-RFLP and allele-specific diagnostic PCR based on sequences of internal transcribed spacer regions. Planta Med. 76, 497–499. doi: 10.1055/s-0029-1186235
Ren, B., Hao, J., Lou, Y. X., Zhang, F. S. (2022). Quality evaluation of l. japonica from different habitats. J. Shanxi Med. Univ. 53, 100–105. doi: 10.13753/j.issn.1007-6611
Saxena, R. K., Penmetsa, R. V., Upadhyaya, H. D., Kumar, A., Carrasquilla-Garcia, N., Schlueter, J. A., et al. (2012). Large-Scale development of cost-effective single-nucleotide polymorphism marker assays for genetic mapping in pigeonpea and comparative mapping in legumes. DNA Res. an Int. J. Rapid Publ. Rep. Genes Genomes 19 (6), 449–461. doi: 10.1093/dnares/dss025
Schneider, K., Kulosa, D., Soerensen, T. R., Mhring, S., Heine, M., Durstewitz, G., et al. (2007). Analysis of DNA polymorphisms in sugar beet (Beta vulgaris l.) and development of an SNP-based map of expressed genes. Theor. Appl. Genet. 115, 601–615. doi: 10.1007/s00122-007-0591-4
Shao, W. H., Wang, Z. S., Zang, J. G. (2020). Analysis of male parents of seed generation of main olive cultivars based on SSR markers. Forestry Sci. Res. 33, 22–30.
Shen, Y., Wang, J., Shaw, R. K., Yu, H., Sheng, X, Zhao, Z, et al. (2021) Development of GBTS and KASP panels for genetic diversity, population structure, and fingerprinting of a large collection of Broccoli. (Brassica oleracea L. var. italica) in China. Front. Plant Sci. (2021) 12, 655254. doi: 10.3389/fpls.2021.655254
Song, R. (2020). Application value and economic benefit analysis of honeysuckle. Seed Technol. 38, 104–105.
Sorkheh, K., Shiran, B., Gradziel, T. M., Epperson, B. K., Martínez-Gómez, P., Asadi, E. (2007). Amplified fragment length polymorphism as a tool for molecular characterization of almond germplasm: genetic diversity among cultivated genotypes and related wild species of almond, and its relationships with agronomic traits. Euphytica 156, 327–344. doi: 10.1007/s10681-007-9382-x
Wang, Z., Fang, B., Chen, J., Zhang, X., Luo, Z., Huang, L., et al. (2010). De novo assembly and characterization of root transcriptome using illumina paired-end sequencing and development of cSSR markers in sweetpotato (Ipomoea batatas). BMC Genomics 11, 726. doi: 10.1186/1471-2164-11-726
Wang, Y., Lv, H., Xiang, X., Yang, A., Feng, Q., Dai, P., et al. (2021a). Construction of a SNP fingerprinting database and population genetic analysis of cigar tobacco germplasm resources in China. Front. Plant Sci. 12, 618133. doi: 10.3389/fpls.2021.618133
Wang, Y., Wu, X., Li, Y., Feng, Z., Mu, Z., Wang, J., et al. (2021b). Identification and validation of a core single-nucleotide polymorphism marker set for genetic diversity assessment, fingerprinting identification, and core collection development in bottle gourd. Front. Plant Sci. 12, 747940. doi: 10.3389/fpls.2021.747940
Wang, M. L., Zhu, C., Barkley, N. A., Chen, Z., Erpelding, J. E., Murray, S. C., et al. (2009). Genetic diversity and population structure analysis of accessions in the US historic sweet sorghum collection. Theor. Appl. Genet. 120, 13–23. doi: 10.1007/s00122-009-1155-6
Xu, S. Y., Li, O. J., Zhang, S. W., Deng, H., Liu, Z. H., Wang, Y., et al. (2015). Construction of SSR fingerprints and genetic diversity analysis of honeysuckle. Tianjin Agric. Sci. 21, 11–14+18.
Xu, C., Ren, Y., Jian, Y., Guo, Z., Zhang, Y., Xie, C., et al. (2017). Development of a maize 55 K SNP array with improved genome coverage for molecular breeding. Mol. Breed. 37, 1–12. doi: 10.1007/s11032-017-0622-z
Yao, T. N., Wu, H., He, J. N. (2022). Isolation and identification of chemical constituents from L. macranthoides. China Pharm. 25, 1076–1081. doi: 10.19962/j.cnki.issn1008-049X
Zhang, Z. M., Hu, Z. C., Lou, H., Wang, Z. L., Li, H. F., Wang, S. (2022). Variety improvement of L. macranthoides and comparison of its cultivation techniques for improving quality and efficiency. Grass-root Agric. Technol. promotion 10, 39–43.
Zhang, Y., Song, M. F., Li, H. T., Sun, H. F., Zhang, Z. L. (2021). DNA Barcoding identification of original plants of a rare medicinal material resina draconis and related dracaena species. Chin. J. Traditional Chin. Med. 46, 2173–2181. doi: 10.19540/j.cnki.cjcmm.20210124.104
Keywords: Lonicera japonica Thunb., genetic relationship, population structure, SNPs, DNA fingerprint, COVID-19, germplasm resources, SNP markers
Citation: Li J, Chang X, Huang Q, Liu P, Zhao X, Li F, Wang Y and Chang C (2023) Construction of SNP fingerprint and population genetic analysis of honeysuckle germplasm resources in China. Front. Plant Sci. 14:1080691. doi: 10.3389/fpls.2023.1080691
Received: 26 October 2022; Accepted: 13 February 2023;
Published: 02 March 2023.
Edited by:
Mi-Jeong Yoo, Clarkson University, United StatesReviewed by:
Panagiotis Madesis, University of Thessaly, GreeceChun Li, Henan Academy of Agricultural Sciences (HNAAS), China
Yifei Liu, Hubei University of Chinese Medicine, China
Copyright © 2023 Li, Chang, Huang, Liu, Zhao, Li, Wang and Chang. This is an open-access article distributed under the terms of the Creative Commons Attribution License (CC BY). The use, distribution or reproduction in other forums is permitted, provided the original author(s) and the copyright owner(s) are credited and that the original publication in this journal is cited, in accordance with accepted academic practice. No use, distribution or reproduction is permitted which does not comply with these terms.
*Correspondence: Jianjun Li, MDQzMDgxQGh0dS5lZHUuY24=; Cuifang Chang, Y2hhbmdjdWlmYW5nQDEyNi5jb20=