
95% of researchers rate our articles as excellent or good
Learn more about the work of our research integrity team to safeguard the quality of each article we publish.
Find out more
ORIGINAL RESEARCH article
Front. Plant Sci. , 03 March 2023
Sec. Plant Systematics and Evolution
Volume 14 - 2023 | https://doi.org/10.3389/fpls.2023.1070600
This article is part of the Research Topic Rise to the Challenges in Plastome Phylogenomics View all 10 articles
 Tian Wan1
 Bai-xue Qiao1Jing Zhou1Ke-sen Shao1
 Liu-yi Pan1Feng An1Xu-sheng He2Tao Liu1Ping-ke Li3
 Yu-liang Cai1*
The subgenus Cerasus, one of the most important groups in the genus Prunus sensu lato, comprises over 100 species; however, the taxonomic classification and phylogenetic relationships of Cerasus remain controversial. Therefore, it is necessary to reconstruct the phylogenetic tree for known Cerasus species. Here, we report the chloroplast (cp) genome sequences of 11 Cerasus species to provide insight into evolution of the plastome. The cp genomes of the 11 Cerasus species (157,571–158,830 bp) displayed a typical quadripartite circular structure. The plastomes contain 115 unique genes, including 80 protein-coding genes, four ribosomal RNAs, and 31 transfer RNAs. Twenty genes were found to be duplicated in inverted repeats as well as at the boundary. The conserved non-coding sequences showed significant divergence compared with the coding regions. We found 12 genes and 14 intergenic regions with higher nucleotide diversity and more polymorphic sites, including matK, rps16, rbcL, rps16-trnQ, petN-psbM, and trnL-trnF. During cp plastome evolution, the codon profile has been strongly biased toward the use of A/T at the third base, and leucine and isoleucine codons appear the most frequently. We identified strong purifying selection on the rpoA, cemA, atpA, and petB genes; whereas ccsA, rps19, matK, rpoC2, ycf2 and ndhI showed a signature of possible positive selection during the course of Cerasus evolution. In addition, we further analyzed the phylogenetic relationships of these species with 57 other congenic related species.Through reconstructing the Cerasus phylogeny tree, we found that true cherry is similar to the flora of China forming a distinct group, from which P. mahaleb was separated as an independent subclade. Microcerasus was genetically closer to Amygdalus, Armeniaca, and Prunus (sensu stricto) than to members of true cherry, whereas P. japonica and P. tomentosa were most closely related to P. triloba and P. pedunculata. However, P. tianshanica formed a clade with P. cerasus, P. fruticosa, P. cerasus × P. canescens ‘Gisela 6’, and P. avium as a true cherry group. These results provide new insights into the plastome evolution of Cerasus, along with potential molecular markers and candidate DNA barcodes for further phylogenetic and phylogeographic analyses of Cerasus species.
Rosaceae is a large family that includes most economically important fruits species in temperate zones, such as Prunus, Armeniaca, Amygdalus, Pyrus, Malus and Crataegus species (Zarei et al., 2017; Sevindik et al., 2020). And the plant subgenus Cerasus is considered one of the most important groups in the genus Prunus (P.) sensu lato, comprising over 100 species, which are naturally distributed in temperate Asia, Europe, North America, China, Japan, and Korea (Chin et al., 2014; Zhang et al., 2021). In China, there are roughly 45 species of Cerasus, 35 of which are considered to be endemic according to the Flora of China project (Yü et al., 1986). However, the taxonomic classification and phylogenetic relationships among species in the subgenus Cerasus or genus Prunus sensu lato have been controversial, with no unification reached to date (Potter et al., 2007; Chin et al., 2014; Liang et al., 2018; Zhang et al., 2021). For example, P. tomentosa, P. tianshanica, P. japonica, P. humilis, P. dictyoneura, P. glandulosa, P. pogonostyla, P. jacquemontii, P. prostrata, and P. pumila were classified in a single group, the “dwarf cherry” (Microcerasus), which was identified as a section of subgenus Cerasus according to Yü et al. (1986) and Webster and Looney (1996). However, in previous phylogenetic studies, Microcerasus species corresponded with Amygdalus, Armeniaca, or Prunus species (Bortiri et al., 2001; Shaw and Small, 2004; Chen et al., 2018; Zhang et al., 2021). Therefore, it is necessary to reconstruct the phylogenetic tree for Cerasus species.
The origin of the chloroplast (cp) can be traced back more than one billion years (Wang et al., 2021; Ravi et al., 2007). In land plants, the cp genome has a relatively conserved quadripartite structure, with conserved sequences in the range of 120–218 kb (Daniell et al., 2016) encoding approximately 100–130 genes (Palmer, 1985; Ravi et al., 2007; Wicke et al., 2011; Daniell et al., 2016; Wang et al., 2021). The cp structure comprises one large single-copy (LSC) region, one small single-copy (SSC) region, and two copies of an inverted repeat (IR) (Sugiura, 1992; Ravi et al., 2007). The significant developmental impact and limited coding potential of the cp genome, combined with maternal inheritance of this organelle provide tangible, causal approaches to understanding plant evolution, diversity, and phylogenic relationships (Ravi et al., 2007; Moore et al., 2010; Greiner et al., 2011). Recent studies have demonstrated that cp genome sequences offer remarkable resolution for analyzing phylogenetic relationships at various taxonomic levels, and can further provide evidence to explain effects of geography and climate oscillations on genetic divergence (Ivanova et al., 2017; Xue et al., 2019; Xue et al., 2021; Zhang et al., 2021; Dunning et al., 2022; Wang et al., 2022). Although cp genome sequences of some Cerasus species have been published (Chen et al., 2018; Feng et al., 2018; Zhang et al., 2021; Li et al., 2022), there is still a lack of information to enable comprehensive analysis of the interspecific relationships of the subgenus Cerasus and the relationship between Cerasus and Prunus sensu lato. Comparison of the cp genomes of the 11 Cerasus species can help to better understand evolution of the Cerasus genome and enable more profound analysis of the phylogenetic relationships in the genus Prunus, offering valuable insights.
In this study, we performed a comparative analysis of 11 complete Cerasus cp genomes to explore the features and structural differentiation of sequences among species. Furthermore, we reconstructed a phylogenetic tree using the newly obtained cp chloroplast sequences and published sequences to explore the genetic relationships among subgenus Cerasus, Prunus (sensu stricto), Amygdalus, and Armeniaca. Our study objectives were to: (1) gain insight into plastome structure features, (2) inform an improved understanding of cp genome evolution, and (3) further delineate the taxonomic status of Cerasus.
Fresh and healthy leaves were collected from adult plants of 11 Cerasus species (Table 1). All samples were immediately frozen in liquid nitrogen and stored at −80°C until analysis. Total genomic DNA was extracted from 100 mg of fresh leaves using a modified CTAB method (Murray and Thompson, 1980). DNA libraries were prepared and sequenced on an Illumina NovaSeq 6000 platform (Illumina, San Diego, CA, USA) with paired-end 150-bp sequencing reads; only reads with a Q30 quality score greater than 80% were retained for analysis.
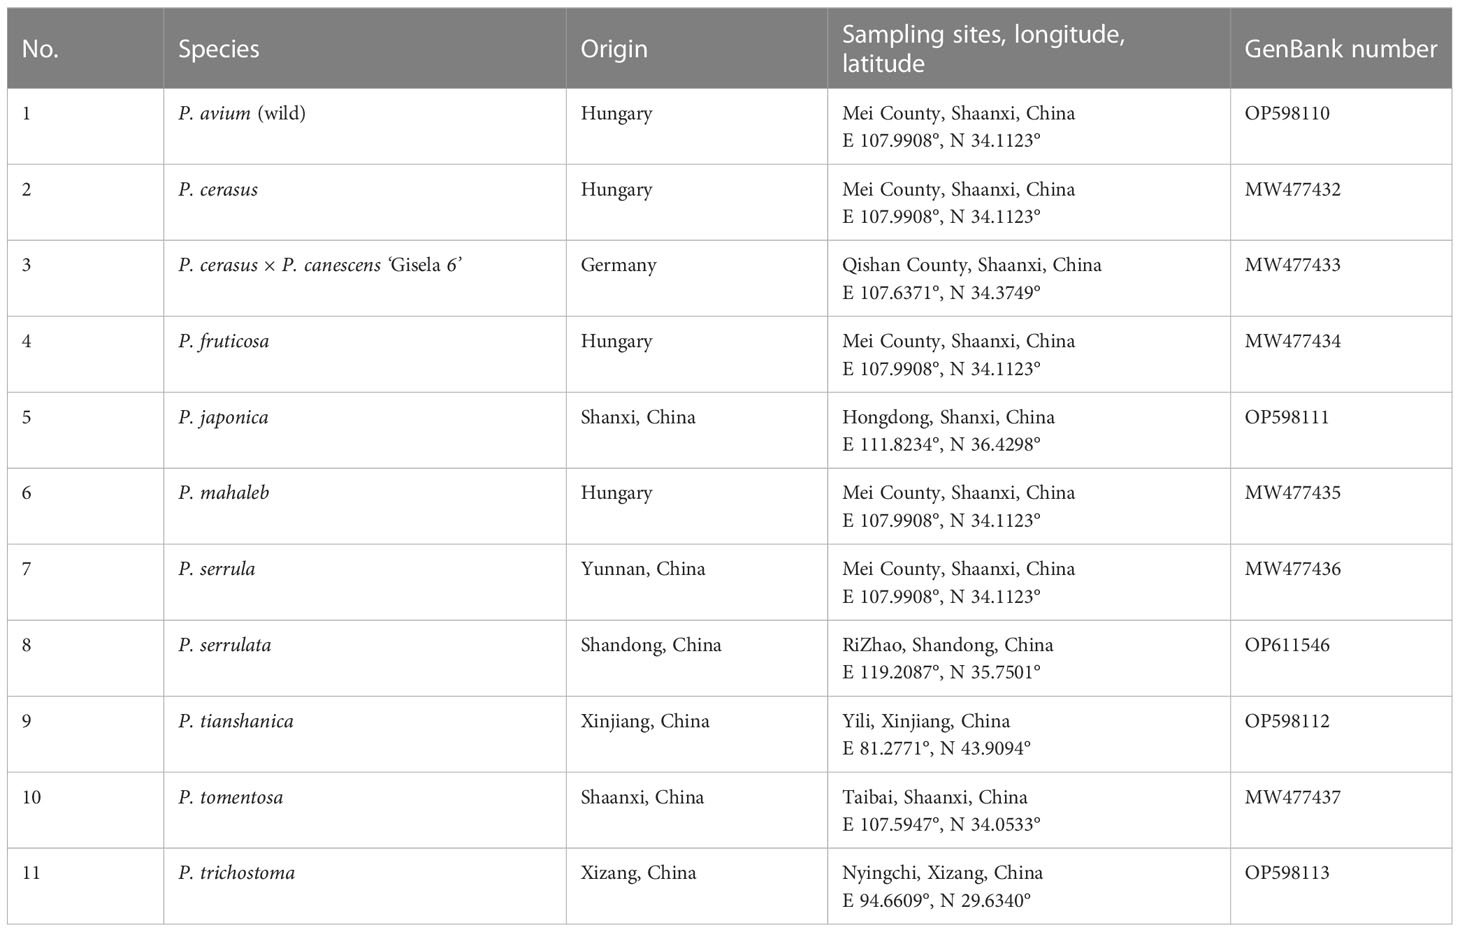
Table 1 Sampling information for the Cerasus species.
The cp genome assembly of Cerasus species was obtained by a baiting and iterative mapping approach (Hahn et al., 2013). The complete cp genome of P. persica (HQ336405) was downloaded from the National Center for Biotechnology Information (NCBI) database as a reference genome. Geneious Prime v2022.0.2 (https://www.geneious.com/) (Kearse et al., 2012) was used for sequence correction. The 11 Cerasus species were annotated by Geneious Prime v2022.0.2, using P. pseudocerasus (NC030599) and P. persica (HQ336405) as reference sequences, and were annotated using GeSeq (https://chlorobox.mpimp-golm.mpg.de/geseq.html) with no reference sequence. Manual editing of annotated and non-annotated portions, including exons and introns, was then performed. The transfer RNA (tRNA) sequences were confirmed using tRNAscan-SE 2.0 (Chan et al., 2021). All annotations were checked against the reference genomes (NC030599, NC054254, and MZ145044). Genome maps were drawn using OrganellarGenomeDRAW (OGDRAW) (Greiner et al., 2019).
Plastome structures among Cerasus species, apple, pear, and grape were compared by the mVISTA percent identity plot in Shuffle-LAGAN mode to reveal the major genomic variations located in LSC and SSC regions (Brudno et al., 2003; Frazer et al., 2004). Subsequently, nucleotide diversity (Pi) and polymorphic sites (S) of single-copy genes and intergenic regions (IGRs) were estimated for the 11 species and P. pseudocerasus (NC030599) by DnaSP v.6 (Rozas et al., 2017). The plastome genetic architecture of the 11 Cerasus species, 24 Cerasus species available in NCBI, and six other species for the LSC/IR and SSC/IR boundaries were analyzed by Irscope (Amiryousefi et al., 2018).
Simple sequence repeats (SSRs) were examined by the Perl script MicroSAtellite (MISA) (Beier et al., 2017) with the following parameter settings: motif size of 1–6 nucleotides; and minimum repeat unit of 10 for mononucleotides, 6 for dinucleotides, and 5 for tri-, tetra-, penta-, and hexa-nucleotides. Non-overlapping repeat sequences were identified by REPuter (Kurtz et al., 2001) (repeat unit length minimum ≥ 25 bp, Hamming distance = 3). Four matches of repeats were classified, namely forward, reverse, complement, and palindromic matches. The online program Tandem Repeats Finder (http://tandem.bu.edu/trf/trf.html) was used to find the tandem repeat sequences of at least 10 bp in length. The alignment parameters for match, mismatch, and indels were set to 2, 7, and 7, respectively.
For identification of codon usage patterns, all coding sequences (CDSs) greater than 350 nucleotides in length were extracted from the cp genome of Cerasus, as described previously (Morton, 1998). The filtered CDSs were subsequently used for the estimation of codon usage using CodonW v.9.1.2 and the codon usage patterns were analyzed by GraphPad Prism v.8.0. In addition to the overall codon usage, we further tabulated codon usage measures such as the effective number of codons (Nc) and GC frequency at the third synonymous position (GC3s). To investigate the selective pressure on plastome protein-coding genes between two species, non-synonymous (Ka) and synonymous (Ks) substitution values were calculated by KaKs_Calculator 2.0 (Wang et al., 2010), with the following settings: genetic code table = 11 (bacterial and plant plastid codes) and the Yang-Nielsen algorithm (YN) calculation method (Ivanova et al., 2017).
To reconstruct the phylogenetic relationships and verify the phylogenetic position of the subgenus Cerasus in Prunus sensu lato, 45 Cerasus cp genome sequences, including 34 published sequences downloaded from NCBI and the 11 sequences obtained in this study, were analyzed along with 23 P.sensu lato complete cp genome sequences. Malus baccata, Malus micromalus, Pyrus communis, Pyrus ussuriensis, Vitis amurensis, V. amurensis, and Ziziphus jujuba were regarded as outgroups. Because the different regions of cp genome differed in the molecular evolutionary rates (Zhang et al., 2017), phylogenetic relationship analyses were performed using 6 datasets that are the complete cp genome sequences, LSC regions, SSC regions, two IR regions, common CDS and IGRs. Sequences were aligned by MAFFT using Geneious Prime v2022.0.2 (Kearse et al., 2012). The phylogenetic tree was constructed with the program Mrbayes (Huelsenbeck and Ronquist, 2001) of Geneious Prime and Maximum likelihood (ML) method of MEGA v11(Kumar et al., 2016), Mrbayes analysis used the following Markov chain Monte Carlo simulation settings: chain length = 1,100,000, subsampling frequency = 200, heated chains = 4, burn-in length = 100,000, heated chain temp = 0.2, and random seed = 170. ML analyses used the General Time Reversible +Gamma Distributed + Nearest-Neighbor-Interchange model with 1000 bootstrap replicates. The tree was visualized with Interactive Tree Of Life (iTOL) v5 software (Letunic and Bork, 2021) and manually edited where necessary.
The Cerasus cp genome displays a typical quadripartite circular structure (Figure 1) containing one LSC, one SSC, and two IR (IRB and IRA) regions, as determined by OGDRAW (Greiner et al., 2019). The plastome size of the 11 Cerasus species ranged from 157,571 bp (P. tomentosa) to 158,830 bp (P. tianshanica). The average coverage depth ranged from 421.8× to 9410× (Table S1; Figure S1). The GC content of the Cerasus cp genome was very similar among the 11 species (36.5–36.8%) with an average of 36.7% (Table S1).
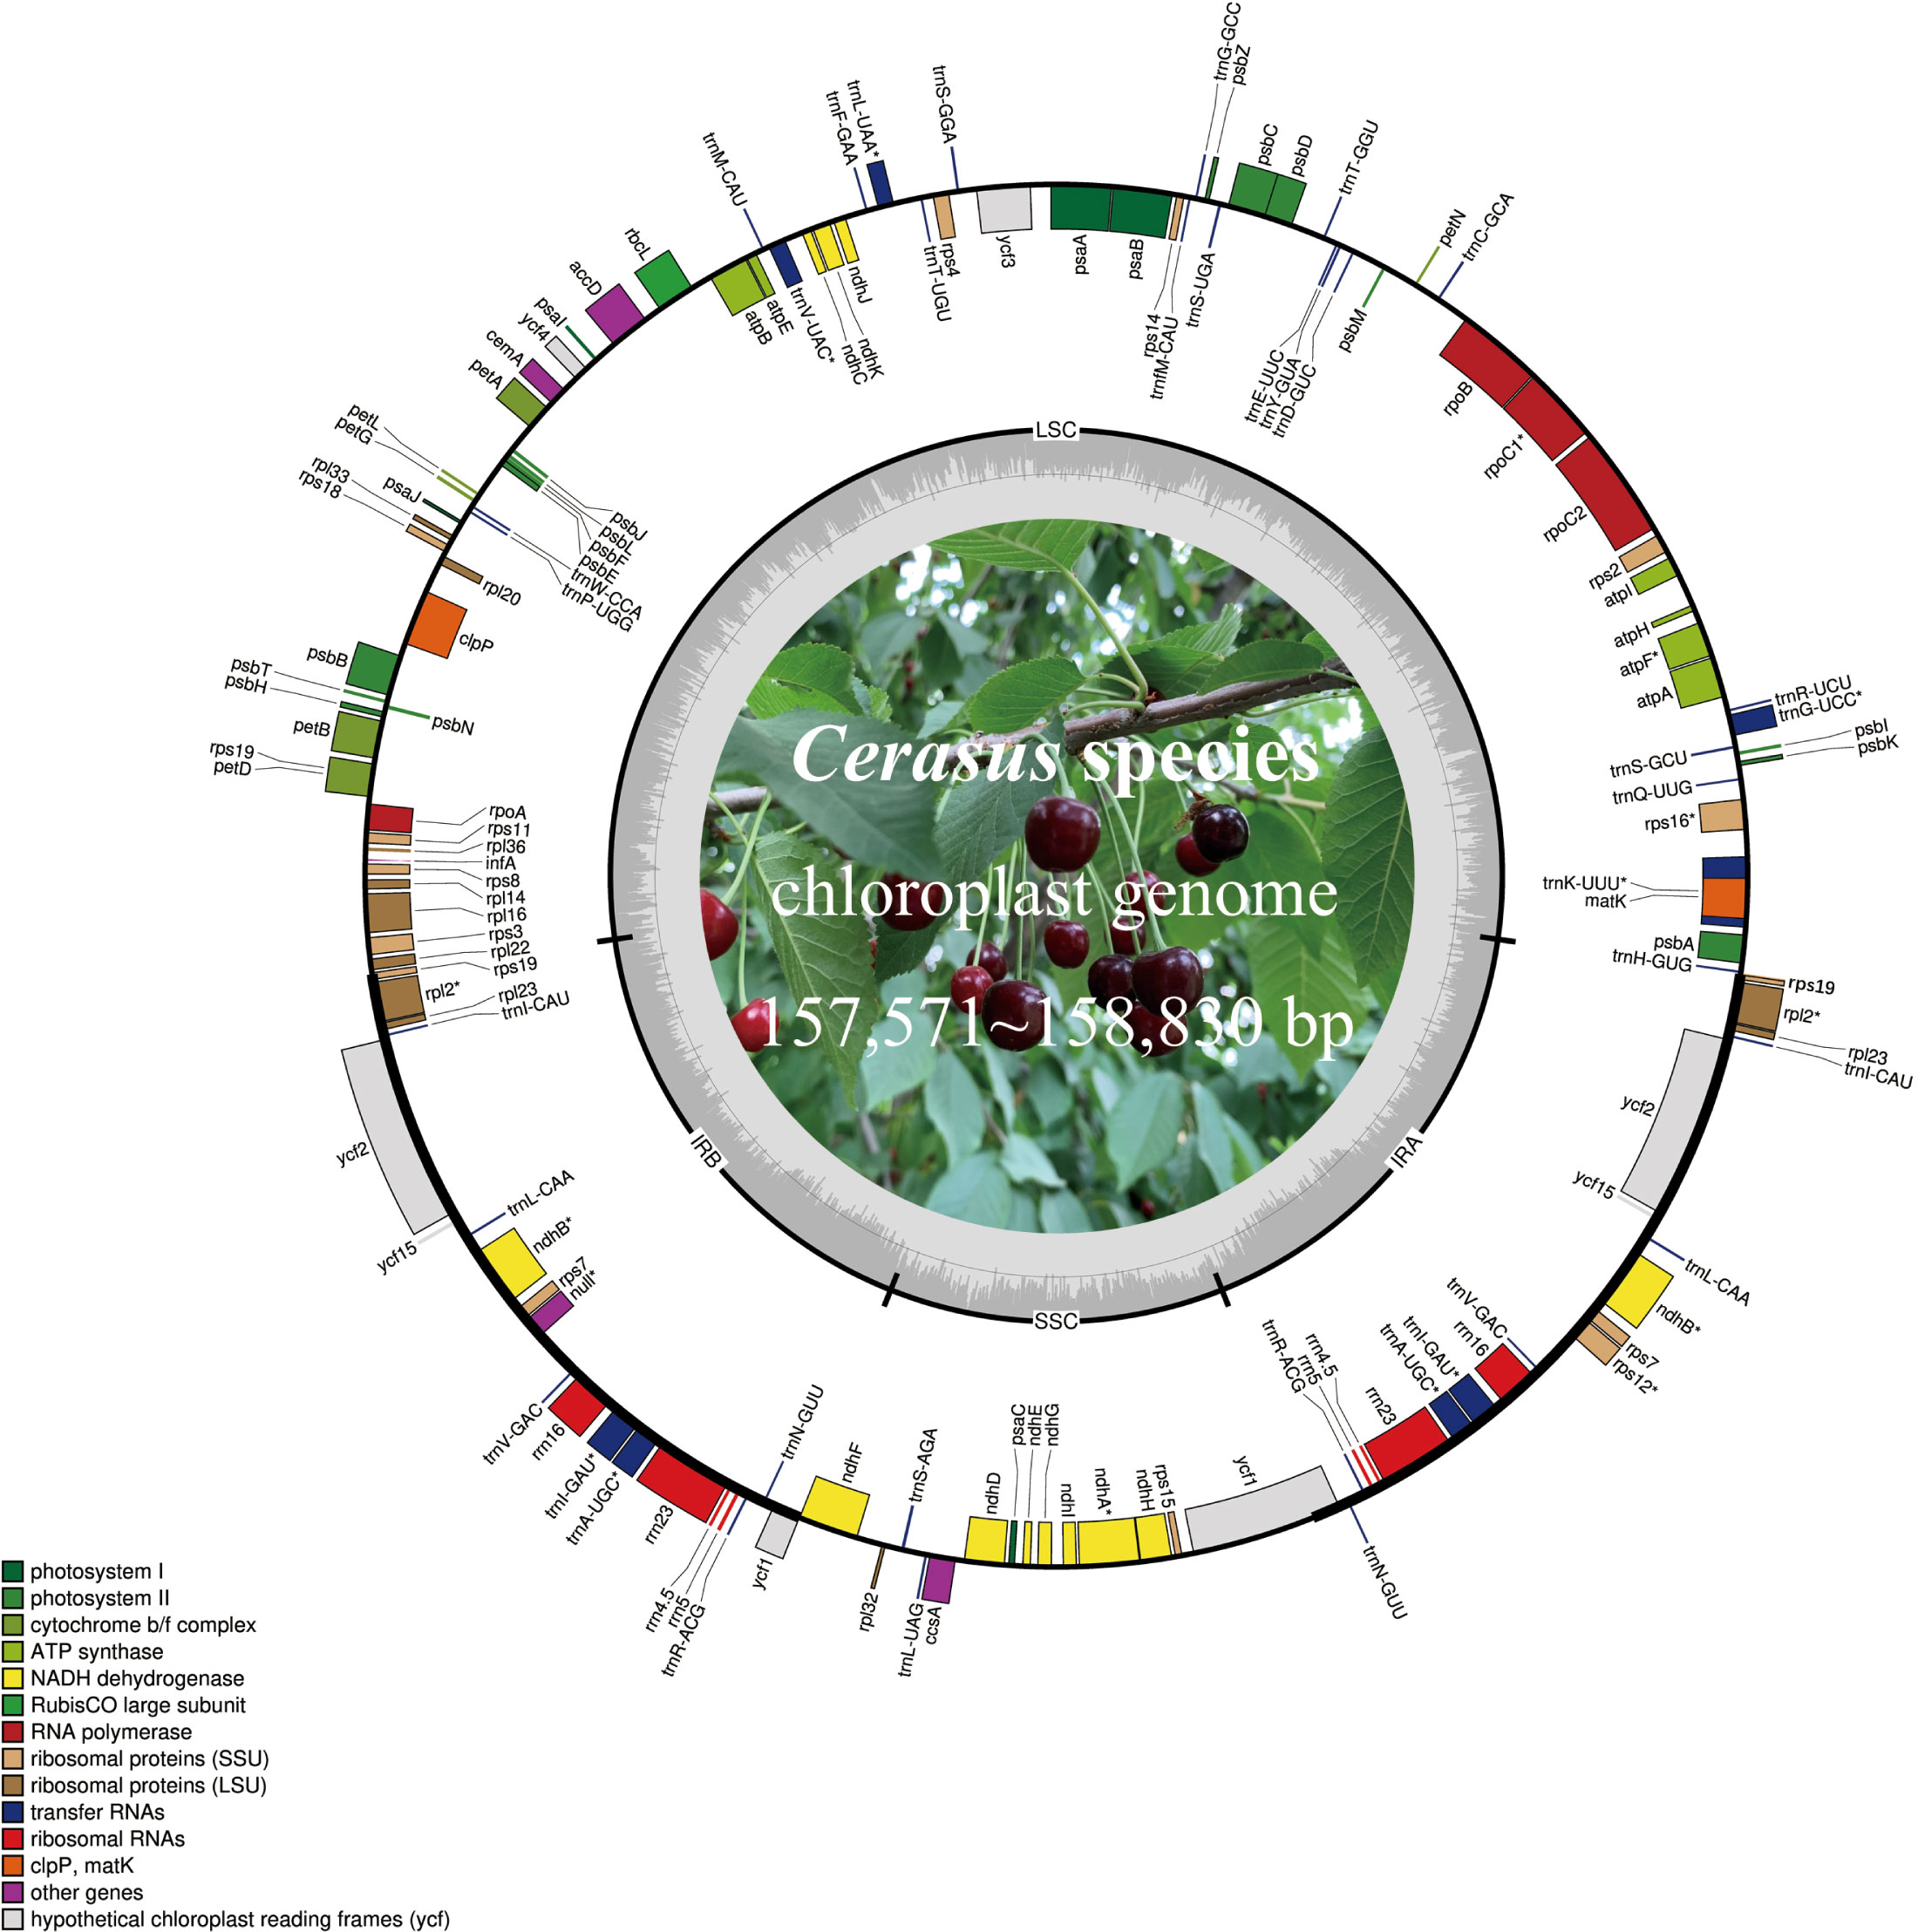
Figure 1 Chloroplast genome map of Cerasus species. Genes on the inside of the large circle are transcribed clockwise and those on the outside are transcribed counterclockwise. The genes are color-coded based on their functions. The dashed area represents the GC composition of the chloroplast genome. LSC, large single copy region; IR, inverted repeat; SSC, small single copy region.
Cerasus plastomes contained the same set of 115 unique genes, including 80 protein-coding genes, 4 ribosomal RNAs (rRNAs), and 31 tRNAs (Table 2). Twenty genes are duplicated in IRs or at the boundaries, including nine protein-coding genes (rpl2, rpl23, rps7, rps12, rps19, ndhB, ycf1, ycf2, and ycf15), four rRNA genes (rrn4.5, rrn5, rrn16, and rrn23), and seven tRNA genes (trnA-UGC, trnI-CAU, trnI-GAU, trnL-CAA, trnN-GUU, trnR-ACG, and trnV-GAC). In the cp genome of P. tianshanica, an insertion sequence was identified that split ycf2 in IRA into two segments (Figure S2A). There are 18 different intron-containing genes (Table 2), including 10 protein-coding genes (atpF, ndhA, ndhB, rpl2, rpl16, rps12, rps16, rpoC1, petB, and petD) and six tRNA-coding genes (trnA-UGC, trnG-UCC, trnI-GAU, trnK-UUU, trnL-UAA, and trnV-UAC). Among these, trnK-UUU has the largest intron (2428–2539 bp) with matK located within it. Two protein-coding genes (clpP and ycf3) contain two introns.
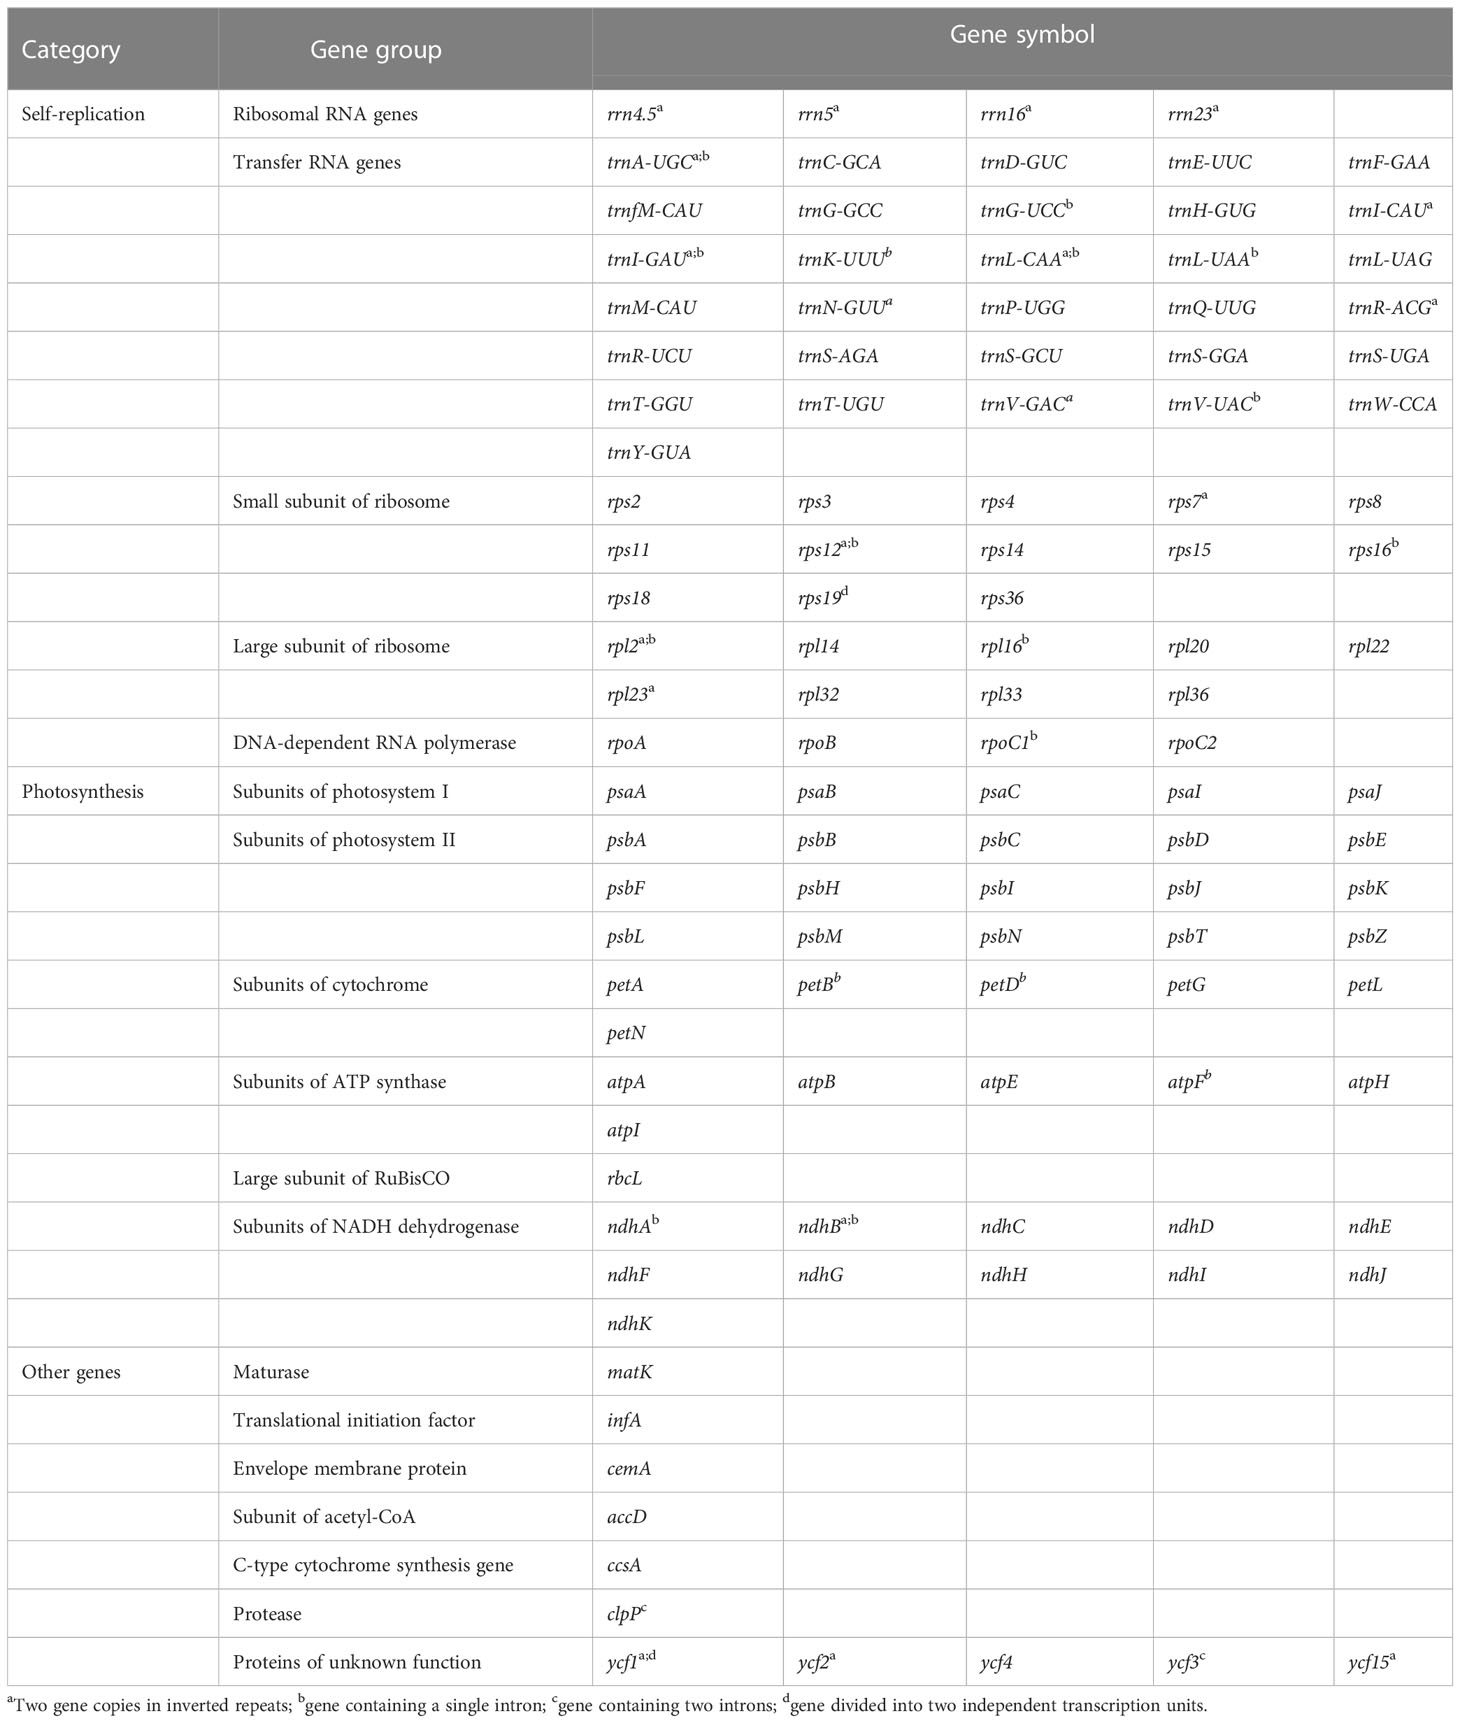
Table 2 Gene types and functional classification of the Cerasus chloroplast genome.
In Cerasus plastomes, the protein-coding gene rps19 is located on the boundary of the LSC and IR regions, except for P. avium in which only the rps19 fragment is on IRA. Comparison showed significant differences of rps19 gene sequences among the Cerasus species (Figure S2B). The ycf1 gene was located on the boundary of the SSC and IRA regions. ycf genes were identified as hypothetical cp reading frames, and small fragments of truncated ycf genes were detected in IRA (ycf15: 126 bp and 129 bp, respectively), with only partial ycf1 identified in the IRB region. The remaining ycf genes were detected at the complete gene size. ycf2 is a large functional gene encoding 2277 amino acids in cp IR regions. The ycf2 gene in P. tianshanica was 6876 bp, with one inserted fragment of 42 bp located at the 900-bp position (Figure S2A). In Cerasus, a high level of similarity was restricted to the IRs, and major differences originated from the LSC and SSC regions. The gene infA, which is a translation-related gene, was identified as a pseudogene.
The mVISTA (Frazer et al., 2004) analysis showed the overall sequence identity, divergent regions, and visualization of the aligned cp genome sequences in Cerasus. The LSC and SSC regions were clearly more divergent than the IRs (Figure 2). The conserved non-coding sequences (CNSs) showed significantly more divergence than the coding regions (Figure 2 and Table S2), indicating that the CDSs are much more conserved than the CNSs. Furthermore, the mean value of Pi in IRs (0.00157) was lower than that of the LSC (0.00719) or SSC (0.01041) regions, which demonstrated that the IR regions have fewer mutations and are thus more strongly conserved. Among 135 plastid genes, only 23 genes showed higher nucleotide diversity (Pi > 0.003), with Pi values ranging from 0.00307 (rpoC2) to 0.00777 (rps15), and 12 genes (trnK-UUU, matK, rps16, trnG-UCC, rpoC2, rbcL, accD, clpP, rpl16, ndhF, ndhA, and ycf1) had a relatively higher number of polymorphic sites (S > 10) (Table S2A; Figure S3). However, 73 IGRs had Pi > 0.003; the 10 most polymorphic IGRs in ascending order were rps19-trnG-GUU (Pi = 0.06926), trnR-UCU-atpA, ndhC-trnV-UAC, ccsA-ndhD, psbl-trnS-GCU, psbC-trnS-UGA, rpl32-trnS-AGA, rpl33-rps18, trnW-CCA-trnP-UGG, and psbZ-trnG-GCC (Pi = 0.01334). Moreover, there were 14 IGRs with Pi > 0.01 and S > 10 (Table S2B; Figure S3). We further analyzed the sequence divergence patterns among all cp genomes. Finally, 506 single nucleotide polymorphisms (SNPs), 59 nucleotide substitution (NS) loci, and 1898 indel loci were identified through the nucleotide alignment (Table S3).
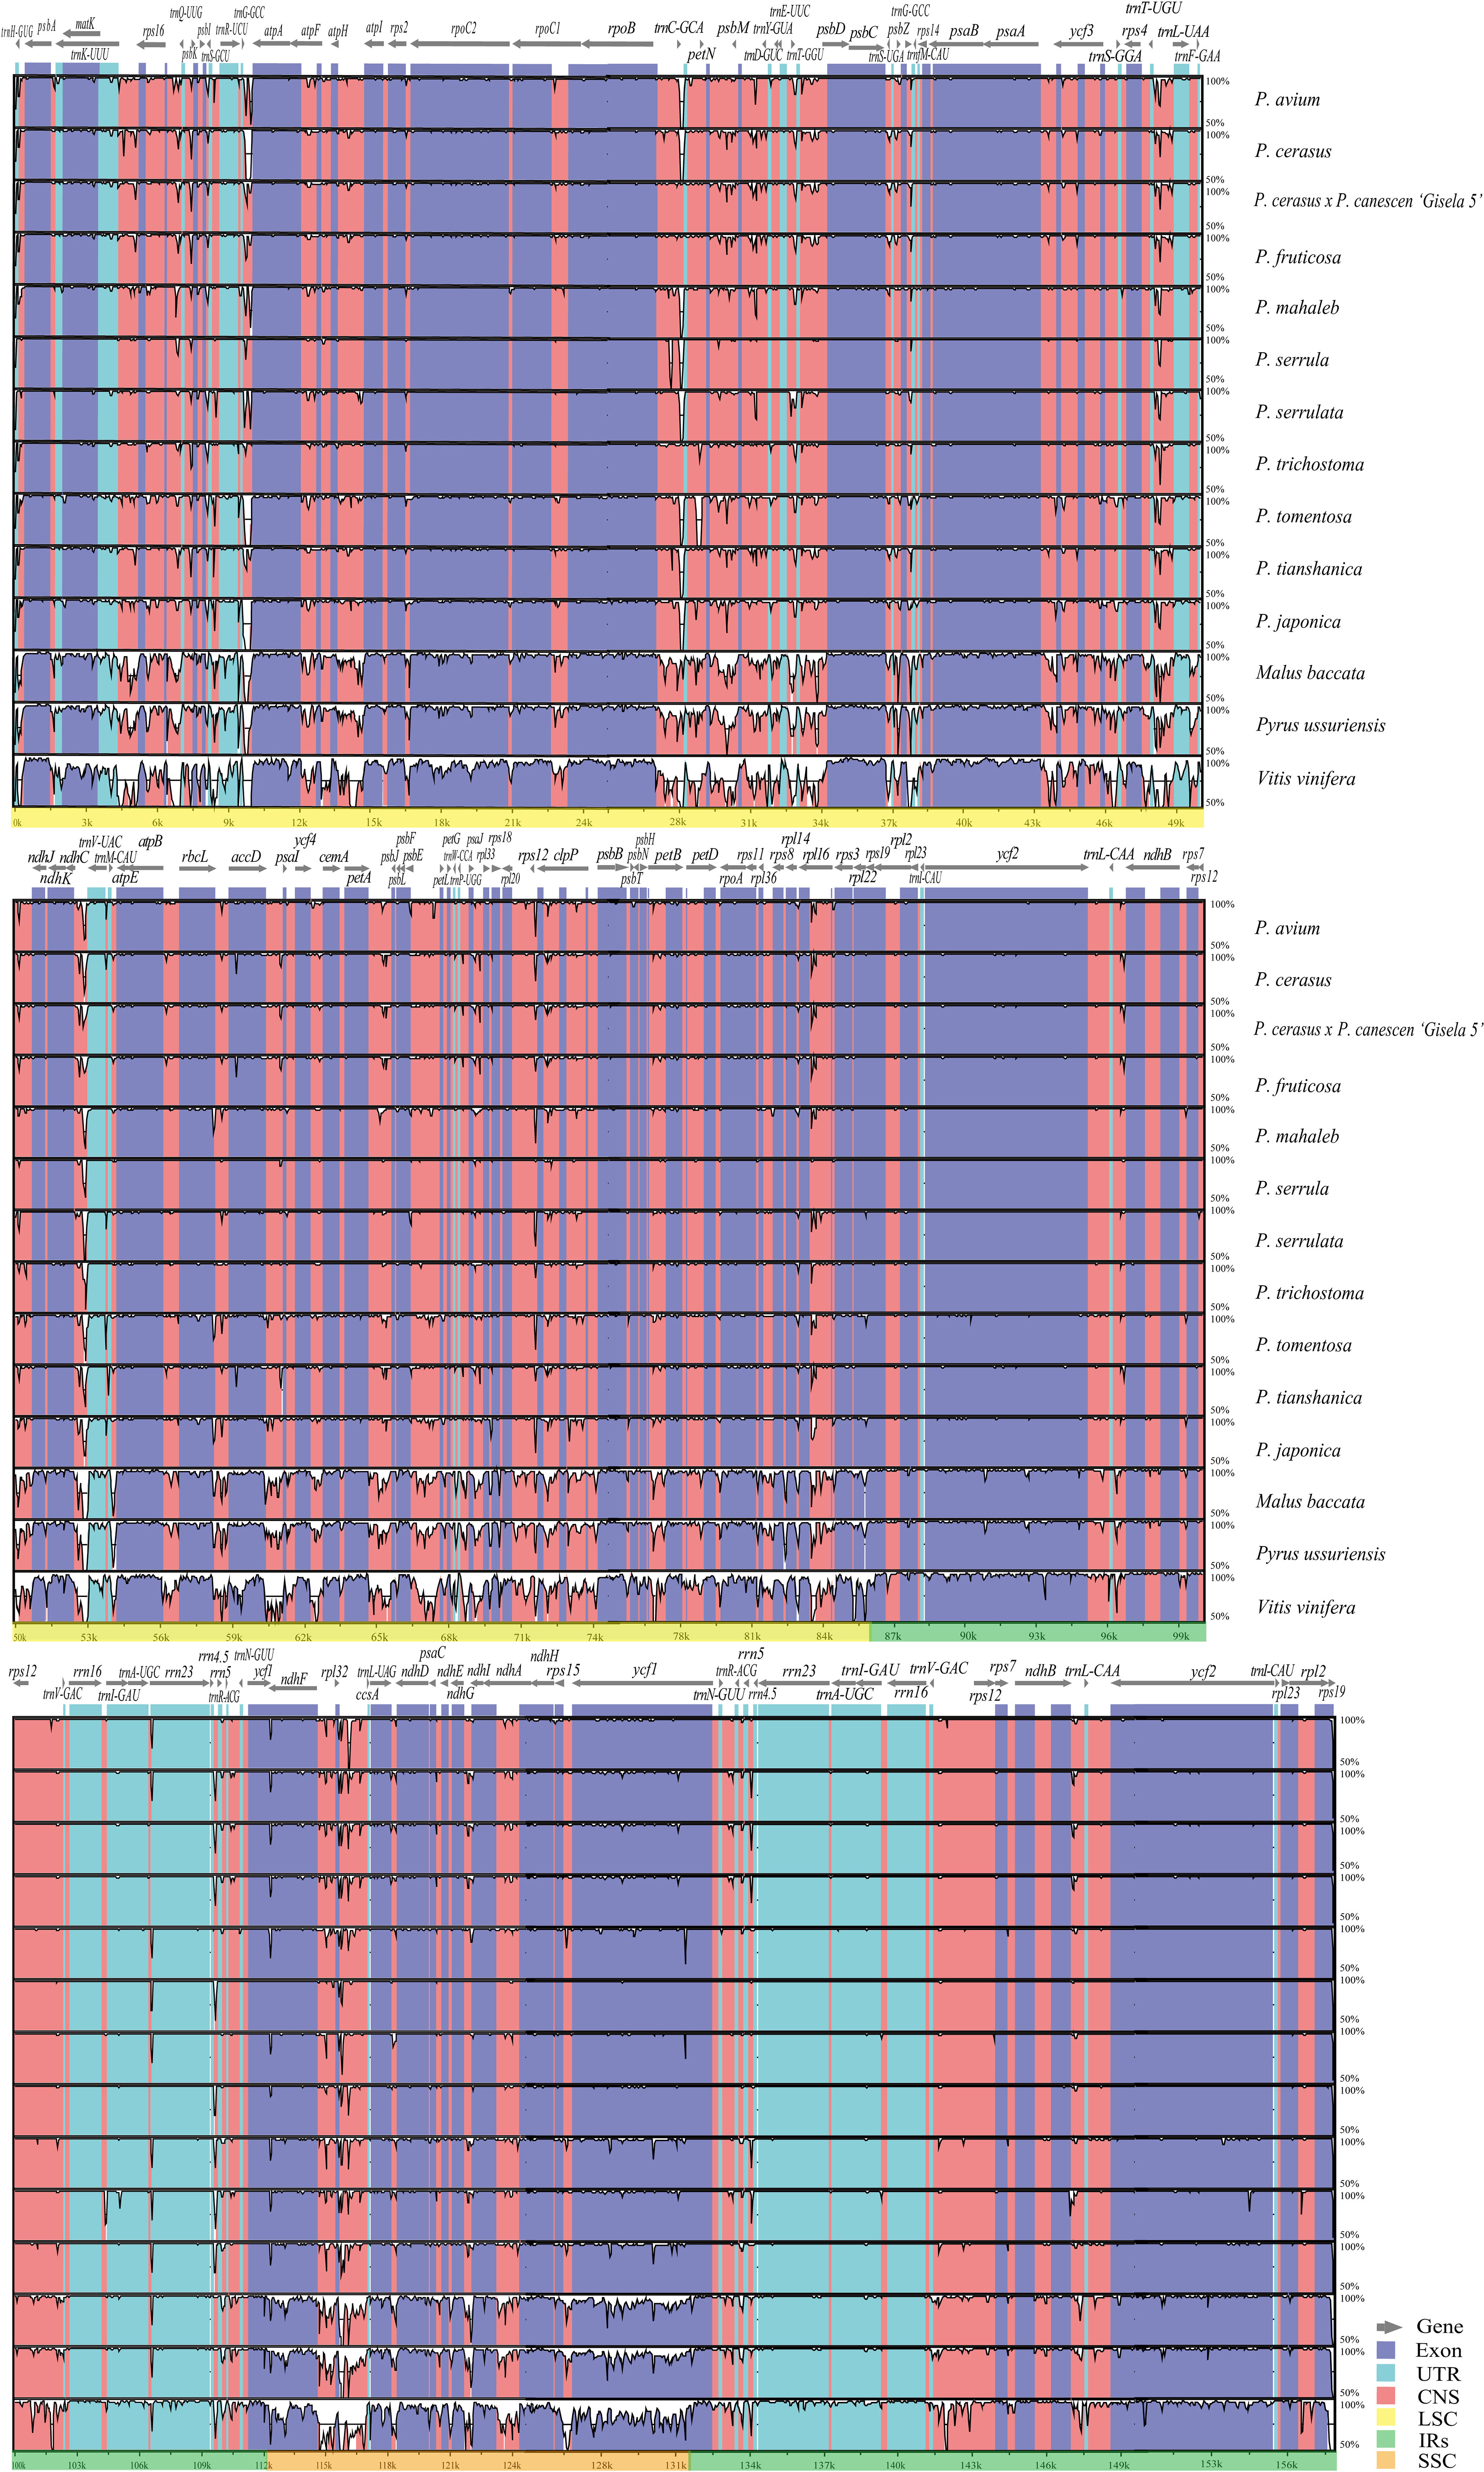
Figure 2 Chloroplast genome sequence comparison of 11 Cerasus species, apple, pear, and grape based on mVISTA. The similarity graphical information portrays sequence identity with Prunus pseudocerasus (NC030599) as reference. A cut-off of 50% identity is used for the plots. In each plot, the Y-axis represents percent identity (50–100%).
Comparing the IR/LSC and IR/SSC boundaries of the 11 cp genomes of Cerasus species revealed the contraction and expansion of IRs with minimal variation at the boundaries. The boundary region of IRA/SSC appears to be relatively stable (Figures 3, S3). That is, the boundary gene ycf1 showed high conservation among Cerasus species with a length of 5606 bp for the majority of the Cerasus species (7/11) analyzed. In P. serrulata, P. tomentosa, and P. japonica, ycf1 had greater extension than found in the other species to different degrees (Figure 3). Both the ycf1 pseudogene and ndhF gene were at the IRB/SSC borders, which partially overlapped in the cp genomes of Cerasus species. The IRB/LSC junction was largely located in rps19, close to rpl22 and rpl2, and except in P. avium, extension of the LSC resulted in larger contraction of IRB toward the rpl22 direction. Concerning the IRA/LSC boundary, the junction site was the rps19 gene in all Cerasus species, except for P. avium in which rps19 showed a contraction in IRA regions, being 48 bp away from the boundary. In addition, trnH was consistently observed in all plastomes, which was located 5–86 bp away from the border.
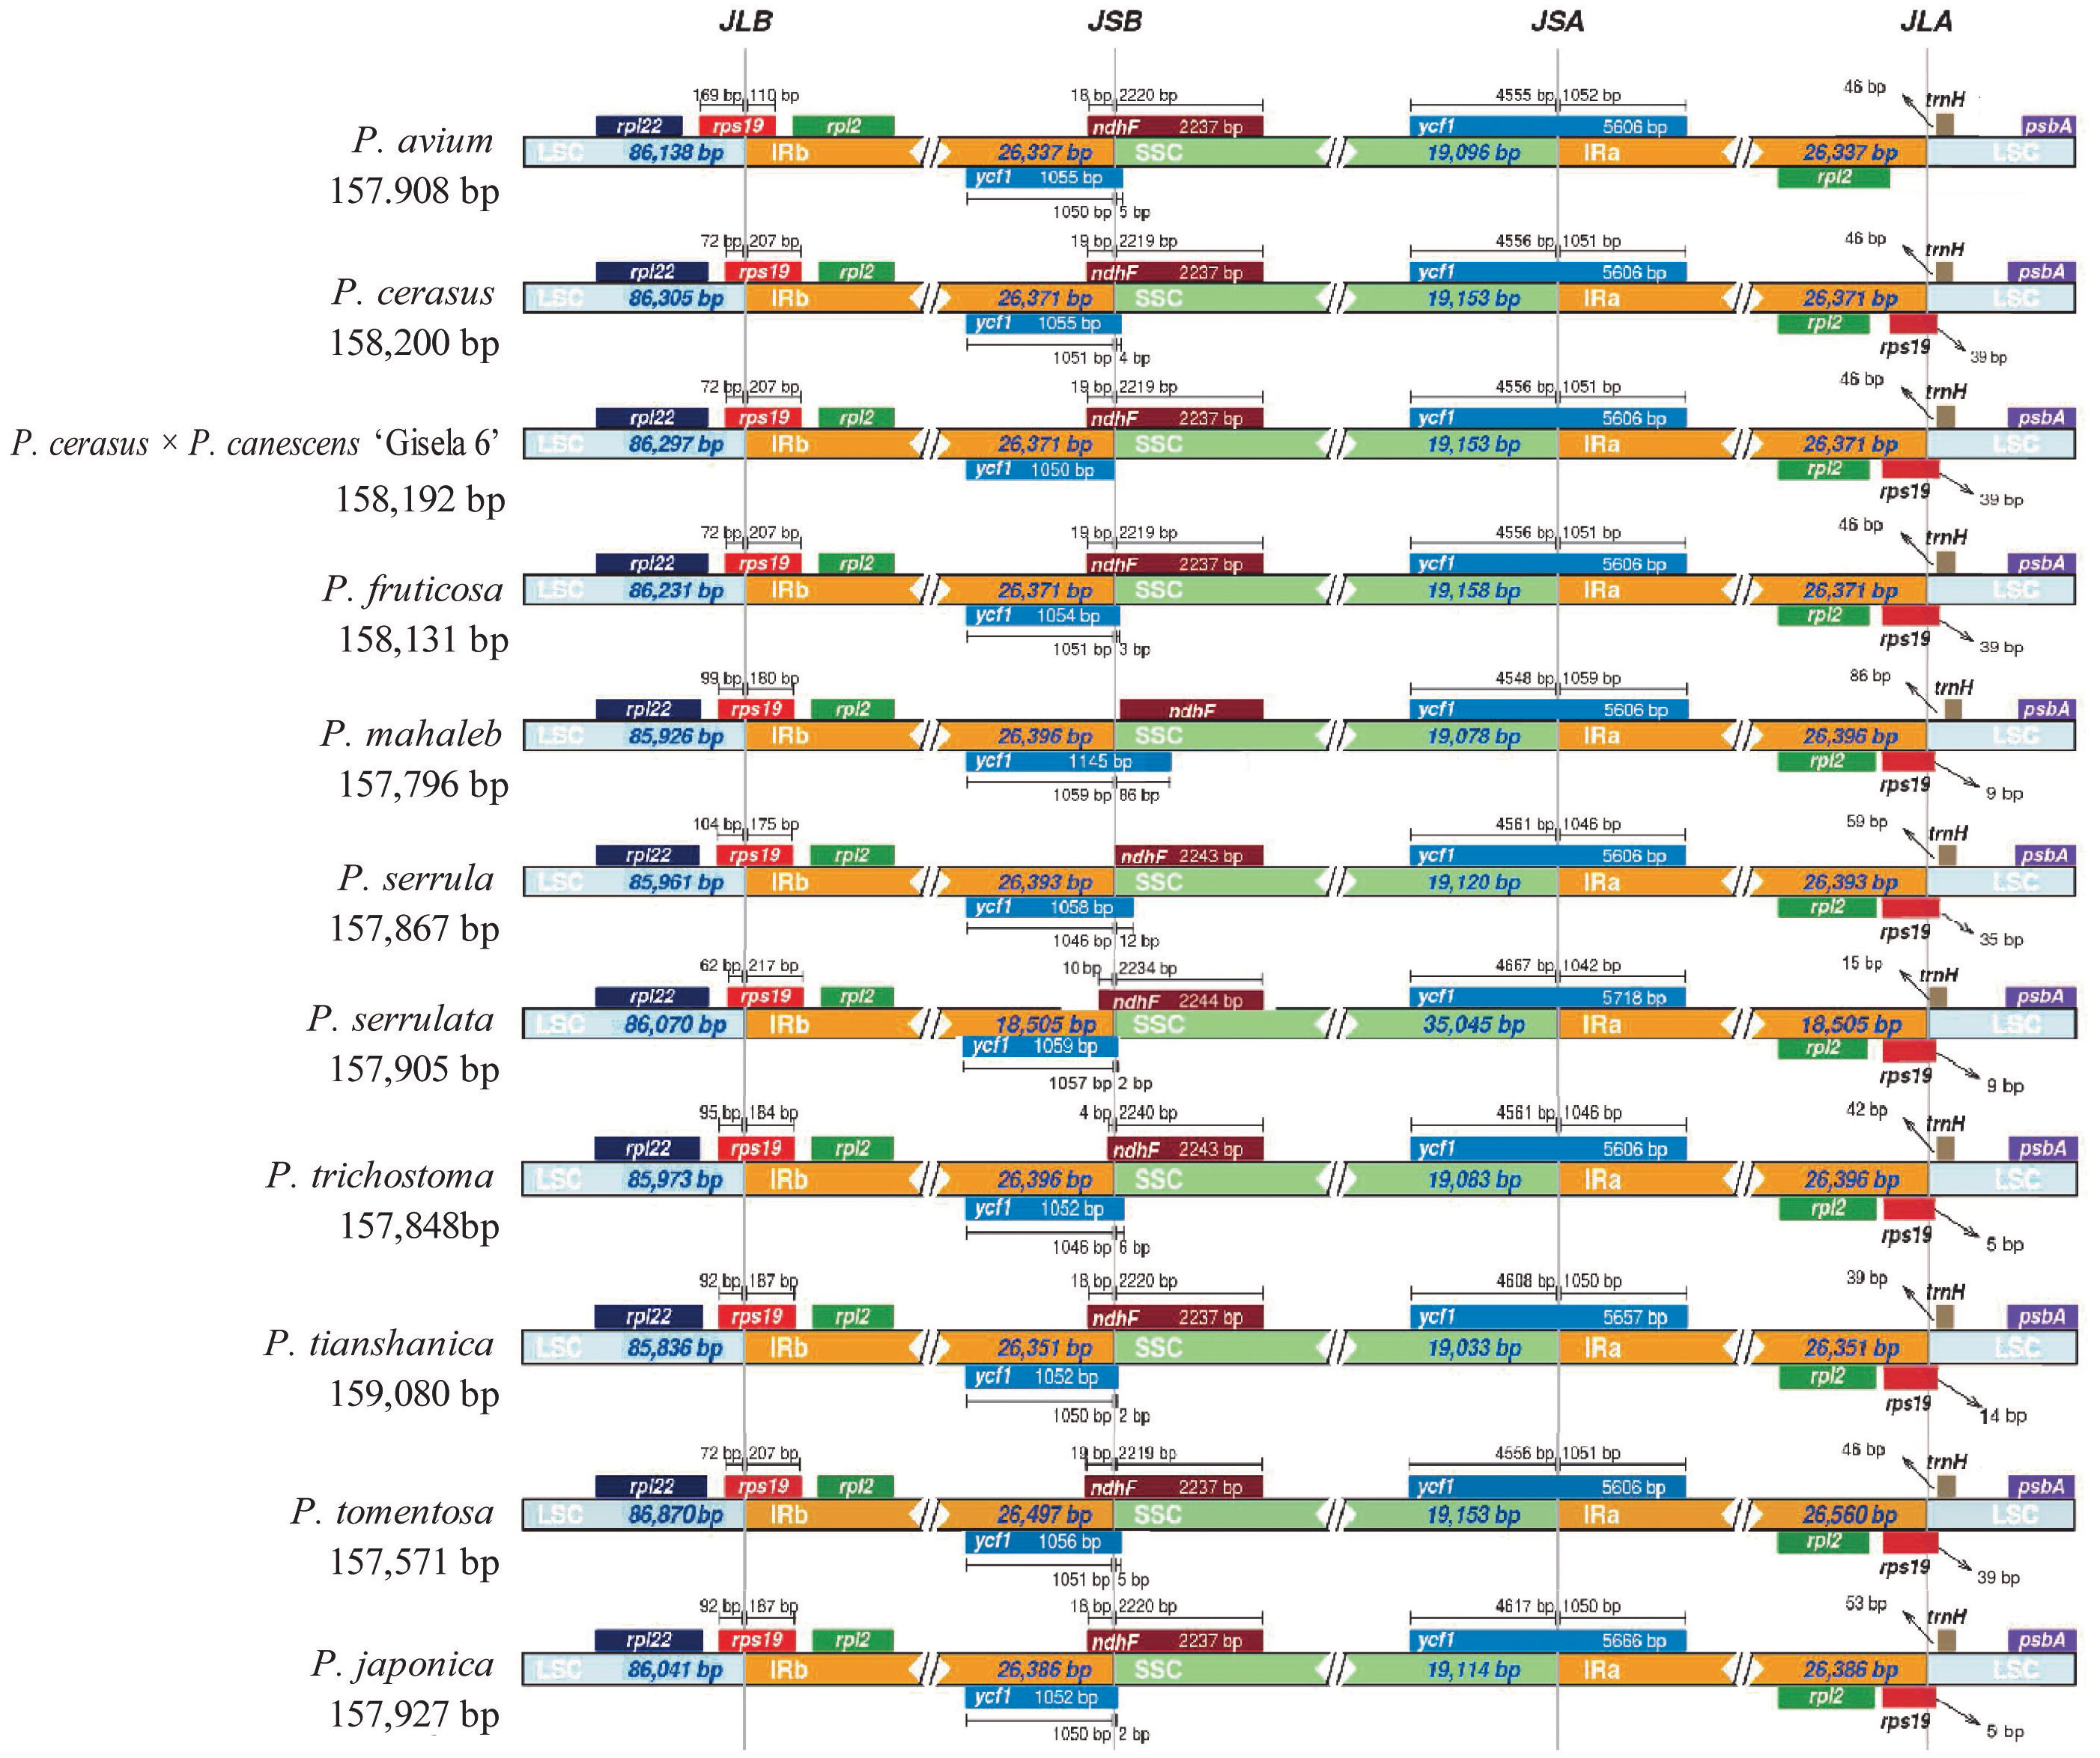
Figure 3 Comparison of the inverted repeat (IR)/large single copy (LSC) boundaries and IR/short single copy (SSC) boundaries among chloroplast genomes of 11 Cerasus species. JLA and JLB indicate the junction sites between the SSC and the two IRs (IRA and IRB); JSA and JSB denote the junction sites between the SSC and the two IRs.
The types and distribution of SSRs were analyzed in the cp genomes of the 11 Cerasus species. A total of 634 SSRs were identified by MISA, 61.51% of which were distributed in the IGR and 133 of which were found in CDSs (Figure 4A; Table S4A). Except for P. tianshanica, the SSRs were mainly enriched in the IGRs and CDSs, both accounting for 41.67% of all SSRs. For the other Cerasus species, SSRs were more abundant in IGRs than in other regions (Figure 4A; Table S4A). Moreover, four types of SSRs were identified: mono-, di-, and tri-nucleotide, and complex repeats. Mononucleotide repeats were the most common, accounting for 85.65% of the total (n =543, range 45–54; Table S4A). By contrast, only 31 dinucleotide repeats were identified (ranging from 1 to 5), accounting for 4.89% of the total, and only two trinucleotide repeats were found, in P. cerasus × P. canescens ‘Gisela 6’ and P. tianshanica, respectively. No other polynucleotides were detected. In addition, the composition of the mononucleotide repeats was mostly A/T, with C and G repeats accounting for less than 6% of these repeats (Table S4A), and all dinucleotide repeats were composed of AT/TA. For the non-overlapping repeats, there were 1164 forward repeats, 645 reverse repeats, 1160 palindromic repeats, 646 complement repeats, and 585 tandem repeats identified using REPuter (Kurtz et al., 2001) and Tandem Repeats Finder for the Cerasus plastomes (Table S4B). Forward repeats were the most abundant (n = 73–179), followed by palindromic repeats (n = 25–173). Tandem repeats were the least abundant repeat type, ranging from 45 in P. mahaleb to 73 in P. tianshanica within 5–249 bp (Table S4). Dispersed repeats were more common in P. cerasus × P. canescens ‘Gisela 6’ and P. tianshanica than in the other species (Figure 4B and Table S4B).
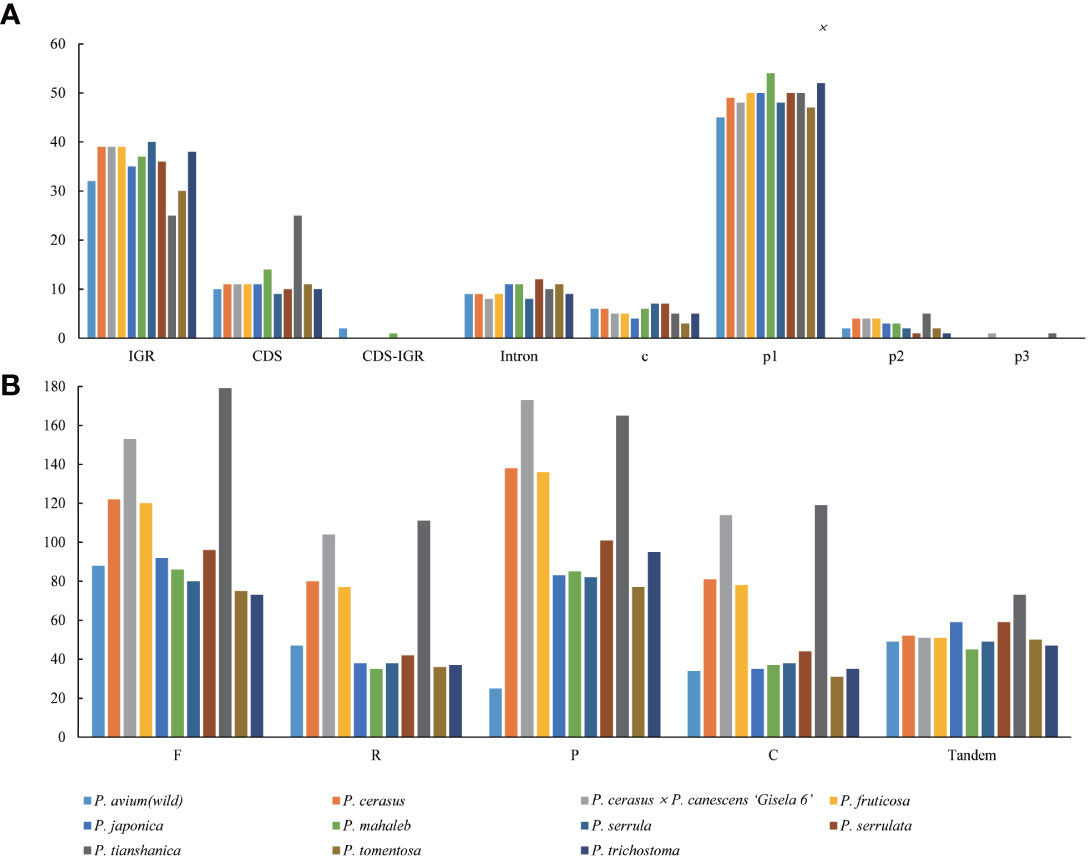
Figure 4 Repetitive motif abundance in 11 Cerasus species computed by REPuter and Tandem Repeats Finder. (A) Distribution and types of simple sequence repeats in the eleven chloroplast genomes. (B) Number of repeat types in the eleven chloroplast genomes.
A total of 49 Cerasus genes were selected based on the 350-bp length threshold for codon bias identification. Codon usage measures such as Nc; silent T, C, A, and G at the 3rd codon position (T3s, C3s, A3s and G3s, respectively); total number of amino acids (L_aa); aromaticity; and grand average of hydropathicity (GRAVY) were estimated (Tables S4A, S5). The number of synonymous codons (L_sym) was approximately 49.7 and the range of L_aa, except for the termination codon (TER), was from 24,034 in P. cerasus × P. canescens ‘Gisela 6’ to 24,421 in P. serrulata, with a relative synonymous codon usage (RSCU) value ranging from 0.38 (CUC) to 1.96 (UUA) (Tables S5B, C; Figures S5, 5). The average Nc was 49.74 for CDSs of the 11 Cerasus species, and the T3s, C3s, A3s, and G3s was 0.4674, 0.1718, 0.4356, and 0.1817, respectively. The mean of GC3s was 0.269 and the GC content was 0.376 (Table S5A). In addition, leucine and isoleucine were the most common codons (Figure 5). Methionine (AUG) and tryptophan (UGG) were each encoded by only one codon, and showed no codon bias (Figure 5). Codon usage was biased toward A and T at the third codon position. Almost all A/U-ending codons had RSCU values larger than 1.0, except for Ile-AUA, Leu-CUA, and TER-UGA, whereas all C/G-ending codons had RSCU values ≤ 1, except for Leu-UUG (Figure S5; Table S5C).
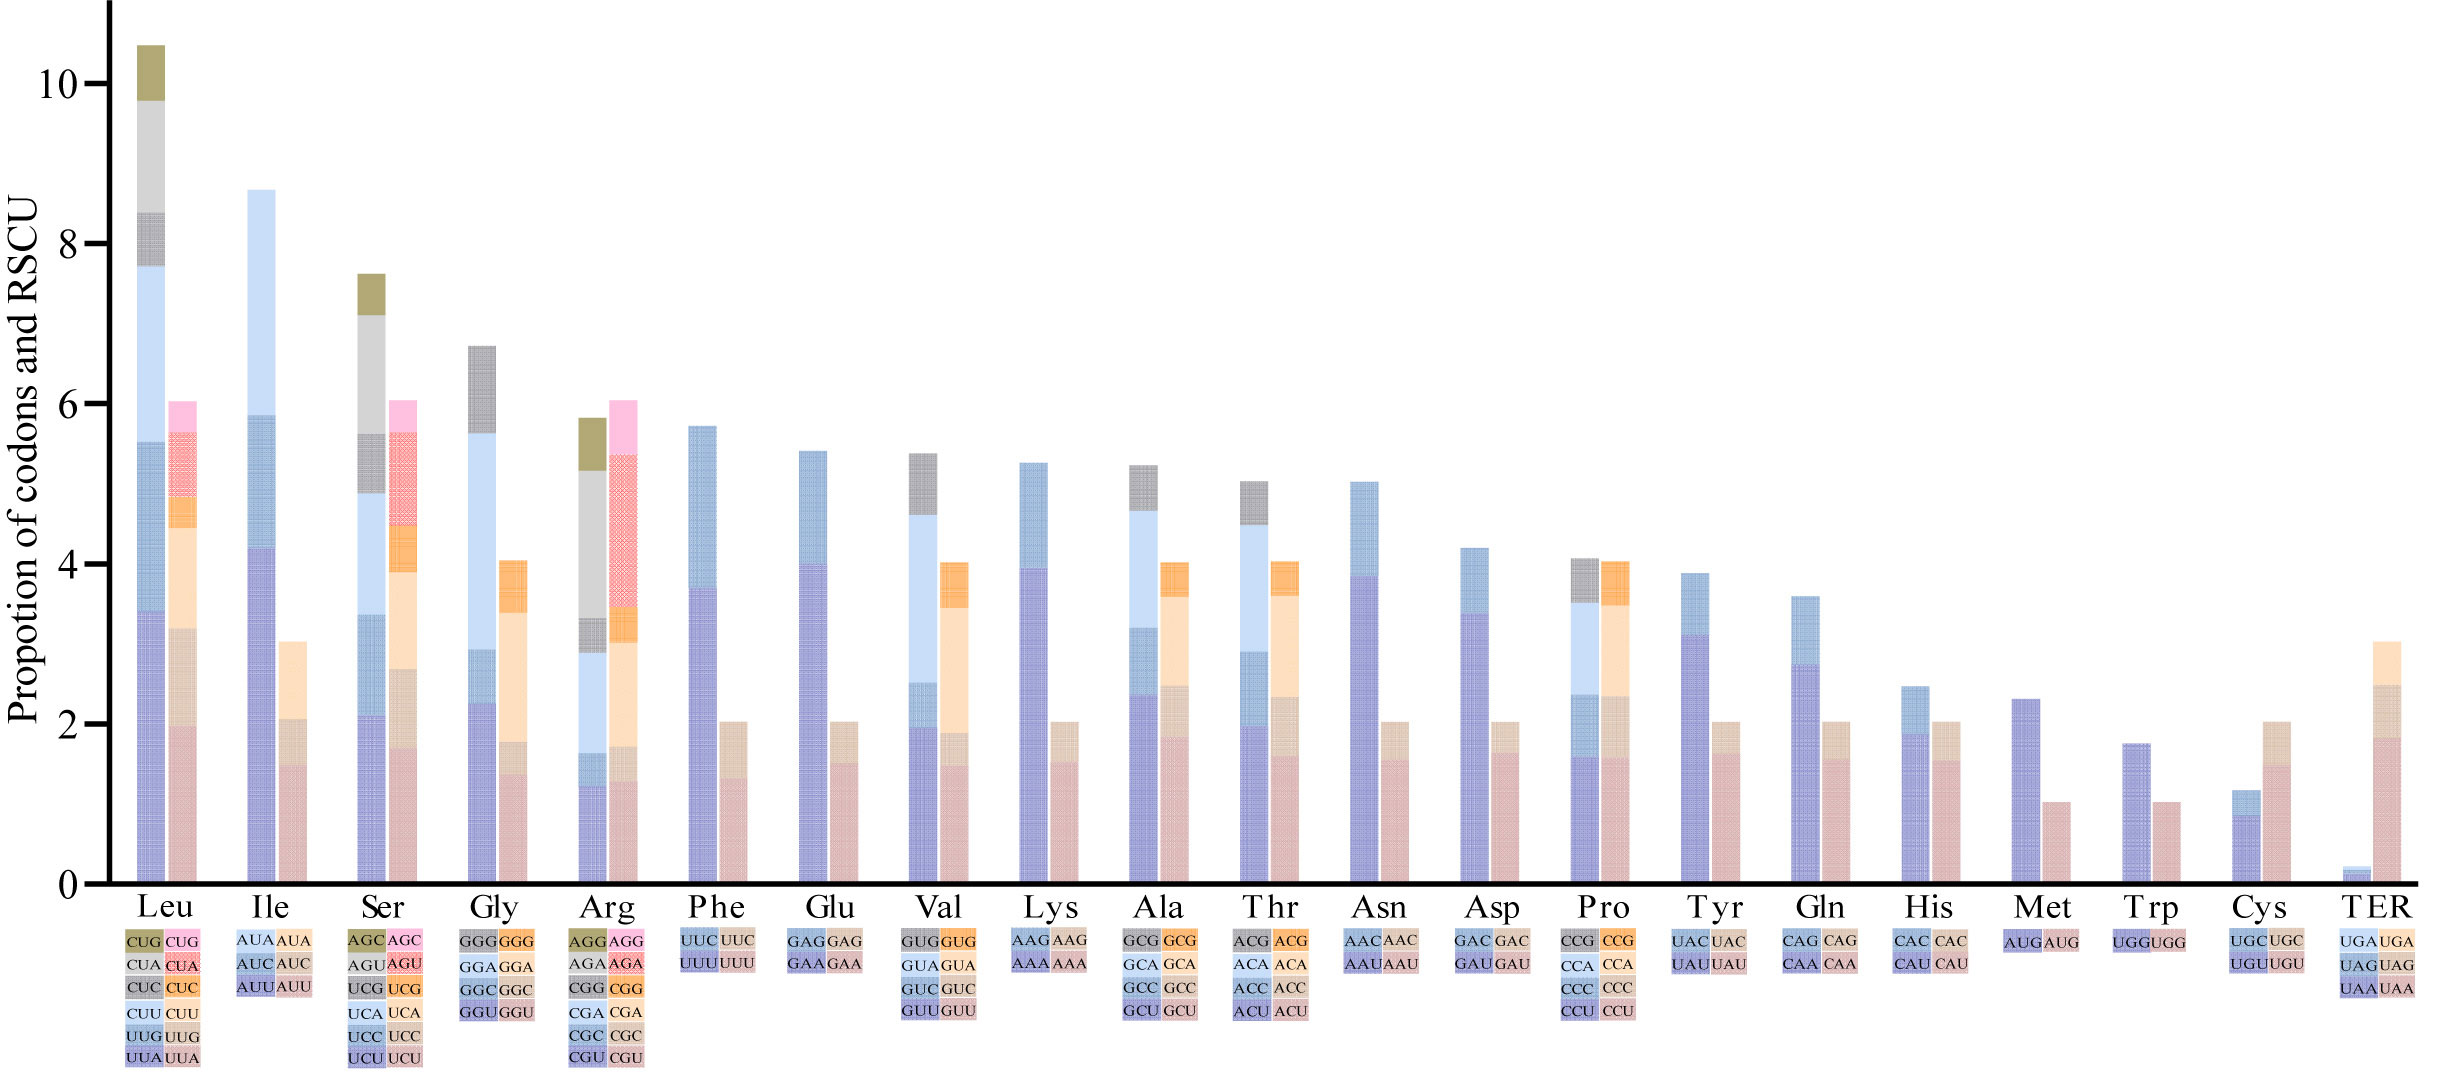
Figure 5 Codon content of 20 amino acids and termination codons in protein-coding genes of Cerasus plastomes. The left columns of the histogram present codon usage and the right columns denote the relative synonymous codon usage (RSCU) values. Colors correspond to codons listed underneath the columns.
The synonymous (Ks) and non-synonymous (Ka) nucleotide substitution patterns are very important markers in gene evolution studies (Kimura, 1989). In all protein-coding genes of Cerasus, ndhB, petL, psbH, rpl33, rps18, and ycf15 had no nonsynonymous rate change, and 20 genes (psaJ, psbA, atpE ndhE, ndhJ, psaC, petD, ycf3, ycf4, three rpl genes, three rps genes, and five psb genes) had no synonymous rate change. Fourteen genes showed neither substitution, including rpl23, rps7, rps8, rps12, petG, petN, psaI, psbI, psbJ, psbK, psbL, psbM, psbN, and psbT. Table S6 lists the genes with both Ka and Ka substitutions. A Ka/Ks ratio < 1, especially less than 0.5, indicates purifying selection; Ka/Ks > 1 indicates likely positive selection; and Ka/Ks values close to 1 show neutral evolution, or relaxed selection (Kimura, 1989; Ivanova et al., 2017). The average Ka/Ks ratio analyzed in the 11 genomes was 0.3158 for 34 protein-coding genes, which were not region-specific. Most protein-coding genes have undergone purifying selection: 33 coding genes showed Ka/Ks < 1, ranging from 0.0301 (atpA) to 0.8861 (ccsA). ycf2_IRA showed Ka/Ks > 1, whereas the ratio for the other ycf2 gene on IRB was 0.2908. The ccsA and ndh genes (except for ndhK in the LSC region) were located in the SSC region, ycf1 was located at the boundary of the LSC and IR regions, and other genes existed in the LSC. Moreover, Ka/Ks ratios in the range of 0.5–1 were observed for the genes petA, rps15, and ccsA, with the value of ccsA being close to 1, indicating neutral evolution (Table S6A; Figure S6). The Ka/Ks values of the remaining genes were between 0.04 and 0.50, with rpoA, atpA, petB, cemA, and rpoC1 showing patterns of strong purifying selection pressure (Ka/Ks < 0.1). For ycf2_IRA, matK, rpoC2, ccsA, and ndhI, the Ka/Ks ratio was greater than 1 in a few cases between the species (Table S6B), especially for ycf2_IRA in the comparison of P. tianshanica with other species. In addition, we analyzed the Ka/Ks ratios of the 10 cp genomes for comparison with P. avium, which reflected the selection pressure for the P. avium cp genome (Figure S7). The average Ka/Ks values of most genes were less than 0.5, except for matK, rpoC2, and ycf2_IRA. The Ka/Ks value of matK was greater than 1 in the comparisons of P. avium with P. japonica, P. tomentosa, and P. tianshanica (Table S6C).
We found that photosynthesis genes had varying Ka/Ks ratios, which were all less than 1, including one large subunit of the RuBisCO gene rbcL (0.1799–0.4581); two subunits of the photosystem II genes psbB and psbC (0.0643–0.2921); two subunits of the cytochrome genes petA and petB (0.0561–0.6536); and three subunits of the ATP synthase genes atpA, atpB, and atpF (0.0301–0.3146). The ratios of five subunits of NADH dehydrogenase genes (ndhA, ndhD, ndhH, ndhG, ndhG and ndhI) ranged from 0.04701 to 1.7677, and the Ka/Ks ratio of ndhI was greater than 1. Ka/Ks ratios of self-replicating genes were as follows: 0.0566–0.8818 for ribosomal protein small subunit genes (rps3, rps4, rps15, rps16), 0.2447–0.496 for ribosomal protein large subunit genes (rpl16 and rpl20), and 0.0327–1.1722 for DNA-dependent RNA polymerase genes (rpoA, rpoB, rpoC1, and rpoC2). Among these, only rpoC2 had Ka/Ks > 1. Among the other genes, matK, ccsA, cemA, clpP, accD, ycf1, and ycf2, the Ka/Ks ratios of matK, ycf2, and ccsA were more than 1 (Table S6B).
Organelle genome sequencing plays a key role in deciphering the evolutionary phylogenomics and cladistics of plant species. Phylogenetic relationships of Cerasus species were estimated with 6 datasets respectively, using Bayesian inference (BI) and ML methods. The results showed the tree topologies based on LSC, SSC, CDS and IGS datasets is basically consistent with complete plastome, especially using BI method (Figures S8–S12). Phylogenetic relationships were almost as consistent with BI and ML with the complete cp genome sequences (Figure 6). In the ingroup, the subgenera Cerasus, Prunus, Armeniaca, and Amygdalus were divided into four major clades (clade I, clade II, clade III, and clade IV) with BI posterior probabilities (BIPP) of 100% and ML bootstrap support (MLBS) of 99–100%. All of the clade I species belonged to subgenus Cerasus and all clade IV species belonged to subgenus Amygdalus. In clade III, only P. sibirica was an Armeniaca species, whereas the others belonged to Prunus. Among the four clades, clade II showed a relatively more complex composition, including dwarf cherry species (P. tomentosa, P. japonica, P. glandulosa, P. humilis, and P. dictyoneura) of Cerasus, Amygdalus (P. tenella, P. pedunculata, P. triloba), and Armeniaca (P. mume, P. mandshurica, and P. armeniaca). Through rebuilding the phylogenetic tree, clade II could be further divided into three small clades (BIPP = 99.87–100%; MLBS = 94–100%), named subclade I, subclade II, and subclade III, respectively. All species in subclade III belonged to Cerasus, and subclade I was also dominated by Cerasus except for P. triloba. Conversely, most of the subclade II species belonged to the subgenus Armeniaca, except for P. tenella. In clade I, P. mahaleb formed a separate branch (Figure 6). P. trichostoma was the closest relative to P. rufa. P. cerasodies, P. fruticosa, P. cerasus, P. tianshanica, and P. cerasus × P. canescens ‘Gisela 6’ were divided into the same small clade, which was close to the clade formed by P. avium, P. clarofolia, and P. setulasa. P. serrula was divided into a clade with P. pseudocerasus and P. clarofolia. P. serrula was the closest relative to P. fengyangshanica, P. jamasakura, P. dielsiana, and seven other species. Surprisingly, P. tomentosa and P. japonica were separated from the majority of Cerasus species and were most closely related to P. triloba and P. pedunculata of the subgenus Amygdalus (Figure 6).
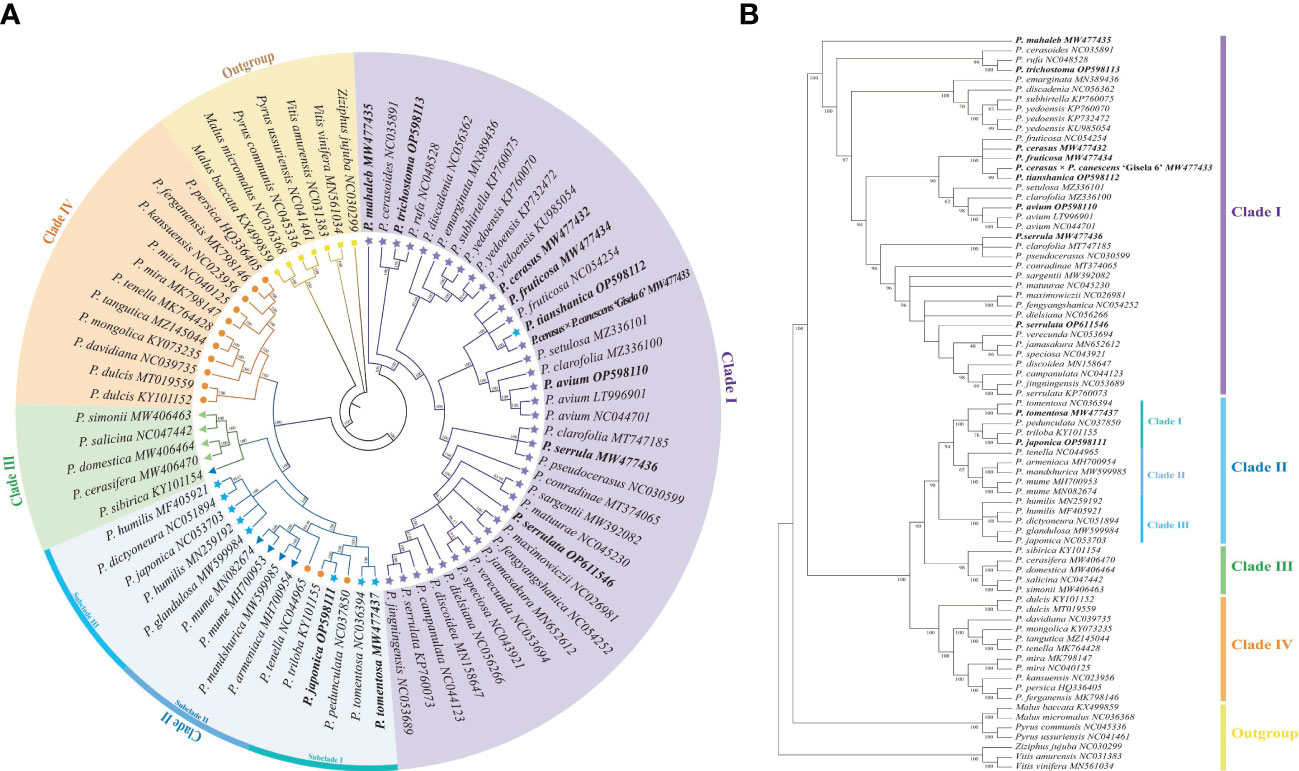
Figure 6 Phylogenetic tree reconstruction of 45 Cerasus species and 23 other Prunoideae species based on whole chloroplast genome sequences. (A) Phylogenetic tree reconstruction using the program Mrbayes of Geneious Prime v2022.0.2. Numbers above the lines represent the Bayesian inference posterior probability (percent). (B) Phylogenetic tree reconstruction using Maximum likelihood method of MEGA v11. Numbers below the lines represent the bootstrap support values.
The cp genome exhibits maternal inheritance in contrast to the nuclear genome (Palmer, 1985). Because of its evolutionarily conserved structure, sequence length, and constituent genes, the cp genome has been widely used in analyses of genetic variation and phylogeny with moderate base replacement (Palmer, 1985; Ravi et al., 2007; Wicke et al., 2011). In this study, the 11 Cerasus cp genomes presented a typical quadripartite structure (LSC, SSC, IRA, and IRB), as reported for other Prunus species (Xue et al., 2019; Zhang et al., 2021; Li et al., 2022) and land plants (Wicke et al., 2011; Zhang et al., 2017; Liu et al., 2020). The Cerasus cp genome size (157,571–158,830 bp) was similar to that of previously reported Prunus species such as P. pseudocerasus (157,834 bp), P. dielsiana (158,005 bp), P. clarofolia (157,899 bp), P. mira (158,153 bp), and P. salicina (157,916 bp) (Feng et al., 2018; Bao et al., 2019; Xue et al., 2019; Zhao et al., 2019; Li et al., 2022). This indicated that the length of the cp sequence is relatively conserved with only moderate variation among species of the Prunus genus.
Comparative analysis of Cerasus species showed that the LSC and SSC regions were more divergent than the IR regions (Figure 2), whereas the CNSs showed significant divergence (Figure S3), consistent with findings for other species (Xue et al., 2019; Liu et al., 2020; Wang et al., 2021). One of the most important factors contributing to the variation in plastome size between species may be the expansion and contraction of IR boundaries (Xue et al., 2019; Zhang et al., 2021). The contraction and expansion of rps19 and ndhF were predicted as the main contributors to the overall variation observed among the Cerasus cp genomes, followed by expansion of ycf1 toward the SSC region (Figures 3, S4). The three genes at IR boundaries were consistent in P. mume, P. salicina, and P. armeniaca (Xue et al., 2019). Significant IR contraction of rps19 and ndhF was observed in the plastomes of some Cerasus and other Prunus species (Zhang et al., 2021; Wang et al., 2022). In addition, displacement of the trnH gene at the IR/LSC locus was detected in the aforementioned studies and the current study. This pattern of these four genes located at IR boundaries was also found in species of other genera, including Malus (Zhang et al., 2021; Wang et al., 2022), Diospyros (Heinze et al., 2016), and Morella (Liu et al., 2017). Therefore, although the IR regions are highly conserved for stabilizing the cp genome structure (Figure 2) (Marechal and Brisson, 2010), some changes (especially in rps19, ndhF, and ycf1) are evident at the IR border areas among Cerasus species, in line with reports for other species and genera.
We annotated 115 unique genes in this study (Table 2), which is similar to the findings reported for other Prunus plastomes with 110–115 unique genes (Xue et al., 2019; Wang et al., 2021; Zhang et al., 2021; Li et al., 2022). There were four rRNA genes detected (4.5S rRNA, 5S rRNA, 16S rRNA, and 23S rRNA), which coincides with reports for land plants (Sugiura, 1992). The differences were mainly reflected in tRNA and protein-coding genes, such as ycf genes (Xue et al., 2019; Zhang et al., 2021). The ycf15 gene was detected in all 11 Cerasus cp genomes, but is lacking in some Prunus (sensu lato) plastomes (Zhang et al., 2021). According to previous reports, angiosperm plastomes harbor approximately 70–88 protein-coding genes (Liu et al., 2020) and 80 unique protein-coding genes were annotated in this study. We found some CDSs and CNSs with relatively high nucleotide diversity (Table S2; Figure S3), which was in line with previous research (Xue et al., 2019; Liu et al., 2020; Wang et al., 2021). Analyses of cp genes and genomes have largely contributed to resolving portions of the plant tree of life (Ravi et al., 2007). Various genes and IGRs have been identified as evolutionarily significant markers, which have been widely used for phylogenetic analyses (Ravi et al., 2007). Intergenic spacer regions were proposed to be the best barcoding candidates (Ravi et al., 2007), which was also confirmed in this study, and we further found that the Pi of the IGRs was higher than that of the CDSs (Table S2; Figure S3). Nevertheless, both the IGRs and CDSs can serve as useful molecular markers. Some genes (matK, rps16, rbcL, rpl16, ndhA, ndhF, and ycf1) and IGRs (rps16-trnQ, petN-psbM, rps15-ycf1, trnL-trnF) exhibited high nucleotide diversity (Table S2), which have also been used for phylogenetic and phylogeography analyses (Ravi et al., 2007; Chavez et al., 2016; Uchoi et al., 2016; Yang et al., 2016; Khan et al., 2018).
Repeats play an important role in genome rearrangement, which can increase the probability of replication fork stagnation, causing an error to recruit persistently specific sequence regions over evolutionary time scales (Mcdonald et al., 2011). Repetitive sequences may facilitate intermolecular recombination and enhance plastome diversity, as an abundance of sequence repeats results in genome regions with increased sequence diversity in prokaryotes and eukaryotes (Mcdonald et al., 2011; Liu et al., 2020). We also found abundant repeats in the Cerasus genome, including dispersed, palindromic, and tandem repeats, along with SSRs (Figure 4A; Table S4A). More abundant SSRs were detected in IGRs for most species, except for P. tianshanica (Figure 4A; Table S4A) and other Prunus species (Wang et al., 2021; Zhang et al., 2021). Combined with the visualization of aligned genome sequences, CNSs showed more significant divergence (Figure 2). This suggested that repetitive CNSs might be the main force promoting cp genome rearrangement in Prunus species (Wang et al., 2021). Furthermore, given the characteristics of maternal inheritance, conservation, and simple structure of the cp genome, cp microsatellites with a high degree of polymorphism can serve as useful molecular markers to identify genetic relationships, population genetic structure, and phylogeography patterns at the inter- and intrapopulation levels (Decroocq et al., 2004; Wang et al., 2021). We only detected mono-, di-, and tri-nucleotide repeats in the Cerasus cp genomes (Figure 4; Table S4) with a greater content of A/T repeats than of G/C repeats, similar to the results of other studies in the genus Prunus (Xue et al., 2019; Zhang et al., 2021). The SSRs identified in this study provide useful information for developing genetic markers to further study the population genetics, evolution, and breeding of the subgenus Cerasus, as well as for the identification and conservation of Cerasus species. Repetitive sequences are also essential for research on indels and substitutions (Wang et al., 2021), which are highly abundant in the plastome of Cerasus (Table S3) and other members of the family Rosaceae (Zhang et al., 2021).
Codon usage and synonymous/nonsynonymous substitutions play an important role in cp plastome evolution (Ivanova et al., 2017; Huang et al., 2021). Mutation is one of the most essential factors affecting codon usage, thus influencing the evolutionary course (Ivanova et al., 2017; Wang et al., 2021). Moreover, codon-choice patterns are considered to be highly conserved during the evolution process (Ikemura, 1985). An RSCU value > 1, < 1, or = 1 indicates preference, low usage, and no preference for a codon, respectively (Sharp and Li, 1987). We found biased codon usage in the Cerasus cp genome, with 19 amino acids having an RSCU value >1 (Figure S5). The codon profile showed strong bias toward the use of A/T in the third-base position, which appears to be a general phenomenon (Murray et al., 1989). Leucine and isoleucine appeared the most frequently and were biased toward UUA and AUU, respectively (Figures S5, 5), whereas cysteine was the least frequently detected, with the third base also biased toward T (UGU) in codon usage (Figures S5, 5). Among the three stop codons, there was clear usage bias toward UAA (RSCU > 1.00) (Figure S5). These results are largely consistent with reports of the cp genomes in P. zhengheensis (Huang et al., 2021; Wang et al., 2021) and other species (Alzahrani et al., 2020; Liu et al., 2020). Two amino acids, methionine (AUG) and tryptophan (UGG), showed no codon usage bias (RSCU = 1.00) (Figure S5). In other words, all amino acids are encoded by 2–6 synonymous codons with the exception of methionine and tryptophan (Murray et al., 1989).
The Ka and Ks nucleotide substitution rates as well as the Ka/Ks ratio are widely used to evaluate the sequence divergence and purifying selection in protein-coding genes. In most genes, with the exception of very rapidly evolving genes, Ka nucleotide substitutions occur less frequently than Ks owing to the action of purifying selection (Ivanova et al., 2017). Ks nucleotide substitutions generally occur more frequently than Ka substitutions (Liu et al., 2017), which was also detected for Cerasus in this study. Among the changed genes, almost all Ka/Ks ratios were less than 1.0 (Tables S5, S6), providing evidence for purifying selection on the protein-coding genes of the cp genome in the genus Prunus and family Rosaceae. According to the Ka/Ks values, we found that rpoA, atpA, petB, cemA, and rpoC1 exhibited strong purifying selection. The ccsA was under neutral selection, whereas ycf2 genes showed a signature of possible positive selection during the course of Cerasus evolution (Table S6), owing to an inserted fragment in the middle of the gene (Figure S2A), in line with the Ka/Ks analyses. However, these patterns are in contrast to previous research on Cerasus (Zhang et al., 2021), in which the matK and rpoC2 genes both showed signatures of positive selection, along with other genes such as ndhF, atpA, and psaA. Under conditions of extreme temperature and changing light intensity, the ndhF gene can balance the redox levels to maintain or enhance photosynthetic performance (Martin et al., 2009; Zhang et al., 2021). In addition, Zhang et al. (2021) detected strong signatures of positive selection in several genes of Rosaceae, including rpoA, rps16, rps18, psaA, psbL, rbcL, ndhD, ndhF, accD, ycf1, and ycf2. In particular, the rbcL gene encodes the large subunit of RuBisCO, which is one of the most useful enzymes for studying plant evolution, serving as a model protein in several studies owing to its response to environmental pressure and climate shifts (Hermida-Carrera et al., 2017; Zhang et al., 2021). In addition to rbcL, ndhF, ycf1, and rps18 had high Pi values in this study, which can help Rosaceae woody fruit trees efficiently capture light energy to obtain sufficient nutrition for growth and development as an adaptation under extreme and variable environmental conditions (Table S2). Hence, it is necessary to further study the patterns of synonymous and non-synonymous substitutions among Cerasus species, which can provide new insight into the evolution of Rosaceae.
The subgenus Cerasus can be classified in two sections of true cherry (Cerasus sensu stricto) and dwarf cherry (Microcerasus), according to Yü et al. (1986). The genetic evolution of Cerasus species has been a long-standing open research question (Liang et al., 2018; Zhang et al., 2021). Given its maternal inheritance, the cp genome has been widely used for species classification and evolutionary analyses (Wang et al., 2022). Therefore, we reconstructed the Cerasus phylogenetic tree based on the complete cp genome (Figure 6). In line with the classification proposed by Yü et al. (1986) and others, true cherry species were classified in a single group as clade I (Figure 6). Surprisingly, P. tianshanica, as a Microcerasus species, also clustered in the true cherry group and formed a clade with P. cerasus, P. fruticosa, P. cerasus × P. canescens ‘Gisela 6’, and P. avium. Moreover, P. mahaleb in clade I was separated from other true cherry species, which is in line with previous reports (Chin et al., 2014; Zhang et al., 2021). Further subdivisions of true cherry match the existing classification (Yü et al., 1986; Webster and Looney, 1996) proposing P. mahaleb or P. emarginata, P. pennsylvanica, and P. prunifolia as a separate group, named section Mahaleb Focke (Table S7). However, in the present study, P. emarginata was not grouped with P. mahaleb (Figure 6). In addition, we found that some true cherry species did not follow the grouping of existing classifications (Yü et al., 1986; Webster and Looney, 1996) or varied to a certain extent at the section level, such as P. tianshanica, P. serrula, and P. serrulata (Figure 6; Table S7). Microcerasus also showed a significant difference from other taxa (Table S7) (Yü et al., 1986; Webster and Looney, 1996), which were grouped with Amygdalus, Armeniaca, and Prunus as a subclade in this study (Figure 6). These relationships were also reported in previous studies (Chen et al., 2018; Zhang et al., 2021; Li et al., 2022). Microcerasus showed close evolutionary relationships to Amygdalus (P. tenella, P. pedunculata, and P. triloba) and Armeniaca (P. mume, P. mandshurica, and P. armeniaca) species. Specifically, P. japonica and P. tomentosa were the closest relatives to Amygdalus (P. triloba and P. pedunculata). Previous studies also revealed that P. pesica in Amygdalus was closely related to Microcerasus (Chen et al., 2018; Wang et al., 2020; Zhang et al., 2021). Hence, during the evolution process, true cherry formed a distinct group, while Microcerasus remained genetically closer to Amygdalus, Armeniaca, and Prunus (sensu stricto) than to true cherry. These results can be supported by multi-cp genome comparative (Zhang et al., 2021) and whole-genome analyses (Wang et al., 2020). Nevertheless, further breakdown of Cerasus (sensu stricto) should not be ignored based on these results, which contrast with the existing classification criteria (Yü et al., 1986; Webster and Looney, 1996). Accordingly, further study of the taxa of the subgenus Cerasus, especially Microcerasus, is necessary to enable breeding novel cherry cultivars and to gain a better understanding of the evolution of Prunus sensu lato specifically and Rosaceae plants more broadly.
Comparative analysis of the cp genome is a key approach to study the molecular evolution and reconstruct the phylogenetic tree of Cerasus species. The present analysis of the cp genomes of 11 Cerasus species showed that IR regions are more strongly conserved than the LSC and SSC regions, whereas the non-coding sequences showed more significant divergence than the coding regions. The contraction/expansion of rps19 and ndhF at the IR boundaries were the main contributors to the observed variation among Cerasus cp genomes, as well as variation in ycf1 and trnH. We identified 26 genes and IGRs with variations that can be used as potential molecular markers and candidate DNA barcodes for studying the phylogeny and phylogeography of cherry species. We further provided important evidence that P. mahaleb forms a unique clade among true cherry (Cerasus sensu stricto) due to plastid genome rearrangement. Microcerasus was found to be genetically closer to Amygdalus, Armeniaca, and Prunus (sensu stricto) than to true cherry species. Moreover, P. tianshanica emerged as a noteworthy species given its close relationship to P. avium. Overall, these findings provide new insight and resources to breed novel cultivated sweet cherry and cherry rootstock in the future.
The datasets presented in this study can be found in online repositories. The names of the repository/repositories and accession number(s) can be found in the article/Supplementary Material.
TW and Y-LC designed the research. TW performed the experiments and analyzed the data. Y-LC identified the plant materials and revised the manuscript. B-XQ, JZ, and K-SS revised the manuscript. FA assembled the sequences. TW, B-XQ, JZ, L-YP, and FA annotated the plastomes. TW, K-SS, L-YP, X-SH, TL, and P-KL collected the plant materials. FA and L-YP provided analysis support. All authors contributed to the article and approved the submitted version.
This work was financially supported by the Bingtuan Science and Technology Program (Grant number: 2021AB017) and the Agricultural Science and Technology Innovation and Transformation Project of Shaanxi province (Grant number: NYKJ-2022-YL(XN)47). The funders had no role in study design, data collection, data analysis, data interpretation, the writing of the manuscript, or decision to publish.
We are grateful to Associate Professor Zengqiang Qian from College of Life Sciences, Shaanxi Normal University, and Guoqing Bai from Xi’an Botanical Garden of Shaanxi Province (Institute of Botany of Shaanxi Province Shaanxi) and Engineering Research Centre for Conservation and Utilization of Botanical Resources for their useful advice and help in data analyses.
The authors declare that the research was conducted in the absence of any commercial or financial relationships that could be construed as a potential conflict of interest.
All claims expressed in this article are solely those of the authors and do not necessarily represent those of their affiliated organizations, or those of the publisher, the editors and the reviewers. Any product that may be evaluated in this article, or claim that may be made by its manufacturer, is not guaranteed or endorsed by the publisher.
The Supplementary Material for this article can be found online at: https://www.frontiersin.org/articles/10.3389/fpls.2023.1070600/full#supplementary-material
Alzahrani, D. A., Yaradua, S. S., Albokhari, E. J., Abba, A. (2020). Complete chloroplast genome sequence of Barleria prionitis, comparative chloroplast genomics and phylogenetic relationships among acanthoideae. BMC Genomics 21, 393. doi: 10.1186/s12864-020-06798-2
Amiryousefi, A., Hyvonen, J., Poczai, P. (2018). IRscope: an online program to visualize the junction sites of chloroplast genomes. Bioinformatics 34, 3030–3031. doi: 10.1093/bioinformatics/bty220
Bao, W., Ao, D., Wuyun, T., Li, T., Wang, L., Liu, H. (2019). The complete chloroplast genome of Prunus mira koehne (Prunoideae, rosaceae), a wild and indigenous peach on Tibet, China. Mitochond. DNA B 4, 3731–3733. doi: 10.1080/23802359.2019.1679048
Beier, S., Thiel, T., Munch, T., Scholz, U., Mascher, M. (2017). MISA-web: A web server for microsatellite prediction. Bioinformatics 33, 2583–2585. doi: 10.1093/bioinformatics/btx198
Bortiri, E., Oh, S. H., Jiang, J., Baggett, S., Granger, A., Weeks, C., et al. (2001). Phylogeny and systematics of Prunus (Rosaceae) as determined by sequence analysis of ITS and the chloroplast trnL-trnF spacer DNA. Syst. Bot. 26, 797–807. doi: 10.1043/0363-6445-26.4.797
Brudno, M., Malde, S., Poliakov, A., Do, C. B., Couronne, O., Dubchak, I., et al. (2003). Glocal alignment: finding rearrangements during alignment. Bioinformatics 19 Suppl 1, i54–i62. doi: 10.1093/bioinformatics/btg1005
Chan, P. P., Lin, B. Y., Mak, A. J., Lowe, T. M. (2021). tRNAscan-SE 2.0: improved detection and functional classification of transfer RNA genes. Nucleic Acids Resour. 49, 9077–9096. doi: 10.1093/nar/gkab688
Chavez, D. J., Beckman, T. G., Chaparro, J. X. (2016). Identifying the north American plum species phylogenetic signal using nuclear, mitochondrial, and chloroplast DNA markers. J. Am. Soc Hortic. Sci. 141, 623–644. doi: 10.21273/jashs03875-16
Chen, T., Wang, Y., Wang, L., Chen, Q., Zhang, J., Tang, H. R., et al. (2018). The complete chloroplast genome of tomentosa cherry Prunus tomentosa (Prunoideae, rosaceae). Mitochond. DNA B 3, 672–673. doi: 10.1080/23802359.2018.1476068
Chin, S. W., Shaw, J., Haberle, R., Wen, J., Potter, D. (2014). Diversification of almonds, peaches, plums and cherries - molecular systematics and biogeographic history of Prunus (Rosaceae). Mol. Phylogen. Evol. 76, 34–48. doi: 10.1016/j.ympev.2014.02.024
Daniell, H., Lin, C. S., Yu, M., Chang, W. J. (2016). Chloroplast genomes: diversity, evolution, and applications in genetic engineering. Genome Biol. 17, 134. doi: 10.1186/s13059-016-1004-2
Decroocq, V., Hagen, L. S., Favé, M.-G., Eyquard, J.-P., Pierronnet, A. (2004). Microsatellite markers in the hexaploid Prunus domestica species and parentage lineage of three European plum cultivars using nuclear and chloroplast simple-sequence repeats. Mol. Breed. 13, 135–142. doi: 10.1023/B:MOLB.0000018761.04559.b3
Dunning, L. T., Olofsson, J. K., Papadopulos, A. S. T., Hibdige, S. G. S., Hidalgo, O., Leitch, I. J., et al. (2022). Hybridisation and chloroplast capture between distinct themeda triandra lineages in Australia. Mol. Ecol 31, 5846–5860. doi: 10.1111/mec.16691
Feng, Y., Liu, T., Wang, X. Y., Li, B. B., Liang, C. L., Cai1, Y. L. (2018). Characterization of the complete chloroplast genome of the Chinese cherry Prunus pseudocerasus (Rosaceae). Conserv. Genet. Resour. 10, 85–88. doi: 10.1007/s12686-017-0770-9
Frazer, K. A., Pachter, L., Poliakov, A., Rubin, E. M., Dubchak, I. (2004). VISTA: Computational tools for comparative genomics. Nucleic Acids Res. 32, W273–W279. doi: 10.1093/nar/gkh458
Greiner, S., Lehwark, P., Bock, R. (2019). OrganellarGenomeDRAW (OGDRAW) version 1.3.1: Expanded toolkit for the graphical visualization of organellar genomes. Nucleic Acids Res. 47, W59–W64. doi: 10.1093/nar/gkz238
Greiner, S., Rauwolf, U., Meurer, J., Herrmann, R. G. (2011). The role of plastids in plant speciation. Mol. Ecol. 20, 671–691. doi: 10.1111/j.1365-294X.2010.04984.x
Hahn, C., Bachmann, L., Chevreux, B. (2013). Reconstructing mitochondrial genomes directly from genomic next-generation sequencing reads-a baiting and iterative mapping approach. Nucleic Acids Res. 41, e129. doi: 10.1093/nar/gkt371
Heinze, B., Fu, J., Liu, H., Hu, J., Liang, Y., Liang, J., et al. (2016). Five complete chloroplast genome sequences from Diospyros: Genome organization and comparative analysis. PloS One 11, e0159566. doi: 10.1371/journal.pone.0159566
Hermida-Carrera, C., Fares, M. A., Fernandez, A., Gil-Pelegrin, E., Kapralov, M. V., Mir, A., et al. (2017). Positively selected amino acid replacements within the RuBisCO enzyme of oak trees are associated with ecological adaptations. PloS One 12, e0183970. doi: 10.1371/journal.pone.0183970
Huang, X., Tan, W., Li, F., Liao, R., Guo, Z., Shi, T., et al. (2021). The chloroplast genome of Prunus zhengheensis: Genome comparative and phylogenetic relationships analysis. Gene 793, 145751. doi: 10.1016/j.gene.2021.145751
Huelsenbeck, J. P., Ronquist, F. (2001). MRBAYES: Bayesian inference of phylogenetic trees. Bioinformatics 17, 754–755. doi: 10.1093/bioinformatics/17.8.754
Ikemura, T. (1985). Codon usage and tRNA content in unicellular and multicellular organisms. Mol. Biol. Evol. 2, 13–34. doi: 10.1093/oxfordjournals.molbev.a040335
Ivanova, Z., Sablok, G., Daskalova, E., Zahmanova, G., Apostolova, E., Yahubyan, G., et al. (2017). Chloroplast genome Analysis of resurrection tertiary relict Haberlea rhodopensis highlights genes important for desiccation stress response. Front. Plant Sci. 8. doi: 10.3389/fpls.2017.00204
Kearse, M., Moir, R., Wilson, A., Stones-Havas, S., Cheung, M., Sturrock, S., et al. (2012). Geneious basic: An integrated and extendable desktop software platform for the organization and analysis of sequence data. Bioinformatics 28, 1647–1649. doi: 10.1093/bioinformatics/bts199
Khan, G., Zhang, F., Gao, Q., Fu, P., Zhang, Y., Chen, S. (2018). Spiroides shrubs on qinghai-Tibetan plateau: Multilocus phylogeography and palaeodistributional reconstruction of Spiraea alpina and S. mongolica (Rosaceae). Mol. Phylogen. Evol. 123, 137–148. doi: 10.1016/j.ympev.2018.02.009
Kimura, M. (1989). The neutral theory of molecular evolution and the world view of the neutralists. Genome 31, 24–31. doi: 10.1139/g89-009
Kumar, S., Stecher, G., Tamura, K. (2016). MEGA7: Molecular evolutionary genetics analysis version 7.0 for bigger datasets. Mol. Biol. Evol. 33, 1870–1874. doi: 10.1093/molbev/msw054
Kurtz, S., Choudhuri, J. V., Ohlebusch, E., Schleiermacher, C., Stoye, J., Giegerich, R. (2001). REPuter: The manifold applications of repeat analysis on a genomic scale. Nucleic Acids Res. 29, 4633–4642. doi: 10.1093/nar/29.22.4633
Letunic, I., Bork, P. (2021). Interactive tree of life (iTOL) v5: An online tool for phylogenetic tree display and annotation. Nucleic Acids Res. 49, W293–W296. doi: 10.1093/nar/gkab301
Li, J., Yan, J., Yu, L., Bai, W., Nie, D., Xiong, Y., et al. (2022). The complete chloroplast genome of Prunus clarofolia (Rosaceae), a wild cherry endemic to China. MITOCHONDRIAL DNA Part B 7, 164–166. doi: 10.1080/23802359.2021.2016080
Liang, C., Wan, T., Xu, S., Li, B., Li, X., Feng, Y., et al. (2018). Molecular identification and genetic analysis of cherry cultivars using capillary electrophoresis with fluorescence-labeled SSR markers. 3 Biotech. 8, 16. doi: 10.1007/s13205-017-1036-7
Liu, Q., Li, X., Li, M., Xu, W., Schwarzacher, T., Heslop-Harrison, J. S. (2020). Comparative chloroplast genome analyses of Avena: Insights into evolutionary dynamics and phylogeny. BMC Plant Biol. 20, 406. doi: 10.1186/s12870-020-02621-y
Liu, L.-X., Li, R., Worth, J. R. P., Li, X., Li, P., Cameron, K. M., et al. (2017). The complete chloroplast genome of Chinese bayberry (Morella rubra, myricaceae): Implications for understanding the evolution of fagales. Front. Plant Sci. 8. doi: 10.3389/fpls.2017.00968
Marechal, A., Brisson, N. (2010). Recombination and the maintenance of plant organelle genome stability. New Phytol. 186, 299–317. doi: 10.1111/j.1469-8137.2010.03195.x
Martin, M., Funk, H. T., Serrot, P. H., Poltnigg, P., Sabater, B. (2009). Functional characterization of the thylakoid ndh complex phosphorylation by site-directed mutations in the ndhF gene. Biochim. Biophys. Acta 1787, 920–928. doi: 10.1016/j.bbabio.2009.03.001
Mcdonald, M. J., Wang, W. C., Huang, H. D., Leu, J. Y. (2011). Clusters of nucleotide substitutions and insertion/deletion mutations are associated with repeat sequences. PloS Biol. 9, e1000622. doi: 10.1371/journal.pbio.1000622
Moore, M. J., Soltis, P. S., Bell, C. D., Burleigh, J. G., Soltis, D. E. (2010). Phylogenetic analysis of 83 plastid genes further resolves the early diversification of eudicots. Proc. Natl. Acad. Sci. U.S.A 107, 4623–4628. doi: 10.1073/pnas.0907801107
Morton, B. R. (1998). Selection on the codon bias of chloroplast and cyanelle genes in different plant and algal lineages. J. Mol. Evol. 46, 449–459. doi: 10.1007/PL00006325
Murray, M. G., Thompson, W. F (1980). Rapid isolation of higher weight DNA. Nucleic Acids Res 8, 4321–4325. doi: 10.1093/nar/8.19.4321
Murray, E. E., Lotzer, J., Eberle, M. (1989). Codon usage in plant genes. Nucleic Acids Res. 17, 477–498. doi: 10.1093/nar/17.2.477
Palmer, J. D. (1985). Comparative organaization of chloroplast genomes. Annu. Rev. Genet. 19, 325–354. doi: 10.1146/annurev.ge.19.120185.001545
Potter, D., Eriksson, T., Evans, R. C., Oh, S., Smedmark, J. E. E., Morgan, D. R., et al. (2007). Phylogeny and classification of rosaceae. Plant Syst. Evol. 266, 5–43. doi: 10.1007/s00606-007-0539-9
Ravi, V., Khurana, J. P., Tyagi, A. K., Khurana, P. (2007). An update on chloroplast genomes. Plant Syst. Evol. 271, 101–122. doi: 10.1007/s00606-007-0608-0
Rozas, J., Ferrer-Mata, A., Sanchez-Delbarrio, J. C., Guirao-Rico, S., Librado, P., Ramos-Onsins, S. E., et al. (2017). DnaSP 6: DNA sequence polymorphism analysis of Large data sets. Mol. Biol. Evol. 34, 3299–3302. doi: 10.1093/molbev/msx248
Sevindik, E., Murathan, Z. T., Sevindik, M. (2020). Molecular genetic diversity of Prunus armeniaca l. (Rosaceae) genotypes by RAPD, ISSR-PCR, and chloroplast DNA (cpDNA) trnL-f sequences. Int. J. Fruit S. 20, S1652–S1661. doi: 10.1080/15538362.2020.1828223
Sharp, P. M., Li, W.-H. (1987). The codon adaptation index-a measure of directional synonymous codon usage bias, and its potential. Nucleic Acids Res. 15, 1281–1295. doi: 10.1093/nar/15.3.1281
Shaw, J., Small, R. L. (2004). Addressing the "hardest puzzle in American pomology:" phylogeny of Prunus sect. prunocerasus (Rosaceae) based on seven noncoding chloroplast DNA regions. Am. J. Bot. 91, 985–996. doi: 10.3732/ajb.91.6.985
Uchoi, A., Malik, S. K., Choudhary, R., Kumar, S., Rohini, M. R., Pal, D., et al. (2016). Inferring phylogenetic relationships of Indian citron (Citrus medica l.) based on rbcL and matK sequences of chloroplast DNA. Biochem. Genet. 54, 249–269. doi: 10.1007/s10528-016-9716-2
Wang, L., Guo, Z., Shang, Q., Sa, W., Wang, L. (2021). The complete chloroplast genome of Prunus triloba var. plena and comparative analysis of Prunus species: genome structure, sequence divergence, and phylogenetic analysis. Braz. J. Bot. 44, 85–95. doi: 10.1007/s40415-020-00685-6
Wang, T., Kuang, R.-P., Wang, X.-H., Liang, X.-L., Wanga, V. O., Liu, K.-M., et al. (2021). Complete chloroplast genome sequence of Fortunella venosa (Champ. ex benth.) C.C.Huang (Rutaceae): Comparative analysis, phylogenetic relationships, and robust support for its status as an independent species. Forests 12, 996. doi: 10.3390/f12080996
Wang, X., Wang, D., Gao, N., Han, Y., Wang, X., Shen, X., et al. (2022). Identification of the complete chloroplast genome of Malus zhaojiaoensis jiang and its comparison and evolutionary analysis with other Malus species. Genes (Basel) 13, 560. doi: 10.3390/genes13040560
Wang, P., Yi, S., Mu, X., Zhang, J., Du, J. (2020). Chromosome-level genome assembly of Cerasus humilis using PacBio and Hi-c technologies. Front. Genet. 11. doi: 10.3389/fgene.2020.00956
Wang, D., Zhang, Y., Zhang, Z., Zhu, J., Yu, J. (2010). KaKs_Calculator 2.0: A toolkit incorporating gamma-series methods and sliding window strategies. Genomics Proteomics Bioinf. 8, 77–80. doi: 10.1016/s1672-0229(10)60008-3
Webster, A. D., Looney, N. E. (1996). CHERRIES: Crop physiology, production and uses (Canbridge: University Press).
Wicke, S., Schneeweiss, G. M., Depamphilis, C. W., Müller, K. F., Quandt, D. (2011). The evolution of the plastid chromosome in land plants: gene content, gene order, gene function. Plant Mol. Biol. 76, 273–297. doi: 10.1007/s11103-011-9762-4
Xue, C., Geng, F. D., Li, J. J., Zhang, D. Q., Gao, F., Huang, L., et al. (2021). Divergence in the Aquilegia ecalcarata complex is correlated with geography and climate oscillations: Evidence from plastid genome data. Mol. Ecol. 30, 5796–5813. doi: 10.1111/mec.16151
Xue, S., Shi, T., Luo, W., Ni, X., Iqbal, S., Ni, Z., et al. (2019). Comparative analysis of the complete chloroplast genome among Prunus mume, P. armeniaca, and P. salicina. Hortic. Res. 6, 89. doi: 10.1038/s41438-019-0171-1
Yang, J., Di, X., Meng, X., Feng, L., Liu, Z., Zhao, G. (2016). Phylogeography and evolution of two closely related oak species (Quercus) from north and northeast China. Tree Genet. Genom. 12, 89. doi: 10.1007/s11295-016-1044-5
Yü, D. J., Lu, L. T., Ku, T. C., Li, C. L., Chen, S. X. (1986). Flora of China (Beijing: Science Press).
Zarei, A., Erfani-Moghadam, J., Mozaffari, M. (2017). Phylogenetic analysis among some pome fruit trees of rosaceae family using RAPD markers. Biotechnol. Biotec. Eq. 31, 289–298. doi: 10.1080/13102818.2016.1276414
Zhang, J., Wang, Y., Chen, T., Chen, Q., Wang, L., Liu, Z. S., et al. (2021). Evolution of rosaceae plastomes highlights unique Cerasus diversification and independent origins of fruiting cherry. Front. Plant Sci. 12. doi: 10.3389/fpls.2021.736053
Zhang, X., Zhou, T., Kanwal, N., Zhao, Y., Bai, G., Zhao, G. (2017). Completion of eight Gynostemma BL. (Cucurbitaceae) chloroplast genomes: Characterization, comparative analysis, and phylogenetic relationships. Front. Plant Sci. 8. doi: 10.3389/fpls.2017.01583
Keywords: Prunus, plastome, genomic variation, repeat sequence, protein-coding gene, phylogeny
Citation: Wan T, Qiao B-x, Zhou J, Shao K-s, Pan L-y, An F, He X-s, Liu T, Li P-k and Cai Y-l (2023) Evolutionary and phylogenetic analyses of 11 Cerasus species based on the complete chloroplast genome. Front. Plant Sci. 14:1070600. doi: 10.3389/fpls.2023.1070600
Received: 15 October 2022; Accepted: 21 February 2023;
Published: 03 March 2023.
Edited by:
Peter Poczai, University of Helsinki, FinlandReviewed by:
Emre Sevindik, Adnan Menderes University, TürkiyeCopyright © 2023 Wan, Qiao, Zhou, Shao, Pan, An, He, Liu, Li and Cai. This is an open-access article distributed under the terms of the Creative Commons Attribution License (CC BY). The use, distribution or reproduction in other forums is permitted, provided the original author(s) and the copyright owner(s) are credited and that the original publication in this journal is cited, in accordance with accepted academic practice. No use, distribution or reproduction is permitted which does not comply with these terms.
*Correspondence: Yu-liang Cai, eXVhbnlpY3lsQG53YWZ1LmVkdS5jbg==
Disclaimer: All claims expressed in this article are solely those of the authors and do not necessarily represent those of their affiliated organizations, or those of the publisher, the editors and the reviewers. Any product that may be evaluated in this article or claim that may be made by its manufacturer is not guaranteed or endorsed by the publisher.
Research integrity at Frontiers
Learn more about the work of our research integrity team to safeguard the quality of each article we publish.