
94% of researchers rate our articles as excellent or good
Learn more about the work of our research integrity team to safeguard the quality of each article we publish.
Find out more
ORIGINAL RESEARCH article
Front. Plant Sci., 21 August 2023
Sec. Plant Abiotic Stress
Volume 14 - 2023 | https://doi.org/10.3389/fpls.2023.1068191
The rise in global temperature is not only affecting plant functioning directly, but is also increasing air vapour pressure deficit (VPD). The yield of banana is heavily affected by water deficit but so far breeding programs have never addressed the issue of water deficit caused by high VPD. A reduction in transpiration at high VPD has been suggested as a key drought tolerance breeding trait to avoid excessive water loss, hydraulic failure and to increase water use efficiency. In this study, stomatal and transpiration responses under increasing VPD at the leaf and whole-plant level of 8 wild banana (sub)species were evaluated, displaying significant differences in stomatal reactivity. Three different phenotypic groups were identified under increasing VPD. While (sub)species of group III maintained high transpiration rates under increasing VPD, M. acuminata ssp. errans (group I), M. acuminata ssp. zebrina (group II) and M. balbisiana (group II) showed the highest transpiration rate limitations to increasing VPD. In contrast to group I, group II only showed strong reductions at high VPD levels, limiting the cost of reduced photosynthesis and strongly increasing their water use efficiency. M. acuminata ssp. zebrina and M. balbisiana thus show the most favourable responses. This study provides a basis for the identification of potential parent material in gene banks for breeding future-proof bananas that cope better with lack of water.
Climate change projections predict that global temperatures will continue to increase this century (IPCC et al., 2021). This temperature rise is not only affecting plant functioning directly, but is also increasing air vapour pressure deficit (VPD) (Hatfield and Prueger, 2015; Ficklin and Novick, 2017; Grossiord et al., 2020). VPD represents the atmospheric water vapour demand and is defined as the difference between the saturation and actual vapour pressure in the atmosphere (Monteith and Unsworth, 2013). The saturation vapour pressure, the water vapour that air can hold, increases exponentially with temperature and has been increasing as global temperatures rise (Lawrence, 2005). The actual vapour pressure (i.e. absolute humidity in the air) on the other hand has not been rising at the same rate as the saturation vapour pressure, therefore increasing the worldwide VPD (Ficklin and Novick, 2017; Grossiord et al., 2020). The impact of this rising VPD is often underestimated compared to other climate change consequences, but periods of high VPD have recently been linked with large-scale tree mortality (Breshears et al., 2013; Williams et al., 2013) and strong yield reductions (Challinor and Wheeler, 2008; Lobell et al., 2013).
Plants respond to the vapour pressure deficit encountered at the leaf level, the leaf-to-air vapour pressure deficit (VPDleaf). The leaf temperature can after all deviate from that of the ambient air by transpirational cooling or heating through radiant energy. For a given stomatal opening, transpiration would increase linearly with VPDleaf, without any gain in carbon uptake. Stomatal conductance (gs) however decreases with increasing VPDleaf, avoiding excessive water loss, but restricting carbon uptake (Dai et al., 1992; Monteith, 1995; Oren et al., 1999). In angiosperms the reduction of gs in response to an increase in VPDleaf is believed to be abscisic acid (ABA) mediated (Xie et al., 2006; Bauer et al., 2013; McAdam and Brodribb, 2015). Upon an increase in VPDleaf, gs is reduced by a rapid ABA biosynthesis (i.e. within 20 min) presumably located in the leaf phloem parenchyma cells and stomatal guard cells (Kuromori et al., 2014; McAdam et al., 2016). The trigger for ABA interference under high VPDleaf is believed to be a drop in water status (McAdam and Brodribb, 2016; Sack et al., 2018), which has been linked to a limited maximal hydraulic conductance at the leaf, stem and/or root level in comparison to the transpiration (Brodribb and Jordan, 2008; Zhang et al., 2013; Choudhary et al., 2014; Ocheltree et al., 2014; Schoppach et al., 2016). Essential gatekeepers for this hydraulic conductance are aquaporins. They are present all along the water transport pathway from root to stomata. Aquaporins were less abundant in soybean and pearl millet genotypes that showed a reduced transpiration rate at high VPDleaf (Sadok and Sinclair, 2010; Devi et al., 2015; Reddy et al., 2017).
Despite the reductions in gs, the transpiration rate usually increases with increasing VPDleaf. Only at high VPDleaf significant decreases in transpiration rates have been observed (Franks et al., 1997; Fletcher et al., 2007; Gholipoor et al., 2010; Ryan et al., 2016). These transpiration responses are commonly described by a segmented pattern where the slope of transpiration rate versus VPDleaf is significantly reduced after a specified breakpoint. Significant differences in segmented transpiration responses to VPDleaf have been observed across- and within-species (Fletcher et al., 2007; Gholipoor et al., 2010; Ryan et al., 2016). While some species or genotypes already reduce transpiration rate significantly at low VPDleaf, others show only a reduction at higher VPDleaf or even maintain the increasing transpiration rate. Restricting transpiration rate at high VPD has been suggested as a key drought tolerance breeding trait as excessive water loss is avoided and might be saved for later in the growing season (Vadez, 2014; Sinclair et al., 2017). Limiting transpiration above a VPD threshold can increase the daily transpiration efficiency but the reduced water use may compromise the yield potential. Reduced transpiration limits carbon uptake, thereby hampering photosynthesis and yield (Richards, 2000; Lee et al., 2020; Eyland et al., 2021). Moreover, care must be taken that the so-called saved water is not merely lost by evaporation or transpiration by neighbouring plants.
The transpiration rate response to VPD was shown to be highly heritable in wheat (Schoppach et al., 2016). Models predict that in drought-prone environments limiting transpiration at high VPD would improve maize and soybean yields by maintaining more soil water available later in the season during flowering or grain filling (Sinclair et al., 2010; Messina et al., 2015). In these drought-prone regions, the negative effect of gs reduction on A during vegetative growth could be compensated later in the growing season (Sinclair et al., 2010; Messina et al., 2015). Improved maize hybrids which, amongst other traits, showed reduced transpiration at high VPDleaf indeed increased yields under water-limited conditions (Gaffney et al., 2015), while for durum wheat cultivars this was only the case under severe drought conditions (Medina et al., 2019).
The current set of edible bananas is complex and has resulted from different parental routes and several back crosses (De Langhe et al., 2010; Perrier et al., 2011; Martin et al., 2020a; Cenci et al., 2021). The hybrid banana genomes are unbalanced with respect to the parental ones, and inter- and intra-genome translocation chromosomes are relatively common (Christelová et al., 2017; Němečková et al., 2018). Most, if not all, cultivars have genomes consisting of different proportions of A- and B-genome chromosomes and/or recombinant chromosomes originating from different parents. Similar to other tropical species, bananas are very sensitive to VPD, with reductions in transpiration when VPD exceeds 2 – 2.3 kPa (Aubert and Catsky, 1970; Carr, 2009; Eyland et al., 2022). Thomas et al. (1998) observed a diverse response in three banana cultivars with different genomic constitutions. Despite these efforts, the transpiration responses to VPD remain largely uncharacterized across diverse banana species.
Evaluation of crop wild relatives for inclusion in breeding schemes is receiving increasing attention nowadays, given their naturally acquired tolerances and resistances to biotic and abiotic stresses (Hajjar and Hodgkin, 2007; Dempewolf et al., 2017). Hence, the main objective of this work was to evaluate gene bank accessions belonging to wild banana (sub)species that can be crossed to elite edible parents. Apart from 3 unknown ancestors of the edible bananas, the M. acuminata (A genome) subspecies banksii, zebrina, malaccensis and burmannica form together with M. balbisiana (B genome) the most important parental donors of the current edible (AAA, AAB and ABB) varieties (Perrier et al., 2011; Christelová et al., 2017; Sardos et al., 2022; Martin et al., 2023). Hence, evaluating their stomatal and transpiration responses under increasing VPD at leaf and whole-plant level is of major interest to breeders. Transpiration rate limitations at high VPD have been indicated as a key breeding trait for high water use efficiency (Sinclair et al., 2010; Vadez, 2014; Messina et al., 2015; Ryan et al., 2016). Given these indications, we hypothesize that adequate stomatal reactions towards VPD is an important sub-trait to breed for drought resilient varieties and that there is intra- and interspecies variability among the banana crop wild relatives. This work could therefore provide the basis for systematically screening gene banks containing crop wild relatives of banana for their transpiration at high VPD, with the aim to identify potential parent material for drought tolerance breeding.
A diversity panel of 9 wild banana gene bank accessions belonging to 8 (sub)species (Table 1) were phenotyped for their transpiration response to VPD. Plants were grown in 2.5 L pots filled with peat-based compost and maintained under well-watered conditions. Plants were grown in the greenhouse for 6 - 8 weeks before moving to the growth chamber (Bronson PGC-1400, the Netherlands). The growth chamber contained an air mixing fan and LED panels providing a light intensity of 250 µmol m-2 s-1 for a 12 h photoperiod and a light spectrum with blue:red:far-red ratio of 1: 1.5: 0.15. Plants were acclimated to the growth chamber for one day under a day/night temperature and relative humidity of 27/24.5°C and 78%, respectively. The next day the VPD step-changes were initiated by altering relative humidity, while temperature was maintained at 36°C during this day. VPD was increased by decreasing relative humidity as temperature fluctuations would not only affect VPD but also aquaporin conductance and water viscosity in xylem and mesophyll cells (Matzner and Comstock, 2001; Yang et al., 2012). At light onset relative humidity was maintained for 90 min at 87%, after which it was subsequently decreased to 78, 68, 62 and 56%, each for 60 min. Average VPDs at each step were 0.77, 1.36, 1.93, 2.34 and 2.64 kPa. Plants were maintained under well-watered conditions by daily watering before light onset. Measurements were taken before 14:00 to avoid afternoon stomatal closure (van Wesemael et al., 2019; Eyland et al., 2021).
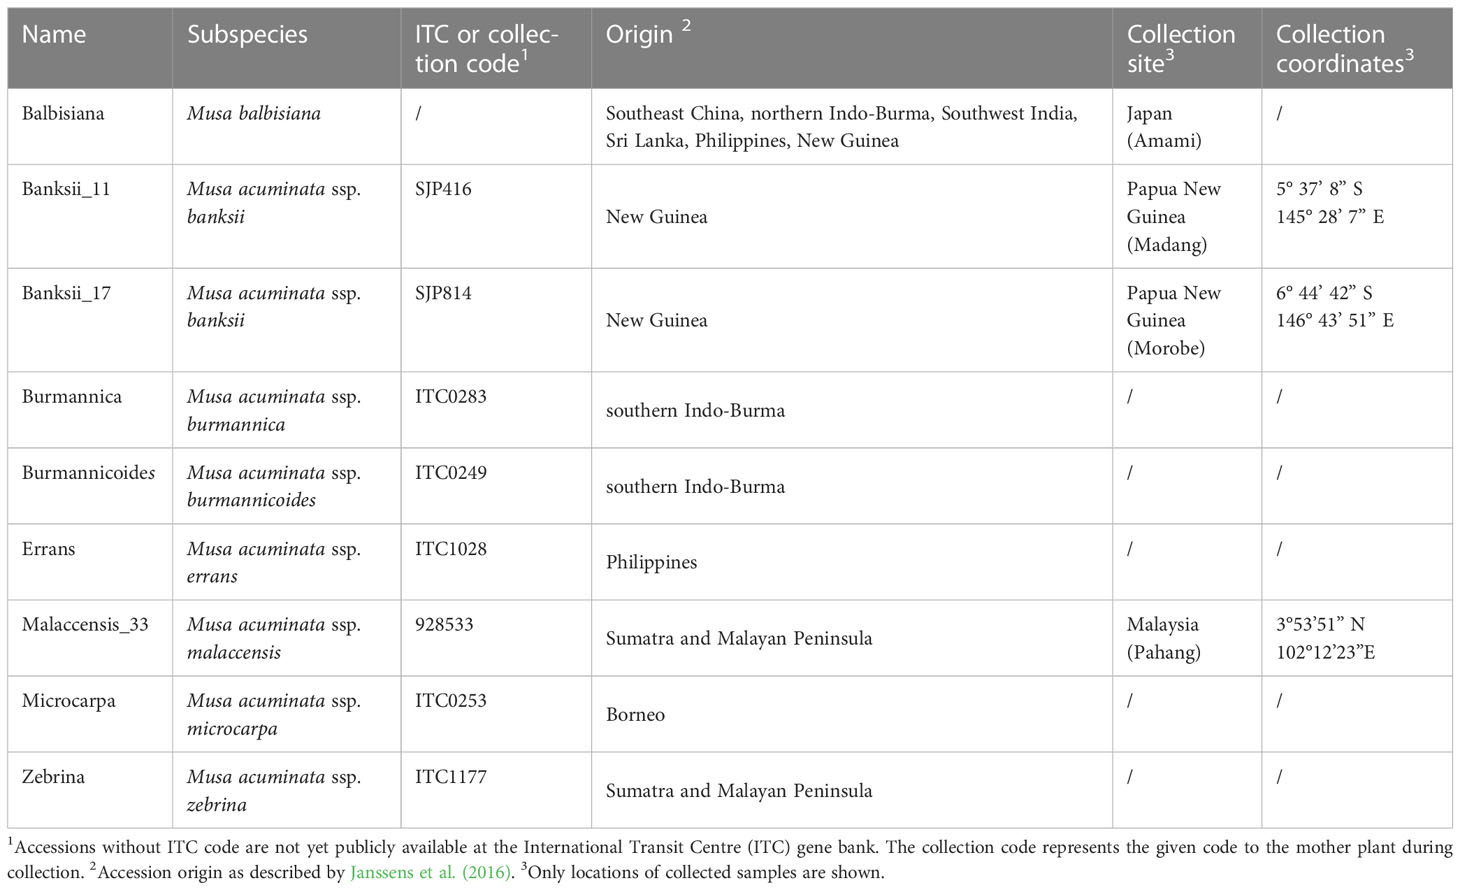
Table 1 Wild banana gene bank accessions screened for their transpiration response to increasing vapour pressure deficit (VPD) at both leaf and whole-plant level.
Gas exchange responses to step increases in VPDleaf were measured every 60 s on the middle of the second youngest fully developed leaf using a LI-6800 infrared gas analyser (LI-COR, USA). Light intensity and CO2 concentration were maintained at 250 µmol m-2 s-1 and 400 µmol mol-1, respectively. Leaf temperature was maintained at 36°C. Relative humidity went from 85 to 75, 65, 55, 45 and 35%, reaching VPDleaf of 0.91, 1.50, 2.09, 2.69, 3.28 and 3.87 kPa. Note that measurements were stopped early if the drying capacity of the infra-red gas exchange system was saturated and unable to maintain reduced relative humidity. The intrinsic water use efficiency (iWUE) was calculated as iWUE = A/gs with A being the photosynthetic rate. At every VPDleaf level the steady-state gs, A, Erate (transpiration rate) and iWUE after 60 min was calculated. The maximum gs was calculated as the highest gs observed across all VPDleaf levels. Segmented regression was performed on the transpiration rate response to increasing VPDleaf for each accession by using a nonlinear mixed effect model in which the intercept was assumed to vary at individual plant level (segmented R package, Muggeo, 2008). This analysis calculates the optimal breakpoint in the transpiration response with a different linear response before and after the breakpoint. To determine the effect of the reduction in stomatal opening on the transpiration, the transpiration reduction (ϕE) was determined according to Franks et al. (1999) and Ryan et al. (2016) (Figure 1). For each individual, a linear regression was fitted through the transpiration rate at the first two VPDleaf levels (0.90 and 1.50 kPa). This linear regression was then extrapolated to predict the transpiration rate (Epred) at higher VPDleaf levels (2.69, 3.28 and 3.87 kPa) (Figure 1). The percentage decrease of the actual measured transpiration rate (Emeas) compared to Epred (Figure 1) was then quantified at each VPDleaf level:
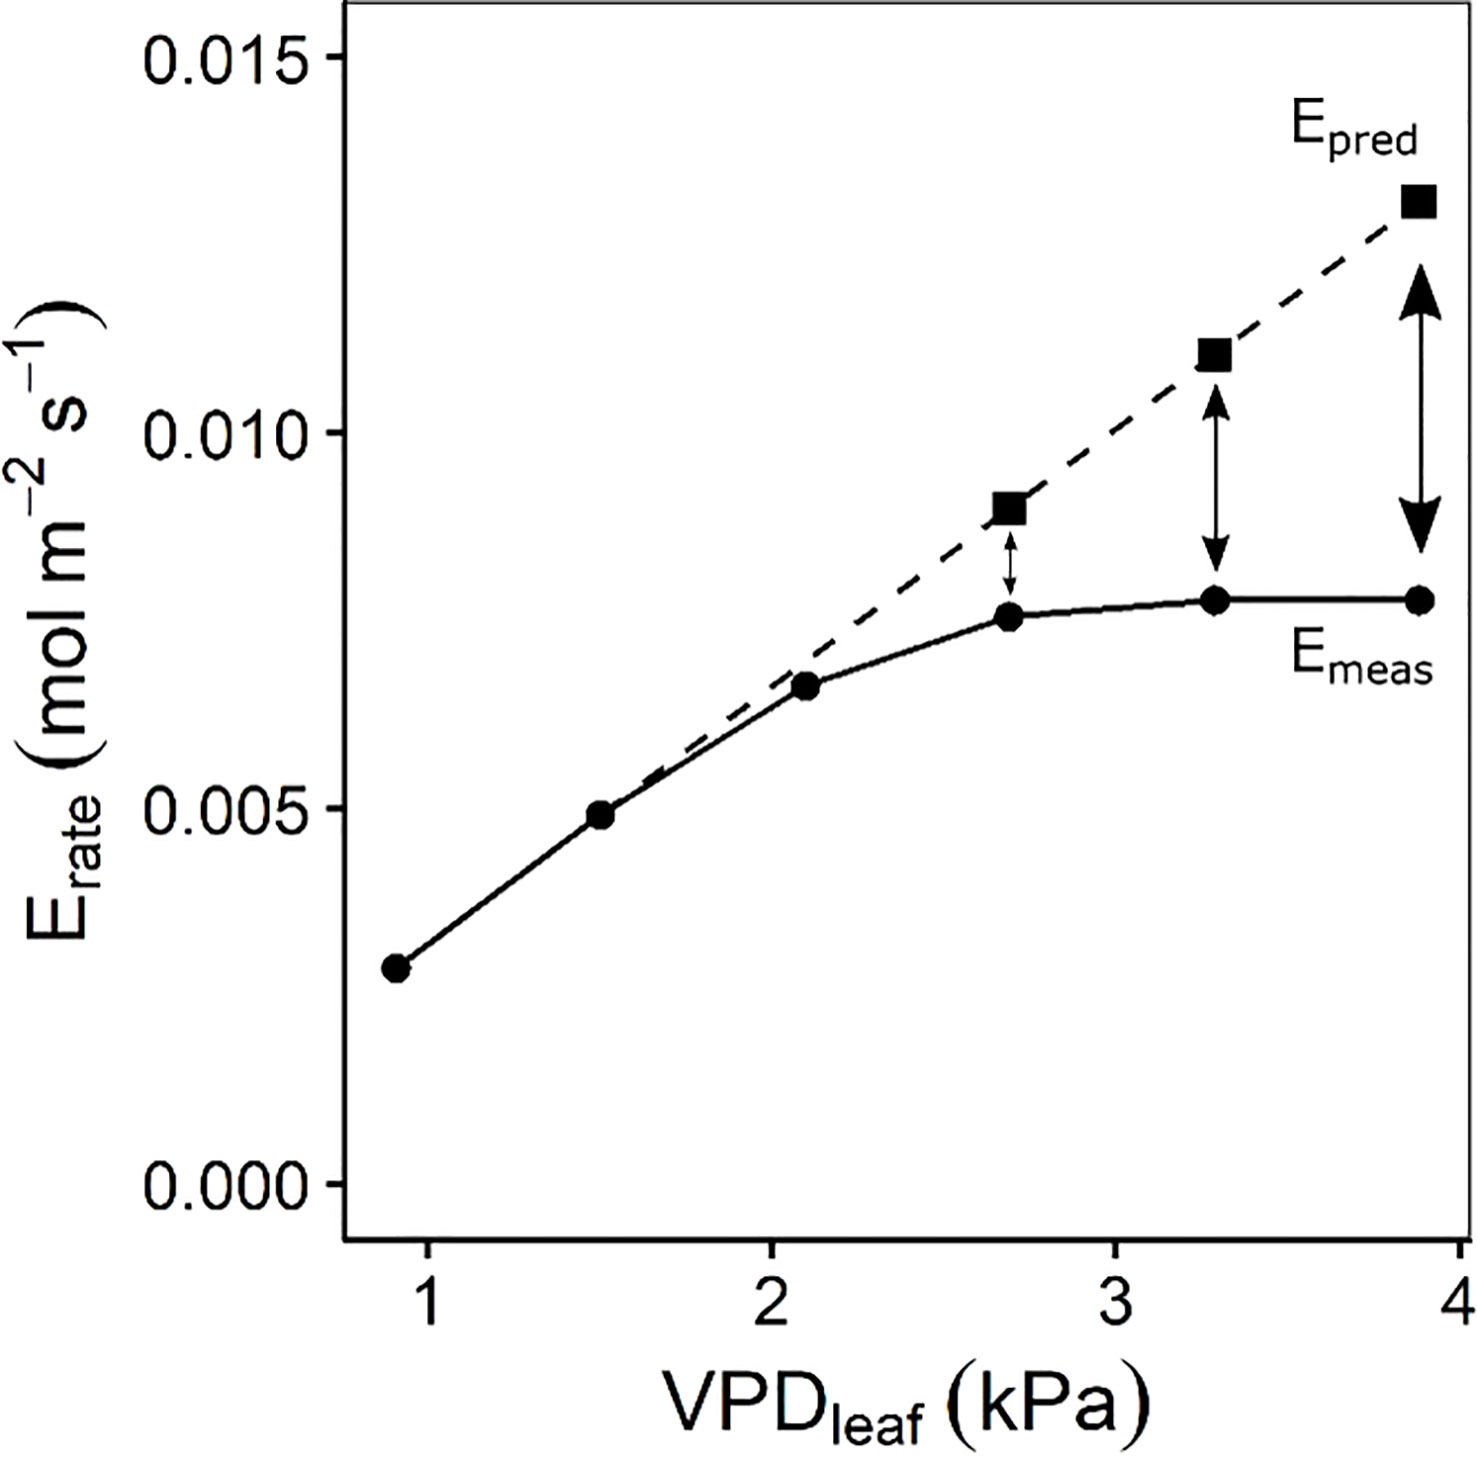
Figure 1 Quantification of the transpiration reduction (ϕE) according to Franks et al (1999). and Ryan et al. (2016). A linear regression was fitted through the transpiration rate at the first two air-to-leaf vapour pressure deficit (VPDleaf) levels. This linear regression was extrapolated (dashed line) to estimate the transpiration rate (Epred) at VPDleaf of 2.69, 3.28 and 3.87 kPa. Epred was then compared to the measured transpiration rate (Emeas) to calculate ϕE (Eq. 1).
The percentage of limitation of the photosynthetic rate (A) by gs reduction was calculated at every VPDleaf level by comparing the measured A (Ameas) with the overall maximally measured A (Amax) (McAusland et al., 2016):
Stomatal reduction (ϕstom) with increasing VPD was defined as the absolute slope between stomatal conductance (gs) and loge(VPDleaf) as described by Oren et al. (1999):
where a is the estimated gs at VPDleaf 1 kPa.
Plants were placed on balances (0.01 g accuracy, Kern, Germany) to register their weight every 10 s. The soil was covered by plastic to avoid evaporation and ensure only water loss through transpiration. Transpiration during each VPD step was calculated by differentiating 5 min average total weight (mtot) at the start of the VPD level with the 5 min average total weight at the end of the VPD level:
Transpiration was normalized by leaf area (LA) and the time (t) passed. LA was quantified by destructive leaf area imaging at the end of the experiment.
Segmented regression was performed on the transpiration rate response to increasing VPD for each accession by using a nonlinear mixed effect model in which the intercept was assumed to vary at plant level. Transpiration reduction (ϕE) was determined according to Eq. 1 with linear regression between the two first VPD levels (0.77 and 1.36 kPa) and comparison between Epred and Emeas at the highest level (2.64 kPa).
All data processing and statistical analysis were carried out in R (V3.6.2). Genotypic differences were tested by applying analysis of variance (ANOVA) with a post hoc Benjamini & Hochberg correction. Significance of the segmented response of transpiration rate to VPD compared to a linear response was determined by the Davies Test (segmented R package, Muggeo, 2008). K-means clustering of accessions was performed on the average scaled output of the segmented regression, the transpiration reduction, the stomatal reduction and photosynthesis limitation, including measurements by leaf gas exchange and by whole-plant transpiration were included (Hartigan and Wong, 1979). Clusters were optimized across 10,000 random sets of cluster centres and plotted on the first two principal components.
The transpiration response was measured at leaf and whole-plant level while relative humidity was stepwise decreased and VPDs consequently increased. The response to increasing VPD at leaf and whole-plant level was described by the segmented regression of transpiration rate versus VPD, the transpiration reduction (Eq. 1), the photosynthetic limitation under increasing VPD (Eq. 2) and the stomatal reduction (Eq. 3). K-means clustering was performed on the output variables measured by both leaf gas exchange and whole-plant transpiration (Table 2). Three clusters were identified and plotted along the first two principal components (Figure 2). The first principal component was mainly determined by the limitation of photosynthetic rate (A) at high VPDs and the transpiration reduction at leaf and whole-plant level (Table 2). Important variables in the second principal component were the slope before the breakpoint in transpiration rate with increasing VPD and the stomatal reduction (Table 2). Cluster I consisted of only one species: M. acuminata ssp. errans (Figure 2). In group II M. acuminata ssp. zebrina and M. balbisiana clustered together (Figure 2). Group III contained 6 accessions: M. acuminata ssp. banksii (2), ssp. burmannica (1), ssp. burmannicoides (1), ssp. malaccensis (1) and ssp. microcrocarpa (1) (Figure 2).
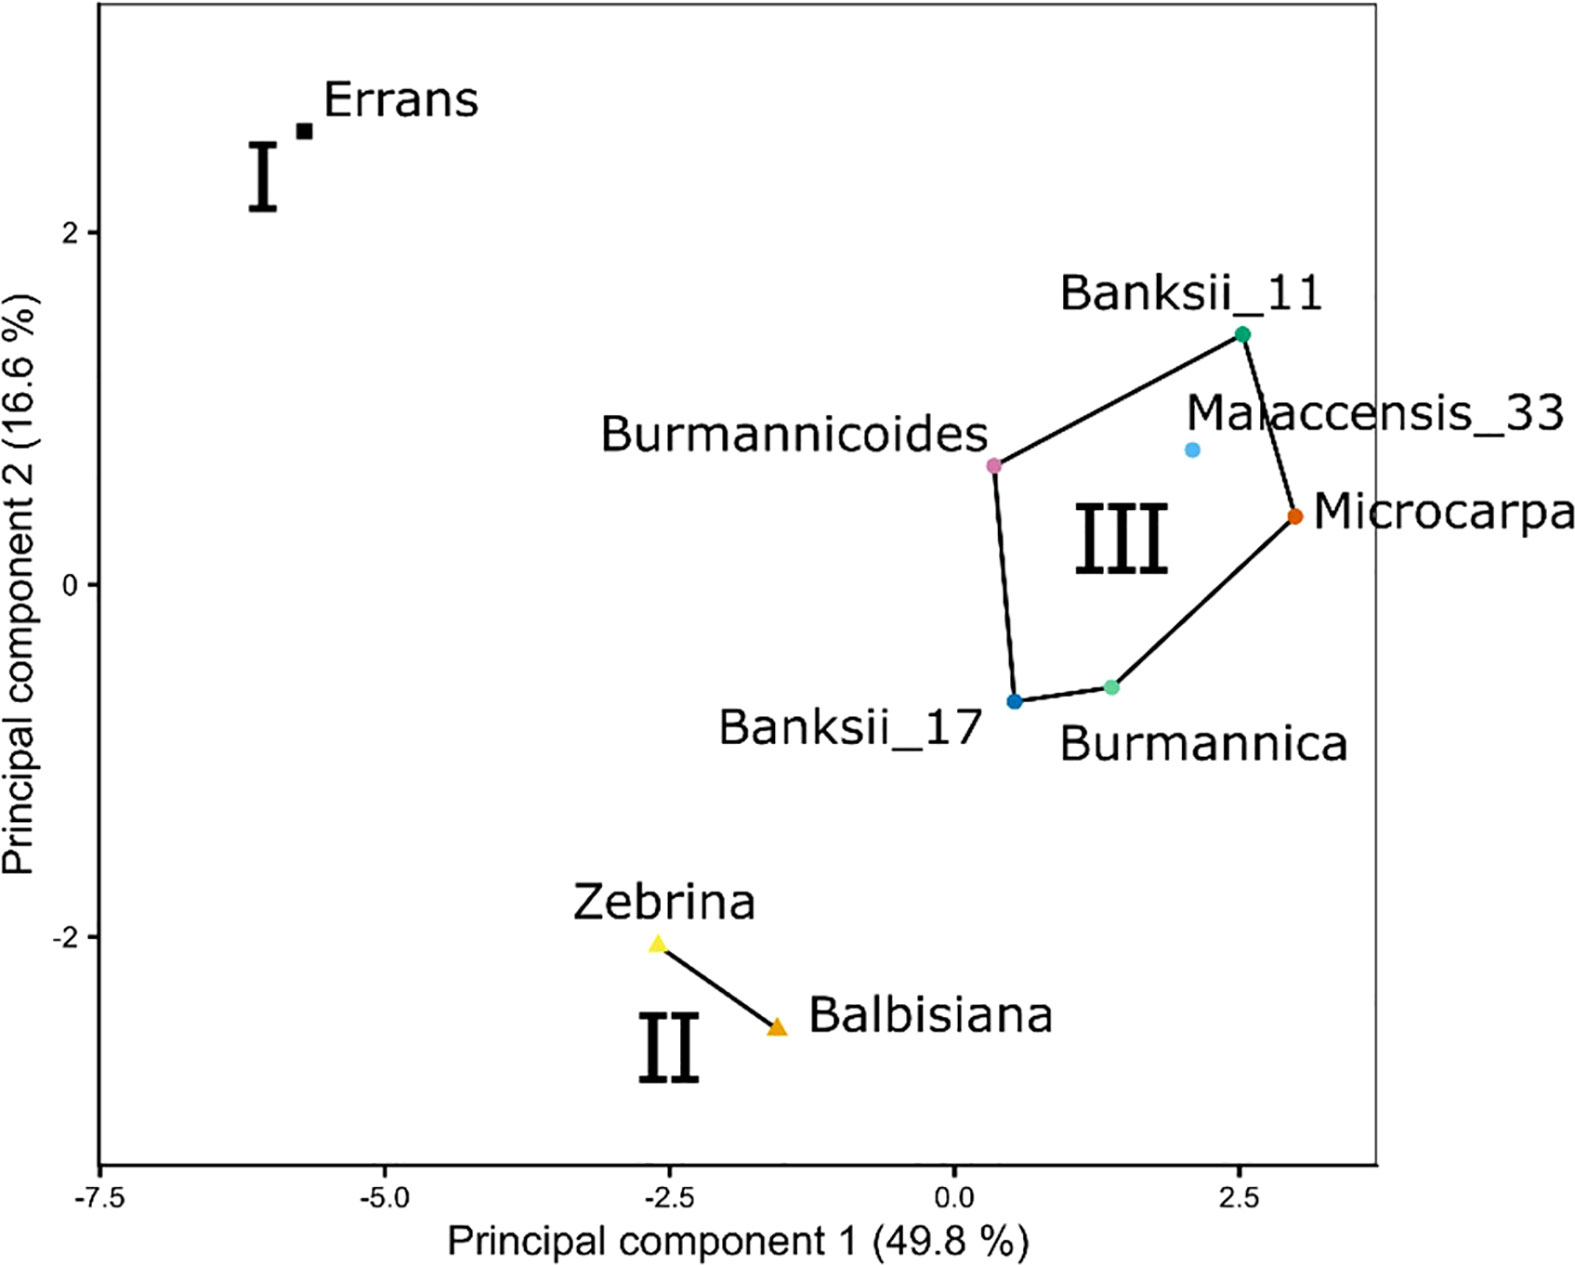
Figure 2 Three phenotypic groups (I, II, III) were defined by k-means clustering based on the stomatal reduction, transpiration reduction and photosynthetic limitation under increasing VPD (see variables in Table 2). Both variables measured by leaf gas exchange and whole-plant transpiration were included. Lines and regions represent the three phenotypic groups from k-means clustering plotted along the first two principal components (Table 2). The first principal component was mainly determined by the limitation of photosynthetic rate at high VPDs and the transpiration reduction at leaf and whole-plant level. Important variables in the second principal component were the slope before the breakpoint in transpiration rate with increasing VPD and the stomatal reduction.
With increasing VPDleaf, gs decreased in all accessions (Figure 3A, Table A.1). The transpiration rate initially increased, but eventually reached steady-state or even declined (Figure 3B). The transpiration rate and gs of M. acuminata ssp. errans were lowest and differed significantly from all other accessions at VPDleaf exceeding 1.50 and 2.09 kPa, respectively (Figures 3A, B, Table A.1). Under a VPDleaf ≤ 2.9 kPa, the highest transpiration rates and gs were observed for M. balbisiana and M. acuminata ssp. burmannica. However, when VPDleaf increased further, the gs of M. balbisiana decreased stronger than M. acuminata ssp. burmannica, translating only in M. balbisiana in a lower transpiration rate (Figures 3A, B, Table A.1). As gs decreased with increasing VPDleaf, the CO2 uptake was limited and A decreased (Figure 3C). The lowest A was observed for M. acuminata ssp. errans and ssp. burmannicoides, with significantly lower A compared to all other accessions except M. acuminata ssp. zebrina (Figure 3C, Table A.1). The intrinsic water use efficiency (iWUE) increased with increasing VPDleaf (Figure 3D). iWUE was highest in M. acuminata ssp. errans and differed significantly from all other accessions as VPDleaf exceeded 1.5 kPa (Figure 3D, Table A.1). The lowest iWUE were observed for M. acuminata ssp. burmannica and ssp. burmannicoides (Figure 3D).

Figure 3 Gas exchange response to step-increases in leaf-to-air vapour pressure deficit (VPDleaf) for 9 wild banana accessions. Steady-state response of (A) stomatal conductance (gs), (B) transpiration rate (Erate), (C) photosynthetic rate (A), (D) intrinsic water use efficiency (iWUE) to increasing VPDleaf. Data represent mean ± se values after 60 min at a specific VPDleaf level (n=3-7). Significance is shown in Table A.1.
In all accessions there was a decrease in the slope of transpiration rate versus VPDleaf (Figure 3B). This response was described by a segmented regression with a specified breakpoint after which the slope of the transpiration rate decreases. A significant breakpoint in transpiration rate in response to VPDleaf was identified in all accessions (Figure 4). Across accessions the breakpoints ranged between 1.75 and 2.5 kPa with M. acuminata ssp. errans having a significant breakpoint at the lowest VPDleaf (Figures 4, 5). Two M. acuminata ssp. banksii accessions and ssp. microcarpa showed the highest breakpoint in transpiration rate (Figures 4, 5). The groups defined by k-means clustering differed in their segmented transpiration response (Figure 5). Group I consisted only of M. acuminata ssp. errans, the subspecies with a breakpoint (a reduction in transpiration rate) at the lowest VPDleaf, as well as the lowest slope (the lowest Erate) before the breakpoint (Figure 5). Group II, consisting of M. acuminata ssp. zebrina and M. balbisiana, had a breakpoint at a relatively low VPDleaf around 2 kPa and a negative slope after the breakpoint (Figure 5). This negative slope indicates a net decrease in transpiration rate, which was not observed in the other accessions. In group III all accessions kept relatively high transpiration rates at relatively high VPDleaf. Musa acuminata ssp. burmannica, ssp. burmannicoides and ssp. malaccensis had a breakpoint at relatively low VPDleaf, but maintained a high slope of transpiration rate afterwards while the M. acuminata ssp. banksii accessions and ssp. microcarpa showed only a significant breakpoint in transpiration rate at higher VPDleaf, (Figure 5).
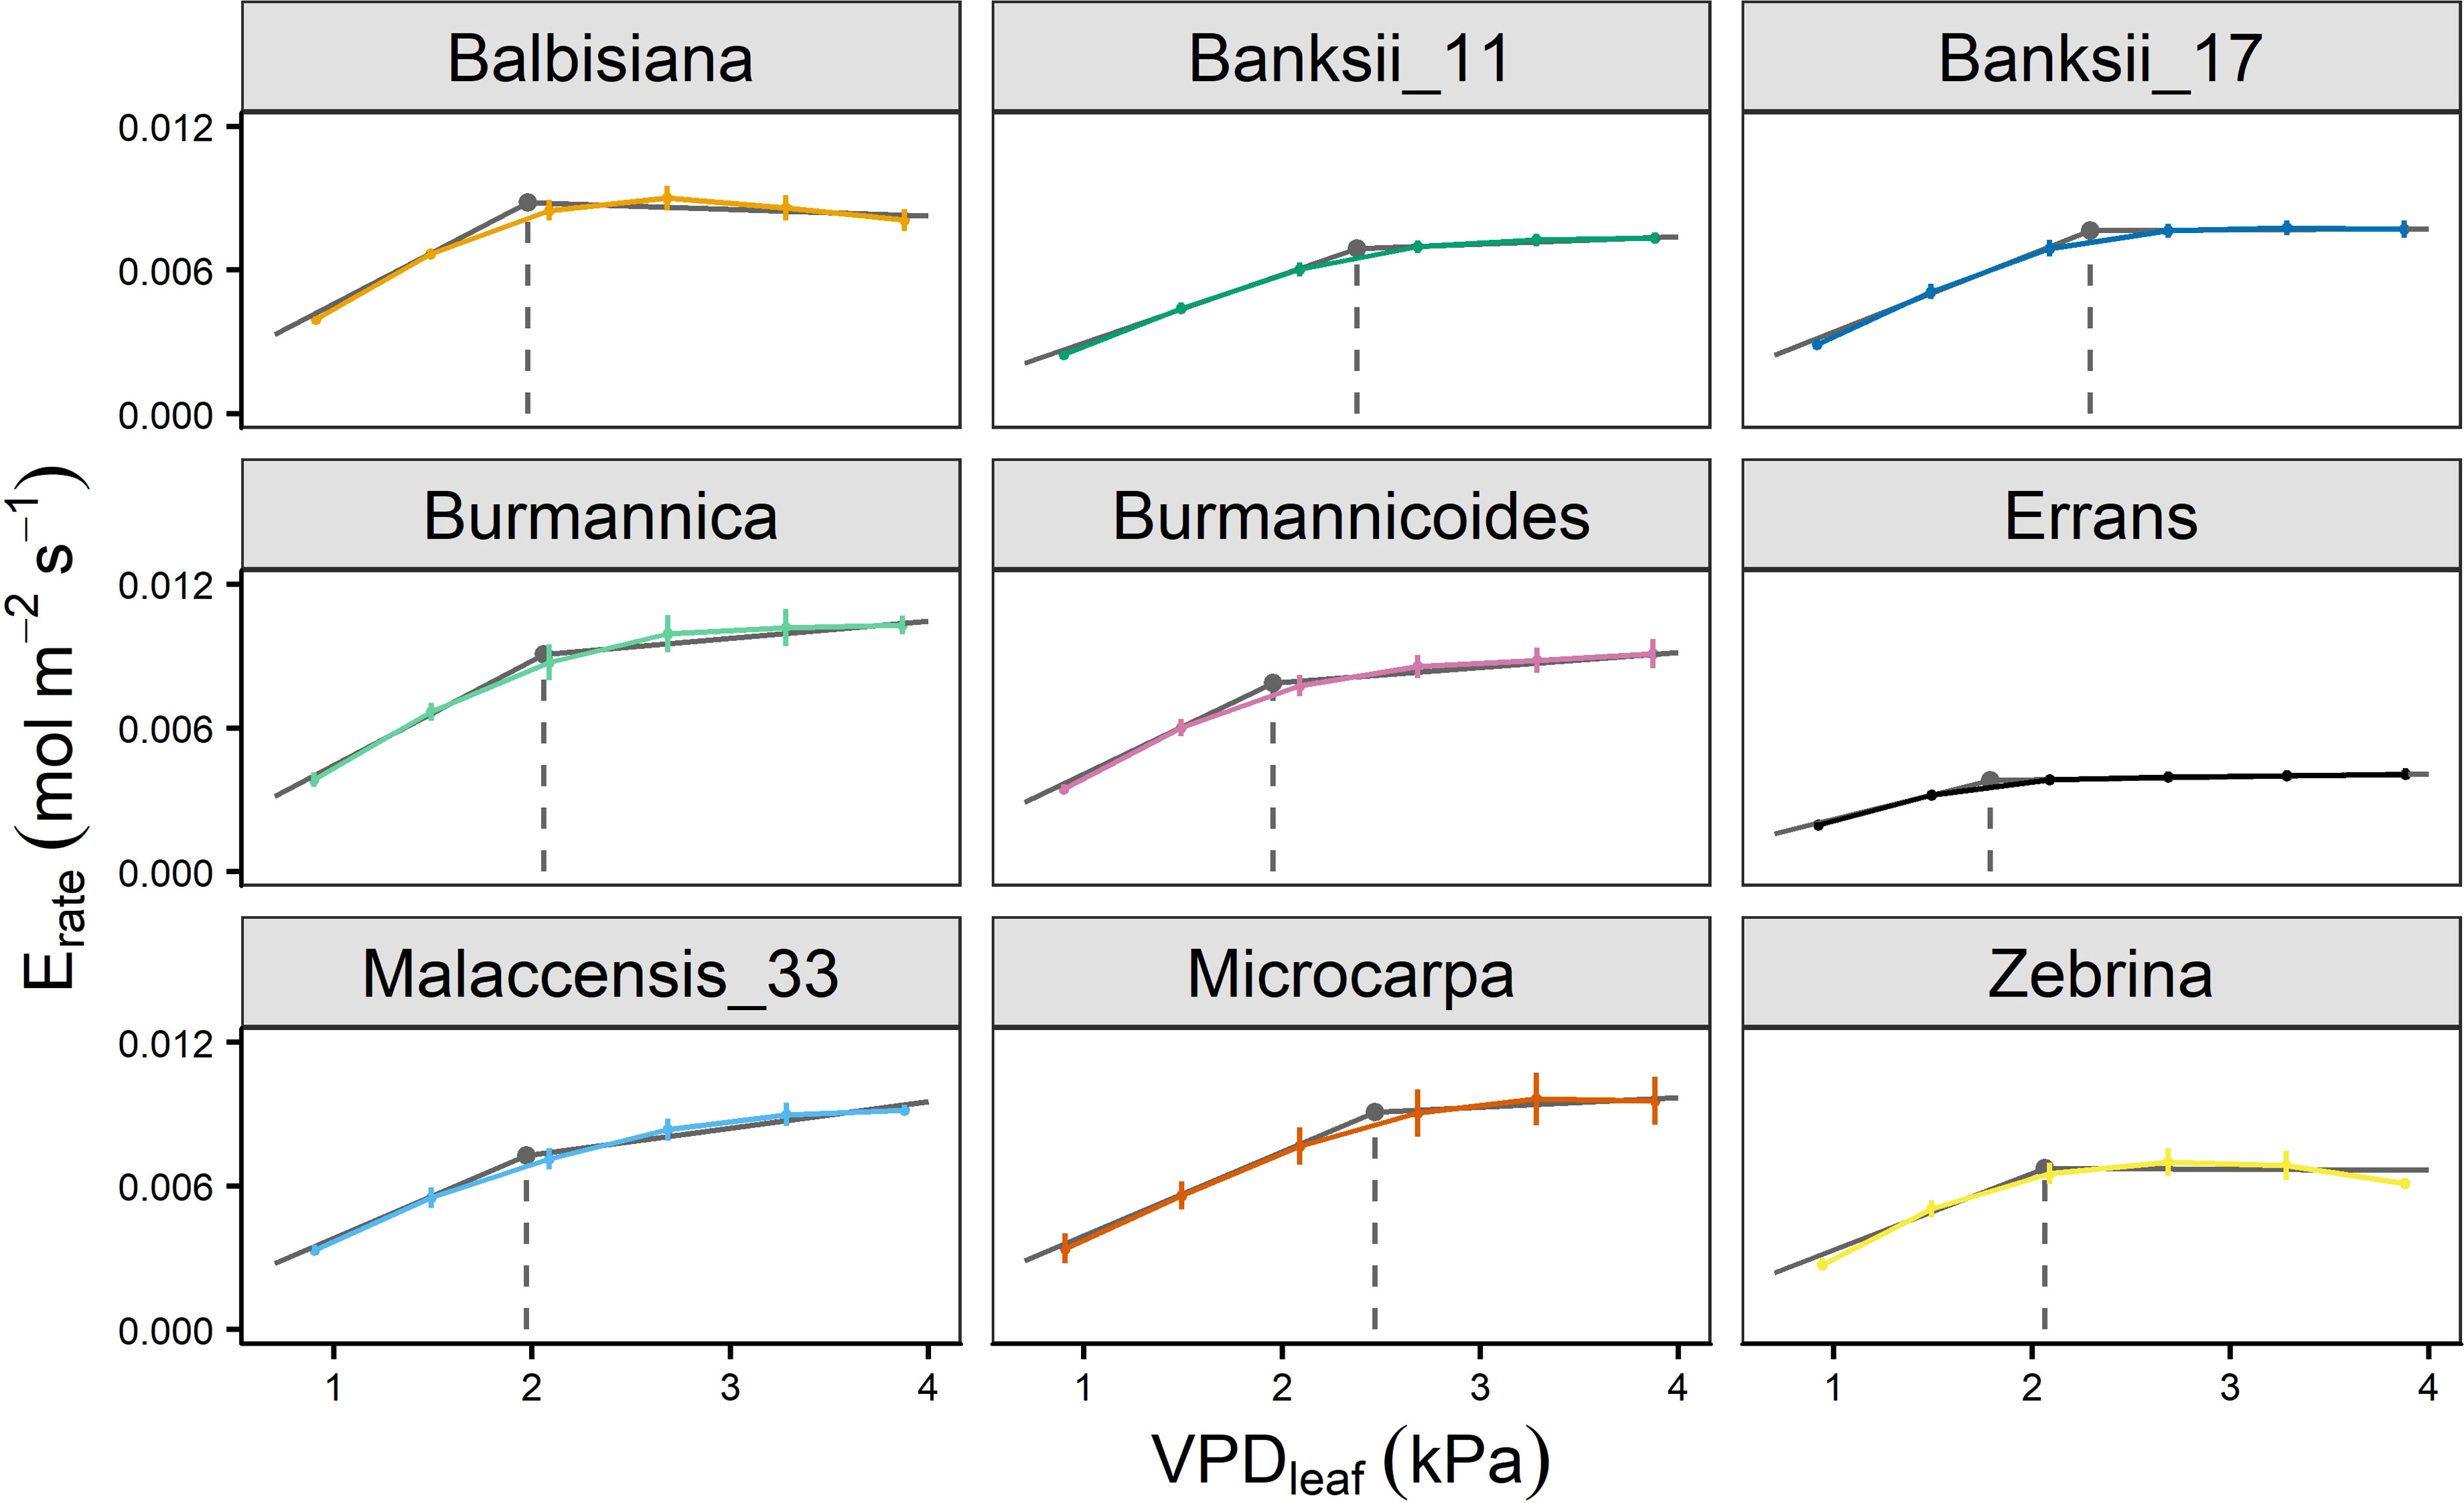
Figure 4 Transpiration rate response of 9 wild banana accessions to step-increases in leaf-to-air vapour pressure deficit (VPDleaf). A significant breakpoint in transpiration rate was identified for all accessions (P-value Davies Test < 0.05). Solid grey lines represent slopes of the modelled segmented response. Grey point and dashed grey line represent the breakpoint in transpiration rate and the VPDleaf of the breakpoint. Data represent mean ± se values after 60 min at a specific VPDleaf level (n=3-7).
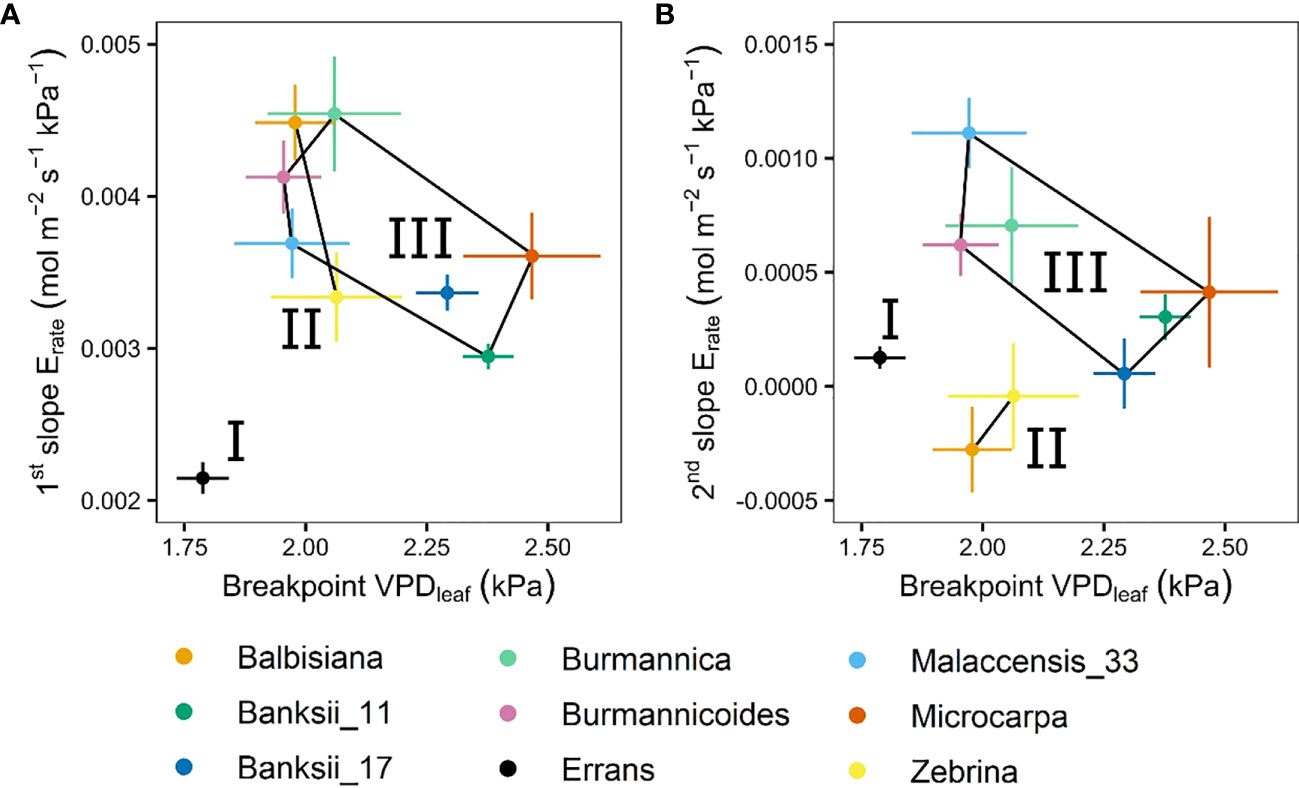
Figure 5 Slopes and breakpoints of the segmented transpiration rate response to step-increases in leaf-to-air vapour pressure deficit (VPDleaf). (A) Relation between the breakpoint in transpiration rate and the slope before the breakpoint. (B) Relation between the breakpoint in transpiration rate and the slope after the breakpoint. Three groups (I, II, III) were defined by k-means clustering and are represented by black lines connecting the included accessions. All segmented responses were significant (P < 0.05). Data represent the optimal estimated value ± se. (n=3-7).
The transpiration reduction (ϕE) (Eq. 1, Figure 1) representing the increase in stomatal resistance with increasing VPDleaf also differed significantly across accessions (Figure 6A, Table A.2). Reductions in transpiration ranged between 37 and 59% at the highest VPDleaf of 3.87 kPa (Figure 6A, Table A.2). The highest reductions in transpiration were observed for M. acuminata ssp. errans, ssp. zebrina and M. balbisiana (Figure 6A). The transpiration reduction of group I and II was significantly higher compared to group III at all VPDleaf levels (Figure 6A, Table A.2).
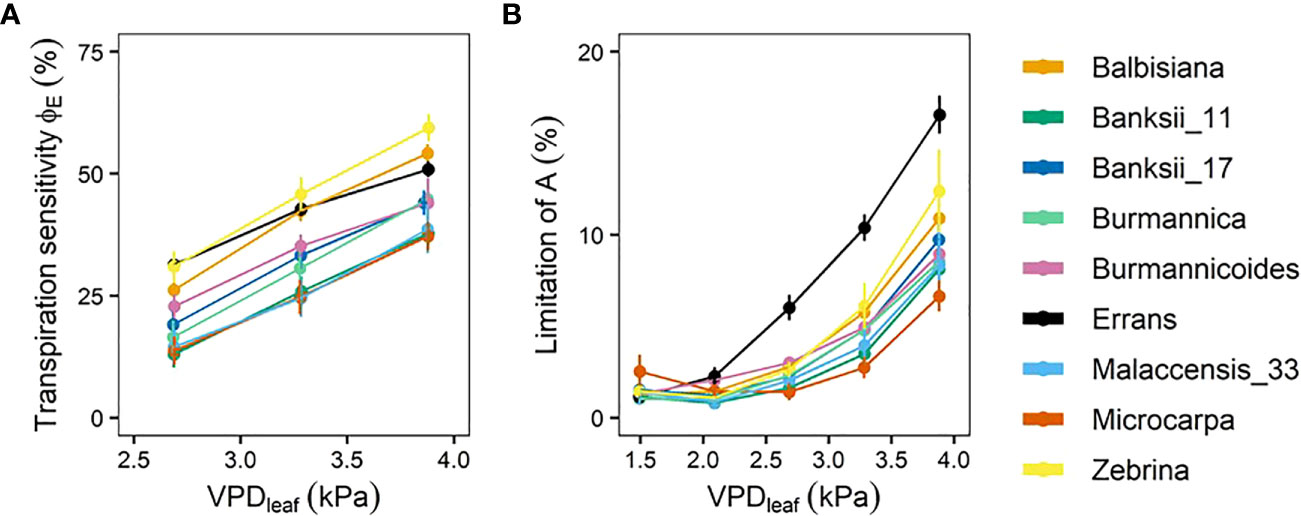
Figure 6 Transpiration reduction (ϕE) and limitation of photosynthetic rate (A) with increasing leaf-to-air vapour pressure deficit (VPDleaf). (A) ϕE in response to increasing VPDleaf. ϕE was determined as shown in Eq. 1. (B) Limitation of A in response to increasing VPDleaf. The limitation of A was determined as shown in Eq. 2. Data represent mean ± se. (n=3-7). Significance is shown in Tables A.2, A.3.
The decrease in stomatal opening with increasing VPDleaf limited the photosynthetic rate (A). In all accessions there was a significant increase in the limitation of A with increasing VPDleaf (P < 0.01) and the limitation ranged from 7 to 17% at the highest VPDleaf level (Figure 6B, Table A.3). The limitation of A was highest in M. acuminata ssp. errans from VPDleaf 2.69 kPa onwards, followed by M. acuminata ssp. zebrina and M. balbisiana (Figure 6B, Table A.3). The limitation of A was significantly higher in group I compared to group II and III from VPDleaf 2.69 kPa onwards (Table A.3). At VPDleaf of 3.28 and 3.87 kPa group II had a significantly higher A limitation compared to group III (Table A.3). Across accessions the limitation of A at higher VPDleaf (≥ 2.69 kPa) was significantly correlated to the breakpoint in transpiration rate (R² = 0.47-0.57; Figure A.1). Similarly, the limitation of A and the transpiration reduction at higher VPDleaf (≥ 2.69 kPa) were significantly correlated (R² = 0.53-0.58; Figure A.1). These correlations indicate that strong reductions in transpiration at high VPDleaf result in higher A limitations.
The stomatal reduction (ϕstom), defined as the slope of gs versus loge(VPDleaf) (Eq. 3) differed significantly across accessions (Table A.4). Highest stomatal reduction was observed in M. balbisiana, while M. acuminata ssp. errans showed lowest reduction (Figure 7, Table A.4). The stomatal reduction was strongly correlated to the maximum observed gs (R² = 0.88, Figures 7, A.1). No significant differences across previously described groups was observed (Table A.4).
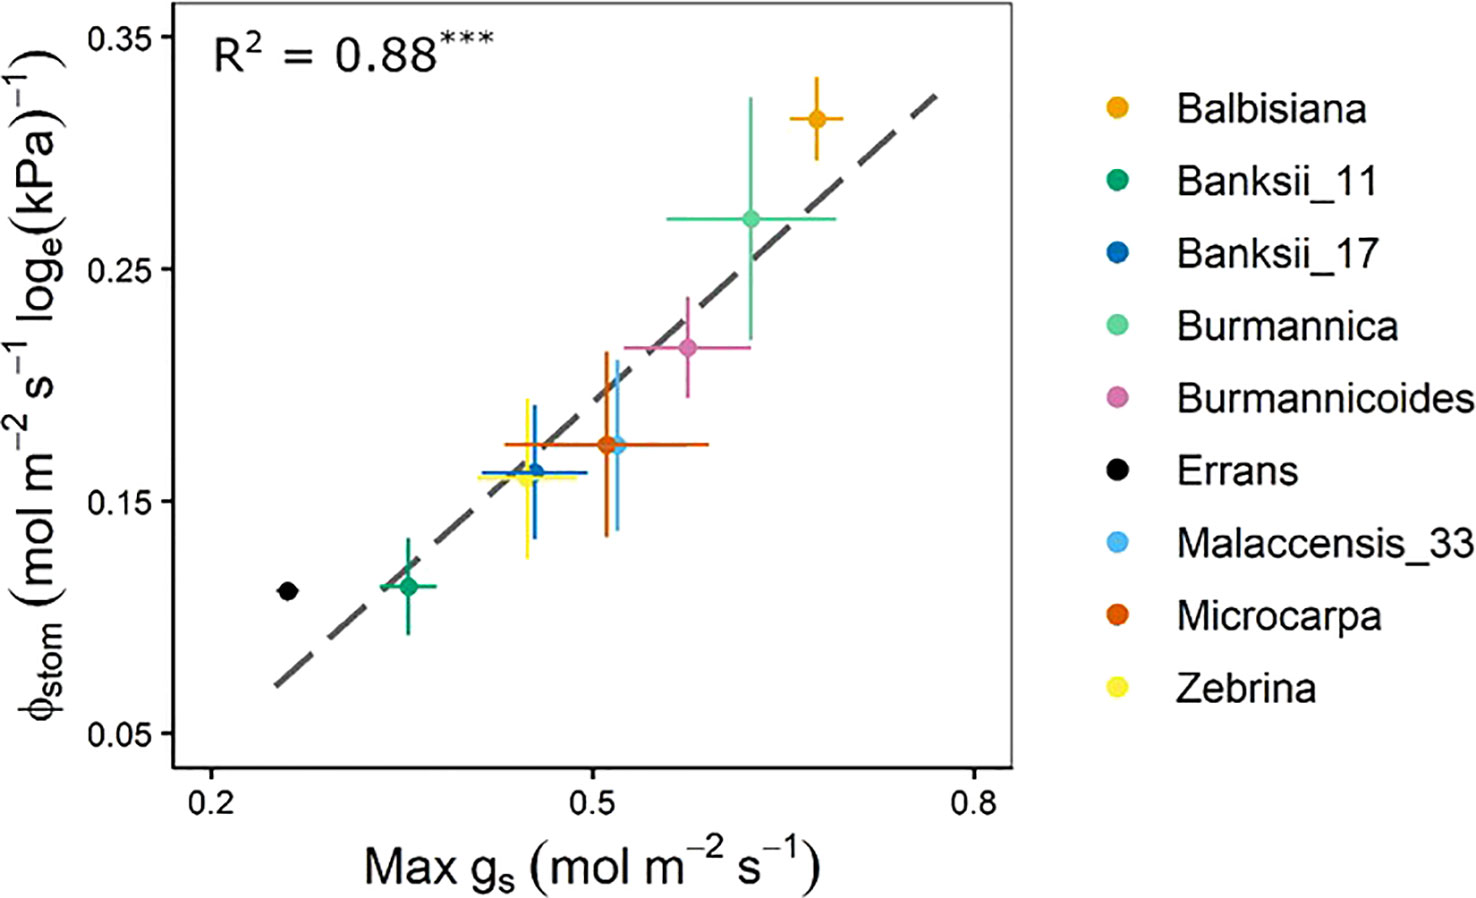
Figure 7 Stomatal reduction (ϕstom) in relation to the maximum observed stomatal conductance (max gs). The ϕstom and max gs were significantly correlated (R² = 0.88, P < 0.001). Data represent mean ± se (n=3-7). Significance is shown in Table A.4.
The whole-plant transpiration rate increased between 98 and 197% with increasing VPD (Figure 8). The lowest transpiration rates were observed for M. acuminata ssp. errans with significant differences compared to all other accessions from VPD 1.93 kPa and beyond (Figure 8, Table A.5). Transpiration rates of all other accessions were double compared to M. acuminata ssp. errans at the highest VPD level (Figure 8, Table A.5).
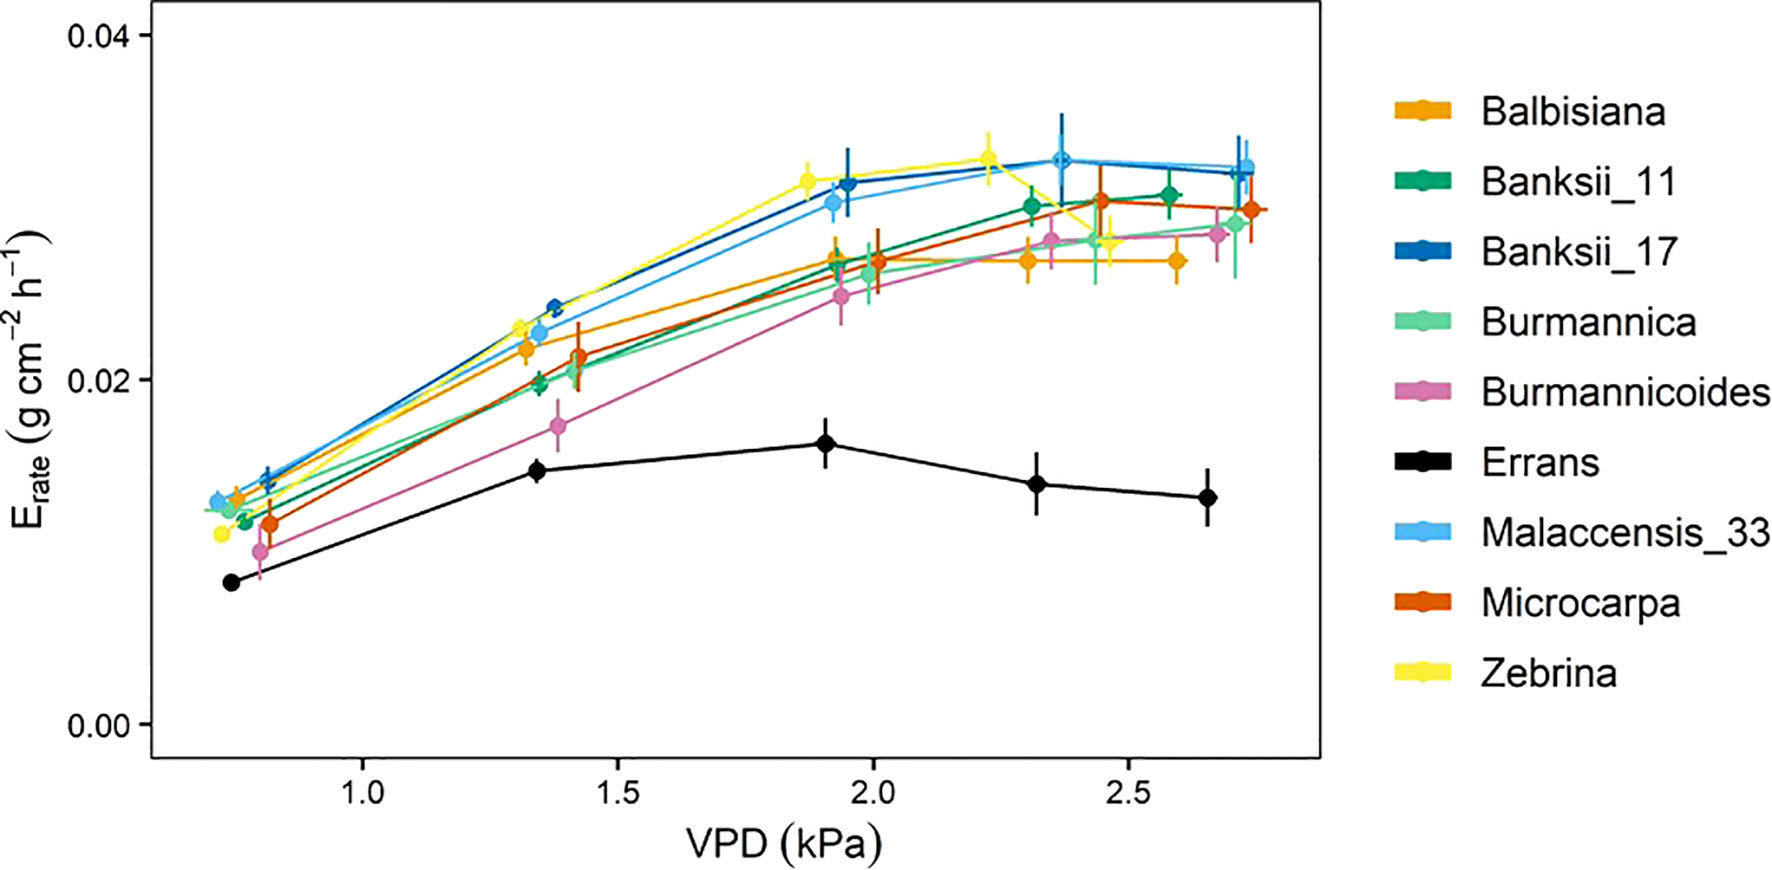
Figure 8 Whole-plant transpiration rate (Erate) response to step-increases in air vapour pressure deficit (VPD) for 9 wild banana accessions. Note that VPD values slightly differed between accessions depending on the maximal drying capacity of the growth chamber. Data represent mean ± se values after 60 min at a specific VPD level (n=4-8). Significance is shown in Table A.5.
A significant breakpoint in whole-plant transpiration rate response to VPD was identified in all accessions (Figure 9). The breakpoints ranged between 1.6 and 2.2 kPa, with M. acuminata ssp. errans and M. balbisiana having the lowest breakpoint (Figures 9, 10). The slope after the breakpoint was strongly negative in M. acuminata ssp. errans and ssp. zebrina (Figures 9, 10). Accessions belonging to group I or II thus showed breakpoints in transpiration rate at lower VPD values and/or strongly negative second slopes (Figure 10).
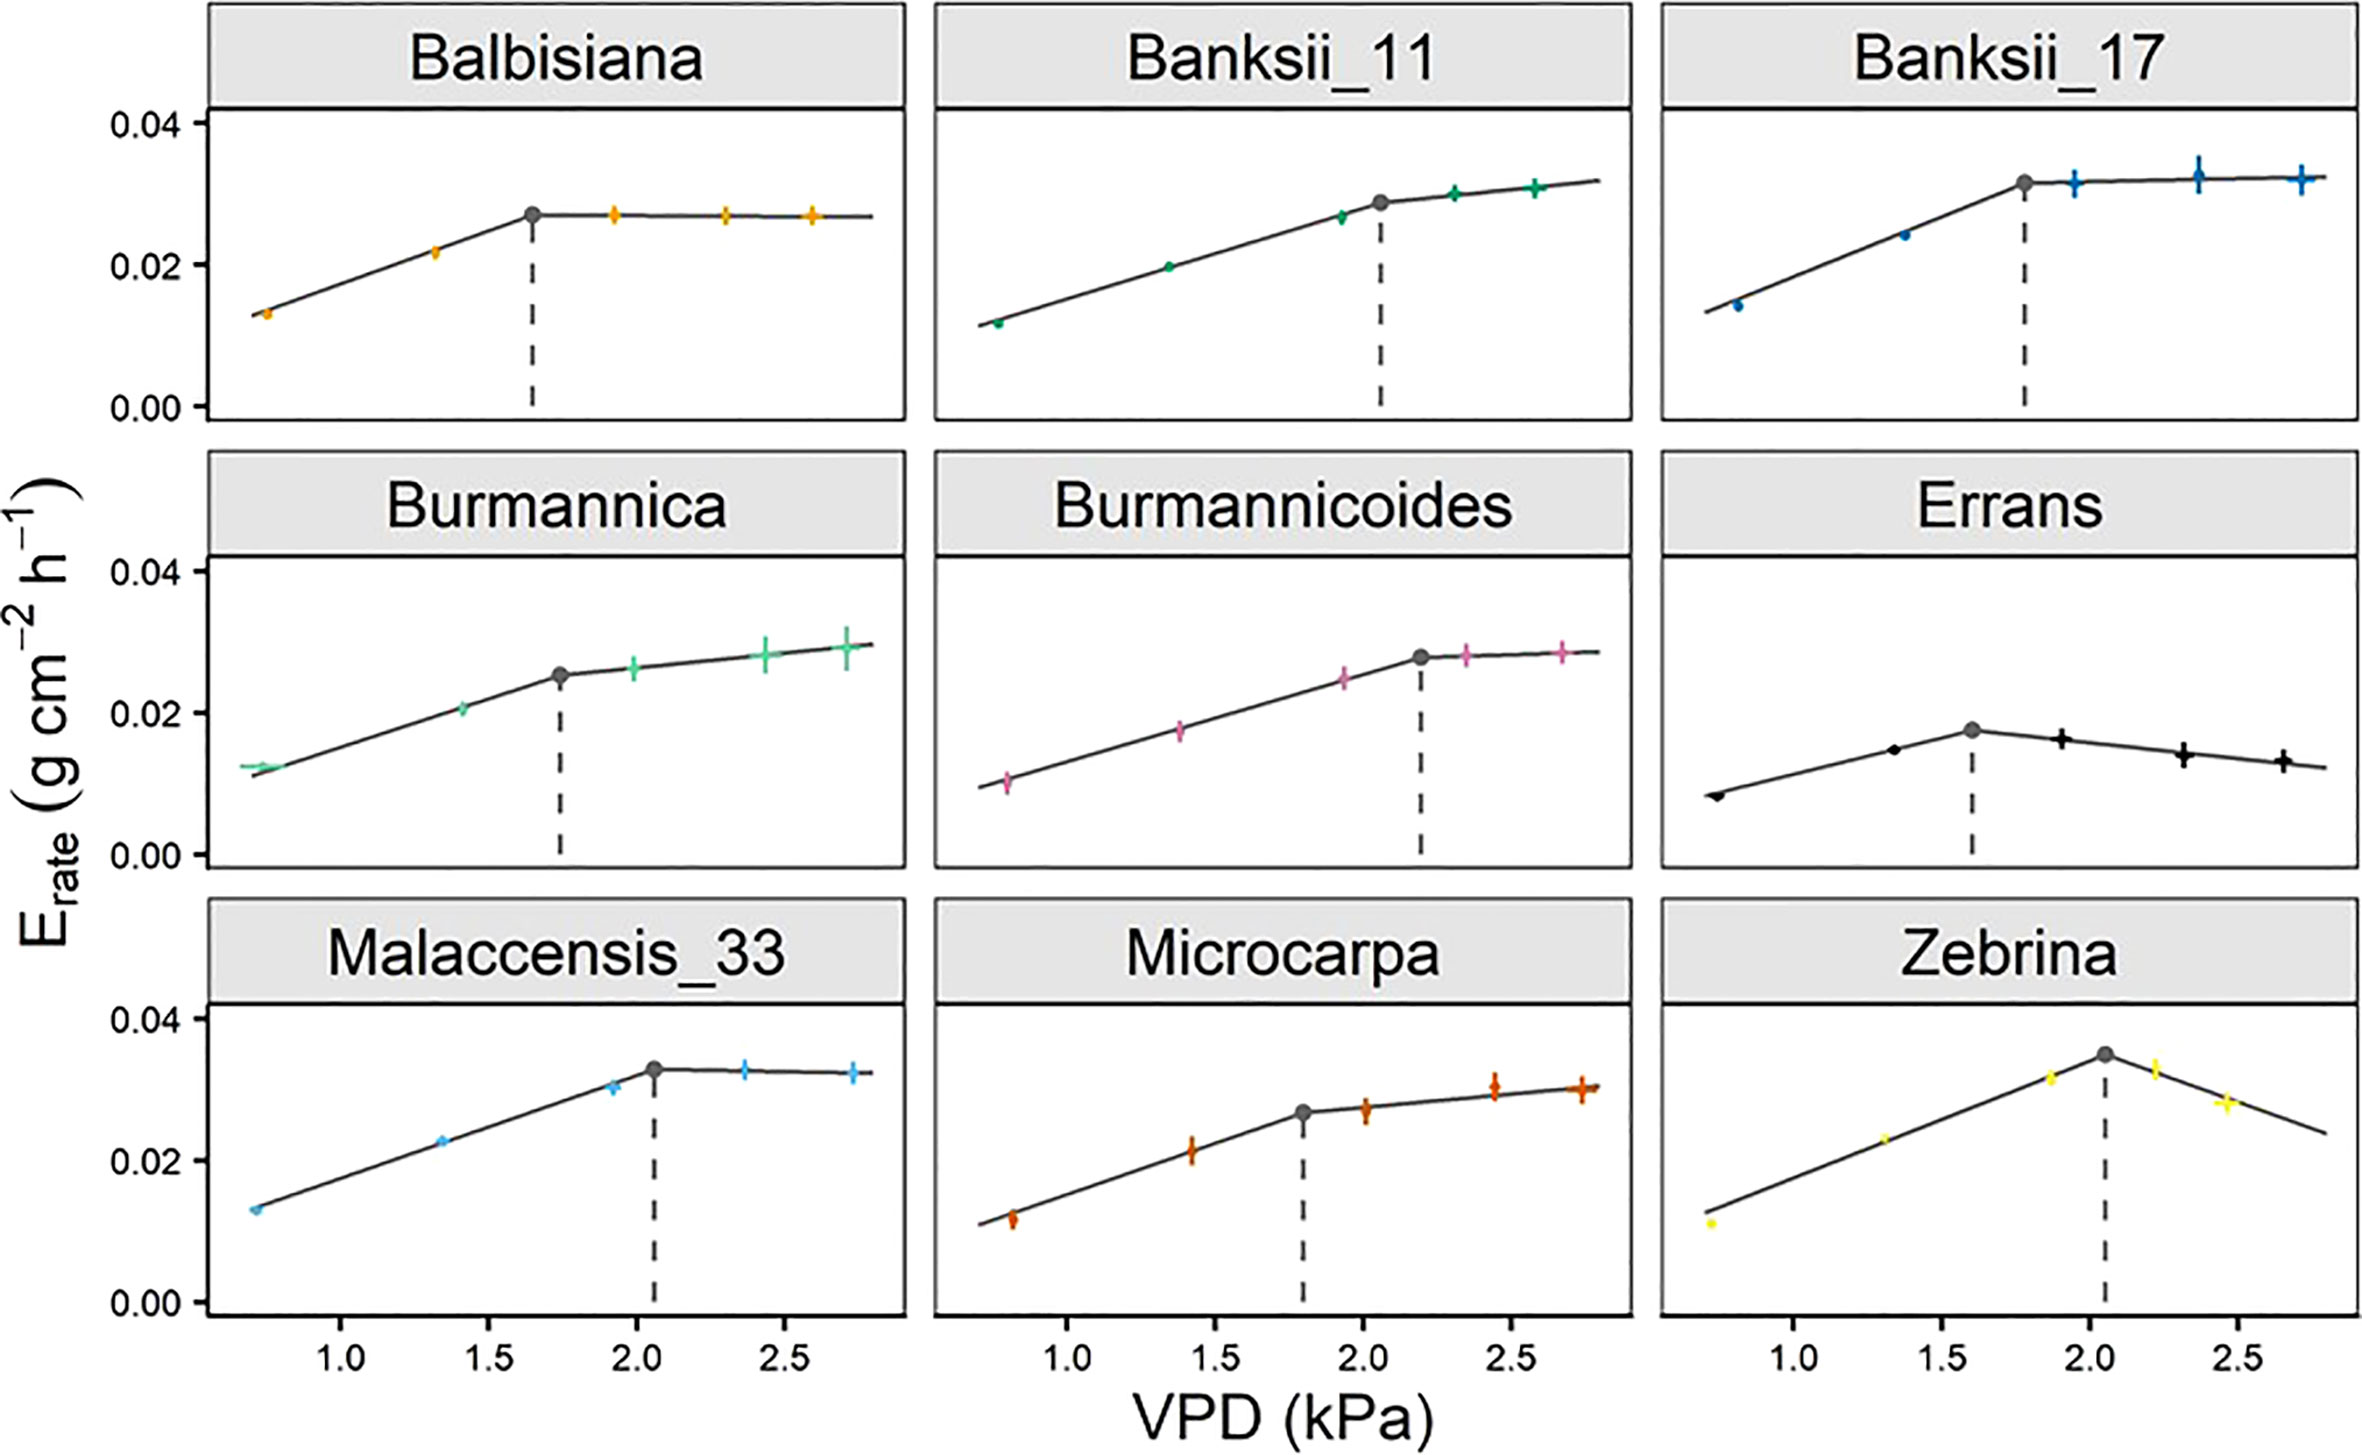
Figure 9 Whole-plant transpiration rate (Erate) response of 9 wild banana accessions to step-increases in air vapour pressure deficit (VPD). A significant breakpoint in transpiration rate was identified for all accessions (P-value Davies Test < 0.05). Solid grey lines represent slopes of the modelled segmented response. Grey point and dashed grey line represent the breakpoint in transpiration rate and the VPD of the breakpoint. Data represent mean ± se (n=4-8).
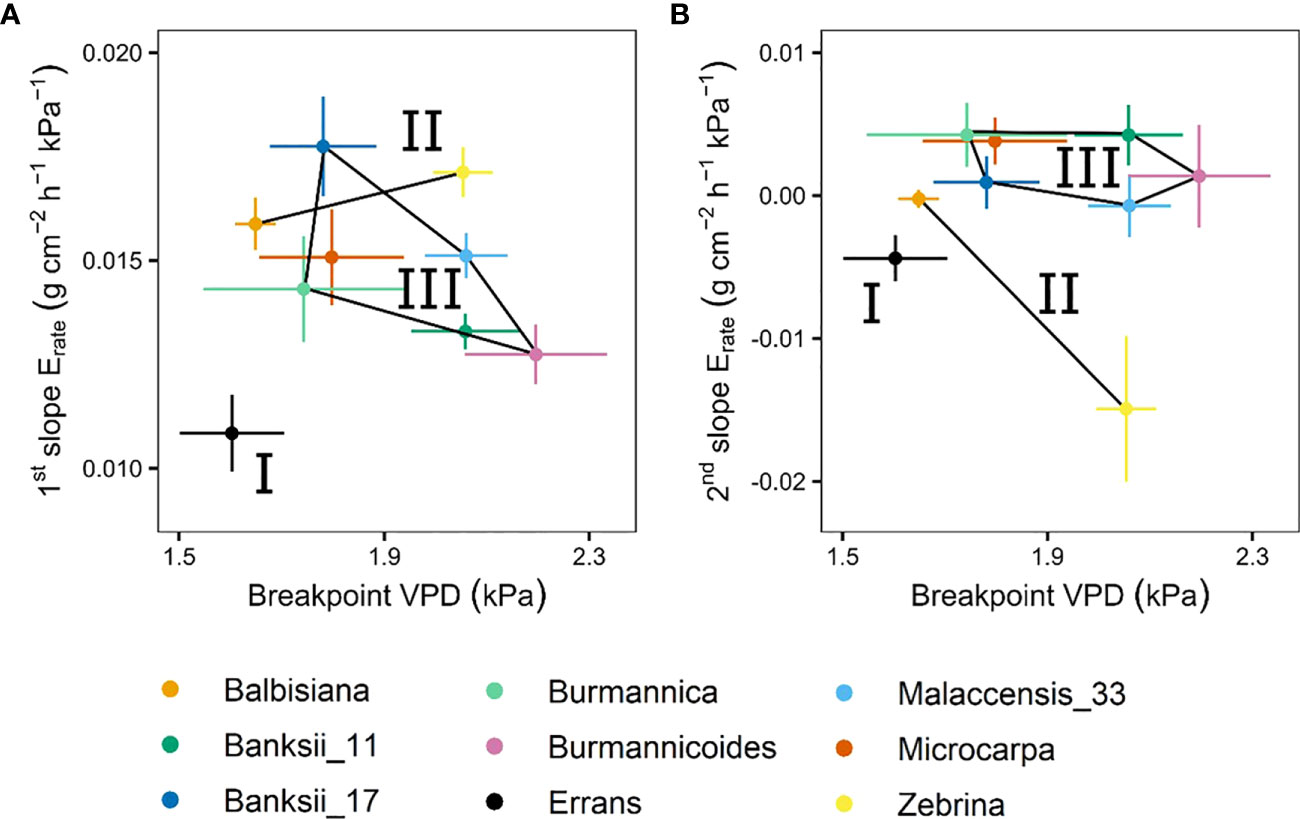
Figure 10 Slopes and breakpoints of the segmented whole-plant transpiration rate (Erate) response to step-increases in air vapour pressure deficit (VPD). (A) Relation between the breakpoint in whole-plant transpiration rate and the slope before the breakpoint. (B) Relation between the breakpoint in whole-plant transpiration rate and the slope after the breakpoint. Three groups (I, II, III) were defined by k-means clustering and are represented by black lines connecting the included accessions. All segmented responses were significant (P < 0.05). Data represent the optimal estimated value ± se (n = 4-8).
The whole-plant transpiration reduction (ϕE) (Eq. 1, Figure 1) of M. acuminata ssp. errans was significantly higher compared to all other accessions (Figure 11, Table A.6). The second highest transpiration reduction was observed for M. acuminata ssp. zebrina and M. balbisiana (Figure 11, Table A.6). Group I (M. acuminata ssp. errans) showed a significantly higher transpiration reduction compared to group II and III (Table A.6). Group II (M. acuminata ssp. zebrina and M. balbisiana) showed a significantly higher transpiration reduction compared to group III (Musa acuminata ssp. burmannica, ssp. burmannicoides, ssp. malaccensis, ssp. banksii and ssp. microcarpa) (Table A.6).
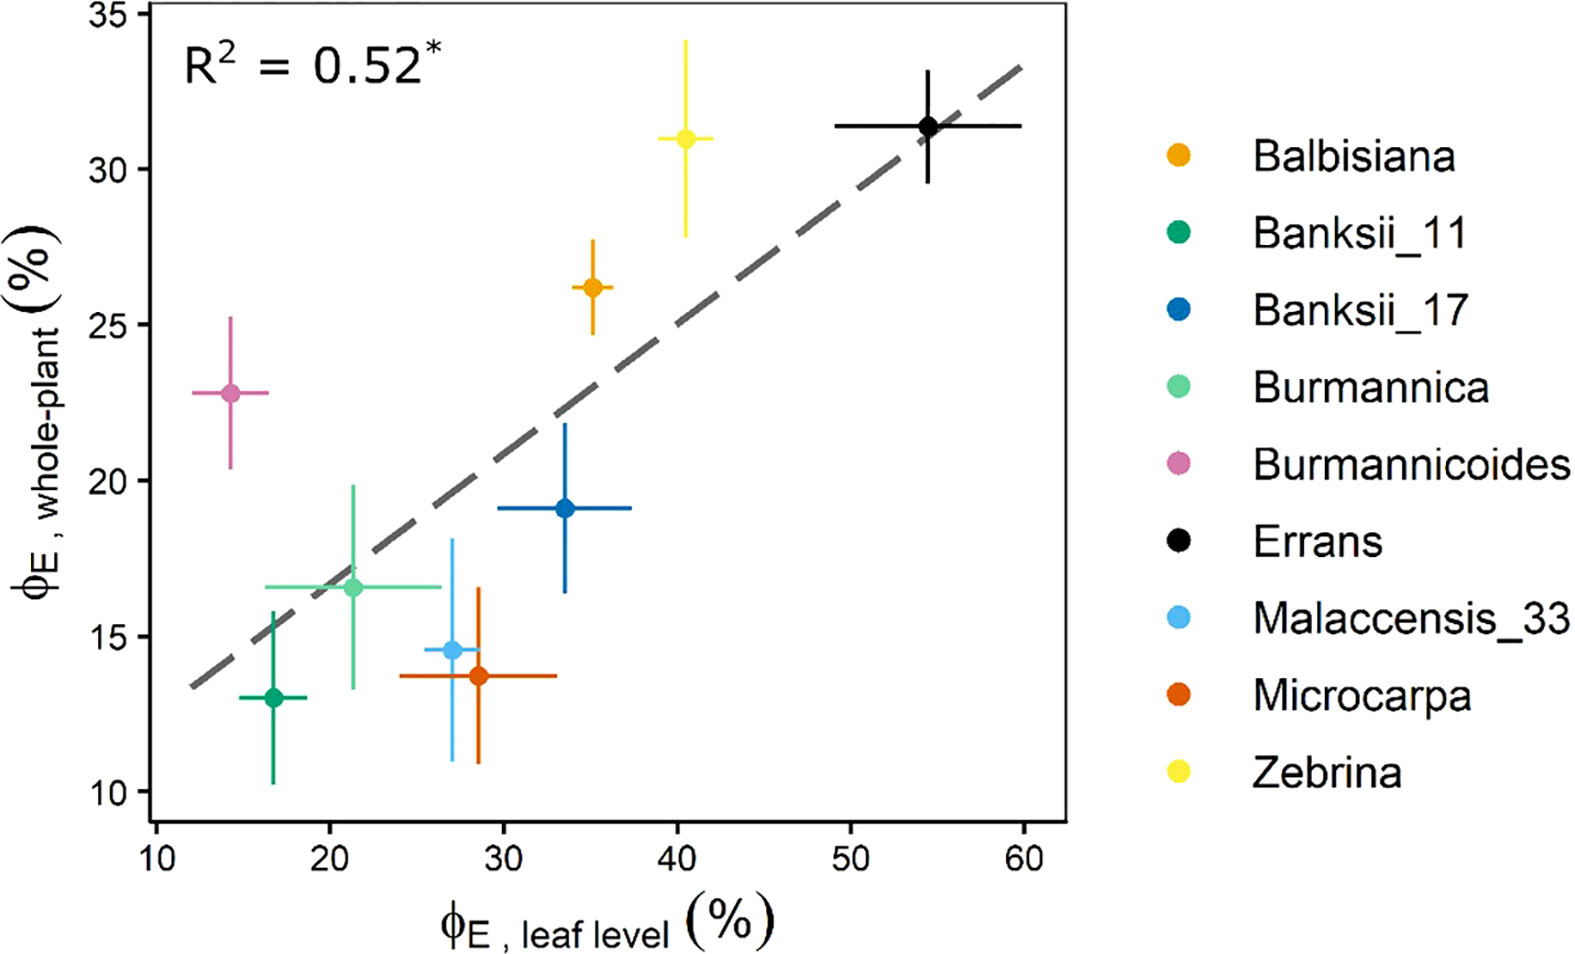
Figure 11 Transpiration reduction measured at whole-plant level (ϕE, whole-plant) at VPD 2.64 kPa in relation to the transpiration reduction measured at leaf level (ϕE, leaf level) at VPDleaf 2.69 kPa. The ϕE at leaf and whole-plant level were significantly correlated (R² = 0.52, P < 0.05). Data represent mean ± se (n=4-8). Significant differences between accessions or groups are indicated in Tables A.2, A.6.
The whole-plant transpiration reduction was significantly correlated to the transpiration reduction measured at leaf level at similar VPD (R² = 0.52, Figures 11, A.1). Similarly, the whole-plant transpiration reduction was significantly correlated to the limitation of A measured at leaf level for VPDleaf exceeding 2.1 kPa (R² = 0.50 - 0.73, Figure A.1).
Diversity in transpiration patterns with increasing VPD has been observed among different genotypes of many crops such as maize, sorghum and soybean (Fletcher et al., 2007; Gholipoor et al., 2010; Yang et al., 2012). We observed a significant change in the transpiration rate of 9 wild banana gene bank accessions already at VPD levels between 1.6 and 2.5 kPa (Figures 4, 9). These values are in line with the general transpiration rate reduction of banana at VPD 2 to 2.3 kPa reported by Carr (2009) and the modelled VPD responses of Eyland et al. (2022). The breakpoints in transpiration rate were at similar VPDs compared to other crops (Gholipoor et al., 2010; Yang et al., 2012; Ryan et al., 2016). However, in other crops several genotypes were identified without a breakpoint as they maintained a linear increase in transpiration rate with increasing VPD (Fletcher et al., 2007; Gholipoor et al., 2010; Yang et al., 2012). Moreover, temperature and other environmental factors like radiation and soil water potential have been shown to interact with VPD in banana (Eyland et al., 2022). These complex interactions explain why a fixed VPD level per accession, where a reduction in transpiration takes place, cannot be defined without taking the other environmental conditions in account.
The wild banana accessions clustered in three groups based on their leaf gas exchange and whole-plant transpiration response to VPD (Figure 2). Accessions of group I and II, M. acuminata ssp. errans, M. acuminata ssp. zebrina and M. balbisiana, showed the highest transpiration rate limitations. This is in line with our previous observations under fluctuating conditions: M. balbisiana showed together with M. acuminata ssp. errans the most pronounced response by strongly decreasing their transpiration rate (Eyland et al., 2022). As reported by Oren et al. (1999), the stomatal reduction was significantly correlated to the maximum gs (Figures 7, A.1). This indicates that accessions with higher gs under low VPDleaf show higher stomatal closure at increasing VPDleaf. However, M. acuminata ssp. errans (group I) showed a very strong stomatal response, despite its low gs. As a consequence of this strong stomatal restriction, the iWUE of M. acuminata ssp. errans was significantly higher compared to all other accessions (Figure 3D). In contrast to the very conservative behaviour of M. acuminata ssp. errans, the accessions of group II displayed high gs and A when VPDleaf was favourable in addition to early or strong transpiration rate reductions at high VPDleaf. This behaviour is assumed to be beneficial in drought-prone areas with periods of high VPD (Sadok and Sinclair, 2010; Vadez, 2014), as water is used efficiently and saved for later in the growing season. Some accessions of group III also showed a breakpoint in transpiration at a relatively low VPDleaf, but a high transpiration rate was kept and a net transpiration increase continued with rising VPDleaf (Figures 4, 5). Hence, these accessions display a more risk taking behaviour, thereby risking hydraulic failure (Sade et al., 2012).
Transpiration reductions at leaf level were validated at the whole-plant level (Figure 11). Accessions belonging to group I and II showing the highest transpiration rate limitations at leaf level also showed significant breakpoints in whole-plant transpiration rates. These breakpoints occurred at low VPDs after which transpiration rate increases were limited (Figures 5, 9).
The physiological and molecular origin of the observed genotypic variability still remains to be elucidated. This evaluation of leaf and whole-plant responses gives an idea on how fast imbalances in water supply and demand develop, as well as on the stomatal responsiveness to these imbalances. The restricted transpiration phenotype under high VPD has been linked in other crops to a limited hydraulic conductance by reduced expression of specific aquaporins (Sadok and Sinclair, 2010; Devi et al., 2015; Reddy et al., 2017). However, the high correlation between hydraulic and stomatal conductance and the challenge to measure hydraulic conductance in banana makes it challenging to separate these two processes in the current experimental setup (Turner et al., 2007). Nevertheless, given the low modelled maximal transpiration rate of M. acuminata ssp. errans (Eyland et al., 2022) and the low observed constituent conductance and transpiration (Figures 3A, B) it can be hypothesised that this species is characterised by a low hydraulic conductance. In contrast, group II and III accessions are hypothesized to have a better hydraulic conductance, allowing increased transpiration with increased evaporative demand. However, the early and strong interference of group II accessions, i.e. M. acuminata ssp. zebrina and M. balbisiana, might point towards a high hydraulic capacity but a fast stomatal reaction to an increasing water imbalance. The robustness of M. balbisiana to increased evaporative demand has already been reported in literature. During a collection mission in Papua New Guinea, it was the only species found almost always in open habitats (Eyland et al., 2020). Under these conditions of high evaporative demands, survival would only be possible if the species is equipped with a high water uptake and transport capacity, as well as reduced stomatal conductance (Eyland et al., 2020). Genotypic variability in stomatal response might be dependent on the speed of ABA anabolism and catabolism, as well as on the number of ABA receptors. Additionally physiological and molecular measurements are required to validate these hypotheses.
As demonstrated in other crops, identification of this conservative behaviour towards VPD, opens up possibilities to improve drought tolerance of cultivated banana hybrids. M. balbisiana is a parent to many edible bananas belonging to the AAB, ABB and AB genome groups and their subgroups. Moreover, in line with the conservative behaviour of M. balbisiana in response to VPD (Figures 3, 4, 6, 8), it has been indicated in many studies that edible bananas with a high portion of B genes are related to drought tolerance (Ekanayake et al., 1994; Thomas et al., 1998; Turner and Thomas, 1998; Thomas and Turner, 2001; Vanhove et al., 2012; Kissel et al., 2015; Van Wesemael et al., 2018; van Wesemael et al., 2019; Eyland et al., 2021; Uwimana et al., 2021; Eyland et al., 2022). Also M. acuminata ssp. zebrina is a parent to several edible bananas (Carreel et al., 2002; Perrier et al., 2011; Němečková et al., 2018; Baurens et al., 2019; Martin et al., 2020a; Martin et al., 2020b; Jeensae et al., 2021), among others the East-African highland banana subgroup (i.e. Mutika/Lujugira). The East-African highland banana subgroup, endemic to the East-African highlands, is due to its risk taking behaviour sensitive to drought (Kissel et al., 2015; van Wesemael et al., 2019; Eyland et al., 2021; Uwimana et al., 2021). Hence, identification of drought tolerance traits in M. acuminata ssp. zebrina populations provides opportunities to mitigate climate change impacts in this and all other important subgroups. So far, not much is known about the contribution of M. acuminata ssp. errans to edible bananas. The accession screened in this study and representing M. acuminata ssp. errans, has been proved to be complex in genome with ancestries coming from ‘malaccensis’, ‘zebrina’ and ‘burmannica/siamea’ (Martin et al., 2020b).
The reduction of transpiration response to high VPD is a key trait for water use efficiency and diversity among wild banana relatives was observed. Reductions in transpiration ranging between 37 and 59%, translated in an increased WUE of 54 to 166%. M. acuminata ssp. errans, on the one hand, responded most conservative, but was also characterized by low gs overall. M. acuminata ssp. zebrina and M. balbisiana, on the other hand, showed strong stomatal closure while maintaining relatively high carbon uptake under low VPD. These two (sub)species thus show favourable responses for a specific sub-trait linked to high water use efficiency, providing a potential basis for the identification of parent material for breeding more drought resilient bananas.
The raw data supporting the conclusions of this article will be made available by the authors, without undue reservation.
SC and RS wrote the concepts for funding. DE performed the experiments and analyzed the data. SC supervised the experiments. SC, CG and DE wrote the manuscript. All authors contributed to the article and approved the submitted version.
This study was undertaken as part of the initiative ‘Adapting Agriculture to Climate Change: Collecting, Protecting and Preparing Crop Wild Relatives’ which is supported by the Government of Norway. The project is managed by the Global Crop Diversity Trust in partnership with national and international gene banks and plant breeding institutes around the world http://www.cwrdiversity.org/. DE was supported by a scholarship funded by the Global TRUST foundation project ‘Crop Wild Relatives Evaluation of drought tolerance in wild bananas from Papua New Guinea’ [Grant number: GS15024]. CG was supported by a PhD scholarship funded by the Belgian Development Cooperation project ‘‘More fruit for food security: developing climate-smart bananas for the African Great Lakes region”. The authors thank all donors who supported this work also through their contributions to the CGIAR Fund (http://www.cgiar.org/who-we-are/cgiar-fund/fund-donors-2/), and in particular to the CGIAR Research Program Roots, Tubers and Bananas (RTB-CRP) and to the ERA-Net transnational call European Research Projects LEAP Agri H2020 cofund project on food & nutrition security & sustainable agriculture, with funding from national funding agencies for the Project ‘PHENOTYPING THE BANANA BIODIVERSITY TO IDENTIFY CLIMATE SMART VARIETIES WITH OPTIMAL MARKET POTENTIAL IN AFRICA AND EUROPE’.
The authors would like to thank Edwige André for the plant propagation; Hendrik Siongers, Stan Blomme, Loïck Derette and Poi Verwilt for their technical assistance during plant growth and phenotyping.
The authors declare that the research was conducted in the absence of any commercial or financial relationships that could be construed as a potential conflict of interest.
All claims expressed in this article are solely those of the authors and do not necessarily represent those of their affiliated organizations, or those of the publisher, the editors and the reviewers. Any product that may be evaluated in this article, or claim that may be made by its manufacturer, is not guaranteed or endorsed by the publisher.
The Supplementary Material for this article can be found online at: https://www.frontiersin.org/articles/10.3389/fpls.2023.1068191/full#supplementary-material
A, photosynthetic rate; Amax, maximally measured photosynthetic rate; Ameas, measured photosynthetic rate; ABA, abscisic acid; Erate, transpiration rate; Emeas, measured transpiration rate; Epred, predicted transpiration rate; Eq, equation; gs, stomatal conductance; h, hour; ITC, International Transit Centre; kPa, kilopascal; L, liter; LA, leaf area; m, meter; min, minutes; mol, moles; mtot, total weight; PC, principal component; s, seconds; se, standard error; ssp., subspecies; R2, R-squared; t1, timepoint 1; t2, timepoint 2; VPD, vapour pressure deficit; VPDleaf, leaf-to-air vapour pressure deficit; iWUE, intrinsic water use efficiency; µmol, micromoles; ϕE, transpiration reduction; ϕstom, stomatal reduction.
Aubert, B., Catsky, J. (1970). The onset of photosynthetic CO2 influx in banana leaf segments as related to stomatal diffusion resistance at different air humidities. Photosynthetica 4 (3), 254–256.
Bauer, H., Ache, P., Lautner, S., Fromm, J., Hartung, W., Al-Rasheid, K. A. S., et al. (2013). The stomatal response to reduced relative humidity requires guard cell-autonomous ABA synthesis. Curr. Biol. 23 (1), 53–57. doi: 10.1016/j.cub.2012.11.022
Baurens, F. C., Martin, G., Hervouet, C., Salmon, F., Yohomé, D., Ricci, S., et al. (2019). Recombination and large structural variations shape interspecific edible bananas genomes. Mol. Biol. Evol. 36 (1), 97–111. doi: 10.1093/molbev/msy199
Breshears, D. D., Adams, H. D., Eamus, D., Mcdowell, N. G., Law, D. J., Will, R. E., et al. (2013). The critical amplifying role of increasing atmospheric moisture demand on tree mortality and associated regional die-off. Front. Plant Sci. 4 (266). doi: 10.3389/fpls.2013.00266
Brodribb, T. J., Jordan, G. J. (2008). Internal coordination between hydraulics and stomatal control in leaves. Plant Cell Environ. 31 (11), 1557–1564. doi: 10.1111/j.1365-3040.2008.01865.x
Carr, M. K. V. (2009). The water relations and irrigation requirements of banana (Musa spp.). Exp. Agric. 45 (3), 333–371. doi: 10.1017/S001447970900787X
Carreel, F., de Leon, D. G., Lagoda, P., Lanaud, C., Jenny, C., Horry, J. P., et al. (2002). Ascertaining maternal and paternal lineage within Musa by chloroplast and mitochondrial DNA RFLP analyses. Genome 45 (4), 679–692. doi: 10.1139/g02-033
Cenci, A., Sardos, J., Hueber, Y., Martin, G., Breton, C., Roux, N., et al. (2021). Unravelling the complex story of intergenomic recombination in ABB allotriploid bananas. Ann. Bot. 127 (1), 7–20. doi: 10.1093/aob/mcaa032
Challinor, A. J., Wheeler, T. R. (2008). Crop yield reduction in the tropics under climate change: Processes and uncertainties. Agric. For. Meteorol. 148 (3), 343–356. doi: 10.1016/j.agrformet.2007.09.015
Choudhary, S., Sinclair, T. R., Messina, C. D., Cooper, M. (2014). Hydraulic conductance of maize hybrids differing in transpiration response to vapor pressure deficit. Crop Sci. 54 (3), 1147–1152. doi: 10.2135/cropsci2013.05.0303
Christelová, P., De Langhe, E., Hřibová, E., Čížková, J., Sardos, J., Hušáková, M., et al. (2017). Molecular and cytological characterization of the global Musa germplasm collection provides insights into the treasure of banana diversity. Biodiversity Conserv. 26 (4), 801–824. doi: 10.1007/s10531-016-1273-9
Dai, Z., Edwards, G. E., Ku, M. S. B. (1992). Control of photosynthesis and stomatal conductance in Ricinus communis L. (castor bean) by leaf to air vapor pressure deficit. Plant Physiol. 99 (4), 1426–1434. doi: 10.1104/pp.99.4.1426
De Langhe, E., Hřibová, E., Carpentier, S., Doleel, J., Swennen, R. (2010). Did backcrossing contribute to the origin of hybrid edible bananas? Ann. Bot. 106 (6), 849–857. doi: 10.1093/aob/mcq187
Dempewolf, H., Baute, G., Anderson, J., Kilian, B., Smith, C., Guarino, L. (2017). Past and future use of wild relatives in crop breeding. Crop Sci. 57, 1070–1082. doi: 10.2135/cropsci2016.10.0885
Devi, M. J., Sinclair, T. R., Taliercio, E. (2015). Comparisons of the effects of elevated vapor pressure deficit on gene expression in leaves among two fast-wilting and a slow-wilting soybean. PloS One 10 (10), 1–21. doi: 10.1371/journal.pone.0139134
Ekanayake, I. J., Ortiz, R., Vuylsteke, D. R. (1994). Influence of leaf age, soil moisture, VPD and time of day on leaf conductance of various Musa genotypes in a humid forest-moist savanna transition site. Ann. Bot. 74, 173–178. doi: 10.1006/anbo.1994.1106
Eyland, D., van Wesemael, J., Lawson, T., Carpentier, S. (2021). The impact of slow stomatal kinetics on photosynthesis and water use efficiency under fluctuating light. Plant Physiol. 186 (2), 998–1012. doi: 10.1093/plphys/kiab114
Eyland, D., Luchaire, N., Cabrera-Bosquet, L., Parent, B., Janssens, S. B., Swennen, R., et al. (2022). High-throughput phenotyping reveals differential transpiration behaviour within the banana wild relatives highlighting diversity in drought tolerance. Plant Cell Environ. 45 (6), 1647–1663. doi: 10.1111/pce.14310
Eyland, D., Breton, C., Sardos, J., Kallow, S., Panis, B., Swennen, R., et al. (2020). Filling the gaps in gene banks: Collecting, characterizing, and phenotyping wild banana relatives of papua new guinea. Crop Sci. 61 (1), 137–149. doi: 10.1002/csc2.20320
Ficklin, D. L., Novick, K. A. (2017). Historic and projected changes in vapor pressure deficit suggest a continental-scale drying of the United States atmosphere. J. Geophys. Res. 122 (4), 2061–2079. doi: 10.1002/2016JD025855
Fletcher, A. L., Sinclair, T. R., Allen, L. H. (2007). Transpiration responses to vapor pressure deficit in well watered “slow-wilting” and commercial soybean. Environ. Exp. Bot. 61 (2), 145–151. doi: 10.1016/j.envexpbot.2007.05.004
Franks, P. J., Cowan, I. R., Farquhar, G. D. (1997). The apparent feedforward response of stomata to air vapour pressure deficit: Information revealed by different experimental procedures with two rainforest trees. Plant Cell Environ. 20 (1), 142–145. doi: 10.1046/j.1365-3040.1997.d01-14.x
Franks, P. J., Farquhar, G. D. (1999). A relationship between humidity response, growth form and photosynthetic operating point in C3 plants. Plant Cell Environ. 22 (11), 1337–1349. doi: 10.1046/j.1365-3040.1999.00494.x
Gaffney, J., Schussler, J., Löffler, C., Cai, W., Paszkiewicz, S., Messina, C., et al. (2015). Industry-scale evaluation of maize hybrids selected for increased yield in drought-stress conditions of the US corn belt. Crop Sci. 55 (4), 1608–1618. doi: 10.2135/cropsci2014.09.0654
Gholipoor, M., Prasad, P. V. V., Mutava, R. N., Sinclair, T. R. (2010). Genetic variability of transpiration response to vapor pressure deficit among sorghum genotypes. Field Crops Res. 119, 85–90. doi: 10.1016/j.fcr.2010.06.018
Grossiord, C., Buckley, T. N., Cernusak, L. A., Novick, K. A., Poulter, B., Siegwolf, R. T.W., et al. (2020). Plant responses to rising vapor pressure deficit. New Phytol. 226 (6), 1550–1566. doi: 10.1111/nph.16485
Hajjar, R., Hodgkin, T. (2007). The use of wild relatives in crop improvement: A survey of developments over the last 20 years. Euphytica 156, 1–13. doi: 10.1007/s10681-007-9363-0
Hartigan, J. A., Wong, M. A. (1979). Algorithm AS 136: A K-means clustering algorithm. Appl. Stat 28 (1), 100. doi: 10.2307/2346830
Hatfield, J. L., Prueger, J. H. (2015). Temperature extremes: Effect on plant growth and development. Weather Climate Extremes 10, 4–10. doi: 10.1016/j.wace.2015.08.001
IPCC, Masson-Delmotte, V., Zhai, P., Pirani, A., Connors, S. L., Péan, C., et al. (2021). “Climate change 2021: the physical science basis,” in Contribution of Working Group I to the Sixth Assessment Report of the Intergovernmental Panel on Climate Change. Eds. Yu, R., Zhou, B. (Cambridge, United Kingdom and New York, NY: Cambridge University Press).
Janssens, S. B., Vandelook, F., De Langhe, E., Verstraete, B., Smets, E., Vandenhouwe, I., et al. (2016). Evolutionary dynamics and biogeography of musaceae reveal a correlation between the diversification of the banana family and the geological and climatic history of southeast asia. New Phytol. 210, 1453–1465. doi: 10.1111/nph.13856
Jeensae, R., Kongsiri, N., Fluch, S., Burg, K., Boonruangrod, R. (2021). Cultivar specific gene pool may play an important role in Musa acuminata Colla evolution. Genet. Resour. Crop Evol. 68 (4), 1589–1601. doi: 10.1007/s10722-020-01088-y
Kissel, E., van Asten, P., Swennen, R., Lorenzen, J., Carpentier, S. C. (2015). Transpiration efficiency versus growth: exploring the banana biodiversity for drought tolerance. Scientia Hortic. 185, 175–182. doi: 10.1016/j.scienta.2015.01.035
Kuromori, T., Sugimoto, E., Shinozaki, K. (2014). Intertissue signal transfer of abscisic acid from vascular cells to guard cells. Plant Physiol. 164 (4), 1587–1592. doi: 10.1104/pp.114.235556
Lawrence, M. G. (2005). The relationship between relative humidity and the dewpoint temperature in moist air: A simple conversion and applications. Bull. Am. Meteorological Soc. 86 (2), 225–234. doi: 10.1175/BAMS-86-2-225
Lee, Y. H., Sang, W. G., Baek, J. K., Kim, J. H., Shin, P., Seo, M. C., et al. (2020). The effect of concurrent elevation in CO2 and temperature on the growth, photosynthesis, and yield of potato crops. PloS One 15 (10), 1–20. doi: 10.1371/journal.pone.0241081
Lobell, D. B., Hammer, G. L., McLean, G., Messina, C., Roberts, M. J., Schlenker, W. (2013). The critical role of extreme heat for maize production in the United States. Nat. Climate Change 3 (5), 497–501. doi: 10.1038/nclimate1832
Martin, G., Baurens, F. C., Hervouet, C., Salmon, F., Delos, J. M., Labadie, K., Perdereau, A., et al. (2020a). Chromosome reciprocal translocations have accompanied subspecies evolution in bananas. Plant J. 104 (6), 1698–1711. doi: 10.1111/tpj.15031
Martin, G., Cardi, C., Sarah, G., Ricci, S., Jenny, C., Fondi, E., Perrier, X., et al. (2020b). Genome ancestry mosaics reveal multiple and cryptic contributors to cultivated banana. Plant J. 102 (5), 1008–1025. doi: 10.1111/tpj.14683
Martin, G., Cottin, A., Baurens, F. C., Labadie, K., Hervouet, C., Salmon, F., et al. (2023). Interspecific introgression patterns reveal the origins of worldwide cultivated bananas in new guinea. Plant J. 113 (4), 802–818. doi: 10.1111/tpj.16086
Matzner, S., Comstock, J. (2001). The temperature dependence of shoot hydraulic resistance: Implications for stomatal behaviour and hydraulic limitation. Plant Cell Environ. 24 (12), 1299–1307. doi: 10.1046/j.0016-8025.2001.00785.x
McAdam, S. A. M., Brodribb, T. J. (2015). The evolution of mechanisms driving the stomatal response to vapor pressure deficit. Plant Physiol. 167 (3), 833–843. doi: 10.1104/pp.114.252940
McAdam, S. A. M., Brodribb, T. J. (2016). Linking turgor with ABA biosynthesis: Implications for stomatal responses to vapor pressure deficit across land plants. Plant Physiol. 171 (3), 2008–2016. doi: 10.1104/pp.16.00380
McAdam, S. A. M., Sussmilch, F. C., Brodribb, T. J. (2016). Stomatal responses to vapour pressure deficit are regulated by high speed gene expression in angiosperms. Plant Cell Environ. 39 (3), 485–491. doi: 10.1111/pce.12633
McAusland, L., Vialet-Chabrand, S., Davey, P., Baker, N. R., Brendel, O., Lawson, T. (2016). Effects of kinetics of light-induced stomatal responses on photosynthesis and water-use efficiency. New Phytol. 211 (4), 1209–1220. doi: 10.1111/nph.14000
Medina, S., Vicente, R., Nieto-Taladriz, M. T., Aparicio, N., Chairi, F., Vergara-Diaz, O., et al. (2019). The plant-transpiration response to vapor pressure deficit (VPD) in durum wheat is associated with differential yield performance and specific expression of genes involved in primary metabolism and water transport. Front. Plant Sci. 9 (1994). doi: 10.3389/fpls.2018.01994
Messina, C. D., Sinclair, T. R., Hammer, G. L., Curan, D., Thompson, J., Oler, Z., et al. (2015). Limited-transpiration trait may increase maize drought tolerance in the US corn belt. Agron. J. 107 (6), 1978–1986. doi: 10.2134/agronj15.0016
Monteith, J. L. (1995). A reinterpretation of stomatal responses to humidity. Plant Cell Environ. 18 (4), 357–364. doi: 10.1111/j.1365-3040.1995.tb00371.x
Monteith, J. L., Unsworth, M. H. (2013). “Properties of gases and liquids,” in Principles of Environmental Physics, 4th edn. Eds. Monteith, J. L., Unsworth, M. H. (Boston: Elsevier), 5–23. doi: 10.1016/B978-0-12-386910-4.00002-0
Muggeo, V. M. R. (2008). Segmented: an R package to fit regression models with broken-line relationships. R News, 20–25.
Němečková, A., Christelová, P., Čížková, J., Nyine, M., Van den houwe, I., Svačina, R., et al. (2018). Molecular and cytogenetic study of East African Highland Banana. Front. Plant Sci. 9, 1–13. doi: 10.3389/fpls.2018.01371
Ocheltree, T. W., Nippert, J. B., Prasad, P. V. V. (2014). Stomatal responses to changes in vapor pressure deficit reflect tissue-specific differences in hydraulic conductance. Plant Cell Environ. 37, 132–139. doi: 10.1111/pce.12137
Oren, R., Sperry, J., Katul, G., Pataki, D., Ewers, B., Phillips, N., et al. (1999). Survey and synthesis of intra-and interspecific variation in stomatal sensitivity to vapour pressure deficit. Plant Cell Environ. 22 (12), 1515–1526. doi: 10.1046/j.1365-3040.1999.00513.x
Perrier, X., De Langhe, E., Donohue, M., Lentfer, C., Vrydaghs, L., Bakry, F., et al. (2011). Multidisciplinary perspectives on (Musa spp.) domestication. Proc. Natl. Acad. Sci. United States America 108 (28), 11311–11318. doi: 10.1073/pnas.1102001108
Reddy, P. S., Tharanya, M., Sivasakthi, K., Srikanth, M., Hash, C. T., Kholova, J., et al. (2017). Molecular cloning and expression analysis of Aquaporin genes in pearl millet [Pennisetum glaucum (L) R. Br.] genotypes contrasting in their transpiration response to high vapour pressure deficits. Plant Sci. 265, 167–176. doi: 10.1016/j.plantsci.2017.10.005
Richards, R. A. (2000). Selectable traits to increase crop photosynthesis and yield of grain crops. J. Exp. Bot. 51 (SPEC. ISS.), 447–458. doi: 10.1093/jexbot/51.suppl_1.447
Ryan, A. C., Dodd, I. C., Rothwell, S. A., Jones, R., Tardieu, F., Draye, X., et al. (2016). Gravimetric phenotyping of whole plant transpiration responses to atmospheric vapour pressure deficit identifies genotypic variation in water use efficiency. Plant Sci. 251, 101–109. doi: 10.1016/j.plantsci.2016.05.018
Sack, L., John, G. P., Buckley, T. N. (2018). ABA accumulation in dehydrating leaves is associated with decline in cell volume, not turgor pressure. Plant Physiol. 176 (1), 489–493. doi: 10.1104/pp.17.01097
Sade, N., Gebremedhin, A., Moshelion, M. (2012). Risk-taking plants: anisohydric behavior as a stress-resistance trait. Plant Signaling Behav. 7 (7), 767–770. doi: 10.4161/psb.20505
Sadok, W., Sinclair, T. R. (2010). Genetic variability of transpiration response of soybean [Glycine max (L.) Merr.] shoots to leaf hydraulic conductance inhibitor AgNO3. Crop Sci. 50, 1423–1430. doi: 10.2135/cropsci2009.10.0575
Sardos, J., Breton, C., Perrier, X., Van den Houwe, I., Carpentier, S., Paofa, J., et al. (2022). Hybridization, missing wild ancestors and the domestication of cultivated diploid bananas. Front. Plant Sci. 13. doi: 10.3389/fpls.2022.969220
Schoppach, R., Taylor, J. D., Majerus, E., Claverie, E., Baumann, U., Suchecki, R., et al. (2016). High resolution mapping of traits related to whole-plant transpiration under increasing evaporative demand in wheat. J. Exp. Bot. 67 (9), 2847–2860. doi: 10.1093/jxb/erw125
Sinclair, T. R., Messina, C. D., Beatty, A., Samples, M. (2010). Assessment across the United States of the benefits of altered soybean drought traits. Agron. J. 102 (2), 475–482. doi: 10.2134/agronj2009.0195
Sinclair, T. R., Devi, J., Shekoofa, A., Choudhary, S., Sadok, W., Vadez, V., et al. (2017). Limited-transpiration response to high vapor pressure deficit in crop species. Plant Sci. 260, 109–118. doi: 10.1016/j.plantsci.2017.04.007
Thomas, D. S., Turner, D. W. (2001). Banana (Musa sp.) leaf gas exchange and chlorophyll fluorescence in response to soil drought, shading and lamina folding. Scientia Hortic. 90 (1–2), 93–108. doi: 10.1016/S0304-4238(00)00260-0
Thomas, D. S., Turner, D. W., Eamus, D. (1998). Independent effects of the environment on the leaf gas exchange of three banana (Musa sp.) cultivars of different genomic constitution. Scientia Hortic. 75 (1–2), 41–57. doi: 10.1016/S0304-4238(98)00114-9
Turner, D. W., Thomas, D. S. (1998). Measurements of plant and soil water status and their association with leaf gas exchange in banana (Musa spp.): a laticiferous plant. Scientia Hortic. 77 (3–4), 177–193. doi: 10.1016/S0304-4238(98)00168-X
Turner, D. W., Fortescue, J. A., Thomas, D. S. (2007). Environmental physiology of the bananas (Musa spp.). Braz. J. Plant Physiol. 19 (4), 463–484. doi: 10.1590/S1677-04202007000400013
Uwimana, B., Zorrilla-Fontanesi, Y., van Wesemael, J., Mduma, H., Brown, A., Carpentier, S., et al. (2021). Effect of seasonal drought on the agronomic performance of four banana genotypes (Musa spp.) in the east african highlands. Agronomy 11 (1), 1–23. doi: 10.3390/agronomy11010004
Vadez, V. (2014). Root hydraulics: The forgotten side of roots in drought adaptation. Field Crops Res. 165, 15–24. doi: 10.1016/j.fcr.2014.03.017
Vanhove, A.-C., Vermaelen, W., Panis, B., Swennen, R., Carpentier, S. C. (2012). Screening the banana biodiversity for drought tolerance: can an in vitro growth model and proteomics be used as a tool to discover tolerant varieties and understand homeostasis. Front. Plant Sci. 3. doi: 10.3389/fpls.2012.00176
Van Wesemael, J., Hueber, Y., Kissel, E., Campos, N., Swennen, R., Carpentier, S. (2018). Homeolog expression analysis in an allotriploid non-model crop via integration of transcriptomics and proteomics. Sci. Rep. 8 (1), 1–11. doi: 10.1038/s41598-018-19684-5
van Wesemael, J., Kissel, E., Eyland, D., Lawson, T., Swennen, R., Carpentier, S. (2019). Using growth and transpiration phenotyping under controlled conditions to select water efficient banana genotypes. Front. Plant Sci. 10. doi: 10.3389/fpls.2019.00352
Williams, A. P., Allen, C. D., Macalady, A. K., Griffin, D., Woodhouse, C. A., Meko, D. M., et al. (2013). Temperature as a potent driver of regional forest drought stress and tree mortality. Nat. Climate Change 3 (3), 292–297. doi: 10.1038/nclimate1693
Xie, X., Wang, Y., Williamson, L., Holroyd, G. H., Tagliavia, C., Murchie, E., et al. (2006). The identification of genes involved in the stomatal response to reduced atmospheric relative humidity. Curr. Biol. 16 (9), 882–887. doi: 10.1016/j.cub.2006.03.028
Yang, Z., Sinclair, T. R., Zhu, M., Messina, C. D., Cooper, M., Hammer, G. L. (2012). Temperature effect on transpiration response of maize plants to vapour pressure deficit. Environ. Exp. Bot. 78, 157–162. doi: 10.1016/j.envexpbot.2011.12.034
Keywords: drought tolerance, stomatal conductance, transpiration, vapour pressure deficit, water use efficiency, wild banana species, breeding
Citation: Eyland D, Gambart C, Swennen R and Carpentier S (2023) Unravelling the diversity in water usage among wild banana species in response to vapour pressure deficit. Front. Plant Sci. 14:1068191. doi: 10.3389/fpls.2023.1068191
Received: 12 October 2022; Accepted: 03 August 2023;
Published: 21 August 2023.
Edited by:
Vicent Arbona, University of Jaume I, SpainReviewed by:
Robooni Tumuhimbise, National Agricultural Research Organisation (NARO), UgandaCopyright © 2023 Eyland, Gambart, Swennen and Carpentier. This is an open-access article distributed under the terms of the Creative Commons Attribution License (CC BY). The use, distribution or reproduction in other forums is permitted, provided the original author(s) and the copyright owner(s) are credited and that the original publication in this journal is cited, in accordance with accepted academic practice. No use, distribution or reproduction is permitted which does not comply with these terms.
*Correspondence: Sebastien Carpentier, cy5jYXJwZW50aWVyQGNnaWFyLm9yZw==
†These authors share first authorship
Disclaimer: All claims expressed in this article are solely those of the authors and do not necessarily represent those of their affiliated organizations, or those of the publisher, the editors and the reviewers. Any product that may be evaluated in this article or claim that may be made by its manufacturer is not guaranteed or endorsed by the publisher.
Research integrity at Frontiers

Learn more about the work of our research integrity team to safeguard the quality of each article we publish.