- 1Henan Key Laboratory of Hybrid Wheat, Xinxiang, Henan, China
- 2School of Life Sciences and Technology, Henan Institute of Science and Technology, Xinxiang, Henan, China
Boron (B) deficiency is an agricultural problem that causes significant yield losses in many countries. B transporters (BORs) are responsible for B uptake and distribution and play important roles in yield formation. A comprehensive analysis of the BOR family members in common wheat is still lacking. In the present study, to clarify the molecular characterization and response to B status, genome-wide TaBOR genes and expression patterns were investigated. Fourteen TaBOR genes were identified in common wheat by a homology search. The corresponding phylogenetic tree indicated that 14 TaBOR genes were separately classified into subfamilies of TaBOR1, TaBOR3, and TaBOR4. All TaBOR genes had 12–14 extrons and 11–13 introns. Most TaBOR proteins contained 10 conserved motifs, and motifs 1, 2, 3, 4, and 6 constituted the conserved bicarbonate (HCO3–) domain. Fourteen TaBOR genes were mapped on 13 chromosomes mainly distributed in the first, third, fifth, and seventh homologous groups. The promoters of TaBOR genes consisted of phytohormones, light responses, and stress-related cis-elements. GO analysis indicated that TaBOR genes were enriched in terms of transmembrane transport and ion homeostasis. TaBOR genes showed diverse expression profiles in different tissues. The members of the TaBOR1 subfamily showed high expression in grains, leaves, roots, stems, and spikes, but members of the TaBOR4 subfamily were highly expressed only in spikes and grains. RT–qPCR indicated that TaBOR1-5A, TaBOR1-5B, and TaBOR1-5D were induced by low B concentrations and had much higher expression in roots than in shoots. TaBOR3-3A, TaBOR3-3B, TaBOR3-3D, TaBOR4-1A, TaBOR4-1B, TaBOR4-1D, and TaBOR3-4B were induced by low and high B concentrations and had high expression in roots and shoots. TaBOR3-4D and TaBOR3-7B were upregulated by low and high B concentrations, respectively, but had expression only in roots. Our results provide basic information on the TaBOR family, which is beneficial for elucidating the functions of TaBOR genes to overcome the problem of B deficiency.
Introduction
Boron (B) is an essential micronutrient for plant growth (Shorrocks, 1997; Nielsen and Eckhert, 2020). Regarding physiological functions, B plays key roles in determining cell size and shape (Yoshinari and Takano, 2017). B deficiency leads to apical growth inhibition in plants (Dell and Huang, 1997; Camacho-Cristobal et al., 2011; Camacho-Cristóbal et al., 2015; González-Fontes and Fujiwara, 2020). During the reproductive stage, B deficiency often leads to fewer pods and a low seed set or sterility (Eser and Aydemir, 2016; Chen et al., 2018). Conversely, B toxicity reduced root cell division and chlorophyll content when B was present in excess, and thus, shoot and root growth was consequently inhibited (Pallotta et al., 2014; Al-Huqail et al., 2020; González-Fontes and Fujiwara, 2020).
Regarding essential microelement soil concentration margins, the B soil concentration margin from deficiency to toxicity was the narrowest. In plants, a complex network constructed by channels and transporters is responsible for the regulation of B homeostasis (Brdar-Jokanović, 2020; Onuh and Miwa, 2021). A number of genes for B deficiency and toxicity tolerance have been identified (Miwa and Fujiwara, 2010). In Arabidopsis, AtBOR1 was first identified as a B transporter that plays key roles in B loading (Takano et al., 2002; Wakuta et al., 2015). High B inhibits the activity of AtBOR1 (Takano et al., 2010; Kasai et al., 2011). After the discovery of AtBOR1, more BOR1-like genes were discovered in plants, such as OsBOR1 (Nakagawa et al., 2007), VvBOR1 (Pérezcastro et al., 2012), CmBOR1 (Cañon et al., 2013), TaBOR1 (Leaungthitikanchana et al., 2013), BnBOR1;1c (Zhang et al., 2017) and RTE (Chatterjee et al., 2014). OsBOR1 was necessary for efficient B uptake and xylem loading and had higher expression in roots than in shoots (Nakagawa et al., 2007). As an ortholog to the AtBOR1 protein, Rte (ROTTEN EAR) is essential for B transport into aerial tissues, and the transcripts accumulate abundantly in cells surrounding the xylem in vegetative and reproductive tissues (Chatterjee et al., 2014). Compared with AtBOR1 and OsBOR1, BnaC4. BOR1;1c showed diverse characteristics, with expression in both shoots and roots under B deficiency (Zhang et al., 2017). Recently, a total of 20 BnBOR genes were determined, distinct expression patterns were revealed in various tissues, and the genetic effects of BnBOR1;1c were investigated in B-efficient and B-inefficient genotypes (Chen et al., 2018). In contrast to AtBOR1 and AtBOR2 functioning in low B conditions, AtBOR4 and HvBot1 contribute to improving B toxicity tolerance (Kajikawa et al., 2011; Nagarajan et al., 2016). Thus, B homeostasis is maintained by the active regulation of transport protein localization and abundance in plants.
Wheat is a staple food worldwide but is very sensitive to B deficiency (Rashid et al., 2011; Qin et al., 2022). The optimal B concentration for wheat ranges from 10 to 100 μg/g (Marschner, 1995). B deficiency is a crucial problem for crop production in areas with high rainfall, which often leads to grain set failure (Rerkasem and Jamjod, 2004; Emon et al., 2010). Quality and yields affected by low B concentrations have been reported in many countries and regions (Rerkasem et al., 1993; Pant et al., 1998). BOR genes also play key roles in inflorescence development and yield formation (Zhang et al., 2017; Chen et al., 2018; Till et al., 2019). Three TaBOR1 genes have been identified in the wheat genome, and their expression profiles have been revealed in different tissues and under different B conditions (Leaungthitikanchana et al., 2013). In addition, Bo1 and Bo4, which are associated with tolerance to high B concentrations, have also been identified (Pallotta et al., 2014). However, the regulatory mechanism of B uptake and utilization is unknown, and the identification of more B transporters is also required to improve B efficiency.
In the present study, 14 B transporter genes were identified, and the exon/intron organization, phylogeny, motif framework, chromosome locations and expression profiles of BOR genes in wheat were illustrated. Furthermore, the expression of 12 B transporter genes under different B conditions was also investigated, which established a foundation for studying the functions of BOR genes and improving B utilization efficiency.
Materials and methods
Identification of TaBOR family members
Based on the protein sequences of 7 AtBOR in Arabidopsis1 and rice,2 14 TaBOR genes were identified using BLAST in WheatOmics3 (Ma et al., 2021). The Gene Structure Display Server (GSDS)4 was employed to obtain the exon/intron distributions of the TaBOR family members (Hu et al., 2015). The MW/pI tool in ExPASy5 was used to assess the isoelectronic point (pI) and molecular weight (MW) of each TaBOR protein (Kozlowski, 2016, 2021).
Conserved motif analysis of proteins
Multiple Expectation Maximization for Motif Elicitation (MEME) program version 4.11.26 was used to identify the conserved motifs of the TaBOR family members (Bailey et al., 2009). The parameters included an output of 10 motifs (10) with a width from 10 to 100, and the motifs were annotated by Pfam.7
Phylogeny, chromosome localization, and classification of TaBOR family members
BOR protein sequence alignment in monocotyledons and dicotyledons was performed using ClustalW2 programs. In total, 40 BOR protein sequences (Supplementary Table 1) were downloaded from Triticum aestivum L., Oryza sativa L., Hordeum vulgare L., Zea mays L., Brassica napus L., Arabidopsis thaliana L., and Sorghum bicolor L. The physical positions of all TaBOR genes were obtained from WheatOmics, and MapInspect software was used to obtain the gene locations on chromosomes. The neighbor-joining method was used to infer the evolutionary history, and MEGA6.0 software was employed for estimating (with 1,000 replicates) the bootstrap values to estimate the relative support for each branch (Saitou and Nei, 1987).
Promoter analysis and protein interaction network of TaBOR genes
To investigate the cis-elements, a 2,000 bp sequence in the promoter regions of TaBOR genes was submitted to the online PlantCARE tool8 (Lescot et al., 2002). The number of elements with the same functions was counted. TBtools software was used to obtain the location of elements for each TaBOR gene (Chen et al., 2020). The protein interaction network of TaBOR family members with other proteins was produced by STRING.9
Gene ontology enrichment analysis
Gene Ontology (GO) enrichment analysis was performed by pannzer210 (Tian et al., 2017), and Gene Ontology (GO) enrichment analysis was explored for the TaBOR family. GO term annotation was produced by Bioinformatics.11
Expression pattern of TaBOR genes
Transcripts per million (TPM) values of five tissues (root, leaf, stem, spike, and grain) were downloaded from Wheatomics. A heatmap of the expression patterns for TaBOR family members was obtained by clustVis.12
Plant materials and cultures
Based on the report of Leaungthitikanchana et al. (2013), plump seeds of Chinese spring were germinated on moistened gauze for 5 days in a chamber after sterilization with 1% H2O2 for 60 min. Subsequently, seedlings of a consistent tidiness were transplanted into 2 L containers filled with half-strength Hoagland nutrient solution with 20 nM and 1 mM boric acid for 7 days. The conditions of germination and seedling growth included a photoperiod of 8 h dark/16 h light, a temperature of 20–25°C, and a relative humidity of 60–70%.
RNA extraction and RT–qPCR analysis
Total RNA was isolated from fresh tissues with an RNA extraction reagent kit (DP452, Tiangen, Beijing), and a reverse transcription reagent kit (Takara, Tokyo, Japan) was used to synthesize the first strand cDNA. RT–qPCR was amplified on a Thermal Cycler Dice (ABI3700, USA) with SYBR Premix Ex Taq II (TAKARA). Genome-specific primer sets were designed with Primer Premier 5 software. The specificity of the primers was checked on the WheatOmics website. All primers are listed in Supplementary Table 2. The fold changes in expression were calculated with the 2–ΔΔCt method (Livak and Schmittgen, 2001).
Results
Identification of the BOR gene family in common wheat
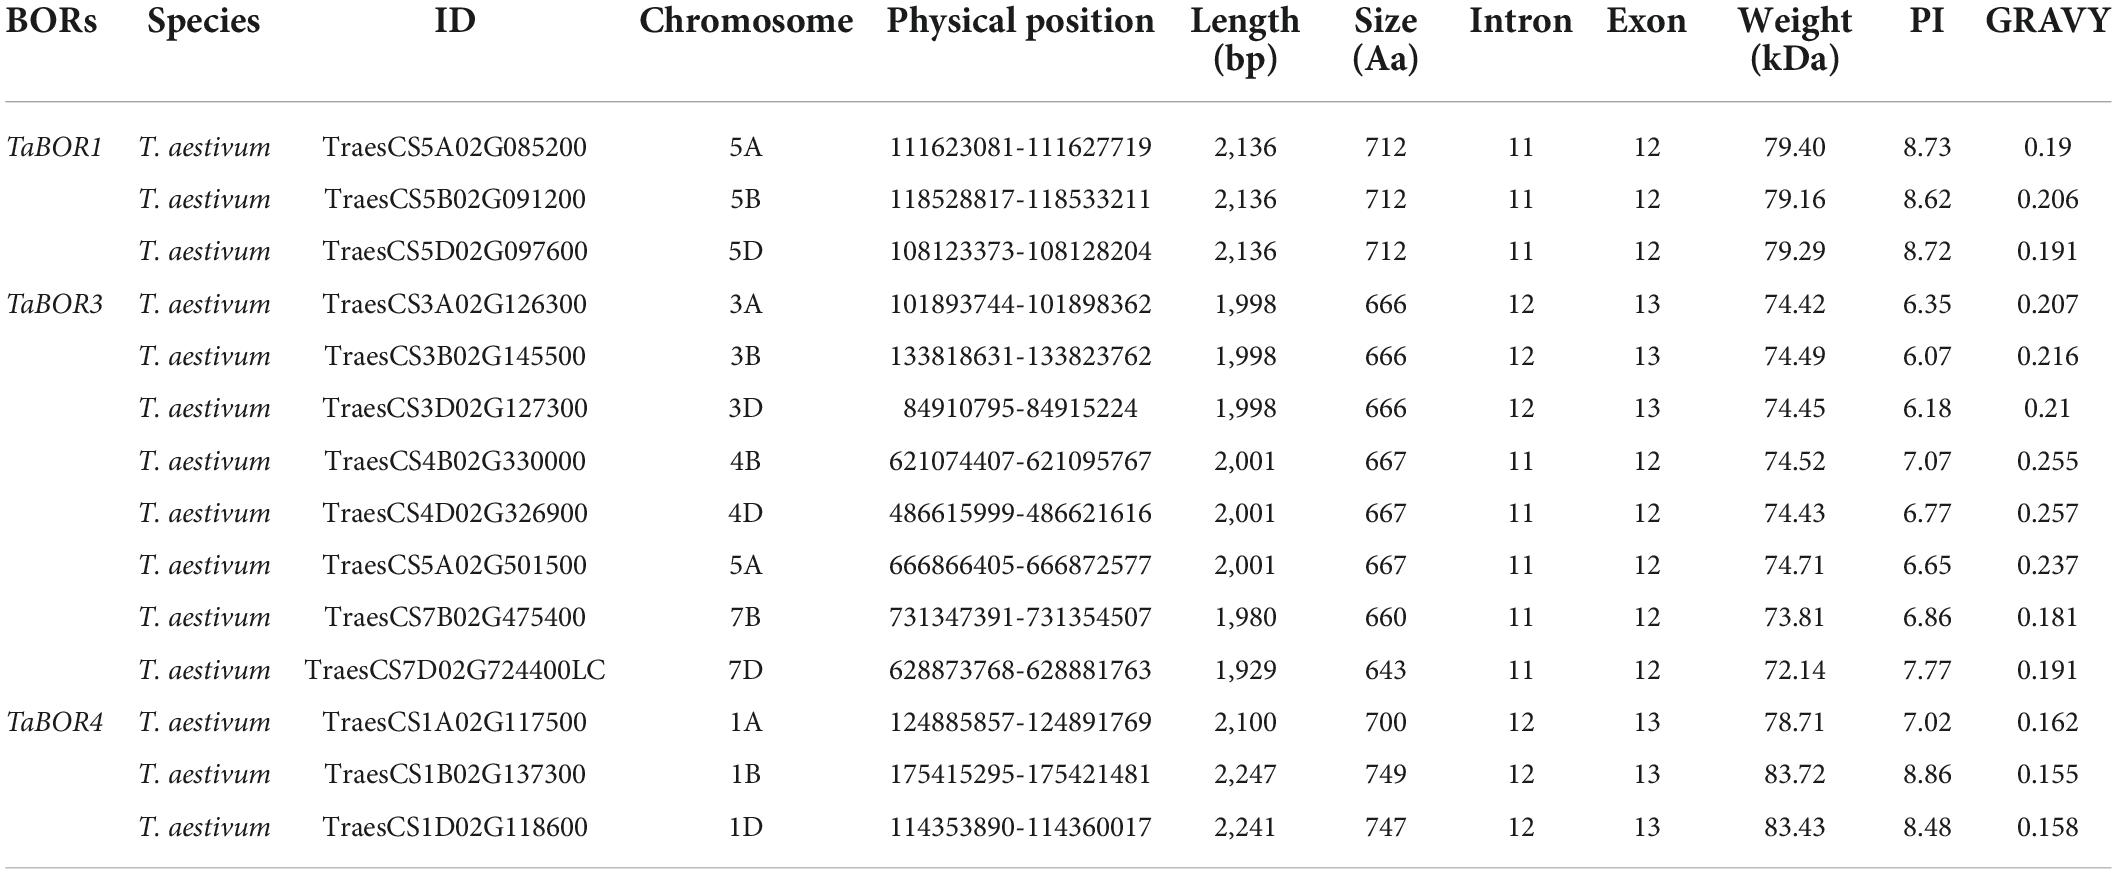
Based on the homologous protein sequences of 7 AtBOR genes (AtBOR1-AtBOR7) in Arabidopsis, B. napus and rice, 14 TaBOR genes were identified using the BLAST program from WheatOmics in common wheat. Detailed information on the BORs is presented in Table 1. Large number variations of encoding amino acids (aa) among BORs were found, with the number ranging from 643 aa (TaBOR3-7D) to 749 aa (TaBOR1-1B). The analysis of the molecular weights and isoelectric points of these genes showed minute variations ranging from 72.14 to 83.72 kDa and 6.07 to 8.86, respectively. The grand average of hydropathicity (GRAVY) was calculated, and all TaBORs were hydrophilic with values ranging from 0.181 to 0.257. Furthermore, 14 TaBOR proteins were located in the cell plasma membrane by TargetP and WoLF PSORT, which were similar to TaBOR1.
Phylogenetic analysis and classification of the BOR family members
Phylogenetic analysis of BOR proteins in monocotyledons and dicotyledons was performed with ClustalW2, and a phylogenetic tree was established with the neighbor-joining method using protein sequences (Figure 1). As shown in the phylogenetic tree, the BORs were classified into monocotyledon and dicotyledon groups. Fourteen TaBOR genes were mainly divided into the TaBOR1, TaBOR3, and TaBOR4 subfamilies, where the TaBOR3 subfamily was the largest, with eight members. The TaBOR1 and TaBOR4 subfamilies each contained three members (Figure 1). TaBOR genes on homologous chromosomes were classified into the same subfamily, suggesting the conservation of BORs in the evolution from ancestors to common wheat. Interestingly, Arabidopsis and B. napus had seven and six BOR gene subfamilies, respectively, while wheat was absent from the BOR2, BOR5, BOR6, and BOR7 subfamilies, indicating that these genes were probably lost after the separation of monocot and dicot plants. The phylogenetic tree indicated that the BORs from common wheat were closely related to OsBOR, with amino acid similarities ranging from 52.6 to 91.3% (Supplementary Table 3). These results suggested that the functions of BORs from common wheat were similar to those of OsBORs as B efflux transporters.
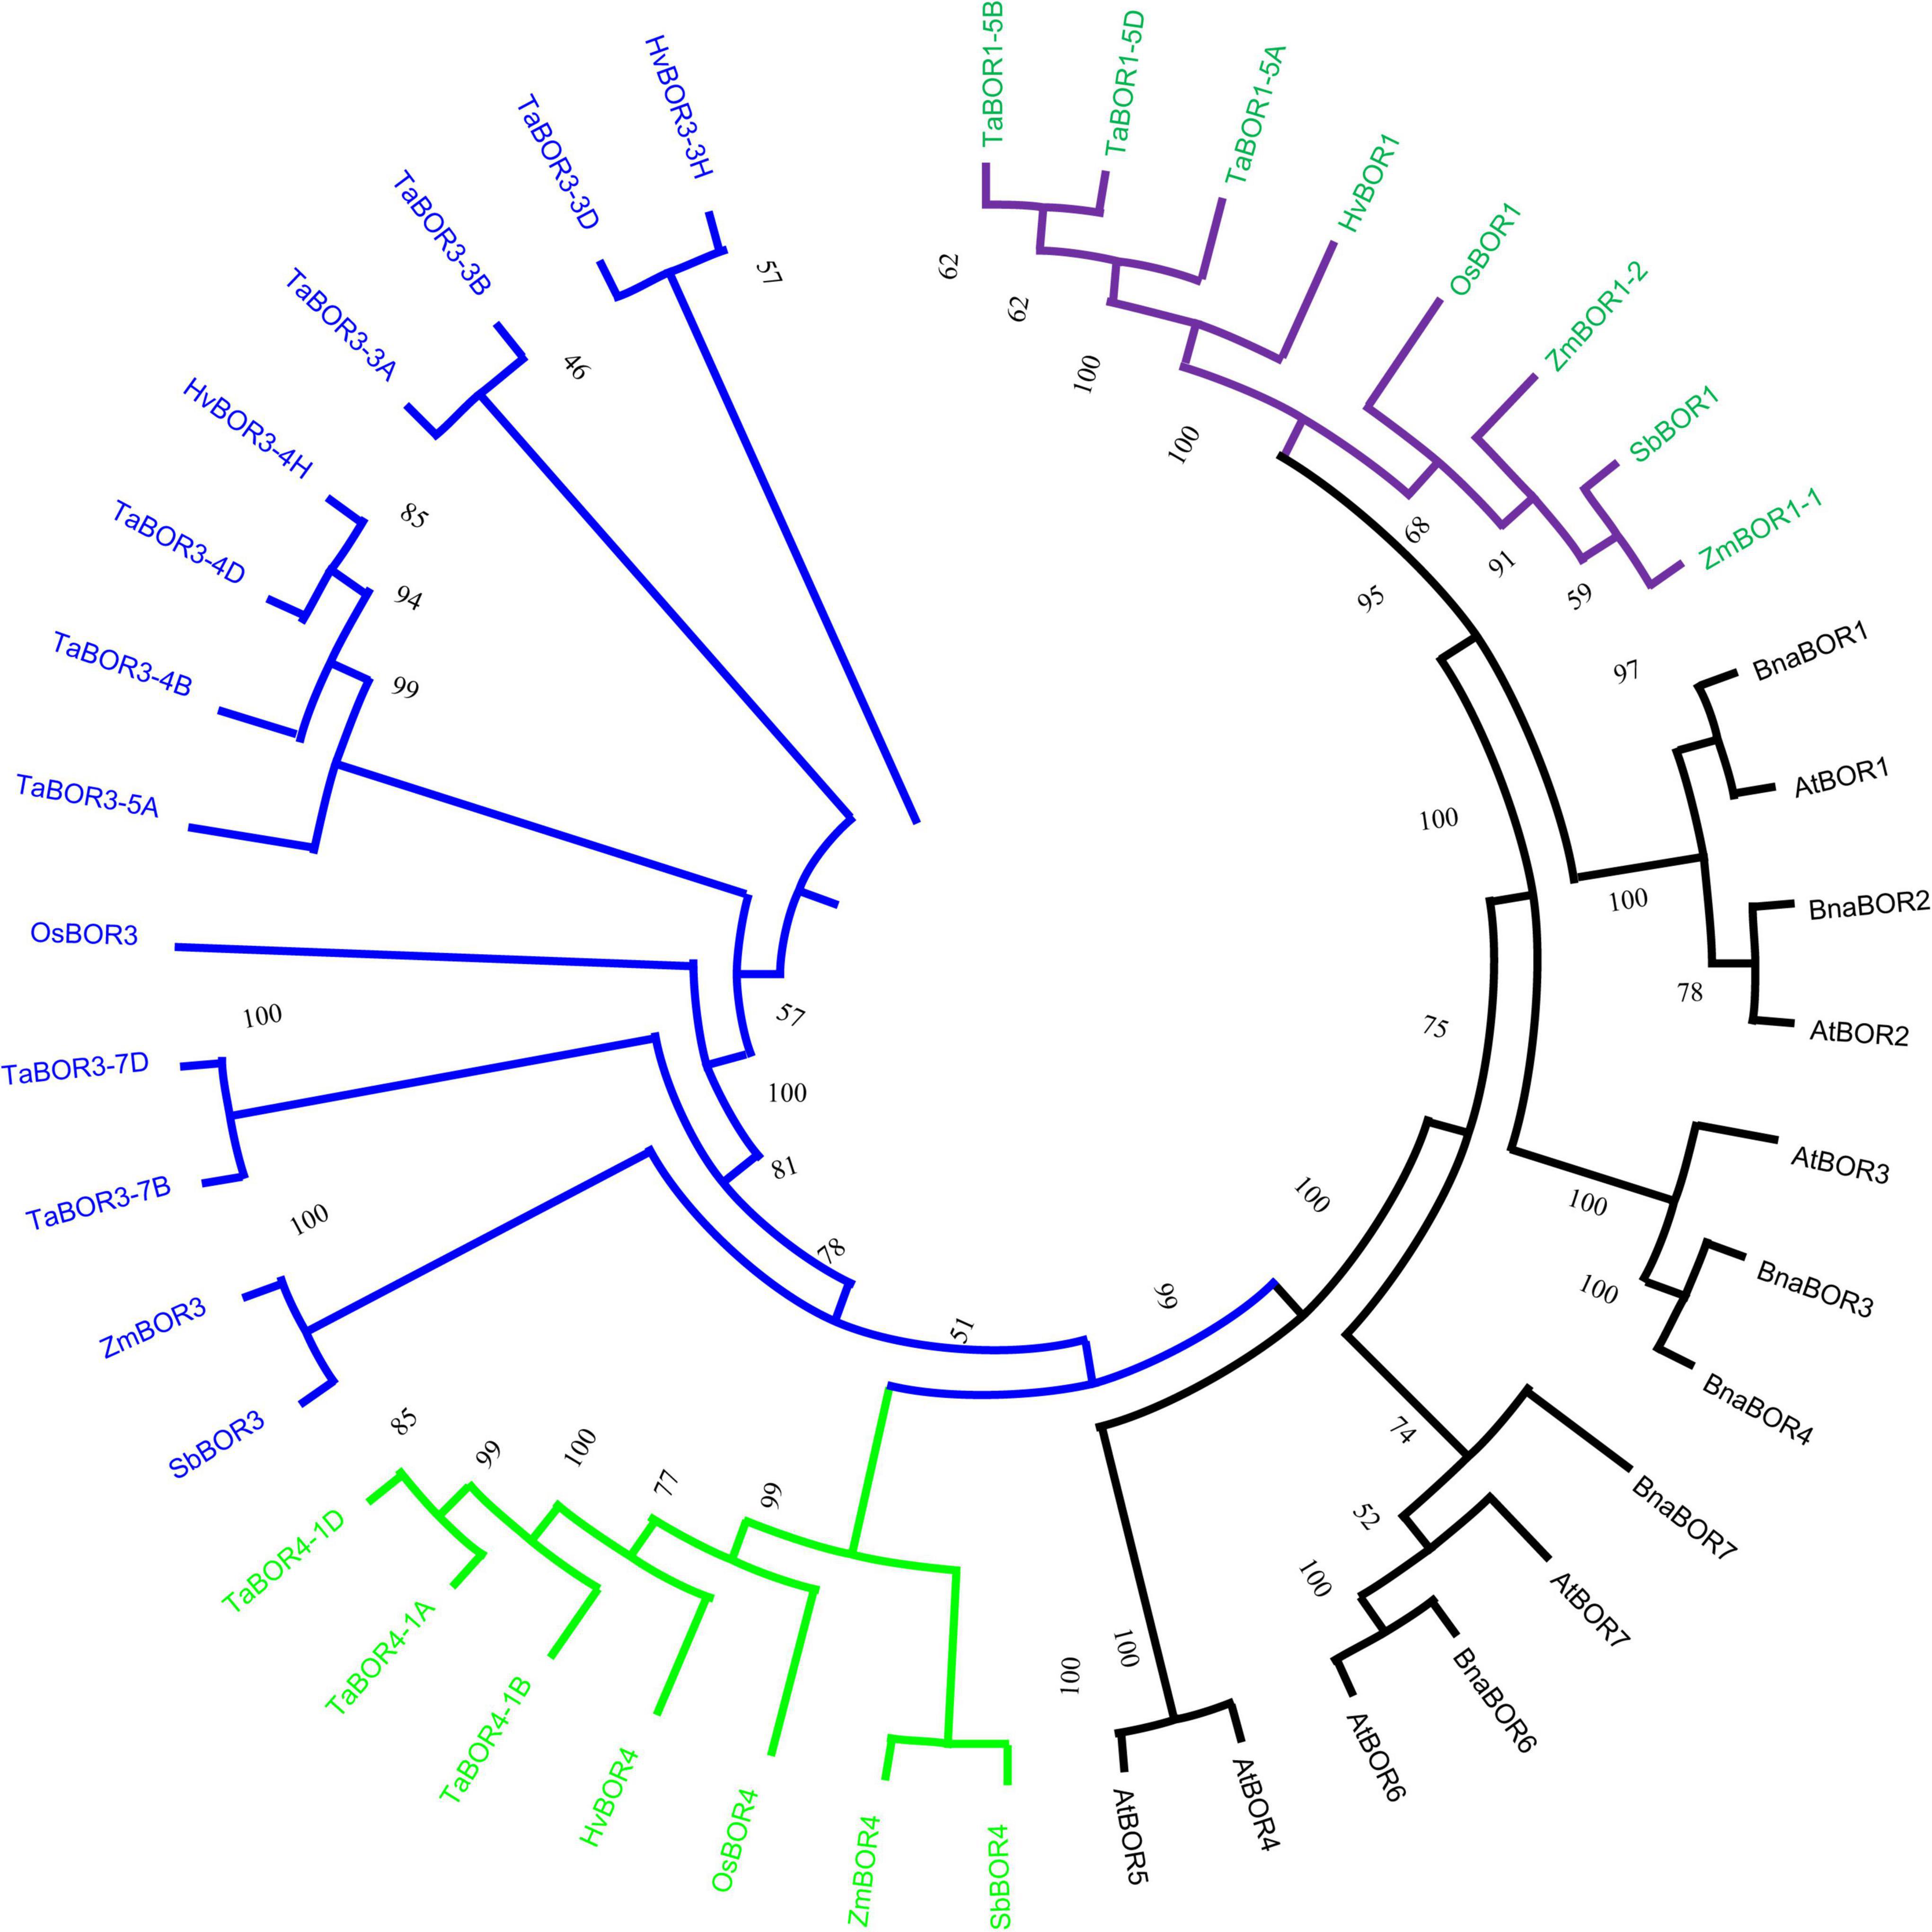
Figure 1. Phylogenetic analysis for BORs in monocot and dicot plants. Subfamilies are marked by branch colors. Green and black font represents the BOR genes in monocot and dicot plants.
Intron/exon organization and conserved motif analysis for BOR genes
The distributions of introns and exons were key for exploring the evolutionary characteristics within the gene families. All 14 TaBORs were used to analyze gene structure by genomic sequence alignment with the coding sequences (Figure 2). The resulting gene structure characteristics revealed that most TaBOR genes were conserved in terms of gene structure. Intron/exon organization indicated that TaBOR family members had 12–14 exons and 11–13 introns in common wheat. TaBOR3-3B, TaBOR3-4B, TaBOR4-1A, TaBOR4-1B, and TaBOR4-1D contained 14 exons and 13 introns, TaBOR3-5A, TaBOR3-4D, TaBOR3-7B, TaBOR1-5B, TaBOR1-5D, and TaBOR3-3D had 13 exons and 12 introns, and the other three genes, TaBOR3-3A, TaBOR3-7D, and TaBOR1-5A, had only 12 exons and 11 introns. Furthermore, the conserved motifs of TaBOR genes were also investigated with MEME. Most genes had 10 conserved motifs (designated motifs 1–10), except TaBOR1-5A, TaBOR1-5B, and TaBOR1-5D, which had 9 motifs, excluding motif 10 (Figure 3). After Pfam domain identification, 5 of 10 motifs, including 1, 2, 3, 4, and 6, constituted the conserved bicarbonate domain (HCO3–), which is a typical structure of the BOR gene.
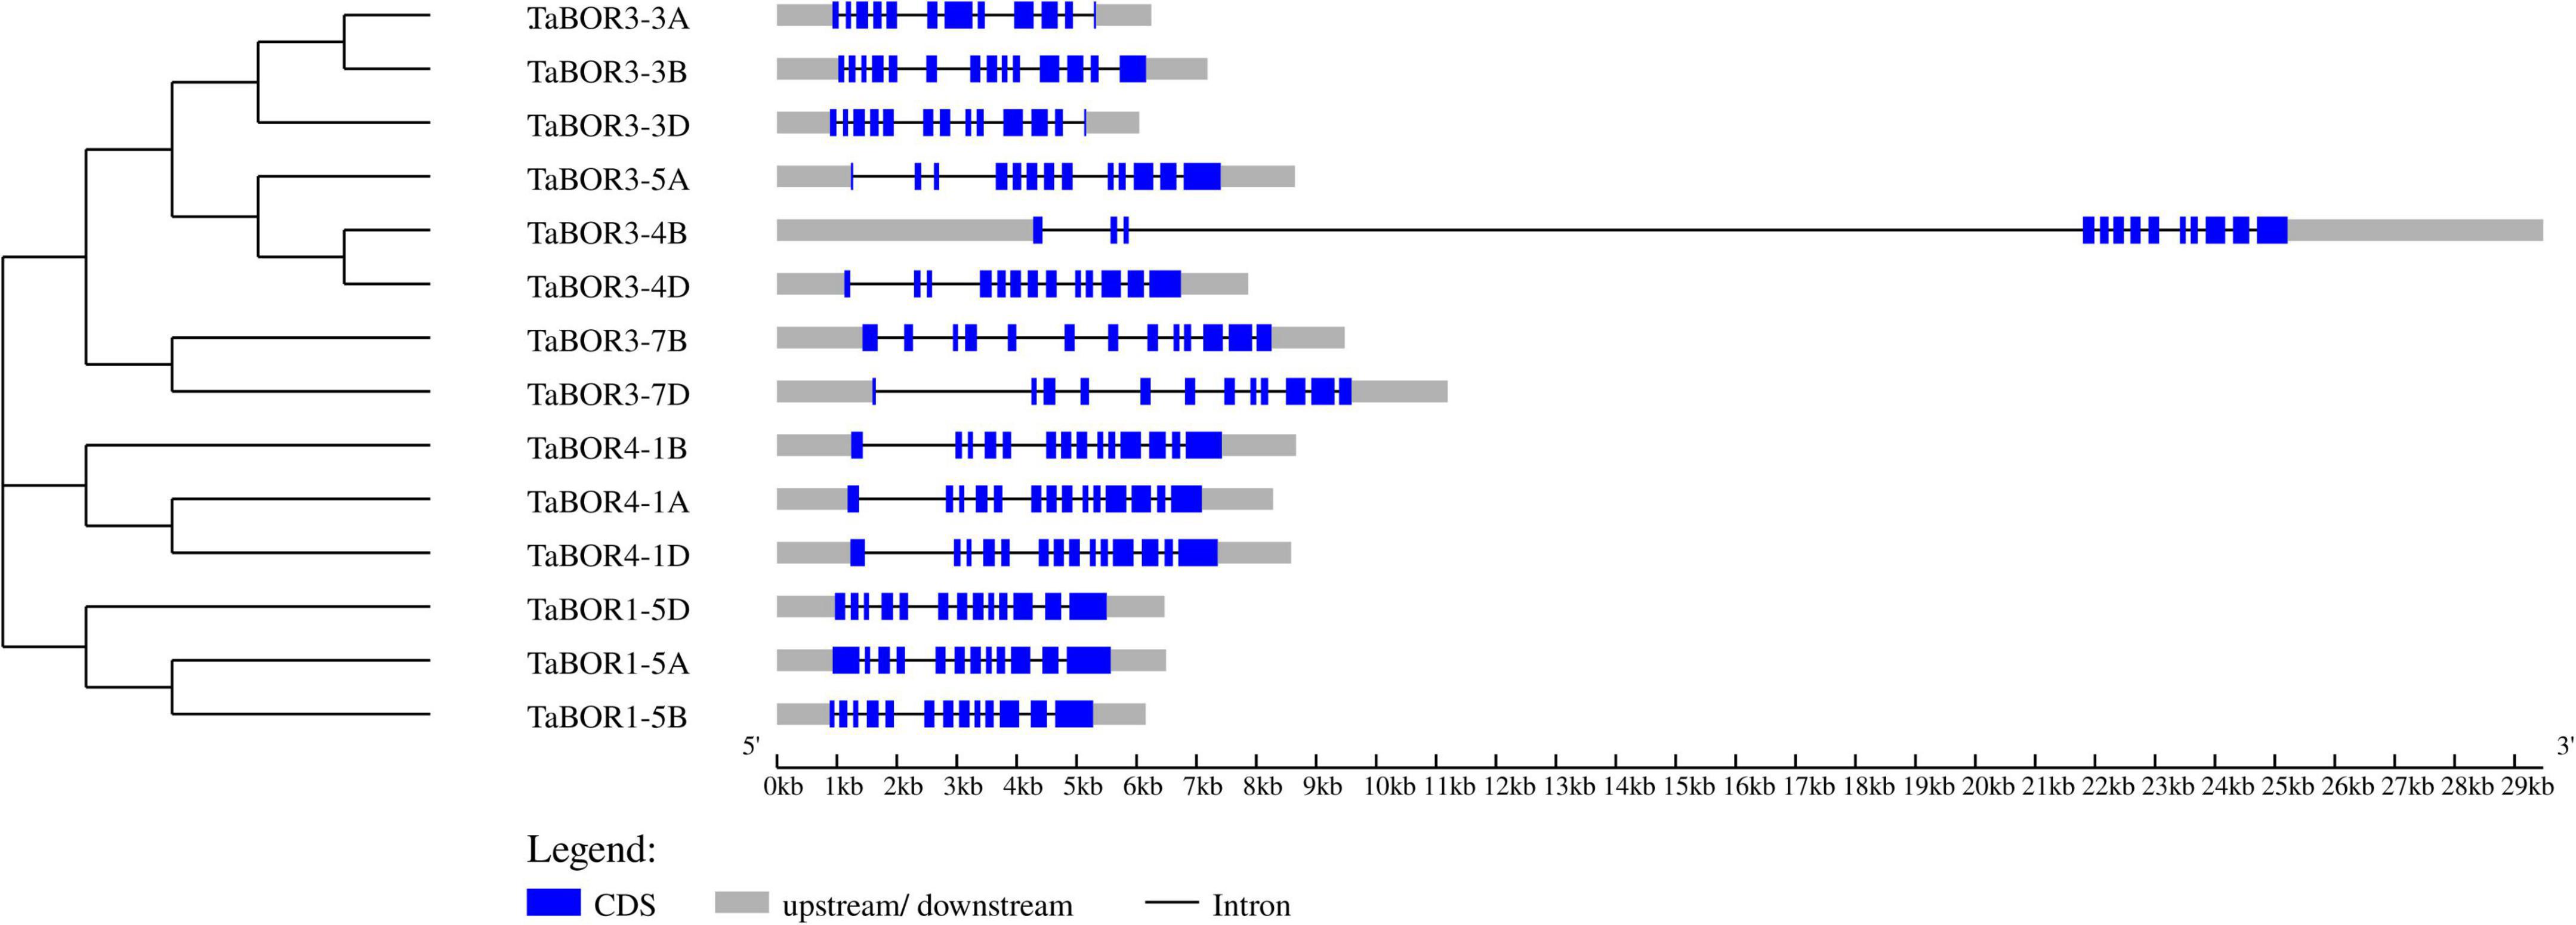
Figure 2. Exon/intron distribution of the TaBOR family members. Blue boxes and gray lines represent exons and introns, respectively. Gray boxes indicate untranslated regions (UTRs).
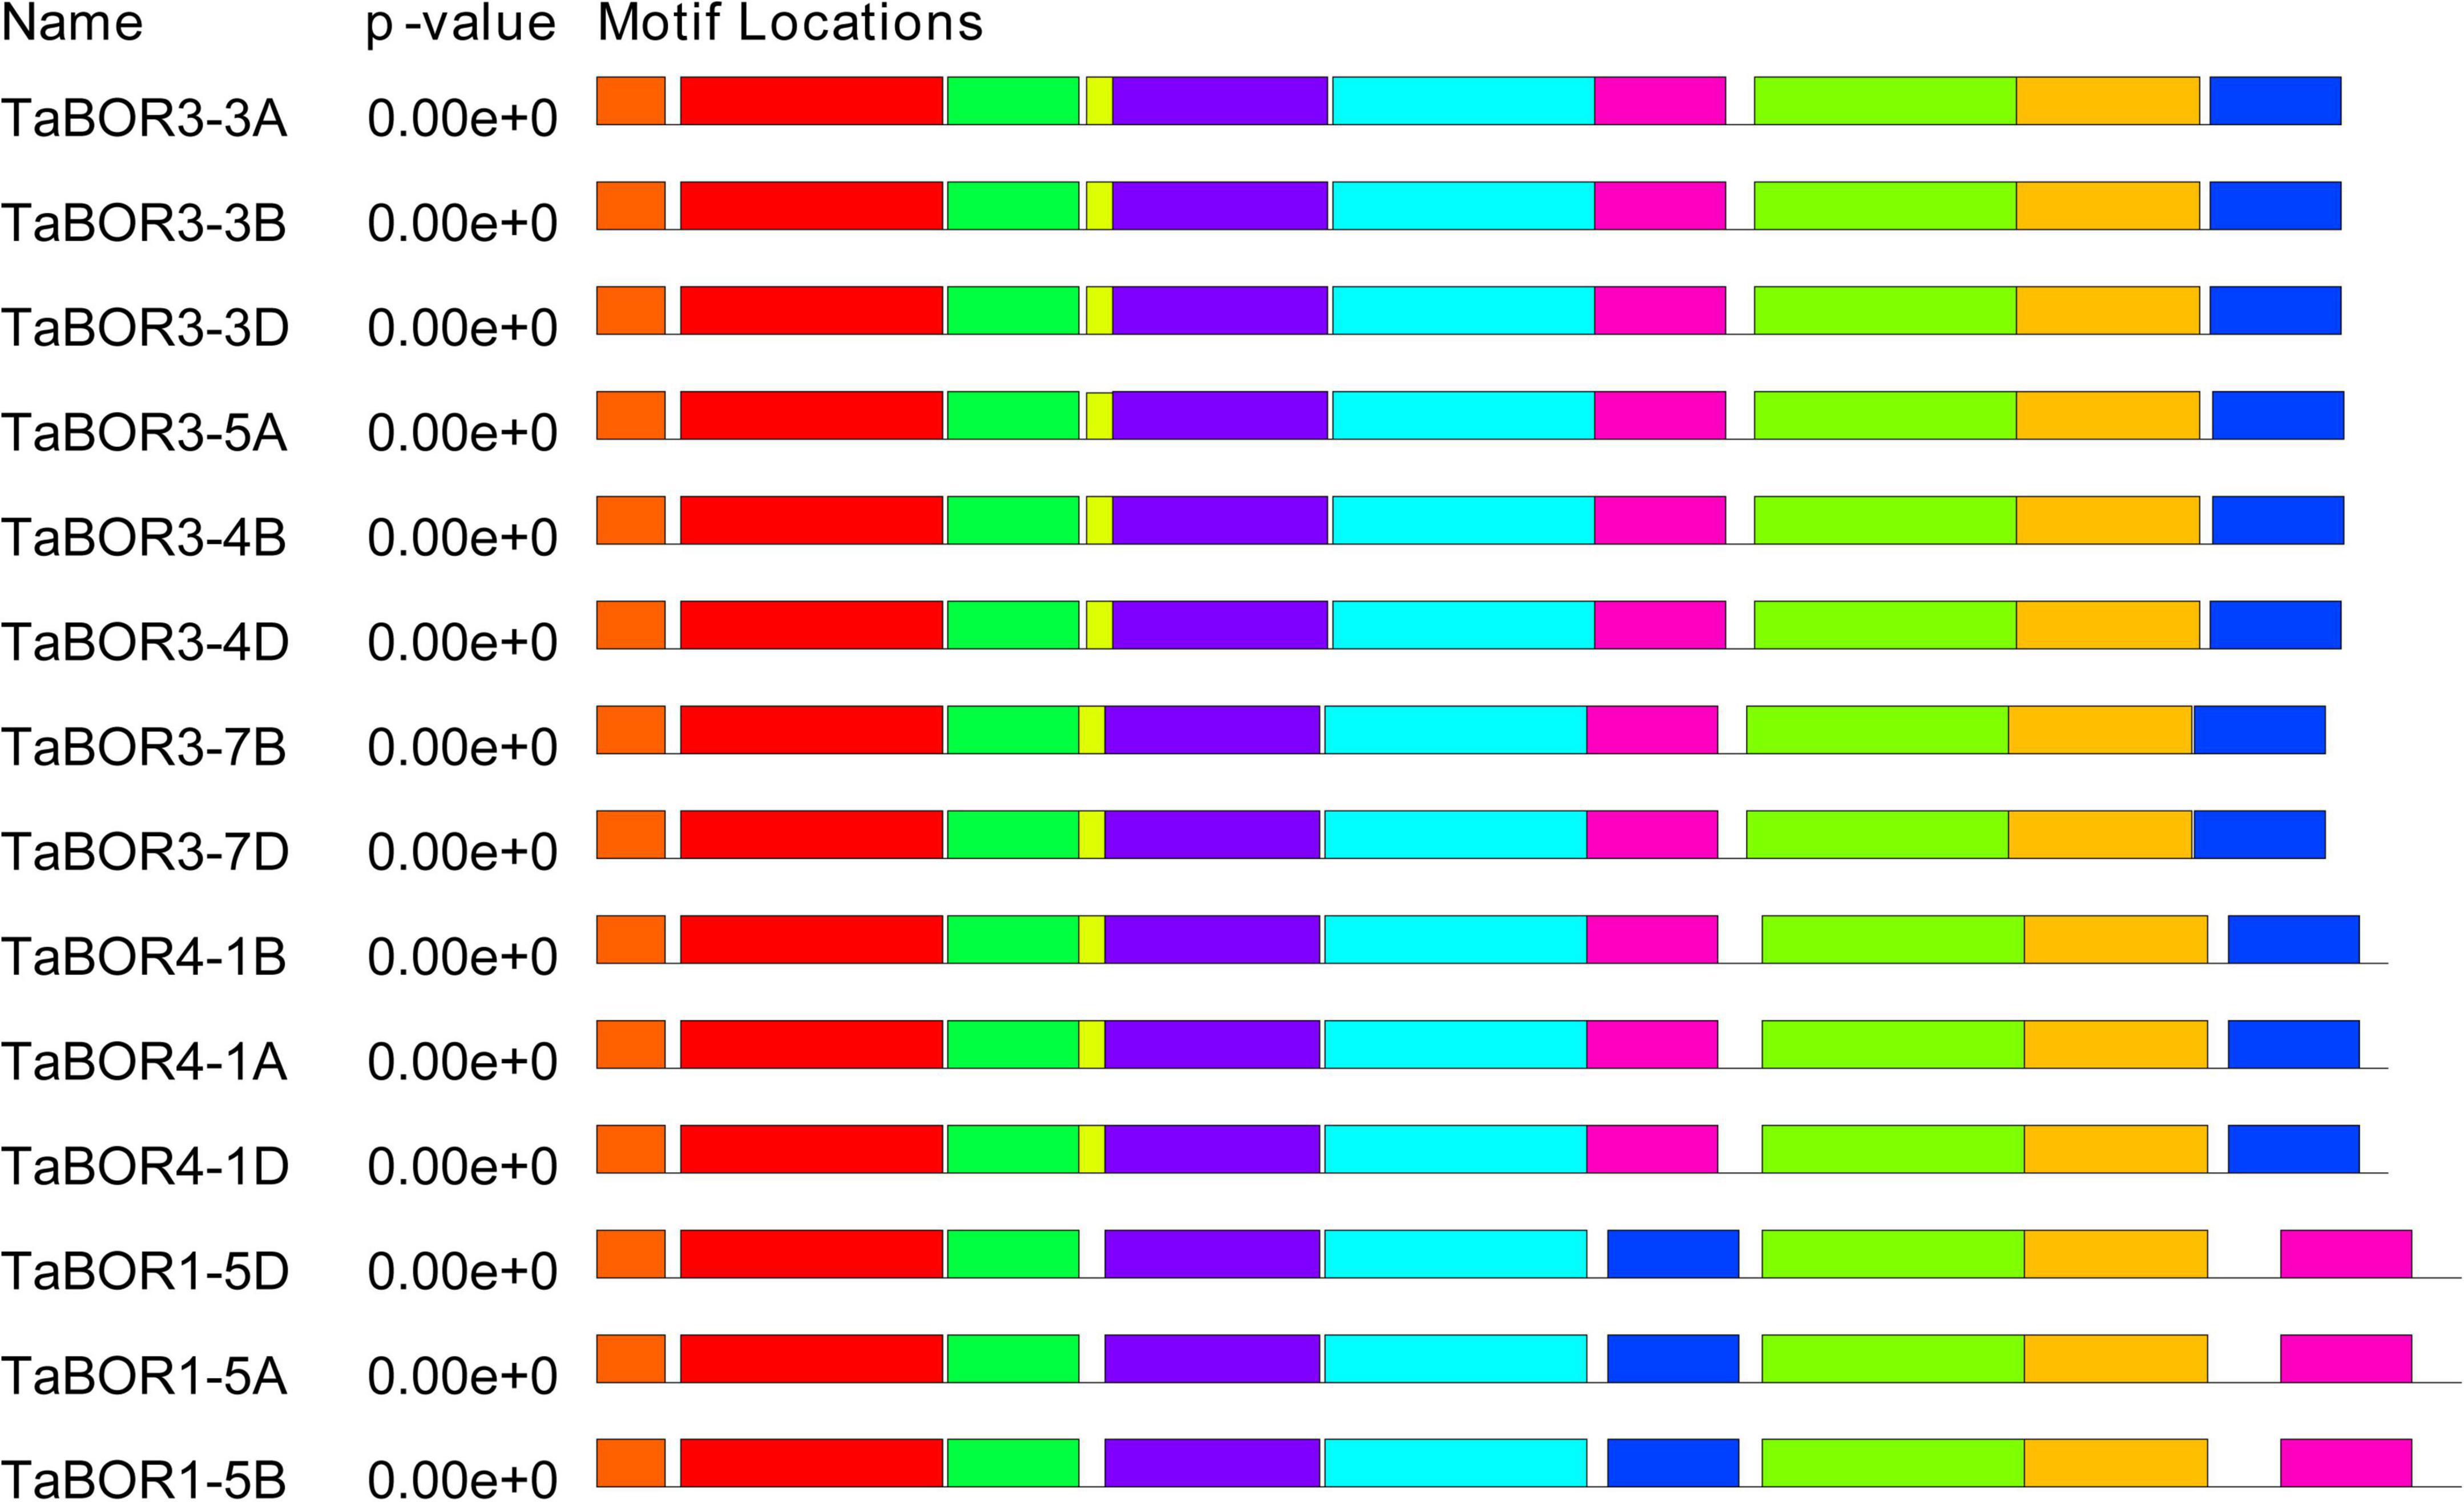
Figure 3. Investigation of conserved motifs in TaBOR proteins by MEME. Different colors represent different motifs.
Chromosome location of BOR genes
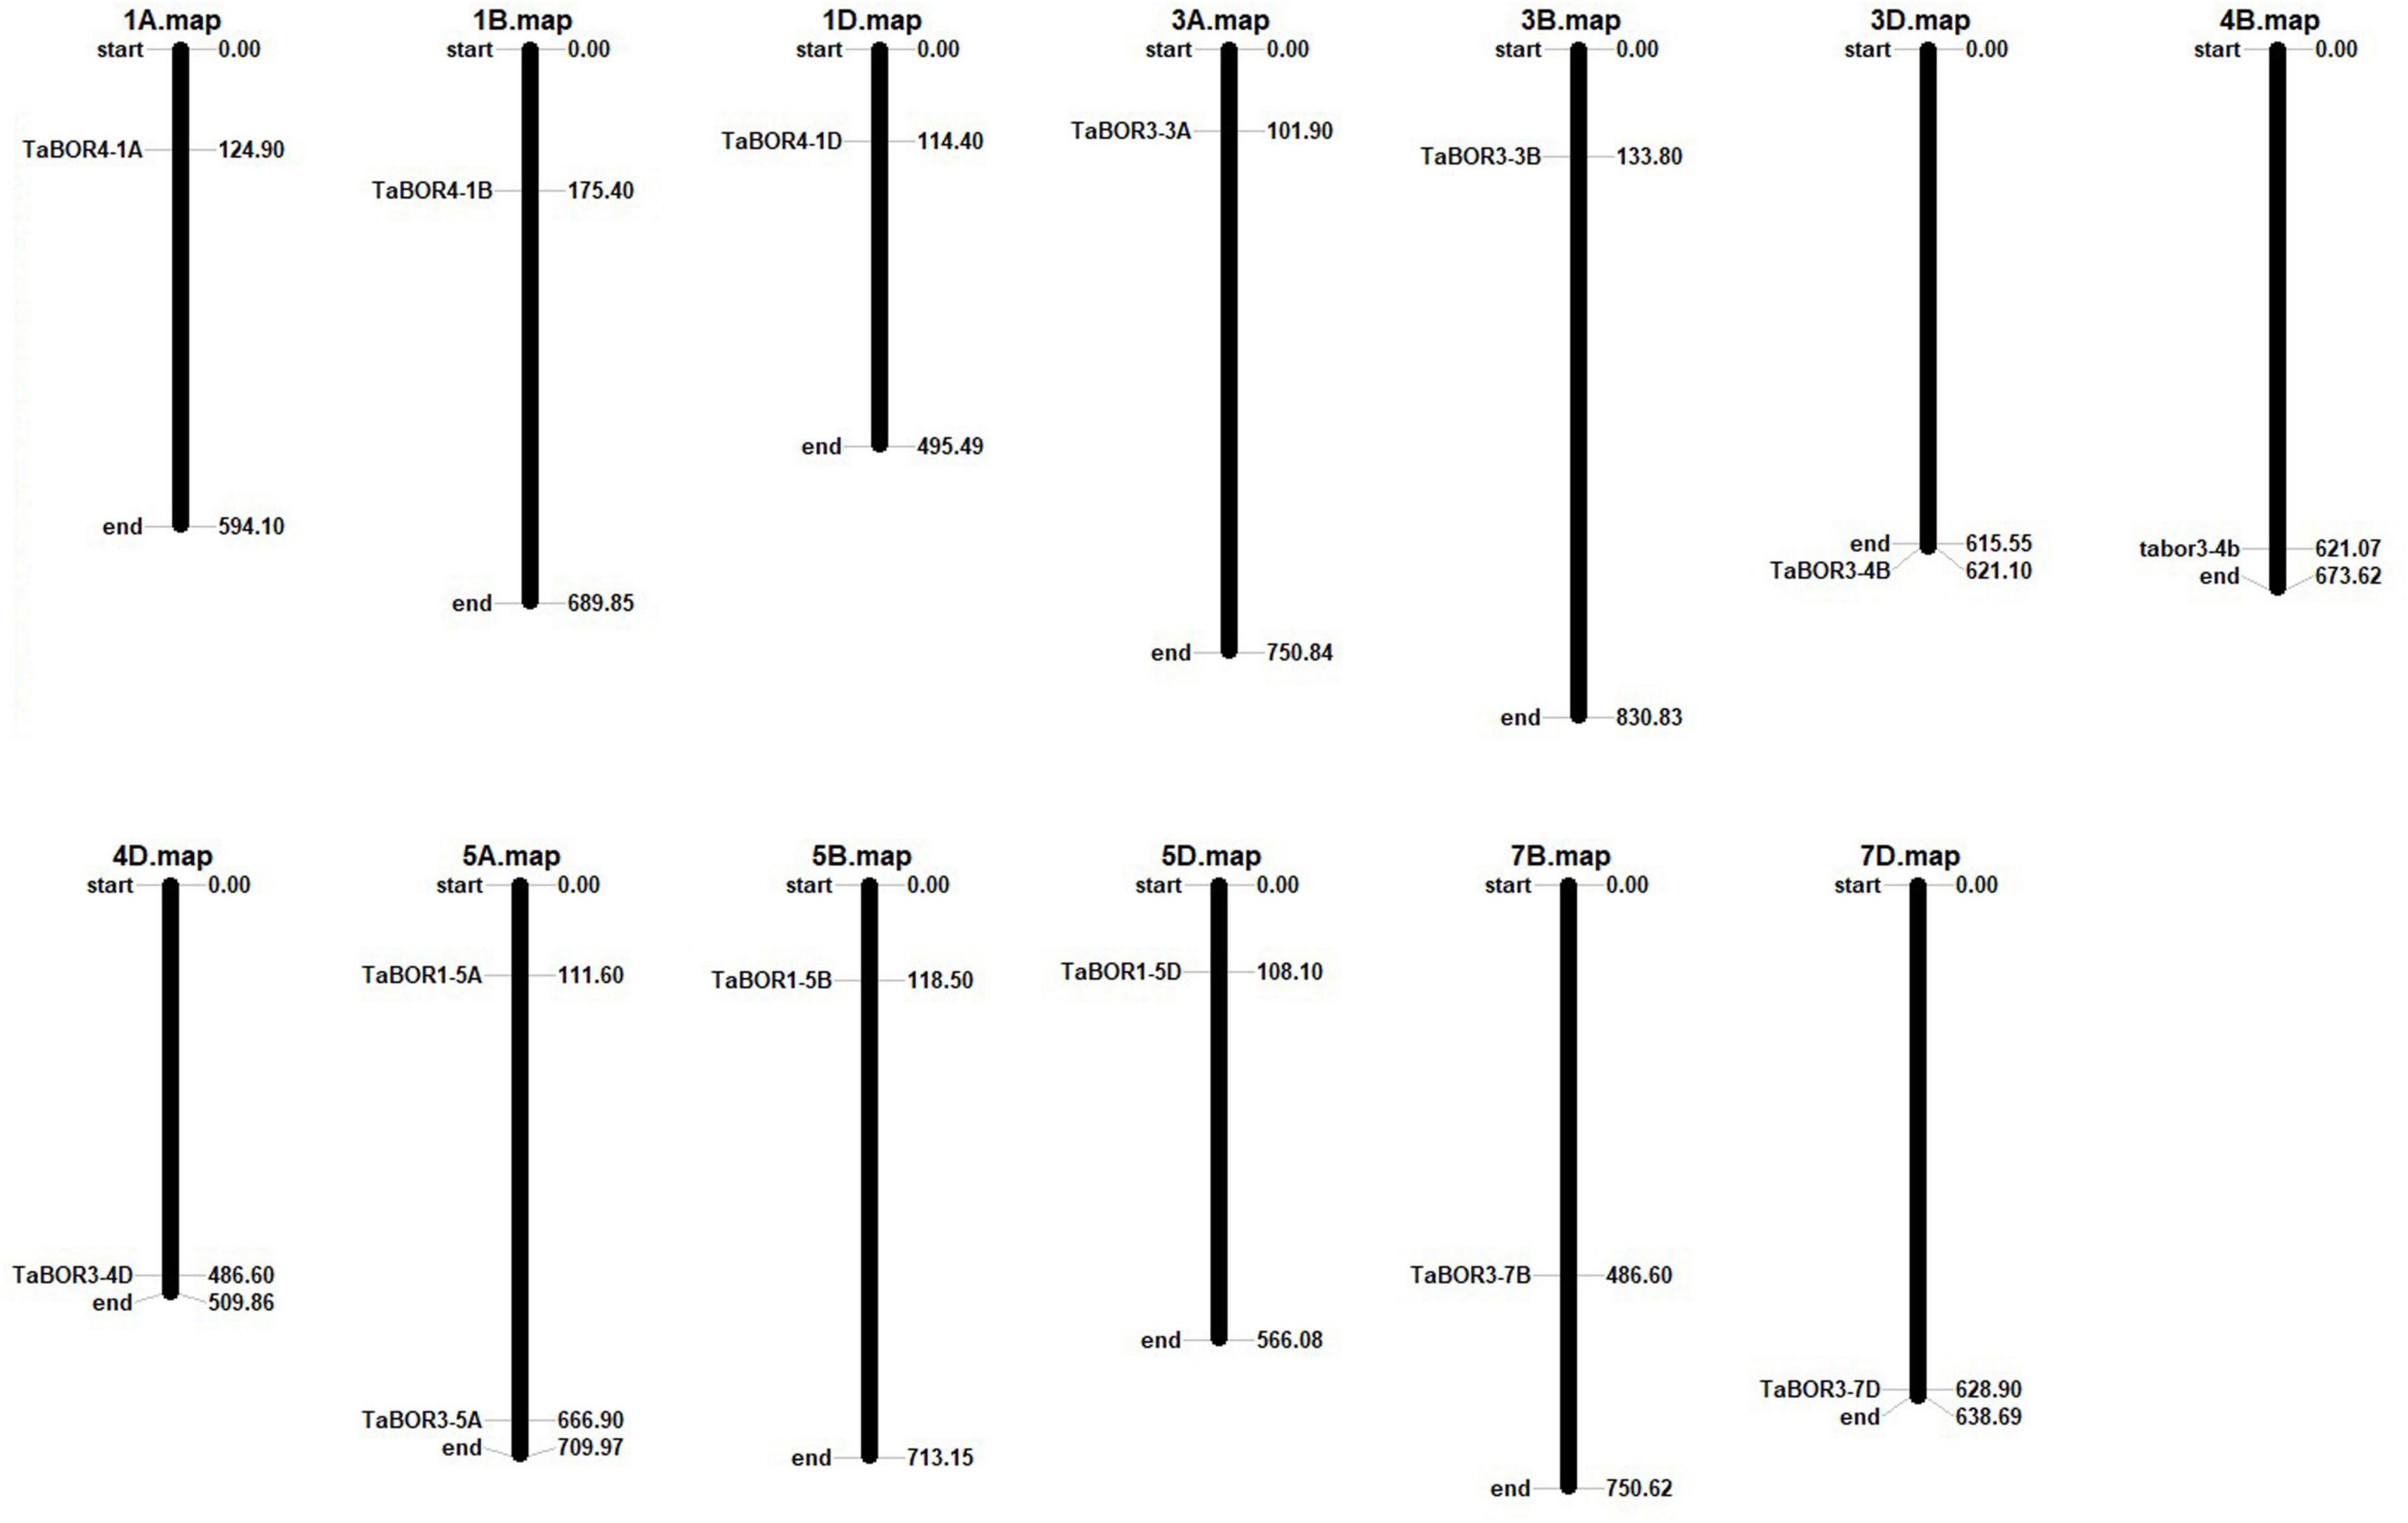
Based on the physical locations of the BOR genes, the identified TaBOR family members were assigned to the corresponding chromosomes by Mapinspect software. All TaBORs were located on chromosome regions that were related to high rates of recombination. The TaBOR genes were mainly present in the first, third, fifth and seventh homologous groups (Figure 4). Among all TaBORs, four genes (TaBOR4-1A, TaBOR3-3A, TaBOR3-5A, and TaBOR1-5A), five genes (TaBOR4-1B, TaBOR3-3B, TaBOR3-4B, TaBOR1-5B, and TaBOR3-7B) and five genes (TaBOR4-1D, TaBOR3-3D, TaBOR3-4D, TaBOR1-5D, and TaBOR3-7D) were distributed on the AA, BB, and DD genomes, respectively. Most chromosomes distributed only one TaBOR gene except chromosome 5A. Both TaBOR3-5A and TaBOR1-5A were located on chromosome 5A.
Promoter analysis of TaBOR genes
A total of 15 CAREs related to the auxin response, methyl jasmonate (MeJA), abscisic acid response, light responses, defense, and stress responses were identified in the TaBOR gene family (Figure 5A). More than ten CAREs were identified for each TaBOR gene. The number of CAREs involved in hormones (IAA, SA, GA, MeJ, and ABA) was the highest (Figure 5B), and at least three CAREs related to light responsiveness were also identified in the promoter of each TaBOR gene. In addition, more than half of the TaBOR genes contained abiotic stress (drought, defense, low temperature, anoxic, salicylic acid) elements. CAREs related to seed-specific regulation were also detected in some of the TaBOR genes. These results indicated that TaBORs played key roles in the processes of wheat growth, development and response to external environments.
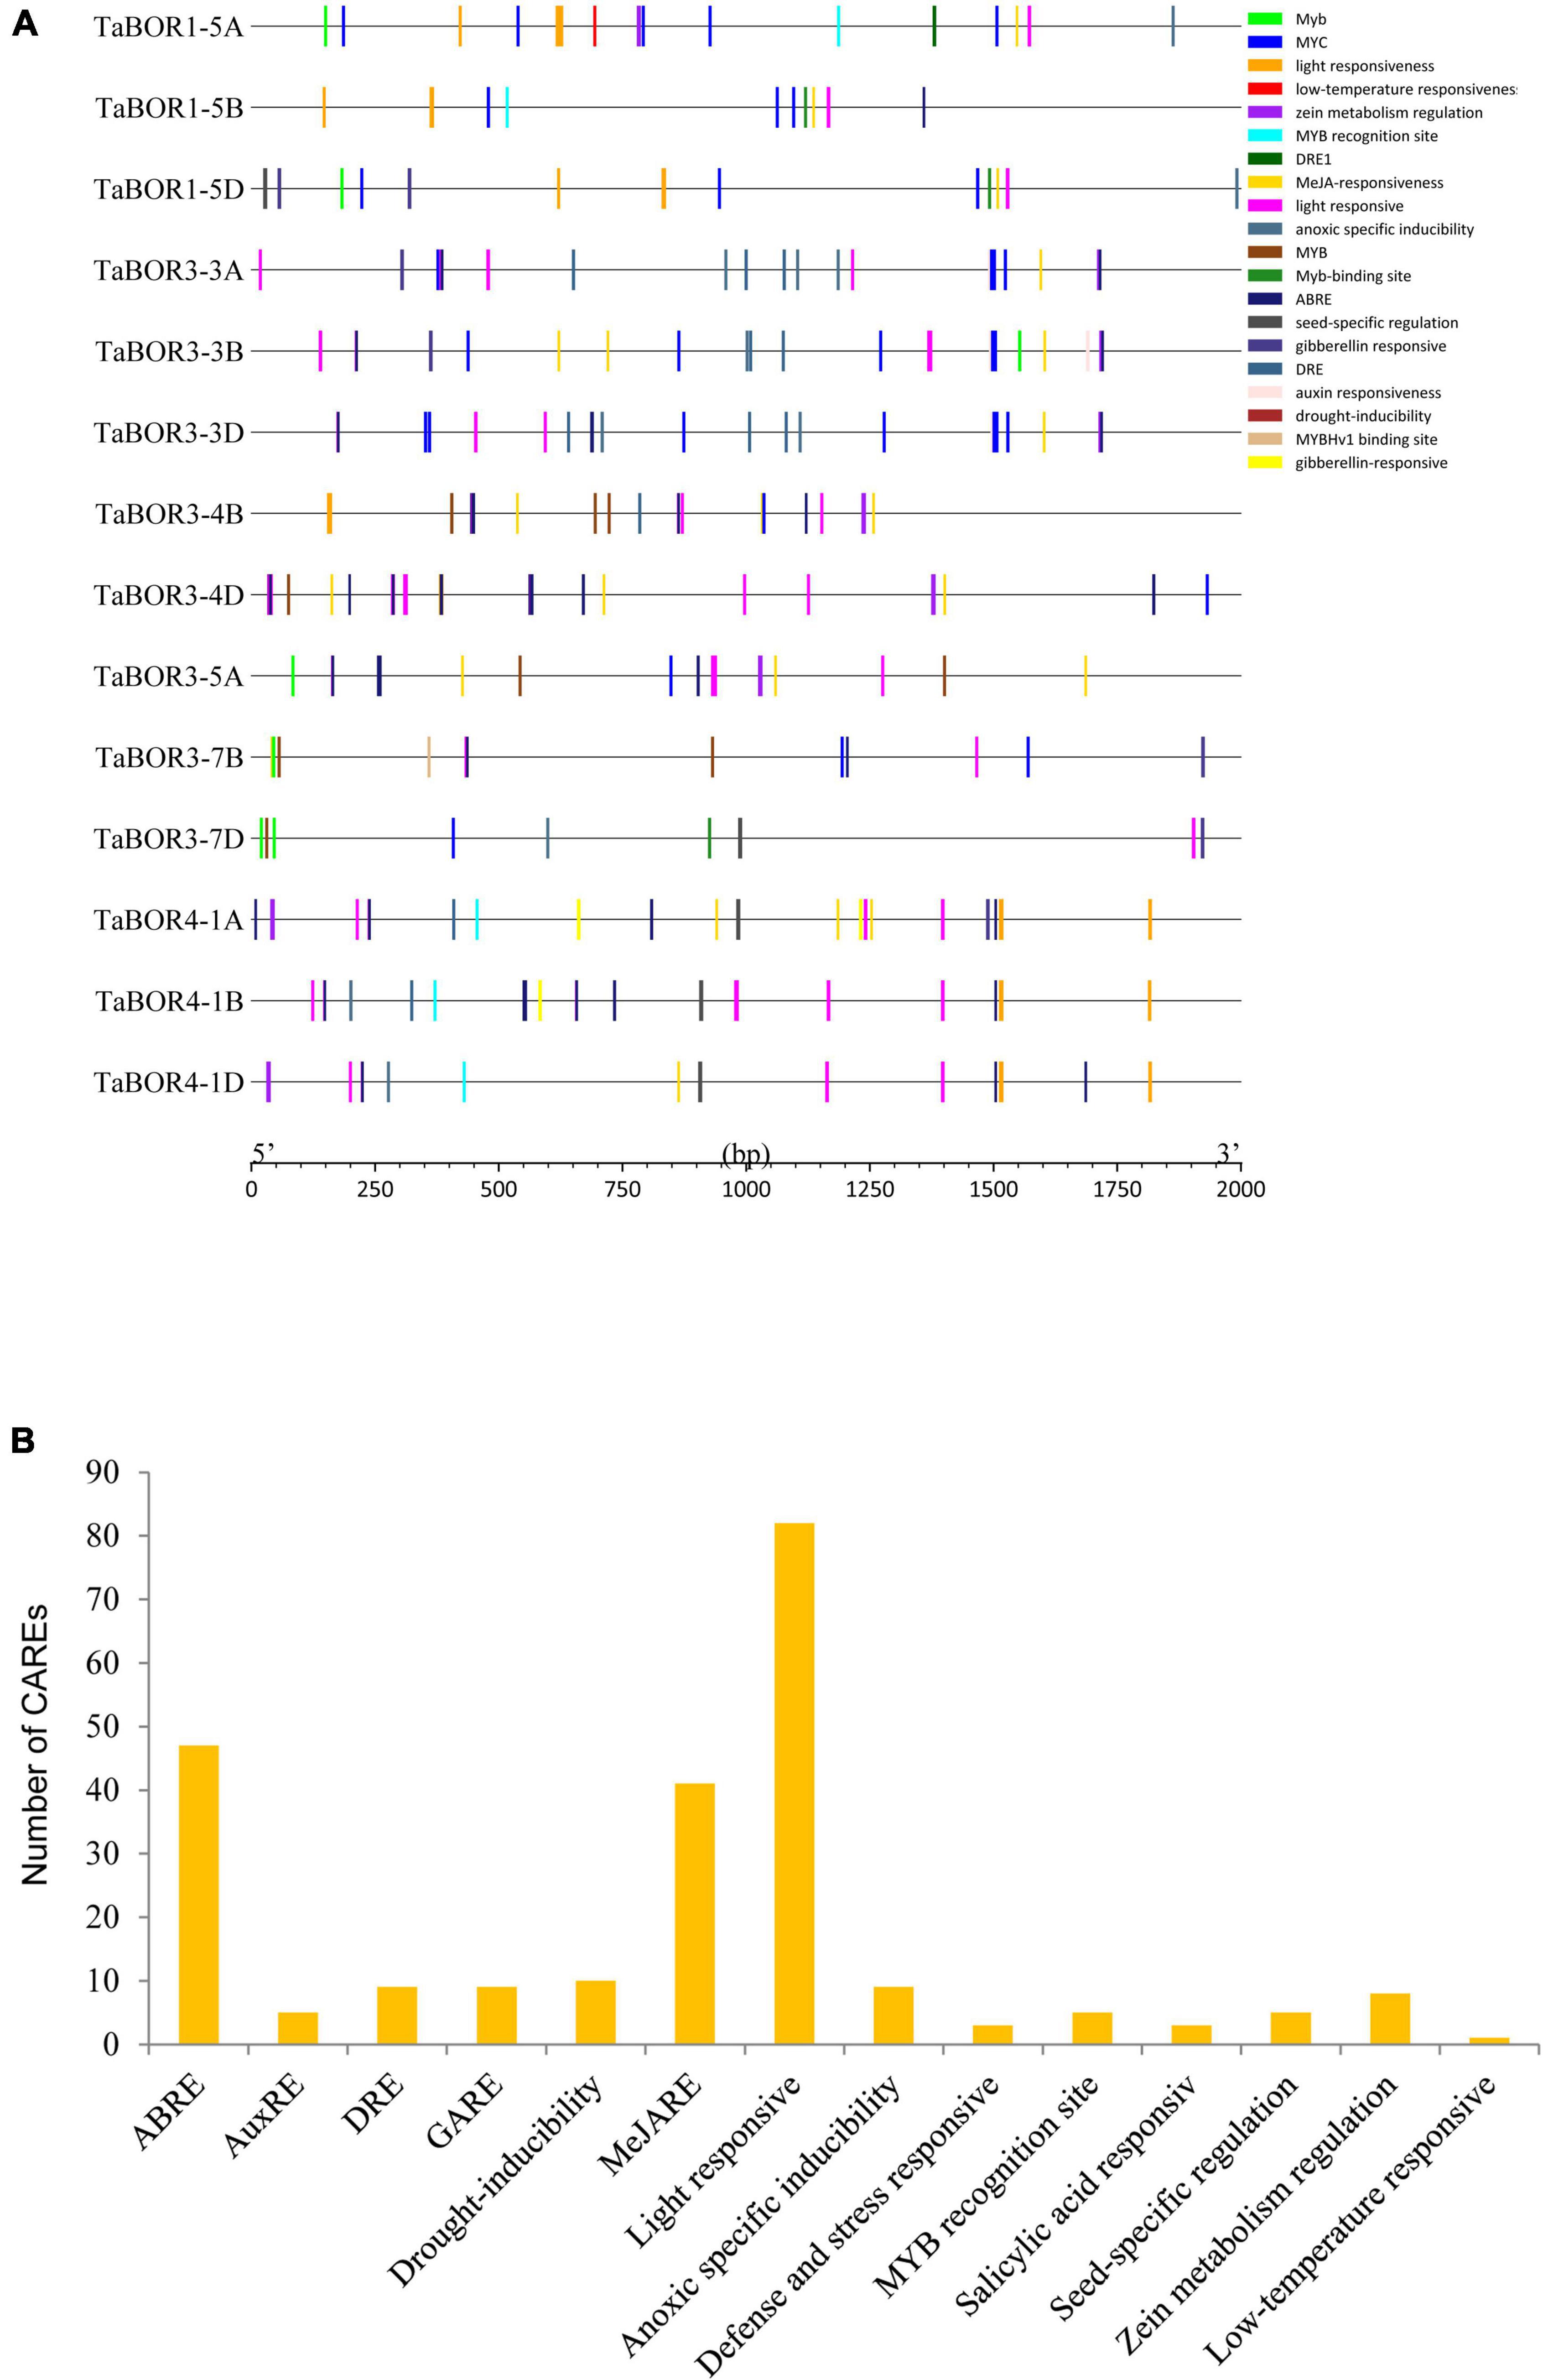
Figure 5. Cis-element identification in TaBOR promoters. (A) Elements are indicated by different colors. (B) Most commonly occurring CAREs in TaBORs.
Gene ontology enrichment analysis
All TaBOR genes were assigned GO terms using AgriGO, and eight terms, including four BP, two CC, and two MF terms, were enriched (Figure 6). In the biological process category, TaBOR genes were enriched in the terms transmembrane transport (GO: 0055085 and GO: 0035445) and ion homeostasis (GO: 0050801 and GO: 0015698). In the cellular component category, TaBORs were enriched in the integral component of the membrane (GO: 0016021 and GO: 0005886), which was consistent with the prediction of subcellular localization by TargetP and WoLF PSORT. In the molecular function category, all 14 TaBOR genes were involved in inorganic anion exchanger activity (GO: 0005452 and GO: 0046715). The GO term enrichment suggested that TaBOR genes played key roles in transmembrane transport and inorganic anion exchange.
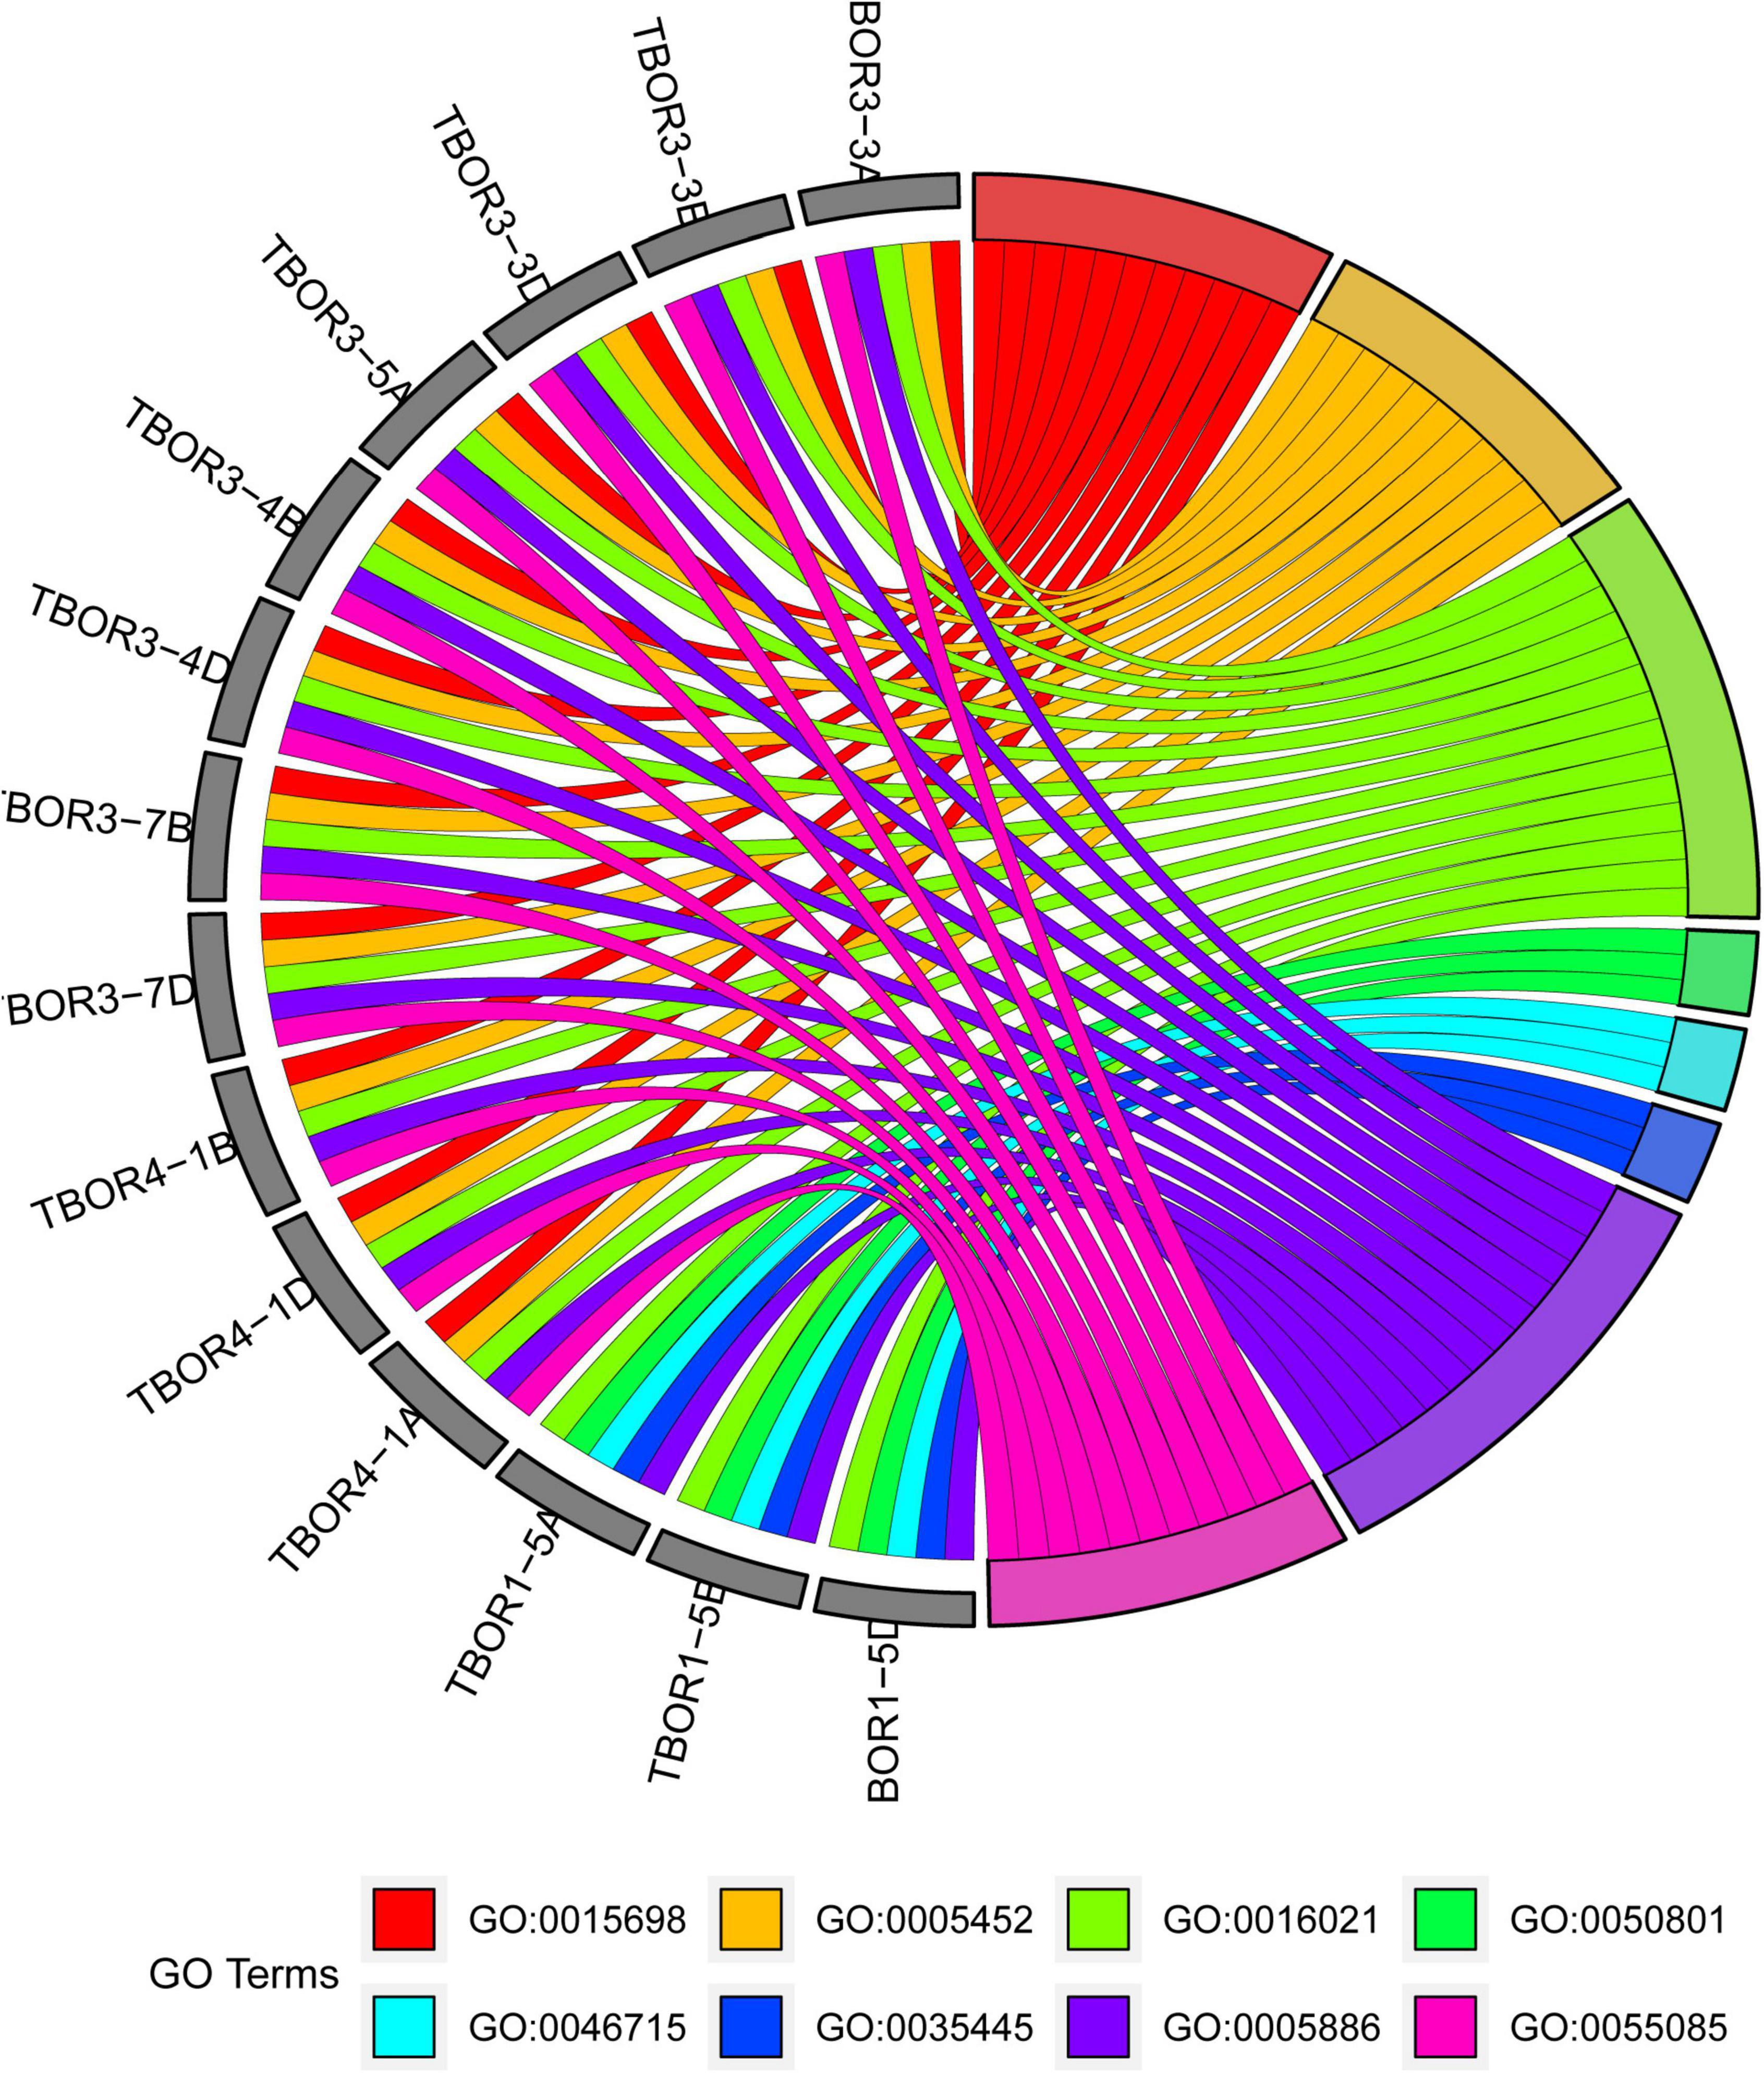
Figure 6. GO enrichment results. GO0015698: inorganic anion transport, GO0005452: inorganic anion exchanger activity, GO0016021: integral component of membrane, GO0050801: ion homeostasis, GO0046715: active borate transmembrane transporter activity, GO0035445: borate transmembrane transport, GO0005886: plasma membrane, GO0055085: transmembrane transport.
Expression patterns of TaBOR family members
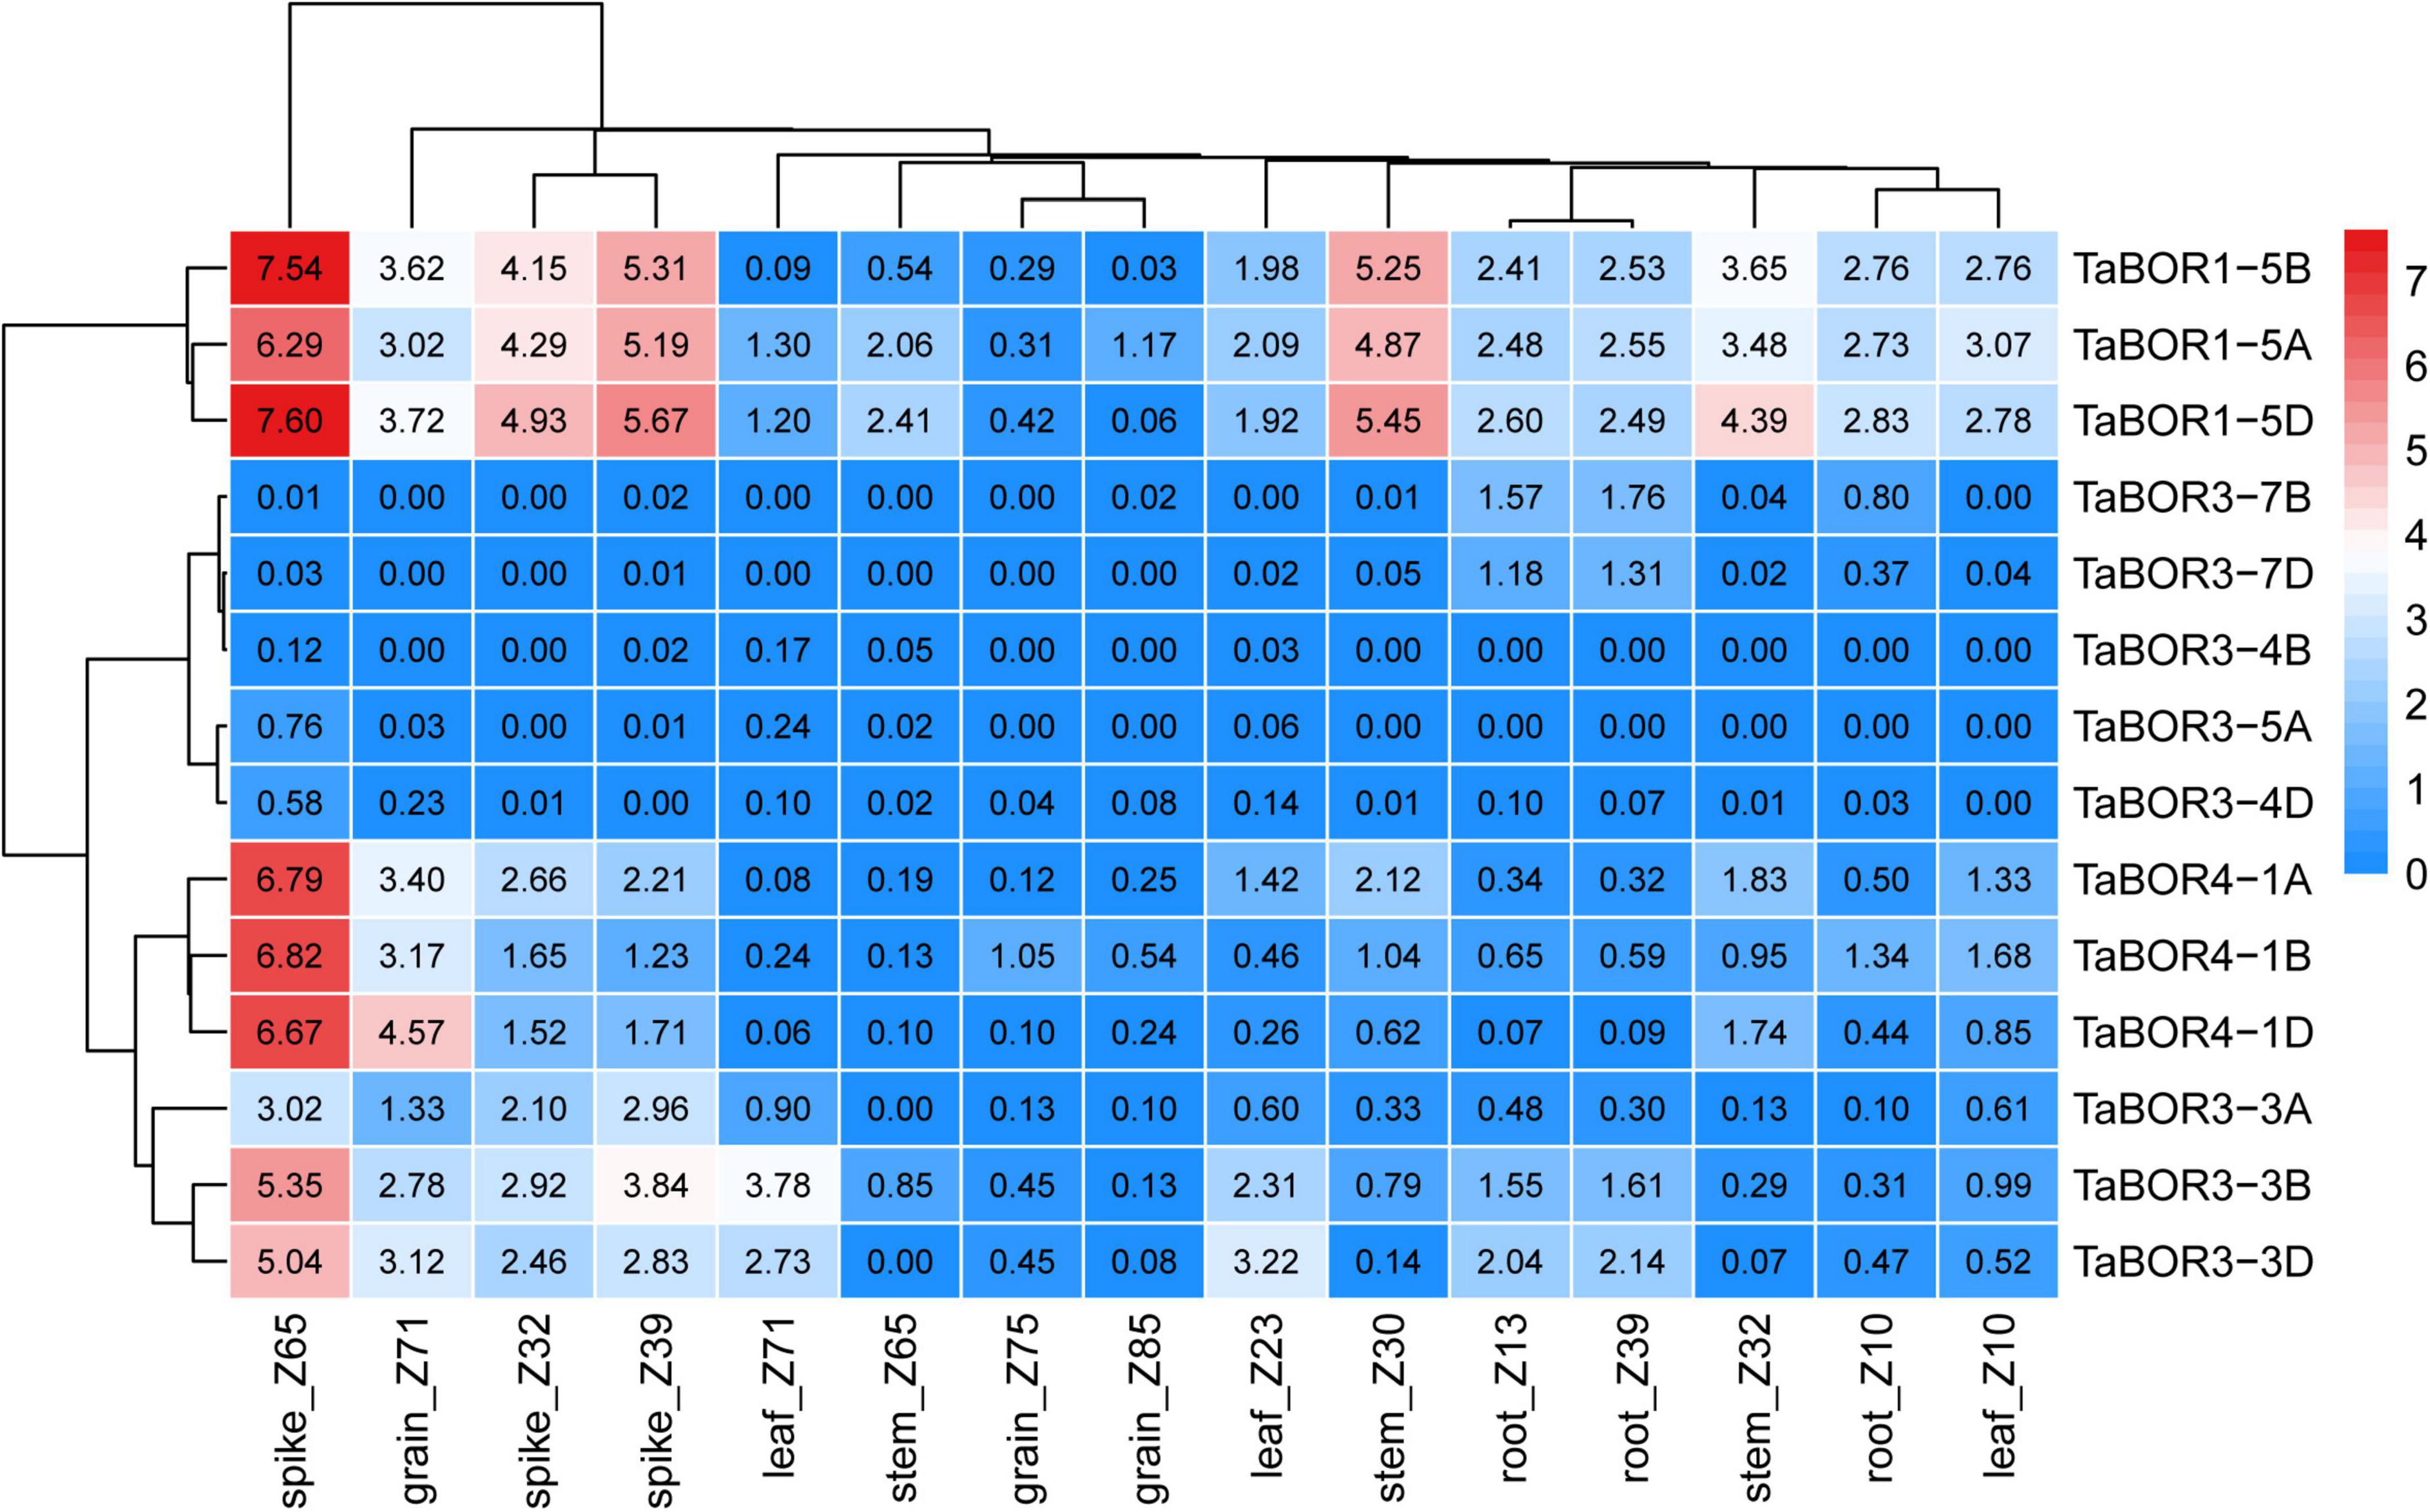
To reveal the expression profiles of TaBOR family members in different tissues, the expression data from the three different developmental stages of five tissues were retrieved from wheatomic,13 and the transcripts per million (TPM) values were used to draw heatmaps (Figure 7). The expression levels indicated that TaBOR genes presented diverse expression patterns in the various tissues. According to the clustering of expression levels, TaBOR genes can be divided into four categories. Both TaBOR1-5D and TaBOR1-5A were highly expressed in five tissues, and TaBOR1-5B displayed higher expression in the spike and root at three stages. In addition, TaBOR1-5B also exhibited higher expression at the grain_z71, leaf_z10, leaf_z23, stem _z30, and stem_32 stages but lower expression at the leaf_z71, stem_z65, grain_z71, and grain_z85 stages. TaBOR4-1A, TaBOR4-1B, TaBOR4-1D, TaBOR3-3A, TaBOR3-3B, and TaBOR3-3D were elevated in the spike at three stages and at grain_z71 points, while they were reduced at other points. The expression levels of TaBOR3-7B and TaBOR3-7D were upregulated in roots at three stages. In all five tissues, TaBOR3-5A, TaBOR3-4B, and TaBOR3-4D showed lower expression at three time points. These results demonstrate that the expression patterns of TaBORs were variable in different tissues at different stages.
Distinct expression patterns of TaBOR family members under B conditions
To reveal the responses of TaBORs to different B conditions at the seedling stage, RT–qPCR was carried out with genome-specific primer sets of 12 TaBOR genes. Three distinct expression patterns of TaBOR family members were detected in common wheat. Three genes (TaBOR1-5A, TaBOR1-5B, and TaBOR1-5D) were mainly expressed under low B and showed much higher expression in roots than in shoots (Figure 8A). TaBOR3-4D and TaBOR3-7B were upregulated by low B and high B in roots, respectively (Figure 8B). The other seven genes (TaBOR3-3A, TaBOR3-3B, TaBOR3-3D, TaBOR4-1A, TaBOR4-1B, TaBOR4-1D, and TaBOR3-4B) displayed only slight expression in roots under B starvation, but their expression increased significantly in roots and shoots under low B and high B (Figure 8C). In roots, TaBOR4-1A, TaBOR4-1B, TaBOR4-1D, and TaBOR3-4B were mainly upregulated by low B, but TaBOR3-3B and TaBOR3-3D were induced by high B. Regardless of high B and low B, six genes (TaBOR3-3B, TaBOR3-3D, TaBOR4-1A, TaBOR4-1A, TaBOR4-1B, TaBOR4-1D, and TaBOR3-4B) showed high expression in shoots. No differences were observed in the expression of TaBOR3-3A under low B and high B in roots and shoots. The various expression patterns of the TaBOR family members may imply diverse B transporter functions in common wheat.
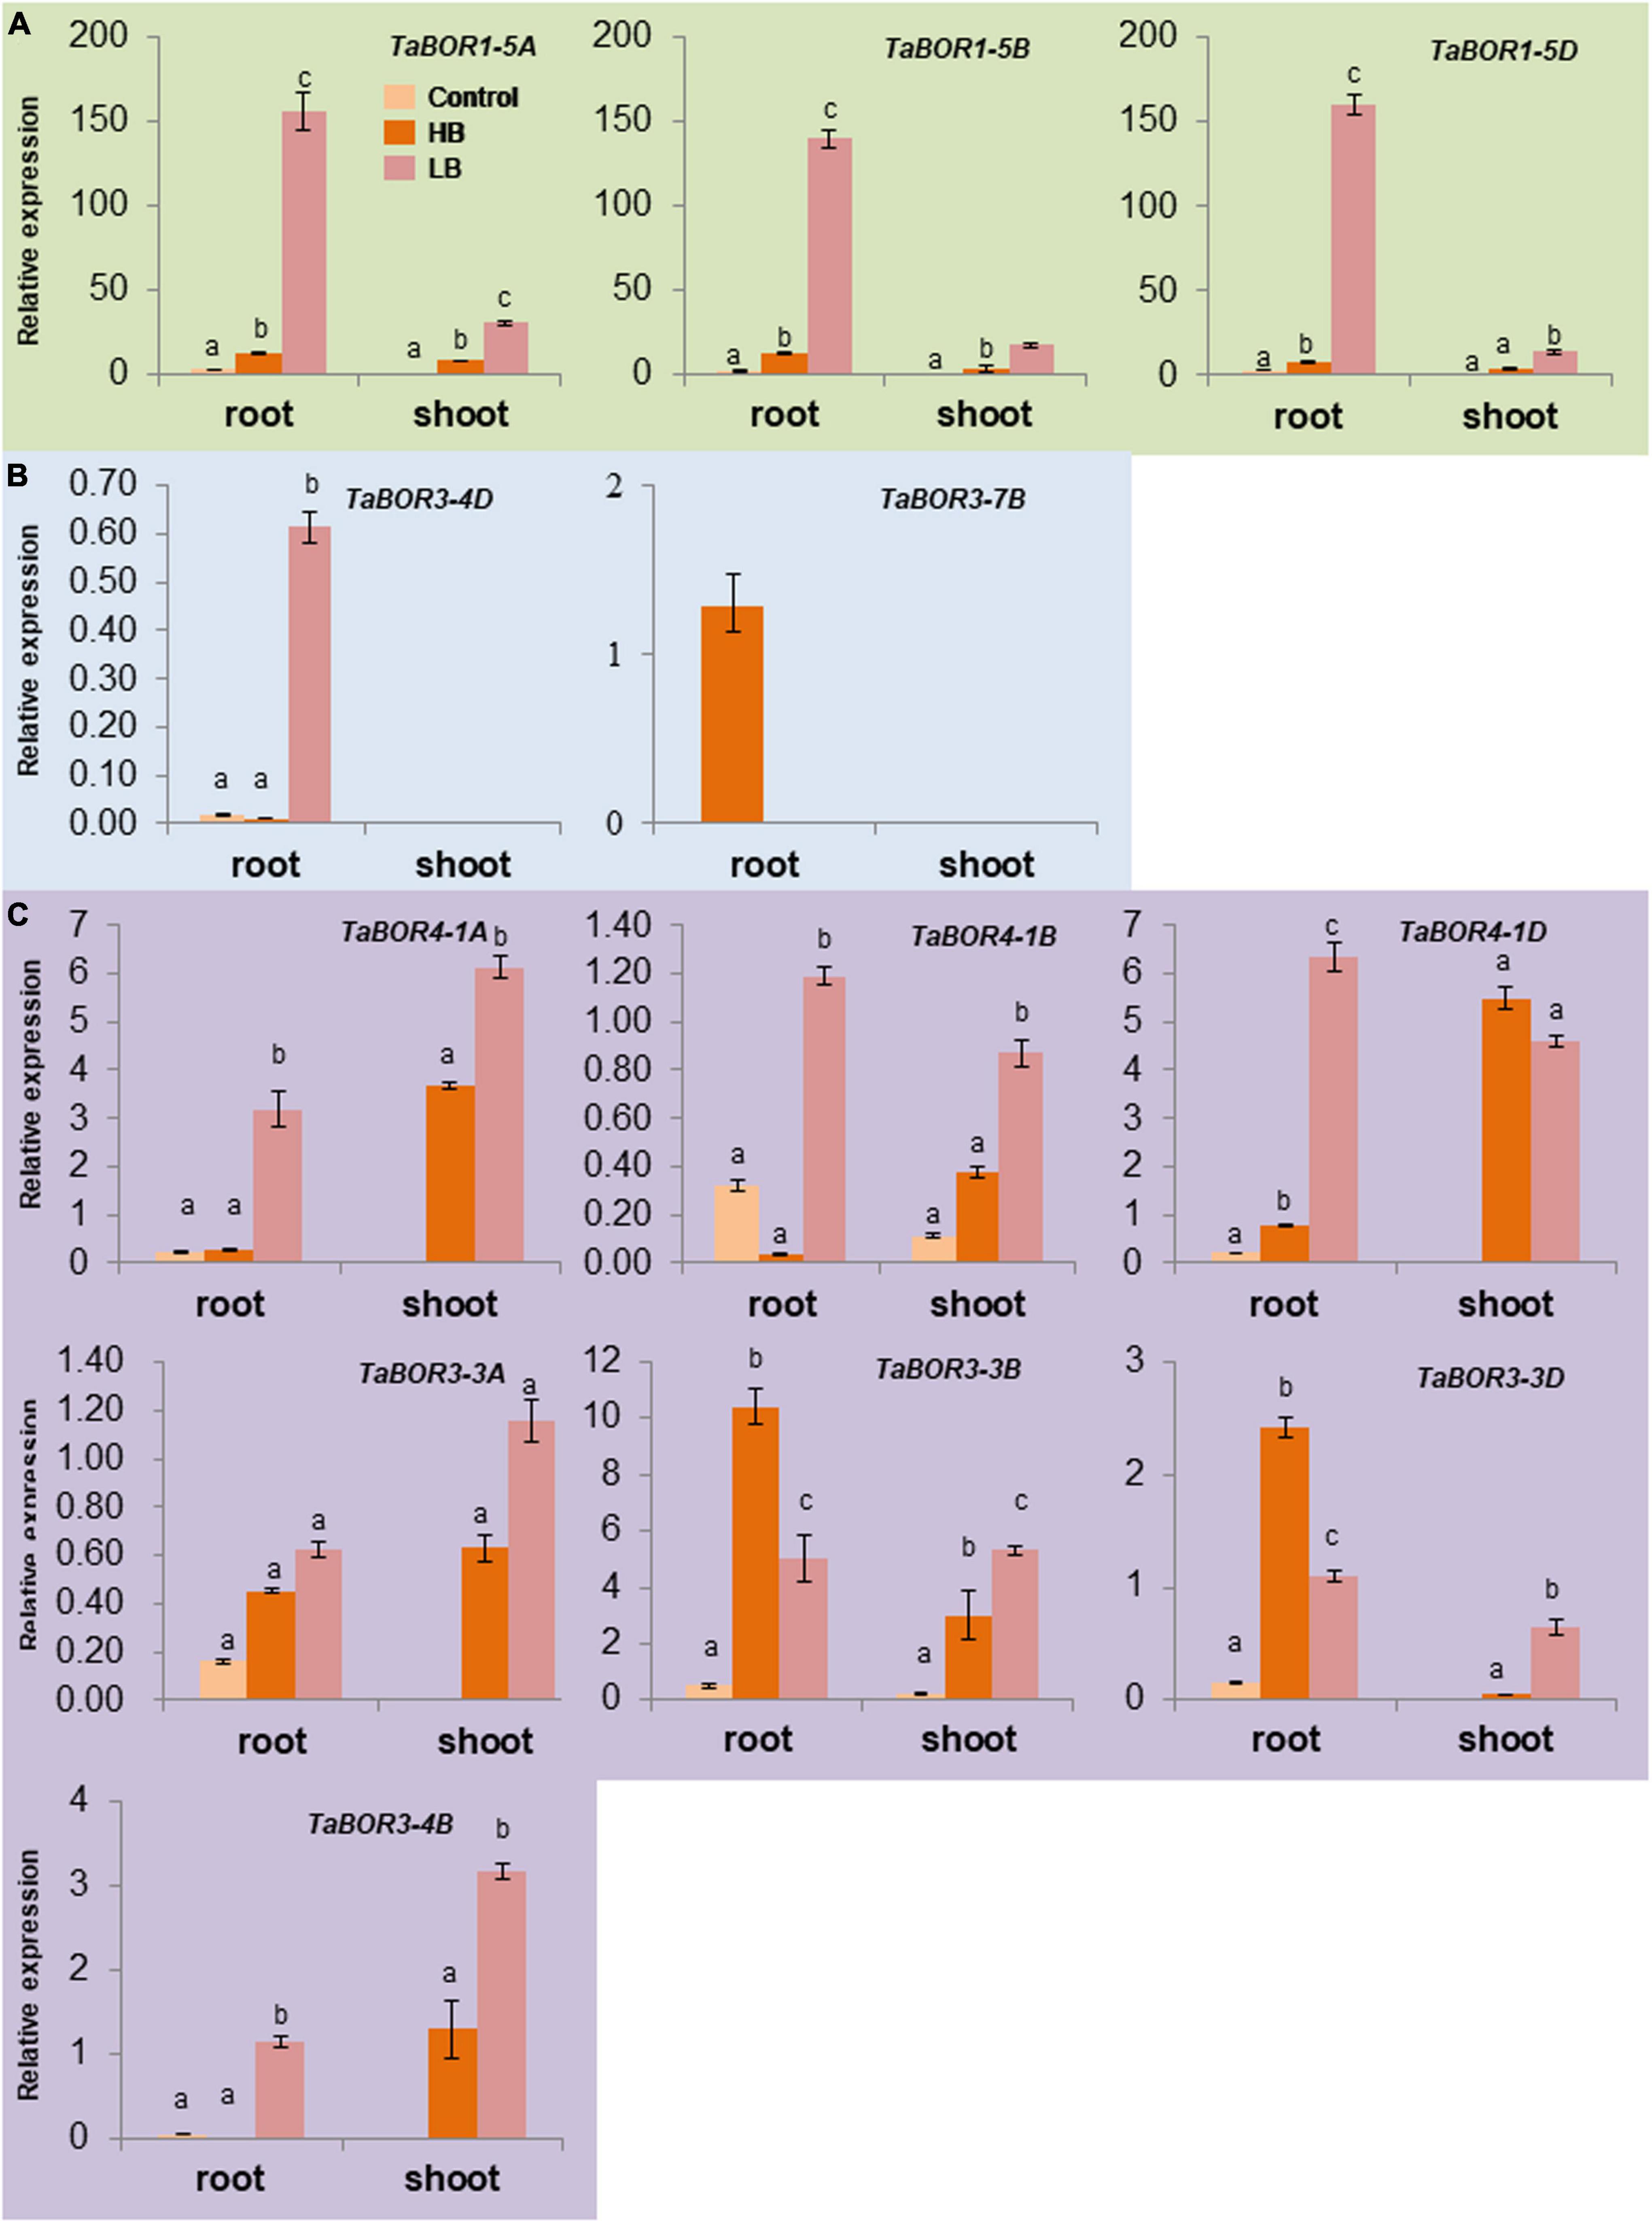
Figure 8. Expression patterns of TaBOR genes under different B stresses. (A) TaBOR genes that were mainly expressed in roots. (B) TaBOR genes that were expressed in only roots. (C) TaBOR genes that were expressed in both shoots and roots. Different letters represent statistical significance (p < 0.05).
Protein–protein interaction network of the TaBOR genes
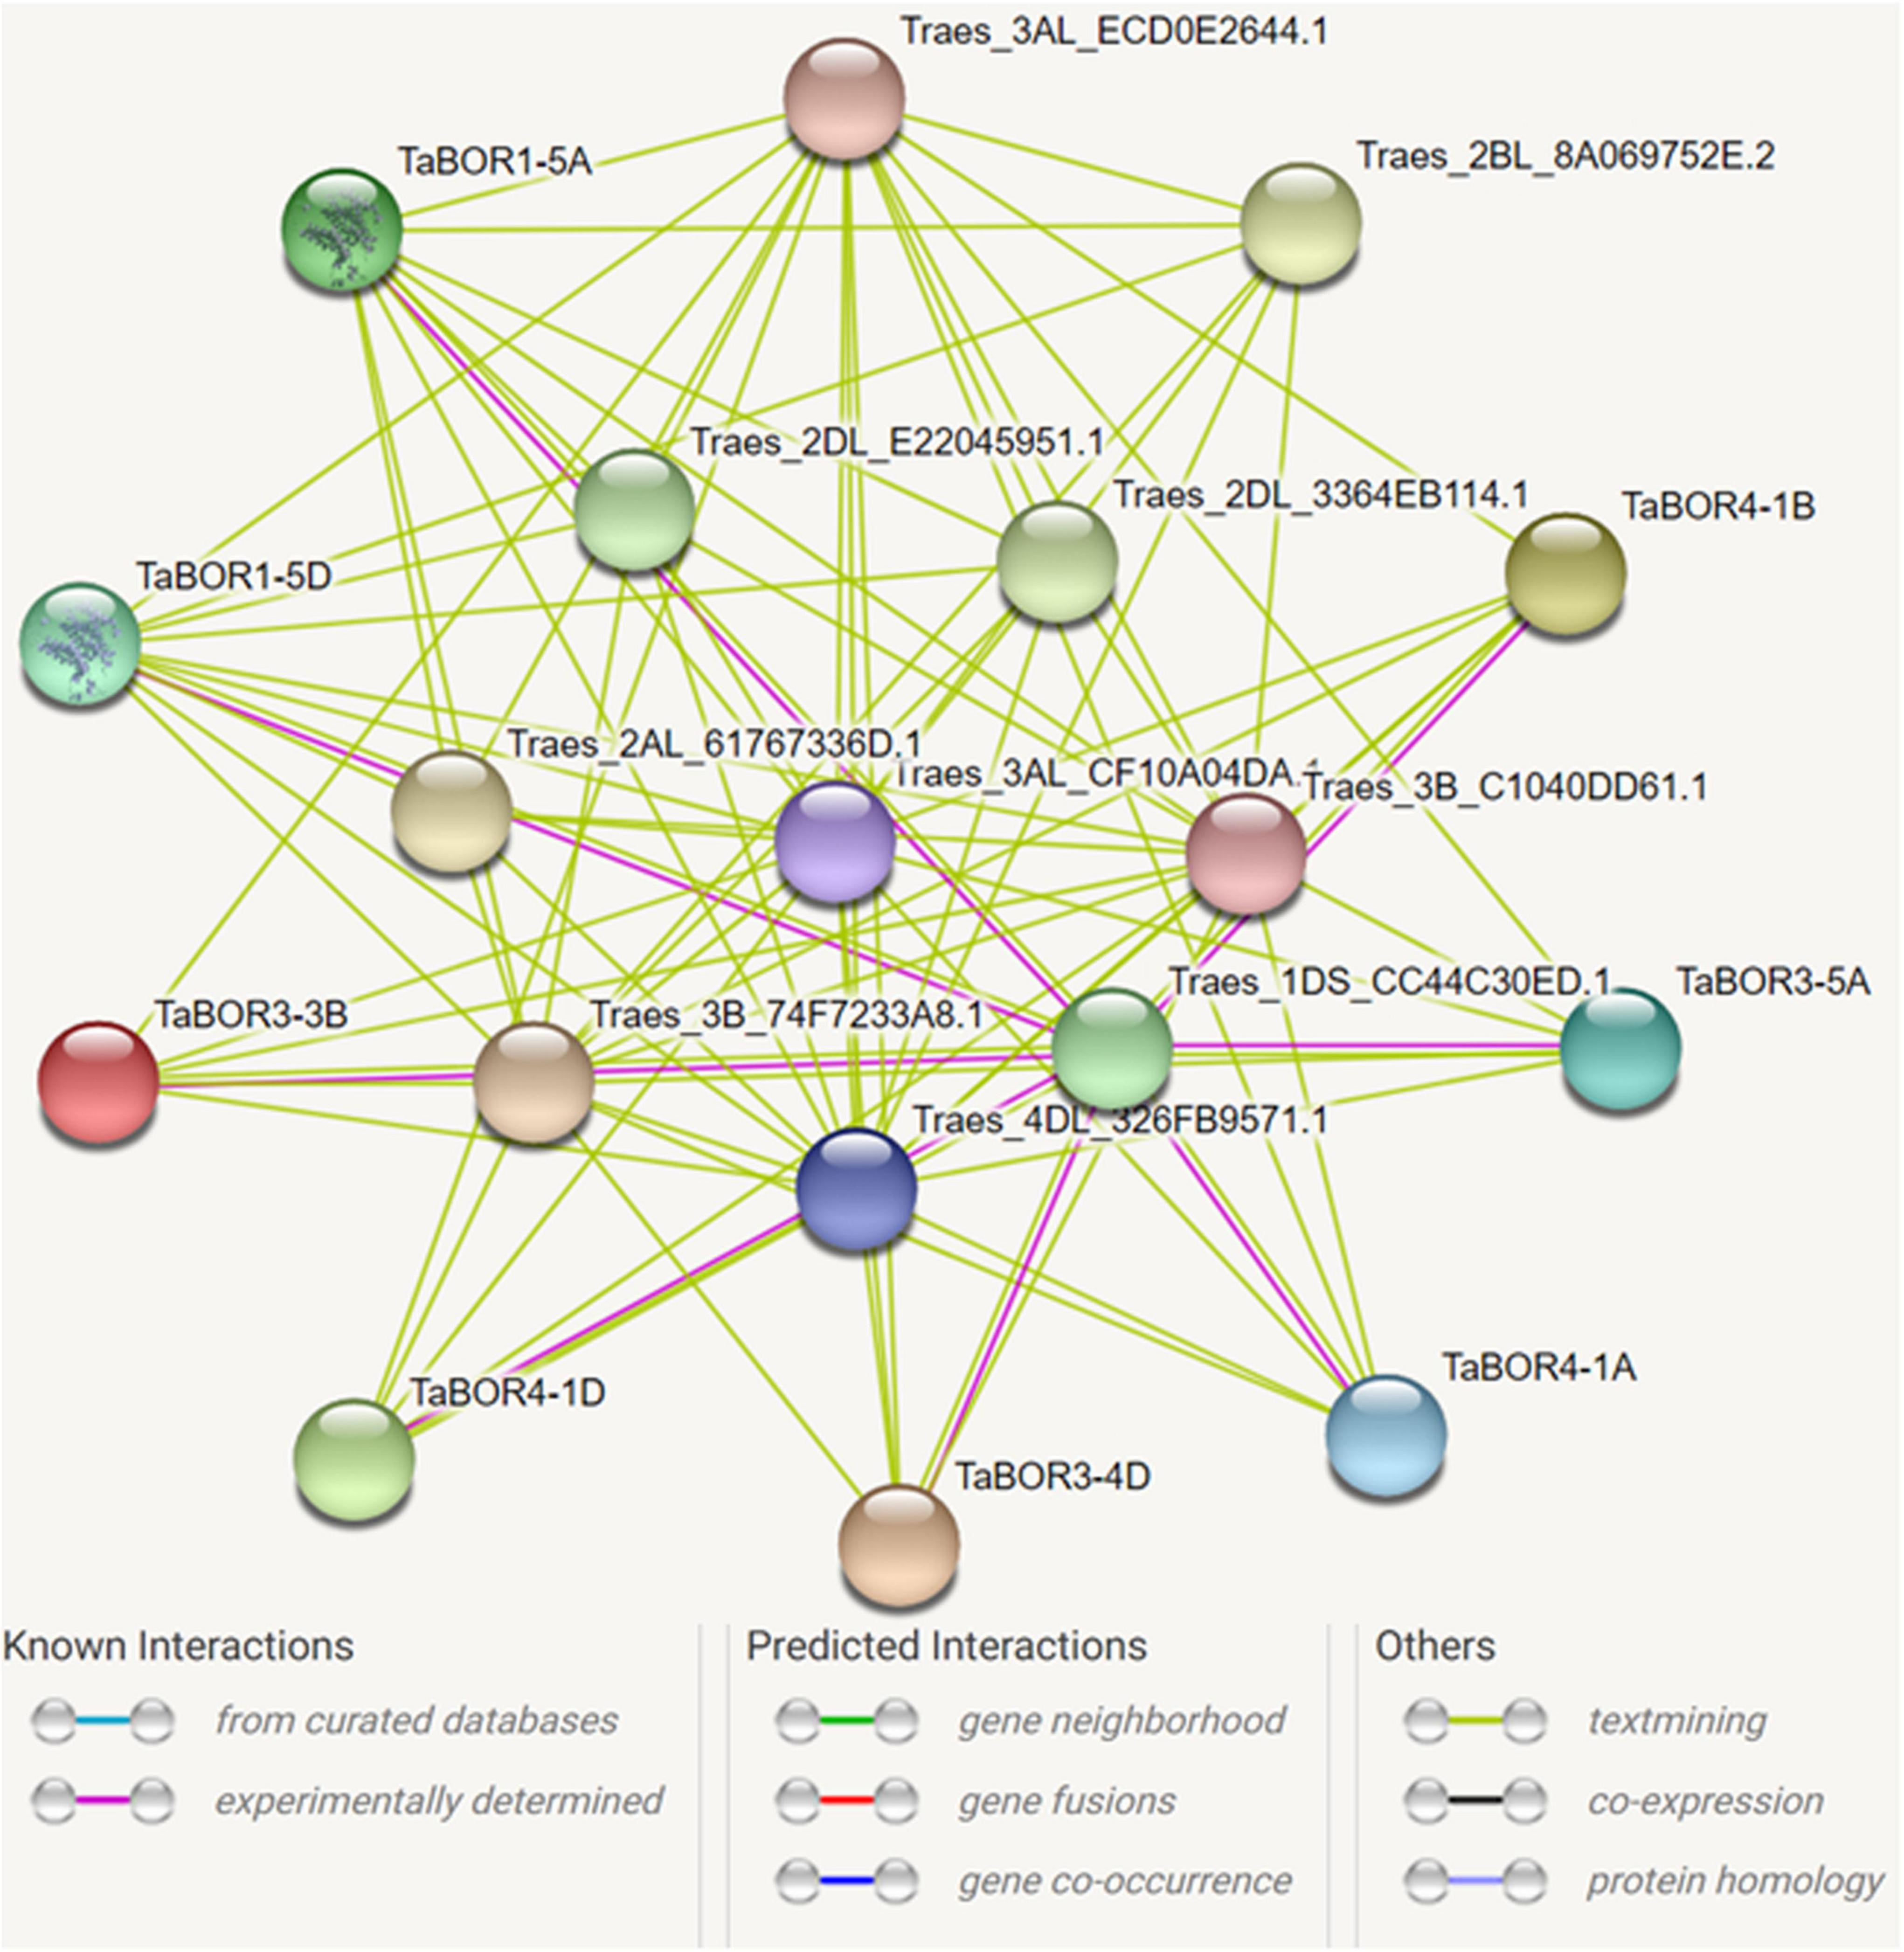
To investigate the relationship between TaBORs and other genes, a protein–protein interaction network was constructed using the STRING database. Eight TaBOR genes were predicted to interact with 10 different proteins (Traes_3B_74F7233A8.1, Traes_2DL_E22045951.1, Traes_2DL_3364EB114.1, Traes_3AL_ECD0E2644.1, Traes_2BL_8A069752E.2, Traes_2AL_61767336D.1, Traes_3AL_CF10A04DA.1, Traes_3B_C1040DD61.1, Traes_4DL_326FB9571.1, Traes_1DS_CC44C30ED.1) (Figure 9). The prediction information indicated that the 10 different proteins were all uncharacterized proteins. After functional annotation by Pfam, the 10 proteins were assigned to the GH3 family, bHLH-MYC_N, BRX_N family, NB-ARC and AdoHcyase. The BRX_N family (Traes_2DL_E22045951.1, Traes_2DL_3364EB114.1, Traes_2BL_8A069752E.2, and Traes_2AL_61767336D.1) has a critical role in modulating the growth rate in both roots and shoots. The GH3 family (Traes_3B_74F7233A8.1 and Traes_3AL_ECD0E2644.1) mainly acted as response factors to auxin. The bHLH-MYC_N family, including Traes_3AL_CF10A04DA.1 and Traes_3B_C1040DD61.1, belongs to the MYB and MYC superfamilies and plays key roles in various developmental processes. These results provide valuable data for the further functional characterization of TaBOR genes.
Discussion
BOR genes in common wheat and their evolution
Boron is a necessary microelement for plant vegetative and reproductive growth. B transporters in plants have been widely discussed (Takano et al., 2002; Hayes and Reid, 2004; Cañon et al., 2013; Leaungthitikanchana et al., 2013; Wakuta et al., 2015; Chatterjee et al., 2017; Chen et al., 2018); however, to our knowledge, few have been reported in common wheat, one of the important food crops. In the present study, we carried out a comprehensive search for BOR family members in common wheat, and a total of 14 full-length TaBORs were obtained (Table 1). The amino acid coding sequences of these TaBOR genes present high homologous conservation with similar protein structural properties, physicochemical parameters and the same subcellular location. Diehn et al. (2019) reported that OsBOR1 shared the same group as AtBOR1 and BnBOR1. The BOR gene phylogenetic tree showed that TaBOR1 and OsBOR1 also exhibited orthologous relationships with AtBOR1 and BnBOR1, suggesting that BORs may share a common ancestor (Figure 1). The BOR genes were mainly divided into dicotyledons and monocotyledons, indicating that BOR genes possibly developed monocot-specific functions after the diversification of dicotyledons and monocotyledons in the evolution of plants. The phylogenetic tree showed that all 14 TaBOR genes were classified into three groups or subfamilies (Figure 1), which was consistent with the results of the OsBOR genes (Nakagawa et al., 2007). There were 4 and 14 identified members of the BOR family in rice and wheat, respectively. The number of BOR genes in wheat was approximately four times that in rice. Interestingly, the same phenomenon was also observed in the B. napus genome and A. thaliana genome (Chen et al., 2018). In wheat, the TaBOR3 subfamily contains eight members, indicating an expanded number of members. Both wheat and rape were polyploidy crops that occurred through genome duplication events, which may be the reason for the copy number expansion of the BOR gene in wheat and in the B. napus genome, enhancing the adaptability of crops to different environments (Liu et al., 2022).
The chromosomal locations of the 14 TaBOR genes suggested that they were unevenly distributed on 13 of the 42 wheat chromosomes, and all the TaBOR genes were located on chromosome arms related to high recombination rates (Figure 4), which has also been reported for maize (Chatterjee et al., 2014) and rape (Chen et al., 2018). Gene structure characteristics revealed that the diversification of TaBOR genes has occurred in the wheat genome. All three TaBOR4 genes contained 14 exons and 13 introns. The TaBOR1 subfamily contained 12–13 exons and 11–12 introns. The differentiation of the TaBOR3 subfamily was highest, with 12–14 exons and 11–12 introns. However, the amino acid identity among TaBOR genes indicated that the TaBOR1 subfamily was the most conserved. The intron/exon organization and protein identity clearly suggested that the TaBOR1 subfamily was more conserved than the TaBOR3 and TaBOR4 subfamilies, implying that TaBOR1 subfamily members may be of the ancestral type (Wakuta et al., 2015). Furthermore, differences were also observed among the conserved motifs of TaBORs through MEME. Groups of TaBOR3 and TaBOR4 possess ten motifs (Motifs 1–10) and TaBOR1 subfamily had 9 motifs except motif 10 (Figure 3). Ten motifs were commonly in TaBOR proteins (Hrmova et al., 2020), which suggested that new motif of TaBOR3 and TaBOR4 subfamilies were obtained based on ancestral type in the evolution of TaBOR genes. This diversity in the extron/intron distribution of TaBOR genes and the motif composition differences of TaBOR proteins were likely caused by the gain or loss of introns and exons during the process of gene duplication, which contributed to the number changes of conserved motifs in TaBOR proteins and the functional differences.
Function and interaction network of TaBOR genes in common wheat
Plasma membrane localization and anion exchanger activity are essential characteristics for the BOR protein, which have been proven in many plant species, such as maize (Chatterjee et al., 2014; Durbak et al., 2014), barley (Sutton et al., 2007; Schnurbusch et al., 2010), wheat (Pallotta et al., 2014), B. napus (Zhang et al., 2017), and rice (Huang et al., 2022). The anion exchanger bicarbonate (HCO3-) domain plays a key role in the process of anion transport in plants, bacteria, and animals (Romero et al., 2013). BOR genes have an essential role in low and high B concentration tolerance (Miwa and Fujiwara, 2010). The conserved domain of the BOR family has been widely demonstrated in many plants but has rarely been discussed in regard to common wheat. The TaBOR protein contains 9–10 conserved motifs, and five motifs are anion exchanger bicarbonate (HCO3-) domains, a typical structure of the BOR gene (Figure 3). Gene ontology was also performed to further explore the functions of TaBOR genes (Figure 6). All TaBOR genes were effectively annotated and assigned GO terms including transmembrane transport (GO: 0055085 and GO: 0035445), ion homeostasis (GO: 0050801 and GO: 0015698), integral membrane component (GO: 0016021 and GO: 0005886), and inorganic anion exchanger activity (GO: 0005452 and GO: 0046715). These results suggested that the TaBOR genes shared similar functions in B transport and export.
As a key DNA sequence existing in the promoter region, CAREs can regulate gene expression and function. The organization of different CAREs may reveal differences in gene regulation and function (Roy and Singer, 2015). A total of 84 cis-elements associated with the light response, such as AE-box, ATCT motif and Box 4 (part of a conserved DNA module involved in light responsiveness), GTGGC-motif, TCT-motif, TCCC-motif, and GATA-motif (part of a light responsive element), G-Box and ACE (cis-acting elements involved in light responsiveness), were detected in the promoters of 14 TaBOR genes (Roy et al., 2011; Roy and Singer, 2015; Figures 5A,B). CAREs related to hormone response (IAA, SA, GA, MeJ, and ABA) were examined. ABREs are cis-elements involved in abscisic acid responsiveness (Forestan et al., 2012; Wang et al., 2015; He et al., 2017) and were identified in most TaBOR genes. However, few ABREs were found in TaBOR1-5A, TaBOR1-5B, and TaBOR1-5D, which may be attributed to the functional differentiation of TaBOR1 (Leaungthitikanchana et al., 2013). In addition, cis-element responses to various stress conditions, including LTR (low temperature responsiveness), TC-rich repeats (defense and stress responsiveness), Myb-binding sites, and MBS (drought inducibility), were also predicted. In regard to B. napus, recent studies indicated that various types of CAREs, such as hormone response, stress response, and development-related elements, were inserted into the promoter of BnaC4. BOR1;1c, the expression of which increased in QY10, a B-efficient genotype, indicating that different cis-elements may contribute to the stronger adaptability of QY10 to low B concentrations (Chen et al., 2018). These results showed that TaBOR genes may be regulated by diverse stresses and hormones in wheat; however, this needs to be verified by experimental studies. This information offered valuable insights for exploring the function of TaBOR genes in response to phytohormones and stress.
The interaction network of TaBOR proteins with other proteins was constructed, and ten uncharacterized proteins were detected (Figure 9). After functional annotation, these proteins displayed diverse roles in the regulation of hormonal, stress and developmental processes. As members of the BRX_N family, Traes_2DL_E22045951.1, Traes_2DL_3364EB114.1, Traes_2BL_8A069752E.2, and Traes_2AL_61767336D were involved in both root and shoot growth rates. Traes_3B_74F7233A8.1 and Traes_3AL_ECD0E2644.1 were responsible for the response to auxin. In rice, the interaction of OsLsi1 and OsBOR1 is essential for B uptake by roots (Huang et al., 2022). Thus, these results demonstrate that an intricate gene network is required to realize the functions of TaBOR genes in various developmental processes. However, further studies are essential for better understanding the functions of TaBOR family members.
Expression profiling of TaBOR genes and their responses to different B conditions
Different expression profiles of BOR1 have been investigated in various plants (Nakagawa et al., 2007). Fourteen TaBOR genes expression levels were observed, and their expression profiles were revealed in various tissues from three stages (Figure 7). TaBOR1-5D and TaBOR1-5A were detected with higher expression in all tissues. The profile of TaBOR1-5B was different from that of TaBOR1-5D and TaBOR1-5A but exhibited lower expression at leaf_z71, stem_z65, grain_z71, and grain_z85. A similar result was observed in response to boron conditions (Leaungthitikanchana et al., 2013). In addition, BOR1 also displayed distinct expression patterns in the flowers and shoots of other plants (Sun et al., 2012; Wakuta et al., 2015). The expression of TaBOR4 subfamily members increased in spikes at three stages and at grain_z71 points. As the homolog of TaBOR4, OsBOR4 had transcripts that accumulated predominantly in anthers (Tanaka et al., 2013), while BnaC4.BOR1;1c was highly expressed in the roots of a B-efficient cultivar (QY10) in B. napus (Chen et al., 2018), suggesting its diverse expression profiles in plants. Regarding the subfamilies of TaBOR3, TaBOR3-3A, TaBOR3-3B, and TaBOR3-3D were highly expressed in spikes, while TaBOR3-7B and TaBOR3-4D expression was elevated in roots. The difference was that the expression patterns of TaBOR3-4D, TaBOR3-4B, TaBOR3-5A, TaBOR3-7B, and TaBOR3-7D showed lower expression except in roots at three stages. Overall, the mRNAs of most TaBOR genes were detected at high levels in spikes. These results indicated that TaBORs have different expression patterns in different tissues at different stages, indicating functional differentiation in different genomes, especially in the TaBOR3 subfamily.
Many studies have demonstrated that BOR genes have different expression patterns under different B conditions (Leaungthitikanchana et al., 2013; Chen et al., 2018). TaBOR family members showed distinct expression profiles in roots and shoots in response to B stimuli (Figure 8), implying various roles of the TaBOR family members in B absorption and transport regulation in common wheat. TaBOR3-4D and TaBOR3-7B were root-specifically expressed but were strongly induced by low and high B concentrations, respectively (Figure 8B), which was similar to the expression of BnBOR3A03 but different from that of BnBOR3C03 in B. napus (Chen et al., 2018). TaBOR1-5A, TaBOR1-5B, and TaBOR1-5D were mainly expressed in roots and were upregulated by low B concentrations (Figure 8A). Leaungthitikanchana et al. (2013) reported that the transcripts for TaBOR1.2 (TaBOR1-5A) and TaBOR1.1 (TaBOR1-5D) accumulated at higher levels in roots than in shoots under B deficiency, which is consistent with the present study. TaBOR3-3A, TaBOR3-3B, TaBOR3-3D, TaBOR4-1A, TaBOR4-1B, TaBOR4-1D, and TaBOR3-4B showed high expression in roots and shoots when exposed to external B concentration (Figure 8C). In other plants, the expression of BOR4 and BOR1 was also induced by B deficiency or low B conditions in roots and shoots, such as BnBOR4C05 and BnBOR1;2a in B. napus (Chen et al., 2018), AtBOR1 in A. thaliana (Cañon et al., 2013), and OsBOR1 in rice (Nakagawa et al., 2007). AtBOR4 is strongly expressed under high B concentrations (Miwa et al., 2014). Taken together, these results indicated that the expression profiles of BOR genes were different in plants under different B conditions, implying diverse functions in B nutrition regulation and coordinated regulation among the TaBOR family members that was necessary for B homeostasis in plants.
Data availability statement
The original contributions presented in this study are included in the article/Supplementary material, further inquiries can be directed to the corresponding authors.
Author contributions
YW planned the experiments. ZN and XH participated in the RT–qPCR data collection. XW and ND made the illustrations. ZY and CH participated in the bioinformation analysis. MZ and SY prepared the samples. YW wrote the manuscript. ZR and ML funded this research. All authors have read and approved the final manuscript.
Funding
This work was supported by The National Key Research and Development Program of China (2016YFD0101602), Key Scientific and Technological Projects in Henan Province (192102110129 and 212102110053), and Key Scientific Research Projects of Colleges and Universities in Henan Province (16A210046).
Conflict of interest
The authors declare that the research was conducted in the absence of any commercial or financial relationships that could be construed as a potential conflict of interest.
Publisher’s note
All claims expressed in this article are solely those of the authors and do not necessarily represent those of their affiliated organizations, or those of the publisher, the editors and the reviewers. Any product that may be evaluated in this article, or claim that may be made by its manufacturer, is not guaranteed or endorsed by the publisher.
Supplementary material
The Supplementary Material for this article can be found online at: https://www.frontiersin.org/articles/10.3389/fpls.2022.997915/full#supplementary-material
Footnotes
- ^ http://www.arabidopsis.org/index.jsp
- ^ http://rice.uga.edu
- ^ http://wheatomics.sdau.edu.cn/
- ^ http://gsds.cbi.pku.edu.cn/
- ^ http://www.expasy.org/tools/
- ^ http://meme-suite.org/tools/meme
- ^ http://pfam.xfam.org/search
- ^ http://bioinformatics.psb.ugent.Be/webtools/plantcare/html/
- ^ https://string-db.org
- ^ http://ekhidna2.biocenter.helsinki.fi/sanspanz/
- ^ http://www.bioinformatics.com.cn/
- ^ https://biit.cs.ut.ee/clustvis/
- ^ http://wheatomics.sdau.edu.cn/expression/index.html
References
Al-Huqail, A. A., Khan, M. N., Ali, H. M., Siddiqui, M. H., Al-Huqail, A. A., AlZuaibr, F. M., et al. (2020). Exogenous melatonin mitigates boron toxicity in wheat. Ecotoxicol. Environ. Saf. 15:110822. doi: 10.1016/j.ecoenv.2020.110822
Bailey, T. L., Boden, M., Buske, F. A., Firth, M., Grant, C. E., and Clementi, L. (2009). MEME SUITE: Tools for motif discovery and searching. Nucl. Acids Res. 37:W202–W208. doi: 10.1093/nar/gkp335
Brdar-Jokanović, M. (2020). Boron toxicity and deficiency in agricultural plants. Int. J. Mol. Sci. 21:1424. doi: 10.3390/ijms21041424
Camacho-Cristóbal, J. J., Martín-Rejano, E. M., Begoña Herrera-Rodríguez, M., Teresa Navarro-Gochicoa, M., Rexach, J., and González-Fontes, A. (2015). Boron deficiency inhibits root cell elongation via an ethylene/auxin/ROS-dependent pathway in Arabidopsis seedlings. J. Exp. Bot. 66, 3831–3840. doi: 10.1093/jxb/erv186
Camacho-Cristobal, J. J., Rexach, J., Herrera-Rodriguez, M. B., Navarro-Gochicoa, M. T., and Gonzalez-Fontes, A. (2011). Boron deficiency and transcript level changes. Plant Sci. 181, 85–89. doi: 10.1016/j.plantsci.2011.05.001
Cañon, P., Aquea, F., and Arce-Johnson, P. (2013). Functional characterization of citrus macrophylla BOR1 as a boron transporter. Physiol. Plant. 149, 329–339. doi: 10.1111/ppl.12037
Chatterjee, M., Liu, Q., Menello, C., Galli, M., and Gallavotti, A. (2017). The combined action of duplicated boron transporters is required for maize growth in boron-deficient conditions. Genetics 206, 2041–2051. doi: 10.1534/genetics.116.198275
Chatterjee, M., Tabi, Z., Galli, M., Malcomber, S., Buck, A., Muszynski, M., et al. (2014). The boron efflux transporter ROTTEN EAR is required for maize inflorescence development and fertility. Plant Cell 26, 2962–2977. doi: 10.1105/tpc.114.125963
Chen, C., Chen, H., Zhang, Y., Thomas, H. R., Frank, M. H., He, Y., et al. (2020). TBtools: An integrative toolkit developed for interactive analyses of big biological data. Mol. Plant 13, 1194–1202. doi: 10.1016/j.molp.2020.06.009
Chen, H. F., Zhang, Q., He, M. L., Wang, S. L., Shi, L., and Xu, F. S. (2018). Molecular characterization of the genome wide BOR transporter gene family and genetic analysis of BnaC04.BOR1;1c in Brassica napus. BMC Plant Biol. 18:193. doi: 10.1186/s12870-018-1407-1
Dell, B., and Huang, L. (1997). Physiological response of plants to low boron. Plant Soil 193, 103–120. doi: 10.1023/A:1004264009230
Diehn, T. A., Bienert, M. D., Pommerrenig, B., Liu, Z. J., Spitzer, C., Bernhardt, N., et al. (2019). Boron demanding tissues of Brassica napus express specific sets of functional Nodulin26-like Intrinsic Proteins and BOR1 transporters. Plant J. 100, 68–82. doi: 10.1111/tpj.14428
Durbak, A. R., Phillips, K. A., O’Neill, M. A., Mares, J., Gallavotti, A., Malcomber, S. T., et al. (2014). Transport of boron by the tassel-less1 aquaporin is critical for vegetative and reproductive development in maize. Plant Cell 26, 2978–2995. doi: 10.1105/tpc.114.125898
Emon, R. M., Gustafson, J. P., Nguyen, H., Musket, T., and Hassan, M. M. (2010). Molecular-marker based characterization and genetic diversity of wheat genotypes in relation to boron efficiency. Indian J. Genet. 70, 339–348.
Eser, A., and Aydemir, T. (2016). The effect of kinetin on wheat seedlings exposed to boron. Plant Physiol. Biochem. 108, 158–164. doi: 10.1016/j.plaphy.2016.06.024
Forestan, C., Farinati, S., and Varotto, S. (2012). The maize PIN gene family of auxin transporters. Front. Plant. Sci. 3:16. doi: 10.3389/fpls.2012.00016
González-Fontes, A., and Fujiwara, T. (2020). Advances in plant boron. Int. J. Mol. Sci. 21:4107. doi: 10.3390/ijms21114107
Hayes, J. E., and Reid, R. J. (2004). Boron tolerance in barley is mediated by efflux of boron from the roots. Plant Physiol. 136, 3376–3382. doi: 10.1104/pp.103.037028
He, P., Zhao, P., Wang, L., Zhang, Y., Wang, X., Xiao, H., et al. (2017). The PIN gene family in cotton (Gossypium hirsutum): Genome-wide identification and gene expression analyses during root development and abiotic stress responses. BMC Genom. 18:507. doi: 10.1186/s12864-017-3901-5
Hrmova, M., Gilliham, M., and Tyerman, S. D. (2020). Plant transporters involved in combating boron toxicity: Beyond 3D structures. Biochem. Soc. Trans. 37, 629–714. doi: 10.1042/BST20200164
Hu, B., Jin, J., Guo, A. Y., Zhang, H., Luo, J., and Gao, G. (2015). GSDS 2.0: An upgraded gene feature visualization server. Bioinformatics 31, 1296–1297. doi: 10.1093/bioinformatics/btu817
Huang, S., Konishi, N., Yamaji, N., Shao, J. F., Mitani-Ueno, N., and Ma, J. F. (2022). Boron uptake in rice is regulated post-translationally via a clathrin-independent pathway. Plant Physiol. 188, 1649–1664. doi: 10.1093/plphys/kiab575
Kajikawa, M., Fujibe, T., Uraguchi, S., Miwa, K., and Fujiwara, T. (2011). Expression of the Arabidopsis borate efflux transporter gene, AtBOR4, in rice affects the xylem loading of boron and tolerance to excess boron. Biosci. Biotechnol. Biochem. 75, 2421–2433. doi: 10.1271/bbb.110629
Kasai, K., Takano, J., Miwa, K., Toyoda, A., and Fujiwara, T. (2011). High boron-induced ubiquitination regulates vacuolar sorting of the bor1 borate transporter in Arabidopsis thaliana. J. Biol. Chem. 286, 6175–6183. doi: 10.1074/jbc.M110.184929
Kozlowski, L. P. (2016). IPC-isoelectric point calculator. Biol. Direct. 11:55. doi: 10.1186/s13062-016-0159-9
Kozlowski, L. P. (2021). IPC 2.0: Prediction of isoelectric point and pKa dissociation constants. Nucl. Acids Res. 49:W285–W292. doi: 10.1093/nar/gkab295
Leaungthitikanchana, S., Fujibe, T., Tanaka, M., Wang, S., Sotta, N., and Takano, J. (2013). Differential expression of three BOR1 genes corresponding to different genomes in response to boron conditions in hexaploid wheat (Triticum Aestivum L). Plant Cell Physiol. 54, 1056–1063. doi: 10.1093/pcp/pct059
Lescot, M., Déhais, P., Thijs, G., Marchal, K., Moreau, Y., Van de Peer, Y., et al. (2002). PlantCARE, a database of plant cis-acting regulatory elements and a portal to tools for in silico analysis of promoter sequences. Nucl. Acids Res. 30, 325–327. doi: 10.1093/nar/30.1.325
Liu, J., Yao, Y. Y., Xin, M. M., Peng, H. R., Ni, Z. F., and Sun, Q. X. (2022). Shaping polyploid wheat for success: Origins, domestication, and the genetic improvement of agronomic traits. J. Integr. Plant Biol. 64, 536–563. doi: 10.1111/jipb.13210
Livak, K. J., and Schmittgen, T. D. (2001). Analysis of relative gene expression data using real-time quantitative PCR and the 2−ΔΔCT method. Methods 25, 402–408.
Ma, S. W., Wang, M., Wu, J. H., Guo, W. L., Chen, Y. M., Li, G. W., et al. (2021). WheatOmics: A platform combining multiple omics data to accelerate functional genomics studies in wheat. Mol. Plant 14, 1965–1968. doi: 10.1016/j.molp.2021.10.006
Miwa, K., Aibara, I., and Fujiwara, T. (2014). Arabidopsis thaliana BOR4 is up regulated under high boron conditions and confers tolerance to high boron. Soil Sci. Plant Nutr. 60, 349–355.
Miwa, K., and Fujiwara, T. (2010). Boron transport in plants: Co-ordinated regulation of transporters. Ann. Bot. 105, 1103–1108. doi: 10.1093/aob/mcq044
Nagarajan, Y., Rongala, J., Luang, S., Singh, A., Shadiac, N., Hayes, J., et al. (2016). A barley efflux transporter operates in a NaC-dependent manner, as revealed by a multidisciplinary platform. Plant Cell 28, 202–218. doi: 10.1105/tpc.15.00625
Nakagawa, Y., Hanaoka, H., Kobayashi, M., Miyoshi, K., Miwa, K., and Fujiwara, T. (2007). Celltype specificity of the expression of OsBOR1, a rice efflux boron transporter gene, is regulated in response to boron availability for efficient boron uptake and xylem loading. Plant Cell 19, 2624–2635. doi: 10.2307/20077131
Nielsen, F. H., and Eckhert, C. D. (2020). Boron. Adv. Nutr. 11, 461–462. doi: 10.1093/advances/nmz110
Onuh, A., and Miwa, K. (2021). Regulation, diversity and evolution of boron transporters in plants. Plant Cell Physiol. 62, 590–599. doi: 10.1093/pcp/pcab025
Pallotta, M., Schnurbusch, T., Hayes, J., Hay, A., Baumann, U., Paull, J., et al. (2014). Molecular basis of adaptation to high soil boron in wheat landraces and elite cultivars. Nature 514, 88–91. doi: 10.1038/nature13538
Pant, J., Rerkasem, B., and Noppakoonwong, R. (1998). Effect of water stress on the boron response of wheat genotypes under low boron field conditions. Plant Soil 202, 193–200. doi: 10.1023/A:1004337630795
Pérezcastro, R., Kasai, K., Gainzacortés, F., Ruizlara, S., Casaretto, J. A., and Peñacortés, H. (2012). VvBOR1, the grapevine ortholog of AtBOR1, encodes an efflux boron transporter that is differentially expressed throughout reproductive development of Vitis Vinifera L. Plant Cell Physiol. 53, 485–494. doi: 10.1093/pcp/pcs001
Qin, S., Xu, Y., Nie, Z., Liu, H., Gao, W., Li, C., et al. (2022). Metabolomic and antioxidant enzyme activity changes in response to cadmium stress under boron application of wheat (Triticum aestivum). Environ. Sci. Pollut. Res. Int. 29, 34701–34713. doi: 10.1007/s11356-021-17123-z
Rashid, A., Rafique, E., Bhatti, A. U., Ryan, J., Bughio, N., and Yau, S. K. (2011). Boron deficiency in rainfed wheat in Pakistan: incidence, spatial variability and management strategies. J. Plant Nutr. 34, 600–613. doi: 10.1080/01904167.2011.538286
Rerkasem, B., and Jamjod, S. (2004). Boron deficiency in wheat: A review. Field Crop Res. 89, 173–186. doi: 10.1016/j.fcr.2004.01.022
Rerkasem, B., Netsangtip, R., Lordkaew, S., and Cheng, C. (1993). Grain set failure in boron deficient wheat. Plant Soil 155, 309–312. doi: 10.1007/BF00025044
Romero, M. F., Chen, A. P., Parker, M. D., and Boron, W. F. (2013). The SLC4 family of bicarbonate (HCO3-) transporters. Mol. Asp. Med. 34, 159–182. doi: 10.1016/j.mam.2012.10.008
Roy, A. L., and Singer, D. S. (2015). Core promoters in transcription: Old problem, new insights. Trends Biochem. Sci. 40, 165–171. doi: 10.1016/j.tibs.2015.01.007
Roy, A. L., Sen, R., and Roeder, R. G. (2011). Enhancer–promoter communication and transcriptional regulation of Igh. Trends Immunol. 32, 532–539. doi: 10.1016/j.it.2011.06.012
Saitou, N., and Nei, M. (1987). The neighbor-joining method: A new method for reconstructing phylogenetic trees. Mol. Biol. Evol. 4, 406–425.
Schnurbusch, T., Hayes, J., Hrmova, M., Baumann, U., Ramesh, S. A., Tyerman, S. D., et al. (2010). Boron toxicity tolerance in barley through reduced expression of the multifunctional aquaporin HvNIP2;1. Plant Physiol. 153, 1706–1715. doi: 10.1104/pp.110.158832
Shorrocks, V. M. (1997). The occurrence and correction of boron deficiency. Plant Soil 193, 121–148. doi: 10.1023/A:1004216126069
Sun, J., Shi, L., Zhang, C. Y., and Xu, F. (2012). Cloning and characterization of boron transporters in Brassica napus. Mol. Biol. Rep. 39, 1963–1973. doi: 10.1007/s11033-011-0930-z
Sutton, T., Baumann, U., Hayes, J., Collins, N. C., Shi, B. J., Schnurbusch, T., et al. (2007). Boron-toxicity tolerance in barley arising from efflux transporter amplification. Science 318, 1446–1449. doi: 10.1126/science.1146853
Takano, J., Noguchi, K., Yasumori, M., Kobayashi, M., Gajdos, Z., Miwa, K., et al. (2002). Arabidopsis boron transporter for xylem loading. Nature 420, 337–340. doi: 10.1038/nature01139
Takano, J., Tanaka, M., Toyoda, A., Miwa, K., Kasai, K., and Fuji, K. (2010). Polar localization and degradation of Arabidopsis boron transporters through distinct trafficking pathways. Proc. Natl. Acad. Sci. U.S.A. 107, 5220–5225. doi: 10.1073/pnas.0910744107
Tanaka, N., Uraguchi, S., Saito, A., Kajikawa, M., Kasai, K., Sato, Y., et al. (2013). Roles of pollen-specific boron efflux transporter, OsBOR4, in the rice fertilization process. Plant Cell Physiol. 54, 2011–2019. doi: 10.1093/pcp/pct136
Tian, T., Liu, Y., Yan, H., You, Q., Yi, X., Du, Z., et al. (2017). AgriGO v2.0: A GO analysis toolkit for the agricultural community, 2017 update. Nucl. Acids Res. 45:W122–W129. doi: 10.1093/nar/gkx382
Till, A. D., Manuela, D. B., Benjamin, P., Zhao, J. L., Christoph, S., Bernhardt, N., et al. (2019). Boron demanding tissues of Brassica napus express specific sets of functional Nodulin26-like Intrinsic Proteins and BOR1 transporters. Plant J. 100, 68–82.
Wakuta, S., Mineta, K., Amano, T., Toyoda, A., Fujiwara, T., Naito, S., et al. (2015). Evolutionary divergence of plant borate exporters and critical amino acid residues for the polar localization and boron-dependent vacuolar sorting of AtBOR1. Plant Cell Physiol. 56, 852–862. doi: 10.1093/pcp/pcv011
Wang, Y., Chai, C., Valliyodan, B., Maupin, C., Annen, B., and Nguyen, H. T. (2015). Genome-wide analysis and expression profiling of the PIN auxin transporter gene family in soybean (Glycine max). BMC Genom. 16:951. doi: 10.1186/s12864-015-2149-1
Yoshinari, A., and Takano, J. (2017). Insights into the mechanisms underlying boron homeostasis in plants. Front. Plant Sci. 8:1951. doi: 10.3389/fpls.2017.01951
Keywords: boron, TaBOR gene, gene family, expression pattern, B deficiency
Citation: Wang Y, Niu Z, Hu X, Wu X, Yang Z, Hao C, Zhou M, Yang S, Dong N, Liu M and Ru Z (2022) Molecular characterization of the genome-wide BOR transporter family and their responses to boron conditions in common wheat (Triticum aestivum L.). Front. Plant Sci. 13:997915. doi: 10.3389/fpls.2022.997915
Received: 19 July 2022; Accepted: 31 August 2022;
Published: 06 October 2022.
Edited by:
Shuaifeng Geng, Institute of Crop Sciences (CAAS), ChinaReviewed by:
Xingwei Zheng, Shanxi Academy of Agricultural Sciences, ChinaLi Baochun, Gansu Agricultural University, China
Copyright © 2022 Wang, Niu, Hu, Wu, Yang, Hao, Zhou, Yang, Dong, Liu and Ru. This is an open-access article distributed under the terms of the Creative Commons Attribution License (CC BY). The use, distribution or reproduction in other forums is permitted, provided the original author(s) and the copyright owner(s) are credited and that the original publication in this journal is cited, in accordance with accepted academic practice. No use, distribution or reproduction is permitted which does not comply with these terms.
*Correspondence: Mingjiu Liu, bWluZ2ppdWxpdUAxMjYuY29t; Zhengang Ru, cnpnaDU4QDE2My5jb20=
 Yuquan Wang
 Zhipeng Niu1,2