- 1Shanghai Agrobiological Gene Center, Shanghai, China
- 2Key Laboratory of Grain Crop Genetic Resources Evaluation and Utilization, Ministry of Agriculture and Rural Affairs, Shanghai, China
- 3State Key Laboratory of Biocatalysis and Enzyme Engineering, School of Life Sciences, Hubei University, Wuhan, China
The commercialization of hybrid rice has greatly contributed to the increase in rice yield, with the improvement of its seed production capacity having played an important role. The stigma exsertion rate (SER) is a key factor for improving the outcrossing of the sterile line and the hybrid rice seed production. We used the Zhenshan 97B × IRAT109 recombinant inbred population comprising 163 lines and a natural population of 138 accessions to decipher the genetic foundation of SER over 2 years in three environments. Additionally, we detected eight QTLs for SER on chromosomes 1, 2, and 8 via linkage mapping. We also identified seven and 19 significant associations for SER using genome-wide association study in 2016 and 2017, respectively. Interestingly, we located two lead SNPs (sf0803343504 and sf083344610) on chromosome 8 in the qTSE8 QTL region that were significantly associated with total SER. After transcriptomic analysis, quantitative real-time PCR, and haplotype analysis, we found 13 genes within this reliable region as important candidate genes. Our study results will be beneficial to molecular marker-assisted selection of rice lines with high outcrossing rate, thereby improving the efficiency of hybrid seed production.
Introduction
Over half the global population heavily relies on rice (Oryza sativa L.) as a primary source of nutrition, with the demand set to increase with the growing population. To match the current population growth rate, rice production needs to increase by at least 40 percent by 2030 (Khush, 2005). Therefore, hybrid rice was developed, which showed 10–20% greater yield than most of the conventional rice cultivars. Improving the hybrid rice yield may be one viable method of addressing the potential food scarcity associated with an ever-increasing global population (Cheng et al., 2007; Spielman et al., 2013). Unfortunately, since rice is self-pollinated, achieving sufficient outcrossing to produce hybrid seeds can be difficult (Kato and Nimai, 1987), with poor seed yield being a major hybrid rice production constraint. Therefore, the challenge is to improve the hybrid rice seed production by enhancing rice outcrossing success (Virmani, 1994; Marathi and Jena, 2014). Several flower traits have been linked to hybrid seed production efficiency, anther pollen density and quality, flowering behavior (e.g., anthesis interval and heading date), and stigma size and exsertion of sterile males (Virmani et al., 1982). Exserted stigmas are specifically less affected by glume shielding and remain viable for several days, thereby increasing the likelihood of trapping exotic pollen and consequently improving rice cross-pollination (Sidharthan et al., 2007). Thus, the stigma exsertion rate (SER) is singularly crucial for the enhancement of hybrid rice seed production.
With the continuous advancement of molecular marker technologies over the past several years, researchers have successfully mapped multiple SER-related QTLs in rice utilizing various types of segregating populations, including chromosome segment substitution lines (Rahman et al., 2017; Zhang et al., 2018; Tan et al., 2020, 2021), doubled haploid lines (Hittalmani et al., 2002; Li et al., 2003), F2 populations (Xiong et al., 1999; Yue et al., 2009; Li et al., 2010, 2017; Xu et al., 2019), backcrossing populations (Li et al., 2001; Miyata et al., 2007), and recombinant inbred lines (RILs) (Uga et al., 2003; Yamamoto et al., 2003; Li et al., 2014). Several studies have identified one particular QTL that co-localized with the GS3 gene, which controls grain size, stigma length, and stigma exsertion (Miyata et al., 2007; Takano-Kai et al., 2011). Rahman et al. (2017) and Zhang et al. (2018) dissected two major QTLs (qSE11 and qSE7), demarcating them into precise regions on chromosomes 11 and 7, respectively. Another QTL (qSER7) was fine-mapped to a ~28 kb region on chromosome 7 (Liu et al., 2019). Therefore, these efforts have shown that SER is a particularly complex trait that is strongly affected by the environment.
Although several QTLs have been identified, only a few have either been cloned or fine-mapped. A considerable limitation of the traditional linkage-based QTL mapping is that it allows the study of only two alleles at any particular locus (Dang et al., 2016). Conversely, genome-wide association studies (GWAS), which utilize the linkage disequilibrium (LD) between phenotypes and genotypes, were promising for localizing QTLs controlling complex traits. Another technology which has vastly aided the advancement of GWAS is next-generation high-throughput DNA sequencing (Brachi et al., 2010; Huang et al., 2013). Recently, GWAS-based QTL mapping has successfully identified SER-associated loci (Yan et al., 2009; Huang et al., 2012; Guo et al., 2017). For example, Zhou et al. (2017) used GWAS to identify over 20 stigma exsertion-associated genomic loci, with three of them being co-localized with the three primary genes controlling grain size GS3, GW5, and GW2.
In the present study, we sought to map the rice SER QTLs via linkage analysis that utilizes an RIL population and association analysis by using a natural population. Using these two methods under different environments, we identified a reliable SER QTL on chromosome 8. Based on transcriptomic analysis, quantitative real-time PCR and haplotype analysis, we obtained 13 candidate genes within the identified QTL region. The results will helpful both fine mapping and gene cloning of QTL for SER and also support molecular marker-assisted selection of rice lines with high outcrossing.
Materials and methods
Plant materials and field experiments
Two collections of rice were utilized for this study (Collection 1 and 2). Collection 1, which was used for traditional linkage-based QTL mapping, encompassed 163 F10 RILs developed from Zhenshan 97B (high SER indica rice) and IRAT109 (low SER japonica rice) (Zou et al., 2005; Liu et al., 2008; Lou et al., 2015). Collection 2, which was used for GWAS analysis, encompassed 138 indica subpopulation accessions of the Chinese rice germplasm mini-core collection (Wu et al., 2015; Ma et al., 2016).
Both rice collections were field-grown using conventional rice cultivation methods and staged sowing at the Shanghai Agrobiological Gene Center field stations in Hainan and Shanghai, China. The field sites were arranged in triplicates based on a randomized block design. Rice was sown seven plants per row in five rows, with a spacing of 18 x 16 cm between and within rows. Collection 1 was analyzed during the summer of 2016 in Shanghai, while in spring of 2017 and 2018 in Hainan. Collection 2 was analyzed during the summer of 2016 in Shanghai and spring 2017 in Hainan.
Trait evaluation
Eight panicles from each rice line were sampled 5–7 days post spikelet flowering. For analysis, we subdivided SER into three separate traits: total stigma exsertion rate (TSE), single stigma exsertion rate (SSE), and dual stigma exsertion rate (DSE). The TSE, SSE, and DSE were determined as a percentage of rice spikelets displaying these traits.
Genotyping
The method of Zou et al. (2005) was followed to characterize the Collection 1 genotypes by using 213 simple sequence repeats (SSR) as markers. Collection 2 was subjected to whole-genome resequencing utilizing an Illumina Solexa Hiseq 2000 sequencing system. All raw sequences can be found online: https://www.ncbi.nlm.nih.gov/Traces/index.html?view=run_browser&acc=SRR1239601&display=metadata and http://www.ncbi.nlm.nih.gov/bioproject/PRJNA260762. Clean reads were used to identify single nucleotide polymorphisms (SNPs) using a combination of BCFtools (Li et al., 2009), SAMtools, and BWA (Li and Durbin, 2009). In total, 1,019,883 SNPs were identified. The SNP identification accuracy was evaluated by subjecting 24 accessions to RiceSNP50, a whole-genome, high-density SNP array (Chen H. et al., 2014). Details regarding the specific methods requires for the processing of the genomic data can be found in Chen W. et al. (2014).
Linkage analysis
Phenotypic information was analyzed with SPSS ver. 19. The MAPMAKER/EXP 3.0 was used to construct linkage maps of the different genotypes (Lander et al., 1987). A mixed-model-based composite interval mapping (MCIM) method was used to perform QTL analysis by applying QTLNetwork ver. 2.0 (Yang et al., 2007, 2008). Hypotheses were tested using the Henderson method III F-statistic, with primary QTLs being declared at F > 6.4. By using a significance level of p < 0.05, the threshold was computed using a 1,000-shuffle permutation test (Churchill and Doerge, 1994).
Association analysis
A compressed mixed linear model method (Zhang et al., 2010) was used to conduct the GWAS, utilizing the R package “Genomic Association and Prediction Integrated Tool (GAPIT)” (Lipka et al., 2012). A minimum allelic frequency (MAF) of 5% was used for all SNPs. The reference genome used was Nipponbare (MSU6.0) (http://rice.plantbiology.msu.edu/). The local LD-based interval of reliable significant SNPs was considered the candidate region, where the LD between nearly SNPs and lead SNP (with the lowest p-value) reduced to r2 = 0.6 (Yano et al., 2016).
Transcriptome analysis
During our previous study (Xia et al., 2020), Zhenshan 97B and IRAT109 were planted as three biological replicates in 2014 at the Baihe Experimental Station in Shanghai, China. Three top leaf samples from three individuals of each replicate at the pre-heading stage were collected on August 5th, 2014, and subsequently stored in liquid nitrogen prior to RNA sequencing. The Illumina Hiseq 2500 at Shanghai Majorbio Biopharm Technology Co., Ltd. (Shanghai, China) was used for RNA sequencing. The PureLink® Plant RNA Reagent (Thermo Fisher Scientific, MA, USA) was utilized to extract total RNA. Using SeqPrep (https://github.com/najoshi/sickle), the single reads were created using overlapping paired reads, with the adaptors being stripped. The library was constructed according to the TruSeq® RNA Sample Preparation v2 Guide (Illumina) using qualified RNA. Cufflinks and Tophat were utilized to map clean data to the Nipponbare (MSU6.0) reference genome (http://rice.plantbiology.msu.edu/), allowing two or less alignment mismatches (Trapnell et al., 2012). Raw sequences can be found online: https://www.ncbi.nlm.nih.gov/bioproject/PRJNA609211. The Fragment Per Kilobase of exon per Million fragments mapped (FPKM) method was utilized to determine the gene expression levels by using the Cuffdiff software (Trapnell et al., 2012).
Quantitative real-time PCR analysis
Total RNA was extracted from young panicles (Stage In7 to Stage In8, with panicle lengths of 5–100 mm) of Zhenshan 97B and IRAT109 at the pre-heading stage using TRNzol-A+ Total RNA Reagent (TIANGEN, Beijing, China). The qRT-PCR method was described by a previous study (Liu et al., 2019). The primers were listed in Supplementary Table 1.
Haplotype analysis
Haplotype analysis was performed on all genes in the reliable candidate region. The SNPs within the 2.0 kb promoter region along with the non-synonymous SNPs in the exon regions of all genes in the interval were used to perform haplotype analysis using the R software.
Results
Phenotypic analysis
The basic SER traits of Collection 1 (RILs) and Collection 2 across 3 years are shown in Table 1. For Collection 1, both the single and dual SERs of Zhenshan 97B were superior to those of IRAT109. Because of the nature of Collection 2, it displayed a wider range and lower coefficient of variation for all SER traits compared to Collection 1. The TSE, SSE, and DSE exhibited environmentally-dependent correlations with each other (Table 2 and Supplementary Table 2). During the spring of 2018 in Hainan, the SSE (SSE2018) and TSE (TSE2018) exhibited the strongest phenotypic correlation (r = 0.987), followed by DSE2018 and TSE2018 (r = 0.794) and SSE2018 and DSE2018 (r = 0.684). The results were similar in the other two environments. Overall, the lines with the greatest SSE were also likely to exhibit increased DSE and TSE.
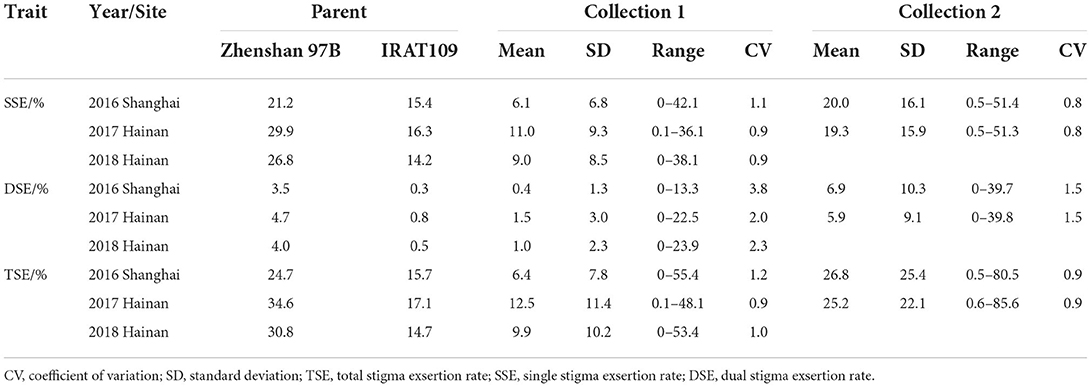
Table 1. Phenotypic information regarding the stigma exsertion rate of the parents and two collections across 3 years.
Linkage-based QTL mapping
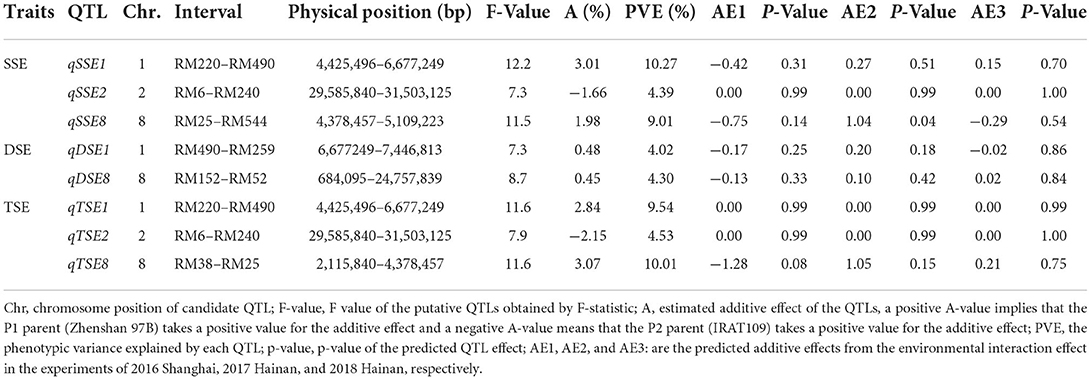
Previously, a set of 213 SSRs was utilized to create a linkage map of the RIL population (Zou et al., 2005), which was utilized here, along with phenotypic data, for SER QTL mapping (Table 3). We identified eight SER QTLs distributed on chromosomes 1, 2, and 8, with the QTL F-values ranging from 7.3 to 12.2 that explained a range of the phenotypic variation of 4.02–10.27%. Among these, we discovered three QTLs for TSE on chromosomes 1, 2, and 8 (Supplementary Figure 1). The QTL-qTSE8, flanked by RM38 and RM25, had the largest additive effect and explained 10.01% of the phenotypic variation. Both alleles, i.e., qTSE1 and qTSE8 were inherited from Zhenshan 97B, whereas the alleles qTSE2 was derived from IRAT109. For SSE, we found three QTLs on chromosomes 1, 2 and 8 (Supplementary Figure 2). The QTL-qSSE1, flanked by RM220 and RM490, explained 10.27% of the variation in phenotypes. qSSE1 and qSSE8 indicated a positive additive effect, whereas qSSE2 demonstrated a negative effect. For DSE, two QTLs (qDSE1 and qDSE8) derived from the parent Zhenshan 97B, were discovered on chromosomes 1 and 8 (Supplementary Figure 3). The ratio of environmental variation to phenotypic variation [V(E)/V(P)] was 24.67%, while the ratio of variation due to environment x genotype and phenotypic variation [V(GE)/V(P)] was 4.40%, thereby suggesting that environmental factors only had a minor effect.
LD-based association mapping
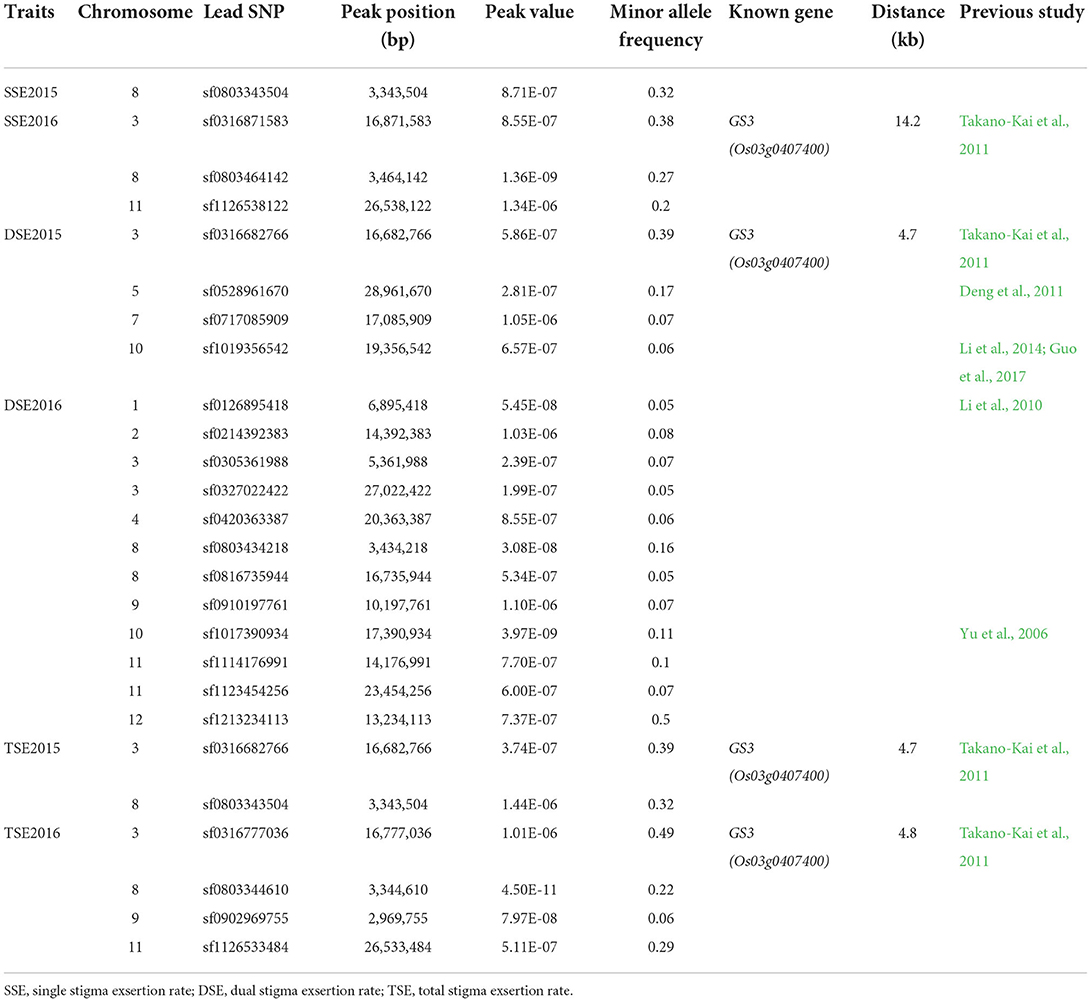
Genotyping of Collection 2 yielded 1,019,883 SNP markers, with a mean distribution of 2.7 SNPs per kb. The majority of these were located in the intergeneric regions (69.6%), with a minority located within coding sequences (13.2%). Utilizing the phenotypic information of 138 Collection 2 accessions, a GWAS was performed using GAPIT (MAF > 5%), with -log(P) ≥ 6.0 as the threshold at a significance level of p < 0.01. For SER (2016SH), we found two, one, and four significant associations for TSE, SSE, and DSE, respectively (Figures 1A–C). We identified a particularly strong signal at the same 3,343,504 bp locus on chromosome 8 for both SSE and TSE. Also, we found the associated SNP sf0316682766 on chromosome 3 near GS3 for both TSE and DSE. We detected other TSE-associated loci on chromosomes 3 and 4, and also other DSE-associated loci on chromosomes 3, 5, 7, and 10. In total, we discovered nineteen significant loci, including three for SSE, twelve for DSE, and four for TSE in 2017HN (Figures 1D–F). The associated loci were distributed on chromosomes 1, 2, 3, 4, 8, 9, 10, 11, and 12, respectively. Two lead SNPs (sf0316871583 and sf0316777036) located on chromosome 3 were associated with SSE and TSE, respectively. Furthermore, the three lead SNPs (sf0803464142, sf0803434218, and sf0803344610) located on chromosome 8 were associated with SSE, DSE and TSE, respectively (Table 4).
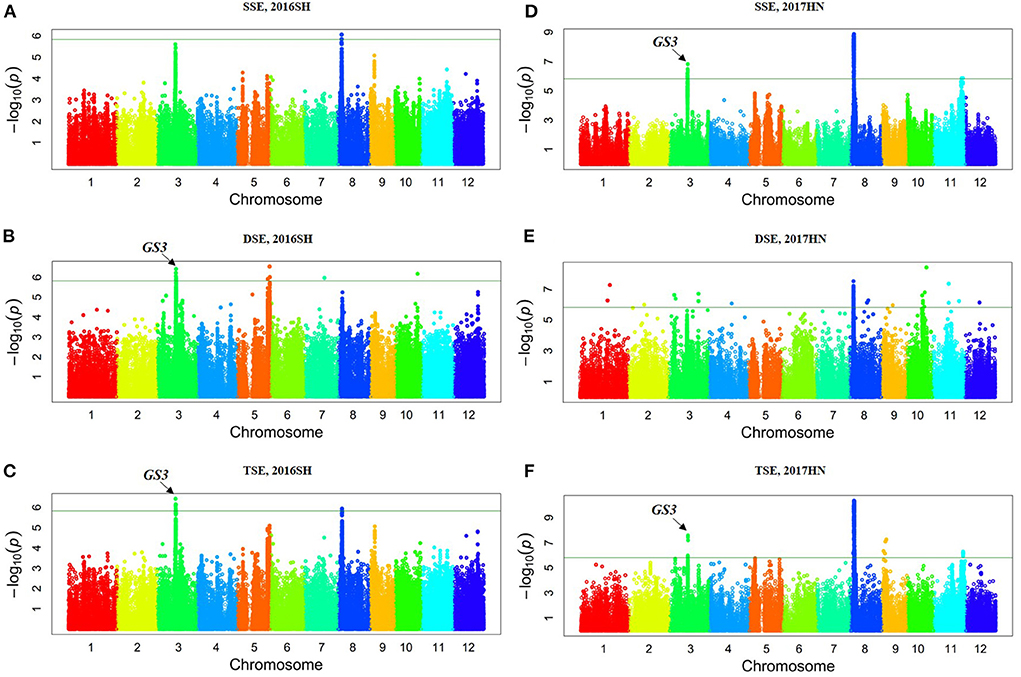
Figure 1. Manhattan plots of genome-wide association mapping for the stigma exsertion rate in Collection 2. 2016SH: 2016 Shanghai (A–C); 2017HN: 2017 Hainan (D–F); TSE, total stigma exsertion rate; SSE, single stigma exsertion rate; DSE, dual stigma exsertion rate.
Comparison of results from QTL and GWAS
According to QTL analysis, we found that qTSE8 on chromosome 8 (RM38-RM25, Chr8: 2,115,840–4,378,457) was associated with TSE (Table 3). Similarly, according to the GWAS analysis, the two peak position SNPs (sf0803343504 and sf083344610) on chromosome 8 were associated with TSE in 2016 and 2017 (Figure 1 and Table 4). Notably, we identified and found that these two associated loci were located in the QTL qTSE8 region via linkage-based mapping.
Identification of candidate genes
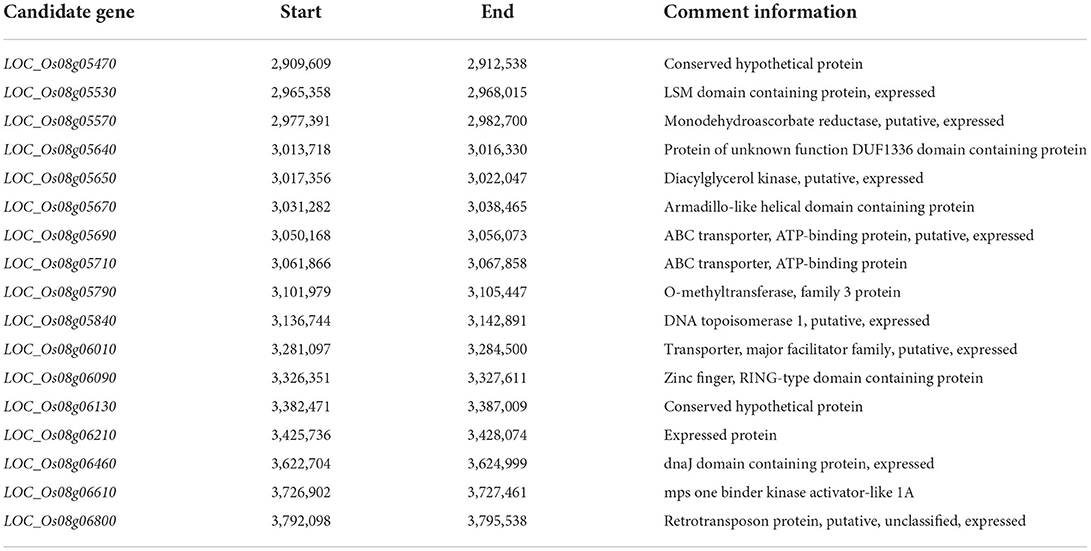
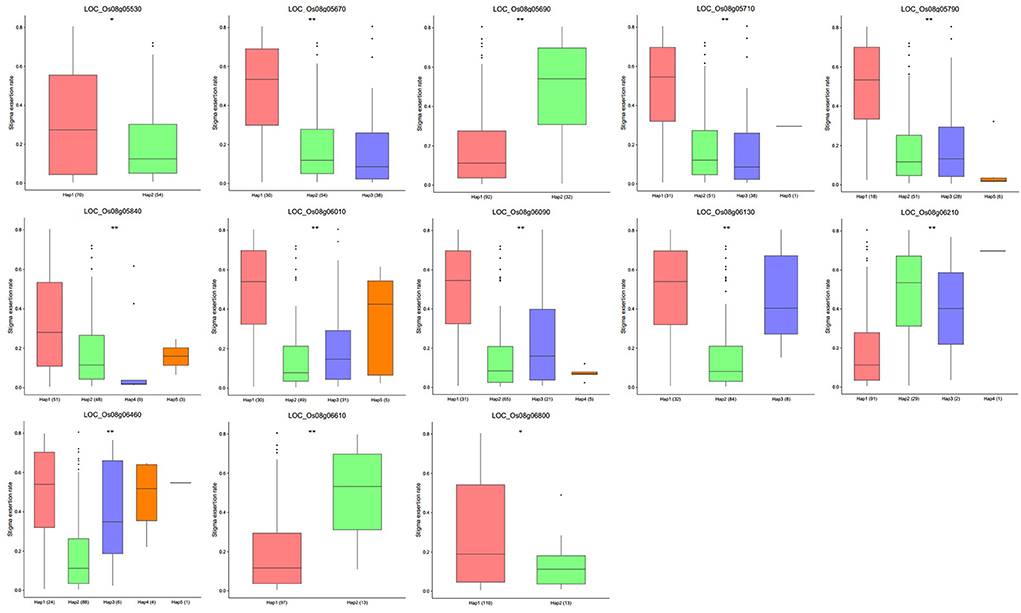
According to the colocalization results, qTSE8 can be considered as a reliable locus. We reduced the candidate interval of qTSE8 on chromosome 8 to 900 kb (2.90–3.80 Mb, r2 of LD > 0.6), and found there were 20 genes within this region, showing significantly different gene expression levels between Zhenshan 97B and IRAT109 based the transcriptome data (Supplementary Table 3). Furthermore, we evaluated these twenty genes via qRT-PCR in the young panicle tissues of the two parents to verify the varying expression levels of the candidate genes. Besides LOC_Os08g06415, LOC_Os08g06560, and LOC_Os08g06840, the expression levels of the other 17 genes showed significant or extremely significant differences between Zhenshan 97B and IRAT109 (Figure 2). According to the rice genome annotation database, these 17 candidate genes, included 13 functionally annotated genes, two genes encoding a conserved hypothetical protein, one gene encoding a protein with unknown functions, and one gene encoding retrotransposon protein (Table 5). The FPKM and qRT-PCR results of the 17 genes have the same trend (Figure 2 and Supplementary Table 3). The expression of most candidate genes in Zhenshan 97B was significantly higher than that in IRAT109. We conducted haplotype analysis on both the SNPs lying within the promoter region and the non-synonymous SNPs in the exon region of those 17 candidate genes. Among them, 13 genes were associated with significant differences in the SER among the different haplotypes (Figure 3 and Supplementary Table 4). The other 4 genes (LOC_Os08g05470, LOC_Os08g05570, LOC_Os08g05640, and LOC_Os08g05650) exhibited no significant differences regarding the SER between different haplotypes. Two haplotypes were found for LOC_Os08g05530, LOC_Os08g05690, LOC_Os08g06610, and LOC_Os08g06800. Three haplotypes were found for LOC_Os08g05670 and LOC_Os08g06130. The other genes were divided into four or five haplotypes. Combined with these analysis results, we finally obtained 13 rice SER-related genes in the candidate interval, which should be focused on in subsequent research.
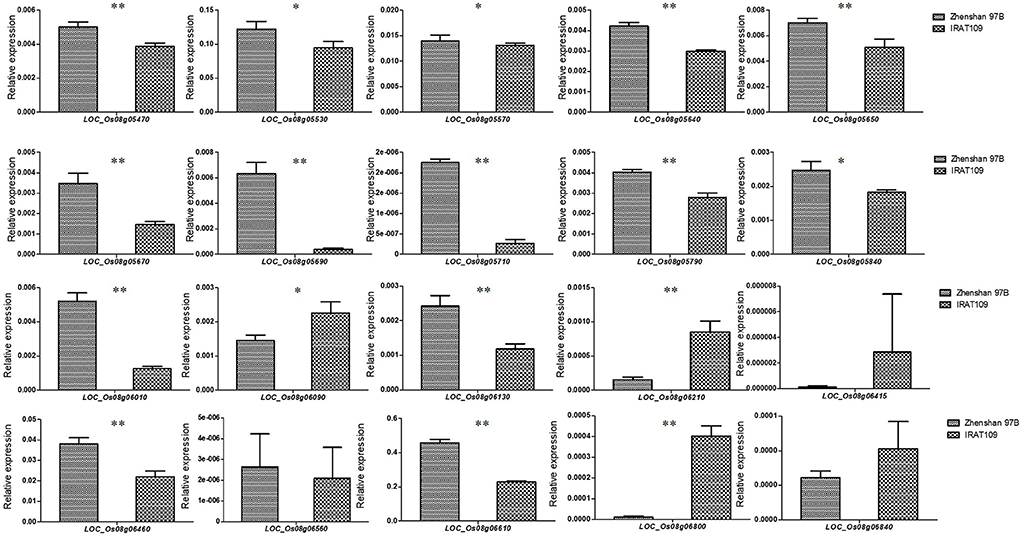
Figure 2. The qRT-PCR analysis of the expression of candidate genes between Zhenshan 97B and IRAT109. *p < 0.05; **p < 0.01; Student's t-test. Values are the mean ± SD with three biological replicates.
Discussion
One crucial trait for the improvement of hybrid rice seed production is SER, a trait linked to the female parent. Research on SER indicates that stigma exsertion is not only regulated by QTLs, but also potentially affected by environmental conditions. Although multiple SER-associated QTLs have been characterized to date, few were placed within a 500 kb interval on the chromosomes (Tan et al., 2021). Unfortunately, traditional QTL mapping of bi-parental crosses is imprecise, and it can only identify the better alleles between the two parents. QTL mapping with GWAS has shown promise for precisely localizing QTLs. GWAS makes the fine-scale mapping of QTLs possible because it utilizes linkage disequilibrium (LD) to explore the interconnection between the phenotypic variation and genotype (Mackay et al., 2009; Guo et al., 2017). The two mapping strategies are complementary to each other in terms of accuracy and breadth of QTL location, information provided, statistical analysis methods, etc. Therefore, combining the two mapping strategies can greatly improve the study of complex quantitative traits (Lou et al., 2015).
In this study, we combined both LD-based and linkage-based mapping to understand the genetic foundation of SER in rice. The QTLs detected for SSE also matched TSE, and we also found that these two traits were highly correlated. Using the RIL population grown in different environments, we detected eight SER QTLs. Three QTLs, namely, qSSE1, qDSE1, and qTSE1 showed chromosomal regions overlapping with those previously described in Li et al. (2010), Li et al. (2014), and Rahman et al. (2017), respectively. The QTLs qSSE8 and qTSE8 were identified adjacent to the chromosomal regions qSPES-8 and qPES-8 identified previously (Deng et al., 2010). Taken together, these findings confirm the accuracy of our identified QTLs.
We detected seven and 19 significant loci through LD-based association analysis in 2016SH and 2017HN, respectively. Furthermore, we detected the same significant SER-associated peak on chromosome 3 near GS3 in 2 years (p < 10−6). Previous research indicated that the GS3 gene controled stigma exsertion (Takano-Kai et al., 2011; Zhou et al., 2017). Our study confirmed that the grain length gene GS3 indeed affected SER, thereby indicating that our GWAS results were reliable. We found the significant DSE loci on chromosomes 1, 5, and 10 to be located within regions of the genome containing the previously identified QTLs for the same trait (Table 4) (Yu et al., 2006; Li et al., 2010, 2014; Deng et al., 2011; Guo et al., 2017).
The combination of GWAS and linkage mapping successfully addressed the constraints imposed by either method used separately. In this study, both GWAS and QTL mapping concurrently detected a single, reliable, colocalized QTL, qTSE8 which likely contains important SER-associated genes. The identification and functional study of these genes is imperative to thoroughly decipher both the molecular and genetic foundation of SER. Transcriptomic analysis is another powerful method for mining genes associated with a given trait. Previously (Xia et al., 2020), we had performed a transcriptomic analysis of the two RIL parental lines, and upon comparing with the results of FPKM and qRT-PCR, we found 17 candidate genes showing significant differences in expression levels between the two parents at reliable interval. Additionally, 13 candidate genes were associated with significant differences in the SER among different haplotypes. Taken together, these results illustrate that combining association and linkage mapping with RNA-seq can be a robust approach to mine for target genes.
Data availability statement
Publicly available datasets were analyzed in this study. This data can be found at: http://www.ncbi.nlm.nih.gov/bioproject/PRJNA260762; http://www.ncbi.nlm.nih.gov/bioproject/PRJNA609211.
Author contributions
YL: writing—original draft, writing—review and editing, and funding acquisition. DF: resource and investigation. DK, AZ, and FW: investigation. XM, LW, HX, and GL: methodology. XY: supervision and funding acquisition. LL: conceptualization, supervision, and writing—review and editing. All authors contributed to the article and approved the submitted version.
Funding
This work was supported by the Shanghai Municipal Commission of Science and Technology (21ZR1456800 and 19391900100) and Open Funding Project of the State Key Laboratory of Biocatalysis and Enzyme Engineering (SKLBEE2021023).
Conflict of interest
The authors declare that the research was conducted in the absence of any commercial or financial relationships that could be construed as a potential conflict of interest.
Publisher's note
All claims expressed in this article are solely those of the authors and do not necessarily represent those of their affiliated organizations, or those of the publisher, the editors and the reviewers. Any product that may be evaluated in this article, or claim that may be made by its manufacturer, is not guaranteed or endorsed by the publisher.
Supplementary material
The Supplementary Material for this article can be found online at: https://www.frontiersin.org/articles/10.3389/fpls.2022.982240/full#supplementary-material
References
Brachi, B., Faure, N., Horton, M., Flahauw, E., Vazquez, A., Nordborg, M., et al. (2010). Linkage and association mapping of Arabidopsis thaliana flowering time in nature. PLoS Genet. 6, e1000940. doi: 10.1371/journal.pgen.1000940
Chen, H., Xie, W., He, H., Yu, H., Chen, W., Li, J., et al. (2014). A high-density SNP genotyping array for rice biology and molecular breeding. Mol. Plant 7, 541–553. doi: 10.1093/mp/sst135
Chen, W., Gao, Y., Xie, W., Gong, L., Lu, K., Wang, W., et al. (2014). Genome wide association analyses provide genetic and biochemical insights into natural variation in rice metabolism. Nat. Genet. 46, 714–721. doi: 10.1038/ng.3007
Cheng, S., Zhuang, J., Fan, Y., Du, J., and Cao, L. (2007). Progress in research and development on hybrid rice: a super-domesticate in China. Ann. Bot. 100, 959–966. doi: 10.1093/aob/mcm121
Churchill, G., and Doerge, R. (1994). Empirical threshold values for quantitative trait mapping. Genetics 138, 963–971. doi: 10.1093/genetics/138.3.963
Dang, X., Liu, E., Liang, Y., Liu, Q., Breria, C., and Hong, D. (2016). QTL detection and elite alleles mining for stigma traits in Oryza sativa by association mapping. Front. Plant Sci. 7:1188. doi: 10.3389/fpls.2016.01188
Deng, Y., Xiao, C., Deng, H., Zhang, H., Deng, X., and Liu, Y. (2011). Detection of QTL related to stigma exsertion rate (SER) in rice (Oryza sativa L.) by bulked segregant analysis. Res. Agric. Modern 32, 230–233. doi: 10.3969/j.issn.1000-0275.2011.02.024
Deng, Y., Ying, J., Shi, Y., Xiao, C., and Zhang, H. (2010). Mapping of QTLs for percentage of exserted stigma in rice. J. Hunan Agric. Univers. 36, 373–376. doi: 10.3724/SP.J.1238.2010.00373
Guo, L., Qiu, F., Gandhi, H., Kadaru, S., De, A. E., Zhuang, J., et al. (2017). Genome-wide association study of outcrossing in cytoplasmic male sterile lines of rice. Sci. Rep. 7, 3223. doi: 10.1038/s41598-017-03358-9
Hittalmani, S., Shashidhar, H. E., Bagali, P. G., Huang, N., Sidhu, J. S., Singh, V. P., et al. (2002). Molecular mapping of quantitative trait loci for plant growth, yield and yield related traits across three diverse locations in a doubled haploid rice population. Euphytica 125, 207–214. doi: 10.1023/A:1015890125247
Huang, X., Kurata, N., Wei, X., Wang, Z., Wang, A., Zhao, Q., et al. (2012). A map of rice genome variation reveals the origin of cultivated rice. Nature 490, 497–501. doi: 10.1038/nature11532
Huang, X., Lu, T., and Han, B. (2013). Resequencing rice genomes: an emerging new era of rice genomics. Trends Genet. 29, 225–232. doi: 10.1016/j.tig.2012.12.001
Kato, H., and Nimai, H. (1987). Floral characteristics and environmental factors for increasing natural outcrossing rate for F1 hybrid seed production of rice Oryza sativa L, Jpn. J. Breed. 37, 318–330. doi: 10.1270/jsbbs1951.37.318
Khush, G. (2005). What it will take to feed 5.0 billion rice consumers in 2030. Plant Mol. Biol. 59, 1–6. doi: 10.1007/s11103-005-2159-5
Lander, E., Green, P., Abrahamson, J., Barlow, A., Daley, M., Lincoln, S., et al. (1987). MAPMAKER: an interactive computer package for constructing primary genetic linkage maps of experimental and natural populations. Genomics 1, 174–118. doi: 10.1016/0888-7543(87)90010-3
Li, C., Sun, C., Mu, P., Chen, L., and Wang, X. (2001). QTL analysis of anther length and ratio of stigma exsertion, two key traits of classification for cultivated rice (Oryza sativa L.) and common wild rice (Oryza rufpogon Grif.). Acta. Genet. Sin. 28, 746–751.
Li, H., and Durbin, R. (2009). Fast and accurate short read alignment with Burrows-Wheeler transform. Bioinformatics 25, 1754–1760. doi: 10.1093/bioinformatics/btp324
Li, H., Gao, F., Zeng, L., Li, Q., Lu, X., Li, Z., et al. (2010). QTL analysis of rice stigma morphology using an introgression line from Oryza longistaminata L. Mol. Plant Breed. 8, 1082–1089. doi: 10.3969/mpb.008.001082
Li, H., Handsaker, B., Wysoker, A., Fennell, T., Ruan, J., Homer, N., et al. (2009). The sequence alignment/map format and SAMtools. Bioinformatics 25, 2078–2079. doi: 10.1093/bioinformatics/btp352
Li, P., Feng, F., Zhang, Q., Chao, Y., Gao, G., and He, Y. (2014). Genetic mapping and validation of quantitative trait loci for stigma exsertion rate in rice. Mol. Breed. 34, 2131–2138. doi: 10.1007/s11032-014-0168-2
Li, W., Dong, G., Hu, X., Teng, S., Guo, L., Zeng, D., et al. (2003). QTL analysis for percentage of exserted stigma in rice (Oryza sativa L.). Acta. Genet. Sin. 30, 637–640.
Li, W., Sheng, Z., Zhu, Z., Wei, X., Shi, L., Wu, Y., et al. (2017). QTL mapping of japonica rice stigma exsertion rate. Chin. J. Rice Sci. 31, 23–30. doi: 10.16819/j.1001-7216.2017.6043
Lipka, A., Tian, F., Wang, Q., Peiffer, J., Li, M., Bradbury, P., et al. (2012). GAPIT: genome association and prediction integrated tool. Bioinformatics 28, 2397–2399. doi: 10.1093/bioinformatics/bts444
Liu, G., Mei, H., Yu, X., Zou, G., Liu, H., Hu, S., et al. (2008). QTL analysis of panicle neck diameter, a trait highly correlated with panicle size, under well-watered and drought conditions in rice (Oryza sativa L.). Plant Sci. 174, 71–77. doi: 10.1016/j.plantsci.2007.09.011
Liu, Y., Zhang, A., Wang, F., Kong, D., Li, M., Bi, J., et al. (2019). Fine mapping a quantitative trait locus, qSER-7, that controls stigma exsertion rate in rice (Oryza sativa L.). Rice 12, 46. doi: 10.1186/s12284-019-0304-z
Lou, Q., Chen, L., Mei, H., Wei, H., Feng, F., Wang, P., et al. (2015). Quantitative trait locus mapping of deep rooting by linkage and association analysis in rice. J. Exp. Bot. 66, 4749–4757. doi: 10.1093/jxb/erv246
Ma, X., Feng, F., Wei, H., Mei, H., Xu, K., Chen, S., et al. (2016). Genome-wide association study for plant height and grain yield in rice under contrasting moisture regimes. Front. Plant Sci. 7, 1801. doi: 10.3389/fpls.2016.01801
Mackay, T., Stone, E., and Ayroles, J. (2009). The genetic of quantitative traits: challenges and prospects. Nat. Rev. Genet. 10, 567–577. doi: 10.1038/nrg2612
Marathi, B., and Jena, K. K. (2014). Floral traits to enhance outcrossing for higher hybrid seed production in rice: present status and future prospects. Euphytica 201, 1–14. doi: 10.1007/s10681-014-1251-9
Miyata, M., Yamamoto, T. T., and Nitta, N. (2007). Marker-assisted selection and evaluation of the QTL for stigma exsertion under japonica rice genetic background. Theor. Appl. Genet. 114, 539–548. doi: 10.1007/s00122-006-0454-4
Rahman, M. H., Zhang, Y., Zhang, K., Rahman, M. S., Barman, H. N., Riaz, A., et al. (2017). Genetic dissection of the major quantitative trait locus (qSE11), and its validation as the major infuence on the rate of stigma exsertion in rice (Oryza sativa L.). Front. Plant Sci. 8, 1818. doi: 10.3389/fpls.2017.01818
Sidharthan, B., Thiyagarajan, K., and Manonmani, S. (2007). Cytoplasmic male sterile lines for hybrid rice production. J. Appl. Sci. Res. 3, 935–937.
Spielman, D., Kolady, D., and Ward, P. (2013). The prospects for hybrid rice in India. Food Secur. 5, 651–665. doi: 10.1007/s12571-013-0291-7
Takano-Kai, N., Doi, K., and Yoshimura, A. (2011). GS3 participates in stigma exsertion as well as seed length in rice. Breed. Sci. 61, 244–250. doi: 10.1270/jsbbs.61.244
Tan, Q., Wang, C., Luan, X., Zheng, L., Ni, Y., Yang, W., et al. (2021). Dissection of closely linked QTLs controlling stigma exsertion rate in rice by substitution mapping, Theor. Appl. Genet. 134, 1253–1262. doi: 10.1007/s00122-021-03771-9
Tan, Q., Zou, T., Zheng, M., Ni, Y., Luan, X., Li, X., et al. (2020). Substitution mapping of the major quantitative trait loci controlling stigma exsertion rate from Oryza glumaepatula. Rice 13, 37. doi: 10.1186/s12284-020-00397-1
Trapnell, C., Roberts, A., Goff, L., Pertea, G., Kim, D., Kelley, D. R., et al. (2012). Differential gene and transcript expression analysis of RNA-seq experiments with TopHat and cufflinks. Nat. Protoc. 7, 562–578. doi: 10.1038/nprot.2012.016
Uga, Y., Fukuta, Y., Cai, H., Iwata, H., Ohsawa, R., Morishima, H., et al. (2003). Mapping QTLs influencing rice floral morphology using recombinant inbred lines derived from a cross between Oryza sativa L. and Oryza rufpogon Griff. Teor. Appl. Genet. 107, 218–226. doi: 10.1007/s00122-003-1227-y
Virmani, S. S. (Ed.). (1994). “Floral traits influencing outcrossing in rice,” in Heterosis and Hybrid Rice Breeding (Berlin: Springer), 88–91. doi: 10.1007/978-3-642-85115-5
Virmani, S. S., Aquino, R. C., and Khush, G. S. (1982). Heterosis breeding in rice (Oryza sativa L.). Theor. Appl. Genet. 63, 373–380. doi: 10.1007/BF00303911
Wu, J., Feng, F., Lian, X., Teng, X., Wei, H., Yu, H., et al. (2015). Genome-wide Association Study (GWAS) of mesocotyl elongation based on re-sequencing approach in rice. BMC Plant Biol. 15, 218. doi: 10.1186/s12870-015-0608-0
Xia, H., Ma, X., Xu, K., Wang, L., Liu, H., Chen, L., et al. (2020). Temporal transcriptomic differences between tolerant and susceptible genotypes contribute to rice drought tolerance. BMC Genomics 21, 776. doi: 10.1186/s12864-020-07193-7
Xiong, L. Z., Liu, K. D., Dai, X. K., Xu, C. G., and Zhang, Q. (1999). Identification of genetic factors controlling domestication-related traits of rice using an F2 population of a cross between Oryza sativa and O. rufipogon. Theor. Appl. Genet. 98, 243–251. doi: 10.1007/s001220051064
Xu, S., Zheng, Y., Liu, Y., Guo, X., Tan, Y., Qian, Q., et al. (2019). Identification of a major quantitative trait locus and its candidate underlying genetic variation for rice stigma exsertion rate. The Crop J. 7, 350–359. doi: 10.1016/j.cj.2018.11.006
Yamamoto, T. T., Takemori, N., and Sue, N. (2003). QTL analysis of stigma exsertion in rice. Rice Genet. News. 10, 33–34.
Yan, W. G., Li, Y., Agrama, H. A., Luo, D., Gao, F., Lu, X., et al. (2009). Association mapping of stigma and spikelet characteristics in rice (Oryza sativa L.). Mol. Breed. 24, 277–292. doi: 10.1007/s11032-009-9290-y
Yang, J., Hu, C., Hu, H., Yu, R., Xia, Z., Ye, X., et al. (2008). QTLNetwork: mapping and visualizing genetic architecture of complex traits in experimental populations. Bioinformatics 24, 721–723. doi: 10.1093/bioinformatics/btm494
Yang, J., Zhu, J., and Williams, R. (2007). Mapping the genetic architecture of complex traits in experimental populations. Bioinformatics 23, 1527–1536. doi: 10.1093/bioinformatics/btm143
Yano, K., Yamamoto, E., Aya, K., Takeuchi, H., Lo, P. C., Hu, L., et al. (2016). Genome-wide association study using whole-genome sequencing rapidly identifies new genes influencing agronomic traits in rice. Nat. Genet. 48, 927–934. doi: 10.1038/ng.3596
Yu, X., Mei, H., Luo, L., Liu, L., Liu, H., Zou, G., et al. (2006). Dissection of additive, epistatic effect and Q × E interaction of quantitative trait loci influencing stigma exsertion under water stress in rice. Acta. Genet. Sin. 33, 542–550. doi: 10.1016/S0379-4172(06)60083-8
Yue, G., Mei, H., Pan, B., Lou, J., Li, M., and Luo, L. (2009). Mapping of QTLs affecting stigma exsertion rate of Huhan 1B as a CMS maintainer of upland hybrid rice. Acta Agric. Zhejianggensis 21, 241–245.
Zhang, K., Zhang, Y., Wu, W., Zhan, X., Anis, G. B., Rahman, M. H., et al. (2018). qSE7 is a major quantitative trait locus (QTL) influencing stigma exsertion rate in rice (Oryza sativa L.). Sci. Rep. 8, 14523. doi: 10.1038/s41598-018-32629-2
Zhang, Z., Ersoz, E., Lai, C., Todhunter, R., Tiwari, H., Gore, M., et al. (2010). Mixed linear model approach adapted for genome-wide association studies. Nat. Genet. 42, 355–360. doi: 10.1038/ng.546
Zhou, H., Li, P., Xie, W., Hussain, S., Li, Y., Xia, D., et al. (2017). Genome-wide association analyses reveal the genetic basis of stigma exsertion in rice. Mol. Plant. 10, 634–644. doi: 10.1016/j.molp.2017.01.001
Keywords: quantitative trait locus (QTL), genome-wide association study (GWAS), transcriptome analysis, stigma exsertion rate (SER), rice
Citation: Liu Y, Fu D, Kong D, Ma X, Zhang A, Wang F, Wang L, Xia H, Liu G, Yu X and Luo L (2022) Linkage mapping and association analysis to identify a reliable QTL for stigma exsertion rate in rice. Front. Plant Sci. 13:982240. doi: 10.3389/fpls.2022.982240
Received: 30 June 2022; Accepted: 04 August 2022;
Published: 23 August 2022.
Edited by:
Kaijing Zuo, Shanghai Jiao Tong University, ChinaReviewed by:
Youlu Yuan, Cotton Research Institute (CAAS), ChinaGuiquan Zhang, South China Agricultural University, China
Copyright © 2022 Liu, Fu, Kong, Ma, Zhang, Wang, Wang, Xia, Liu, Yu and Luo. This is an open-access article distributed under the terms of the Creative Commons Attribution License (CC BY). The use, distribution or reproduction in other forums is permitted, provided the original author(s) and the copyright owner(s) are credited and that the original publication in this journal is cited, in accordance with accepted academic practice. No use, distribution or reproduction is permitted which does not comply with these terms.
*Correspondence: Xinqiao Yu, eXV4cTY2QDEyNi5jb20=; Lijun Luo, bGlqdW5Ac2FnYy5vcmcuY24=
†These authors have contributed equally to this work and share first authorship
 Yi Liu
 Dong Fu
 Deyan Kong1,2
 Xiaosong Ma
 Lei Wang
 Hui Xia
 Lijun Luo
