 Peiyu Tian
 Jiamin Liu
 Yang Wang
94% of researchers rate our articles as excellent or good
Learn more about the work of our research integrity team to safeguard the quality of each article we publish.
Find out more
ORIGINAL RESEARCH article
Front. Plant Sci., 23 September 2022
Sec. Crop and Product Physiology
Volume 13 - 2022 | https://doi.org/10.3389/fpls.2022.974714
This article is part of the Research TopicRecent Advances on Nitrogen Use Efficiency in Crop Plants and Climatic ChallengesView all 29 articles
The contributions of the different leaf layers to maize yields identified as middle leaf > lower leaf > upper leaf, where the vertical photosynthetically active radiation (PAR) in the canopy gradually decreases. We hypothesized that the allocation of more PAR and nitrogen (N) to the highest contributing leaves will would be beneficial for higher yields and N use efficiencies. The N application rate and plant density effectively regulated the canopy light and N distribution. We evaluated the interactive effects of N rate and plant density on the agronomic and ecophysiological characteristics of leaves at different orientations in a 2019/2020 field experiment. In this study, an N application rate of 180 kg ha–1 coupled with a plant density of 82,500 plants ha–1 achieved the highest yield and N recovery efficiency (NRE). In contrast to the traditional farming practices in northern China, the density was increased and N rate was reduced. Densification from 52,500 to 82,500 plants ha–1 increased the population leaf area index (LAI) by 37.1% and total photosynthetically active radiation (TPAR) by 29.2%; however, excessive density (from 82,500 to 97,500 plants ha–1) drastically reduced the proportion of TPAR by 28.0% in the lower leaves. With increased density, the leaf areas and angles of the upper leaves decreased much more than those of the other leaves, which allowed the middle and lower leaves to access more light, which manifested a smaller extinction coefficient for light (KL). A high yield (>1,000 kg ha–1) of maize could be achieved simultaneously with higher NRE; however, it was negatively correlated with internal N use efficiency (IEN). Higher N concentrations and lower total performance index (PItotal) in the lower leaves may be an important rationale for the reduction of IEN in high-yielding maize. Additionally, decreased N rate without yield reduction under higher densities was primarily attributed to the more uniform vertical N distribution [a smaller extinction coefficient for N (KN)]. These results suggest that the N fertilizer rate can be moderately reduced without a reduction in maize yield under high plant densities in northern China.
Maize (Zea mays L.) is a major cereal crop worldwide and a staple food in developing countries (Nedi et al., 2016). Increasing grain yields with reduced inputs is an important goal for sustainable agriculture. Maize grain yield is positively related to the number of kernels per unit land area. Kernels arise from well-developed and pollinated female florets, that are borne by spikelet meristems derived from the inflorescence meristem (Ning et al., 2021). For high-yield maize breeding, kernel number per ear is one of the key breeding targets (Zhou et al., 2015). In cultivation, there are two approaches for increasing the kernel number per unit area: (i) increasing the number of grains per unit area by increasing the planting density and (ii) increasing the number of florets under the same planting density to increase the number of grains per ear (Yan et al., 2018). The former needs to overcome the adverse effects of dense planting conditions on floret development, whereas the latter requires improvements in the activities of inflorescence and florets, which can increase the number of fertile florets (Cheng et al., 1983).
In China, most farmers produce maize under conditions of low plant density and high fertilizer input. In practice, low plant densities (5.0–6.0 plants m–2) and the over-application of Nitrogen (N) fertilizer (approximately 250 kg N ha–1) restrict yields and N use efficiencies (Jin et al., 2012). In contrast, grain yields as high as 15.2 t ha–1 have been achieved in some studies under high plant densities (9.0–10.5 plants m–2) and N inputs (approximately 750 kg N ha–1) in northern China (Li et al., 2001). Therefore, appropriate plant densities combined with optimal N management are likely to increase grain yields and N use efficiency (Yan et al., 2016).
N is the most limiting nutrient in maize production; thus, it is required in larger amounts than to other nutrients (Correndo et al., 2021). During the silking stage, maize exhibits a reduced vegetative plant N accumulation rate and increased N remobilization rate (from vegetative organs to grains). Thus, deficiencies in N accumulation prior to anthesis affect kernel numbers of reductions in carbon assimilation (Uhart and Andrade, 1995). Limited N decreases starch deposition in the maize endosperm, which resulting in a decline in kernel weight, primarily through its influence on the synthesis of sucrose synthase, hexokinase, and pyrophosphate-linked phosphofructokinase (Singletary and Below, 1990). Consequently, to ensure high yields, N fertilizer overdosing relative to the actual needs of plants is practiced by most farmers in China (Xu et al., 2017). However, the overapplication of N fertilizer enhances N losses through runoff, denitrification, leaching, and volatilization (Li et al., 2018; Hou et al., 2021). Furthermore, high N fertilizer inputs lead to luxury absorption, and increased the risks of lodging, diseases, and pests (Kruczek, 2003).
Plant density influences the light environment of plant canopies (Luo et al., 2018). This is because the leaf area and angle of a single plant are reduced with increasing plant density, whereas the upper leaf area is increased, which inhibits light interception of the middle and lower leaves (Mina, 2013; Al-Naggar and Atta, 2017). Ecological studies have demonstrated that light harvesting is of paramount importance for plants growing in light competitive environments such as dense stands (Hou et al., 2019). In the upper canopy layer, the allocation of N to the photosynthetic apparatus of the leaves increases with higher radiation, which results in enhanced N use efficiencies. In contrast, N allocations in the mid- and lower-canopy layers decrease with higher plant densities, resulting in a reduction of light-saturated photosynthetic rates and photosynthetic N use efficiencies in leaves (Yao et al., 2016). An appropriate maize plant density provides a good microecological environment that is beneficial for individual plants as well as coordination between groups (Shi et al., 2016). From this perspective, medium plant densities are optimal as they facilitate the highly efficient utilization of light, the superior spatial allocation of leaf N to the photosynthetic apparatus, and high use efficacy of photosynthetic N in leaves within the canopy (Yao et al., 2016). This strategy has been employed to increase the yields of wheat (Liu et al., 2021; Zheng et al., 2021), cotton (Li et al., 2017), rice (Hou et al., 2019), and oilseed rape (Labra et al., 2020).
It is noteworthy that the accumulation of N in individual plants decreases with higher plant densities (Wang et al., 2020), because crowding stress reduces the capacity of plants to absorb soil N (Yan et al., 2017). Thus, more N fertilizer is required as planting density increases. Except for a few reports of super high-yielding crops, most studies have concluded that increased plant densities with reduced N inputs can improve their efficacy while maintaining grain yields (Dong et al., 2019; Du et al., 2021). This raises the question of why high N inputs under high plant densities do not attain high yields. Furthermore, the optimal plant density optimizes the distribution of N in maize to enhance its efficiency. In this study, we compared the agronomic and photochemical characteristics of different canopy layers at various N input rates and plant densities. Furthermore, we clarified the effects of light and leaf N matching on maize yields and N use efficiencies.
Field experiments were conducted during the maize growing seasons (June–October 2019, 2020) in Yuzhou County (34°27′N 113°34′E), Henan Province, Central China. During the maize-growing seasons, the total precipitation and mean temperature were 321.2 mm and 18.0°C, respectively, in 2019, and 467.0 mm and 24.4°C, respectively, in 2020 (Figure 1). Prior to the experiments, soil samples were extracted from the upper 20-cm layer for chemical analyses. The soil type was fluvoaquic soil (pH 8.2), with an organic matter content of 16.3 g kg–1, total N of 1.04 g kg–1, available P of 20.0 mg kg–1, available K of 113.7 mg kg–1, available Zn of 1.15 mg kg–1, and bulk density of 1.25 g cm–3.
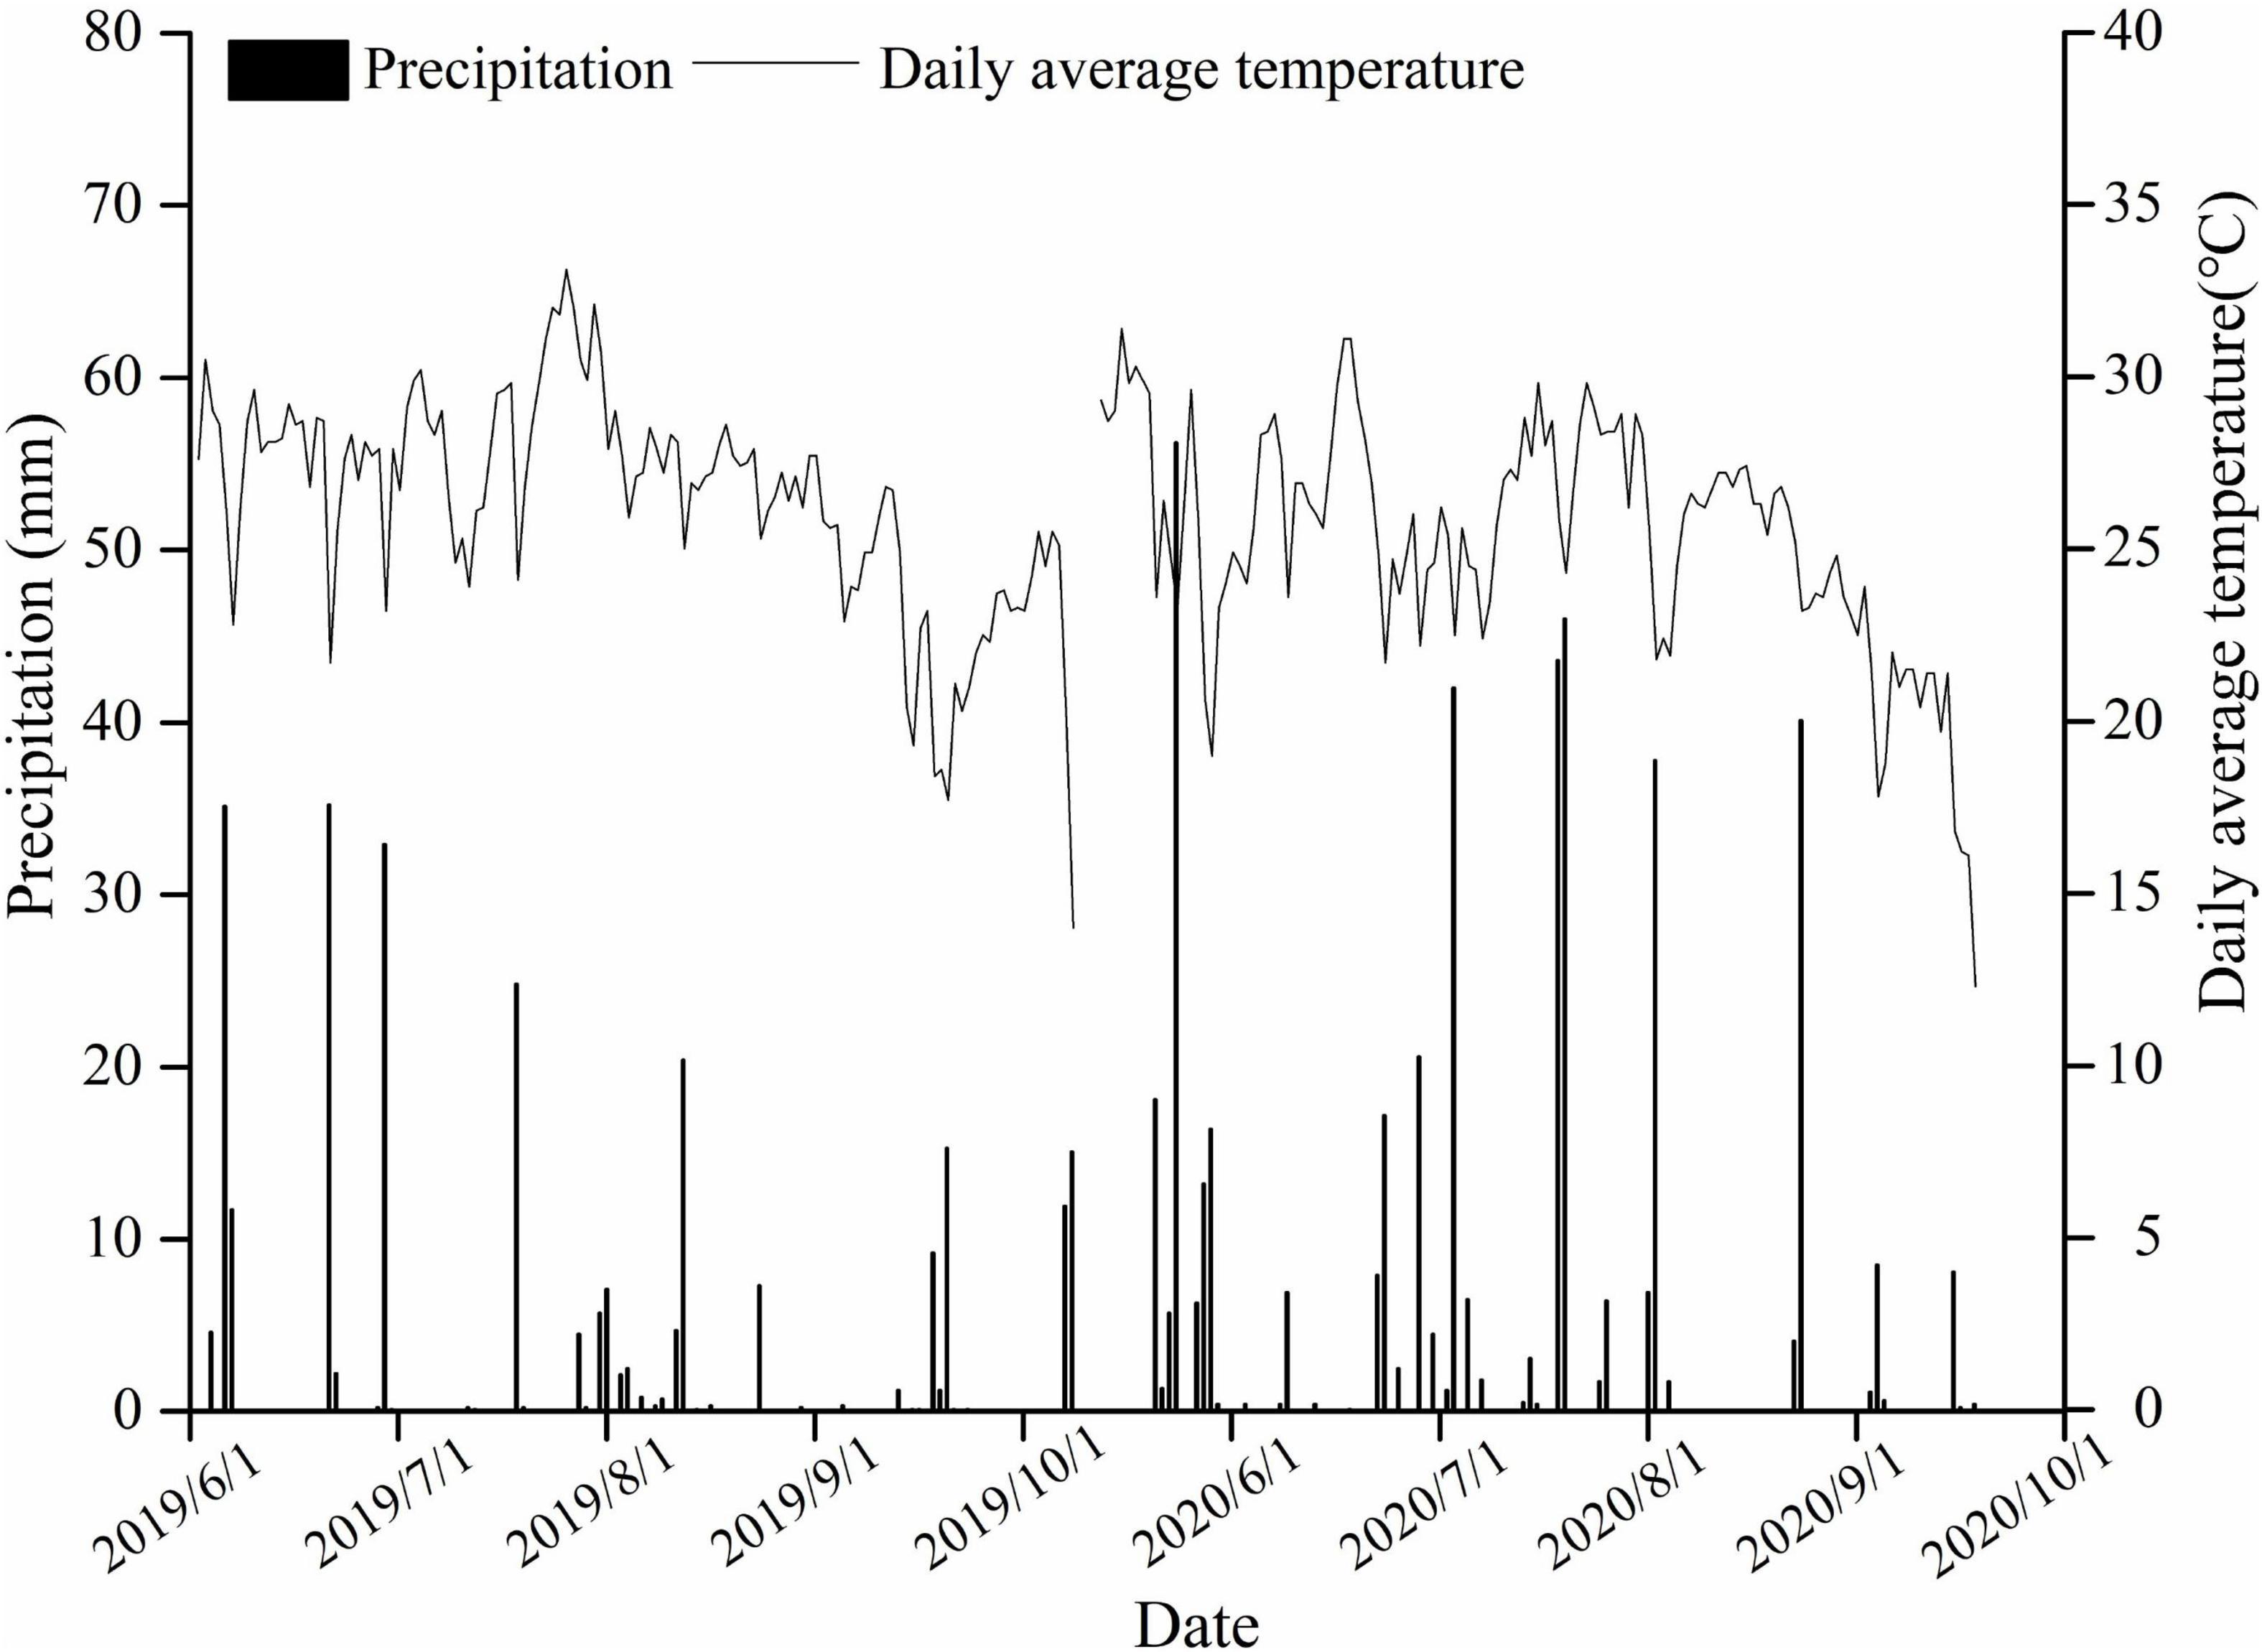
Figure 1. Temperature and precipitation measurements during the maize-growing season.
The cultivar Beiqing 340 was used for the experiments during the two growing seasons. This maize cultivar has been widely cultivated by Henan farmers because of its high yields and adaptability. Beiqing 340 is a compact plant type, with an average plant height of 279 cm and 19 leaves. It has sturdy stems, well-developed aerial roots, and good lodging resistance (ensuring that maize will not lodge under high-density planting in this study).
The experiment was laid out using a split-plot design with three replicates, with plant densities assigned to the primary plots, whereas the N input rates were set up in subplots. These included four plant densities (52,500, 67,500, 82,500, and 97,500 plants ha–1, abbreviated as D525, D675, D825, and D975, respectively) and three N input rates (0, 180, and 360 kg ha–1, abbreviated as N0, N180, and N360, respectively). The dimensions of each plot were 4 m × 10 m and seeds were mechanically sown on June 03. Urea served as the source of N, which was applied in two splits, with 50% at the basal stage and 50% at the 10-leaf stage (45 days after sowing). Phosphorus (90 kg [P2O5] ha–1) in the form of calcium superphosphate, potassium (90 kg [K2O] ha–1) in the form of potassium chloride and zinc (5 kg [Zn] ha–1) in the form of zinc sulfate were applied as the basal dose. Basal fertilizer was applied to the ground following manual broadcasting, whereas N topdressing was applied by means of side-dressing. Nicosulfuron and atrazine were applied at the three-leaf stage to control weeds, whereas thiophanate-methyl and lambda-cyhalothrin were applied at the eight-leaf stage to prevent diseases and insects.
The ear leaf, a leaf above the ear leaf, and a leaf below the ear leaf were defined as the middle leaf (M leaf). The remaining leaves above the middle leaf were referred to as the upper leaf (U leaf; the six leaves above the middle leaf), while the remaining leaves below the M leaf were referred to as the lower leaf (L leaf; there are only five to six leaves below the middle leaf at the silking stage, because some of the early emerging lower leaves would have died). Beiqing 340 had a total of 19 leave. We measured the agronomic (except leaf area) and physiological indicators of the 16th, 12th, and 8th leaves (from the base to the top, the base leaf was the 1st leaf, the ear leaf was the 12th leaf, and the top leaf was the 19th leaf), which represent the upper, middle, and lower leaves, respectively (Figure 2).
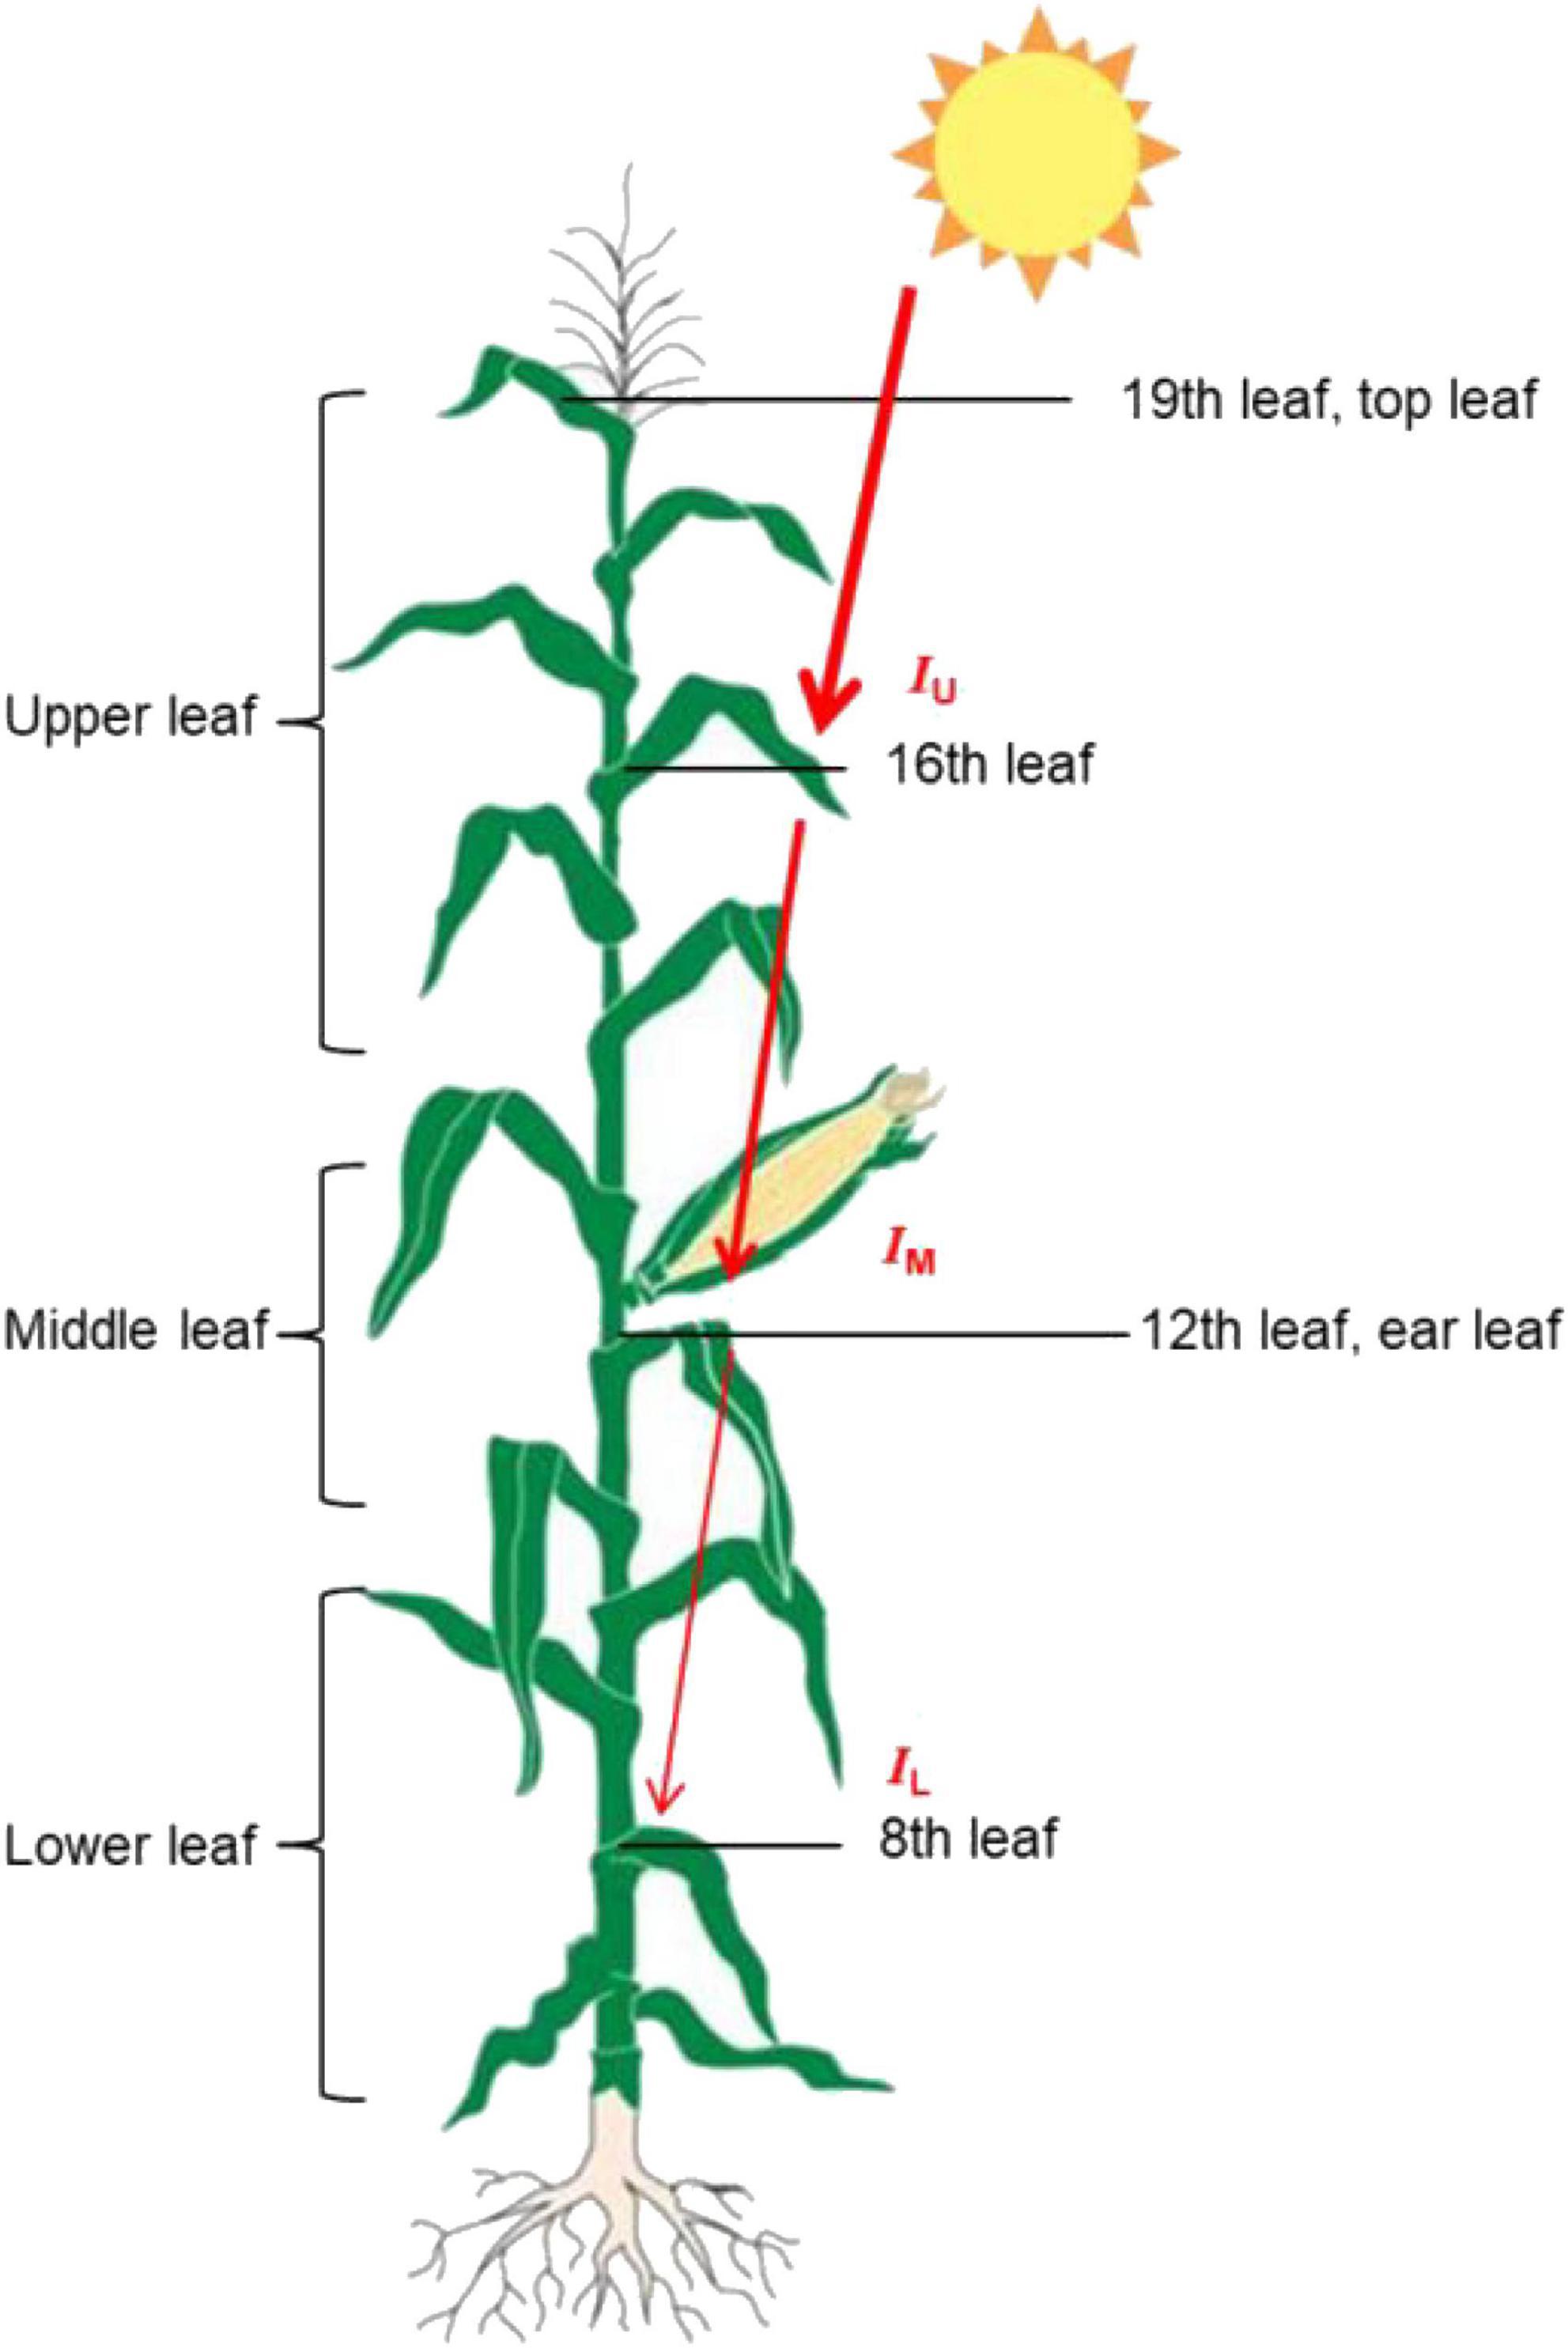
Figure 2. A schematic model depicting the leaf position and incident light of maize. The IU, and Io, IM, and IL are PAR values on a horizontal level at upper, middle and lower leaf layers. The thickness of the red arrows represent the light density that is intercepted by different leaf positions.
At the silking stage (75 days after sowing), the PAR was measured using a field scout external light sensor meter (3415FX and 366816 quantum light 6 sensor bar, Spectrum, CA, United States) from 11:00 to 12:30 pm, during sunlight hours. The sensor bar was horizontally placed into the different leaf positions facing upward to measure the PAR. The TPAR was calculated as follows:
TPAR (μmol s–1) = PAR (μmol ⋅ m–2 ⋅ s–1) × leaf area (m2).
The area of each living leaf was measured at the silking stage (R1). The leaf area was determined using a leaf area meter (YMJ-A; Zhejiang Top Yunnong Technology Co., Ltd., China), and the U, M, and L leaf areas were the sum of the areas of all leaves at that leaf position. The leaf area index (LAI) is the surface area of leaves per unit of ground. The leaf angle was measured using a protractor, and the leaf angle was defined as the acute angle value between the leaf and stem.
At the silking stage, the leaves at different leaf positions of five representative plants in each plot were selected as physiological test materials in the morning (10:00–1200 am). The leaf disk samples were homogenized in 5 mL of an 80% acetone solution added to 0.01 g of CaCO3, and then centrifuged at 2,000 × g for 10 min at 10°C. The supernatant was collected, and the final volume of the extract was 25 mL using 80% acetone. The absorbance (A) of the extracts was determined at 663 and 645 nm using a spectrophotometer, and an estimate of the chlorophyll content a [Chl a = 12.72 × A663 − 2.59 × A645], chlorophyll b [Chl b = 22.88 × A645 − 4.67 × A663], chlorophyll (a + b) [Chl (a + b) = 20.29 × A6452 + 8.05 × A663] was obtained according to Li (2000).
The remaining leaf disk samples were used to measure relative leaf conductivity (EC), and 40 mL of distilled water was added to the samples in a clean beaker. Subsequently, the conductivity R0 was quantified using a conductivity meter (DDSJ 308, Shanghai), which was placed in a beaker sealed with plastic wrap and soaked for 5–6 h, after which the conductivity R1 was measured. Next, the samples were placed in a water bath, boiled for 30 min, and removed. After cooling to room temperature, conductivity R2 was measured again. The relative conductivity EC was calculated as EC = (R1 − R0)/(R2 − R0), according to Fu et al. (2020).
To obtain the dry weight of the leaves, the leaf samples were dried at 105°C for 30 min, and then at 70°C to a constant weight, ground to pass through a 1-mm mesh screen, and then digested with H2SO4 and H2O2. The total N concentration of the digested samples was determined using an automated continuous flow analyzer (Seal, Norderstedt, Germany).
The chlorophyll a fluorescence was measured for 10 s via a Plant Efficiency Analyzer (PEA; Hansatech Ltd., King’s Lynn, Norfolk, United Kingdom) with an excitation light intensity of 3.3 mmol m–2 s–1, which emits light that is centered at a 650 nm wavelength with an intensity of 3,000 μmol photons m–2 s–1. The fluorescence emission was detected using a high-performance PIN-photodiode with an optical design and filtering that ensured a maximal response to longer wavelength fluorescence signals. These measurements were taken from the leaves (30 min dark-adapted) at the maize silking stage, in which 15 leaves at different orientations were measured for each plot.
Each transient was analyzed according to the JIP-test (Appenroth et al., 2001), by utilizing the original data: F0 (minimum fluorescence, when all PSII reaction centers were open), Fm (maximum fluorescence, when all PSII reaction centers were closed), M0 (approximated initial slope of the fluorescence transient), and Vj and Vi (fluorescence intensities at 2 and 60 ms, respectively). The following equations were used for the quantification of PSII behavior, referring to time zero: (1) the specific energy fluxes per cross section (CS) for absorption (ABS/CS0), trapping (TR0/CS0), electron transport (ET0/CS0), dissipation (DI0/CS0), and PSI electron acceptation (RE0/CS0):
ABS/CS0 = F0;
TR0/CS0 = (1–F0/FM) × F0;
ET0/CS0 = (1–F0/FM) × (1-Vj) × F0;
DI0/CS0 = ABS/CS0–TR0/CS0;
RE0/CS0 = (ET0/CS0) × (1–Vj) × (1–Vi),
(2) The number of active PSII reaction centers per excited cross-section (RC/CS0)
RC/CS0 = (FM – F0) × (Vj/M0)
(3) Total performance index (PItotal) of the photosynthetic apparatus on an absorption basis:
PItotal = (RC/ABS) × [(TR0/ABS)/(1–TR0/ABS)] × [(ET0/TR0)/(1–ET0/TR0)] × [(RE0/ET0]/(1–RE0/ET0)].
The relationship between canopy light distribution and canopy structure may be described by an exponential function (Gallagher and Biscoe, 1978) as:
IM = IU. e (–KL(U–M) . F(U–M)); IL = IM. e (–KL(M–L) . F(M–L))
where F(U–M) and F(M–L) are the cumulative areas of green leaves per unit ground from the upper to middle leaf layer and from the middle to lower leaf layer, respectively; IU, IM, and IL are PAR values on a horizontal level in the upper, middle, and lower leaf layers, respectively; and KL(U–M) and KL(U–M) are the light extinction coefficients from the upper to middle leaf layer and from the middle to lower leaf layer, respectively. A smaller KL value indicates a more uniform light distribution in the canopy.
The N gradient is described by the following with an exponential function (Anten et al., 1995) as:
NM = (NU–Nb). e(–KN(U–M) . F (U–M)) + Nb; NL = (NM–Nb). e(–KN(M–L) . F(M–L)) + Nb
where NU, NM, and NL are the leaf N (g N m–2) of the upper, middle, and lower leaf layers, respectively; KN(U–M) and KN(M–L) are the extinction coefficients for effective leaf N from the upper to middle leaf layer and from the middle to lower leaf layer, respectively; and Nb is the base value of leaf N for photosynthesis, which may be regarded as representing the non-photosynthetic N content. The value of Nb is 0.3 g N m–2 leaf (Yin and van Laar, 2005).
The formula for calculating the absorption and utilization efficiency parameters of the N fertilizer:
TNA [kg ha–1] = plant N concentration [kg kg–1] × plant dry matter [kg ha–1]
IEN [kg kg–1] = grain yield [kg ha–1]/total plant N uptake [kg ha–1]
NRE [%] = (TNA of N applied - TNA of N omitted) [kg ha–1]/N applied [kg ha–1] × 100 [%]
where TNA is the total N accumulation, IEN is the internal N-use efficiency, and NRE is the N recovery efficiency.
The data from both seasons were statistically evaluated using an analysis of variance (ANOVA) to compare the differences between the various treatments, and the means were separated using the least significant difference (LSD) test at a significance level of 0.05. Variance analyses of N rate, plant density, and their interactive effects were performed using the Statistical Software Package for Social Science (SPSS, version 19.0). Figures were generated using Origin Pro 9.0.
Two-way ANOVAs revealed that the grain yield was markedly affected by the N rate (N), plant density (D) and their interaction effect (N × D) in 2019 and 2020 (Figure 3). Compared with the N0 input, the grain yields were remarkedly increased under the N180 input at averaged across planting densities, averaging 1681.0 and 2454.2 kg ha–1 for the 2 years at increase rates of 17.8 and 28.2%, respectively. Compared with N180, the grain yield with the N360 input under the D525 treatment was substantially increased. No notable change in grain yield was observed under the D675 treatment; however, it was markedly reduced by D975 treatment.
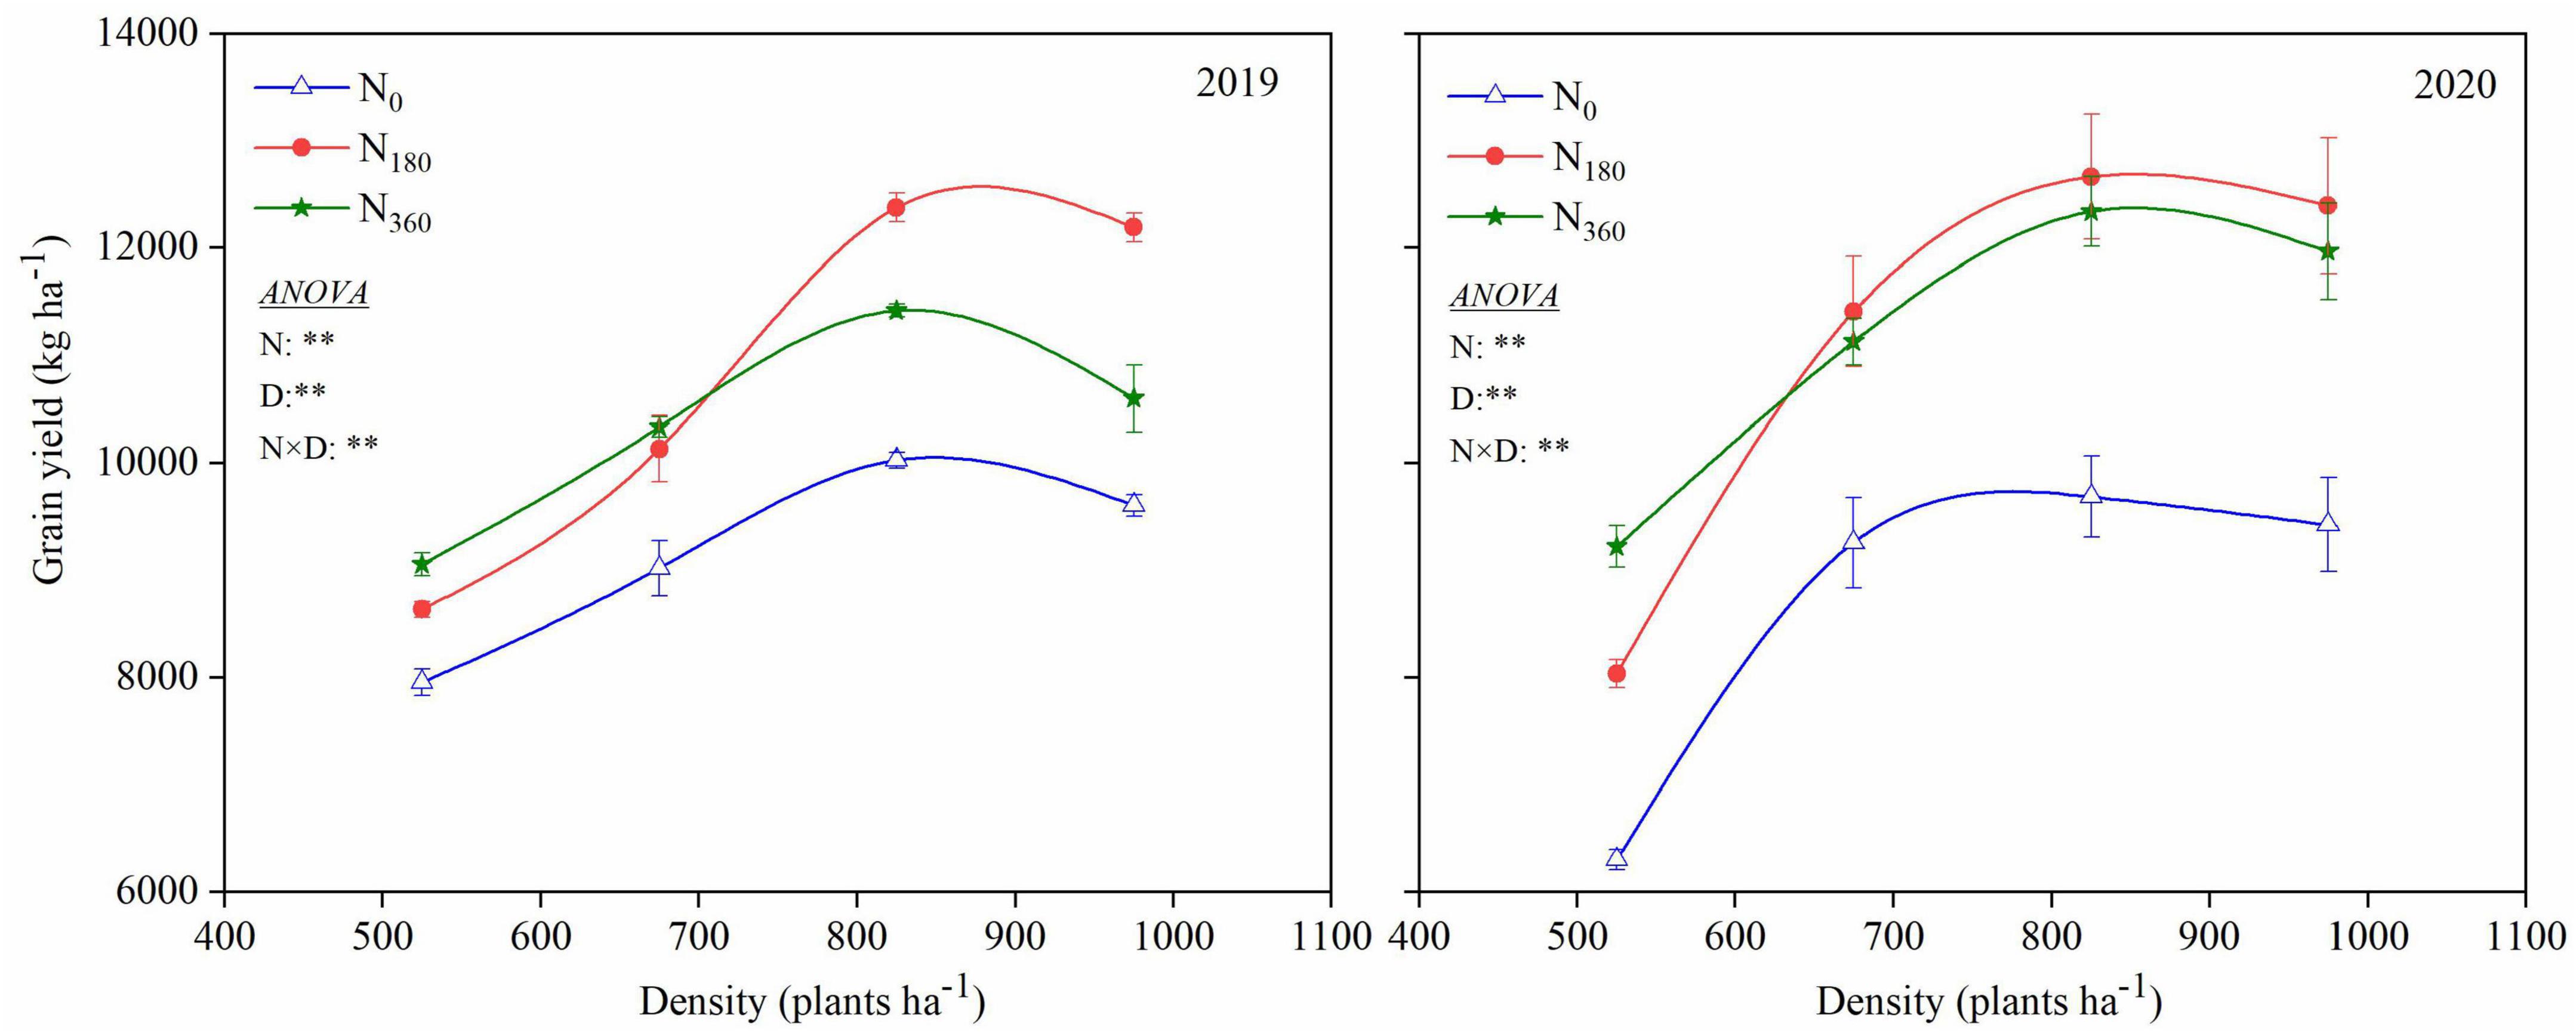
Figure 3. Influence of N rate and plant density on the grain yield.
Higher plant densities resulted in greater grain yields, with the largest being under the D825 treatment at 2722.7 and 3708.2 kg ha–1, with increase rates of 31.8 and 47.2%, respectively, recorded for the 2 years. Higher plant densities led to relatively higher grain yields with a lower N application rate, and vice versa. The N180 input combined with D825 treatment for 2 years was the optimal combination for the best yields among all treatments.
LAI, leaf area, and leaf angle at different leaf orientations were affected by N rates and plant density; however, there were no strong interaction between them (Figure 4 and Table 1). Compared with the N0 input averaged across planting densities, the LAI of the N180 input was increased by from 19.4 to 23.5% in 2019 and from 14.3 to 22.0% in 2020. With continued increase in the N fertilizer rate to 360 kg ha–1, the LAI decreased. Higher plant density also substantially significantly influenced leaf development. Compared with the D525 treatment averaged across the N treatments, the LAI under D825 treatment increased by 26.9% in 2019 and 47.3% in 2020. With a further increase in planting density, compared to the D825 treatment, the LAI under the D975 treatment increased by 13.9% in 2019 and 12.1% in 2020.
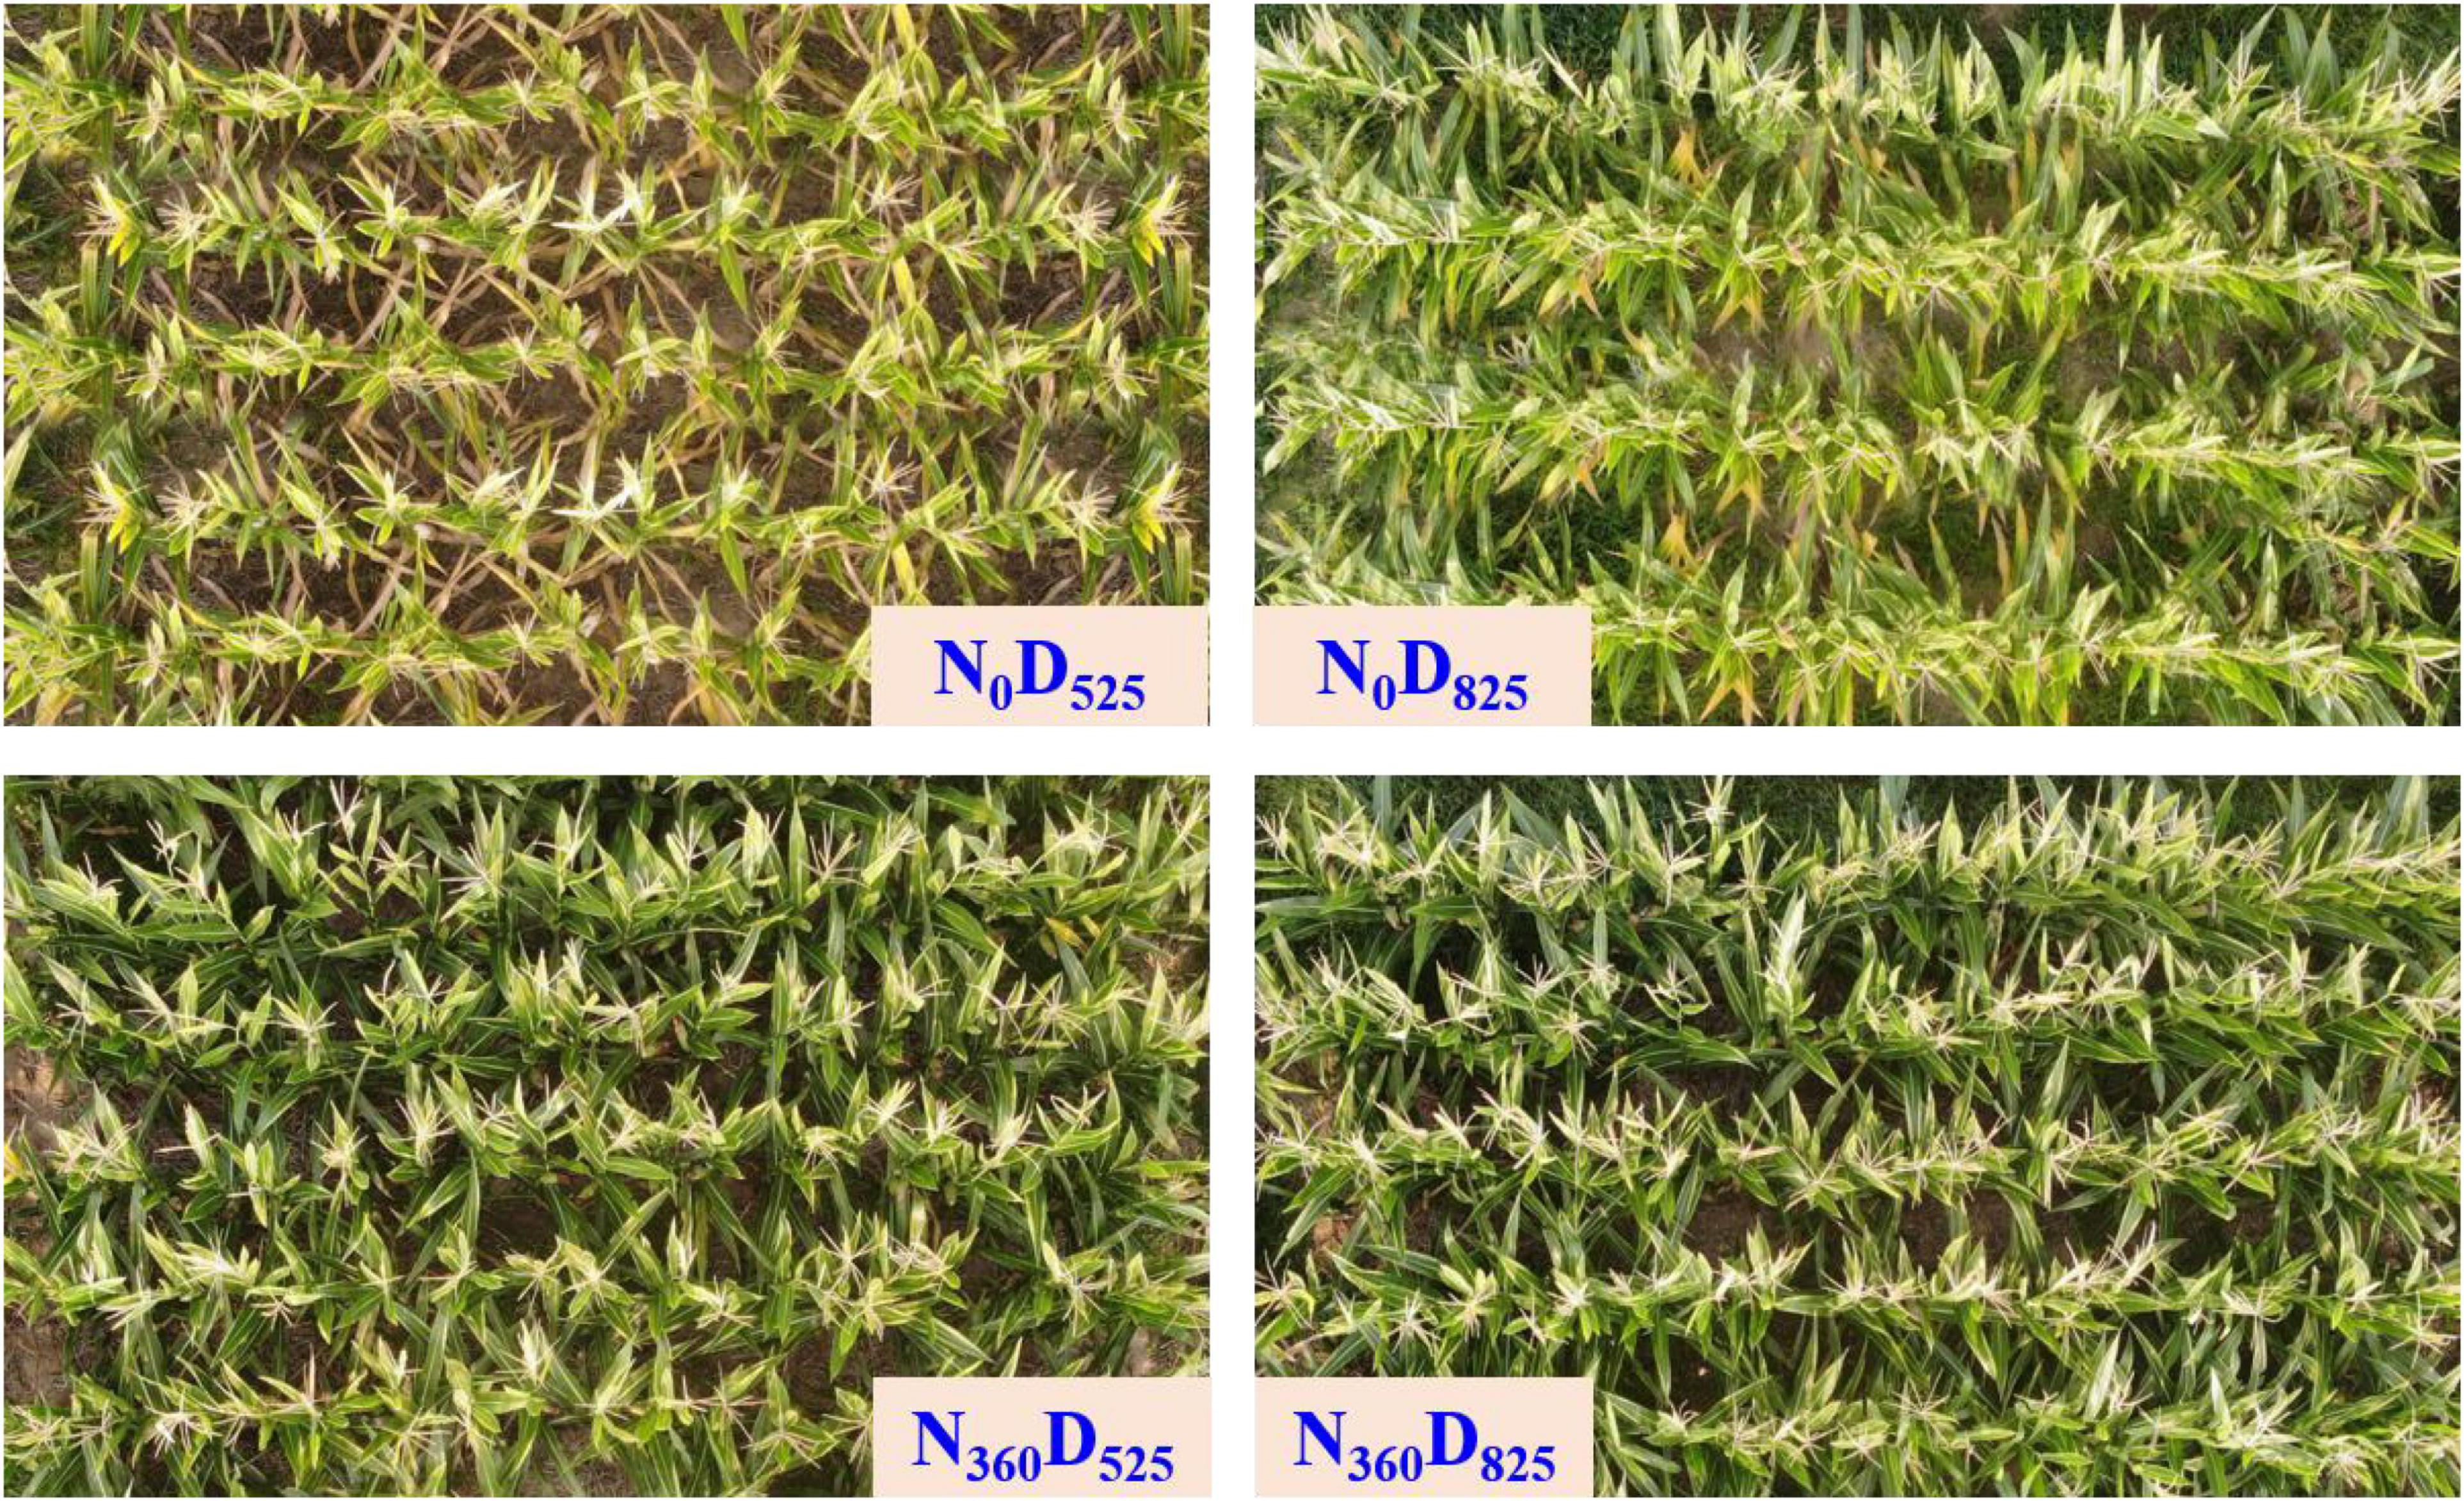
Figure 4. Top view of different nitrogen input and plant density treatments on leaf development at the tasseling stage.
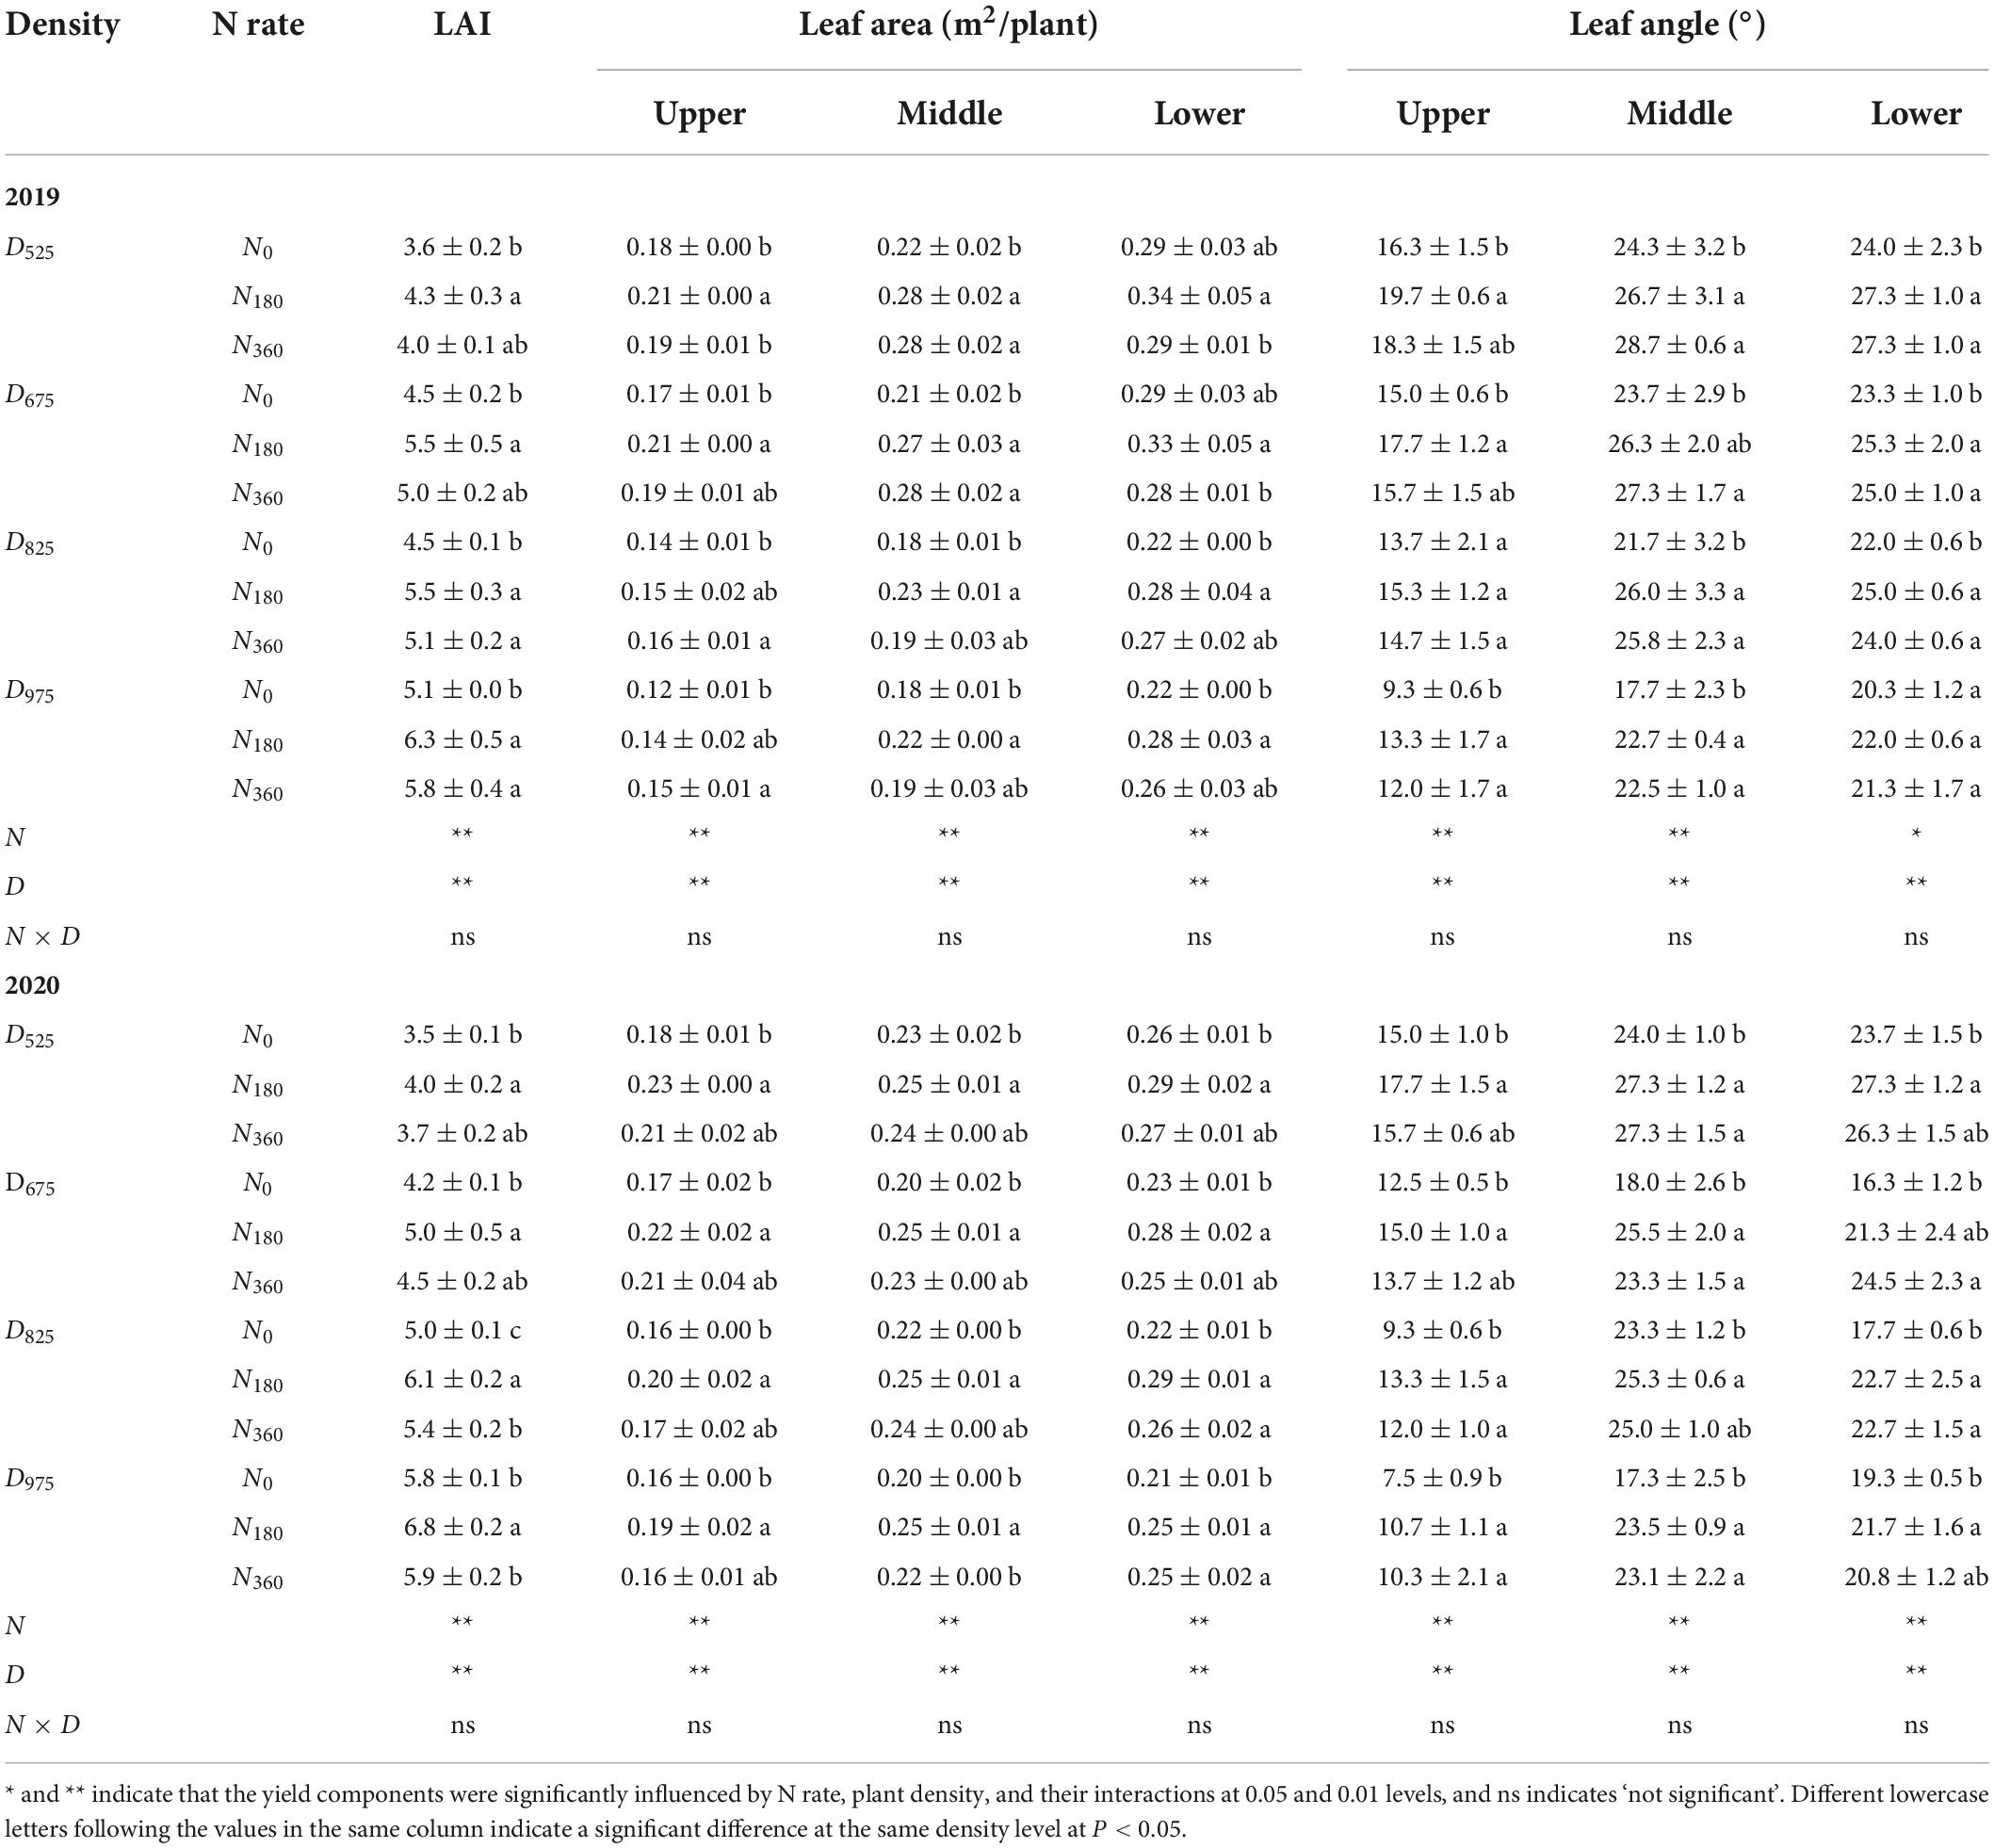
Table 1. Influence of N rate and plant density on the leaf area index (LAI), leaf area, and angle at different leaf positions.
The area of the lower leaf was higher than that of the middle or U leaf. Similar to the LAI being affected by N application rate, the leaf areas at different orientations were enhanced with the N rate, and the maximum value appeared under N180 input. The leaf area per plant was decreased substantially at higher plant densities. Compared with the D525 treatment averaged across N treatments, the U leaf area under the D825 treatment showed the greatest decreases of 22.4% (2019) and 14.5% (2020), followed by the L leaf and M leaf. Comparison with the D825 treatment, the leaf area at different leaf positions continued to decrease.
Akin to the leaf area, the leaf angle also affected the amount of intercepted light. The leaf angle of the U leaf was the lowest, followed by those of the M, and L leaves. At the same planting density, the leaf angles under various N inputs were notably higher than those under N0 input; however, no obvious differences were observed between them. Leaf angles also decreased at higher plant densities. Compared with the D525 treatment averaged across N treatments, the U leaf angle under the D825 treatment decreased by 19.5% (2019) and 28.5% (2020), the M leaf angle decreased by 7.8% (2019) and 6.4% (2020), and the L leaf angle decreased by 9.7% (2019) and 18.4% (2020). In comparison with the D825 treatment, the leaf angles at different leaf positions continued to decrease.
The area of the pie chart represents the TPAR intercepted by different leaf layers (Figure 5 and Supplementary Figure 1). In 2019, the average TPAR of the U leaves was 22.4% higher than that of the M leaves, and 3.67 times higher than that of the L leaves across all treatments. In 2020, the average TPAR of the U leaves was 37.5% higher than that of the M leaves, and 4.19 times higher than that of the L leaves at across all treatments. For the same leaf positions, TPAR increased with higher planting densities and higher N application rates (except for N360 treatments). For U leaves, the average TPAR ratio (TPAR of any leaf layer/TPAR of the whole population) increased with higher plant densities, ranging from 46.3 to 48.9% (2019) and from 45.7 to 49.1% (2020) across N treatments. However, the TPAR ratio for L leaves decreased with higher plant densities, ranging from 10.0 to 7.1% (2019) and from 9.5 to 7.1% (2020). The change in the TPAR value of M leaves among the different densities was very small, ranging from 4.4 to 4.5% (2019) and from 4.3 to 4.5% (2020).
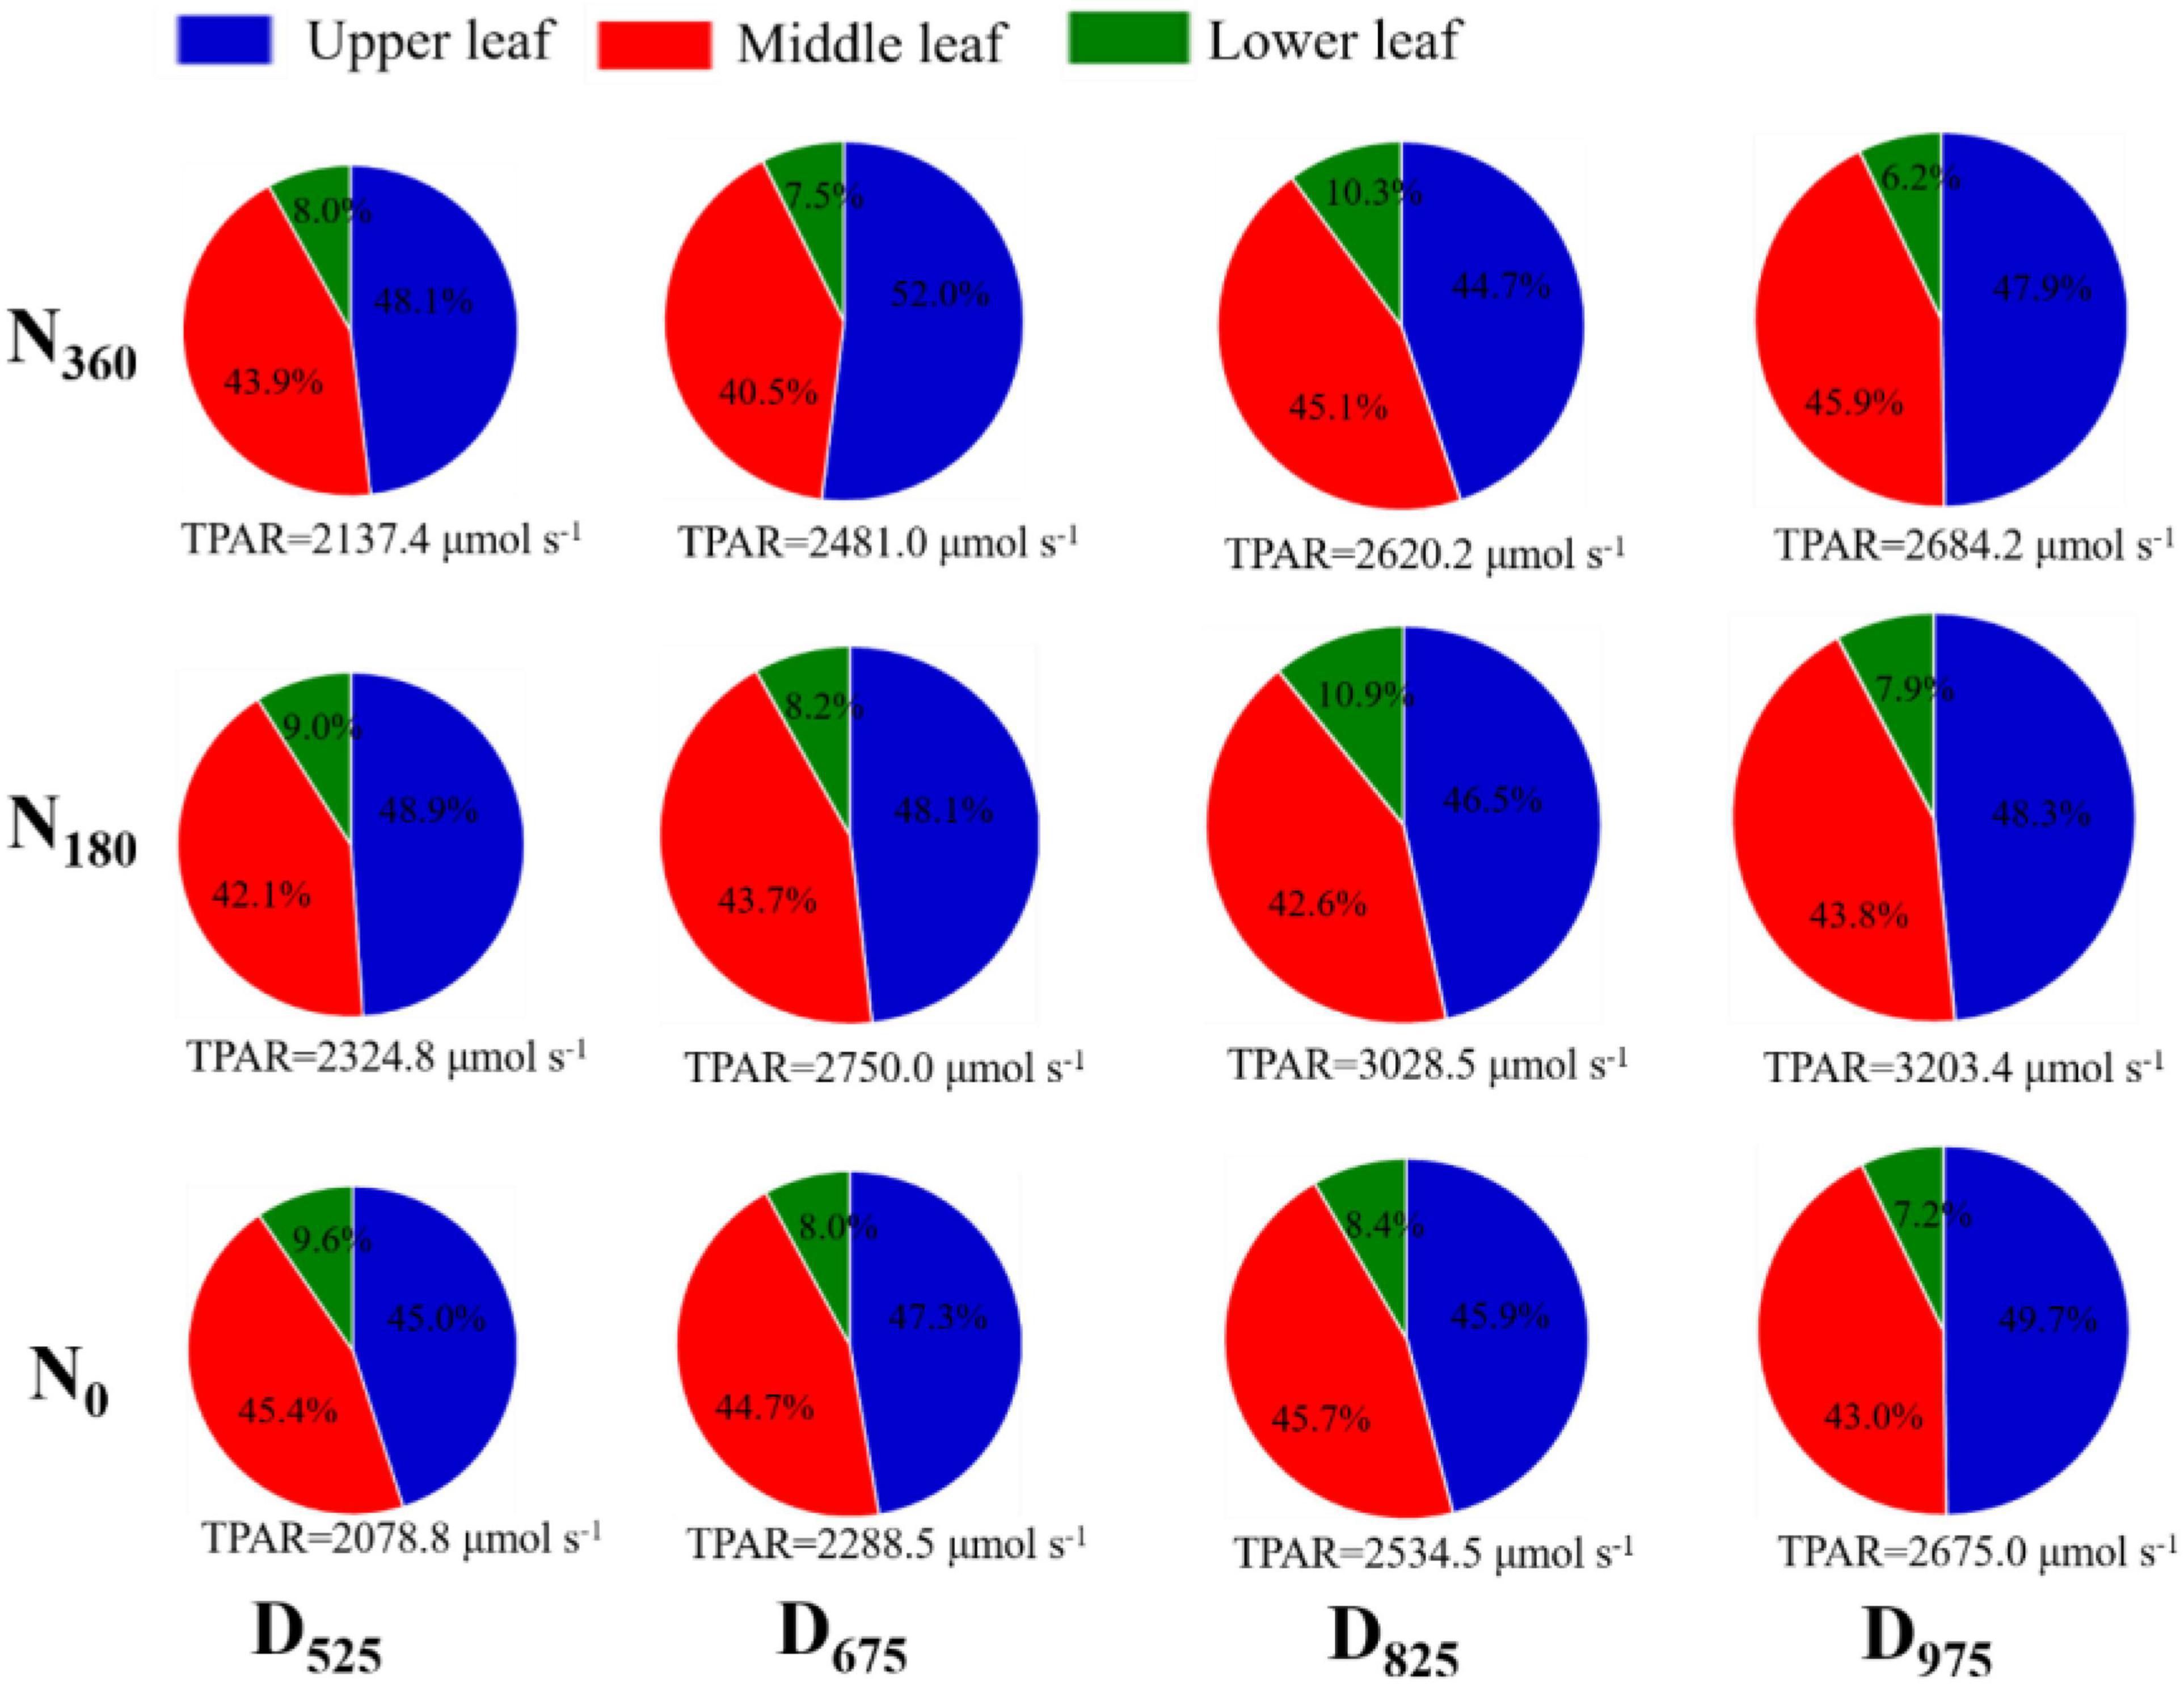
Figure 5. Influence of N rate and plant density on the photosynthetically active radiation (PAR) at different leaf positions in 2019. The size of pie diagram represents the TPAR of different leaf layers; the percentage of each section represents the TPAR ratio for the upper, middle, and lower leaf layers.
Under the same treatments, the photosynthesis-related parameters (N concentration, chlorophyll concentration, fluorescence efficiency, and senescence process) of leaves at different positions varied (Figure 6 and Supplementary Figure 2). The M position leaf possessed the highest leaf N, chlorophyll, and PItotal, and the lowest relative EC, followed by the U and L leaves.
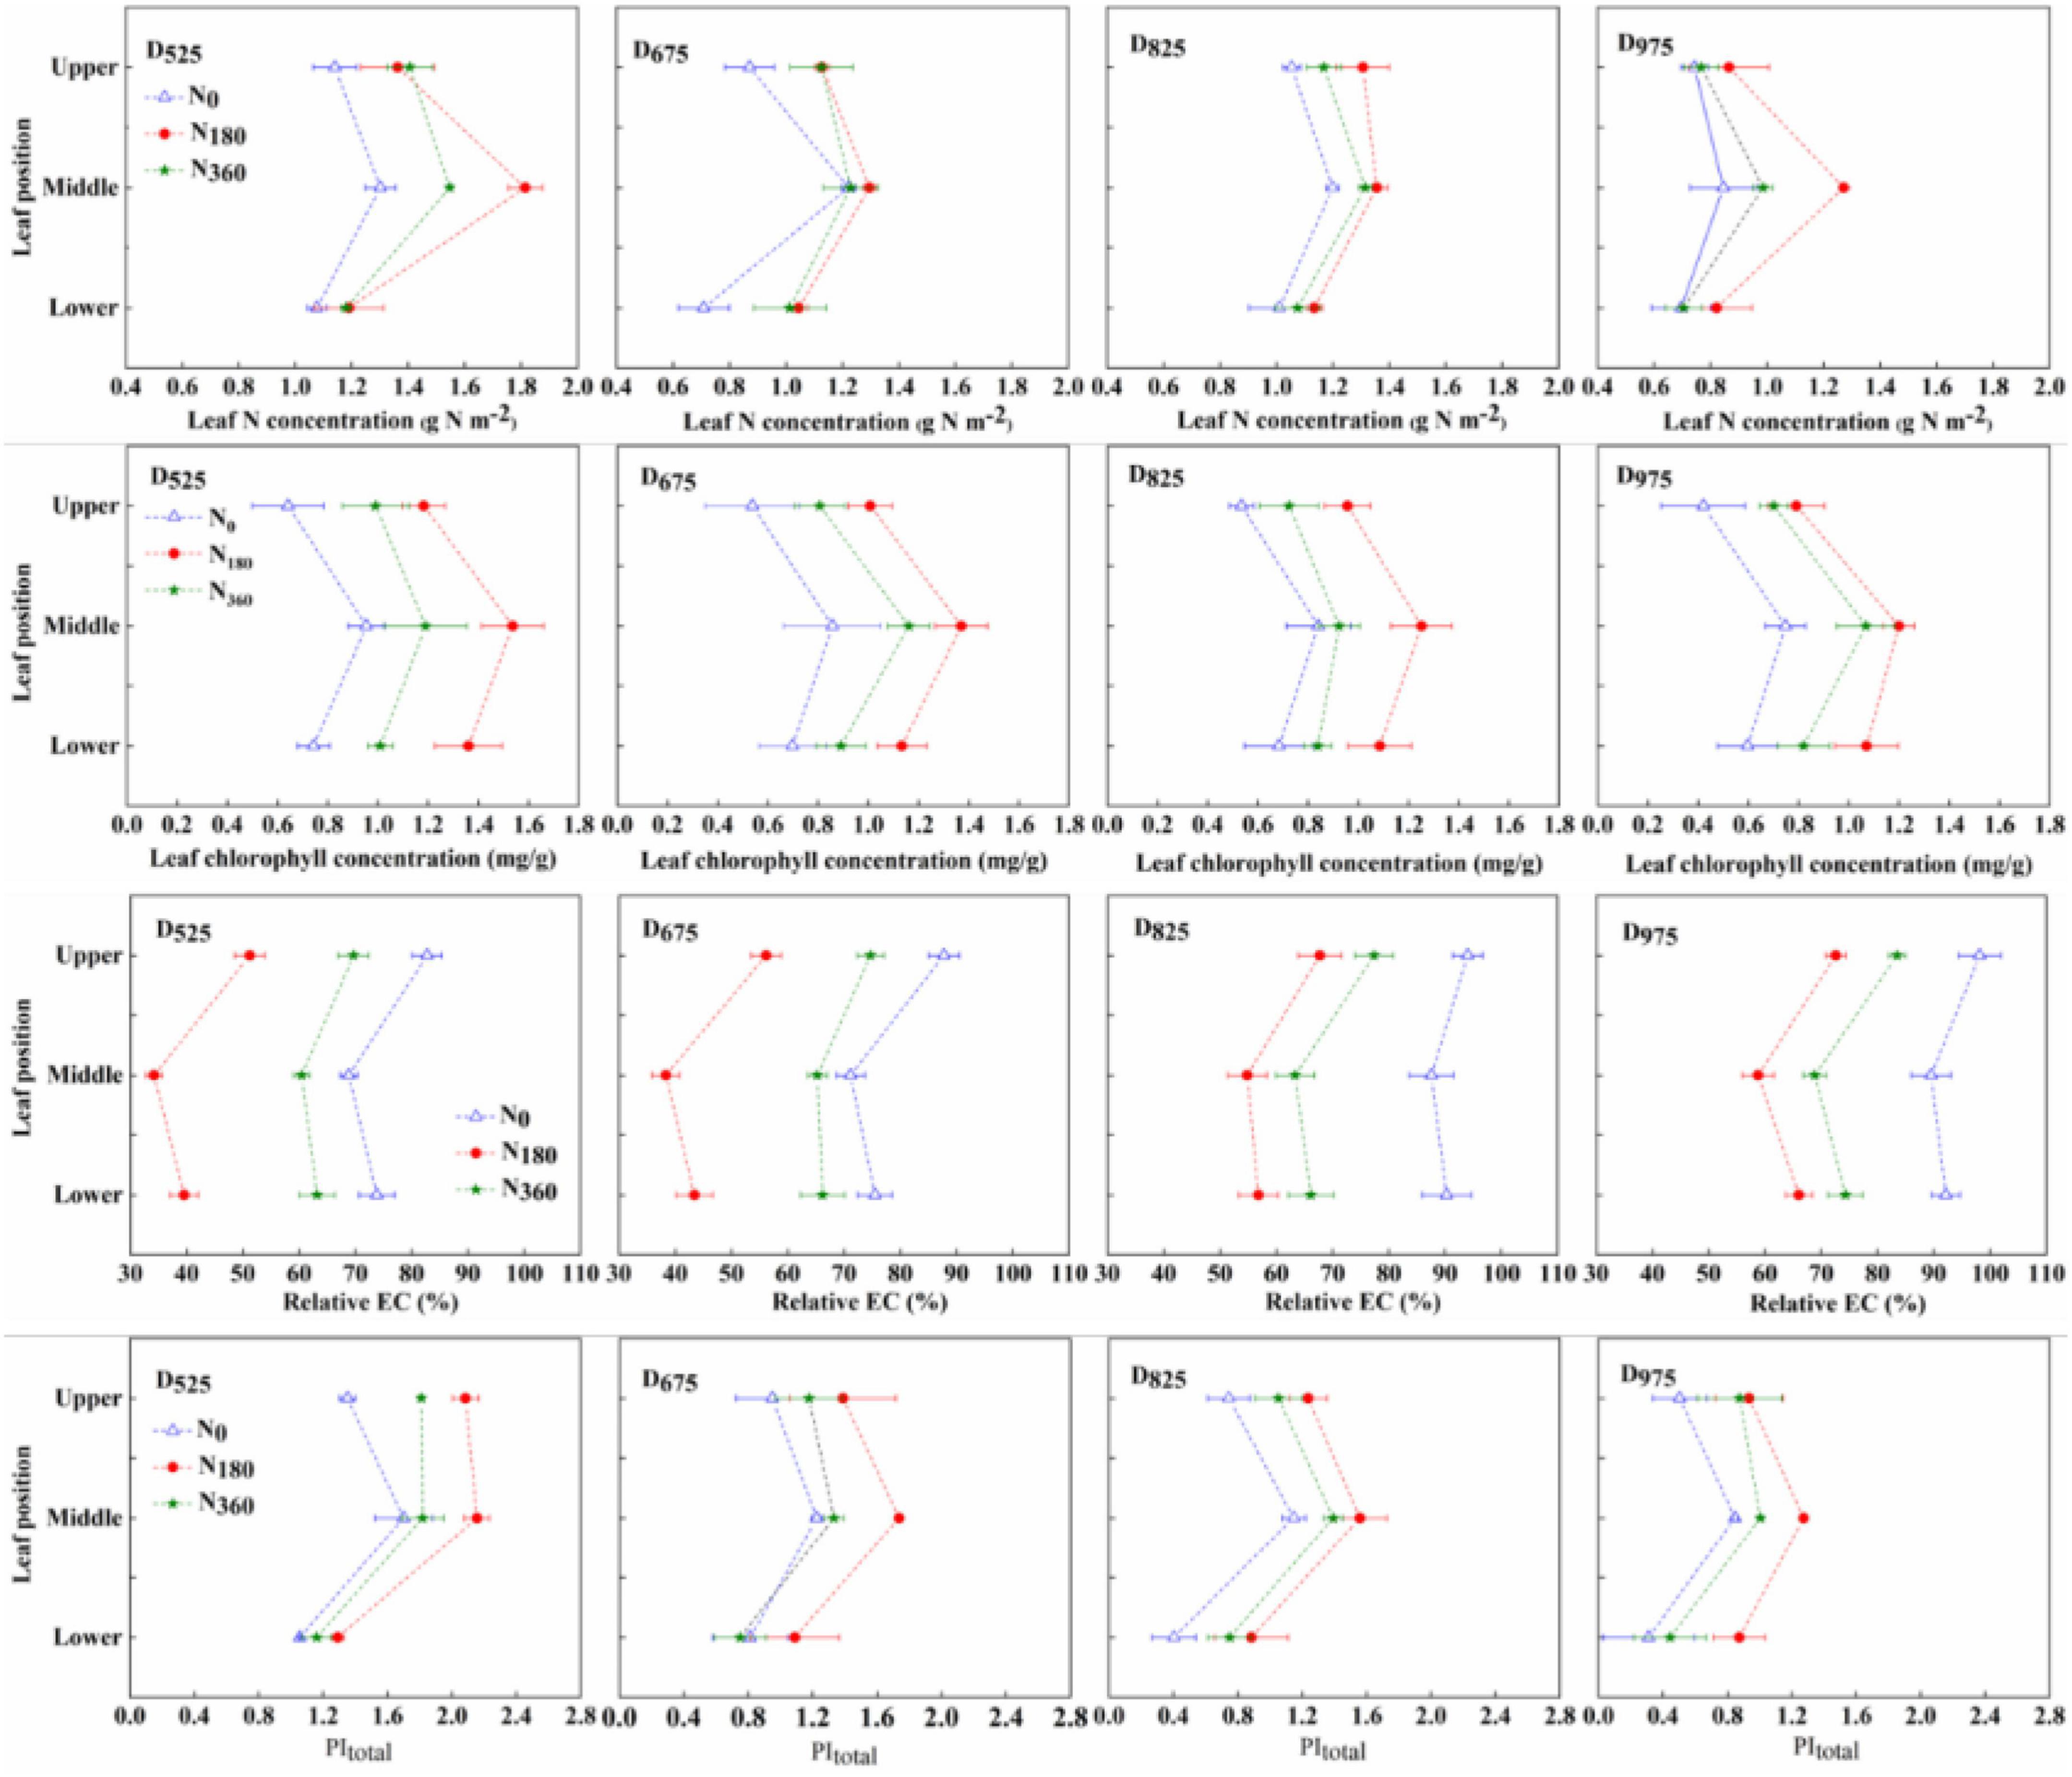
Figure 6. Influence of N rate and plant density on the leaf N concentration, chlorophyll concentration, relative EC, and PItotal at different leaf positions in 2019.
At the same plant density, the specific leaf N (SLN) concentration, chlorophyll concentration, and PItotal of the N180 inputs were always better than those of the N360 inputs, with the worst being the N0 input. The relative EC parameter, the opposite trend was observed for the relative EC parameter between different N input rates. At the same N input rates, SLN concentration, chlorophyll concentration and PItotal decreased with higher plant densities, but the highest value was always observed with N180. In 2019, compared with the D525 treatment, the SLN concentration under the D825 treatment decreased by 11.6% (U leaf, 6.6%; M leaf, 17.0%; and L leaf, 9.7%), leaf chlorophyll concentration decreased by 18.4% (U leaf, 16.2%; M leaf, 18.0%; and L leaf, 21.3%), leaf PItotal was decreased by 36.4% (U leaf, 41.9%; M leaf, 27.7%; and L leaf, 42.2%), and leaf relative EC increased by 21.0% (U leaf, 20.8%; M leaf, 25.8%; and L leaf, 17.4%). Further increasing planting density, compared with the D825 treatment, the SLN concentration under the D975 treatment decreased by 27.5% (U leaf, 31.0%; M leaf, 19.8%; and L leaf, 32.7%), leaf chlorophyll concentration decreased by 5.4% (U leaf, 4.6%; M leaf, 0.2%; and L leaf, 13.6%), leaf PItotal decreased by 22.9% (U leaf, 20.0%; M leaf, 23.8%; and L leaf, 23.7%), and the leaf relative EC increased by 6.9% (U leaf, 9.0%; M leaf, 5.6%; and L leaf, 6.3%). A similar trend was observed for 2020.
Specific leaf fluxes are presented in Table 2. The ABS/CS0, TR0/CS0, and ET0/CS0 of the M leaves were significantly higher than those of the U and L leaves during the two growing seasons. At the same plant density, the ABS/CS0, DI0/CS0, TR0/CS0, and ET0/CS0 of the N180 at any leaf position were the highest, followed by the N360, with the worst being the N0 input. It is worth noting that under the same N rates, ABS/CS0, DI0/CS0, TR0/CS0, and ET0/CS0 at any leaf position decreased with higher plant densities. In 2019, compared with the D525 treatment, the ABS/CS0 under the D825 treatment was decreased by 3.3% (U leaf), 6.2% (M leaf), and 4.7% (L leaf) at the different leaf positions. The ABS/CS0 of D975 was decreased by 0.7% (U leaf), 0.6% (M leaf), and 0.7% (L leaf) in comparison with D825. In 2020, compared with the D525 treatment, the ABS/CS0 under the D825 treatment was decreased by 11.7% (U leaf), 12.6% (M leaf), and 10.5% (L leaf) at the different leaf positions. The ABS/CS0 of D975 decreased by 1.0% (U leaf), 0.9% (M leaf), and 1.0% (L leaf) in comparison with D825. Similarly, with an increased in planting density (from D525 to D825), the rate of decrease of TR0/CS0 and ET0/CS0 in M leaves was higher than that in other leaf layers.
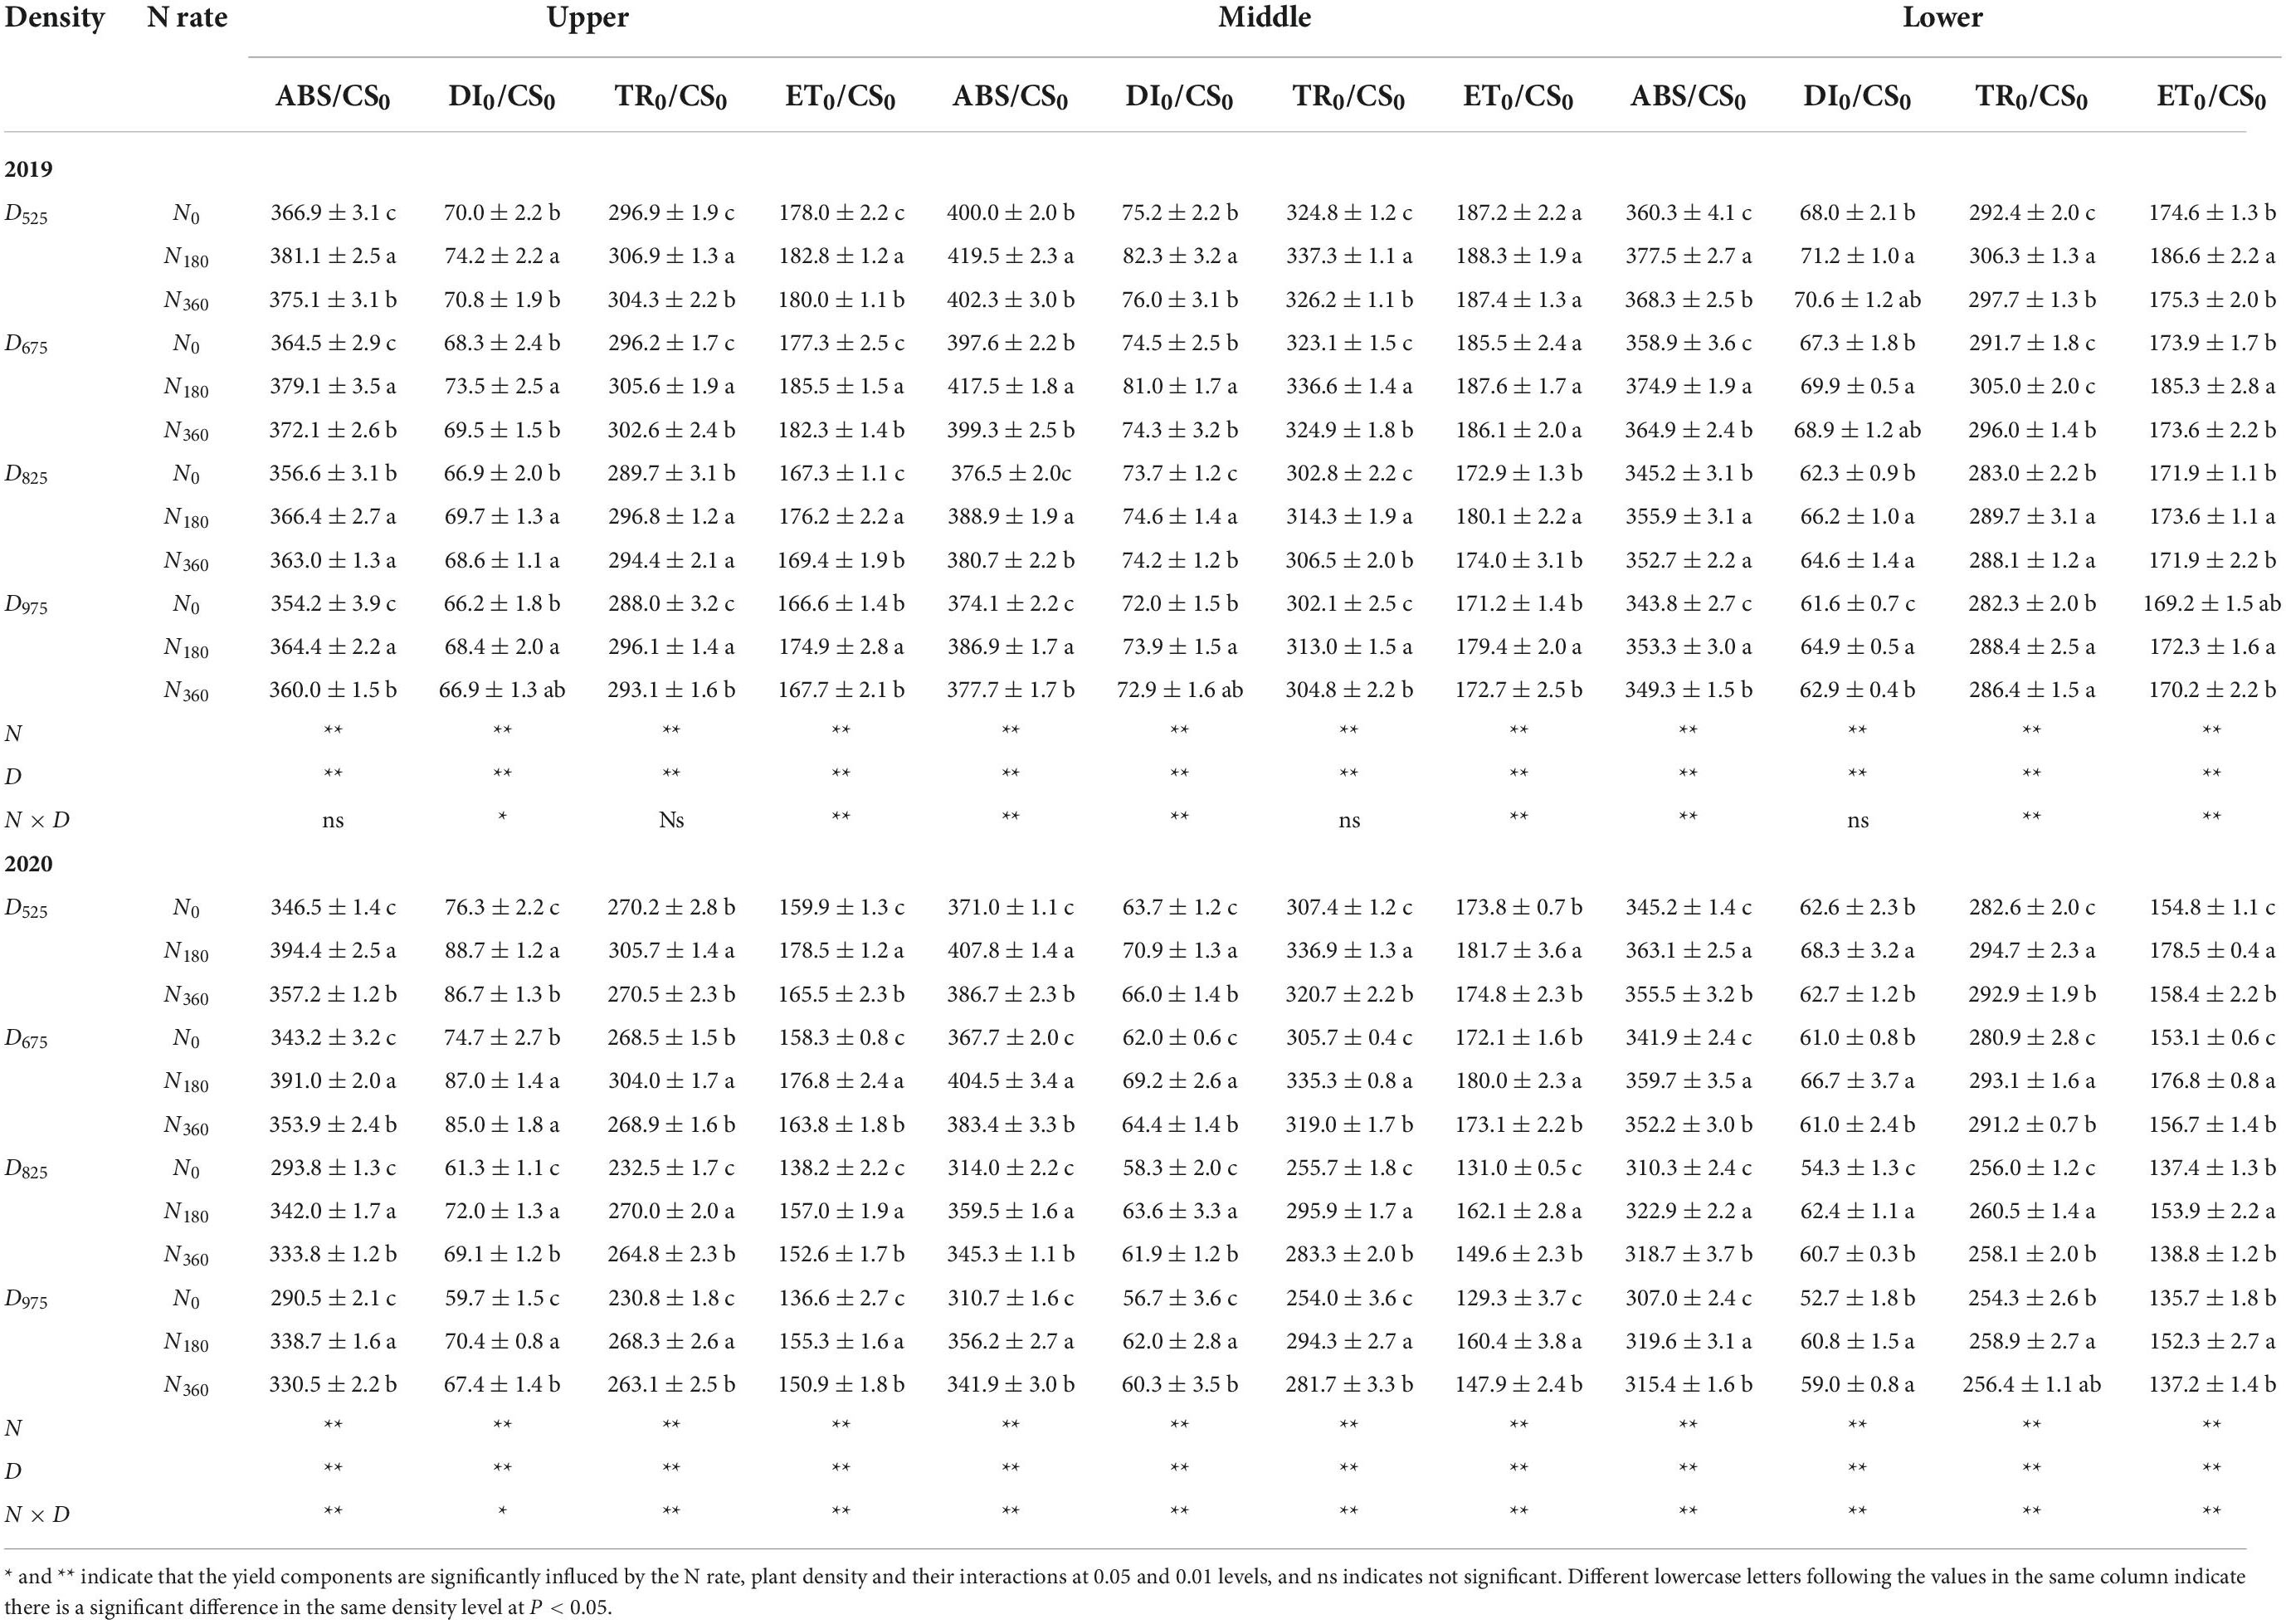
Table 2. Influence of N rate and plant density on the leaf specific energy fluxes per cross section (CS) at different leaf positions.
The canopy extinction coefficients for light (KL) and N (KN) were calculated using the cumulative LAI from the top of the canopy and the relative sunlight penetration. The KL value from the U to M leaf layers decreased with higher N application rates. However, from the M to L leaf layers the KL value was highest under the N0 input, then under the N360 input, with the minimum found for the N180 input (Table 3). Furthermore, KL decreased at higher plant densities. As the SLN of the M leaf was the highest, the KN from the U to M leaves had a negative value, while the KN from the M to L leaves had a positive value. The value of KN was the highest under the N0 input, followed by N360 input, with the minimum being under the N180 input.
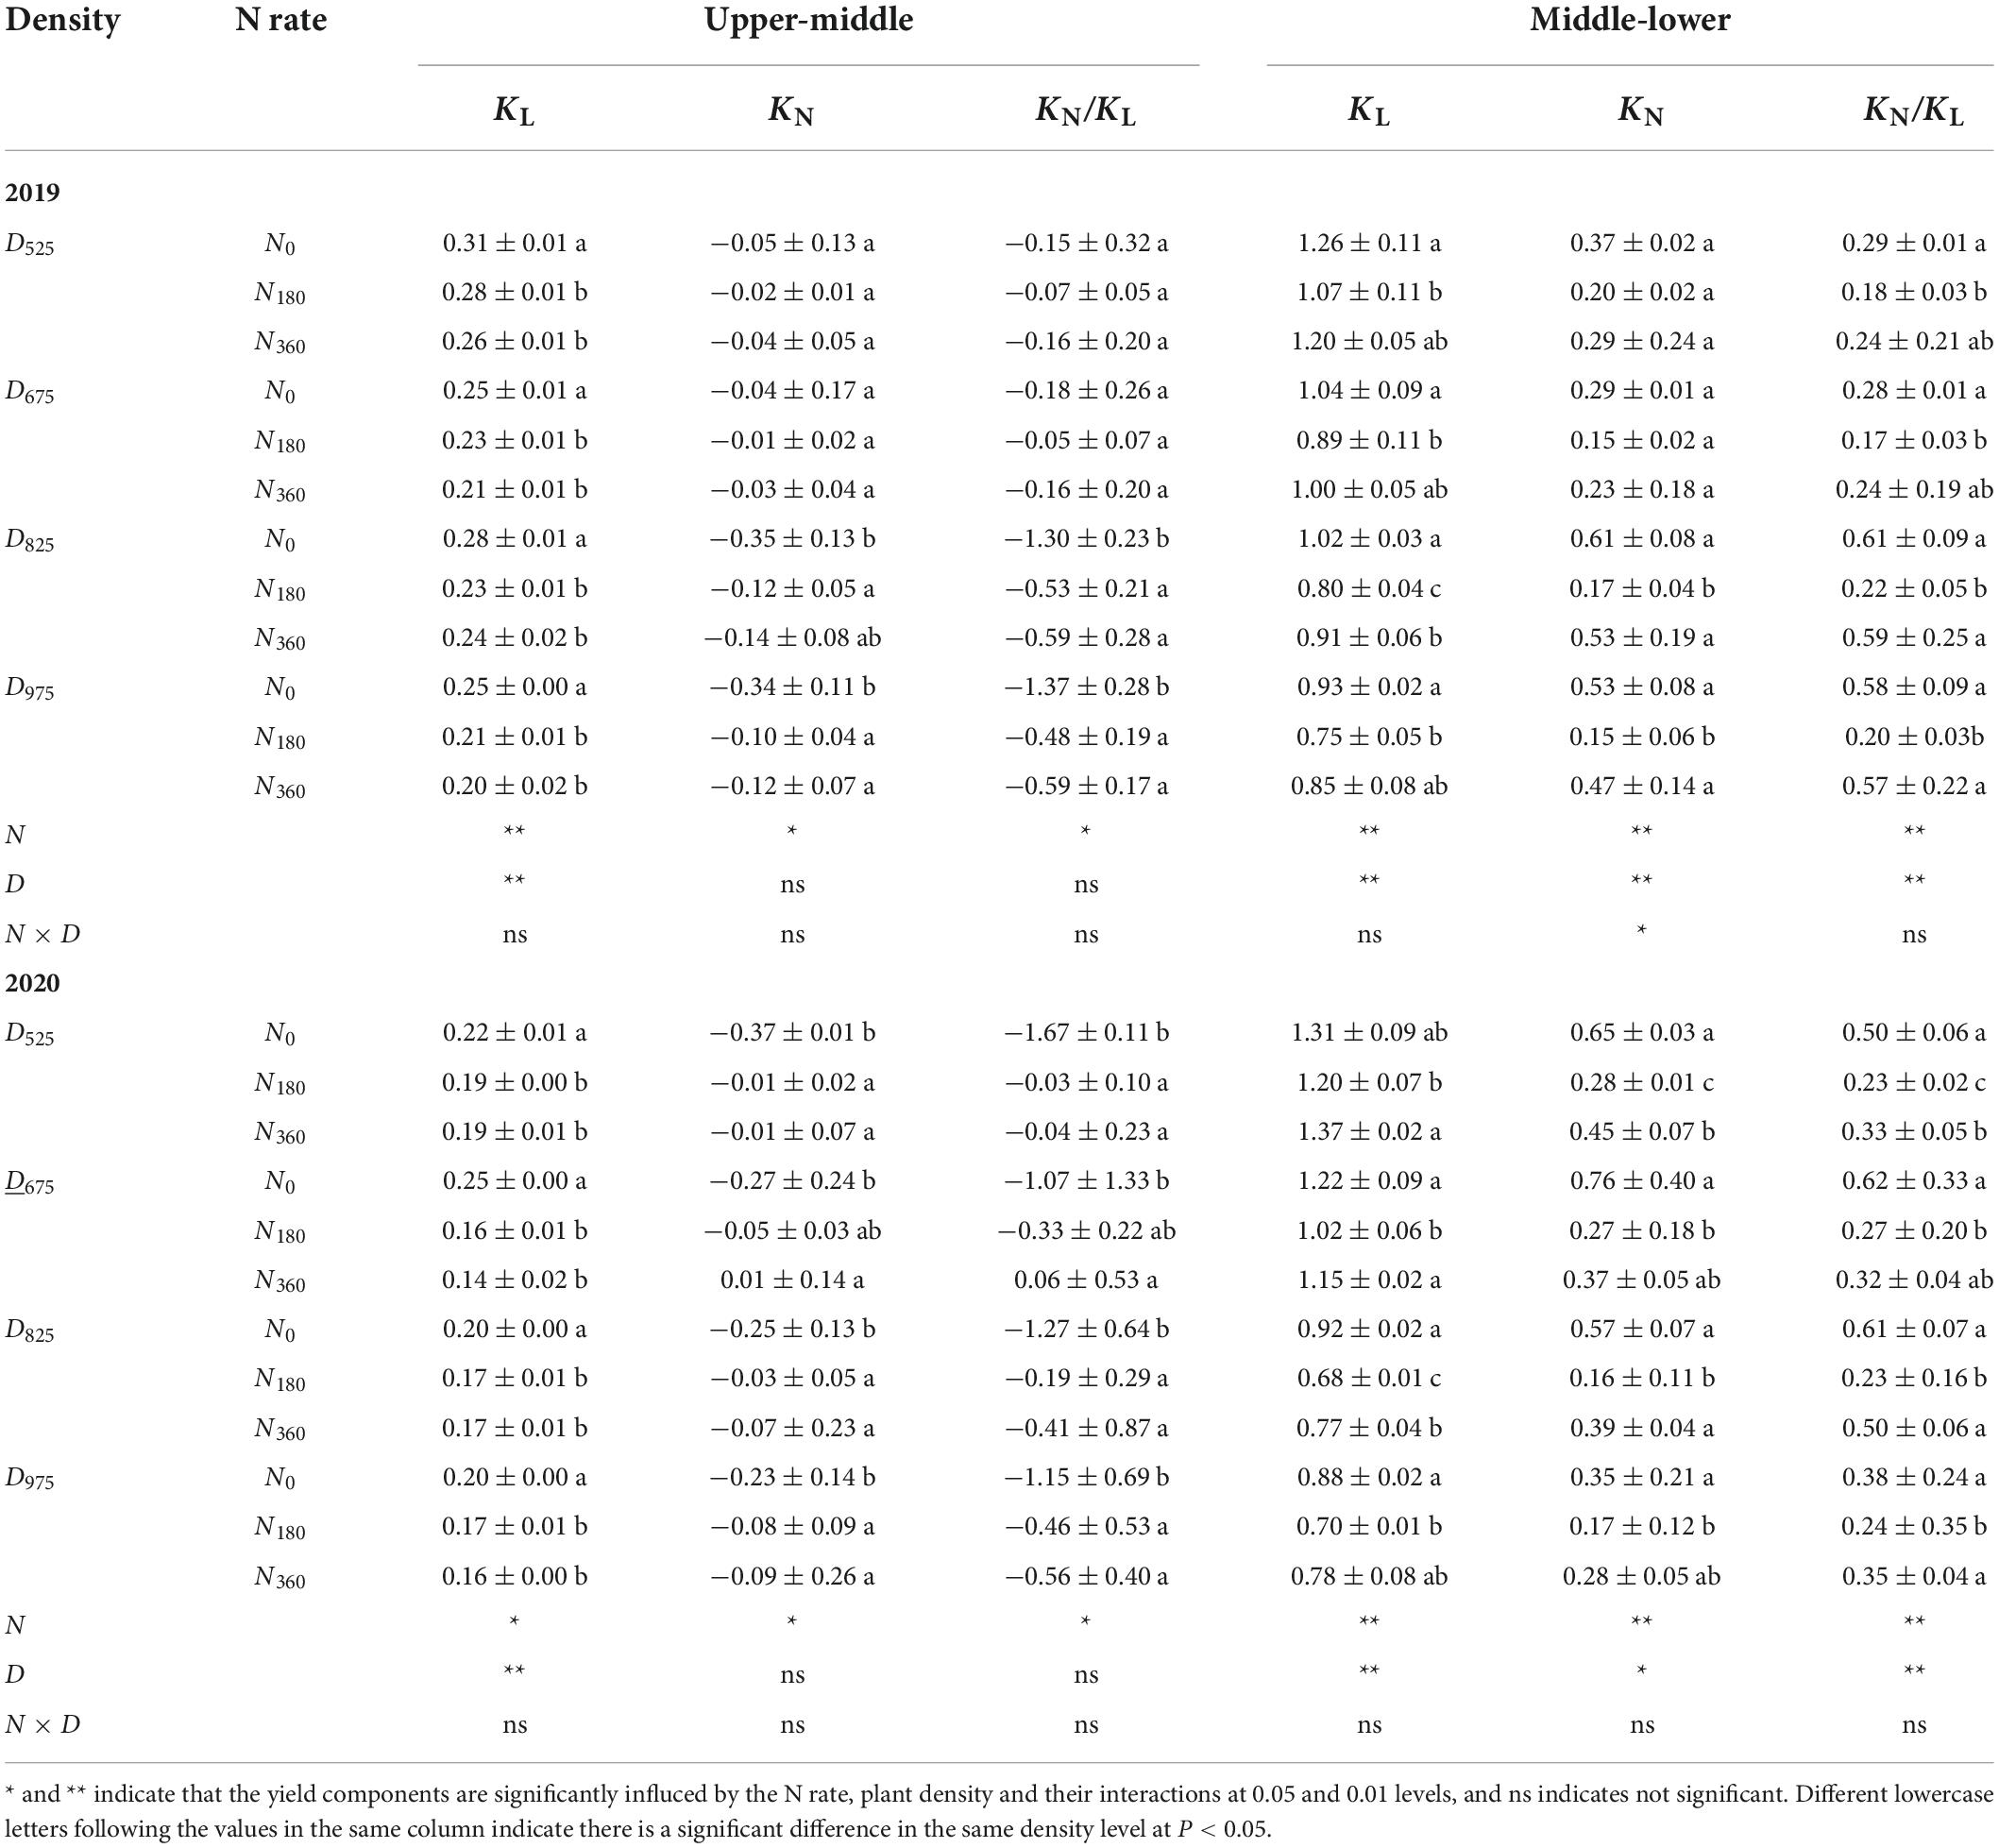
Table 3. Influence of N rate and plant density on the canopy light extinction coefficient (KL, m2 ground m–2 leaf), canopy nitrogen extinction coefficient (KN, m2 ground m–2 leaf), and their ratio (KN/KL).
Parameter KN/KL is an indicator of the N partitioning efficiency at the overall canopy level. This value from the U to M leaf positions was arranged in the order of N180 > N360 > N0, whereas the opposite tendency was found for the M to L leaf positions. It should be noted that the absolute KN/KL value was higher at higher plant densities (D825 and D975) than that in the lower plant densities (D525 and D675).
The relationship between KN/KL and the internal N use efficiency (IEN) is shown in Figure 7. There was a significant positive correlation between the KN/KL (from the M to L leaf positions) and IEN, where the fitted linear equation was y = 0.012x − 0.24, with a coefficient of determination of 0.34. There was a significant negative correlation between KN/KL (from the U to M leaf positions) and IEN, where the fitted linear equation was y = −0.037x + 1.36 with a coefficient of determination of 0.34.
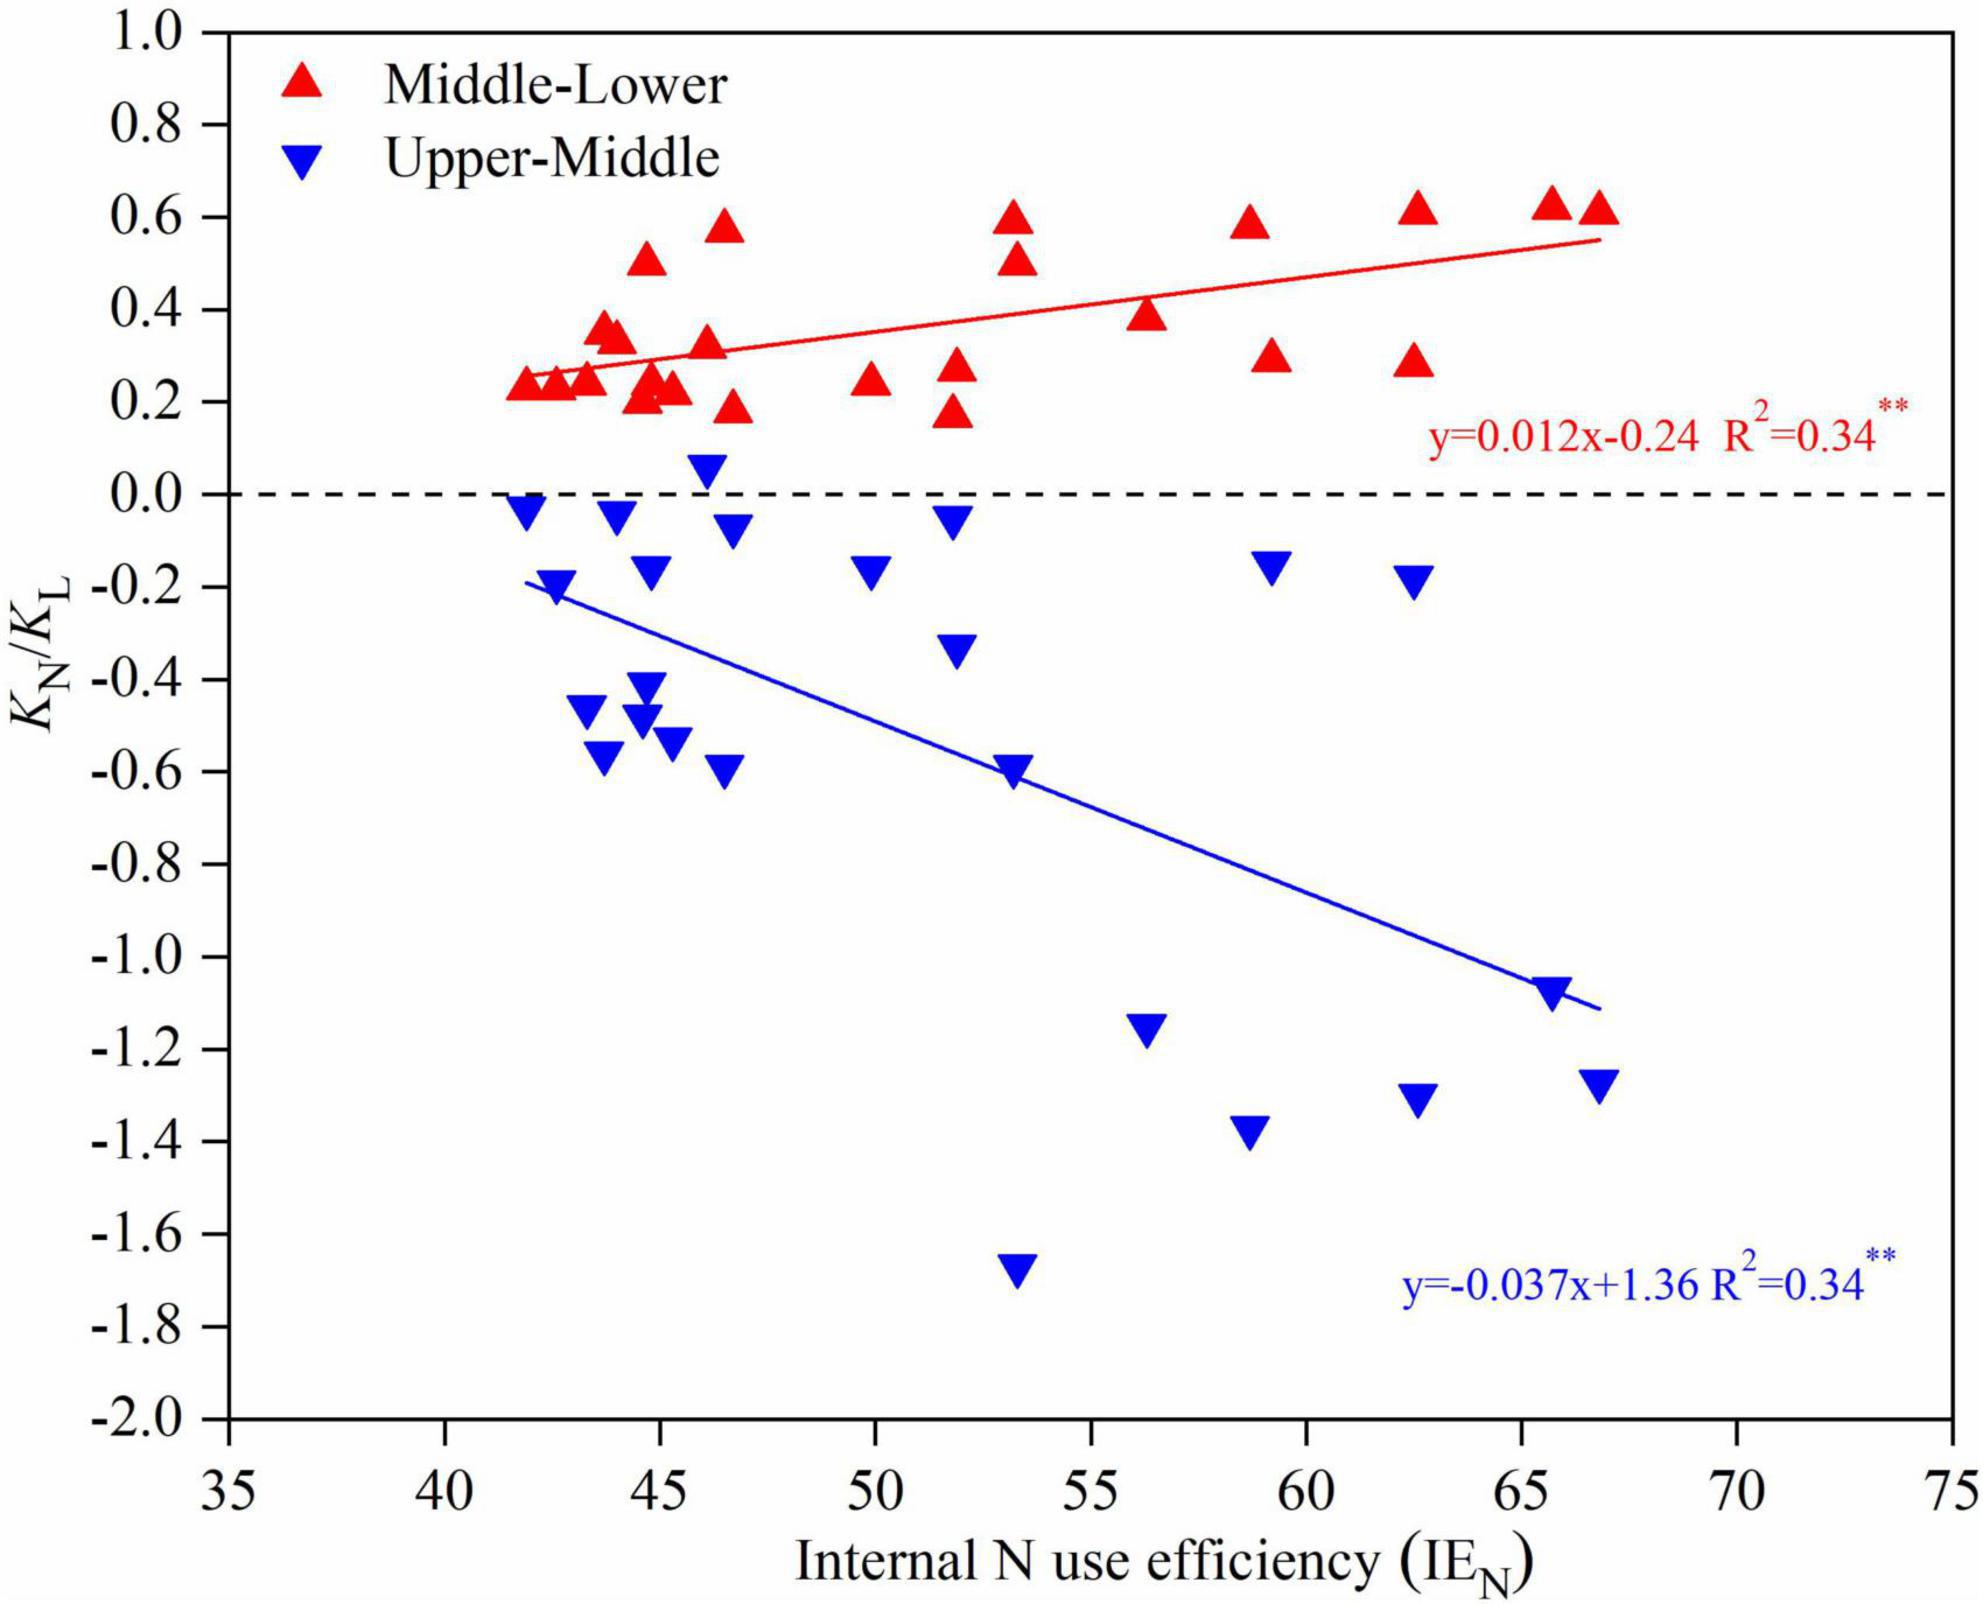
Figure 7. The N extinction coefficient with respect to light (KN/KL) vs. internal N use efficiency for upper-middle maize canopy (blue line) and middle-lower maize canopy (red line) in 2019 and 2020.
There was a quadratic correlation between the yield and the N recovery efficiency (NRE) for the overall data, and this equation also fitted for the yield and NRE under N180 or N360 inputs with higher determination (Figure 8). The NRE under N360 inputs significantly lower than that under N180 input. At the same N level, the plant density management practices improved both the maize yield and NRE, particularly under the N180 inputs, and the NRE under the D825 treatment increased by 115.6% compared with the D525 treatment.
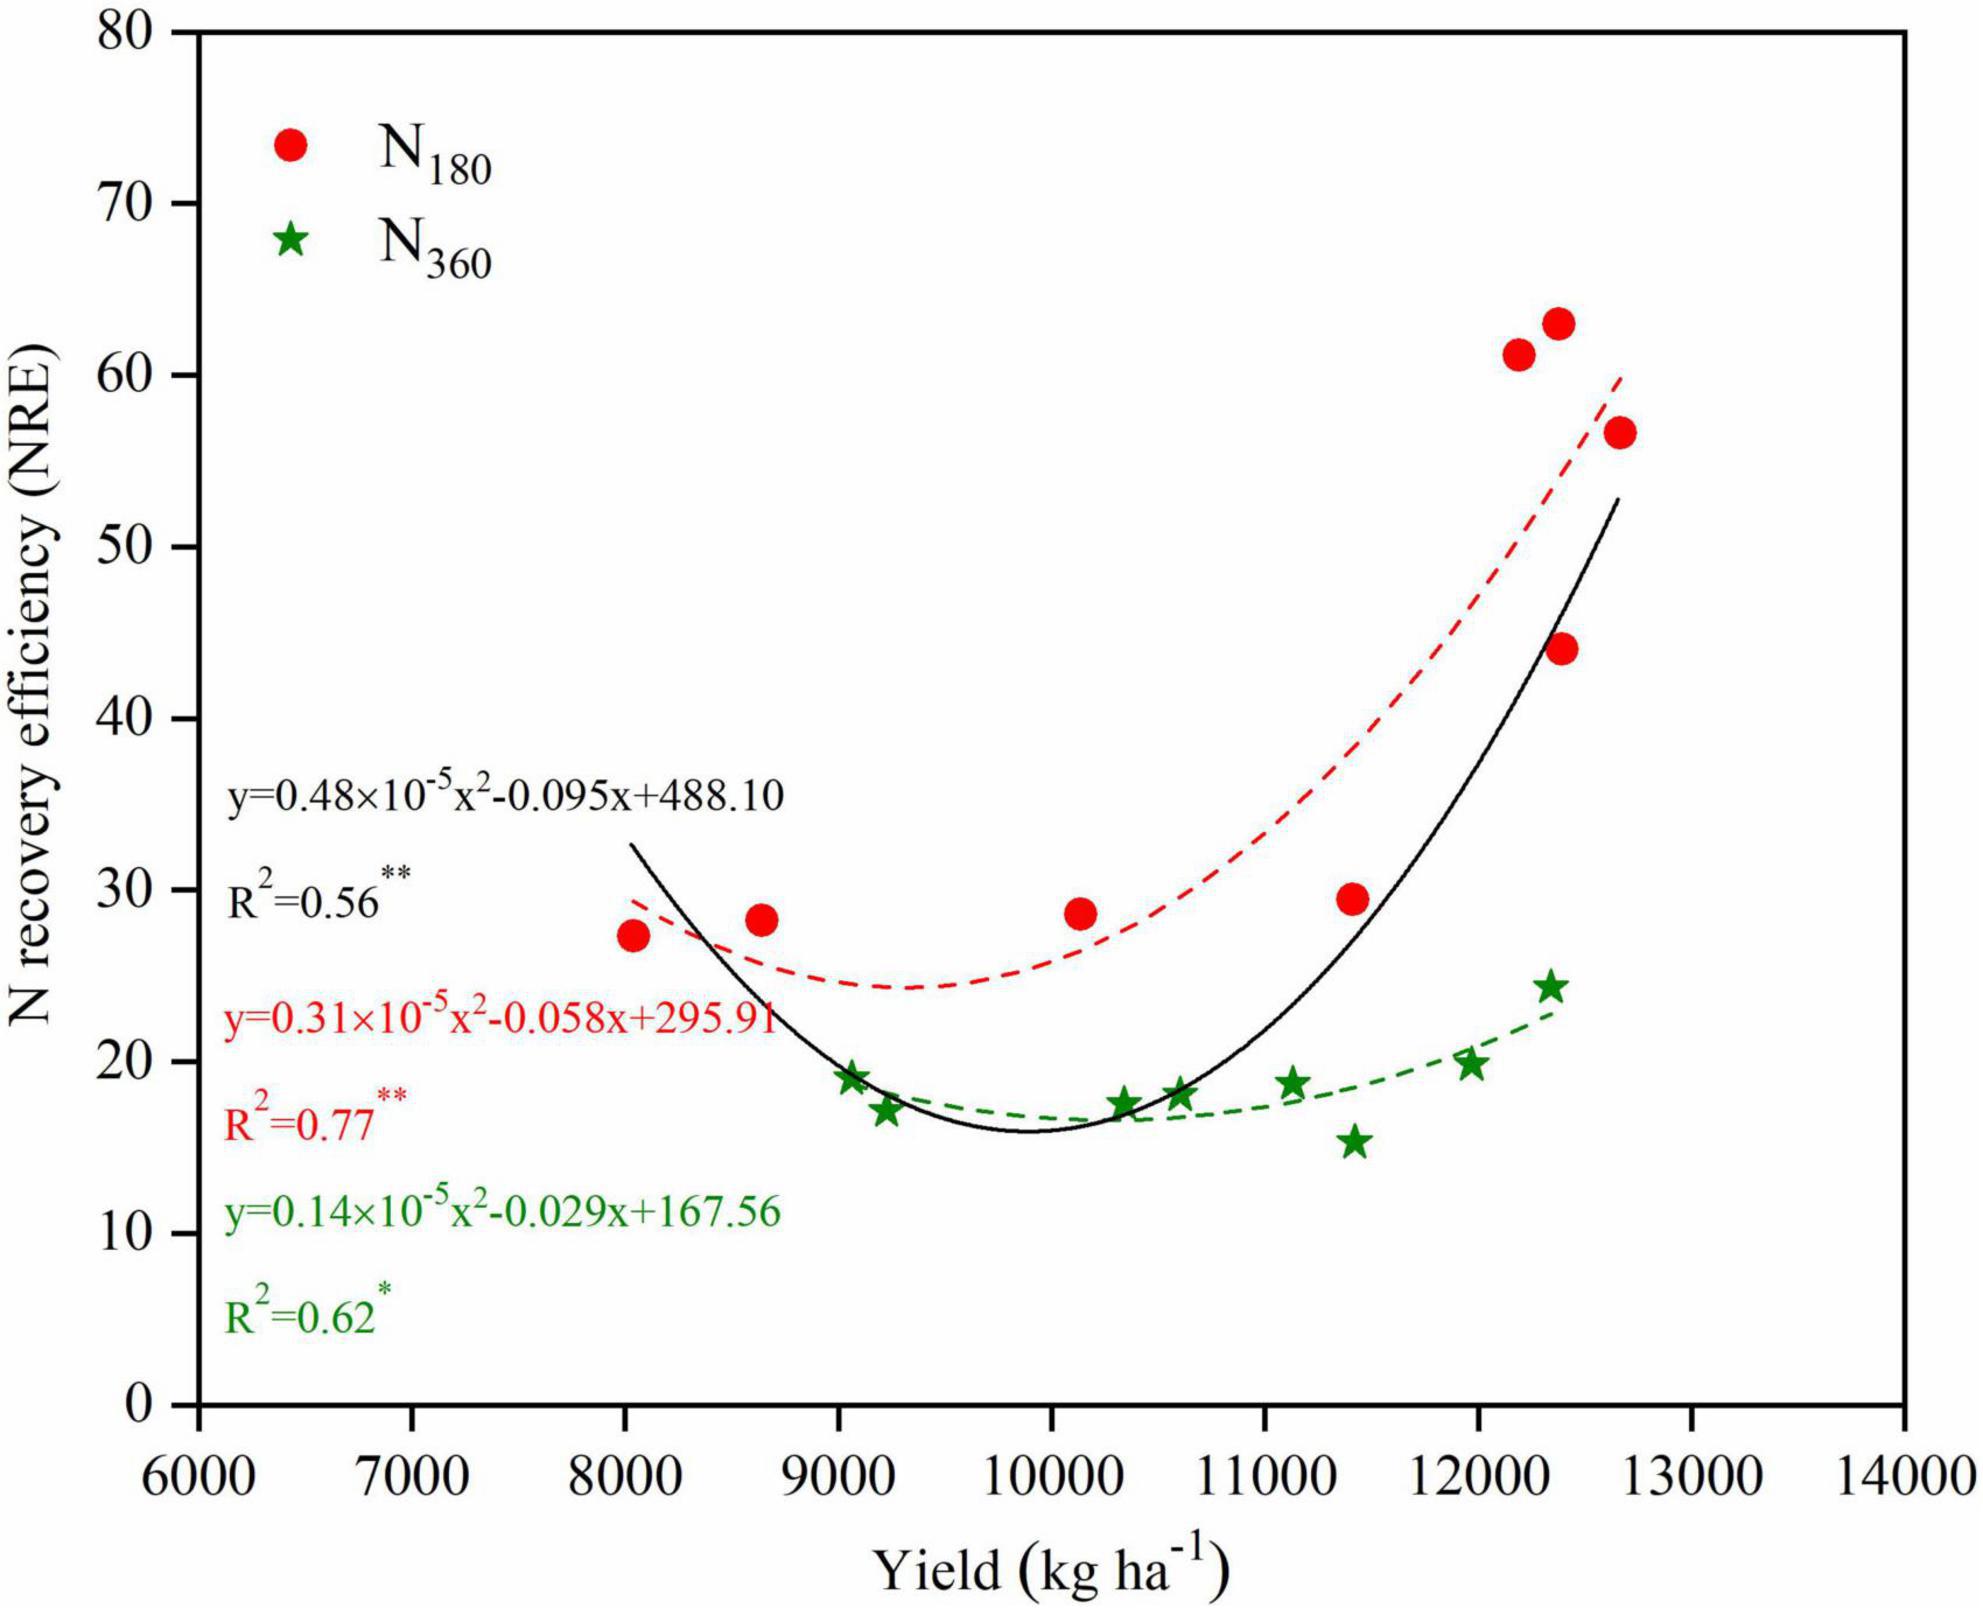
Figure 8. Relationships between yield and N recovery efficiency (NRE) for maize in 2019 and 2020. Non-linear regressions were fitted for overall data (black solid line), data for the N180 inputs (red dashed line) and N360 inputs (green dashed line).
For a <10,000 kg ha–1 yield a positive linear correlation (y = 0.0026x + 32.05) appeared between the yield and IEN, whereas for a ≥10,000 kg ha–1 yield a significant negative linear correlation (y = −0.0045x + 99.33) appeared (Figure 9). At the same N levels, the fitted linear equation under N0 inputs was y = 0.0025x + 38.56 with a coefficient of determination of 0.43. The non-linear fitted equation under the N180 inputs was y = 0.2 × 10–5x2 + 0.041x − 161.85 with a coefficient of determination of 0.94, whereas under the N360 inputs it was y = 0.2 × 10–5x2 + 0.037x − 149.34 with a coefficient of determination of 0.53.
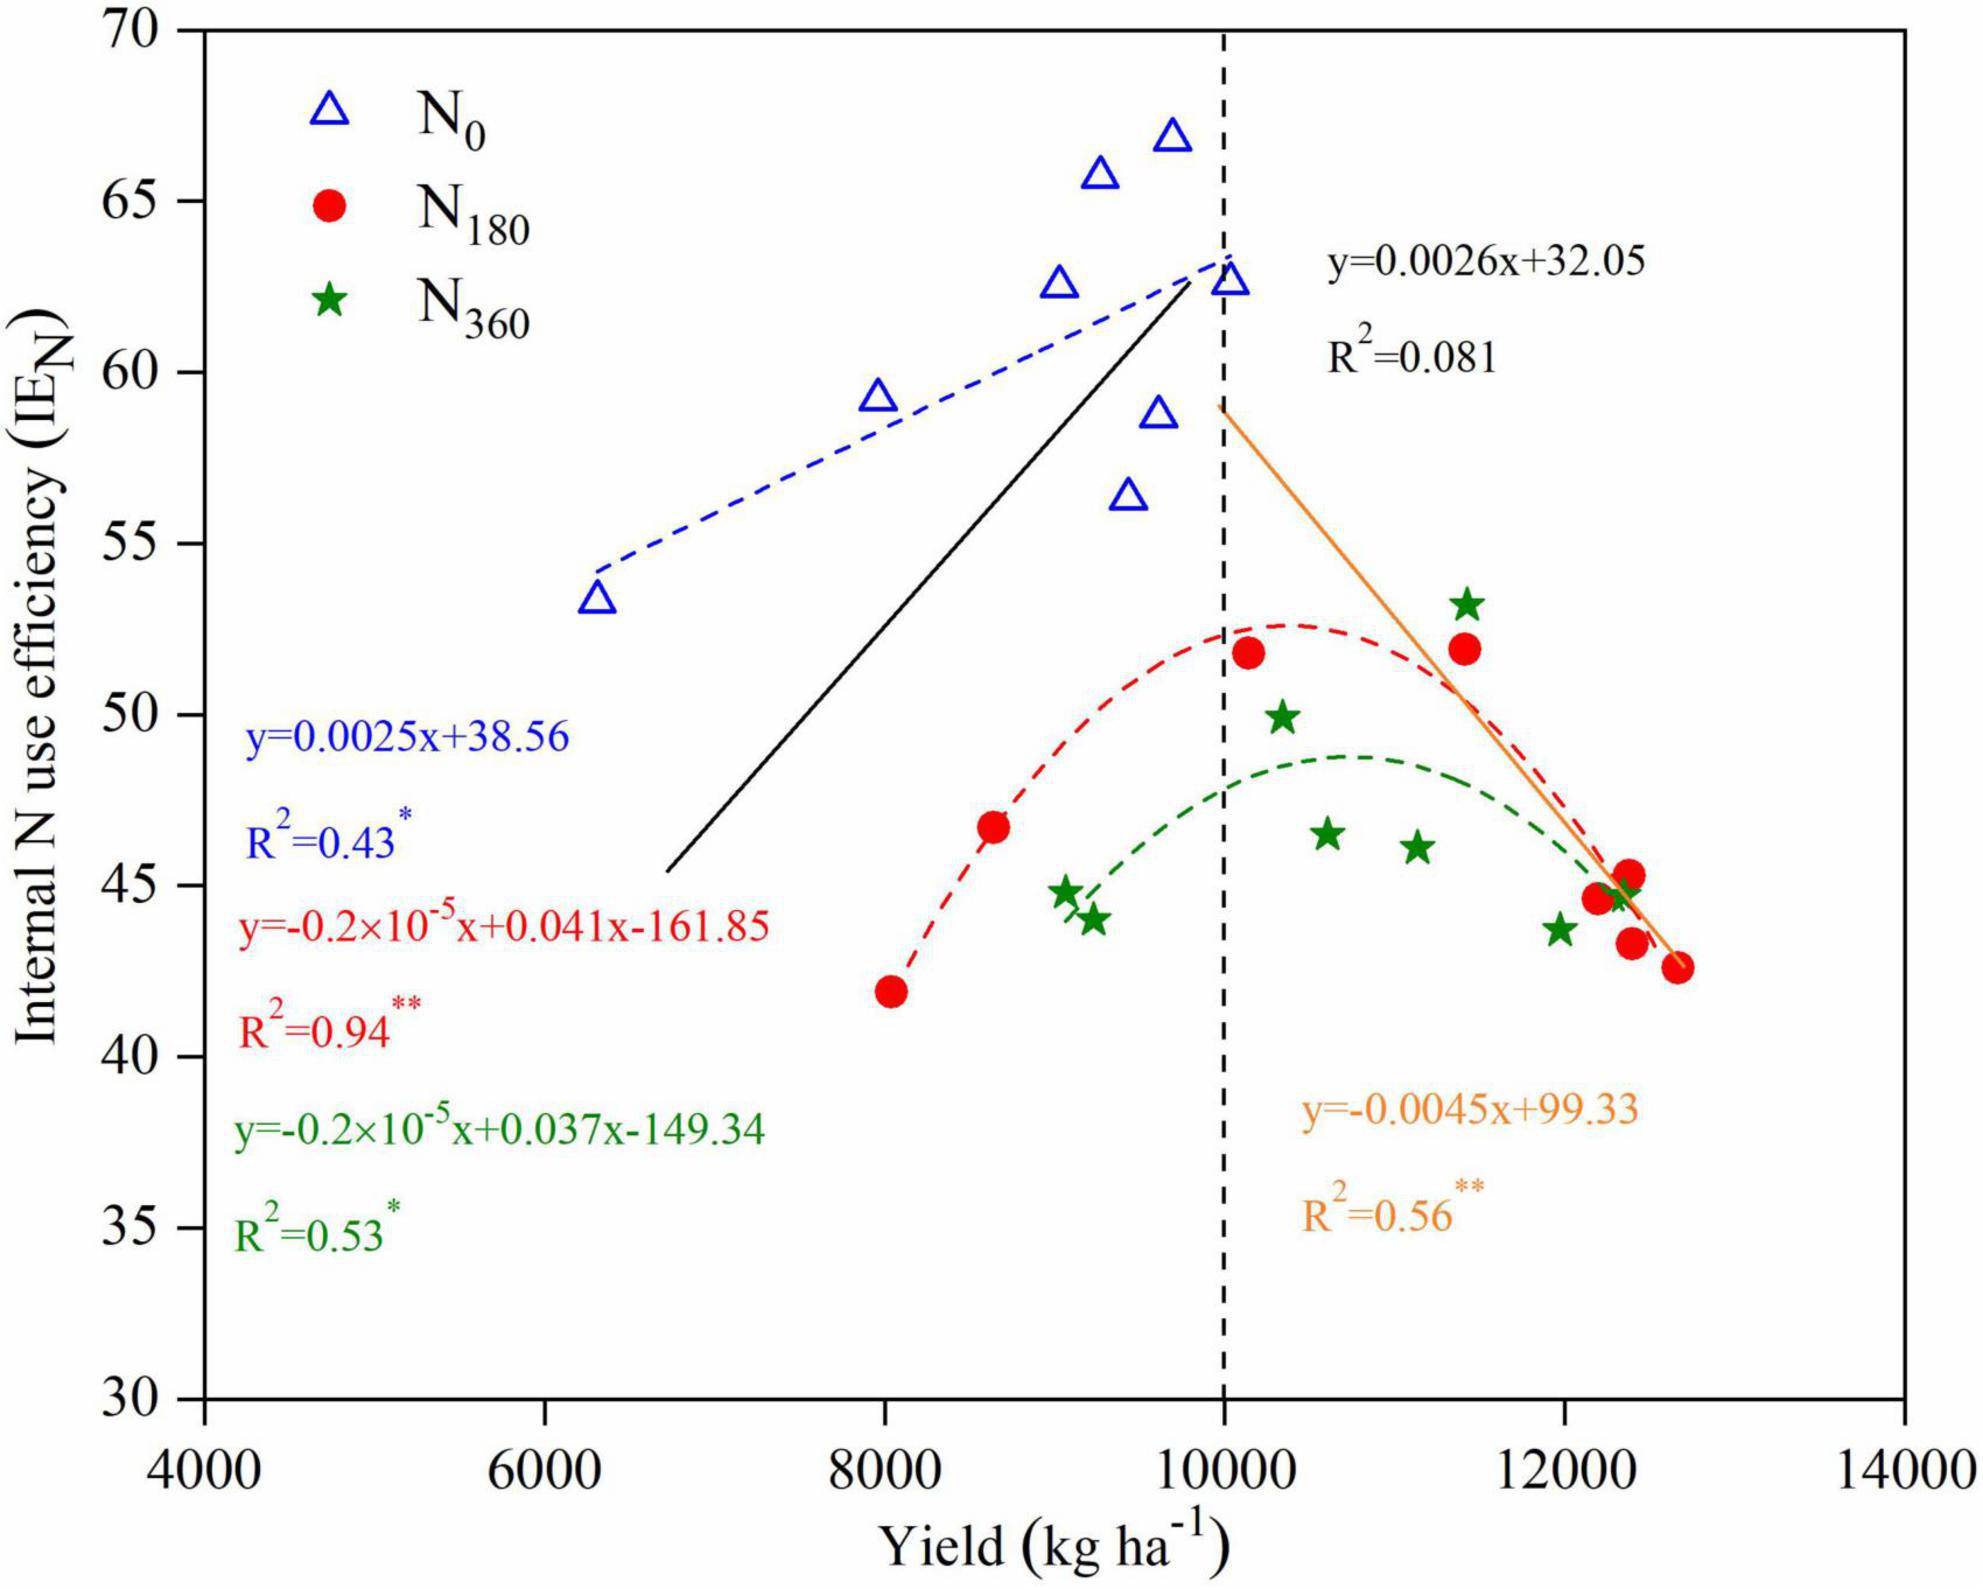
Figure 9. Relationships between yield and internal N use efficiency (IEN) for maize in 2019 and 2020. Linear regressions were fitted for the low yield data (<10,000 kg ha– 1; black solid line) and high yield data (≥10,000 kg ha– 1; orange solid line). Non-linear regressions were fitted for the data under the N0 inputs (blue dashed line), N180 inputs (red dashed line), and N360 inputs (green dashed line).
One of the most critical aspects of maize production is N nutrition. The application of N fertilizer within a certain range significantly increased maize yield (Zhao et al., 2018). In this study, N input increased the kernels per ear and grain weight of maize, particularly in terms of the number of kernels (Supplementary Table 1). Meanwhile, the NRE was reduced with higher N application rates (Figure 8), which suggests that the absorption of N by individual maize plants was limited; thus, it was necessary to increase the crop density. Currently, the density of summer maize in the North China Plain is ∼61,900 plants ha–1, which is much lower than that reported for high-yield maize in the United States (85,500–1,09,500 plants ha–1). Intensive planting has become a key measure and development trend toward achieving large-scale high-yielding maize on a global scale (Ma et al., 2020).
In this study, increasing plant density could further improve NRE under N180 inputs (Figure 8). This is because increasing the density accelerates the transfer of N nutrients from the stems and leaves to the grains (Lai et al., 2022). The highest NRE of maize in this experiment was 56.5–62.8% (2019–2020), while the average NRE of farmer practices in China was 25–30% (Li et al., 2019). Hence, increased plant density is important for reducing N fertilizer losses and environmental risks. Once the optimum plant density was exceeded, both the grain yields and NRE decreased (Figures 1, 8), whereas the risks of lodging, diseases, and insect pests increased (Xue et al., 2017).
In this study, the highest yield and NRE were observed for the D825/N180 treatment, but not for the D975 treatment (Figures 1, 8). Analysis of the agronomic and canopy attributes between different canopy layers for this treatment provided theoretical support for the development of maize populations with high yield and N efficiency in field production. Previous studies have demonstrated that LAI enhances light interception and further increase crop yield (Portes and Melo, 2014; Shi et al., 2016). In this study, the LAI of the D825/N180 treatment was substantially lower than that of the D975/N180 treatment, whereas it was markedly higher than that of the other N-density combinations (Table 1). Hence, LAI is not always accompanied by high yield (Remison and Lucas, 1982). Although LAI was not the highest in the D825/N180 treatment, it had the highest population PAR value (Figure 5). As N and plant density increased leaf area, the shading of the M and L leaves became even more severe under high N and planting density treatments. Insufficient light limits the physiological photosynthetic functions of leaves, even though it results in higher photosynthetic potential (Wang et al., 2017). This, suggests that population PAR is a better indicator of yield than leaf area or LAI.
Moreover, our findings revealed that the angles of the U leaves decreased more than those of the M and L leaves with increasing plant densities (Table 1). The substantial reduction in leaf area and angle of U-leaves seemed to favor more sunlight in the M and L leaf layers. Earlier studies proposed that the net photosynthetic rate of maize was greater in the mid-canopy than in the other leaves from the silking stage until physiological maturity (Dwyer and Stewart, 1986). In this study, the PItotal of the M leaves was the highest, followed by that of the U and L leaves (Figure 6). The low photosynthetic efficiencies in the L leaves were likely related to their long-term exposure to shade (Chen et al., 2015) but not to N nutrient concentration, as the lowest ABS/CS0 was recorded in the L leaves (Table 2 and Figure 6). Furthermore, the chlorophyll concentrations of the M leaves were the highest, followed by those of the L and U leaves. Meanwhile, the relative EC showed the opposite trend in the different leaf layers (Figure 6 and Supplementary Figure 2). Chlorophyll is often positively correlated with the functional periods of leaves, whereas the EC value is negatively correlated (Fu et al., 2020). These data indicate that the M leaves maintained a longer functional period than the L and U leaves. Furthermore, in this study, N deficits or excesses and increasing plant densities led to a significant reduction in whole-plant leaf photosynthetic efficiency (Figure 6 and Supplementary Figure 2). Thus, the selection of reasonable N-density treatments might initially impact leaf agronomic and physiological properties in different leaf layers, which are more conducive to the light-N matching of the vertical maize canopy.
Canopy productivity might be markedly improved by enhancing the light distribution to the leaf layer that contributes the most to grain yield. Several studies have demonstrated that the M leaves contributed the most, followed by the U and L leaves of maize (Dwyer and Stewart, 1986). This may be related to the photosynthetic products of M leaves following the principle of nearest distribution to preferentially supply the cobs (Yuan et al., 2015). Thus, it may be assumed that the higher the PAR is in M leaves, the more conducive the plant will be to high yields. In this study, the PAR value of M leaves in D825/N180 was the highest among all treatments; however, this was not only due to PAR ratio (Figure 5 and Supplementary Figure 1). Additionally, it is necessary to note that the D825/N180 treatment had the highest PAR ratio in the L leaves. Although the N concentration and photosynthetic capacity of L leaves were less than those of M and U leaves (Chen et al., 2015), they had sufficient leaf area (approximately 1.5 times higher than that of U leaves). Furthermore, the function of the L leaves is mainly to produce photosynthetic products to maintain the growth of roots and stems (Hao, 2017). Premature senescence of L leaves due to insufficient light accelerates root senescence, and absorption of mineral nutrients is restricted in the later growth stage (Borras et al., 2003). Then, to help the M and L leaves get more light, it is necessary to slow down the light reduction in the vertical direction, that is, a smaller KL value. A smaller KL value indicates a more uniform light distribution within the vertical canopy, which better matches the high-yielding canopy (Peng et al., 2008; Gu et al., 2017). Our results indicated that both the application of N and enhancing plant density could decrease the value of KL (Table 3).
A linear, or more generally asymptotic relationship between photosynthesis and the leaf N content has been found in numerous studies (Xiong et al., 2015; Wu et al., 2019). Crop growth and production are dependent not only on the amount of total N absorbed by plants, but also on the vertical leaf N distribution within canopies (Li et al., 2013; Hikosaka, 2016). In many plant canopies, there is a vertical gradient of leaf N content per unit leaf area, which is higher in U-leaves (Huang et al., 2014; Niinemets et al., 2015). In this study, the N content of the M leaves was the highest, followed by that of the U and L leaves (Figure 6), which was distinct from that of rice and wheat (Shiratsuchi et al., 2006). Hence, the KN from the upper-middle canopy had a negative value, whereas the KN from the middle-lower canopy had a positive value. It was worth mentioning that the absolute value of KN under moderate N inputs (N180) was lowest, and the high-yield treatment (D825/N180) had the lowest KN (absolute value). This indicates that the N gradient distribution in the vertical canopy of high-yield maize was more uniform. Furthermore, the higher KN under N0 input may have been related to low N availability. When the availability of N is low for plants, senescence of old leaves occurs; thus, the retranslocation of N from old to new leaves is accelerated, which also contributes to the high KN, as shown in Table 3.
It has been suggested that leaf N gradients observed in canopies represent a strategy for maximizing carbon assimilation (Hirose, 2005). In this study, a higher absolute KN/KL value in the U-M canopy and a lower absolute KN/KL value in the M-L canopy were observed in the D825/N180 treatment (Table 3). It can be used as an indicator for evaluating the quality of maize canopy structure in breeding and cultivation management. There was a significant negative linear correlation between the IEN and grain yields when the yield was >10 t ha–1, whereas the NRE was significantly increased with enhanced yields (Figures 7, 8). Therefore, the mechanism of N-density matching to improve grain yields was not primarily determined by the retranslocation of N from the leaves to the grain, but rather by enhancing the absorption efficiency of N by roots. This viewpoint was similar to that of Yan et al. (2017) who suggested that planting density affected the ability of maize plants to use available soil N either insufficient or excessive density will result in a low NRE.
Previous studies have reported that insufficient plant densities and excessive use of N fertilizer were the main reasons for the lower corn yields and N use efficiencies in China (Meng et al., 2013). According to this study, increasing the plant density from 52,500 to 82,500 plants ha–1 improved both the grain yields and N use efficiency (NUE, including NRE and IEN). However, a further increase in plant density to 97,500 plants ha–1 induced grain yield losses and NUE reductions. In this study, the 82,500 plants ha–1 was similar to the optimal plant density (79,000 plants ha–1) in America (Ciampitti and Vyn, 2011), while it was lower than the 90,000–1,05,000 plant ha–1 for a superior high-yield study in China (Chen et al., 2011). It could not be ignored that the average N fertilizer inputs of super-high-yielding fields reached 774 kg N ha–1. Consequently, low NRE and substantial N losses have been reported in these fields, which is clearly not in line with the goals of modern crop nutrient management. Our study suggests that the potential negative effects of reduced N rate on yield attributes and grain yield can be compensated for increasing plant density to a certain range, and dense planting may be a feasible strategy to reduce N input in maize production.
Increasing yields in conjunction with efficient N utilization is an important goal for sustainable agriculture. In this study, an N application rate of 180 kg ha–1 coupled with a plant density of 82,500 plants ha–1 achieved the highest yield and NRE, which resulted in higher plant densities and lower N inputs than traditional agricultural practices in Northern China. Moderate densification effectively reduced the leaf area and angles of the upper leaves while allowing more light to enter the middle and lower leaf layers, increasing the population TPAR. The N and chlorophyll concentrations, anti-aging capacity, and photosynthetic fluorescence efficacy of the middle leaves were much higher than those of other leaves. The lager leaf area compensated for the insufficient PAR absorption efficiency in the lower leaves. Thus, maintaining a certain light intensity in the lower leaf layer (indicated by a smaller KL) is key to achieving high yields. Furthermore, the reduced N rate without yield reductions under higher plant densities primarily attributed to the vertical N distribution, was more uniform.
The raw data supporting the conclusions of this article will be made available by the authors, without undue reservation.
YY and YW conceived the idea and designed the study. JL, YZ, YH, PT, and YL conducted the experiments. YW and JL performed analyses and wrote the manuscript. All authors approved the final version of the manuscript.
This work was supported by the National Key Research and Development Program of China (No. 2021YFD1700900), the Natural Science Foundation of Henan Province (No. 212300410155), Scientific and Technological Project of Henan Province (No. 202102110025), and Key Scientific Research Project of the Higher Education Institutions of Henan Province (No. 21A210022).
The authors declare that the research was conducted in the absence of any commercial or financial relationships that could be construed as a potential conflict of interest.
All claims expressed in this article are solely those of the authors and do not necessarily represent those of their affiliated organizations, or those of the publisher, the editors and the reviewers. Any product that may be evaluated in this article, or claim that may be made by its manufacturer, is not guaranteed or endorsed by the publisher.
The Supplementary Material for this article can be found online at: https://www.frontiersin.org/articles/10.3389/fpls.2022.974714/full#supplementary-material
N, nitrogen; PAR, photosynthetically active radiation; TPAR, total photosynthetically active radiation; LAI, leaf area index; KL, extinction coefficient for light; NRE, N recovery efficiency; IEN, internal N use efficiency; PItotal, total performance index; KN, extinction coefficient for N; EC, relative leaf conductivity; M leaf, middle leaf; U leaf, upper leaf; L leaf, low leaf.
Al-Naggar, A., and Atta, M. (2017). Elevated plant density effects on performance and genetic parameters controlling maize (Zea mays L.) agronomic traits. J. Adv. Biol. Biotechnol. 12, 1–20. doi: 10.9734/JABB/2017/31550
Anten, N. P. R., Schieving, F., and Werger, M. J. A. (1995). Patterns of light and nitrogen distribution in relation to whole canopy carbon gain in C3 and C4 mono- and dicotyledonous species. Oecologia 101, 504–513. doi: 10.1007/BF00329431
Appenroth, K. J., Stockel, J., and Srivastava, A. (2001). Multiple effects of chromate on the photosynthetic apparatus of Spirodelapolyrhiza as probed by OJIP chlorophyll a fluorescense. Environ. Pollut. 115, 49–64. doi: 10.1016/S0269-7491(01)00091-4
Borras, L., Maddonni, G. A., and Otegui, M. E. (2003). Leaf senescence in maize hybrids: Plant population, row spacing, and kernel set effects. Field Crop Res. 82, 13–26. doi: 10.1016/S0378-4290(03)00002-9
Chen, X. P., Cui, Z. L., Vitousek, P. M., Cassman, K. G., Matson, P. A., Bai, J. S., et al. (2011). Integrated soil–crop system management for food security. P. Natl. Acad. Sci. U.S.A. 108, 6399–6404. doi: 10.1073/pnas.1101419108
Chen, Y. L., Xiao, C. X., Wu, D. L., Xia, T. T., Chen, Q. W., Chen, F. J., et al. (2015). Effects of nitrogen application rate on grain yield and grain nitrogen concentration in two maize hybrids with contrasting nitrogen remobilization efficiency. Eur. J. Agron. 62, 79–89. doi: 10.1016/j.eja.2014.09.008
Cheng, P. C., Greyson, R. I., and Walden, D. B. (1983). Organ initiation and of the development unisexual flowers in the tassel and ear of Zea mays. Am. J. Bot. 70, 450–462. doi: 10.1002/j.1537-2197.1983.tb06411.x
Ciampitti, I. A., and Vyn, T. J. (2011). A comprehensive study of plant density consequences on nitrogen uptake dynamics of maize plants from vegetative to reproductive stage. Field Crop. Res. 121, 2–18. doi: 10.1016/j.fcr.2010.10.009
Correndo, A. A., Rotundo, J. L., Tremblay, N., Archontoulis, S., Coulter, J. A., Ruiz-Diaz, D., et al. (2021). Assessing the uncertainty of maize yield without nitrogen fertilization. Field Crop. Res. 260:107985. doi: 10.1016/j.fcr.2020.107985
Dong, S. X., Zhang, J., Zha, T., Dai, X. L., and He, M. R. (2019). Increased plant density with reduced nitrogen input can improve nitrogen use efficiency in winter wheat while maintaining grain yield. Arch. Agron. Soil Sci. 66, 1707–1720. doi: 10.1080/03650340.2019.1690139
Du, X. B., Wang, Z., Lei, W. X., and Kong, L. C. (2021). Increased planting density combined with reduced nitrogen rate to achieve high yield in maize. Sci. Rep. 11:358. doi: 10.1038/s41598-020-79633-z
Dwyer, L. M., and Stewart, W. D. (1986). Effect of leaf age and position on net photosynthetic rates in maize (Zea mays L.). Agr. For. Meteorol. 37, 29–46. doi: 10.1016/0168-1923(86)90026-2
Fu, W., Wang, Y., Ye, Y. L., Zhen, S., Zhou, B. H., Wang, Y., et al. (2020). Grain yields and nitrogen use efficiencies in different types of stay-green maize in response to nitrogen fertilizer. Plants 9:474. doi: 10.3390/plants9040474
Gallagher, J. N., and Biscoe, P. V. (1978). Radiation absorption, growth and yield of cereals. J. Agric. Sci. 91, 47–60. doi: 10.1017/s0021859600056616
Gu, J. F., Chen, Y., Zhang, H., Li, Z. K., Zhou, Q., Yu, C., et al. (2017). Canopy light and nitrogen distributions are related to grain yield and nitrogen use efficiency in rice. Field Crop. Res. 206, 74–85. doi: 10.1016/j.fcr.2017.02.021
Hao, Q. Y. (2017). A research on the influence of different types of maize leafs on production and yield component traits (in Chinese with English abstract). Oasis Agr. Sci. Eng. 3, 19–24.
Hikosaka, K. (2016). Optimality of nitrogen distribution among leaves in plant canopies. J. Plant Res. 129, 299–311. doi: 10.1007/s10265-016-0824-1
Hirose, T. (2005). Development of the Monsi-Saeki theory on canopy structure and function. Ann. Bot. 95, 483–494. doi: 10.1093/aob/mci047
Hou, P. F., Jiang, Y., Yan, L., Petropoulos, E., Wang, J. Y., Xue, L. H., et al. (2021). Effect of fertilization on nitrogen losses through surface runoffs in Chinese farmlands: A meta-analysis. Sci. Total Environ. 793:148554. doi: 10.1016/j.scitotenv.2021.148554
Hou, W. F., Muhammad, R. K., Zhang, J. L., Lu, J. W., Ren, T., Cong, R. H., et al. (2019). Nitrogen rate and plant density interaction enhances radiation interception, yield and nitrogen use efficiency of mechanically transplanted rice. Agr. Ecosyst. Environ. 269, 183–192. doi: 10.1016/j.agee.2018.10.001
Huang, W. J., Yang, Q. Y., Pu, R. L., and Yang, S. Y. (2014). Estimation of nitrogen vertical distribution by bi-directional canopy reflectance in winter wheat. Sensors 14, 20347–20359. doi: 10.3390/s141120347
Jin, L. B., Cui, H. Y., Li, B., Zhang, J. W., Dong, S. T., and Liu, P. (2012). Effects of integrated agronomic management practices on yield and nitrogen efficiency of summer maize in North China. Field Crop. Res. 134, 30–35. doi: 10.1016/j.fcr.2012.04.008
Kruczek, A. (2003). Effect of foliar nutrition with nitrogen and a multiple fertilizer on maize by diseases, pests and lodging. Acta Agrophys. 85, 77–87.
Labra, M. H., Struik, P. C., Calderini, D. F., and Evers, J. B. (2020). Leaf nitrogen traits in response to plant density and nitrogen supply in oilseed rape. Agronomy 10:1780. doi: 10.3390/agronomy10111780
Lai, Z. L., Fan, J. L., Yang, R., Xv, X. Y., Liu, L. J., Li, S., et al. (2022). Interactive effects of plant density and nitrogen rate on grain yield, economic benefit, water productivity and nitrogen use efficiency of drip-fertigated maize in northwest China. Agr. Water Manage. 263:107453. doi: 10.1016/j.agwat.2021.107453
Li, C. H., Su, X. H., Xie, R. Z., Zhou, S. M., and Li, D. H. (2001). Study on relationship between grain-yield of summer corn and climatic ecological condition under super-high-yield cultivation (in Chinese with English abstract). Sci. Agric. Sin. 34, 311–316.
Li, H. L., Zhao, C. J., Huang, W. J., and Yang, G. J. (2013). Non-uniform vertical nitrogen distribution within plant canopy and its estimation by remote sensing: A review. Field Crop. Res. 142, 75–84. doi: 10.1016/j.fcr.2012.11.017
Li, H. S. (2000). Principles and techniques of plant physiological biochemical experiment. Beijing: Higher Education Press.
Li, P. C., Dong, H. L., Zheng, C. S., Sun, M., Liu, A. Z., Wang, G. P., et al. (2017). Optimizing nitrogen application rate and plant density for improving cotton yield and nitrogen use efficiency in the North China Plain. PLoS One 12:e0185550. doi: 10.1371/journal.pone.0185550
Li, P. F., Lu, J. W., Wang, Y., Hussain, S., Ren, T., Cong, R., et al. (2018). Nitrogen losses, use efficiency, and productivity of early rice under controlled-release urea. Agr. Ecosyst. Environ. 251, 78–87. doi: 10.1016/j.agee.2017.09.020
Li, X. L., Guo, L. G., Zhou, B. Y., Tang, X. M., Chen, C. C., Zhang, L., et al. (2019). Characterization of low-N responses in maize (Zea mays L.) cultivars with contrasting nitrogen use efficiency in the North China Plain. J. Integr. Agr. 18, 2141–2152. doi: 10.1016/S2095-3119(19)62597-9
Liu, Y., Liao, Y. C., and Liu, W. Z. (2021). High nitrogen application rate and planting density reduce wheat grain yield by reducing filling rate of inferior grain in middle spikelets. Crop J. 9, 412–426. doi: 10.1016/j.cj.2020.06.013
Luo, Z., Liu, H., Li, W. P., Zhao, Q., Dai, J. L., Tian, L. W., et al. (2018). Effects of reduced nitrogen rate on cotton yield and nitrogen use efficiency as mediated by application mode or plant density. Field Crop. Res. 218, 150–157. doi: 10.1016/j.fcr.2018.01.003
Ma, D. L., Li, S. K., Zhai, L. C., Yu, X. F., Xie, R. Z., and Gao, J. L. (2020). Response of maize barrenness to density and nitrogen increases in Chinese cultivars released from the 1950s to 2010s. Field Crop. Res. 250:107766. doi: 10.1016/j.fcr.2020.107766
Meng, Q. F., Hou, P., Wu, L. Q., Chen, X. P., Cui, Z. L., and Zhang, F. S. (2013). Understanding production potentials and yields gaps in intensive maize production in China. Field Crop. Res. 143, 91–97. doi: 10.1016/j.fcr.2012.09.023
Mina, T. (2013). Investigation flag leaf traits in different agronomical treatments in rice. World Appl. Sci. J. 28, 2163–2168.
Nedi, G., Alamerew, S., and Tulu, L. (2016). Reivew on quality protein maize breeding for ethiopia. J. Biol. Agr. Healthc. 16, 84–96.
Niinemets, U., Keenan, T. F., and Hallik, L. (2015). A worldwide analysis of within-canopy variations in leaf structural, chemical and physiological traits across plant functional types. New Phytol. 2015, 973–993. doi: 10.1111/nph.13096
Ning, Q., Jian, Y. N., Du, Y. F., Li, Y. F., Shen, X. M., Jia, H. T., et al. (2021). An ethylene biosynthesis enzyme controls quantitative variation in maize ear length and kernel yield. Nat. Commun. 12:5832. doi: 10.1038/s41467-021-26123-z
Peng, S. B., Khush, G. S., Virk, P., Tang, Q. Y., and Zou, Y. B. (2008). Progress in ideotype breeding to increase rice yield potential. Field Crop. Res. 108, 32–38. doi: 10.1016/j.fcr.2008.04.001
Portes, T. D., and Melo, H. C. (2014). Light interception, leaf area and biomass production as a function of the density of maize plants analyzed using mathematical models. Acta Sci. Agron. 36, 457–463. doi: 10.4025/actasciagron.v36i4.17892
Remison, S. U., and Lucas, E. O. (1982). Effects of planting density on leaf area and productivity of two maize cultivars in Nigeria. Exp. Agr. 18, 93–100. doi: 10.1017/S0014479700013478
Shi, D. Y., Li, Y. H., Zhang, J. W., Liu, P., Zhao, B., and Dong, S. T. (2016). Increased plant density and reduced N rate lead to more grain yield and higher resource utilization in summer maize. J. Integr. Agr. 15, 2515–2528.
Shiratsuchi, H., Yamagishi, T., and Ishii, R. (2006). Leaf nitrogen distribution to maximize the canopy photosynthesis in rice. Field Crop. Res. 95, 291–304. doi: 10.1016/j.fcr.2005.04.005
Singletary, G. W., and Below, F. E. (1990). Nitrogen-induced changes in the growth and metabolism of developing maize kernels grown in vitro. Plant Physiol. 92, 160–167. doi: 10.1104/pp.92.1.160
Uhart, S. A., and Andrade, F. H. (1995). Nitrogen deficiency in maize: II. Carbon-nitrogen interaction effects on kernel number and grain yield. Crop Sci. 35, 1384–1389. doi: 10.2135/cropsci1995.0011183X003500050021x
Wang, X. K., Wang, G., Turner, N. C., Xing, Y. Y., Li, M. T., and Guo, T. (2020). Determining optimal mulching, planting density, and nitrogen application to increase maize grain yield and nitrogen translocation efficiency in Northwest China. BMC Plant Biol. 20:282. doi: 10.1186/s12870-020-02477-2
Wang, Y., Ren, T., Lu, J. W., Cong, R. H., Hou, W. F., Liu, T., et al. (2017). Exogenously applied gibberellic acid improves the growth and yield performance of inferior rice tillers grown under different nitrogen levels. Acta Physiol. Plant 39:5. doi: 10.1007/s11738-016-2307-3
Wu, Y. W., Li, Q., Jin, R., Chen, W., Liu, X. L., Kong, F. L., et al. (2019). Effect of low-nitrogen stress on photosynthesis and chlorophyll fluorescence characteristics of maize cultivars with different low-nitrogen tolerances. J. Integr. Agr. 18, 1246–1256. doi: 10.1016/S2095-3119(18)62030-1
Xiong, D. L., Yu, T. T., Liu, X., Li, Y., Peng, S. B., and Huang, J. L. (2015). Heterogeneity of photosynthesis within leaves is associated with alteration of leaf structural features and leaf N content per leaf area in rice. Funct. Plant Biol. 42, 687–696. doi: 10.1071/FP15057
Xu, C. L., Huang, S. B., Tian, B. J., Ren, J. H., Meng, Q. F., and Wang, P. (2017). Manipulating planting density and nitrogen fertilizer application to improve yield and reduce environmental impact in Chinese maize production. Front. Plant Sci. 8:1234. doi: 10.3389/fpls.2017.01234
Xue, J., Xie, R. Z., Zhang, W. F., Wang, K. R., Hou, P., Ming, B., et al. (2017). Research progress on reduced lodging of high-yield and-density maize. J. Integr. Agr. 16, 2717–2725. doi: 10.1016/S2095-3119(17)61785-4
Yan, P., Chen, Y. Q., Sui, P., Vogel, A., and Zhang, X. P. (2018). Effect of maize plant morphology on the formation of apical kernels at different sowing dates and under different plant densities. Field Crop. Res. 223, 83–92.
Yan, P., Pan, J. X., Zhang, W. J., Shi, J. F., Chen, X. P., and Cui, Z. L. (2017). A high plant density reduces the ability of maize to use soil nitrogen. PLoS One 12:e0172717. doi: 10.1371/journal.pone.0172717
Yan, P., Zhang, Q., Shuai, X. F., Pan, J. X., Zhang, W. J., Shi, J. F., et al. (2016). Interaction between plant density and nitrogen management strategy in improving maize grain yield and nitrogen use efficiency on the North China Plain. J. Agr. Sci. 154, 978–988. doi: 10.1017/S0021859615000854
Yao, H. S., Zhang, Y. L., Yi, X. P., Zhang, X. J., and Zhang, W. F. (2016). Cotton responds to different plant population densities by adjusting specific leaf area to optimize canopy photosynthetic use efficiency of light and nitrogen. Field Crop. Res. 188, 10–16. doi: 10.1016/j.fcr.2016.01.012
Yin, X., and van Laar, H. H. (2005). Crop systems dynamics: An ecophysiological simulation model for genotype-by-environment interactions. Wageningen: Wagningen Academic Publishers. doi: 10.3920/978-90-8686-539-0
Yuan, J., Shi, B., Wu, Z. L., and Tan, X. F. (2015). Response of fruit quality and leaf photosynthesis to different sink-source relationships in camellia oleifera (in Chinese with English abstract). Plant Physiol. J. 51, 1287–1292.
Zhao, B., Duan, A. W., Ata-Ul-Karim, S. T., Liu, Z. D., Chen, Z. F., Gong, Z. H., et al. (2018). Exploring new spectral bands and vegetation indices for estimating nitrogen nutrition index of summer maize. Eur. J. Agron. 93, 113–125. doi: 10.1016/j.eja.2017.12.006
Zheng, B. Q., Zhang, X. Q., Wang, Q., Li, W. Y., Huang, M., Zhou, Q., et al. (2021). Increasing plant density improves grain yield, protein quality and nitrogen agronomic efficiency of soft wheat cultivars with reduced nitrogen rate. Field Crop. Res. 267:108145. doi: 10.1016/j.fcr.2021.108145
Keywords: canopy N distribution, light gradient, N use efficiency, maize, individual, population
Citation: Tian P, Liu J, Zhao Y, Huang Y, Lian Y, Wang Y and Ye Y (2022) Nitrogen rates and plant density interactions enhance radiation interception, yield, and nitrogen use efficiencies of maize. Front. Plant Sci. 13:974714. doi: 10.3389/fpls.2022.974714
Received: 21 June 2022; Accepted: 29 August 2022;
Published: 23 September 2022.
Edited by:
Sajid Fiaz, The University of Haripur, PakistanReviewed by:
Atta Mohi Ud Din, National Research Centre of Intercropping, PakistanCopyright © 2022 Tian, Liu, Zhao, Huang, Lian, Wang and Ye. This is an open-access article distributed under the terms of the Creative Commons Attribution License (CC BY). The use, distribution or reproduction in other forums is permitted, provided the original author(s) and the copyright owner(s) are credited and that the original publication in this journal is cited, in accordance with accepted academic practice. No use, distribution or reproduction is permitted which does not comply with these terms.
*Correspondence: Yang Wang, d2FuZ3lhbmcxMTA2QGhlbmF1LmVkdS5jbg==; Youliang Ye, eWx5ZUBoZW5hdS5lZHUuY24=
Disclaimer: All claims expressed in this article are solely those of the authors and do not necessarily represent those of their affiliated organizations, or those of the publisher, the editors and the reviewers. Any product that may be evaluated in this article or claim that may be made by its manufacturer is not guaranteed or endorsed by the publisher.
Research integrity at Frontiers
Learn more about the work of our research integrity team to safeguard the quality of each article we publish.