 Mang Zhu
 Jun Ma1‡
 Xinfang Liu
 Yanbo Wang
 Min Jiang
95% of researchers rate our articles as excellent or good
Learn more about the work of our research integrity team to safeguard the quality of each article we publish.
Find out more
ORIGINAL RESEARCH article
Front. Plant Sci. , 09 September 2022
Sec. Plant Pathogen Interactions
Volume 13 - 2022 | https://doi.org/10.3389/fpls.2022.968924
This article is part of the Research Topic Genomics and disease resistance in wheat and maize View all 16 articles
Northern corn leaf blight (NCLB), caused by the fungal pathogen Exserohilum turcicum, poses a grave threat to maize production worldwide. The resistance gene in A619Ht3, discovered decades ago, is an important genetic resource for NCLB control. By using a pair of near-isogenic lines (NILs) A619Ht3 and A619, together with the resistant and susceptible bulks derived from the cross of A619Ht3 and L3162 lines, we initially detected a Ht3-like (Ht3L) locus in bin 8.06 that was closely associated with NCLB resistance. We then performed five rounds of fine-mapping, which ultimately delimited the Ht3L locus to a 577-kb interval flanked by SNP markers KA002081 and KA002084. Plants homozygous for the Ht3L/Ht3L genotype exhibited an average reduction in diseased leaf area (DLA) by 16.5% compared to plants lacking Ht3L locus. The Ht3L locus showed extensive variation in genomic architecture among different maize lines and did not appear to contain any genes encoding canonical cell wall-associated kinases against NCLB. Moreover, the Ht3L locus was located ∼2.7 Mb away from the known Htn1 locus. We speculate that the Ht3L locus may contain a bona fide Ht3 gene or a novel NCLB resistance gene closely linked to Ht3. In practice, the Ht3L locus is a valuable resource for improving maize resistance to NCLB.
Northern corn leaf blight (NCLB), caused by the hemibiotrophic fungus Exserohilum turcicum (Chang and Fan, 1986), is one of the most devastating foliar diseases in most maize-growing areas worldwide. Maize (Zea mays L.) grown in areas with high humidity and moderate temperatures is more prone to NCLB outbreaks. During the grain-filling period, NCLB causes leaf necrosis and thus abolishes photosynthetic output, leading to lower grain yield (Raymundo and Hooker, 1981). The development and deployment of resistant maize varieties is the most environmentally friendly and cost-effective way to reduce yield loss caused by NCLB.
Maize resistance to NCLB is a very complex trait, including both qualitative and quantitative resistance. Several qualitative resistance genes against NCLB have been discovered. The first locus, Helminthosporium turcium resistance l (Ht1), was identified in the inbred line ‘GE440’ and ‘Ladyfinger’ popcorn in 1959; this locus shows a partially dominant inheritance pattern and maps to chromosome 2L (Bentolila et al., 1991). Ht1 substantially inhibits the formation of conidia in chlorosis (Hilu and Hooker, 1964, 1965). The Ht2 locus displays a similar resistance performance and genetic architecture to Ht1 and maps to chromosome 8L (Hooker, 1977). Ht3, a dominant single gene identified independently of Ht1 and Ht2, was introgressed into the maize genome from the wild maize relative Florida gamagrass (Tripsacum floridanum) (Hooker, 1981). Ht2 and Ht3 were recently shown to be identical and allelic to the previously cloned Htn1 gene (Yang et al., 2021). At the maturity stage, plants harboring Ht2 or Ht3 display necrotic and chlorotic lesions, respectively, while plants with Htn1 show a delay in lesion formation (Hooker, 1977, 1981; Welz and Geiger, 2000). This observation suggests that other genes may be linked to Htn1 and contribute to the response against NCLB. Moreover, histological studies revealed that plants with different resistance genes (Ht1, Ht2, Ht3, or Htn1) show different symptoms, indicating that resistance mechanisms conferred by these genes are not equivalent (Navarro et al., 2020).
Previous studies have shown that quantitative trait loci (QTLs) for resistance to NCLB are dispersed over all 10 chromosomes in maize (Welz and Geiger, 2000; Wisser et al., 2006; Balint-Kurti et al., 2010; Zwonitzer et al., 2010). Although many QTLs associated with resistance against NCLB have been identified in different populations, few have been fine-mapped or their causal genes even cloned. For instance, a major QTL was detected on chromosome 8 from a cross derived from two near-isogenic lines (NILs) with contrasting performance for NCLB resistance and fine-mapped to a 460-kb region containing 12 annotated genes (Chung et al., 2010). Another major QTL, designated qNLB1.06, was anchored to a 3.6-Mb region and narrowed down to two putative candidate genes by joint linkage and association mapping (Jamann et al., 2014). The QTL qNCLB7.02 was mapped to chromosome 7 by linkage mapping and validated in chromosome segment substitution lines (CSSLs) (Wang et al., 2018). Single-marker and haplotype-based association mapping studies identified 12 and 10 loci, respectively, that were significantly associated with NCLB resistance (Ding et al., 2015). A total of 29 resistance QTLs against NCLB were identified using a nested association mapping (NAM) population with 5,000 recombinant inbred lines (RILs) (Poland et al., 2011). To date, the gene ZmWAK-RLK1 (Wall-associated-receptor-like kinase 1) at the Htn1 locus is the only resistance QTL against NCLB that has been cloned through map-based cloning (Hurni et al., 2015). Further investigation revealed that NCLB resistance mediated by ZmWAK-RLK1 correlates with reduced benzoxazinoid contents (Yang et al., 2019).
Although the Htn1 locus is effective against most prevalent NCLB races, NCLB isolates with virulence in Htn1-bearing plants have been reported (Weems and Bradley, 2018; Jindal et al., 2019). Thus, there is an urgent need to explore novel loci conferring NCLB resistance. Quantitative disease resistance has been widely utilized in resistance breeding programs due to its moderate effectiveness and the durable and non-race-specific resistance it confers (Ayliffe et al., 2008; Poland et al., 2009). Introgression of both qualitative and quantitative resistance loci into inbred lines via marker-assisted backcrossing (MABC) is a powerful means to control diseases in maize (Zhao et al., 2012; Li et al., 2017).
Bulked-segregant analysis (BSA) is a rapid, technically simple method to identify markers linked to specific genes (Michelmore et al., 1991), which has been widely used in rice (Oryza sativa) (Venuprasad et al., 2009), wheat (Triticum aestivum) (Shen et al., 2003) and maize (Cai et al., 2003; Li et al., 2018). Another powerful strategy to narrow down a QTL interval is sequential QTL fine-mapping based on the genotypes and phenotypes of progeny derived from recombinants (Yang et al., 2012). Many quantitative disease-resistance genes have been cloned using this strategy (Zuo et al., 2015; Leng et al., 2017; Liu et al., 2017, 2020; Wang et al., 2017; Ye et al., 2019). In the current study, we conducted QTL identification and high-resolution mapping of the Ht3-like (Ht3L) locus in the resistant line A619Ht3 by combining NIL analysis, BSA and sequential QTL fine-mapping. Our results lay the foundation for the future map-based cloning of the causal gene at the Ht3L locus. The molecular markers on or adjacent to Ht3L described here can also be used for MABC to improve maize resistance to NCLB in breeding programs.
The pair of near-isogenic lines (NILs) A619Ht3 and A619 was obtained from the Eastern Cereal and Oilseed Research Centre of Agriculture and Agri-Food Canada. While A619Ht3 is highly resistant to NCLB, A619 is highly susceptible to NCLB, and both NILs share ∼98.84% genomic homozygosity (Ma et al., 2014). The elite but susceptible inbred line L3162 is the male parent of the hybrids Liaodan565 and Liaodan566 widely grown in China. From a cross between A619Ht3 (donor parent) and L3162 (recurrent parent), multiple backcross populations were developed for initial QTL detection and fine-mapping. In 2016, the two parental lines (A619Ht3 and L3162) and their BC2F1 backcross population comprising 362 individuals were grown at the Shenyang experimental station (41°46′N, 123°26′E) in China for artificial inoculation. Twenty-nine highly susceptible and 29 highly resistant plants were selected to form the susceptible and resistant bulks, respectively, for initial mapping of the Ht3L locus. Subsequently, the BC3F1 progeny from recombination events in the mapped Ht3L region were identified and backcrossed to L3162 (Hainan winter nursery, 18°39′N and 109°21′E) to produce BC4F1 progeny for fine-mapping. In the following five rounds of fine-mapping from 2017 to 2021, newly-occurring recombinants were screened in Shenyang and then backcrossed twice to L3162 in Shenyang and Hainan to generate progeny. All offspring were investigated for NCLB resistance at the Shenyang experimental station. A619Ht3 and L3162 were planted annually in each experimental block as resistant and susceptible controls, respectively.
Exserohilum turcicum (mixed races 0, 1, 2, 3N, 12N, and 23N) was cultured on potato dextrose agar (PDA) medium for 15 days at 25°C and then stored in the dark at room temperature. Plant materials were artificially inoculated at the V8-V10 leaf stages with ∼5 mL of spore suspension (1 × 10⁵-106 conidia per mL in 0.02% [v/v] Tween 20) per plant. Spray irrigation was then performed for 2 days following inoculation, three to four times a day, to maintain a humid environment. Four weeks after inoculation, NCLB lesions were prominent and suitable for first scoring, followed by two more scorings over the next 14 days. Diseased leaf area (DLA) was examined for three leaves (ear leaf and its upper and lower leaves) based on standards listed in Supplementary Figure 1. Average DLA was used to represent NCLB severity.
Fresh leaf tissue at the five-leaf seedling stage was harvested for high-throughput extraction of genomic DNA in 96-well plates. Plant genomic DNA was extracted according to the method described previously (Murray and Thompson, 1980). The Maize3K Chip was used to genotype the NILs (A619Ht3 and A619) and the two parental lines (A619Ht3 and L3162). The Maize6K Chip was used to genotype each plant in the selected susceptible and resistant bulks. Kompetitive Allele-Specific PCR (KASP) markers, developed in the target Ht3L region, were subjected to automated genotyping with the QuantStudio 12 K Flex Real-Time PCR System (Applied Biosystems by Life Technologies).
The single-nucleotide polymorphism (SNP) index was calculated based on the heterozygosity at each SNP within a given bulk. For each SNP, the Δ(SNP-index) value was calculated using the following formula: Δ(SNP-index) = SNP-index in the resistant bulk – SNP-index in the susceptible bulk (Takagi et al., 2013). The Δ(SNP-index) value was used to identify candidate regions for Ht3L. The average Δ(SNP-index) value of the SNPs located in each genomic interval was calculated using a sliding window with a window size of 10 Mb and 10-kb steps. The distribution of Δ(SNP-index) along the chromosomes was plotted using R software. SNP markers in the candidate Ht3L regions were also used to conduct regional association analyses. For each SNP marker, the significant difference in SNP-index between two bulks was determined by chi-squared test.
Markers in the Ht3L region were identified according to the B73 reference genome sequence and were projected onto the 25 founders of the NAM population to define their corresponding Ht3L regions. The sequence information and annotated genes in the Ht3L regions were then retrieved from MaizeGDB1. The gene distribution in susceptible and resistant founders was plotted using R software.
To determine the A619Ht3 resistance spectrum, we conducted virulence testing on the five near-isogenic lines containing the different Ht loci (A619, A619Ht1, A619Ht2, A619Ht3 and A619HtN) by inoculating designated physiological races of Exserohilum turcicum (1,2,3, and 123N) in growth chamber. The results showed that A619Ht3 exhibits susceptible to races 3 and 123N, while resistant to races 1 and 2 (Table 1), which was consistent with the resistance spectrum of the Ht3 locus in OH43 and HZS genetic backgrounds (Guo, 2015). We thus named the resistance gene in A619Ht3 as Ht3-like (Ht3L) to distinguish it from the recently reported Ht3 allele that is identical to Ht2 and allelic to Htn1 (Yang et al., 2021).

Table 1. Virulence testing on the five different Ht genes by designating physiological races of Exserohilum turcium.
The NILs A619 and A619Ht3 differ considerably in their resistance to NCLB, with A619 being highly susceptible and A619Ht3 extremely resistant (Figures 1A,B). We genotyped the A619 and A619Ht3 NILs using the Maize3K Chip to identify chromosomal region(s) potentially covering the Ht3L locus. We detected three segments with stretches of polymorphisms between the two NILs in bins 3.08 (6 SNPs), 7.03/7.04 (12 SNPs) and 8.06 (12 SNPs) (Table 2), which we considered candidate Ht3L regions.

Figure 1. Performances of three maize inbred lines A619, A619Ht3, and L3162 against NCLB at nearly 6 weeks after inoculation in 2021. A619Ht3 exhibited highly resistant to NCLB, while A619 and L3162 show highly susceptible to NCLB. (A) Symptoms of NCLB on leaves; (B) Diseased leaf area (DLA).

Table 2. Three candidate Ht3-like regions associated with NCLB resistance.
To determine which segment harbors the Ht3L locus, we selected the susceptible line L3162 that is genetically distinct from A619Ht3 to generate mapping populations. We genotyped A619Ht3 and L3162 with the Maize3K Chip, which returned 493 SNPs distributed over all maize chromosomes, numbers sufficient for an initial mapping of Ht3L (Supplementary Table 1). Within the frames of three Ht3L candidate regions defined by two NILs, we searched for SNPs between two parental lines A619Ht3 and L3162 to define the cognate Ht3L candidate regions.
From a BC2F1 population derived from a cross between A619Ht3 and L3162, we selected 29 highly resistant and 29 susceptible individuals to prepare two bulks. We then used the Maize6K Chip to genotype each BC2F1 individual from the two bulks and calculated the Δ(SNP-index) for each SNP in the resistant and susceptible bulks. This analysis revealed a prominent peak on chromosome 8 (Figure 2A). We also calculated the SNP-index values for those SNPs mapping to the three Ht3L candidate regions defined above between the two bulks. We detected no significant difference for SNP-index values between the two bulks within bins 3.08 or 7.03/7.04 (Figure 2B and Supplementary Table 2). By contrast, the SNP-index value for every SNP in bin 8.06 was significantly higher in the resistant bulk than in the susceptible bulk, indicating that the Ht3L locus might lie within bin 8.06 (Figure 2B and Table 3). Taken together, we concluded that the Ht3L locus maps to bin 8.06, which was flanked by SNP markers PZE-108095959 and PZE-108110343 and represented a physical distance of 11.23 Mb based on the B73 physical map (AGPv5).
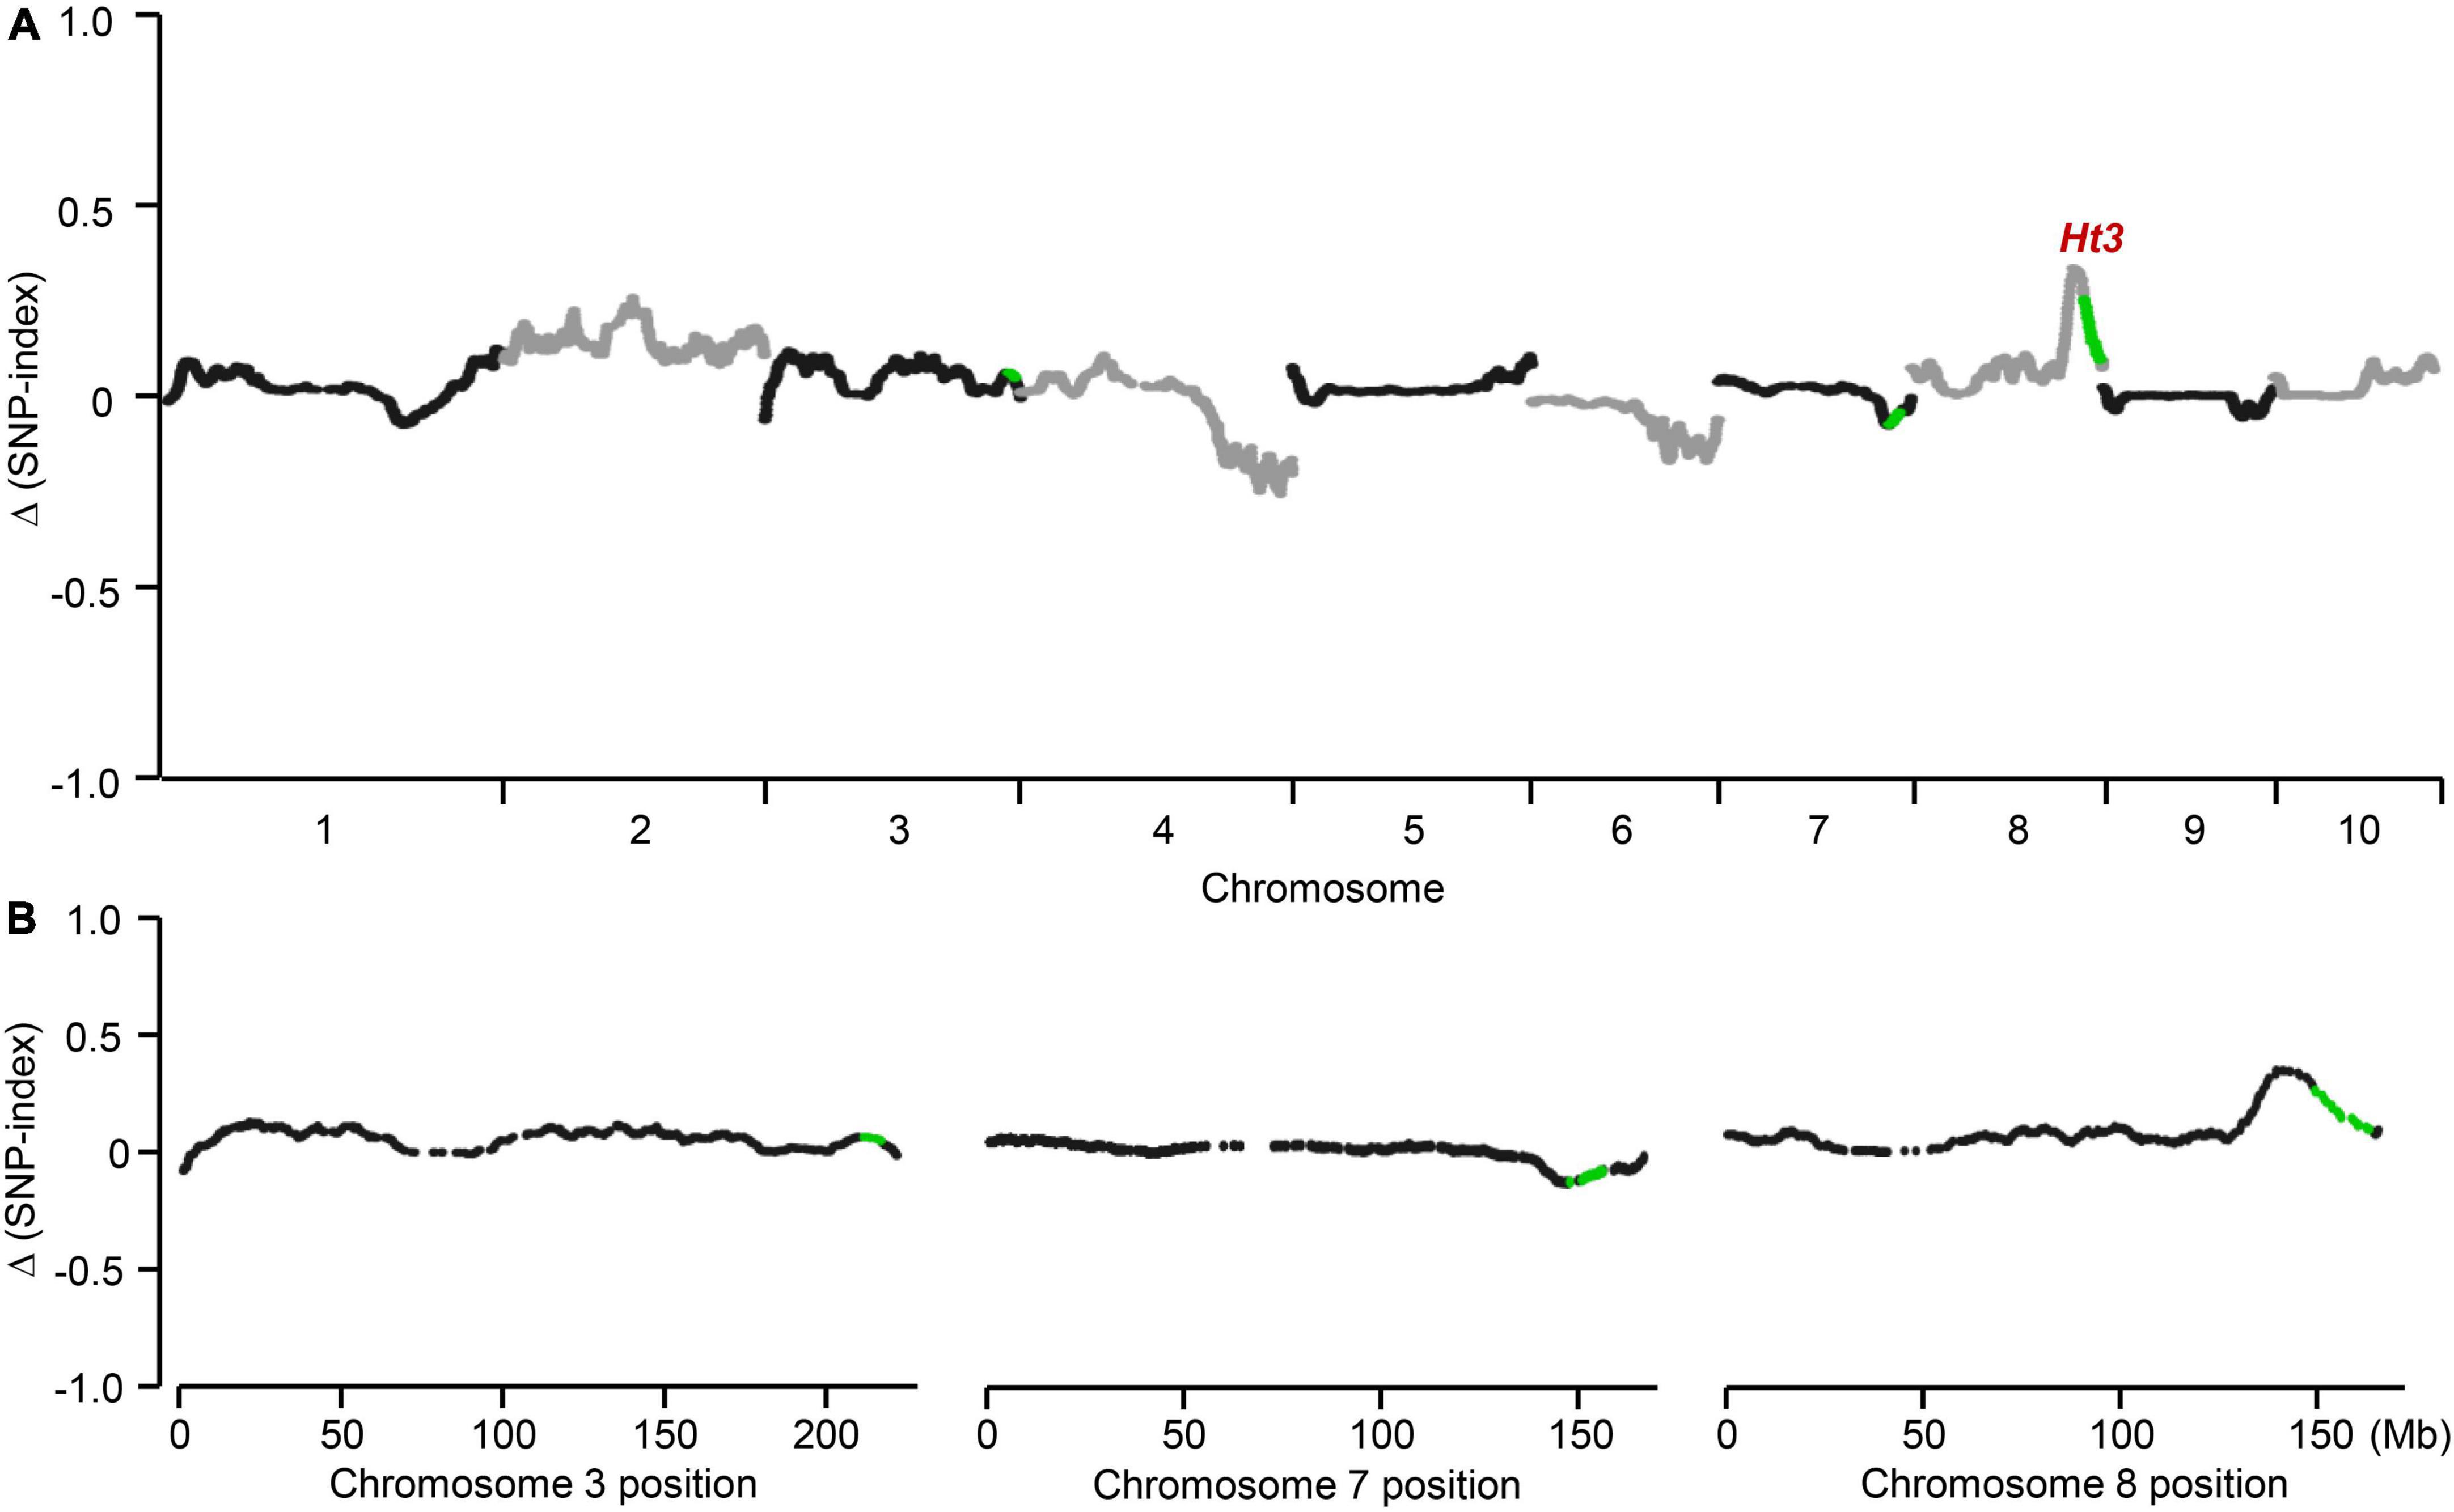
Figure 2. Initial detection of the Ht3L locus. In the BC2F1 segregating population, highly resistant and susceptible individuals were selected to prepare two blocks. SNP-index value which represents the heterozygosity was estimated for each SNP. (A) Genome-wide association mapping of Ht3L locus. (B) Ht3L was located in bin 8.06. Difference in SNP-index between two bulks, Δ(SNP-index), was calculated for all SNPs and used for genome-wide association. The average Δ(SNP-index) was calculated using a sliding window analysis with 10-Mb window size and 10-kb increments. Each plot represents a SNP marker, and the green plots correspond to the significantly associated SNPs in NILs analysis. The Ht3L locus was identified as a peak of the Δ(SNP-index) in bin 8.06.

Table 3. SNP markers in bin 8.06 significantly associated with NCLB resistance.
We developed high-density molecular markers over the Ht3L region to saturate the target region. Accordingly, we retrieved the SNP markers in the Ht3L region between A619Ht3 and L3162 from the genotype data of the Maize6K Chip. We then converted all SNPs located in the Ht3L region into KASP markers and tested them against A619Ht3 and L3162. Totally, we obtained 18 effective KASP markers for fine-mapping (Supplementary Table 3).
We used a sequential fine-mapping strategy based on recombinant-derived progeny to narrow down the location of the Ht3L locus. In the first round of fine-mapping, we used six KASP markers (A001802, A000823, A001155, A001807, A000827, and A001808) to detect recombination events in the 11.23-Mb Ht3L region from the BC2F1 population obtained in 2016. We identified seven BC2F1 recombinants, which we backcrossed twice to the susceptible parent L3162 to produce their corresponding BC4F1 populations. With an additional five newly-developed KASP markers (A007452, A007453, A007455, A007456, and A007457), we determined the precise recombination breakpoint for each recombinant. To this end, we grew 1,678 plants from the BC4F1 progeny in the field and scored them for their extent of diseased leaf area (DLA) in Shenyang in 2017 (Figure 3A). In parallel, the marker in the heterozygous Ht3L region was used to genotype all individuals to distinguish homozygous (L3162/L3162) from heterozygous (A619Ht3/L3162) BC4F1 plants. With the both genotypic and phenotypic data, an average DLA value can be estimated for both homozygous and heterozygous genotypes in each BC4F1 progeny. Significant difference in DLA between two genotypes indicated the presence of the Ht3L locus in the A619Ht3 donor segment; otherwise, there is no Ht3L locus. As shown, recombinants I to V showed a significant difference (P < 0.05) in their DLA values between homozygous and heterozygous genotypes in their BC4F1 progeny, indicating that they carried the Ht3L locus in the A619Ht3 donor segment (Figure 3A), while recombinants VI and VII exhibited no significant difference (P > 0.05), and thus lacked the Ht3L locus. Recombinants V (with Ht3L) and VII (without Ht3L) defined the left boundary of the mapping interval to marker A007452, while recombinants I (with Ht3L) and VI (without Ht3L) marked the right boundary with marker A007455. The resulting interval spanned a region of 2.17 Mb (AGPv5) (Figure 3A).
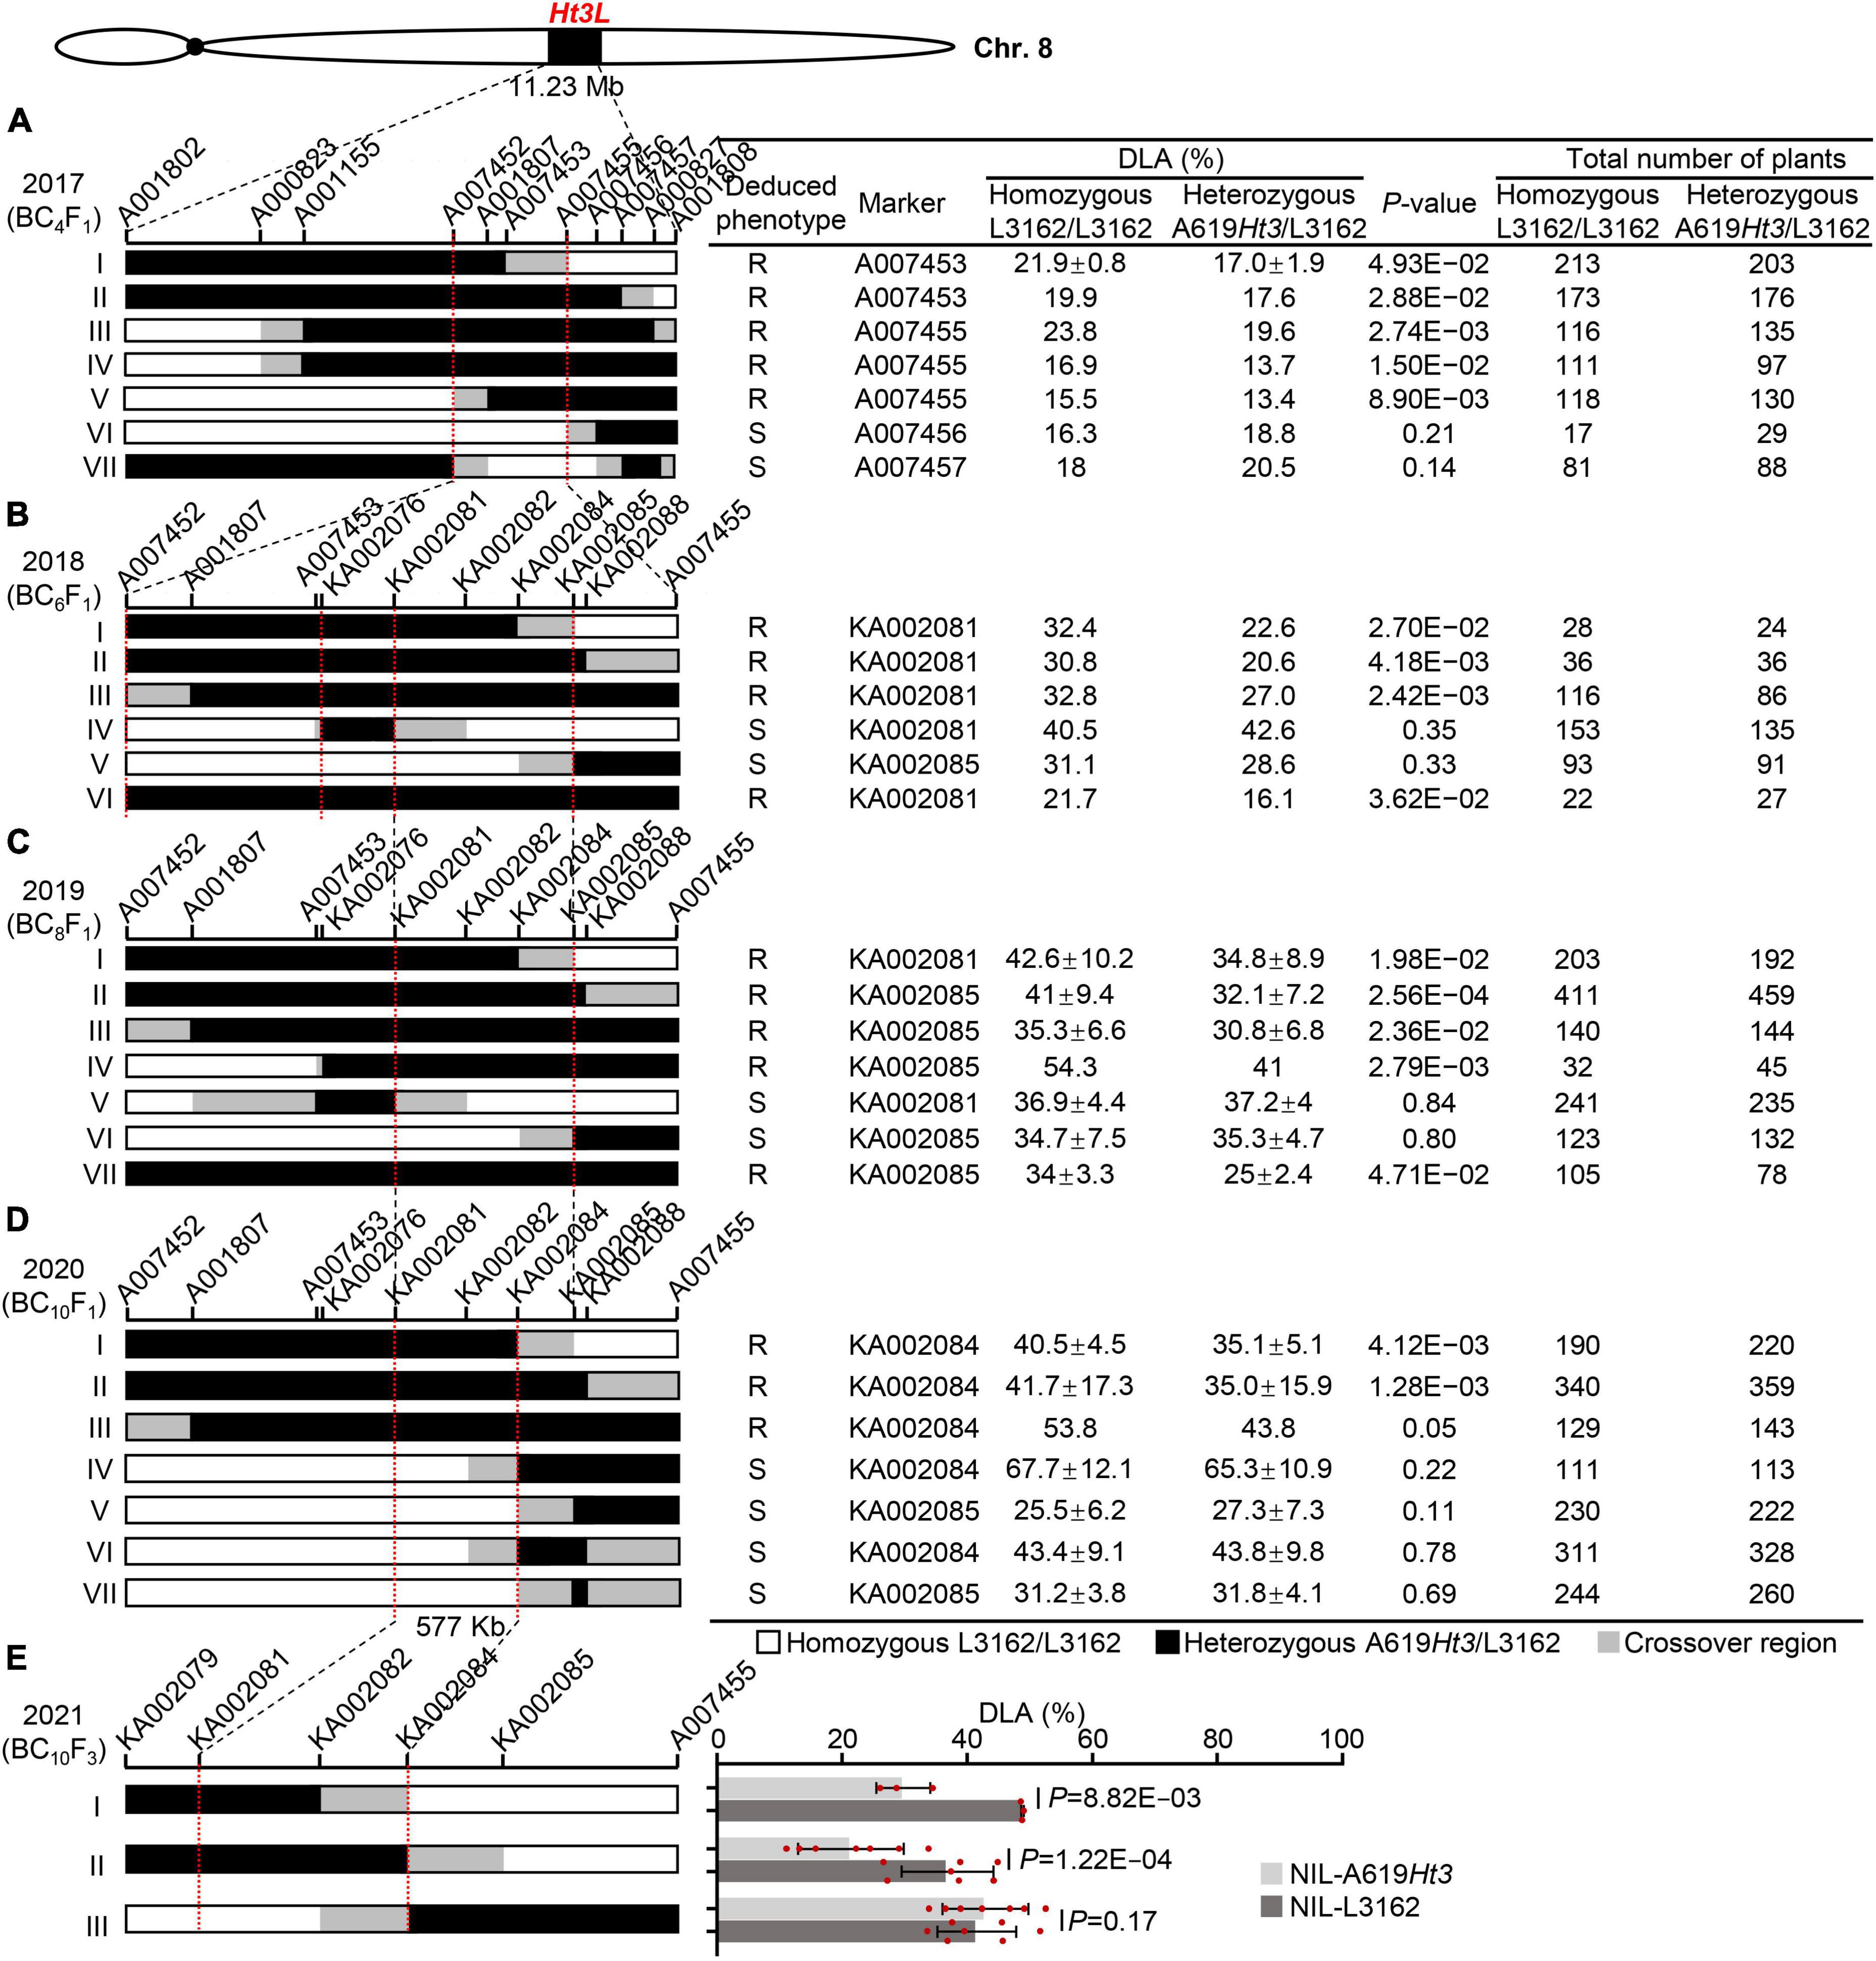
Figure 3. Sequential fine-mapping of the Ht3L locus by using the recombinant-derived progeny. The vertical bars mark the sites of key molecular markers. The red dotted lines indicate the left and right boundaries of the mapped Ht3L. The chromosomal composition at Ht3L is depicted as black, white, and gray rectangles, representing heterozygous A619Ht3/L3162, homozygous L3162/L3162, and recombination breakpoint regions, respectively. The total number of plants refers to all progeny of a given recombinant. The significant difference in DLA among genotypes was calculated using t-test. A significant difference in DLA (P < 0.05) between heterozygous and homozygous offsprings indicated the presence of Ht3L in the A619Ht3 donor region, and the corresponding parental recombinants were deduced to be NCLB resistance (R). A P-value > 0.05 indicates that no significant difference in DLA between heterozygous and homozygous offsprings, suggesting the absence of Ht3L in the donor region, and the corresponding recombinants were deduced to be NCLB susceptibility (S). Ht3L was narrowed from an ∼11.23-Mb to an ∼577-kb region flanked by the markers KA002081 and KA002084 through five rounds of fine-mapping process. (A) Ht3L was initially mapped in bin 8.06 with the physical distance of 11.23-Mb and fine-mapped to an ∼2.17-Mb interval with seven BC4F1 recombinants. (B) Ht3L was localized into either A007452/KA002076 or KA002081/KA002085 intervals by using six BC6F1 recombinants. (C) Ht3L was confirmed to be located into the 838-kb KA002081/KA002085 interval by using seven BC8F1 recombinants. (D) Ht3L was narrowed down to a 577-kb interval flanked by markers KA002081 and KA002084 by using seven BC10F1 recombinants. (E) Ht3L was further confirmed to be in a 577-kb interval by using three pairs of NILs.
Based on the results shown in Figure 3A, we selected those recombinants with crossovers within the 2.17-Mb mapping interval for the next round of fine-mapping, as such recombinants were still valuable to resolve the Ht3L locus with high-density markers. Thus, we backcrossed recombinants I and V to L3162 twice to produce their BC6F1 progeny. We also identified another three new recombinants within the 2.17-Mb region from the BC4F1 progeny, which, together with a heterozygous plant (as a positive control), were backcrossed twice to L3162 to produce BC6F1 progeny. We genotyped the five resulting BC6F1 progeny consisting of 847 individuals, grown in the field for NCLB testing in 2018, with 11 markers spanning the 2.17-Mb region, including seven newly-developed markers. We also tested the markers against the heterozygous Ht3L region to distinguish homozygous from heterozygous BC6F1 progeny. We detected a significant difference (P < 0.05) in DLA for recombinants I, II and III, together with the positive control (VI in Figure 3B), between the two genotypes in their BC6F1 progeny, but not for recombinants IV or V. Thus, the recombinant III defines a new left boundary of the mapping interval with marker A007452, and the recombinants I and V define a new right boundary with marker KA002085. Notably, recombinant IV appeared to harbor two crossovers that allowed us to exclude the region between markers KA002076 and KA002081 for the Ht3L locus, thus delineating the Ht3L locus to either the A007452-KA002076 or KA002081-KA002085 interval (Figure 3B).
From the BC6F1 populations, we isolated one new recombinant that, along with six existing BC6F1recombinants, was backcrossed twice to L3162 to produce seven BC8F1 populations comprising 2,540 individuals. With this third round of fine-mapping, we observed that the new recombinant (IV in Figure 3C) shows a significant difference in DLA between the homozygous and heterozygous BC8F1 offspring. This recombinant carried a heterozygous region downstream of marker KA002076, which excluded the A007452-KA002076 interval as the candidate region (Figure 3C). The other six BC8F1 progeny derived from previous recombinants exhibited similar results, with recombinants I to III harboring the Ht3L locus in their heterozygous region, but not recombinants V or VI. Taken together, this third round of fine-mapping delimited the Ht3L locus to the region flanked by markers KA002081 and KA002085, with a physical length of 838 kb (AGPv5).
In the summer of 2020, we planted 3,200 BC10F1 plants corresponding to seven recombinants in Shenyang for further fine-mapping. Of them, two new recombinants (IV and VI in the Figure 3D) with breakpoints between KA002082 and KA002084 showed no significant difference (P > 0.05) in DLA between the BC10F1 homozygous and heterozygous genotypes, indicating the A619Ht3 donor region lacked Ht3L. Based on these two recombinants, we moved the right boundary from marker KA002085 to marker KA002084. Phenotypic scorings for NCLB severity in the field indicated that the progeny from recombinants I-III showed a significant difference (P < 0.05) in DLA between the homozygotes and heterozygotes in their BC10F1 progeny, whereas the progeny from recombinants IV–VII did not show this difference. Thus, we ultimately anchored Ht3L to a 577-kb interval flanked by markers KA002081 and KA002084 (AGPv5).
From the BC10F1 progeny, we selfed heterozygous recombinants to develop three pairs of NILs, which were planted in the summer of 2021 to evaluate their DLA values. The first two pairs of NILs (I and II in Figure 3E) displayed significant differences in the DLA scores between NILs with and without A619Ht3 donors, but the third pair did not (Figure 3E). These results confirmed that Ht3L maps to the 577-kb interval flanked by markers KA002081 and KA002084 (AGPv5).
We calculated the genetic effect of the Ht3L/ht3l genotype as the difference in the DLA values between heterozygous and homozygous genotypes for each of the BC4F1, BC6F1, BC8F1 and BC10F1 progeny. For the ht3l/ht3l and Ht3L/ht3l genotypes, we estimated the average DLA values to be 20.3% and 16.5% in BC4F1, 29.4% and 21.6% in BC6F1, 40.5% and 32.1% in BC8F1 and 42.2% and 35.9% in BC10F1, respectively (Figure 4). As expected, the Ht3L/ht3l heterozygotes had lower DLA values than ht3l/ht3l homozygotes. We also estimated the genetic effect of Ht3L/ht3l relative to ht3l/ht3l: 3.8% in BC4F1, 7.9% in BC6F1, 8.4% in BC8F1 and 6.3% in BC10F1 progeny, respectively. For the three pairs of NILs, the average DLA values of the susceptible NILs (with ht3l/ht3l) and resistant NILs (with Ht3L/Ht3L) were 40.4% and 23.9%, respectively. Thus, the genetic effect of the homozygous Ht3L/Ht3L genotype was 16.5% (Figure 4).
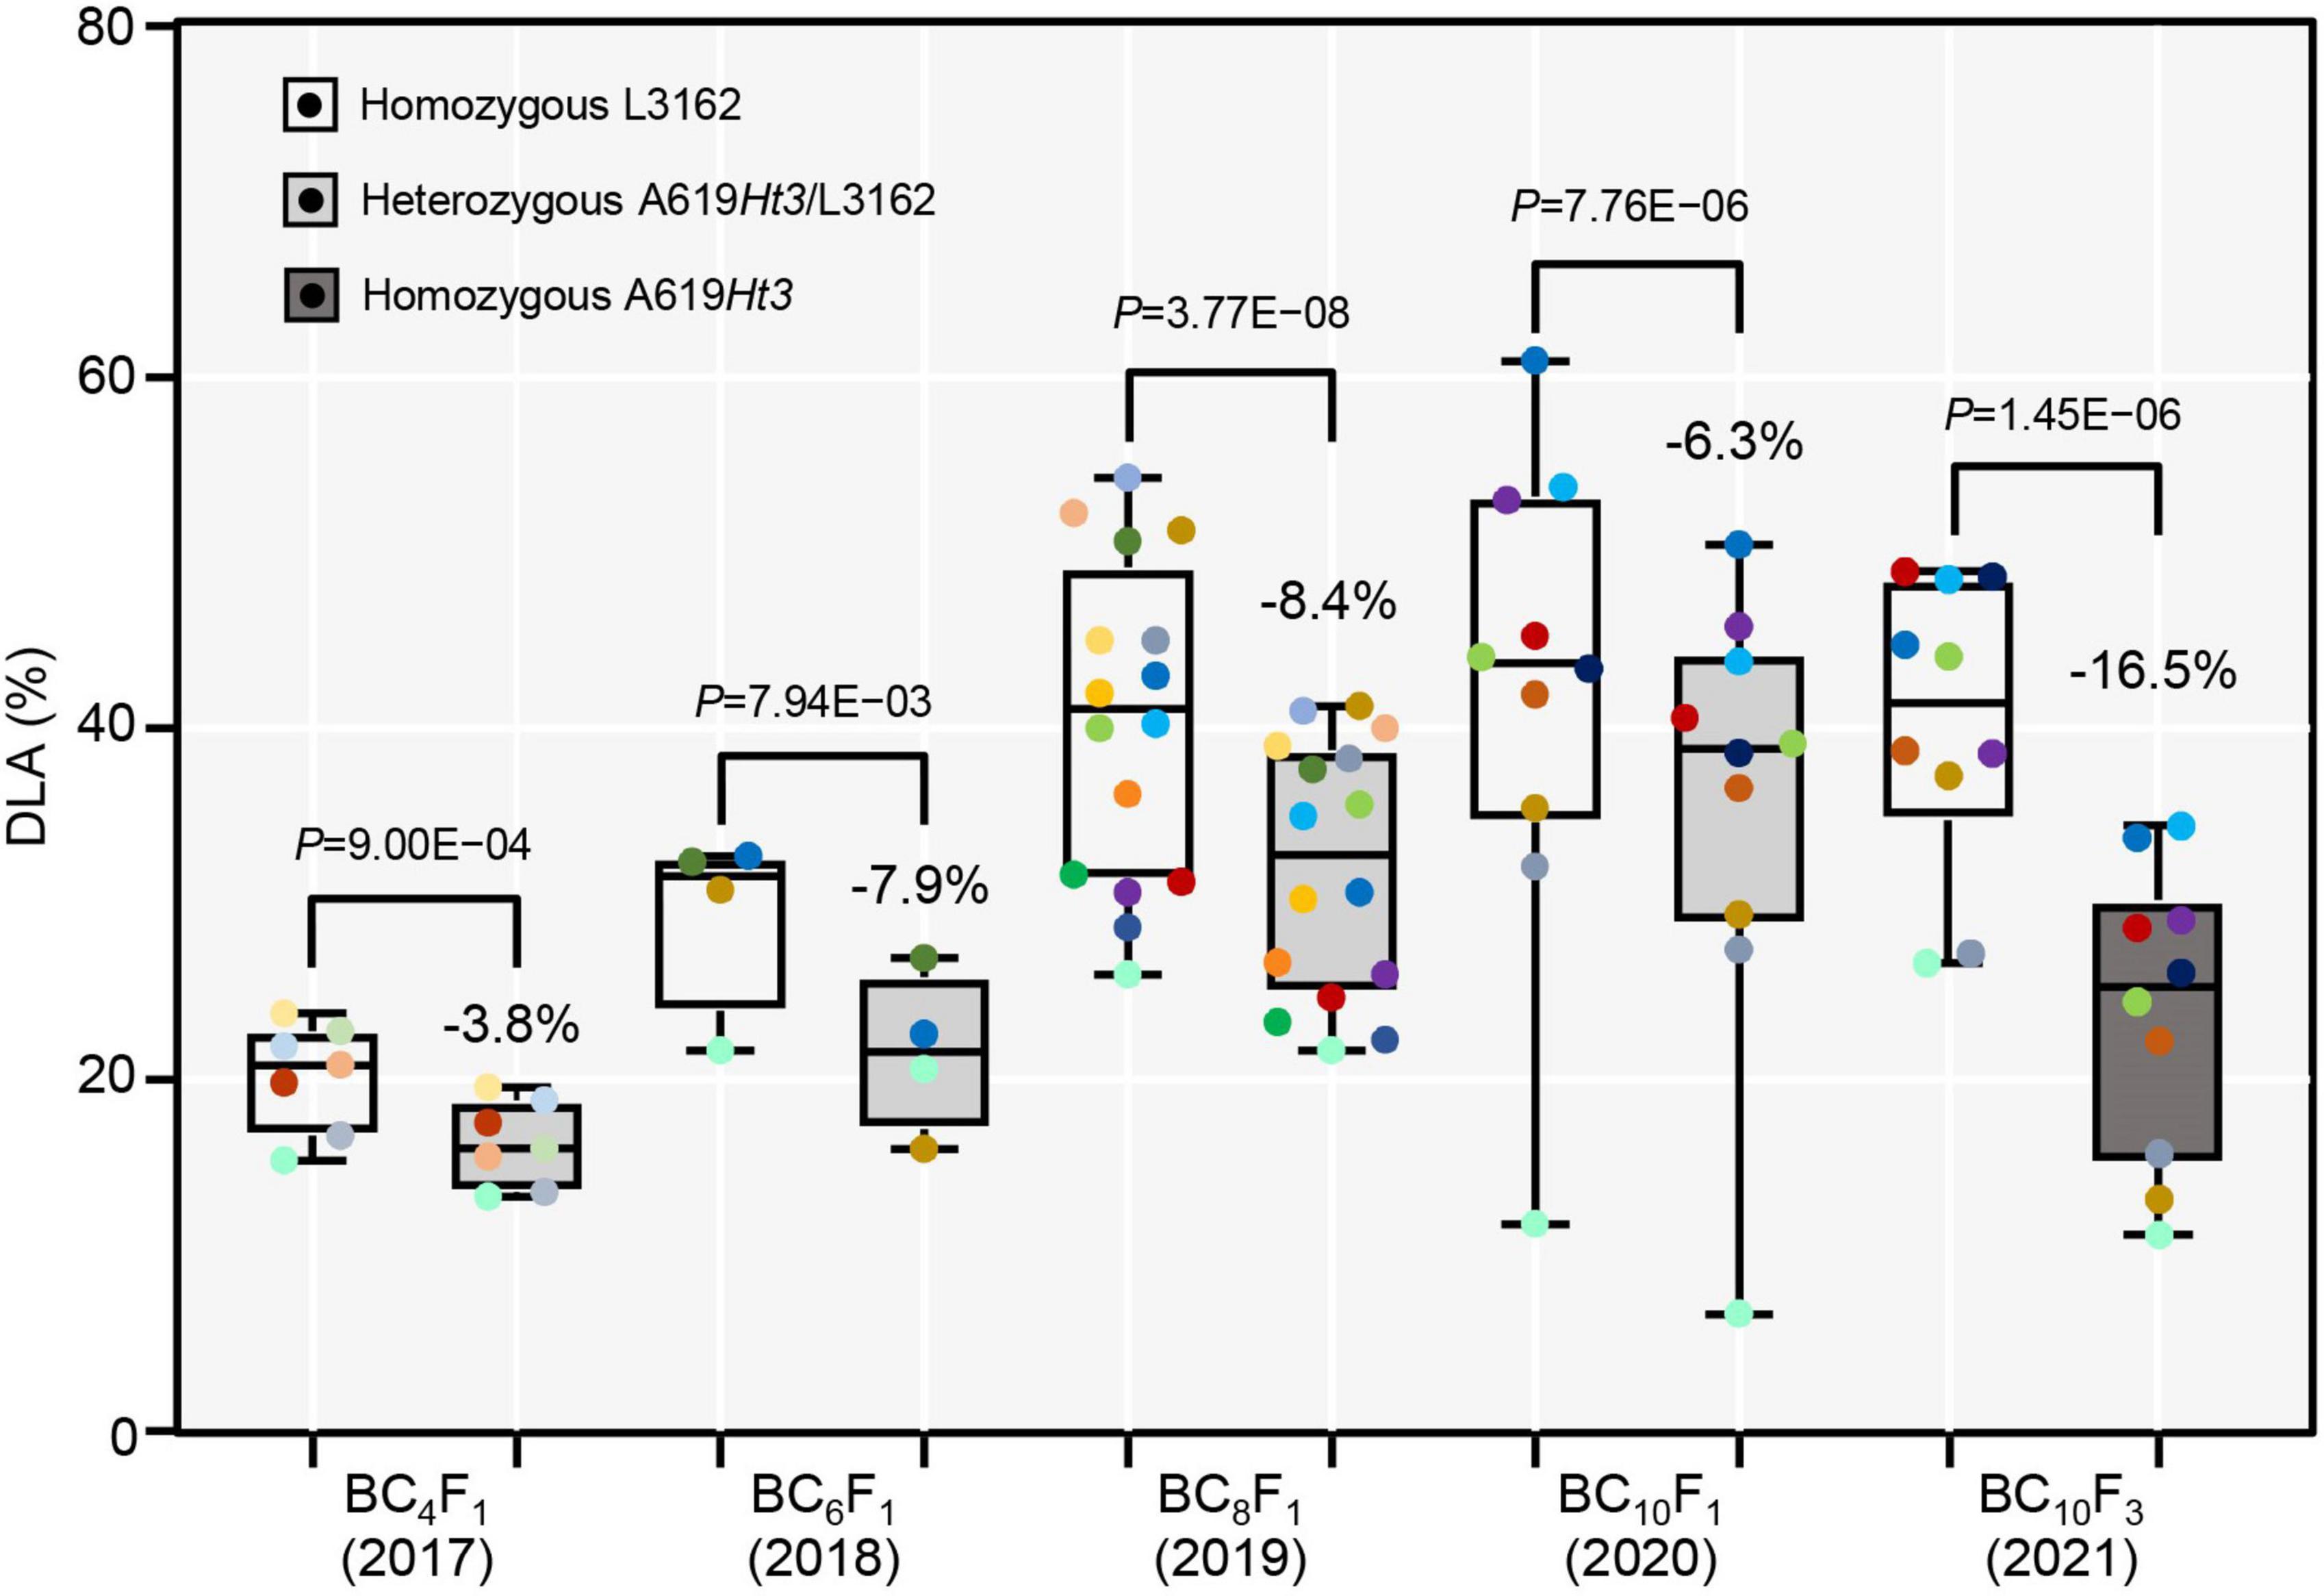
Figure 4. The genetic effect of the Ht3L locus. The DLAs are shown for both homozygous and heterozygous genotypes at Ht3L in the BC4F1, BC6F1, BC8F1, BC10F1 populations. The difference in DLA homozygous ht3l/ht3l and heterozygous Ht3L/ht3l genotypes was calculated for each generation. In the last two columns, the DLAs were calculated for two homozygous genotypes ht3l/ht3l and Ht3L/Ht3L of NIL-I and NIL-II. The P values between two genotypes were calculated by paired two-tailed t-test and indicated. P-value < 0.05 indicates significant difference; P-value > 0.05 indicates no significant difference.
Bin 8.06 is associated with several Ht genes, such as Ht2 and Htn1. The identified resistance genes belong to the cell wall-associated-like kinase gene family and exhibit extensive variation in their genomic structure (Yang et al., 2021). Within the current 577-kb mapping interval of Ht3L locus, we detected 15 annotated genes according to the B73 reference genome sequence (RefGen_v5, Figure 5 and Table 4). To our surprise, we identified no WAK-like gene within this interval, which appeared inconsistent with a recent report (Yang et al., 2021). Three of these genes encoded proteins of unknown function, while the remaining 12 genes encoded, among others, a VIVIPAROUS1 (VP1)-like transcription factor (Zm00001eb361390), a K+ exchanger-like protein (Zm00001eb361440), a zinc knuckle (CCHC-type) protein (Zm00001eb361470), two violaxanthin de-epoxidases (Zm00001eb361480 and Zm00001eb361490), a brassinosteroid-insensitive protein (Zm00001eb361520), a potassium channel KAT protein (Zm00001eb361550) and a phosphatidylinositol kinase (Zm00001eb361560).
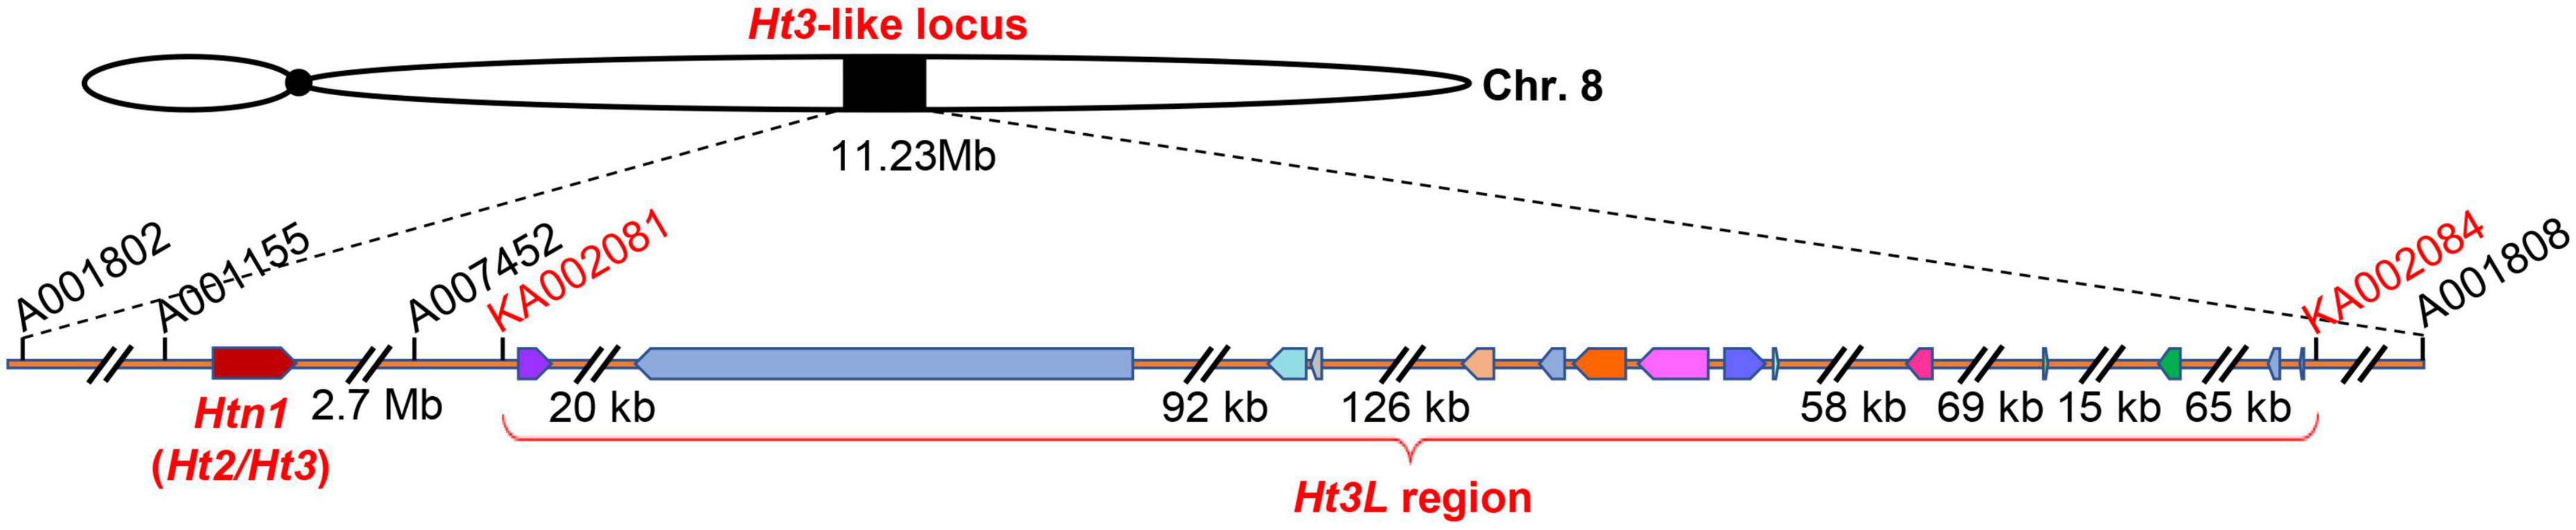
Figure 5. The Ht3L locus is independent from Htn1. The mapped Ht3L region encompassing 15 annotated genes, which was located 2.7-Mb to the right of Htn1.
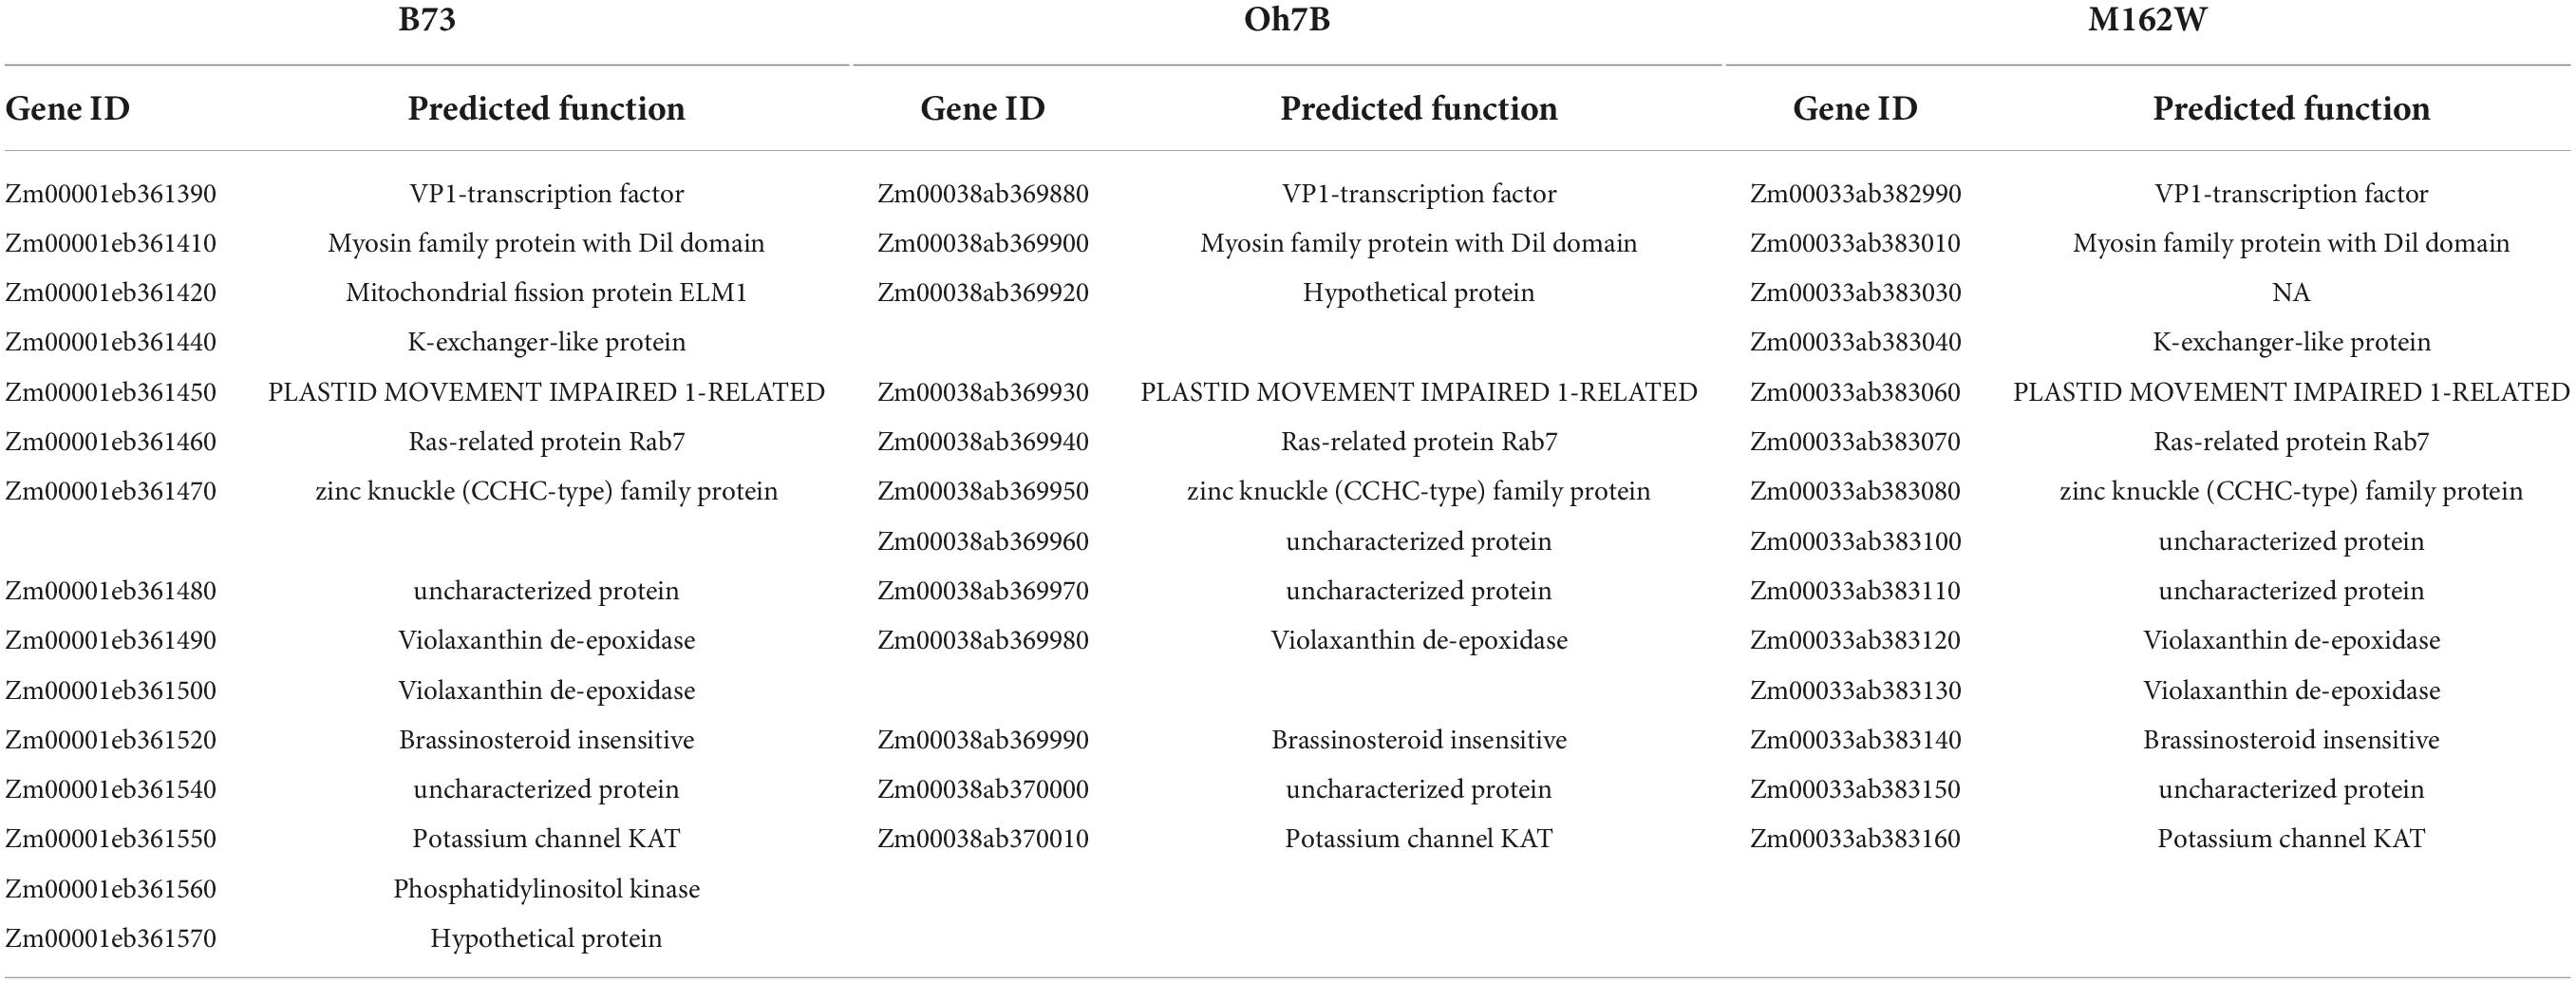
Table 4. Predicted candidate genes within the Ht3-like region.
We also retrieved the corresponding regions for the mapped 577-kb Ht3L region from 25 sequenced founders of the NAM population (see text footnote 1). Of these 25 lines, seven were highly susceptible and another ten were highly resistant to NCLB, based on a previous report (Poland et al., 2011). The inbred lines Oh7B and M162W were the most susceptible and resistant lines, respectively (Table 4). The Ht3L region exhibited considerable variation in its length across inbred lines, varying from 383 kb to 590 kb (Supplementary Figure 2). Again, none of the annotated genes in these inbred lines encoded a cell wall-associated kinase. Further fine-mapping and functional testing will be required to identify the Ht3L causative gene conferring NCLB resistance.
We initially genotyped the two NILs, A619Ht3 and A619, which share ∼98.84% of their genome sequences and yet differ widely in NCLB resistance. We rapidly identified three chromosomal segments possibly associated with NCLB resistance based on the presence of SNPs between the two NILs. To narrow down the position of the Ht3L locus and improve NCLB resistance, we crossed the donor A619Ht3 to the elite but highly susceptible inbred line L3162 as a recurrent parental line. The genomes of the donor A619Ht3 and the recurrent parental line L3162 differed by sufficient SNPs to allow fine-mapping of Ht3L. With A619Ht3 as the parental line, we could quickly project the three potential Ht3L segments from A619Ht3/A619 to A619Ht3/L3162. Given that two bulks consisted of highly resistant and susceptible individuals, respectively, we calculated the SNP-index values and looked for a region characterized by a higher index value in the resistant bulk compared to the susceptible bulk. This allowed us to detect a QTL peak on bin 8.06, which was confirmed by regional analysis using SNP-index over the three Ht3L candidate segments. We then attempted to continuously narrow down the Ht3L location by sequential fine-mapping based on recombinant-derived progeny testing (Yang et al., 2012), reaching a final interval of 577 kb.
Stable onset of symptoms and accurate phenotypic assessment are particularly critical for QTL mapping related to NCLB resistance. Considering the uncertainty associated with natural infections, we adopted an artificial inoculation method to ensure stable and uniform environmental conditions conducive to NCLB occurrence. We therefore uniformly sprayed plants with a spore suspension, followed by spray irrigation for two days, three to four times a day, to maintain high humidity. To obtain reliable phenotypic data, we assessed DLA three times in the field four weeks after artificial inoculation, using three leaves around the ear leaf. Moreover, we planted the resistant and susceptible parental lines, along with test materials, every year as controls, which allowed us to judge the stable occurrence of NCLB. In light of the performance of the positive and negative controls in terms of resistance, we believe that our artificial inoculation method was successful and reliable.
At least four major genes and numerous QTLs have been reported for resistance to NCLB in maize (Yang et al., 2017; Zhu et al., 2021). Symptom development is influenced by both genetic factors and environmental conditions. We therefore undertook a sequential fine-mapping strategy based on recombinant-derived progeny testing (Yang et al., 2012). To minimize the influence of genetic backgrounds, we conducted five rounds of QTL fine-mapping from families derived from four to ten generations of backcrosses to ensure that each individual had an almost identical genetic background outside of the Ht3L region (Supplementary Figure 3). We planted all progeny derived from the same recombinant in the same plot to ensure that they experienced very similar environmental conditions. As the heterozygous and homozygous plants of the same progeny were randomly distributed in the testing plot, the difference in DLA between these two genotypes should minimally reflect any environmental influence. Generally, we backcrossed each recombinant twice to the susceptible inbred L3162 to increase the size of the mapping progeny, to further minimize both background noise and any environmental influence. In addition, we evaluated key recombinants for NCLB resistance over several years; although disease severity varied over the years, the difference in DLA between two genotypes was very stable for all key recombinants, which underscores the accuracy of the fine-mapping data presented in the current study.
A high density of molecular markers is also key to effective QTL mapping. The wide availability of genome sequences for multiple maize germplasms has driven SNP marker-based genetic mapping and QTL analysis (Chen et al., 2015; Ding et al., 2015). In the current study, we used the Maize3K and Maize6K Chips to obtain useful SNPs, from which we developed high-density KASP markers over the target Ht3L region. The developed markers were easy to use in each fine-mapping step and are characterized by positional accuracy, low genotyping errors, relatively low cost, and scalable flexibility in applications (Semagn et al., 2013).
Bin 8.05/8.06 is a hotspot for NCLB resistance, as Ht2, Ht3, Htn1 and other QTLs against NCLB also map to this genomic interval. Recently, Ht2 and Ht3 were reported to be identical and allelic to Htn1 (Yang et al., 2021). We initially anchored the Ht3L locus to a genomic segment of 11.23 Mb (AGPv5) in bin 8.06, flanked by the SNP markers PZE-108095959 and PZE-108110343. Notably, this 11.23-Mb segment overlapped with the known location of the Htn1 locus. After five rounds of fine-mapping, we delineated the Ht3L locus to a 577-kb interval. To our surprise, the Ht3L locus was located ∼2.7 Mb away from Htn1 (Figure 5). Intriguingly, when looking back over the resistance performance of different recombinants, we failed to observe any genetic contribution of the Htn1 locus to NCLB resistance. For instance, the BC2F1 recombinant VII, which carried only the Htn1 locus and lacked the Ht3L locus, did not exhibit a significant difference in DLA between its BC4F1 offspring heterozygous and homozygous for Htn1. Likewise, BC2F1 recombinants (No. I and II) with two loci (Ht3L and Htn1) did not display a lower DLA score than those BC2F1 recombinants (No. V) only harboring the Ht3L locus. The lack of phenotypic variation associated with the Htn1 locus between A619Ht3 and L3162 thus indicated that both lines have the same susceptible Htn1 allele. The other possibility is that Htn1 may lose its NCLB-resistance function due to the presence of an unidentified suppressor or the absence of a co-receptor in the L3162 background. For example, a dominant suppressor inhibiting the expression of Ht2 was found in lines related to ‘B14’ (Ceballos and Gracen, 1989).
We detected extensive genomic variation within the 577-kb Ht3L interval in the 25 founders of the NAM population, with a size varying from 383 kb to 590 kb. Surprisingly, no gene in this Ht3L region was annotated as encoding a canonical cell wall-associated kinase, in contrast to the Ht2/Ht3/Htn1 locus (Yang et al., 2021). In field trials across multiple years, A619Ht3 always exhibited highly resistance to NCLB, in sharp contrast to the highly susceptible lines A619 and L3162. Given that A619Ht3 harbors both the resistant Ht3L and Htn1 loci, we propose two possible explanations for the results of the current study: 1) the 577-kb Ht3L locus interval may contain a bona fide Ht3 gene that is located ∼2.7 Mb away from the known Ht2/Ht3/Htn1 locus; or 2) A619Ht3 harbors a Ht3 gene that is allelic to Htn1, as claimed by Yang et al. (2021), in which case the mapped Ht3L locus must contain a novel NCLB resistance gene. In this alternative scenario, we speculate that A619Ht3 is unlikely to harbor another resistant allele at the reported Ht2/Ht3 or Htn1 loci, as only one resistance QTL was detected in our mapping populations. Since the detailed genomic sequence of the parental line A619Ht3 is not currently available, we are still uncertain about the relationship between the currently mapped Ht3L locus and the reported Ht2/Ht3/Htn1 locus. In addition, the genetic backgrounds clearly have pronounced effects on Ht3L-conferred NCLB resistance, as we observed wide variation in DLA scores between homozygotes and heterozygotes in the fine-mapping progeny of different parental recombinants.
Exserohilum turcicum shows clear physiological differentiation as a function of the resistance performance of inbred lines and differences of climatic conditions. Moreover, the distribution of physiological races is also complex. Twelve physiological races have been identified in China, of which races 0 and 1 are dominant (Gao et al., 2011). Because of the apparent physiological differentiation of the fungus causing NCLB, the rapid evolution of pathogen populations must be considered in NCLB-resistance breeding programs. Several resistance loci should be pyramided via marker-assisted backcrossing (MABC) to breed more resistant varieties that can combat multiple physiological races of NCLB. MABC was shown to be effective to improve the resistance of inbred lines. For example, all 63 converted lines produced through MABC by introducing nine resistant ZmCCT (CONSTANS [CO], CO-like, TIMING OF CAB2 EXPRESSION 1 [TOC1]) haplotypes into seven elite maize inbred lines exhibited enhanced resistance to maize stalk rot (Li et al., 2017). The current study reveals a distinct Ht3L locus for NCLB resistance. Considering the substantial annual yield loss caused by NCLB, the Ht3L locus will be valuable in future breeding programs of NCLB-resistant maize.
Mining and utilizing resistant loci/genes can greatly promote the development of resistant varieties, which will decrease yield losses and improve grain quality. With the availability of high-density SNP markers, we delimited Ht3L to an interval of 577kb via five rounds of sequential fine-mapping. The homozygous Ht3L/Ht3L genotype reduced DLA by 16.5% compared to that in lines without Ht3L. Our results will facilitate the cloning of the causative gene underlying the Ht3L locus and accelerate application of Ht3L in the breeding of NCLB-resistant maize varieties.
The original contributions presented in this study are included in the article/Supplementary material, further inquiries can be directed to the corresponding author/s.
MJ and YW designed the experiments. JM, XL, XQ, XG, and MJ were responsible for the field tests. YG, YZ, and XL conducted genotyping. MZ and YG analyzed the data. MZ, JM, and MJ wrote the manuscript. MJ and YW supervised the project. MZ, JM, and MJ revised the manuscript in response to the reviewers. All authors read and approved the manuscript.
This study was supported by the National Key Research and Development Project of China (2021YFD1201003) and Modern Agricultural Industry System Construction Project of China (CARS-02-52).
We are thankful to Zhiyan Cao (Hebei Agricultural University) for providing E. turcicum isolates. We also gratefully acknowledge editor and reviewers for thoughtful suggestion on our manuscript.
YG and YZ were employed by Liaoning Dongya Agricultural Development Co., Ltd.
The remaining authors declare that the research was conducted in the absence of any commercial or financial relationships that could be construed as a potential conflict of interest.
All claims expressed in this article are solely those of the authors and do not necessarily represent those of their affiliated organizations, or those of the publisher, the editors and the reviewers. Any product that may be evaluated in this article, or claim that may be made by its manufacturer, is not guaranteed or endorsed by the publisher.
The Supplementary Material for this article can be found online at: https://www.frontiersin.org/articles/10.3389/fpls.2022.968924/full#supplementary-material
Ayliffe, M., Singh, R., and Lagudah, E. (2008). Durable resistance to wheat stem rust needed. Curr. Opin. Plant Biol. 11, 187–192. doi: 10.1016/j.pbi.2008.02.001
Balint-Kurti, P. J., Yang, J., Van Esbroeck, G., Jung, J., and Smith, M. E. (2010). Use of a maize advanced intercross line for mapping of QTL for Northern leaf blight resistance and multiple disease resistance. Crop Sci. 50, 458–466. doi: 10.2135/cropsci2009.02.0066
Bentolila, S., Guitton, C., Bouvet, N., Sailland, A., Nykaza, S., and Freyssinet, G. (1991). Identification of an RFLP marker tightly linked to the Ht1 gene in maize. Theor. Appl. Genet. 82, 393–398. doi: 10.1007/BF00588588
Cai, H. W., Gao, Z. S., Yuyama, N., and Ogawa, N. (2003). Identification of AFLP markers closely linked to the rhm gene for resistance to Southern corn leaf blight in maize by using bulked segregant analysis. Mol. Genet. Genomics 269, 299–303. doi: 10.1007/s00438-003-0837-z
Ceballos, H., and Gracen, V. E. (1989). A dominant inhibitor gene inhibits the expression of Ht2 against Exserohilum turcicum race 2 in corn inbred lines related to B14. Plant Breed. 102, 35–44.
Chang, H. S., and Fan, K. C. (1986). Comparative studies ou some biology and pathology of corn and broom corn isolates of Exserohilum turcicum (Pass) Leonard & Suggs. Bot. Bull. Acad. Sin. 27, 209–218.
Chen, G., Wang, X., Long, S., Jaqueth, J., Li, B., Yan, J., et al. (2015). Mapping of QTL conferring resistance to northern corn leaf blight using high-density SNPs in maize. Mol. Breed. 36:4. doi: 10.1007/s11032-015-0421-3
Chung, C. L., Jamann, T., Longfellow, J., and Nelson, R. (2010). Characterization and fine-mapping of a resistance locus for northern leaf blight in maize bin 8.06. Theor. Appl. Genet. 121, 205–227. doi: 10.1007/s00122-010-1303-z
Ding, J., Ali, F., Chen, G., Li, H., Mahuku, G., Yang, N., et al. (2015). Genome-wide association mapping reveals novel sources of resistance to northern corn leaf blight in maize. BMC Plant Biol. 15:206. doi: 10.1186/s12870-015-0589-z
Gao, J., Lu, S., Gao, Z., Zhuang, J., Zhang, X., and Zhang, S. (2011). Identification and dynamic analysis on physiological race of Exserohilum turcicum in Northeastern China in 2009. J. Maize Sci. 19, 138–140.
Guo, L. (2015). Genetic diversity and mating type distribution of Setosphaeria turcica in China. Hebei: Hebei Agricultural University.
Hilu, H. M., and Hooker, A. L. (1964). Host-pathogen relationship of Helminthosporium turcicum in resistant and susceptible corn seedlings. Phytopathology 54, 570–575.
Hilu, H. M., and Hooker, A. L. (1965). Localized infection by Helminthosporium turcium on corn leaves. Phytopathology 55, 189–192.
Hooker, A. L. (1977). A second major locus in corn for chlortic-lesion resistance to helmintbosporium turcicum. Crop Sci. 17, 132–135.
Hooker, A. L. (1981). Resistance to Helminthosporium turcium from Tripsacum floridanum incorporated into maize. Maize Genet. Crop Newsl. 55, 87–88.
Hurni, S., Scheuermann, D., Krattinger, S. G., Kessel, B., Wicker, T., Herren, G., et al. (2015). The maize disease resistance gene Htn1 against northern corn leaf blight encodes a wall-associated receptor-like kinase. Proc. Natl. Acad. Sci. U.S.A. 112, 8780–8785. doi: 10.1073/pnas.1502522112
Jamann, T. M., Poland, J. A., Kolkman, J. M., Smith, L. G., and Nelson, R. J. (2014). Unraveling genomic complexity at a quantitative disease resistance locus in maize. Genetics 198, 333–344. doi: 10.1534/genetics.114.167486
Jindal, K. K., Tenuta, A. U., Woldemariam, T., Zhu, X., Hooker, D. C., and Reid, L. M. (2019). Occurrence and distribution of physiological races of exserohilum turcicum in ontario. Can. Plant Dis. 103, 1450–1457. doi: 10.1094/PDIS-06-18-0951-SR
Leng, P., Ji, Q., Asp, T., Frei, U. K., Ingvardsen, C. R., Xing, Y., et al. (2017). Auxin binding protein 1 reinforces resistance to sugarcane mosaic virus in maize. Mol. Plant 10, 1357–1360. doi: 10.1016/j.molp.2017.07.013
Li, P., Du, C., Zhang, Y., Yin, S., Zhang, E., Fang, H., et al. (2018). Combined bulked segregant sequencing and traditional linkage analysis for identification of candidate gene for purple leaf sheath in maize. PLoS One 13:e0190670. doi: 10.1371/journal.pone.0190670
Li, Y., Tong, L., Deng, L., Liu, Q., Xing, Y., Wang, C., et al. (2017). Evaluation of ZmCCT haplotypes for genetic improvement of maize hybrids. Theor. Appl. Genet. 130, 2587–2600. doi: 10.1007/s00122-017-2978-1
Liu, Q., Deng, S., Liu, B., Tao, Y., Ai, H., Liu, J., et al. (2020). A helitron-induced RabGDIalpha variant causes quantitative recessive resistance to maize rough dwarf disease. Nat. Commun. 11:495. doi: 10.1038/s41467-020-14372-3
Liu, Q., Liu, H., Gong, Y., Tao, Y., Jiang, L., Zuo, W., et al. (2017). An atypical thioredoxin imparts early resistance to sugarcane mosaic virus in maize. Mol. Plant 10, 483–497. doi: 10.1016/j.molp.2017.02.002
Ma, J., Wang, Y., KLiu, X., Li, M., Gong, X., Qi, X., et al. (2014). SNP gene chip analysis of near-isogenic lines to northern corn leaf blight. J. Maize Sci. 22, 153–158.
Michelmore, R., Paran, I., and Kesseli, R. (1991). Identification of markers linked to disease-resistance genes by bulked segregant analysis: Arapid method to detect markers in specific genomic regions by using segregating populations. Proc. Natl. Acad. Sci. U.S.A. 88, 9828–9832. doi: 10.1073/pnas.88.21.9828
Murray, M. G., and Thompson, W. F. (1980). Rapid isolation of high molecular weight plant DNA. Nucleic Acids Res. 8, 4321–4325.
Navarro, B. L., Hanekamp, H., Koopmann, B., and von Tiedemann, A. (2020). Diversity of expression types of Ht genes conferring resistance in maize to exserohilum turcicum. Front. Plant. Sci. 11:607850. doi: 10.3389/fpls.2020.607850
Poland, J. A., Balint-Kurti, P. J., Wisser, R. J., Pratt, R. C., and Nelson, R. J. (2009). Shades of gray: The world of quantitative disease resistance. Trends Plant Sci. 14, 21–29. doi: 10.1016/j.tplants.2008.10.006
Poland, J. A., Bradbury, P. J., Buckler, E. S., and Nelson, R. J. (2011). Genome-wide nested association mapping of quantitative resistance to northern leaf blight in maize. Proc. Natl. Acad. Sci. U.S.A. 108, 6893–6898. doi: 10.1073/pnas.1010894108
Raymundo, A. D., and Hooker, A. L. (1981). Measuring the relationship between northern corn leaf blight and yield losses. Plant Dis. 65, 325–327.
Semagn, K., Babu, R., Hearne, S., and Olsen, M. (2013). Single nucleotide polymorphism genotyping using Kompetitive Allele Specific PCR (KASP): Overview of the technology and its application in crop improvement. Mol. Breed. 33, 1–14. doi: 10.1007/s11032-013-9917-x
Shen, X., Zhou, M., Lu, W., and Ohm, H. (2003). Detection of Fusarium head blight resistance QTL in a wheat population using bulked segregant analysis. Theor. Appl. Genet. 106, 1041–1047. doi: 10.1007/s00122-002-1133-8
Takagi, H., Abe, A., Yoshida, K., Kosugi, S., Natsume, S., Mitsuoka, C., et al. (2013). QTL-seq: Rapid mapping of quantitative trait loci in rice by whole genome resequencing of DNA from two bulked populations. Plant J. 74, 174–183. doi: 10.1111/tpj.12105
Venuprasad, R., Dalid, C. O., Del Valle, M., Zhao, D., Espiritu, M., Sta Cruz, M. T., et al. (2009). Identification and characterization of large-effect quantitative trait loci for grain yield under lowland drought stress in rice using bulk-segregant analysis. Theor. Appl. Genet. 120, 177–190. doi: 10.1007/s00122-009-1168-1
Wang, C., Yang, Q., Wang, W., Li, Y., Guo, Y., Zhang, D., et al. (2017). A transposon-directed epigenetic change in ZmCCT underlies quantitative resistance to Gibberella stalk rot in maize. New Phytol. 215, 1503–1515. doi: 10.1111/nph.14688
Wang, J., Xu, Z., Yang, J., Lu, X., Zhou, Z., Zhang, C., et al. (2018). qNCLB7.02, a novel QTL for resistance to northern corn leaf blight in maize. Mol. Breed. 38:54. doi: 10.1007/s11032-017-0770-1
Weems, J. D., and Bradley, C. A. (2018). exserohilum turcicum race population distribution in the North Central United States. Plant Dis. 102, 292–299. doi: 10.1094/PDIS-01-17-0128-RE
Welz, H., and Geiger, H. (2000). Genes for resistance to northern corn leaf blight in diverse maize populations. Plant Breed. 119, 1–14.
Wisser, R., Balint-Kurti, P., and Nelson, R. (2006). The genetic architecture of disease resistance in maize: A synthesis of published studies. Phytopathology 96, 120–129. doi: 10.1094/PHYTO-96-0120
Yang, P., Praz, C., Li, B., Singla, J., Robert, C. A. M., Kessel, B., et al. (2019). Fungal resistance mediated by maize wall-associated kinase ZmWAK-RLK1 correlates with reduced benzoxazinoid content. New Phytol. 221, 976–987. doi: 10.1111/nph.15419
Yang, P., Scheuermann, D., Kessel, B., Koller, T., Greenwood, J. R., Hurni, S., et al. (2021). Alleles of a wall-associated kinase gene account for three of the major northern corn leaf blight resistance loci in maize. Plant J. 106, 526–535. doi: 10.1111/tpj.15183
Yang, Q., Balint-Kurti, P., and Xu, M. (2017). quantitative disease resistance: Dissection and adoption in maize. Mol. Plant 10, 402–413. doi: 10.1016/j.molp.2017.02.004
Yang, Q., Zhang, D., and Xu, M. (2012). A sequential quantitative trait locus fine-mapping strategy using recombinant-derived progeny. J. Integr. Plant Biol. 54, 228–237. doi: 10.1111/j.1744-7909.2012.01108.x
Ye, J., Zhong, T., Zhang, D., Ma, C., Wang, L., Yao, L., et al. (2019). The auxin-regulated protein ZmAuxRP1 coordinates the balance between root growth and stalk rot disease resistance in maize. Mol. Plant 12, 360–373. doi: 10.1016/j.molp.2018.10.005
Zhao, X., Tan, G., Xing, Y., Wei, L., Chao, Q., Zuo, W., et al. (2012). Marker-assisted introgression of qHSR1 to improve maize resistance to head smut. Mol. Breed. 30, 1077–1088. doi: 10.1007/s11032-011-9694-3
Zhu, M., Tong, L., Xu, M., and Zhong, T. (2021). Genetic dissection of maize disease resistance and its applications in molecular breeding. Mol. Breed. 41, 1–22. doi: 10.1007/s11032-021-01219-y
Zuo, W., Chao, Q., Zhang, N., Ye, J., Tan, G., Li, B., et al. (2015). A maize wall-associated kinase confers quantitative resistance to head smut. Nat. Genet. 47, 151–157. doi: 10.1038/ng.3170
Keywords: Ht3, northern corn leaf blight (NCLB), maize (Zea mays L.), maize disease, fine-mapping
Citation: Zhu M, Ma J, Liu X, Guo Y, Qi X, Gong X, Zhu Y, Wang Y and Jiang M (2022) High-resolution mapping reveals a Ht3-like locus against northern corn leaf blight. Front. Plant Sci. 13:968924. doi: 10.3389/fpls.2022.968924
Received: 14 June 2022; Accepted: 25 August 2022;
Published: 09 September 2022.
Edited by:
Handong Su, Huazhong Agricultural University, ChinaReviewed by:
Vikas Venu Kumaran, Indian Agricultural Research Institute (ICAR), IndiaCopyright © 2022 Zhu, Ma, Liu, Guo, Qi, Gong, Zhu, Wang and Jiang. This is an open-access article distributed under the terms of the Creative Commons Attribution License (CC BY). The use, distribution or reproduction in other forums is permitted, provided the original author(s) and the copyright owner(s) are credited and that the original publication in this journal is cited, in accordance with accepted academic practice. No use, distribution or reproduction is permitted which does not comply with these terms.
*Correspondence: Min Jiang, am0zMTkyQDEyNi5jb20=; Yanbo Wang, bG53YW5neWFuYm9AMTYzLmNvbQ==
‡These authors have contributed equally to this work
†Present Address: Xue Gong, Guangxi Academy of Agricultural Sciences, Nanning, China
Disclaimer: All claims expressed in this article are solely those of the authors and do not necessarily represent those of their affiliated organizations, or those of the publisher, the editors and the reviewers. Any product that may be evaluated in this article or claim that may be made by its manufacturer is not guaranteed or endorsed by the publisher.
Research integrity at Frontiers
Learn more about the work of our research integrity team to safeguard the quality of each article we publish.