
95% of researchers rate our articles as excellent or good
Learn more about the work of our research integrity team to safeguard the quality of each article we publish.
Find out more
ORIGINAL RESEARCH article
Front. Plant Sci. , 18 August 2022
Sec. Plant Breeding
Volume 13 - 2022 | https://doi.org/10.3389/fpls.2022.968466
This article is part of the Research Topic Generating Useful Genetic Variation in Crops by Induced Mutation, Volume II View all 6 articles
 Jung Min Kim1,2
 Jae Il Lyu3
 Dong-Gun Kim1
 Nguyen Ngoc Hung1,2
 Ji Su Seo1,2
 Joon-Woo Ahn1
 You Jin Lim4
 Seok Hyun Eom4
 Bo-Keun Ha2*
 Soon-Jae Kwon1*
Isoflavones are major secondary metabolites that are exclusively produced by legumes, including soybean. Soy isoflavones play important roles in human health as well as in the plant defense system. The isoflavone content is influenced by minor-effect quantitative trait loci, which interact with polygenetic and environmental factors. It has been difficult to clarify the regulation of isoflavone biosynthesis because of its complex heritability and the influence of external factors. Here, using a genotype-by-sequencing-based genome-wide association mapping study, 189 mutant soybean genotypes (the mutant diversity pool, MDP) were genotyped on the basis of 25,646 high-quality single nucleotide polymorphisms (SNPs) with minor allele frequency of >0.01 except for missing data. All the accessions were phenotyped by determining the contents of 12 isoflavones in the soybean seeds in two consecutive years (2020 and 2021). Then, quantitative trait nucleotides (QTNs) related to isoflavone contents were identified and validated using multi-locus GWAS models. A total of 112 and 46 QTNs related to isoflavone contents were detected by multiple MLM-based models in 2020 and 2021, respectively. Of these, 12 and 5 QTNs were related to more than two types of isoflavones in 2020 and 2021, respectively. Forty-four QTNs were detected within the 441-Kb physical interval surrounding Gm05:38940662. Of them, four QTNs (Gm05:38936166, Gm05:38936167, Gm05:38940662, and Gm05:38940717) were located at Glyma.05g206900 and Glyma.05g207000, which encode glutathione S-transferase THETA 1 (GmGSTT1), as determined from previous quantitative trait loci annotations and the literature. We detected substantial differences in the transcript levels of GmGSTT1 and two other core genes (IFS1 and IFS2) in the isoflavone biosynthetic pathway between the original cultivar and its mutant. The results of this study provide new information about the factors affecting isoflavone contents in soybean seeds and will be useful for breeding soybean lines with high and stable concentrations of isoflavones.
Soybean [Glycine max (L.) Merr] is a major source of protein and oil as well as secondary metabolites that are beneficial for human health (Liang et al., 2010). Soy isoflavones primarily consist of daidzein, glycitein, genistein, daidzin, glycitin, genistin, 6-o-malonyldaidzin, 6-o-malonylglycitin, 6-o-malonylgenistin, 6-o-acetyldaidzin, 6-o-acetylglycitin, and 6-o-acetylgenistin in seeds, and coumestrol in leaves and roots (Kudou et al., 1991; Yuk et al., 2011). Soy isoflavones are synthesized and conjugated through a branch of the phenylpropanoid pathway, and are stored in the central vacuole of cells (Dastmalchi and Dhaubhadel, 2014). Phytochemicals are metabolites that are naturally derived from plants. Some of them, such as phenolic compounds and anthocyanins, have antioxidant and antiviral properties (Messina, 1999; Lee et al., 2005). Soy isoflavones have diverse functions. They interact with rhizobia to promote nodulation in the roots, root nodule symbiosis for nitrogen fixation, and are involved in resistance to pathogens and stresses (Graham et al., 1990; Sreevidya et al., 2006; Li et al., 2013). Recent studies have shown that consumption of products and medicines derived from soybean is beneficial for human health (Kang et al., 2002; Collison, 2008; Lobato et al., 2012). Soy isoflavones, as a class of phytoestrogens, have antitumor activity and the ability to ameliorate the symptoms of cardiovascular disease and climacteric syndrome, as well as relieving post-menopausal symptoms (Farina et al., 2006; Ma et al., 2008).
The detailed mechanism of the regulation of isoflavone biosynthesis is still unclear because complex quantitative traits such as isoflavone content, tocopherol content, and saponin content are interrelated, and are affected by genotype, year, and location (Rupasinghe et al., 2003; Gutierrez-Gonzalez et al., 2009; Shaw et al., 2016). Both additive and epistatic effects are affected by genotype × environment interactions, and because many alleles make small contributions to overall phenotypic variations, it is difficult to identify quantitative trait loci (QTLs) related to isoflavone content (Gutierrez-Gonzalez et al., 2011; Fan et al., 2015). To address these problems, high-density genotyping platforms and advanced next-generation sequencing (NGS) technologies have been developed and applied to detect genetic polymorphisms related to traits of interest in many crops (Thomson, 2014; Rasheed et al., 2017). Genotype-by-sequencing (GBS) can be applied in situations where there are multiple samples with high genetic diversity and large genomes. Compared with whole genome genotyping, GBS is more cost-effective, simpler, highly reproducible, and can partially capture important parts of the genome that are otherwise inaccessible. This approach has been used to discover huge numbers of single nucleotide polymorphisms (SNPs). It is anticipated that high-density SNP genotyping will be compatible with genome-wide association study (GWAS), marker-assisted selection, and genomic selection for crop improvement (Elshire et al., 2011; He et al., 2014).
To map QTLs associated with isoflavone content, previous studies conducted QTL mapping using an F2 population and recombinant inbred lines (RILs) as a bi-parental population. Primomo et al. (2005) identified QTLs and epistatic interactions underlying isoflavone contents in soybean seed using RILs with 99 polymorphic simple sequence repeat (SSR) markers and detected 17 QTLs spanning multiple loci. Cai et al. (2018) detected 48 additive QTLs underlying variations in seed isoflavone content using SNP and SSR markers. Using specific-locus amplified fragment sequencing (SLAF-seq) methods, Pei et al. (2018) constructed a high-density genetic map using 3,541 SLAF markers and data from multiple environments and detected 24 stable QTLs for isoflavone components. Although linkage mapping has revealed some core QTLs underlying qualitative and quantitative traits such as agronomic traits (Brummer et al., 1997; Chen et al., 2007), stress tolerance (Concibido et al., 2004; Lee et al., 2004), and some functional components (Warrington et al., 2015; Li et al., 2017), the low crossover rates of the two parents’ alleles in the F2 and RIL populations leads to limited segregation and recombination frequency, resulting in genetic distortion, low allelic diversity, and low mapping resolution (Zhang et al., 2010; Xu et al., 2017).
As an alternative to linkage mapping, GWAS has some advantages as a tool because of its high-density resolution, its suitability for analyses of large sample and population sizes, and the large amount of markers. In addition, it involves powerful statistical methods that analyze the association mapping (AM) between traits of interests and the amount of SNPs markers based on natural populations and the structure of linkage disequilibrium (LD) (Korte and Farlow, 2013; Ibrahim et al., 2020). In previous AM studies on soy isoflavones, Chu et al. (2017) detected a gene encoding an R2R3-type MYB transcription factor (GmMYB29) that affected isoflavone content via GWAS and 207,608 SNPs using the NJAU 355K SoySNP array. This transcription factor binds to the promoters of two major genes in the isoflavone biosynthetic pathway, IFS2 and CHS8, and activates their expression. Meng et al. (2016) detected 44 QTLs on chromosome 16 related to seed isoflavone content using restricted two-stage multi-locus GWAS with 55,340 SNPs derived from restriction-site-association DNA sequencing. Recently, Wu et al. (2020) identified 87 SNPs and 37 QTLs underlying isoflavone content using both GWAS and linkage analysis based on 28,926 SNPs and 4412 bins, respectively, and one major locus (qISO8-1) of GmMPK1 was significantly co-localized on chromosome 8.
The spontaneous mutation rate is as low as one mutation per 100 million to 1 billion nucleotides per generation. Ionizing radiation can increase the mutation rate by up to 1,000-fold to 1 million-fold compared with the natural mutation rate (Johnson et al., 2000; Jiang and Ramachandran, 2010). Therefore, mutation breeding has been used by breeders and researchers to rapidly generate elite cultivars and high-quality, large mutant populations. This method has been used to genetically improve many crops. To date, approximately 3,365 varieties of more than 210 species have been developed using mutation technology (Malek et al., 2014; Chaudhary et al., 2019).1 Using gamma-ray radiation, Kim et al. (2019) developed a high-stearic acid mutant soybean Hfa180, with a stearic acid content more than 8.57-fold that in the original cultivar. Joshi et al. (2016) selected two mutant rice lines, D100-200 and D100-209, with increased salt tolerance; they showed increases of 18 and 34% in yield and related parameters compared with wild-type plants under saline conditions. Lee et al. (2014) generated a lipoxygenase-free soybean mutant H70 with reduced undesirable flavors. This mutant had a deletion and single-point mutations of Lox1, Lox2, and Lox3 genes compared with the original cultivar. The soybean mutant population used in this study was developed as a mutant diversity pool (MDP) by our group. Its agronomic traits, contents of functional components, and expression levels of genes related to certain phytochemicals have been described in other studies (Kim et al., 2020, 2021).
No previous studies have conducted AM using multiple GWAS models and a mutant soybean population. In this study, the first aim was to dissect causative QTLs related to isoflavone content in soybean seeds using an MDP and multiple GWAS methods; MLM and mrMLM (mrMLM, FastmrMLM, FASTmrEMMA, pLAR-mEB, pKWmEB, and ISIS EM-BLASSO) under year-to-year variation. A total of 25,646 high-quality SNPs in 189 mutant soybean genotypes with phenotypic data were used for this GBS-based GWAS analysis to detect important SNPs. The results of this study provide comprehensive insights into the factors that affect isoflavone contents in soybean seeds.
The association mapping population consisting of 189 soybean lines from the MDP was selected and successfully validated with target region amplification polymorphism (TRAP) markers. Briefly, for constructing a soybean MDP, 1000 M1 seeds of each accession were derived from seven cultivars by 250 Gy of gamma-irradiation (Co60) and planted at Radiation Breeding Research Farm in the Korea Atomic Energy Research Institute (KAERI, 35.5699°N 126.9722°E, Jeongeup, Jeollabuk, Republic of Korea). Subsequently, 1695 M1:2 seeds single-seed descent planted in soybean filed at the KAERI during M1–M5 generation and then we selected 523 accessions based on agronomic traits. To homozygous population, 523 M5:6 seeds were propagated as bulks until M12 generation to remove redundant phenotypes. Finally, we selected 208 soybean mutants showing genetically fixed morphological characteristics. Previous GWAS of this population have revealed details of its genetic diversity, important agronomic traits, and functional genes (Kim et al., 2020, 2021). The seeds of the MDP were obtained from the (KAERI). To evaluate year-to-year variations in isoflavone contents, field trials were conducted in 2020 and 2021 at the Radiation Breeding Research Farm at the KAERI. In each year, the 189-member MDP was planted with a randomized complete block design with three replications. Each genotype was sown in one row per plot, and each row was 300 cm long, with 80 cm spacing between rows. Field management during the growing season, including fertilization, weed management, and insecticide-fungicide application were based on a standard cropping system. After maturity, three individual plants were randomly harvested from each plot and the seeds were collected to quantify isoflavones.
Isoflavones were extracted and quantified as described by Chen et al. (2020) and Lim et al. (2021), with slight modifications. Briefly, 10 dried seeds from each genotype were ground into a fine powder using a 2010 GENO/GRINDER (SPEX samplePrep LLC, Metuchen, NJ, United States). Then, 20 mg of the powder was placed in a 2-mL microcentrifuge tube with 1 mL of 80% (v/v) methanol. The mixture was incubated in a shaking incubator for 24 h (room temperature, 150 rpm). After centrifugation at 13,000 rpm for 5 min, the supernatant (1-mL) was passed through a syringe filter (NORM-JECT, Henke-Sass Wolf, Tuttlingen, Germany) equipped with a 0.22 μm PTFE membrane (GVS, Sanford, ME, United States). The filtered extract was placed in a 2-mL vial and subjected to ultra-performance liquid chromatography (UPLC) analysis. The UPLC was equipped with a reversed-phase UPLC column (ACQUITY BEH C18 Column; 2.1 × 50 mm, 1.7 μm particle size, Waters Corp., Milford, MA, United States). The mobile phase consisted of A (water with 0.1% v/v formic acid) and B (acetonitrile with 0.1% v/v formic acid). The elution gradient was as follows: 2 min of equilibration at 13%, followed by a linear increase in mobile phase B to 17% in 3 min, to 22% in 3 min, to 60% in 6 min, then held for 1 min (total run time, 20 min). The flow rate was 0.25 mL min–1, the injection volume was 1 μL, and the oven temperature was 25°C. Twelve isoflavone standards (daidzein (DZE), glycitein (GLE), Genistein (GNE), daidzin (DZI), glycitin (GLI), genistin (GNI), malonyl daidzin (MDZI), malonyl glycitin (MGLI), malonyl genistin (MGNI), acetyl daidzin (ADGI), acetyl glycitin (AGLI), and acetyl genistin (AGNI)) were purchased from Sigma-Aldrich for identification and quantification of each isoflavone in the soybean seeds.
Descriptive statistics such as maximum, minimum, mean, standard deviation (SD), skewness and kurtosis were calculated for data from each of the two years using Microsoft EXCEL 2016. Two-way analysis of variance (two-way ANOVA) and Pearson’s correlation coefficients among individuals and total isoflavone contents with each year were estimated to determine the effects of genotype, year, and genotype × year using R with the following basic codes; aov (formula, data = NULL, projections = FALSE, qr = TRUE, contrasts = NULL) function and corr_coef (data, verbose = TRUE). These analyses were conducted using the METAN package. The broad-sense heritability (h2) was calculated as follows:
where σ2G is genotypic variance, σ2GE is the variance of the genotype × environment interaction, σ2e is error variance, n is the number of environments, and r is the number of replications within each environment. The frequency distribution of phenotypic data was displayed using ggpubr and cowplot in the R package.
The 189 members of the MDP were genotyped using 37,249 SNPs derived by GBS as described by Kim (2021). The raw GBS data have been deposited at the NCBI sequence Read Archive (SRA) database (accession no. PRJNA845013). For the GWAS, a total of 25,646 high-quality SNPs in the 189 MDP with minor allele frequency (MAF) > 0.01 were filtered from raw SNPs using Plink (command settings: geno 0.5, mind 0.2). First, when applying the mixed linear model (MLM) and multi-locus random-SNP-effect mixed linear model (mrMLM) to reduce the false-positive rate in GWAS, a principal component analysis (PCA) was conducted and a kinship matrix (K) was calculated using Tassel 5.2 software to estimate the population structure. The Bonferroni threshold (p-value = 1.95 × 10⁻⁶) was calculated by negative log10 (0.05/n, n is the number of SNPs) and its threshold was used to detect important quantitative trait nucleotides (QTNs). A MLM based on single-locus effects was applied by Tassel using phenotype and genotype data with PC as a fixed effect and K as a random effect. In this study, we used six approaches: mrMLM, FastmrMLM, FASTmrEMMA, pLAR-mEB, pKWmEB, and ISIS EM-BLASSO within the multi-locus random-SNP-effect mixed linear model (mrMLM).2 The logarithm of the odds (LOD) score was set to 3 for determining significant QTNs and all options were set to default values. Information about the position of QTNs was retrieved from the Phytozome v9.13 and Soybase4 databases, based on the cultivar Williams 82.a2.v1. The Manhattan and QQ plots were drawn using CMplot in the R package.
The immature soybean seeds of wild type (Danbaek) and its mutant (DB-088) were collected into conical tubes, immediately frozen in liquid nitrogen, and then finely ground using a mortar and pestle. Total RNA was isolated using TRIZOL reagent (Invitrogen, Carlsbad, CA, United States). To adjust the concentration in the next two steps (RNA DNase treatment and cDNA synthesis), RNA quantity and quality were determined using a NanoDrop ND-1000 spectrophotometer (Thermo Fisher Scientific, Waltham, MA, United States). First, 20 μg total RNA was digested to remove contaminating DNA, and then the first-strand cDNA was synthesized using SuperScript III First-Strand synthesis SuperMix (Invitrogen). All of these procedures were conducted according to the manufacturer’s instructions.
The transcript levels of GmGSTT1, IFS1, and IFS2 were determined using the Bio-Rad CFX96 Real-time PCR system (Bio-Rad, Hercules, CA, United States) with iTaq Universal SYBR Green Supermix (Bio-Rad). The reference gene was ELF1B (Jian et al., 2008; Le et al., 2012). The thermal cycling conditions were as follows: 95°C for 10 min, followed by 40 cycles of 95°C for 15 s, 50°C for 15 s, and 72°C for 30 s. Each reaction had five replicates. The relative transcript level of each gene was calculated as follows:
The primer sets used in this study are listed in Supplementary Table 1.
To evaluate and validate the range of variation in isoflavone contents among genotypes and across years, the 189 mutant soybean genotypes were grown for 2 consecutive years (2020 and 2021) for GWAS analysis. We quantified the total isoflavones (TI) content and the contents of twelve types of isoflavones in soybean seeds: aglycones (DZE, GLE, and GNE), glucosides (DZI, GLI, and GNI), malonyl-glucosides (MDZI, MGLI, and MGNI), and acetyl-glucosides (ADGI, AGLI, and AGNI).
The average contents of isoflavones in each year were as follows: DZE [2020 (6.14 μg g–1), 2021 (4.67 μg g–1)], GLE [2020 (14.66), 2021 (2.80)], GNE [2020 (7.85), 2021 (6.75)], DZI [2020 (309.14), 2021 (168.45)], GLI [2020 (128.96), 2021 (109.00)], GNI [2020 (421.80), 2021 (252.62)], MDZI [2020 (796.50), 2021 (602.93)], MGLI [2020 (229.07), 2021 (226.86)], MGNI [2020 (1070.55), 2021 (885.91)], ADZI [2020 (117.03), 2021 (88.59)], AGNI [2020 (3.08), 2021 (2.41)], and TI [2020 (3104.80), 2021 (2350.98)].
Overall, isoflavone contents were lower in 2021 than in 2020. The average contents of aglycones, glucosides, malonyl-glucosides, acetyl-glucosides, and total isoflavones decreased from 9.55 μg g–1 in 2020 to 4.74 μg g–1 in 2021 (decreased by 50.39%), from 286.63 μg g–1 in 2020 to 176.69 μg g–1 in 2021 (decreased by 38.36%), from 698.71 μg g–1 in 2020 to 571.90 μg g–1 in 2021 (decreased by 18.15%), from 60.06 μg g–1 to 45.50 μg g–1 (decreased by 24.24%) and from 3104.80 μg g–1 in 2020 to 2350.98 μg g–1 in 2021 (decreased by 24.28%), respectively. The isoflavone contents showed continuous variations with normal distribution in the 2 years (Figure 1), indicating that isoflavone contents are quantitative traits that are regulated by numerous genes with smaller effects of environmental factors.
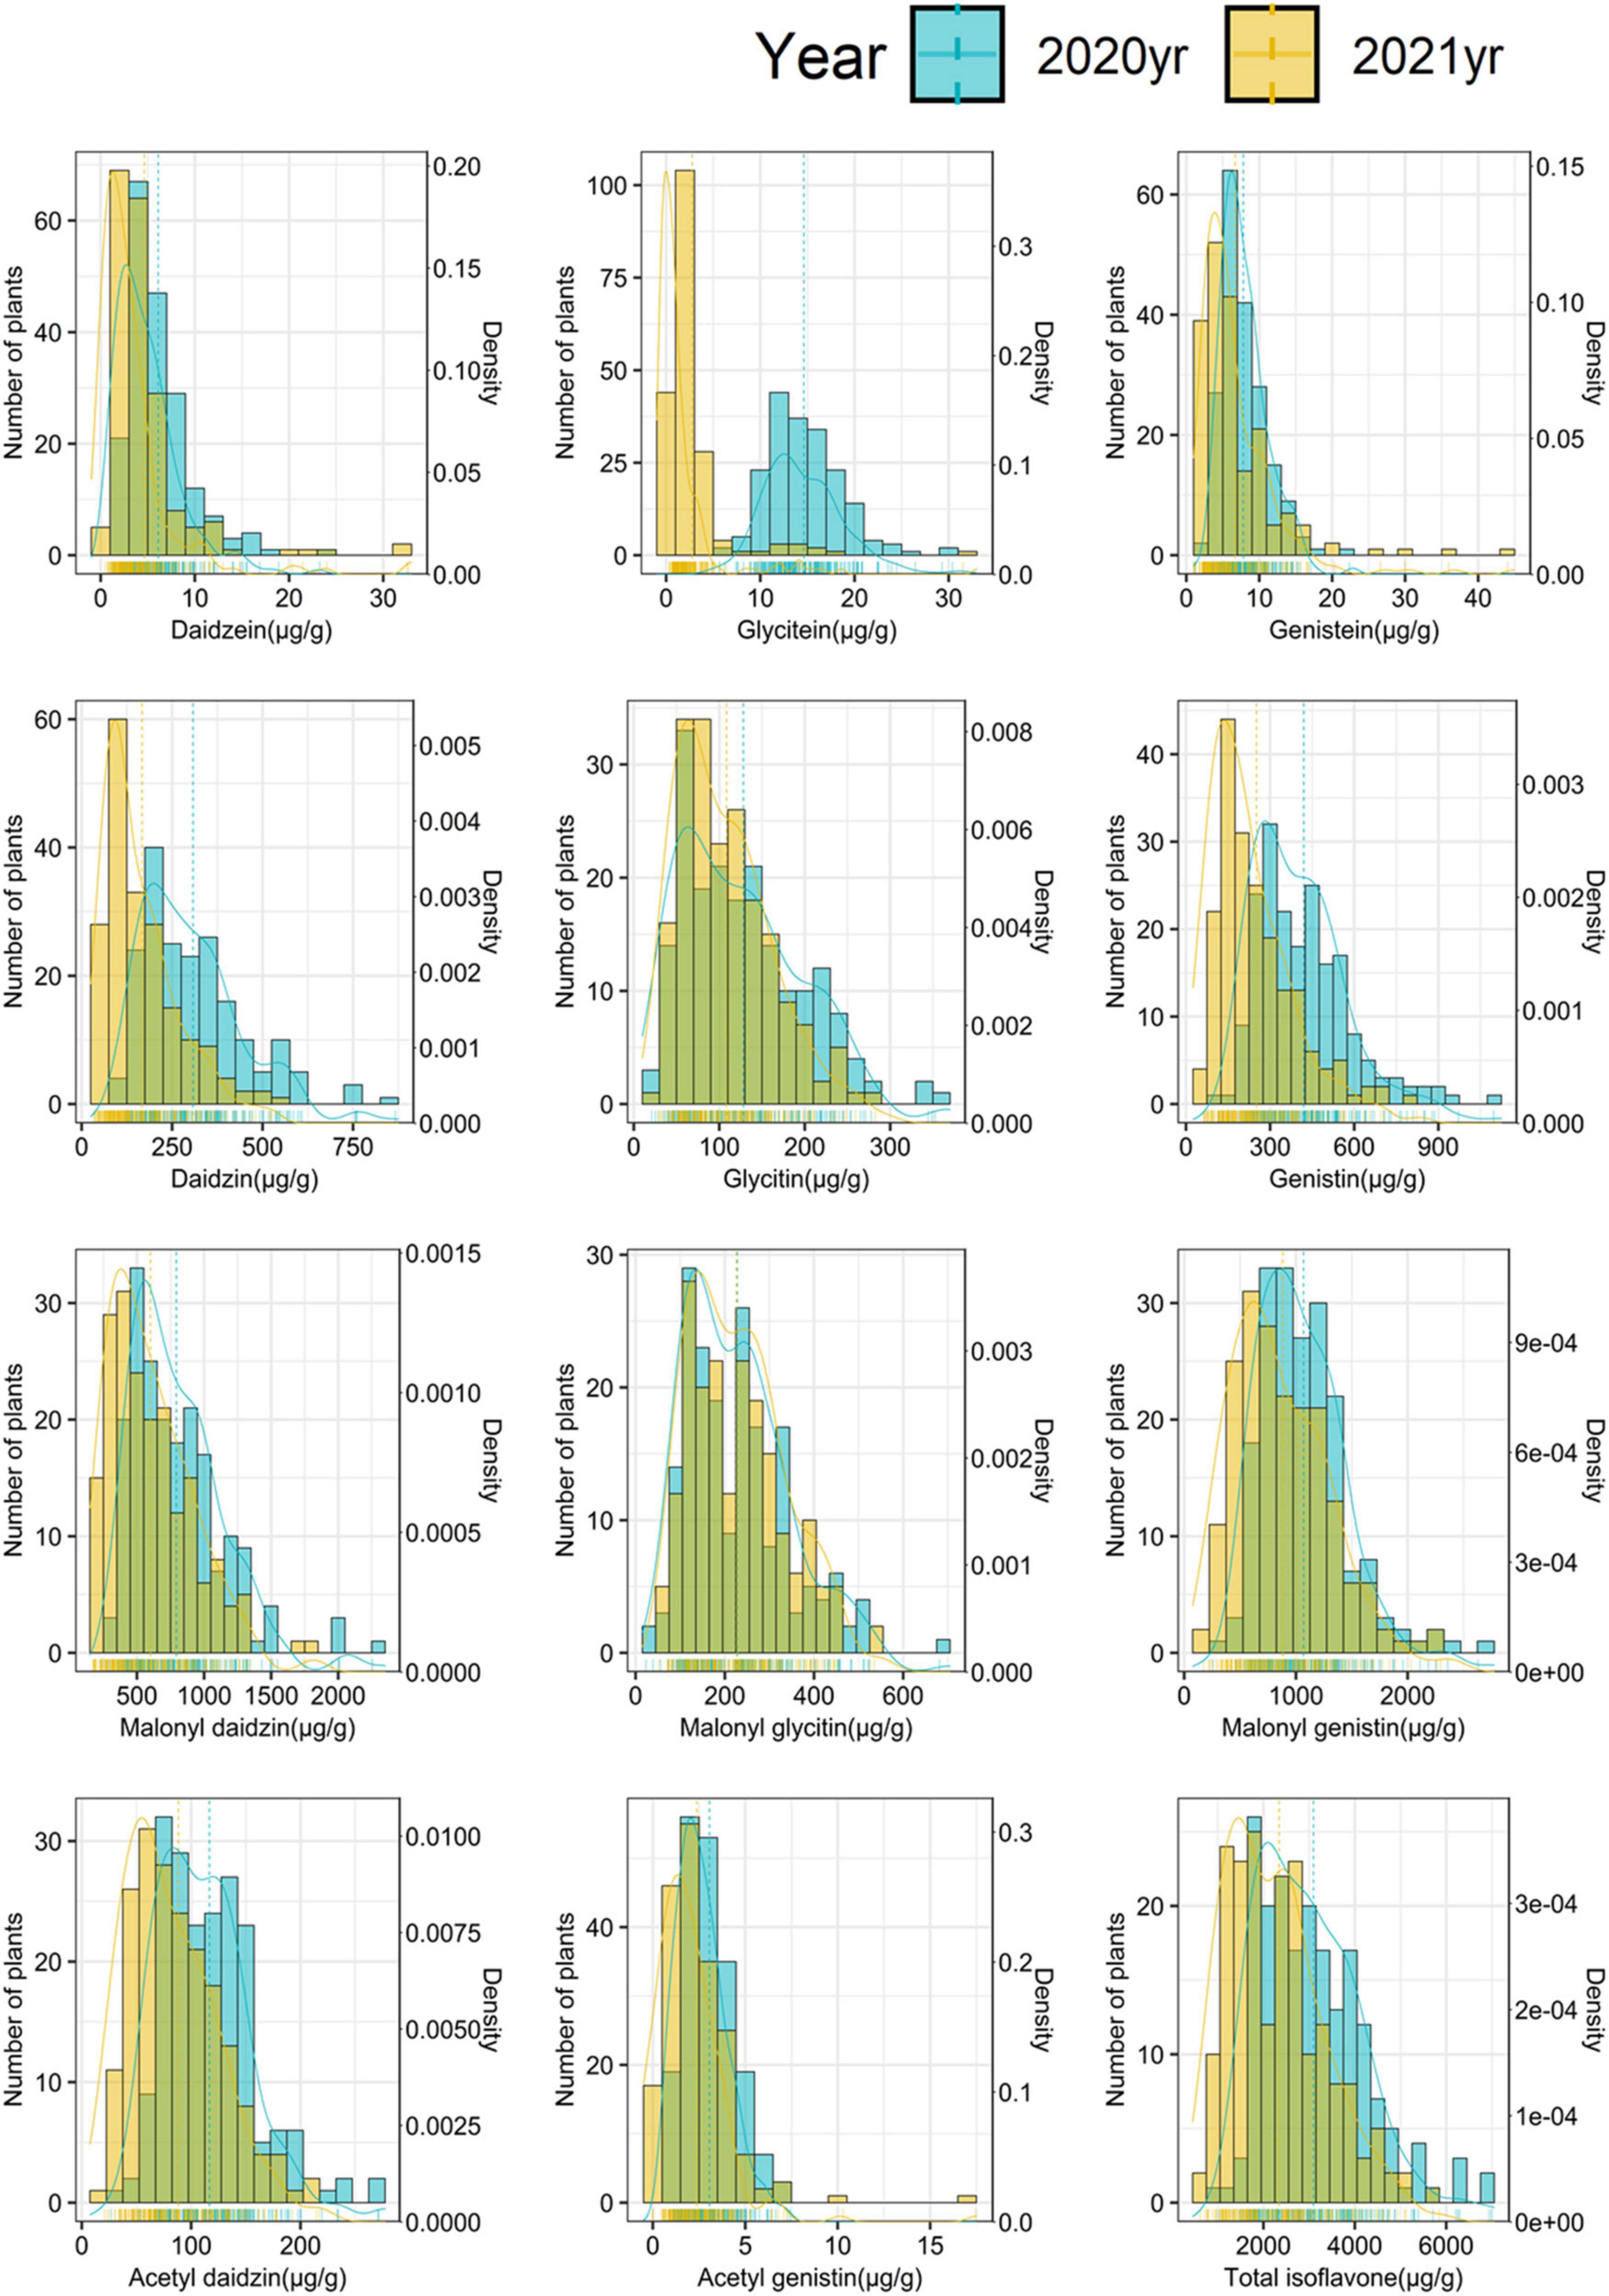
Figure 1. Frequency distribution of individual isoflavones and total isoflavone contents in mutant diversity pool (MDP).
As shown in Table 1, the ANOVA revealed significant effects of genotype, year, and genotype × year on isoflavone contents. The contents of all isoflavones except for MGLI differed significantly between 2020 and 2021 (P < 0.001). This result suggested that the isoflavone content was strongly affected by genetic factors and environmental factors. Based on variance among genotypes, years, and genotype × year, the broad-sense heritability values calculated for isoflavone contents ranged from high (e.g., 86% for MGNI and for ADZI) to low (e.g., 15% for GLE). This indicated that heritability varied depending on the type of isoflavone, and that all of the studied isoflavones except for GLE and AGNI were more affected by genetic factors than by environmental factors.
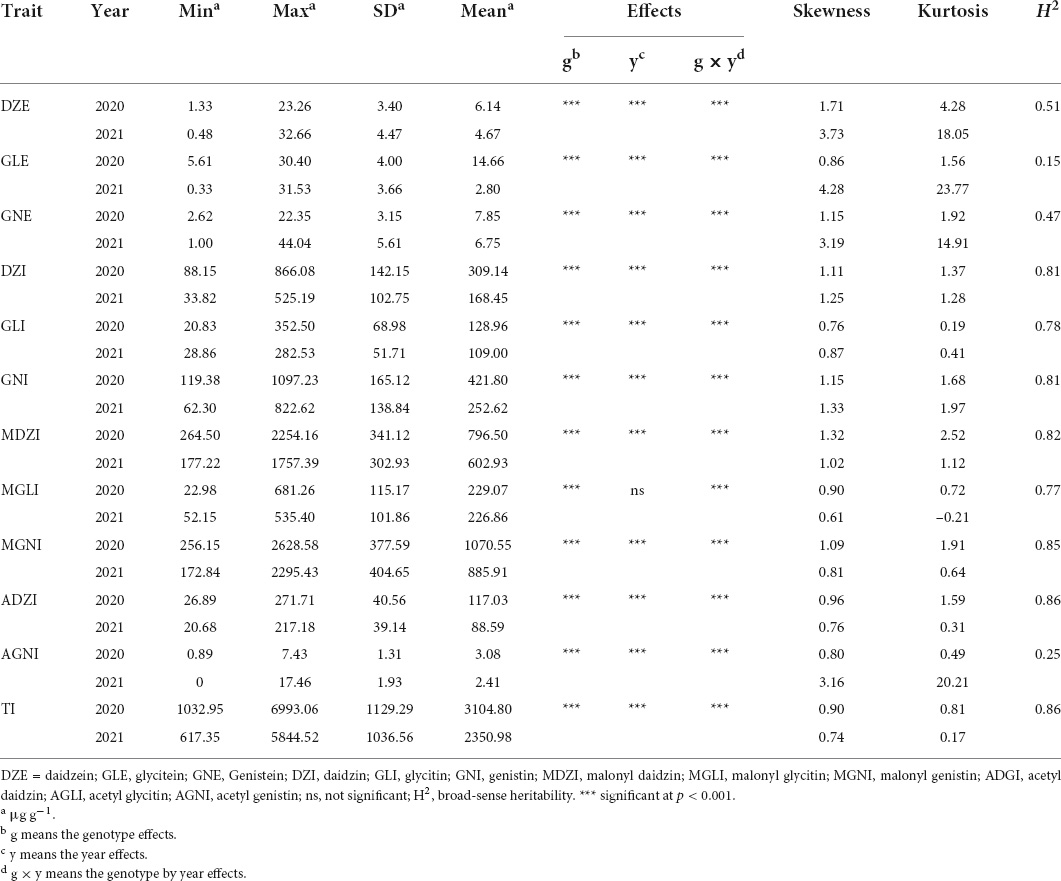
Table 1. Descriptive statistics, ANOVA analysis, and broad-sense heritability of isoflavone contents in MDP.
To determine the relationships between total isoflavones and individual isoflavones, and between pairs of individual isoflavones in the two years, we conducted Pearson’s correlation analysis using data for 12 individual isoflavones (Figure 2). Strong positive correlations were detected between TI and ADZI [2020 (r = 0.95, P < 0.001) and 2021 (r = 0.96, P < 0.001)], MGNI [2020 (r = 0.94, P < 0.001) and 2021 (r = 0.96, P < 0.001)], MDZI [2020 (r = 0.94, P < 0.001) and 2021 (r = 0.94, P < 0.001)], GNI [2020 (r = 0.94, P < 0.001) and 2021 (r = 0.89, P < 0.001)], and DZI [2020 (r = 0.93, P < 0.001) and 2021 (r = 0.89, P < 0.001)]. This result indicated that the main contributors to TI were ADZI, MGNI, MDZI, GNI, and DZI in both years.
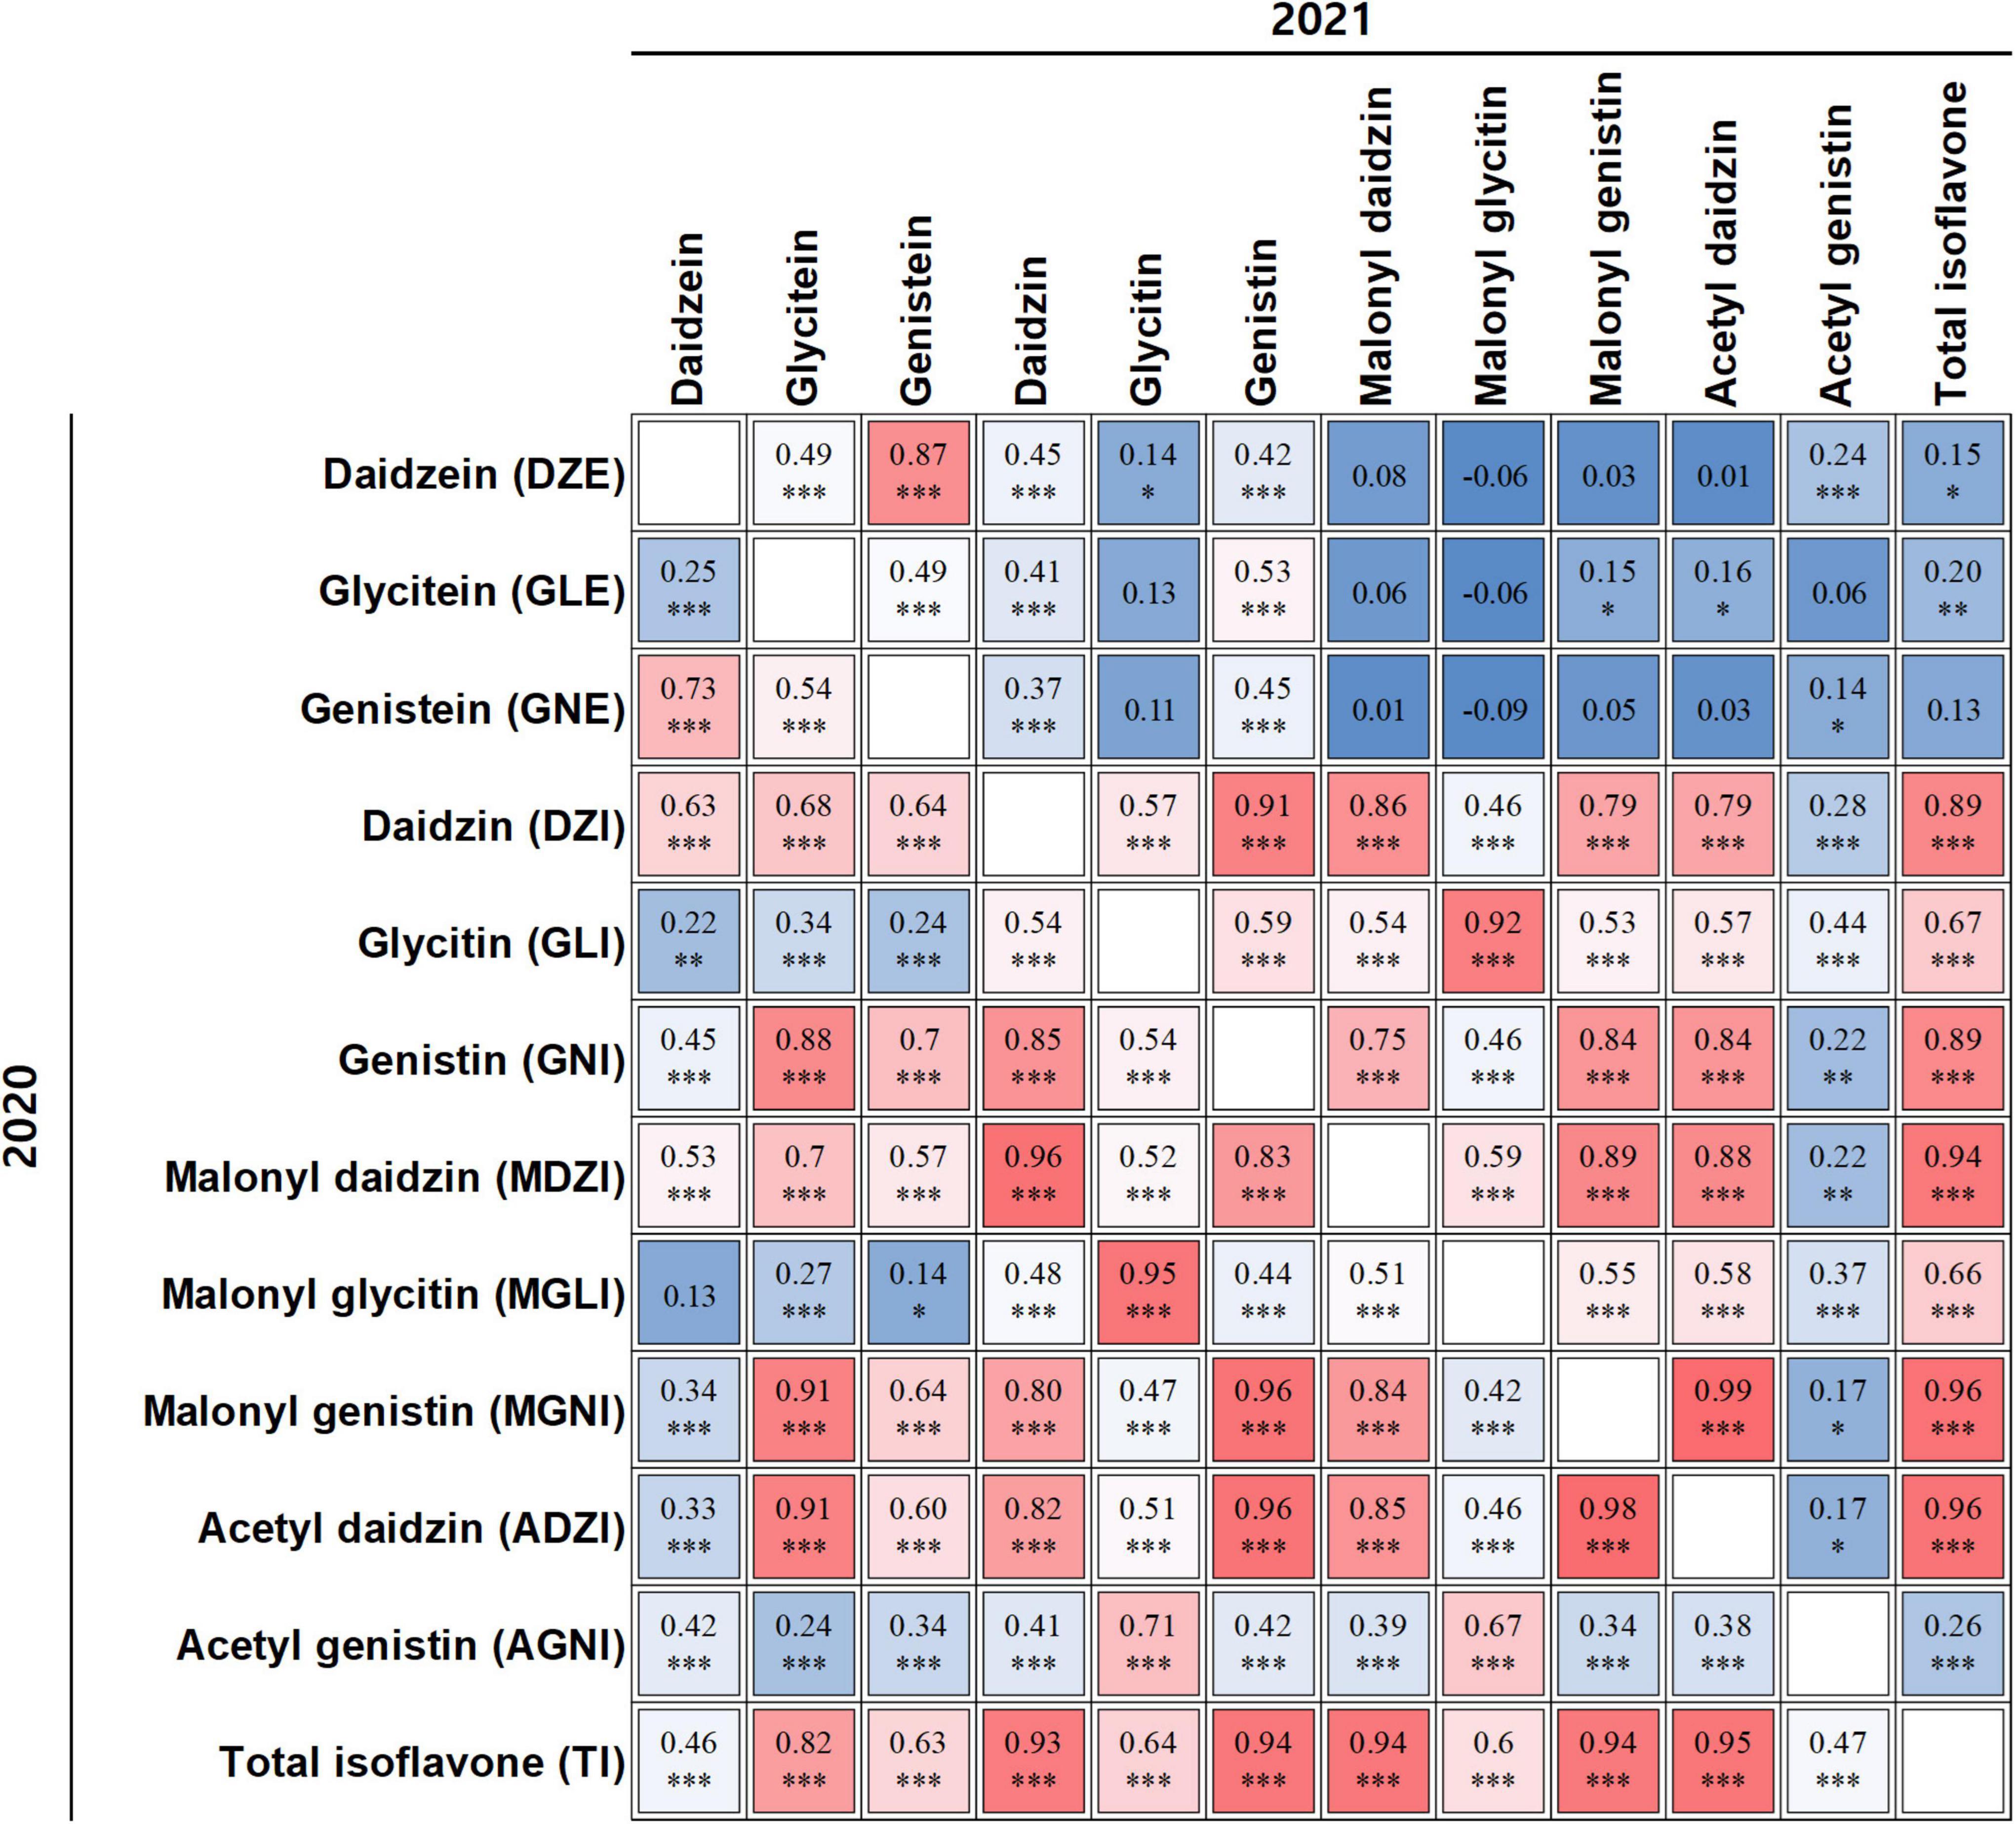
Figure 2. Correlation analyses among individual isoflavones and total isoflavones. Correlation coefficient in upper panel relates to isoflavone content data from 2021; that in lower panel relates to isoflavone content data from 2020. *, **, ***, and indicate significance at p < 0.05, 0.01, 0.001, and not significant, respectively.
We also detected positive correlations between DZI and GNI, between DZI and MDZI (r = 0.85–0.96, P < 0.001) and between GLI and MGLI (r = 0.92–0.95, P < 0.001). GNI and MDZI were positively correlated with MGNI and ADZI (r = 0.84–0.96, P < 0.001). Although GLE and GNE were positively correlated with MGNI and ADZI (r = 0.60–0.91, P < 0.001), GLE and GNE were positively correlated with GNI (r = 0.7–0.88, P < 0.001), and DZI was positively correlated with others (r = 0.63–0.68, P < 0.001) in 2020, these correlations were not significant or weak in 2021. This result indicated that correlations among isoflavones were subject to year effects as well as genetic factors.
The 25,646 SNPs (MAF < 0.01) were distributed across all the chromosomes, with frequencies ranging from 865 SNPs (3.37%, Chr. 12) to 2182 SNPs (8.51%, Chr. 18) per chromosome, with an average of 1,282 SNPs per chromosome. Thus, the SNPs were evenly distributed across all 20 soybean chromosomes in the MDP, and their number and distribution were sufficient for GWAS analysis. Of the 158 QTNs detected, 112 and 46 significant QTNs (LOD ≥ 3, p-value = 1.95 × 10⁻⁶) related to isoflavone contents were detected in 2020 and 2021, respectively. They were distributed across all chromosomes except for Chr. 12 and Chr. 17. The QTNs were detected using MLM and mrMLM methods (Figures 3, 4). Information for all QTNs is shown in Supplementary Tables 2, 3.
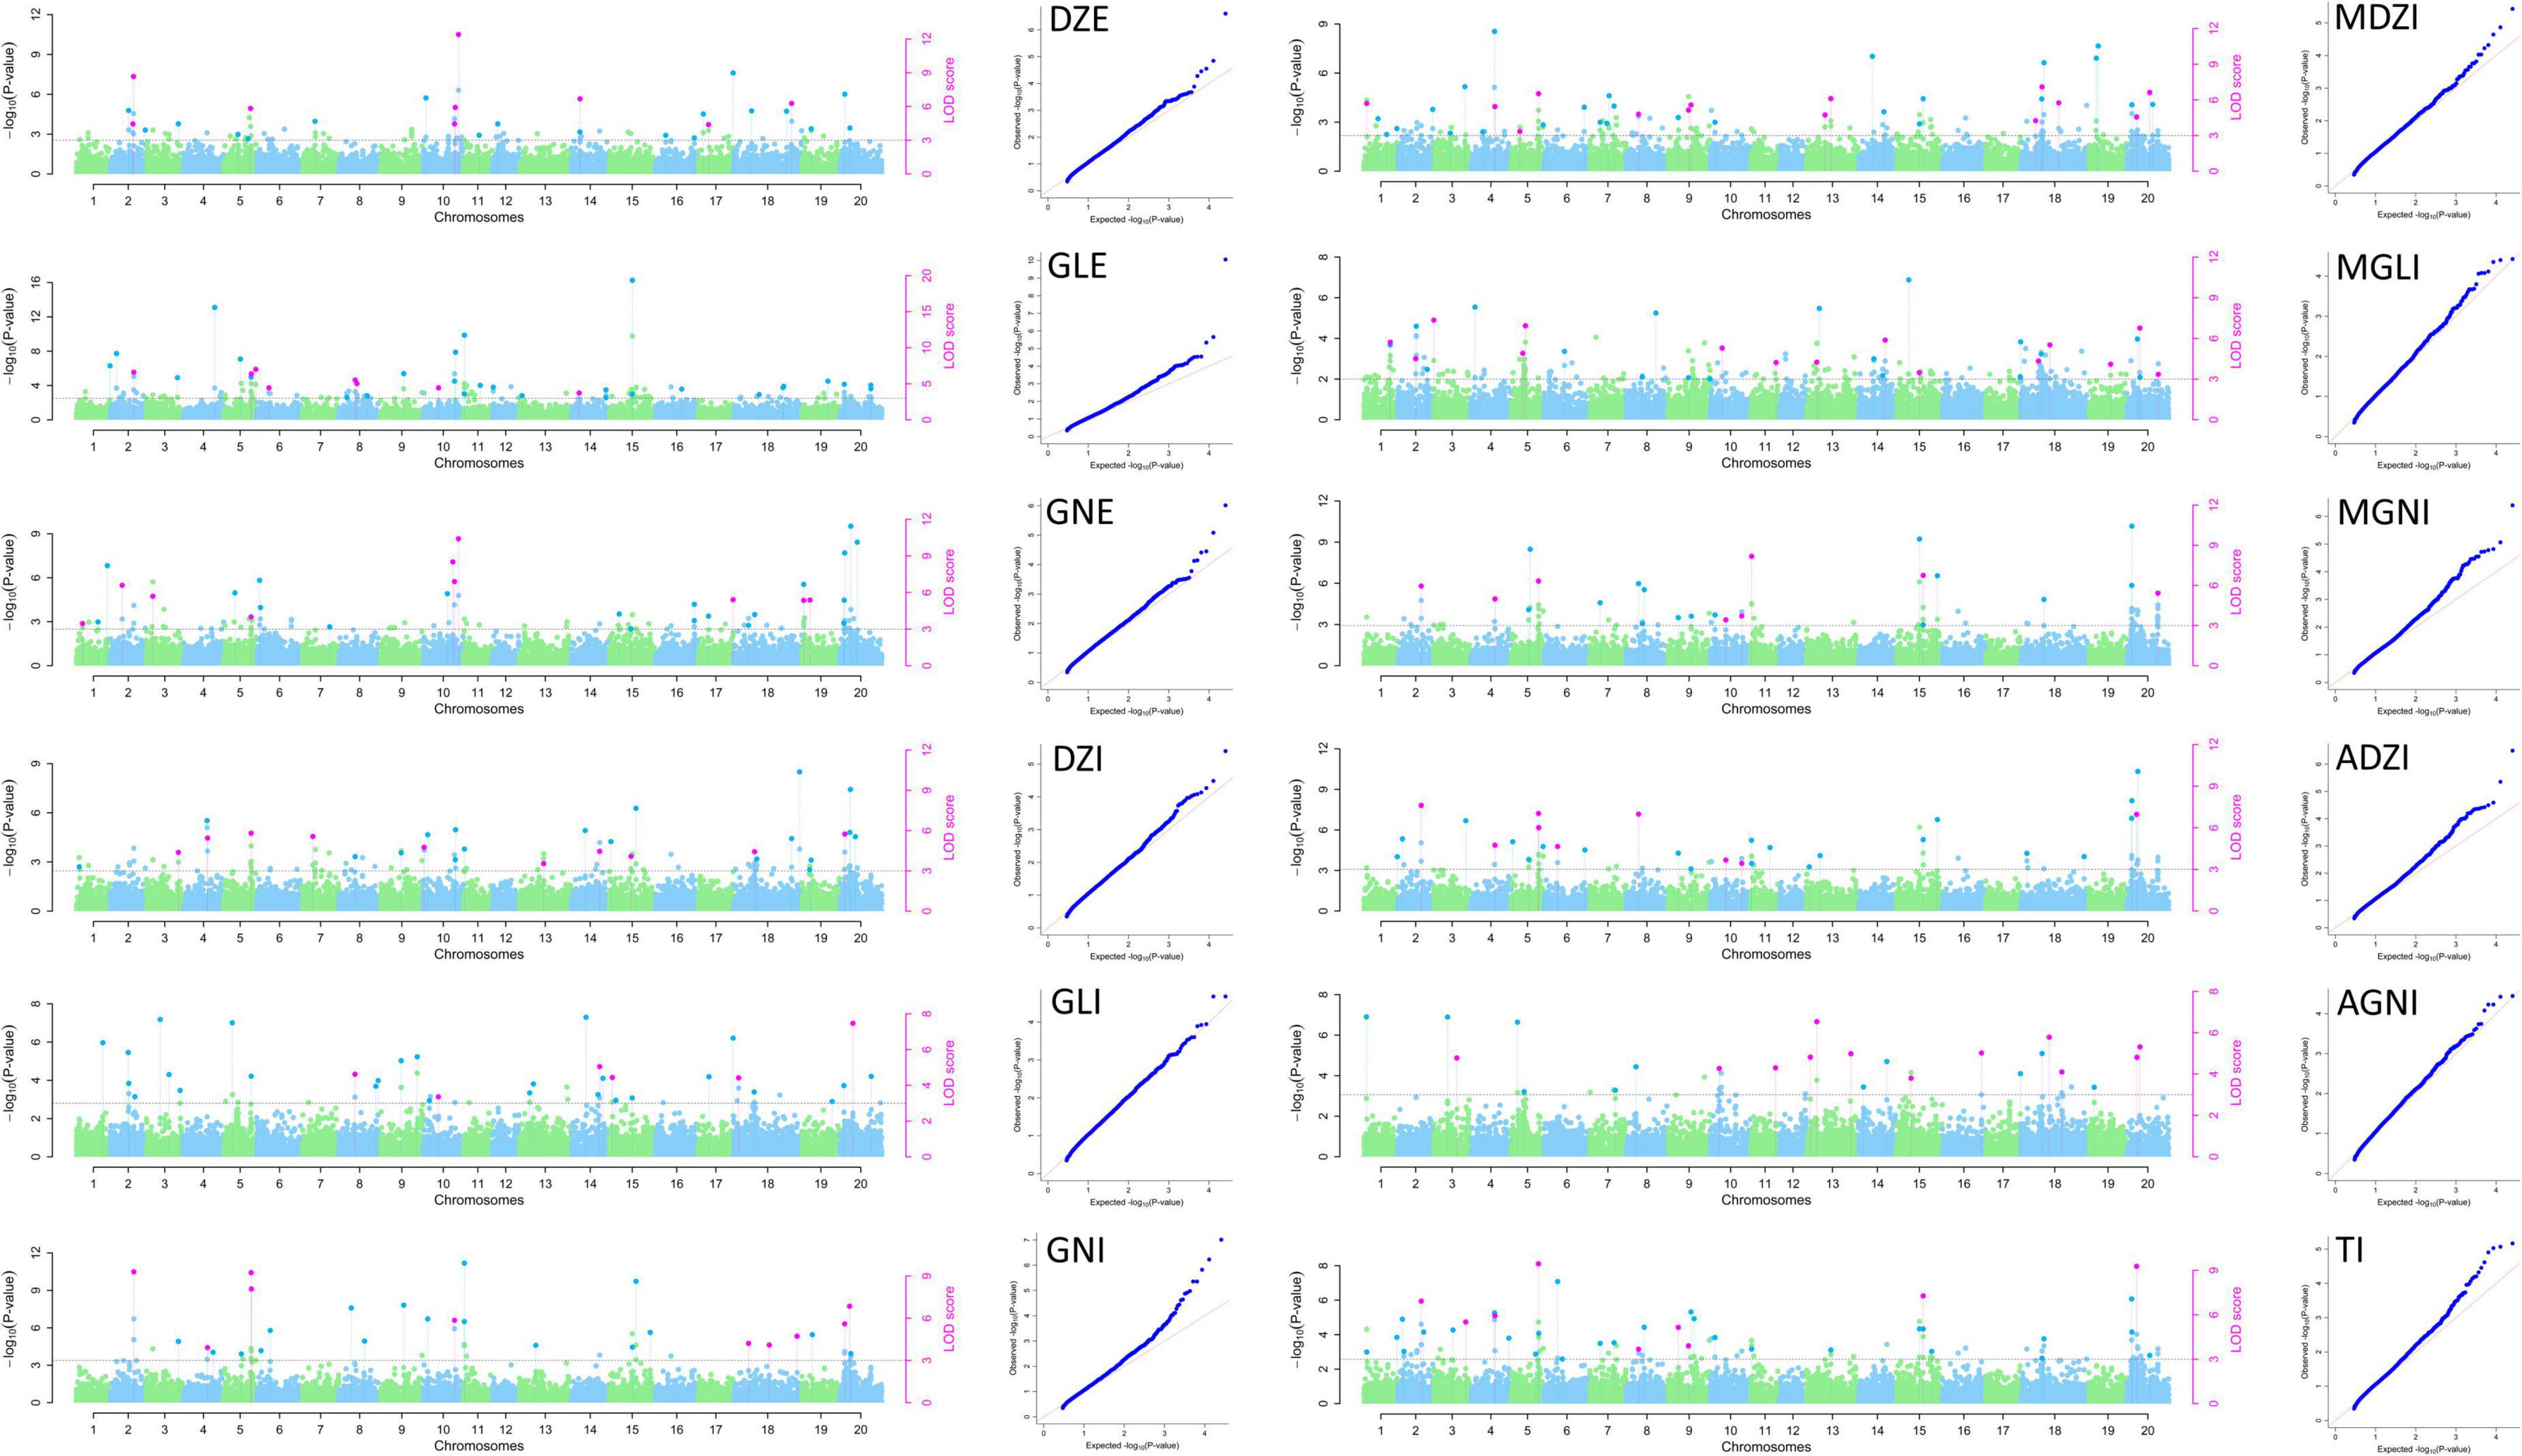
Figure 3. Manhattan and QQ plots for isoflavone contents in 2020 in the MDP using MLM and mrMLM.
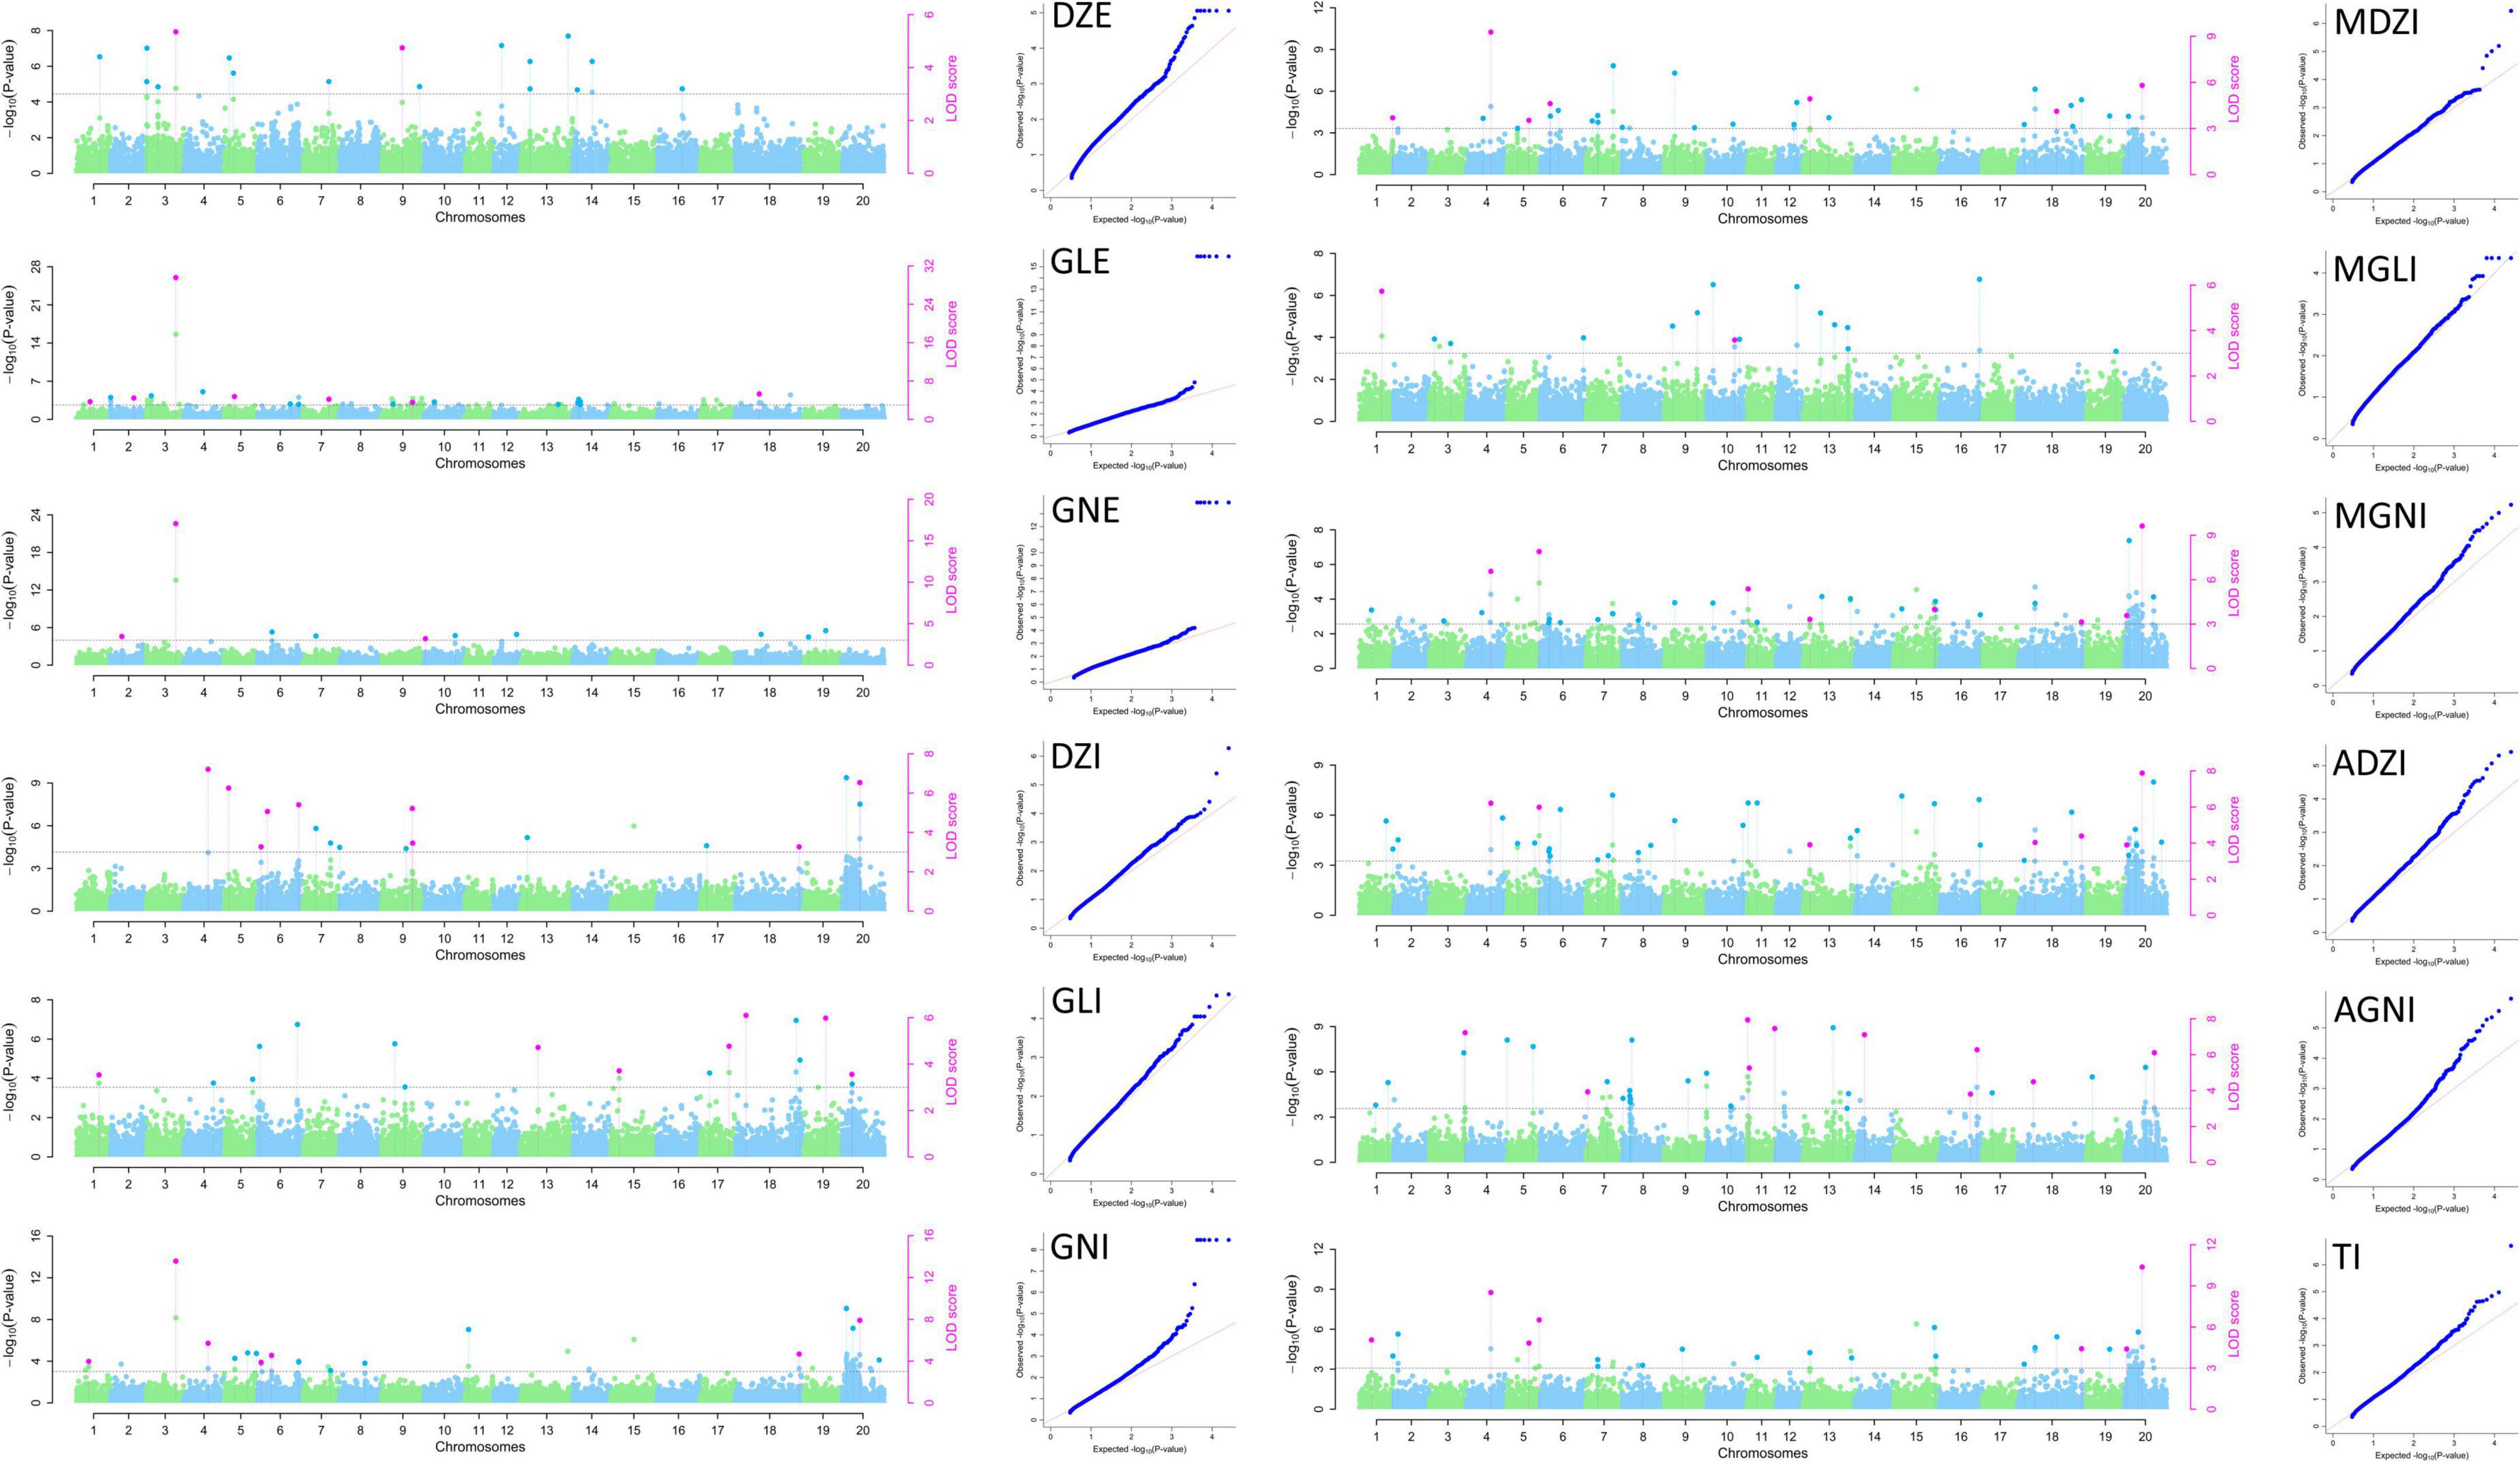
Figure 4. Manhattan and QQ plots for isoflavone contents in 2021 in the MDP using MLM and mrMLM.
We detected 112 QTNs related to isoflavone contents in 2020. These QTNs were located on 18 of the 20 soybean chromosomes (all except Chr. 12 and 17). The number of QTNs per chromosome ranged from one (Chr. 1, Chr. 6, Chr. 7, and Chr. 16) to 19 (Chr. 5 and Chr. 20). Of the QTNs significantly related to isoflavones detected in 2020 (LOD ≥ 3, -log10(P) ≥ 5.7), nine QTNs were related to DZE and explained 1.71–27.89% of the variation in DZE content (–1.80 to 16.51 μg g–1). They were located on Chr. 2, 5, 10, 14, 18, and 20. The 10 QTNs for GLE were located on chromosomes 2, 5, 8, 9, 10, 11, and 20, and explained 1.67%–17.25% of the variation in GLE content (–3.05 to 8.93 μg g–1). Ten QTNs for GNE were located on Chr. 3, 5, 10, 19, and 20, and explained 2.52–22.62% of the variation in GNE content (–2.25 to 12.91 μg g–1). The nine QTNs for DZI were located on chromosomes 4, 5, 7, 14, 15, 18, and 20 and explained 6.50–18.18% of variation in QTN content (–117.49 to 385.37 μg g–1). The three QTNs for GLI were located on Chr. 14, 18, and 20 and explained 5.86–21.53% of the variation in QTN content (22.45–73.22 μg g–1). The 13 QTNs for GNI were located on chromosomes 2, 5, 10, 11, 15, 18, and 20 and explained 0.16–22.36% of the variation in GNI content (–324.75 to 525.77 μg g–1). The 12 QTNs for MDZI were located on Chr. 4, 5, 8, 9, 13, 18, and 20, and explained 2.07–16.67% of the variation in MDZI content (–316.48 to 891.52 μg g–1). The 8 QTNs for MGLI were located on chromosomes 1, 2, 3, 5, 14, 18, and 20 and explained 2.29–16.74% of the variation in MGLI content (–64.00 to 106.65 μg g–1). The 11 QTNs for MGNI were located on chromosomes 2, 4, 5, 11, 15, and 20, and explained 2.12–21.77% of the variation in MGNI content (–999.45 to 1261.72 μg g–1). The 12 QTNs for ADZI were located on chromosomes 2, 4, 5, 6, 8, 11, 15, and 20, and explained 3.80–19.31% of the variation in ADZI content (–31.76 to 77.35 μg g–1). The seven QTNs for AGNI were located on chromosomes 11, 13, 16, 18 and 20, and explained 4.21–14.11% of the variation in AGNI content (–0.60 to 0.57 μg g–1). The 8 QTNs for TI were located on chromosomes 2, 3, 4, 5, 9, 15, and 20, and explained 2.81–18.31% of the variation in TI content (–3115.80 to 2665.47 μg g–1).
Of the 122 QTNs detected in 2020, 12 QTNs were detected for two or more types of isoflavones and using more than one GWAS analysis method. These 12 QTNs were located on Chr. 2, 4, 5, 8, 9, 10, 11, 14, 15, and 20 (Table 2).
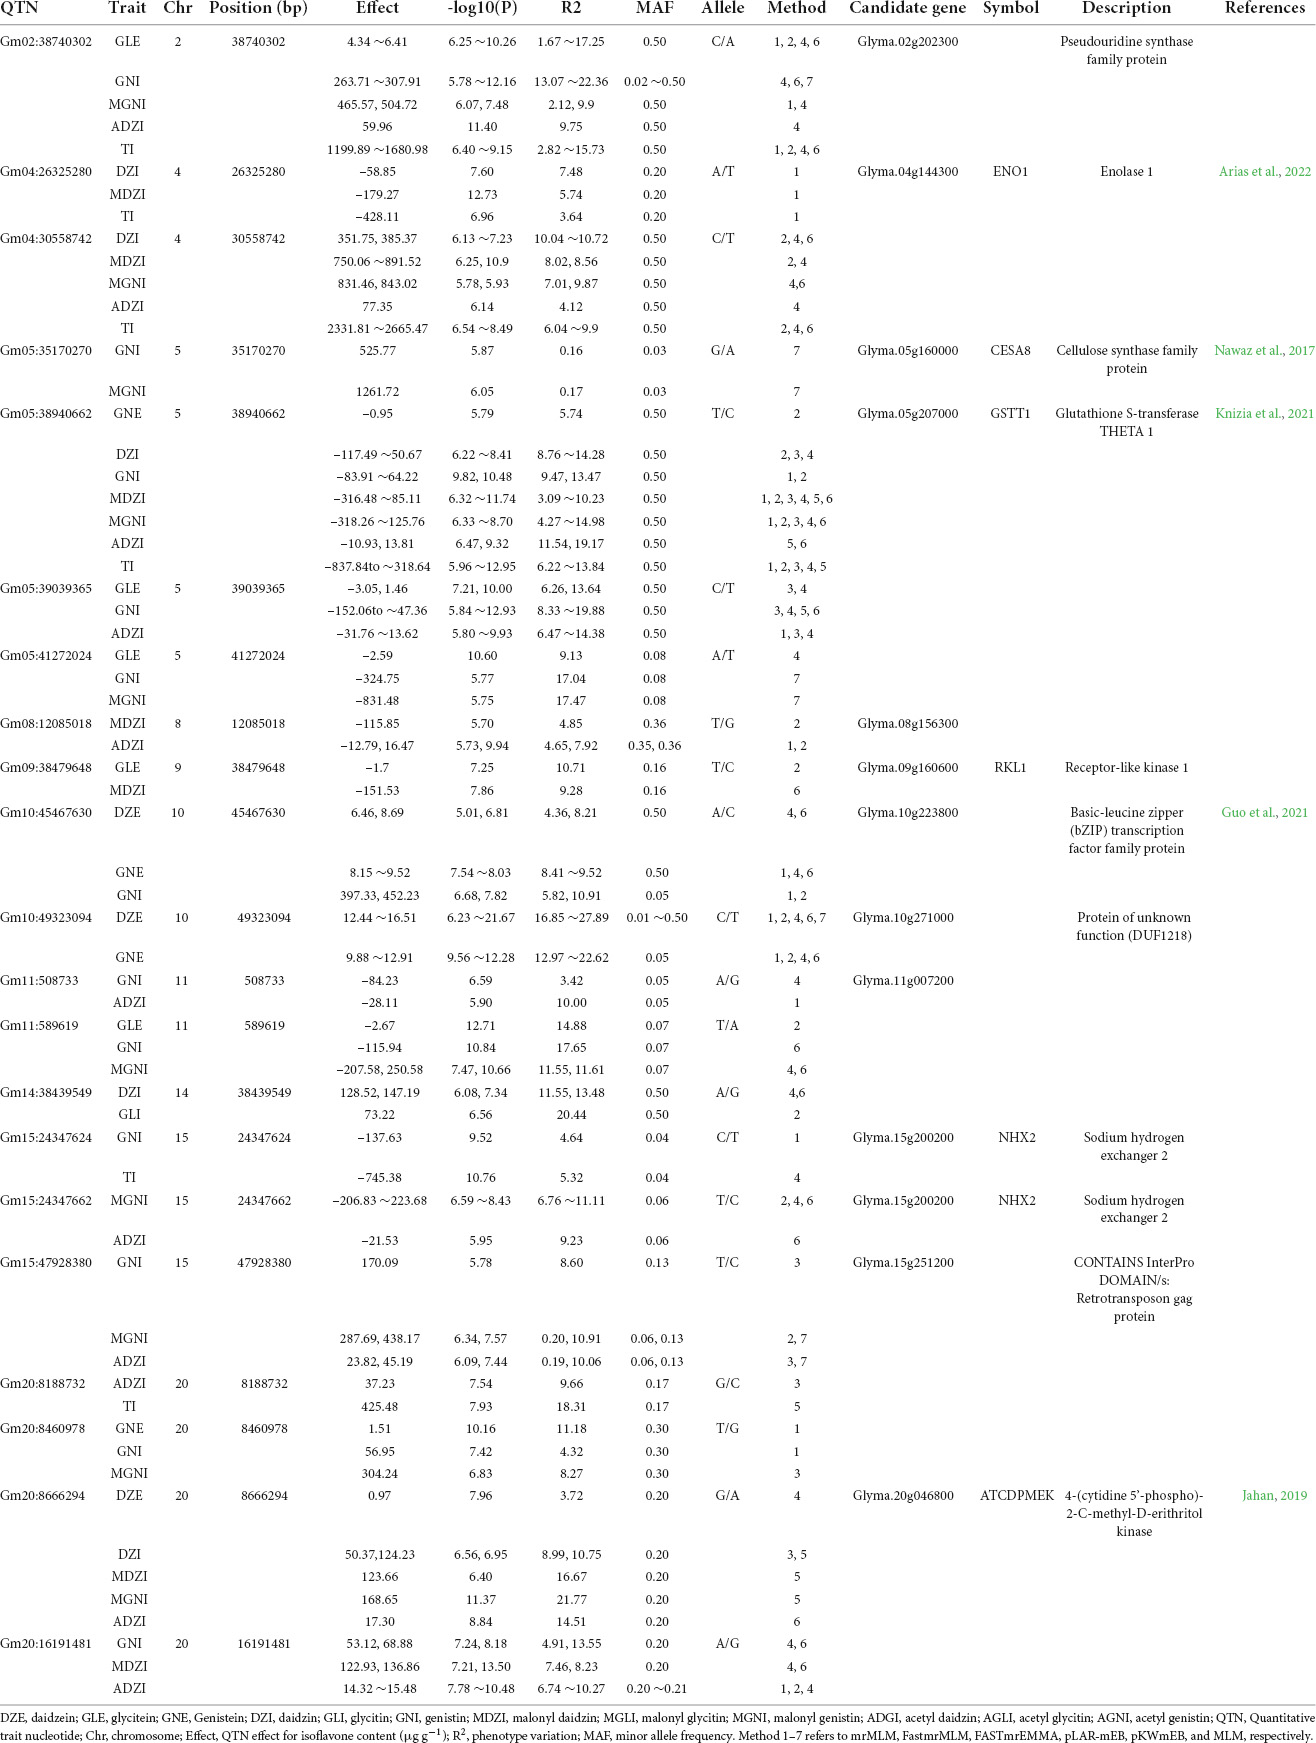
Table 2. Information about co-detected QTNs for isoflavone contents in 2020 using MLM-based models.
We detected 46 QTNs related to isoflavones content in 2021. They were located on 16 of the 20 soybean chromosomes (all except Chr. 2, 8, 12, and 15). The one QTNs related to DZE were located on Chr. 3 and explained 12.30% of the variation in DZE content (16.30 μg g–1). The three QTNs for GLE were located on Chr. 3, 7 and 18 and explained 6.07–58.24% of the variation in GLE content (9.22–29.05 μg g–1). The two QTNs for GNE were located on Chr. 3 and 10, and explained 17.00–57.37% of the variation in GNE content (16.00–39.51 μg g–1). The six QTNs for DZI were located on Chr. 4, 5, 6, 9, and 20, and explained 2.95–19.67% of the variation in DZI content (–41.34 to 366.70 μg g–1). The three QTNs for GLI were located on Chr. 17, 18, and 19, and explained 5.74–25.26% of the variation in GLI content (–27.80 to 19.54 μg g–1). The five QTNs for GNI were located on Chr. 3, 4, 6, 18, and 20, and explained 4.66–26.02% of the variation in GNI content (–75.44 to 617.89 μg g–1). The four QTNs for MDZI were located on Chr. 4, 7, 13, and 20, and explained 6.04–22.13% of the variation in MDZI content (–116.13 to 1241.39 μg g–1). One QTN for MGLI was located on Chr. 1, and explained 4.01% of the variation in MGLI content (–140.64 μg g–1). The four QTNs for MGNI were located on Chr. 1, 4, 5, and 20, and explained 6.37–21.93% of the variation in MGNI content (–245.86 to 1199.61 μg g–1). The five QTNs for ADZI were located on Chr. 4, 5, 18, and 20, and explained 5.23–21.18% of the variation in ADZI content (–19.42 to 105.52 μg g–1). The seven QTNs for AGNI were located on Chr. 3, 11, 14, 16, and 20, and explained 8.13–34.48% of the variation in AGNI content (–1.60 to 3.31 μg g–1). The five QTNs for TI were located on Chr. 1, 4, 5, and 20 and explained 4.34–21.35% of the variation in TI content (–524.76 to 3212.93 μg g–1).
Of the 46 QTN detected in 2021, 5 QTNs were detected for two or more types of isoflavones and using more than one GWAS analysis method. These 5 QTNs were located on Chr. 3, 4, 5, 18, and 20 (Table 3).
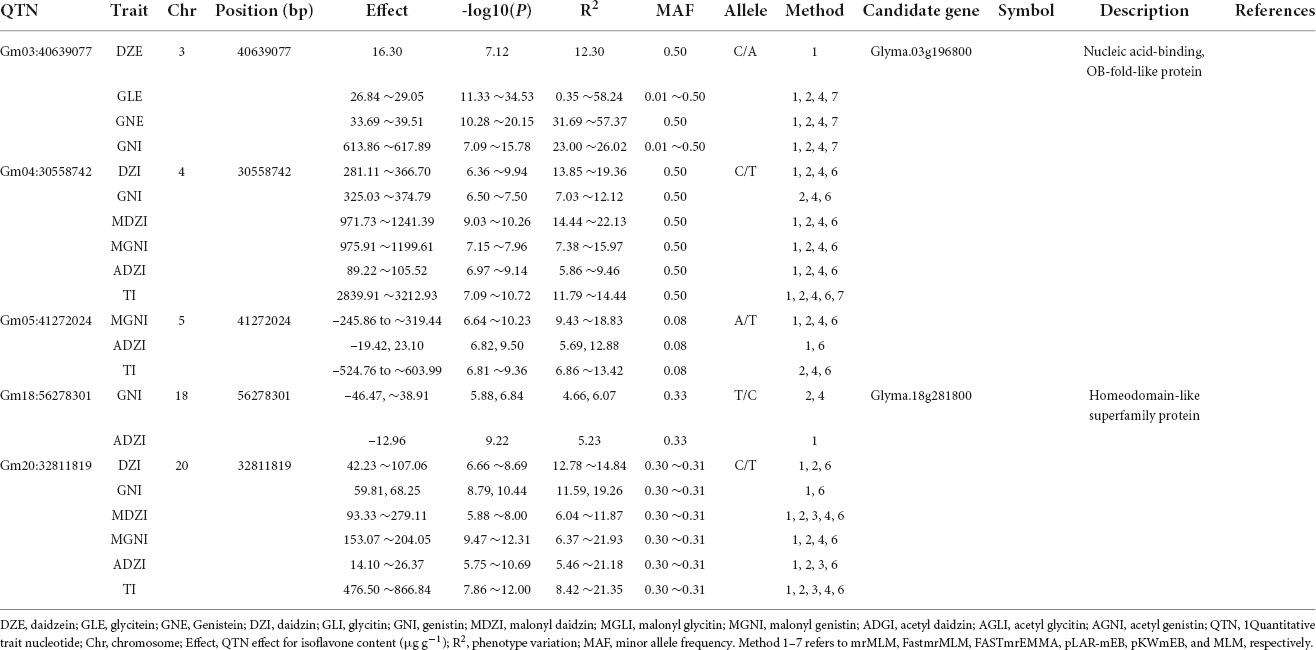
Table 3. Information about co-detected QTNs for isoflavone contents in 2021 using MLM-based models.
To explore the genetic basis of isoflavone biosynthesis, we estimated the genome-wide average of LD decay using the genotype dataset of 25,646 SNPs. The LD half decay distance was approximately 441 kb (Figure 5A). Significant QTNs located around Gm05:38940662 (Glyma.05g207000) on chromosome 5 were detected by multiple models (MLM, mrMLM, FASTmrMLM, FASTmrEMMA, pLARmEB, pKWmEB, and ISIS EM-BLASSO) in 2020, and were related to the contents of six individual isoflavones (GNE, DZI, GNI, MDZI, MGNI, and ADZI) and TI. A total of 44 QTNs were detected in a 441-kb interval surrounding Gm05:38940662. Of these, four QTNs (Gm05:38936166, Gm05:38936167, Gm05:38940662 and Gm05:38940717) were significantly associated with variations in isoflavone contents (Figure 5B). Two of those QTNs (Gm05:38936166 and Gm05:38936167) were located at the 3’-untranslated region (UTR) of Glyma.05g206900 (a gene encoding glutathione S-transferase THETA1; GSTT1), and the other two (Gm05:38940662 and Gm05:38940717) were located at the 3’-UTR and caused non-synonymous substitutions in the coding sequence (CDS) of Glyma.05g207000 (a gene on chromosome 5 encoding another GSTT1). The QTNs at Gm05:38936166 and Gm05:38940662 caused transitions (A/G and C/T) and the QTN at Gm05:38936167 resulted in a transversion. The QTN at Gm05:38940717 resulted in a predicted amino acid substitution from threonine to isoleucine (Figure 5C).
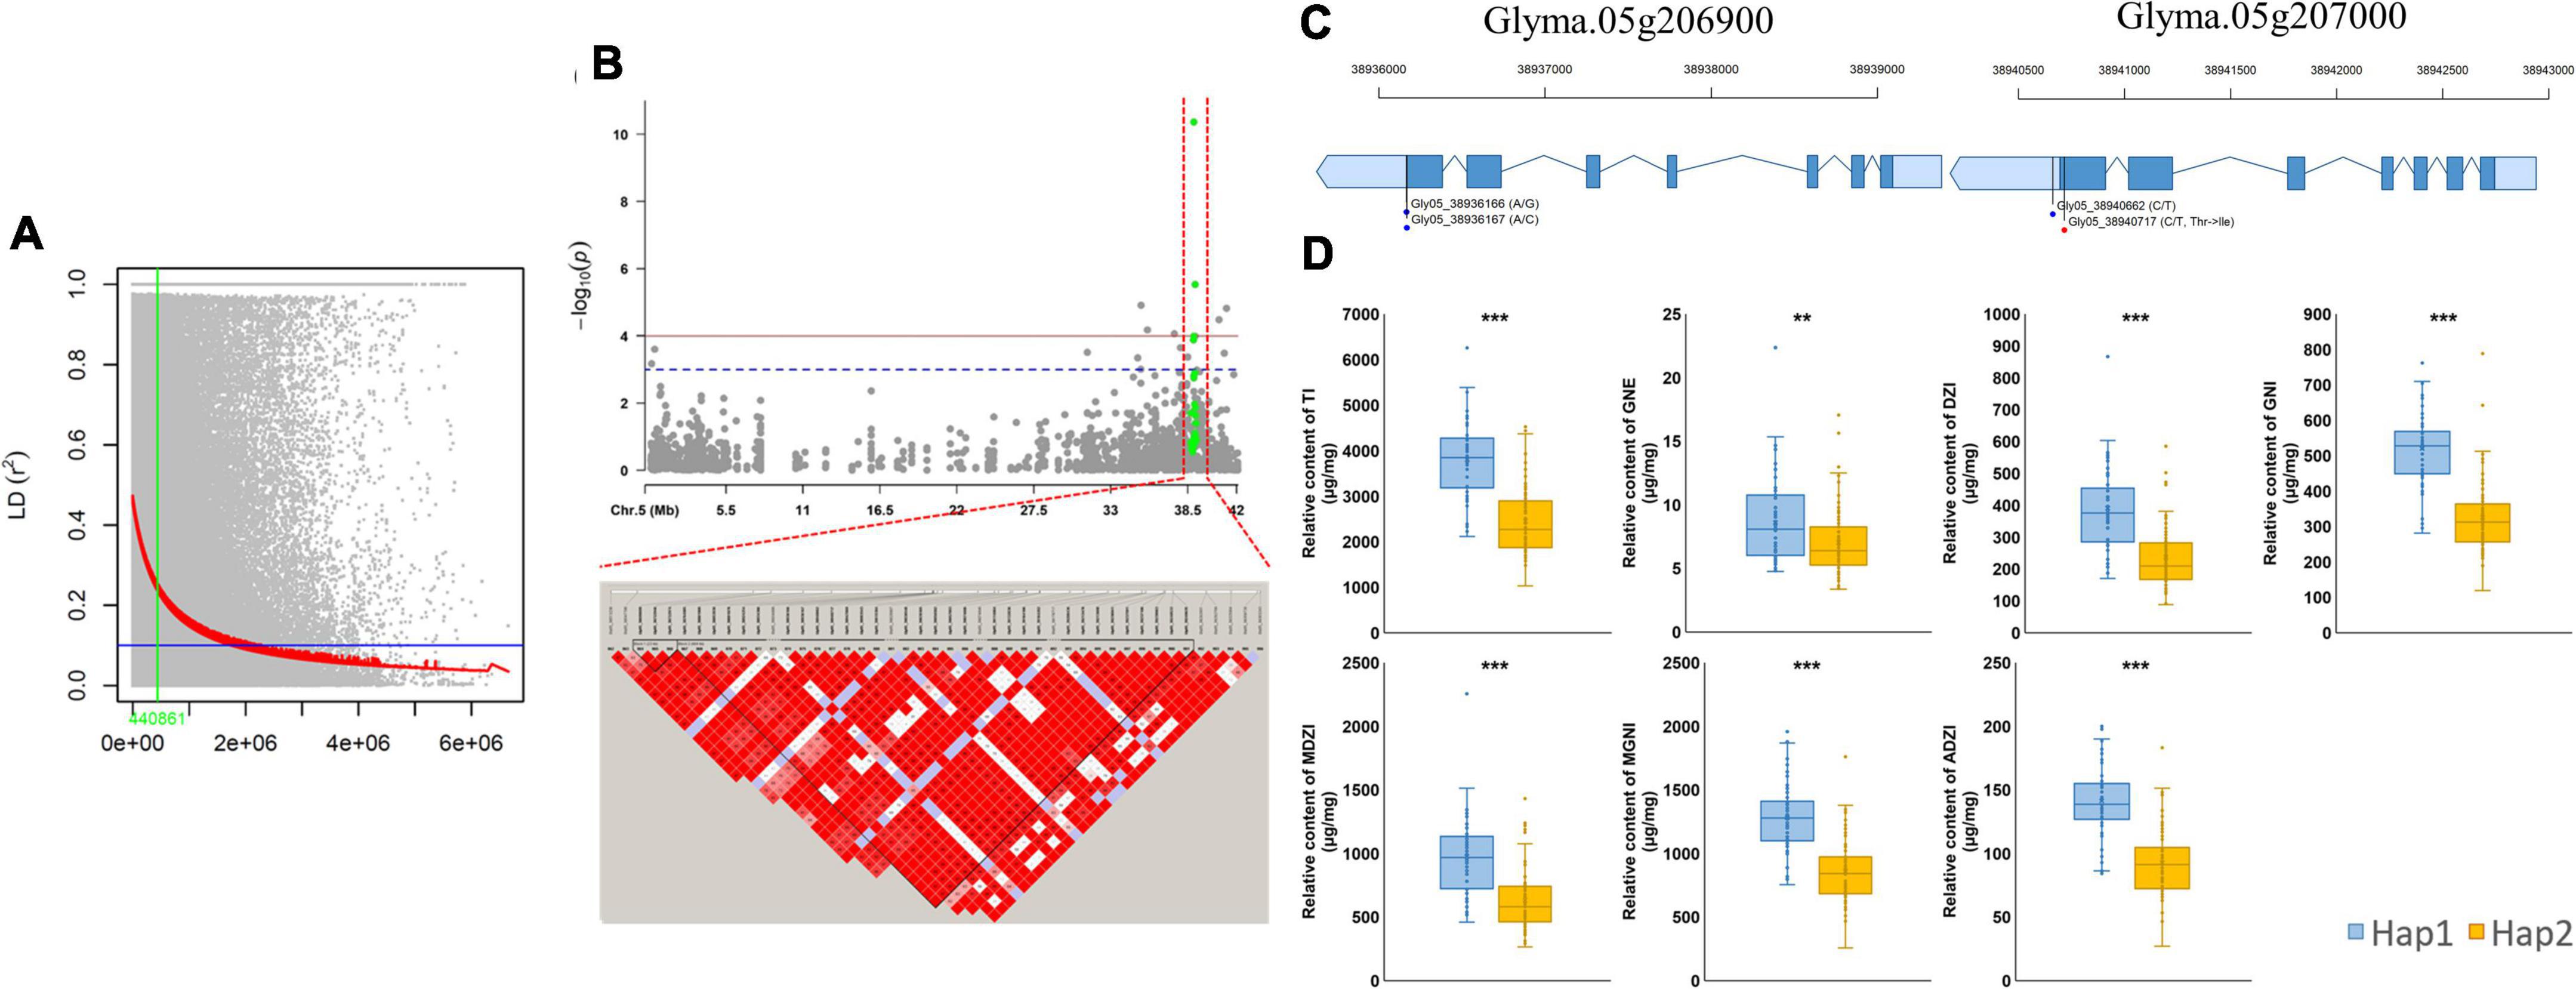
Figure 5. Linkage disequilibrium (LD) analysis of Gm05:38940662 (GmGSTT1) and variations in isoflavone contents between haplotypes. (A) Genome-wide average LD decay (R2) of MDP; (B) association mapping for Gm05:38940662 and LD analysis based on isoflavone contents; (C) gene models of GmGSTT1 (Glyma.05g206900 and Glyma.05g207000); (D) isoflavone contents in different haplotypes.
To compare the isoflavone contents based on these four QTNs, a subset of 137 soybean mutants with variable isoflavone contents was divided into two haplotypes (Hap1 and Hap2) (Figure 5D). The mean contents of the following seven isoflavones were significantly different between Hap 1 (58 genotypes) and Hap 2 (79 genotypes): TI [hap1 (3806.44 μg g–1) and hap2 (2448.48 μg g–1), p < 0.001], GNE [hap1 (8.59 μg g–1) and hap2 (7.03 μg g–1), p < 0.01], DZI [hap1 (390.40 μg g–1) and hap2 (236.20 μg g–1), p < 0.001], GNI [hap1 (519.64 μg g–1) and hap2 (325.42 μg g–1), p < 0.001], MDZI [hap1 (974.80 μg g–1) and hap2 (632.11 μg g–1), p < 0.001], MGNI [hap1 (1281.23 μg g–1) and hap2 (857.82 μg g–1), p < 0.001], ADZI [hap1 (141.21 μg g–1) and hap2 (92.73 μg g–1), p < 0.001].
To explore the transcriptional patterns of GmGSTT1 (Glyma.05g206900 and Glyma.05g207000) and those of the core isoflavone biosynthesis genes IFS1 and IFS2, we conducted quantitative real-time PCR (qRT-PCR) analyses using seeds of Danbaek (DB) and its mutant (DB-088) with low and high isoflavone contents, respectively. These two lines were selected from the 189 members of the MDP as shown in Figure 6A. Consistent with the predicted effects of the QTNs, the contents of the isoflavones GNE, DZI, DZI, MDZI, MGNI, ADZI, and TI were significantly higher in seeds of DB088 than in those of DB. The qRT-PCR analyses confirmed differences in gene transcript levels between the two genotypes (Figure 6B). The relative transcript levels of GST1-1 (Glyma.05g206900) and GST1-2 (Glyma.05g207000) were 1.96-fold (p < 0.01) and 1.76-fold (p < 0.05) higher, respectively, in the seeds of DB088 than in the seeds of DB. Interestingly, IFS1 and IFS2 also showed higher transcript levels in the seeds of DB088 than in the seeds of DB, with similar transcriptional patterns to that of GmGSTT1. The transcript level of IFS1 in seeds of DB-088 was 3.71-fold (p < 0.001) that in seeds of DB, and the transcript level of IFS2 in DB-088 was 2.32-fold (p < 0.001) that in DB. These results suggested that GmGSTT1 is involved in isoflavone synthesis in soybean seeds.
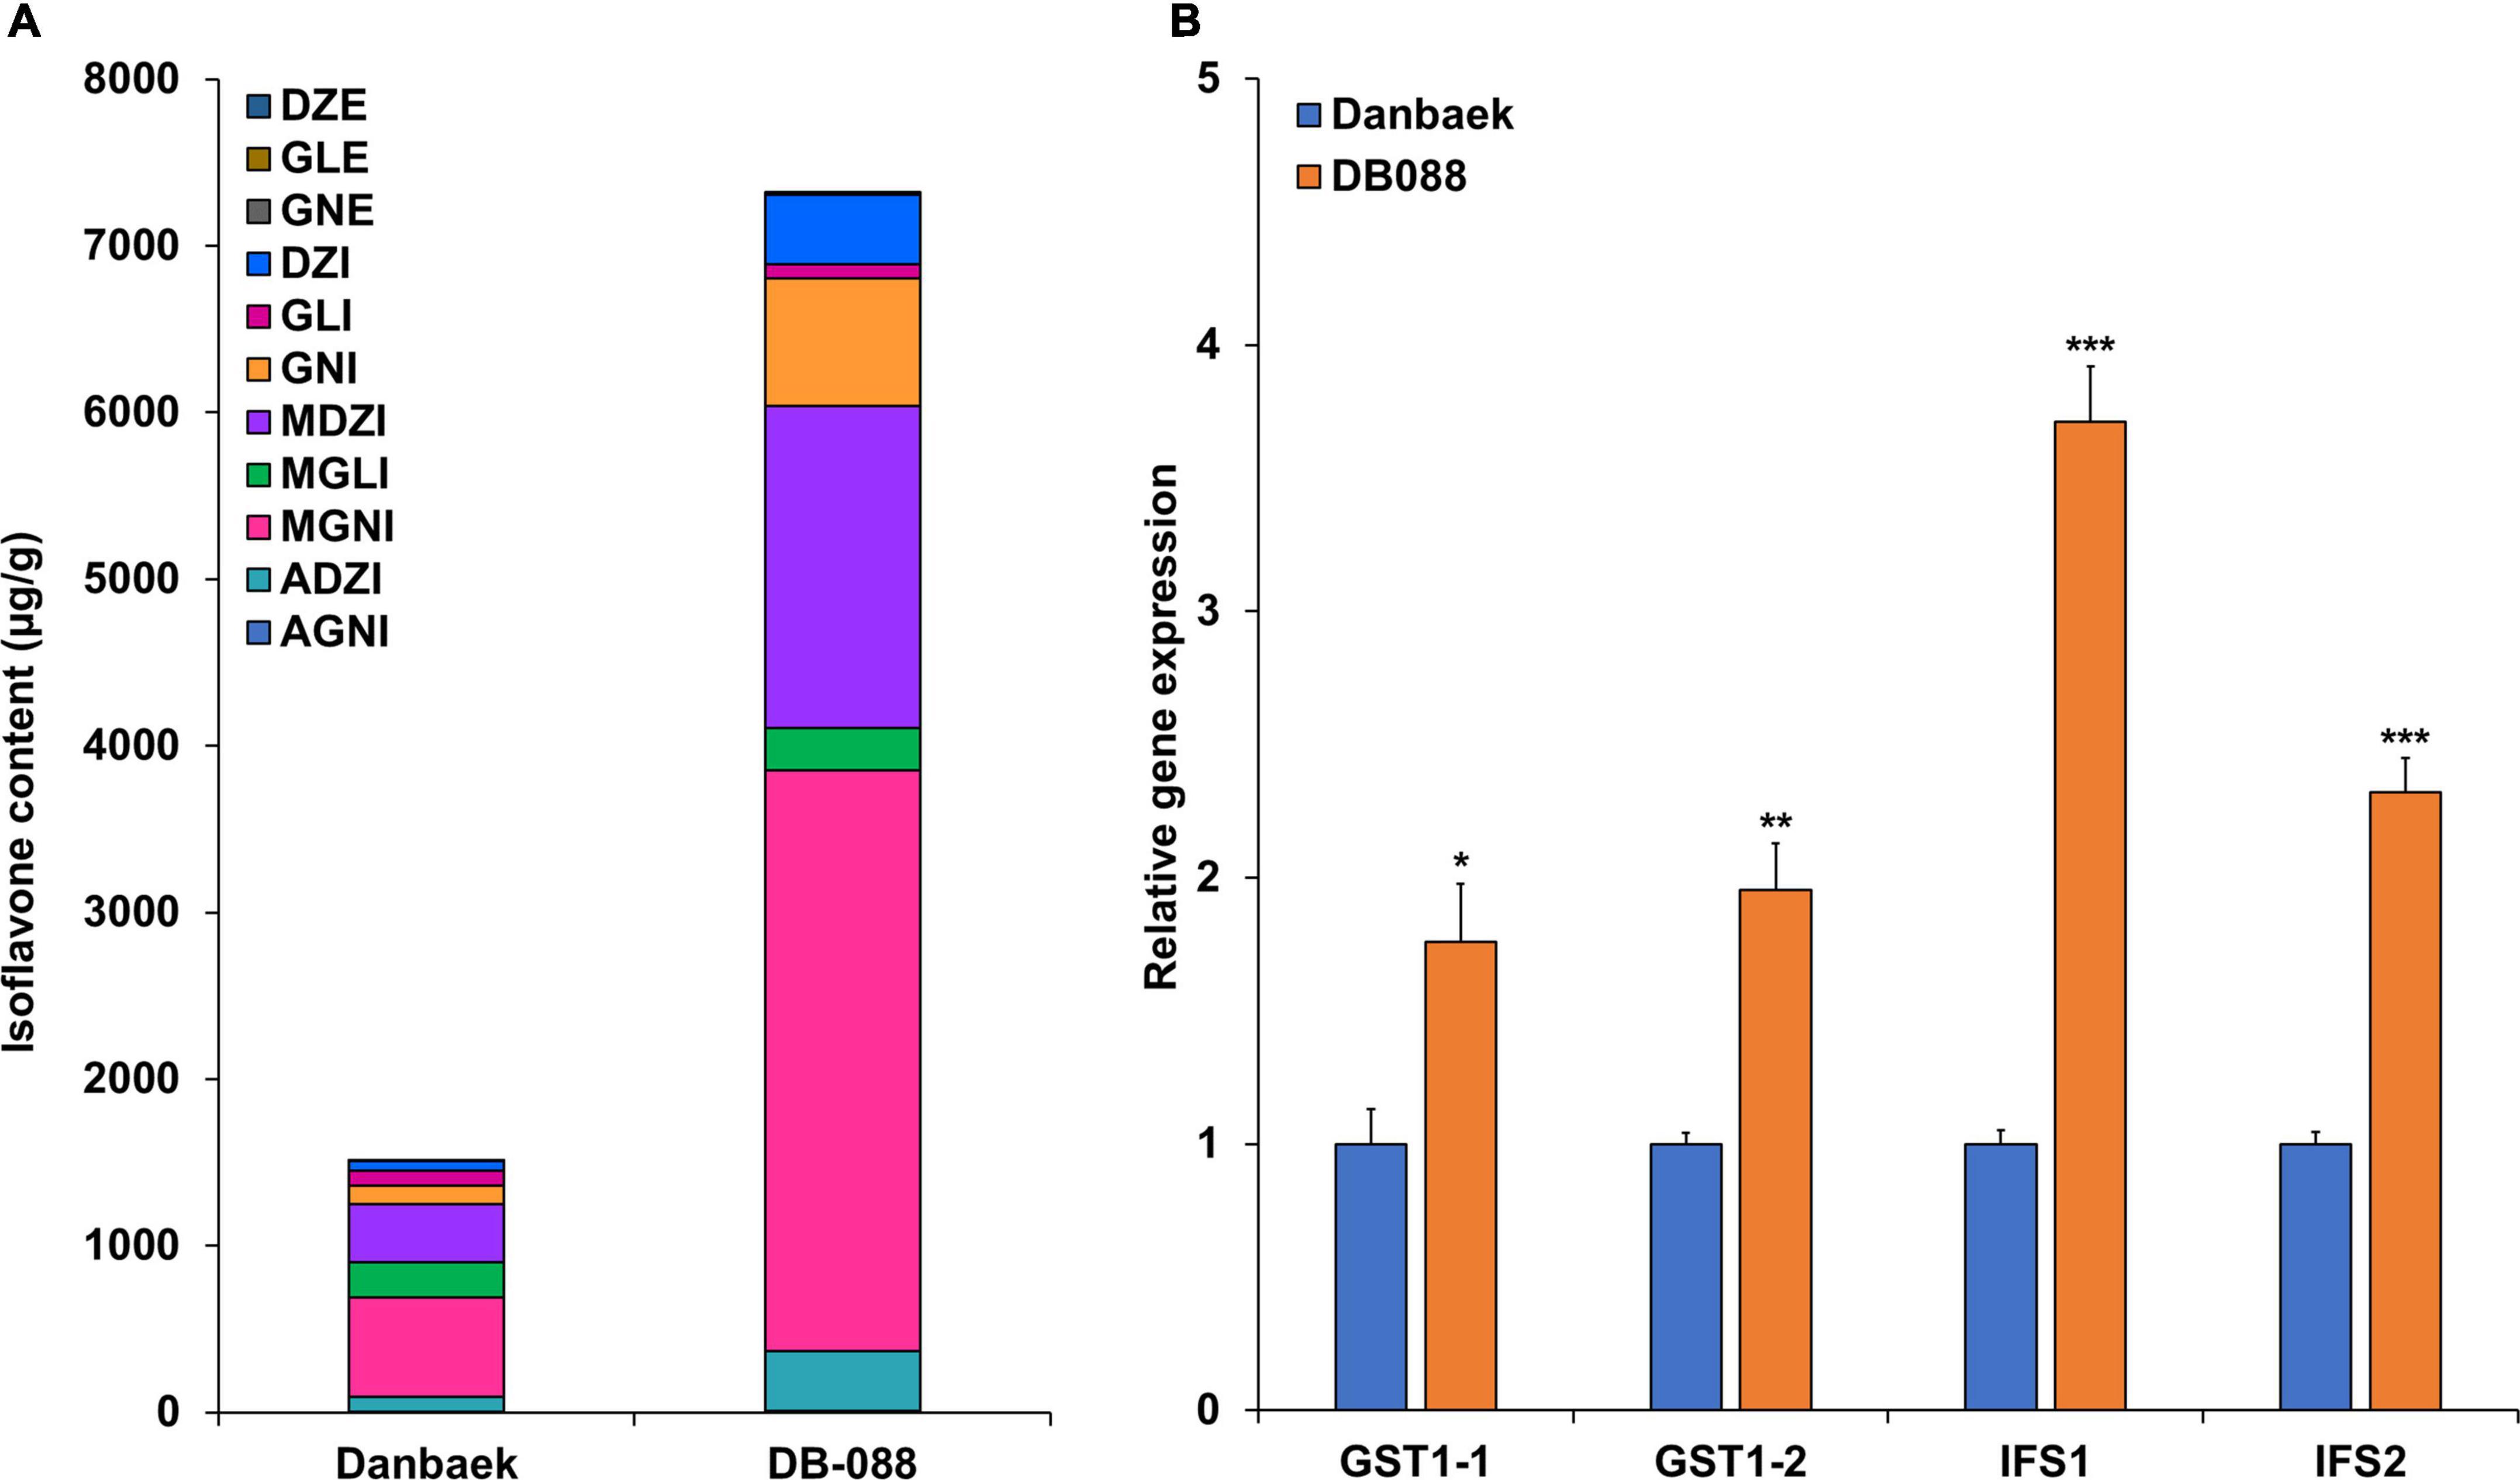
Figure 6. Transcript levels of GmGSTT1 and other isoflavone biosynthetic genes in original cultivar (DB) and its mutant (DB-088), and isoflavone contents. (A) Isoflavone content in DB and DB-088; (B) relative gene transcript levels in DB and DB-088. All data are means ± SD (n = 5). The * p < 0.05, ** < 0.01, and ** < 0.001, Student’s t-test.
This core collection constructed by mutation breeding has previously been used in GWAS and linkage mapping studies to dissect important QTLs and candidate genes associated with quantitative and qualitative traits for crop improvement. Kim et al. (2019) constructed a bi-parental mapping population derived from the high-stearic acid mutant soybean Hfa180 with a three-base-pair deletion in exon 1 of GmSACPD-C. This mutation leads to a high stearic acid content and was developed using mutated alleles. In the population derived from this mutant, Kompetitive allele-specific PCR markers were used to identify a subset of high-stearic acid soybean lines. Hwang et al. (2020) performed GWAS analysis of a core rice mutant population (2,561 individuals) induced by gamma-ray irradiation. This population was subjected to abiotic stress treatments. Then, whole-genome resequencing analyses revealed a candidate gene for stress tolerance (Os02g0528900, encoding a PDR-like-ABC transporter) with two SNPs. Ma et al. (2022) used QTL mapping with bulk segregant analysis and GBS methods to detect the QTL for the dwarf phenotype of the mutant upland cotton line Ari1327. Thus, the use of GWAS or linkage mapping combined with a mutation breeding population is ideal for genome-wide mapping studies to explore the basis of complex agronomic traits.
To reveal causal genes associated with isoflavone content, we first conducted a GBS-based GWAS using multiple statistical methods, including MLM and mrMLM, to analyze data from a mutant mapping population consisting of 189 soybean mutant genotypes. The multi-locus random-SNP-effect mrMLM, which was developed by Zhang et al. (2020), includes six methods: mrMLM, FASTmrMLM, FASTmrEMMA, pLARmEB, pKWmEB, and ISIS EM-BLASSO. Unlike the conservative MLM model, the mrMLM method has been widely used to detect many important QTNs. The mrMLM estimated potentially significant QTNs based on empirical Bayes. Even if the significance threshold is less stringent, mrMLM have robust statistics, accuracy, short running time, and a low false positive rate (Cui et al., 2018; Guan et al., 2019; Zhang et al., 2020).
The isoflavone contents in the mutant population varied significantly between 2020 and 2021 because of complex heritability as well as external factors. In this study, the largest decrease was detected for aglycones (reduced by 50.39% in 2021 compared with that in 2020), followed by glucosides, total isoflavones, acetyl-glucosides, and malonyl-glucosides (reduced by 38.36, 24.28, 24.24, and 18.15% in 2021 compared with those in 2020, respectively). Thus, all of the isoflavones detected were affected by genotype, year, and the genotype × year interaction (Table 1). In previous studies, one soybean cultivar showed a 3.6-fold variation in isoflavone contents among different sites in the same year, and variations of up to 1.5-fold across different years (Eldridge and Kwolek, 1983); and the contents of individual isoflavones showed variations between 2 years ranging from 16.6% (MDZI) to 400% (GLE), and variations among eight planting locations ranging from 20.9% (MDZI) to 400% (GLE) (Hoeck et al., 2000). Factors that affect the contents of secondary metabolites in soybean seeds include temperature, location, sowing date, the type of fertilizer used, and the developmental stage of the seeds. Previous studies have demonstrated that high temperatures can lead to decreased contents of isoflavones and fatty acids (but not saponins) in soybean seeds. Similarly, isoflavone contents were found to be 5.8-fold lower in soybean varieties cultivated with early sowing dates (April and May) than in those cultivated with later sowing dates (June and July) (Tsukamoto et al., 1995). Another study showed that a shift from high to low temperature increased total isoflavone contents by 2.5-fold, with daidzein showing the largest increase of 3-fold (Lozovaya et al., 2005).
In our study, for those isoflavones showing a normal distribution in their contents in the MDP population, the broad-sense heritability ranged from 15% (GLE) to 86% (TI and ADZI) across the 2 years. Consistent with our results, a previous study detected heritability of TI ranging from 87.2 to 93.8% in individual and multiple environments. Meng et al. (2016) and Chu et al. (2017) detected broad-sense heritability of major isoflavone components ranging from 67.80% (GNE) to 83.80% (GLE) and from 87.2 to 93.8% (TI) across years and locations, respectively. However, Primomo et al. (2005) and Zeng et al. (2009) estimated the heritability for isoflavones to be lower than 60% based on multiple interactions. Overall, our results and those of other studies suggest that isoflavone contents in soybean seeds are more influenced by genetic effects than by year effects, indicating that isoflavone contents in soybean seeds are traits that can be genetically manipulated. We conducted correlation analyses for 12 types of isoflavones across two years (2020 and 2021), and detected strong positive correlations between total isoflavones and glucosides [DZI, GLI, and GNI (r = 0.64–0.94 in 2020 and r = 0.67–0.89 in 2021)]; and between total isoflavones and malonyl glucosides [MDZI, MGLI and MGNI (r = 0.64–0.94 in 2020 and r = 0.67–0.89 in 2021)]. We detected weaker positive correlations between total isoflavones and aglycones [DZE, GLE, and GNE (r = 0.46–0.82 in 2020 and r = 0.12–0.20 in 2021)]; and between total isoflavones and acetyl glucosides [ADZI and AGNI (r = 0.26–0.96 in 2020 and r = 0.47–0.95 in 2021)]. Across both years, DZI (r = 0.93***, r = 0.89***), GNI (r = 0.94***, r = 0.89***), MDZI (r = 0.94***, r = 0.94***), MGNI (r = 0.94***, r = 0.96***) and ADZI (r = 0.95***, r = 0.96***) showed significantly strong positive correlations with TI and with each other, consistent with the results of other studies (Azam et al., 2020; Yoon et al., 2021).
Previously, GWAS and QTL mapping have been used to detect candidate genes for quantitative and qualitative traits using natural populations and bi-parental populations, respectively. Recently, QTLs related to isoflavones have been detected by QTL mapping using a bi-parental population, an F2 population, and RILs. Cai et al. (2018) identified a novel QTL underlying isoflavone content using an RIL mapping population with 3469 bin markers based on restriction site-associated DNA tag sequencing. They detected 15 stable QTLs mapped onto ten chromosomes, among which qIF5-1 explained the largest proportion of variation in isoflavone content across environments (6.37–59.95%). In another study, specific-locus amplified fragment (SLAF) sequencing was used for high-density linkage mapping using 3,541 SLAF markers in multiple environments. That study detected 24 stable QTLs for isoflavone components, which explained 4.2–21.2% of the variations in their contents. They included four novel QTLs (qG8, qMD19, QMG18, and qTIF19) for GNI, MDZI, MGNE, and TI, respectively (Pei et al., 2018). A GWAS identified GmMYB29, a gene encoding a R2R3-type MTB transcription factor, which binds to the promoters of IFS2 and CHS8 to activate their expression. When GmMYB29 was over-expressed or silenced by RNAi in soybean hairy roots, the isoflavone contents were increased by 1.6-fold to 3.3-fold or decreased by 2-fold, respectively (Chu et al., 2017). GmMPK1, encoding a mitogen-activated protein kinase, was detected in GWAS and linkage mapping studies using a bi-parental mapping population of soybean. This gene was found to be significantly associated with isoflavone contents and resistance to Phytophthora root rot (Wu et al., 2020). Another study detected GmMYB176, which encodes a transcription factor that binds to the CHS8 promoter to regulate isoflavone biosynthesis. In further analyses, the isoflavone content decreased when GmMYB176 was suppressed by RNAi, but it was not increased when GmMYB176 was overexpressed (Yi et al., 2010). Overexpression of GmMYB29 and GmMPK1 led to increased isoflavone contents and enhanced tolerance to biotic and abiotic stresses, indicating that isoflavone biosynthesis is closely associated with resistance to external stress factors. Together, the results of those studies show that the expression of isoflavone biosynthetic genes, such as PAL, 4CL, CHS8, CHR, and IFS2, is activated by MYB, zinc, bZIP, and PLATZ transcription factors and their interactions in soybean.
In our study, we first screened for QTNs and candidate genes related to isoflavone contents using a mutant soybean population. and confirmed that isoflavone contents were significantly different (p < 0.001) between two haplotype groups. We identified QTNs in genes encoding transcription factors such as bZIP (Glyma.05g.223800), WRKY (Glyma.04g238300) and bHLH (Glyma.13g291400). We also detected a stable QTN (Gm05:38940662) on chromosome 5 in a gene encoding glutathione S-transferase THETA 1 (GmGSTT1), which was found to be associated with seven types of isoflavones (GNE, DZI, GNI, MDZI, MGNI, AZI, TI) in 2020 using multiple-GWAS models (Table 2). In the LD analysis based on Gm05:38940662, we detected 44 QTNs (Gm05:38513238 to Gm05:39363243) within a 441-kb surrounding Gm05:38940662. These four QTNs were located in the 3’-UTR and within non-synonymous coding regions in two GmGSTT1 genes, and resulted in nucleotide changes (A/G, A/C, and C/T) resulting in an amino acid substitution in the first exon (Thr/Ile). We compared the contents of seven types of isoflavones between two haplotype groups: Hap1 with high isoflavone contents, and Hap2 with low isoflavone contents. Within these groups, the top 20% of Hap1 and bottom 20% of Hap2, the TI, GNE, DZI, MDZI, MGNI and ADZI of the 20% of Hap1 extremely increased up to 3.02-fold, 1.94-fold, 3.32-fold, 3.05-fold, 3.15-fold, 2.77-fold and 2.79-fold (p < 0.001) compared with the bottom 20% of Hap2, respectively. These data suggest that the four QTNs will be useful as informative molecular markers in breeding programs to increase the isoflavone content in soybean seeds.
Ionizing radiation induces mutations, including chromosomal alterations, SNPs, and insertions/deletions. Thus, it has been used extensively for crop improvement (Lee et al., 2014; Kim et al., 2019; Hwang et al., 2020; Ma et al., 2022). To confirm that the gene mutation detected in this study affected the transcript levels of GmGSTT1, we performed qRT-PCR analyses for DB-088, the mutant with the greatest increase in isoflavone content compared with the original cultivar DB (see Figure 6A). The genes IFS1 and IFS2 are known to be important determinants of isoflavone content, and were also up-regulated in DB-088 compared with those in DB. Previous studies have reported that non-synonymous SNPs in exons of IFS1 and IFS2 not only greatly reduced isoflavone contents in soybean seeds, but also affected responses to biotic and abiotic stresses (Cheng et al., 2008, 2010). In the present study, the expression profile of GmGSTT1 was similar to that of two IFS genes, suggesting that GmGSTT1 is also related to variations in isoflavone content. The four QTNs in GmGSTT1 were related to increased contents of seven types of isoflavones (up to 1.65-fold) (Figure 5D).
The NCBI database lists 133 soybean GST genes. Members of this family are well characterized detoxification enzymes that are involved in stress tolerance and nodulation in soybean roots. They are a ubiquitous class of enzymes that participate in the antioxidant system, thereby decreasing the accumulation of reactive oxygen species (Dalton et al., 2009; Dixon et al., 2010). Overexpression of GsGST genes has been shown to increase tolerance to abiotic stresses such as salt, drought, cold and heavy metals, and biotic stresses such as insect attack and virus infection (Takesawa et al., 2002; Ji et al., 2010). Members of the GST family also play roles in the accumulation of secondary metabolites such as anthocyanins and cinnamic acid. Some GSTs have been reported to contribute to the formation of other natural products such as the sulfur-containing phytochemicals in Brassicaceae species (Dixon et al., 2010; Czerniawski and Bednarek, 2018). In maize, the anthocyanin biosynthetic gene Bronze-2 is involved the accumulation of anthocyanins in the vacuole. During this process, anthocyanins conjugate with GST, and the anthocyanin-GSH complex is transported into the vacuole via a glutathione pump (Marrs et al., 1995). Activation of GST catalyzes the binding of GSH to ABC transporters, enabling ATP hydrolysis to direct translocation across the membrane. ATP-binding cassette (ABC) transporters are well known for role in sequestration of flavonoids glycosides, glucuronides and glutathione conjugates into the vacuole (Petrussa et al., 2013). As mentioned above, members of the GST family are involved in many aspects of growth and development during the whole life span of plants. Isoflavones are precursors of phytoalexins, and their accumulation is induced in response to hormones and external stimuli such as insect attack. Like anthocyanins, isoflavones accumulate in the vacuole. Thus, it is possible that GmGSTT1 conjugates with isoflavones for transport and storage, like it does with anthocyanins.
This is the first GWAS analysis associated with isoflavone content using a mutant soybean population with multiple GWAS-models across two years. We have identified many significant QTNs, and detected four stable QTNs in the gene GmGSTT1. Our findings provide evidence that GmGSTT1 affects isoflavone contents in soybean seeds. The results of this study include genetic information that will be useful for crop improvement, specifically for the production of soybean lines with stable and high isoflavone contents.
The datasets presented in this study can be found in online repositories. The names of the repository/repositories and accession number(s) can be found in the article/Supplementary material.
S-JK, B-KH, and J-WA conceived and revised the manuscript. JMK designed the experiment and drafted the manuscript. JMK, YJL, SHE, JSS, and NNH phenotyped the isoflavone content. JIL and D-GK genotyped the GBS data. JMK, JIL, and D-GK analyzed the GWAS data. All authors contributed to the article and approved final manuscript.
This work was supported by the research program of Korea Atomic Energy Research Institute (Project No. 523320-22) and National Research Foundation of Korea (NRF) grant funded by the Korea government (RS-2022-00156231).
The authors declare that the research was conducted in the absence of any commercial or financial relationships that could be construed as a potential conflict of interest.
All claims expressed in this article are solely those of the authors and do not necessarily represent those of their affiliated organizations, or those of the publisher, the editors and the reviewers. Any product that may be evaluated in this article, or claim that may be made by its manufacturer, is not guaranteed or endorsed by the publisher.
The Supplementary Material for this article can be found online at: https://www.frontiersin.org/articles/10.3389/fpls.2022.968466/full#supplementary-material
Arias, C. L., Quach, T., Huynh, T., Nguyen, H., Moretti, A., Shi, Y., et al. (2022). Expression of AtWRI1 and AtDGAT1 during soybean embryo development influences oil and carbohydrate metabolism. Plant Biotechnol. J. 20, 1327–1345. doi: 10.1111/pbi.13810
Azam, M., Zhang, S., Abdelghany, A. M., Shaibu, A. S., Feng, Y., Li, Y., et al. (2020). Seed isoflavone profiling of 1168 soybean accessions from major growing ecoregions in China. Food Res. Intl. 130:108957. doi: 10.1016/j.foodres.2019.108957
Brummer, E., Graef, G., Orf, J., Wilcox, J., and Shoemaker, R. (1997). Mapping QTL for seed protein and oil content in eight soybean populations. Crop Sci. 37, 370–378. doi: 10.2135/cropsci1997.0011183X003700020011x
Cai, Z., Cheng, Y., Ma, Z., Liu, X., Ma, Q., Xia, Q., et al. (2018). Fine-mapping of QTLs for individual and total isoflavone content in soybean (Glycine max L.) using a high-density genetic map. Theo. Appl. Genet. 131, 555–568. doi: 10.1007/s00122-017-3018-x
Chaudhary, J., Alisha, A., Bhatt, V., Chandanshive, S., Kumar, N., Mir, Z., et al. (2019). Mutation breeding in tomato: Advances, applicability and challenges. Plants 8:128. doi: 10.3390/plants8050128
Chen, M.-Y., Hung, S.-W., Tsai, W.-H., Lee, M.-C., and Chang, K.-C. (2020). A method for determination of twelve isoflavones in soybean by ultra-performance liquid chromatography. Adapt. Med. 12, 4–10.
Chen, Q.-S., Zhang, Z.-C., Liu, C.-Y., Xin, D.-W., Qiu, H.-M., Shan, D.-P., et al. (2007). QTL analysis of major agronomic traits in soybean. Agric. Sci. China 6, 399–405. doi: 10.1016/S1671-2927(07)60062-5
Cheng, H., Yang, H., Zhang, D., Gai, J., and Yu, D. (2010). Polymorphisms of soybean isoflavone synthase and flavanone 3-hydroxylase genes are associated with soybean mosaic virus resistance. Mol. Breed. 25, 13–24. doi: 10.1007/s11032-009-9305-8
Cheng, H., Yu, O., and Yu, D. (2008). Polymorphisms of IFS1 and IFS2 gene are associated with isoflavone concentrations in soybean seeds. Plant Sci. 175, 505–512. doi: 10.1016/j.plantsci.2008.05.020
Chu, S., Wang, J., Zhu, Y., Liu, S., Zhou, X., Zhang, H., et al. (2017). An R2R3-type MYB transcription factor. GmMYB29, regulates isoflavone biosynthesis in soybean. PLoS Genet. 13:e1006770. doi: 10.1371/journal.pgen.1006770
Collison, M. W. (2008). Determination of total soy isoflavones in dietary supplements, supplement ingredients, and soy foods by high-performance liquid chromatography with ultraviolet detection: Collaborative study. J. AOAC Int. 91, 489–500. doi: 10.1093/jaoac/91.3.489
Concibido, V. C., Diers, B. W., and Arelli, P. R. (2004). A decade of QTL mapping for cyst nematode resistance in soybean. Crop Sci. 44, 1121–1131. doi: 10.2135/cropsci2004.1121
Cui, Y., Zhang, F., and Zhou, Y. (2018). The application of multi-locus GWAS for the detection of salt-tolerance loci in rice. Front. Plant Sci. 9:1464. doi: 10.3389/fpls.2018.01464
Czerniawski, P., and Bednarek, P. (2018). Glutathione S-transferases in the biosynthesis of sulfur-containing secondary metabolites in Brassicaceae plants. Front. Plant Sci. 9:1639. doi: 10.3389/fpls.2018.01639
Dalton, D. A., Boniface, C., Turner, Z., Lindahl, A., Kim, H. J., Jelinek, L., et al. (2009). Physiological roles of glutathione S-transferases in soybean root nodules. Plant Physiol. 150, 521–530. doi: 10.1104/pp.109.136630
Dastmalchi, M., and Dhaubhadel, S. (2014). “Soybean seed isoflavonoids: Biosynthesis and regulation,” in Phytochemicals–Biosynthesis, function and application, (Berlin: Springer), 1–21. doi: 10.1007/978-3-319-04045-5_1
Dixon, D. P., Skipsey, M., and Edwards, R. (2010). Roles for glutathione transferases in plant secondary metabolism. Phytochemistry 71, 338–350. doi: 10.1016/j.phytochem.2009.12.012
Eldridge, A. C., and Kwolek, W. F. (1983). Soybean isoflavones: Effect of environment and variety on composition. J. Agric. Food Chem. 31, 394–396. doi: 10.1021/jf00116a052
Elshire, R. J., Glaubitz, J. C., Sun, Q., Poland, J. A., Kawamoto, K., Buckler, E. S., et al. (2011). A robust, simple genotyping-by-sequencing (GBS) approach for high diversity species. PLoS One 6:e19379. doi: 10.1371/journal.pone.0019379
Fan, S., Li, B., Yu, F., Han, F., Yan, S., Wang, L., et al. (2015). Analysis of additive and epistatic quantitative trait loci underlying fatty acid concentrations in soybean seeds across multiple environments. Euphytica 206, 689–700. doi: 10.1007/s10681-015-1491-3
Farina, H. G., Pomies, M., Alonso, D. F., and Gomez, D. E. (2006). Antitumor and antiangiogenic activity of soy isoflavone genistein in mouse models of melanoma and breast cancer. Oncol. Rep. 16, 885–891. doi: 10.3892/or.16.4.885
Graham, T., Kim, J., and Graham, M. (1990). Role of constitutive isoflavone conjugates in the accumulation of glyceollin in soybean infected with Phytophthora megasperma. Mol. Plant Microbe. Interact. 3, 157–166. doi: 10.1094/MPMI-3-157
Guan, M., Huang, X., Xiao, Z., Jia, L., Wang, S., Zhu, M., et al. (2019). Association mapping analysis of fatty acid content in different ecotypic rapeseed using mrMLM. Front. Plant Sci. 9:1872. doi: 10.3389/fpls.2018.01872
Guo, B., Dai, Y., Chen, L., Pan, Z., and Song, L. (2021). Genome-wide analysis of the soybean root transcriptome reveals the impact of nitrate on alternative splicing. G3 (Bethesda) 11:jkab162. doi: 10.1093/g3journal/jkab162
Gutierrez-Gonzalez, J. J., Vuong, T. D., Zhong, R., Yu, O., Lee, J.-D., Shannon, G., et al. (2011). Major locus and other novel additive and epistatic loci involved in modulation of isoflavone concentration in soybean seeds. Theo. Appl. Genet. 123, 1375–1385. doi: 10.1007/s00122-011-1673-x
Gutierrez-Gonzalez, J. J., Wu, X., Zhang, J., Lee, J.-D., Ellersieck, M., Shannon, J. G., et al. (2009). Genetic control of soybean seed isoflavone content: Importance of statistical model and epistasis in complex traits. Theo. Appl. Genet. 119, 1069–1083. doi: 10.1007/s00122-009-1109-z
He, J., Zhao, X., Laroche, A., Lu, Z.-X., Liu, H., and Li, Z. (2014). Genotyping-by-sequencing (GBS), an ultimate marker-assisted selection (MAS) tool to accelerate plant breeding. Front. Plant Sci. 5:484. doi: 10.3389/fpls.2014.00484
Hoeck, J. A., Fehr, W. R., Murphy, P. A., and Welke, G. A. (2000). Influence of genotype and environment on isoflavone contents of soybean. Crop Sci. 40, 48–51. doi: 10.2135/cropsci2000.40148x
Hwang, S.-G., Lee, S. C., Lee, J., Lee, J. W., Kim, J.-H., Choi, S. Y., et al. (2020). Resequencing of a core rice mutant population induced by gamma-ray irradiation and its application in a genome-wide association study. J. Plant Biol. 63, 463–472. doi: 10.1007/s12374-020-09266-2
Ibrahim, A. K., Zhang, L., Niyitanga, S., Afzal, M. Z., Xu, Y., Zhang, L., et al. (2020). Principles and approaches of association mapping in plant breeding. Trop. Plant Biol. 13, 212–224. doi: 10.1007/s12042-020-09261-4
Jahan, M. (2019). Genetic regulation of the elicitation of glyceollin biosynthesis in soybean. [dissertation/doctral thesis]. West Virginia: West Virginia University.
Ji, W., Zhu, Y., Li, Y., Yang, L., Zhao, X., Cai, H., et al. (2010). Over-expression of a glutathione S-transferase gene, GsGST, from wild soybean (Glycine soja) enhances drought and salt tolerance in transgenic tobacco. Biotechnol. Lett. 32, 1173–1179. doi: 10.1007/s10529-010-0269-x
Jian, B., Liu, B., Bi, Y., Hou, W., Wu, C., and Han, T. (2008). Validation of internal control for gene expression study in soybean by quantitative real-time PCR. BMC Mol. Biol. 9:59. doi: 10.1186/1471-2199-9-59
Jiang, S.-Y., and Ramachandran, S. (2010). Natural and artificial mutants as valuable resources for functional genomics and molecular breeding. Int. J. Biol. Sci. 6:228. doi: 10.7150/ijbs.6.228
Johnson, R. E., Washington, M. T., Prakash, S., and Prakash, L. (2000). Fidelity of human DNA polymerase η. J. Biol. Chem. 275, 7447–7450. doi: 10.1074/jbc.275.11.7447
Joshi, R., Prashat, R., Sharma, P. C., Singla-Pareek, S. L., and Pareek, A. (2016). Physiological characterization of gamma-ray induced mutant population of rice to facilitate biomass and yield improvement under salinity stress. Indian J. Plant Physiol. 21, 545–555. doi: 10.1007/s40502-016-0264-x
Kang, H., Ansbacher, R., and Hammoud, M. (2002). Use of alternative and complementary medicine in menopause. Int. J. Gynecol. Obstetr 79, 195–207. doi: 10.1016/S0020-7292(02)00297-7
Kim, D.-G. (2021). Studies on the construction of Mutant Diversity Pool (MDP) Lines, and their genomic and metabolic characterization in soybean. [dissertation/doctral thesis]. Suncheon: Sunchon National University.
Kim, D.-G., Lyu, J. I., Lee, M.-K., Kim, J. M., Hung, N. N., Hong, M. J., et al. (2020). Construction of soybean mutant diversity pool (MDP) lines and an analysis of their genetic relationships and associations using TRAP markers. Agronomy 10:253. doi: 10.3390/agronomy10020253
Kim, D.-G., Lyu, J.-I., Lim, Y.-J., Kim, J.-M., Hung, N.-N., Eom, S.-H., et al. (2021). Differential gene expression associated with altered isoflavone and fatty acid contents in soybean mutant diversity pool. Plants 10:1037. doi: 10.3390/plants10061037
Kim, S. H., Ryu, J., Kim, W. J., Kang, R., Seo, E., Kim, G., et al. (2019). Identification of a new GmSACPD-C allele in high stearic acid mutant Hfa180 derived from gamma-ray irradiation. Mol. Breed. 39, 1–12. doi: 10.1007/s11032-019-0928-0
Knizia, D., Yuan, J., Bellaloui, N., Vuong, T., Usovsky, M., Song, Q., et al. (2021). The soybean high density ‘Forrest’by ‘Williams 82’SNP-based genetic linkage map identifies QTL and candidate genes for seed isoflavone content. Plants 10:2029. doi: 10.3390/plants10102029
Korte, A., and Farlow, A. (2013). The advantages and limitations of trait analysis with GWAS: A review. Plant Methods 9, 1–9. doi: 10.1186/1746-4811-9-29
Kudou, S., Fleury, Y., Welti, D., Magnolato, D., Uchida, T., Kitamura, K., et al. (1991). Malonyl isoflavone glycosides in soybean seeds (Glycine max Merrill). Agric. Biol. Chem. 55, 2227–2233. doi: 10.1271/bbb1961.55.2227
Le, D. T., Aldrich, D. L., Valliyodan, B., Watanabe, Y., Ha, C. V., Nishiyama, R., et al. (2012). Evaluation of candidate reference genes for normalization of quantitative RT-PCR in soybean tissues under various abiotic stress conditions. PLoS One 7:e46487. doi: 10.1371/journal.pone.0046487
Lee, C. H., Yang, L., Xu, J. Z., Yeung, S. Y. V., Huang, Y., and Chen, Z.-Y. (2005). Relative antioxidant activity of soybean isoflavones and their glycosides. Food Chem. 90, 735–741. doi: 10.1016/j.foodchem.2004.04.034
Lee, G., Boerma, H., Villagarcia, M., Zhou, X., Carter, T., Li, Z., et al. (2004). A major QTL conditioning salt tolerance in S-100 soybean and descendent cultivars. Theo. Appl. Genet. 109, 1610–1619. doi: 10.1007/s00122-004-1783-9
Lee, K. J., Hwang, J. E., Velusamy, V., Ha, B.-K., Kim, J.-B., Kim, S. H., et al. (2014). Selection and molecular characterization of a lipoxygenase-free soybean mutant line induced by gamma irradiation. Theo. Appl. Genet. 127, 2405–2413. doi: 10.1007/s00122-014-2385-9
Li, B., Fan, S., Yu, F., Chen, Y., Zhang, S., Han, F., et al. (2017). High-resolution mapping of QTL for fatty acid composition in soybean using specific-locus amplified fragment sequencing. Theo. Appl. Genet. 130, 1467–1479. doi: 10.1007/s00122-017-2902-8
Li, Q.-G., Zhang, L., Li, C., Dunwell, J. M., and Zhang, Y.-M. (2013). Comparative genomics suggests that an ancestral polyploidy event leads to enhanced root nodule symbiosis in the Papilionoideae. Mol. Biol. Evol. 30, 2602–2611. doi: 10.1093/molbev/mst152
Liang, H.-Z., Yu, Y.-L., Wang, S.-F., Yun, L., Wang, T.-F., Wei, Y.-L., et al. (2010). QTL mapping of isoflavone, oil and protein contents in soybean (Glycine max L. Merr.). Agric. Sci. China 9, 1108–1116. doi: 10.1016/S1671-2927(09)60197-8
Lim, Y. J., Lyu, J. I., Kwon, S.-J., and Eom, S. H. (2021). Effects of UV-A radiation on organ-specific accumulation and gene expression of isoflavones and flavonols in soybean sprout. Food Chem. 339:128080. doi: 10.1016/j.foodchem.2020.128080
Lobato, L. P., Iakmiu Camargo Pereira, A. E., Lazaretti, M. M., Barbosa, D. S., Carreira, C. M., Mandarino, J. M. G., et al. (2012). Snack bars with high soy protein and isoflavone content for use in diets to control dyslipidaemia. Int. J. Food Sci. Nutr. 63, 49–58. doi: 10.3109/09637486.2011.596148
Lozovaya, V. V., Lygin, A. V., Ulanov, A. V., Nelson, R. L., Daydé, J., and Widholm, J. M. (2005). Effect of temperature and soil moisture status during seed development on soybean seed isoflavone concentration and composition. Crop Sci. 45, 1934–1940. doi: 10.2135/cropsci2004.0567
Ma, C., Rehman, A., Li, H. G., Zhao, Z. B., Sun, G., and Du, X. M. (2022). Mapping of dwarfing QTL of Ari1327, a semi-dwarf mutant of upland cotton. BMC Plant Biol. 22:5. doi: 10.1186/s12870-021-03359-x
Ma, D.-F., Qin, L.-Q., Wang, P.-Y., and Katoh, R. (2008). Soy isoflavone intake increases bone mineral density in the spine of menopausal women: Meta-analysis of randomized controlled trials. Clin. Nutr. 27, 57–64. doi: 10.1016/j.clnu.2007.10.012
Malek, M., Rafii, M. Y., Afroz, S. S., Nath, U. K., and Mondal, M. (2014). Morphological characterization and assessment of genetic variability, character association, and divergence in soybean mutants. Sci. World J. 2014:968796. doi: 10.1155/2014/968796
Marrs, K. A., Alfenito, M. R., Lloyd, A. M., and Walbot, V. (1995). A glutathione S-transferase involved in vacuolar transfer encoded by the maize gene Bronze-2. Nature 375, 397–400. doi: 10.1038/375397a0
Meng, S., He, J., Zhao, T., Xing, G., Li, Y., Yang, S., et al. (2016). Detecting the QTL-allele system of seed isoflavone content in Chinese soybean landrace population for optimal cross design and gene system exploration. Theo. Appl. Genet. 129, 1557–1576. doi: 10.1007/s00122-016-2724-0
Messina, M. J. (1999). Legumes and soybeans: Overview of their nutritional profiles and health effects. Am. J. Clin. Nutr. 70, 439s–450s. doi: 10.1093/ajcn/70.3.439s
Nawaz, M. A., Rehman, H. M., Baloch, F. S., Ijaz, B., Ali, M. A., Khan, I. A., et al. (2017). Genome and transcriptome-wide analyses of cellulose synthase gene superfamily in soybean. J. Plant Physiol. 215, 163–175. doi: 10.1016/j.jplph.2017.04.009
Pei, R., Zhang, J., Tian, L., Zhang, S., Han, F., Yan, S., et al. (2018). Identification of novel QTL associated with soybean isoflavone content. Crop J. 6, 244–252. doi: 10.1016/j.cj.2017.10.004
Petrussa, E., Braidot, E., Zancani, M., Peresson, C., Bertolini, A., Patui, S., et al. (2013). Plant flavonoids—biosynthesis, transport and involvement in stress responses. Int. J. Mol. Sci. 14, 14950–14973. doi: 10.3390/ijms140714950
Primomo, V. S., Poysa, V., Ablett, G. R., Jackson, C.-J., Gijzen, M., and Rajcan, I. (2005). Mapping QTL for individual and total isoflavone content in soybean seeds. Crop Sci. 45, 2454–2464. doi: 10.2135/cropsci2004.0672
Rao, X., Huang, X., Zhou, Z., and Lin, X. (2013). An improvement of the 2∧ (–delta delta CT) method for quantitative real-time polymerase chain reaction data analysis. Biostat. Bioinform. Biomath. 3:71.
Rasheed, A., Hao, Y., Xia, X., Khan, A., Xu, Y., Varshney, R. K., et al. (2017). Crop breeding chips and genotyping platforms: Progress, challenges, and perspectives. Mol. Plant 10, 1047–1064. doi: 10.1016/j.molp.2017.06.008
Rupasinghe, H. V., Jackson, C.-J. C., Poysa, V., Di Berardo, C., Bewley, J. D., and Jenkinson, J. (2003). Soyasapogenol A and B distribution in soybean (Glycine max L. Merr.) in relation to seed physiology, genetic variability, and growing location. J. Agric. Food Chem. 51, 5888–5894. doi: 10.1021/jf0343736
Shaw, E. J., Kakuda, Y., and Rajcan, I. (2016). Effect of genotype, environment, and genotype× environment interaction on tocopherol accumulation in soybean seed. Crop Sci. 56, 40–50. doi: 10.2135/cropsci2015.02.0069
Sreevidya, V., Srinivasa Rao, C., Sullia, S., Ladha, J. K., and Reddy, P. M. (2006). Metabolic engineering of rice with soybean isoflavone synthase for promoting nodulation gene expression in rhizobia. J. Exp. Bot. 57, 1957–1969. doi: 10.1093/jxb/erj143
Takesawa, T., Ito, M., Kanzaki, H., Kameya, N., and Nakamura, I. (2002). Over-expression of ζ glutathione S-transferase in transgenic rice enhances germination and growth at low temperature. Mol. Breed. 9, 93–101. doi: 10.1023/A:1026718308155
Thomson, M. J. (2014). High-throughput SNP genotyping to accelerate crop improvement. Plant Breed. Biotechnol. 2, 195–212. doi: 10.9787/PBB.2014.2.3.195
Tsukamoto, C., Shimada, S., Igita, K., Kudou, S., Kokubun, M., Okubo, K., et al. (1995). Factors affecting isoflavone content in soybean seeds: Changes in isoflavones, saponins, and composition of fatty acids at different temperatures during seed development. J. Agric. Food Chem. 43, 1184–1192. doi: 10.1021/jf00053a012
Warrington, C. V., Abdel-Haleem, H., Hyten, D., Cregan, P., Orf, J., Killam, A., et al. (2015). QTL for seed protein and amino acids in the Benning× Danbaekkong soybean population. Theo. Appl. Genet. 128, 839–850. doi: 10.1007/s00122-015-2474-4
Wu, D., Li, D., Zhao, X., Zhan, Y., Teng, W., Qiu, L., et al. (2020). Identification of a candidate gene associated with isoflavone content in soybean seeds using genome-wide association and linkage mapping. Plant J. 104, 950–963. doi: 10.1111/tpj.14972
Xu, Y., Li, P., Yang, Z., and Xu, C. (2017). Genetic mapping of quantitative trait loci in crops. Crop J. 5, 175–184. doi: 10.1016/j.cj.2016.06.003
Yi, J., Derynck, M. R., Li, X., Telmer, P., Marsolais, F., and Dhaubhadel, S. (2010). A single-repeat MYB transcription factor, GmMYB176, regulates CHS8 gene expression and affects isoflavonoid biosynthesis in soybean. Plant J. 62, 1019–1034. doi: 10.1111/j.1365-313X.2010.04214.x
Yoon, H., Yi, J., Desta, K.t, Shin, M.-J., Lee, Y., Lee, S., et al. (2021). Yearly variation of isoflavone composition and yield-related traits of 35 Korean soybean germplasm. Korean J. Breed. Sci. 53, 411–423. doi: 10.9787/KJBS.2021.53.4.411
Yuk, H. J., Lee, J. H., Curtis-Long, M. J., Lee, J. W., Kim, Y. S., Ryu, H. W., et al. (2011). The most abundant polyphenol of soy leaves, coumestrol, displays potent α-glucosidase inhibitory activity. Food Chem. 126, 1057–1063. doi: 10.1016/j.foodchem.2010.11.125
Zeng, G., Li, D., Han, Y., Teng, W., Wang, J., Qiu, L., et al. (2009). Identification of QTL underlying isoflavone contents in soybean seeds among multiple environments. Theo. Appl. Genet. 118, 1455–1463. doi: 10.1007/s00122-009-0994-5
Zhang, L., Wang, S., Li, H., Deng, Q., Zheng, A., Li, S., et al. (2010). Effects of missing marker and segregation distortion on QTL mapping in F2 populations. Theo. Appl. Genet. 121, 1071–1082. doi: 10.1007/s00122-010-1372-z
Keywords: Isoflavone, SNPs, QTLs, GBS, GWAS, MDP
Citation: Kim JM, Lyu JI, Kim D-G, Hung NN, Seo JS, Ahn J-W, Lim YJ, Eom SH, Ha B-K and Kwon S-J (2022) Genome wide association study to detect genetic regions related to isoflavone content in a mutant soybean population derived from radiation breeding. Front. Plant Sci. 13:968466. doi: 10.3389/fpls.2022.968466
Received: 14 June 2022; Accepted: 29 July 2022;
Published: 18 August 2022.
Edited by:
Antonio Costa De Oliveira, Federal University of Pelotas, BrazilReviewed by:
Yuan-Ming Zhang, Huazhong Agricultural University, ChinaCopyright © 2022 Kim, Lyu, Kim, Hung, Seo, Ahn, Lim, Eom, Ha and Kwon. This is an open-access article distributed under the terms of the Creative Commons Attribution License (CC BY). The use, distribution or reproduction in other forums is permitted, provided the original author(s) and the copyright owner(s) are credited and that the original publication in this journal is cited, in accordance with accepted academic practice. No use, distribution or reproduction is permitted which does not comply with these terms.
*Correspondence: Soon-Jae Kwon, c29vbmphZWt3b25Aa2FlcmkucmUua3I=; Bo-Keun Ha, YmtoYUBqbnUuYWMua3I=
Disclaimer: All claims expressed in this article are solely those of the authors and do not necessarily represent those of their affiliated organizations, or those of the publisher, the editors and the reviewers. Any product that may be evaluated in this article or claim that may be made by its manufacturer is not guaranteed or endorsed by the publisher.
Research integrity at Frontiers
Learn more about the work of our research integrity team to safeguard the quality of each article we publish.