 Jun Hu
 Yin Shen3
 Yuhong Zheng
 Hassan Karimi-maleh
 Qing Liu
 Li Fu
Li Fu- 1CAS Key Laboratory of Mountain Ecological Restoration and Bioresource Utilization & Ecological Restoration and Biodiversity Conservation Key Laboratory of Sichuan Province, Chengdu Institute of Biology, Chinese Academy of Sciences, Chengdu, China
- 2University of Chinese Academy of Sciences, Beijing, China
- 3Key Laboratory of Novel Materials for Sensor of Zhejiang Province, College of Materials and Environmental Engineering, Hangzhou Dianzi University, Hangzhou, China
- 4Institute of Botany, Jiangsu Province and Chinese Academy of Sciences (Nanjing Botanical Garden, Memorial Sun Yat-Sen), Nanjing, China
- 5School of Resources and Environment, University of Electronic Science and Technology of China, Chengdu, China
- 6Department of Chemical Engineering and Energy, Laboratory of Nanotechnology, Quchan University of Technology, Quchan, Iran
- 7Department of Chemical Sciences, University of Johannesburg, Doornfontein Campus, Johannesburg, South Africa
Electrochemical fingerprinting can collect the electrochemical behavior of electrochemically active molecules in plant tissues, so it is regarded as a new plant analysis technology. Because the signal of electrochemical fingerprinting is positively correlated with the amount and type of electrochemically active molecules in plant tissues, it can also be used to reflect genetic differences between different species. Previous electrochemical fingerprinting techniques have been frequently used in phylogenetic studies of herbaceous plants. In this work, 19 Quercus species (17 evergreen or semi evergreen species and 2 deciduous species) were selected for investigation. The results indicated the electrochemical fingerprint of some species share similar features but can be distinguished after changing the recording condition (extraction solvent and electrolyte). The two sets of electrochemical fingerprint data can be used to construct different pattern recognition technology, which further speeds up the recognition efficiency. These electrochemical fingerprints were further used in phylogenetic investigations. The phylogenetic results deduced from electrochemical fingerprinting were divided mainly into three clusters. These can provide evidence for some of these arguments as well as new results.
Introduction
Electrochemical fingerprinting is a new analytical technique, which can be used to collect the information of electrochemically active molecules in plant tissues (Xu et al., 2020; Zhou et al., 2020; Fan et al., 2021; Fu et al., 2021; Wang et al., 2021; Zheng et al., 2021b; Fu et al., 2022). The fingerprint can be used not only for plant identification and growth monitoring, but also for phylogenetic investigation in recent years. These applications are due to the fact that the type and amount of electrochemically active substances in plant tissues can reflect their differences at the genetic level (Karimi-Maleh et al., 2021b; Karimi-Maleh et al., 2021a). Thus, this new analytical technique is beginning to serve as a complementary methodology for phytochemical studies and plant phylogeny. Today, research on electrochemical fingerprinting is mainly focused on herbaceous and lianas. This is because the active substances in these plant tissues can be easily extracted and can contribute a distinct electrical signal. In contrast, there have been few reports on woody plants based on electrochemical fingerprinting. This is because woody plants have more cellulose and lignin in their tissues, which reduces the accuracy of electrochemical fingerprinting.
Quercus is a family of trees under Fagaceae. It is widely distributed in Asia, Africa, Europe and America and other regions, there are about 500 species. Quercus are mainly distributed in tropical (subtropical) and temperate regions of the Northern Hemisphere, and are important species of broad-leaved forests. It occupies a large share in the forest area of the northern hemisphere and is of great significance to the local environment beautification and ecological restoration. Abrams believes that Quercus has developed root system and thick leaves, which can keep high water potential of these plants in the case of drought and prevent wilting (Abrams, 1990). In addition, Quercus can maintain a higher photosynthetic rate under low water potential compared with other groups in the same domain, which is conducive to obtaining competitive advantages in the environment. Cavende-bares et al. (Cavender-Bares et al., 2004b; Cavender-Bares et al., 2004a) found that the life history characteristics of Quercus were also influenced and restricted by their living environment. For example, Quercus adapted to post-fire habitat are generally shrub type, with strong redifferentiation ability of rhizomes. Quercus that grow in humid environment are generally tall trees. Quercus distributed in arid environment have resistance mechanism to xylem catheter embolization, which leads to the small amount of water passing through, which is a response of plants to drought stress. Quercus grow in humid environments and are free to absorb large amounts of water.
The name Quercus was first suggested by the Swedish naturalist Linnaeus. In 1867, Swedish botanist Oersted (Øersted, 1867) distinguished Cyclobalanopsis Oerst from other plants in the genus based on the conformation of shell bracts into concentric circles, and became an independent species of Cyclobalanopsis Oerst. In 1924 Trelease (Trelease, 1924) divided Quercus into six subgenus groups, including Cyclobalanopsis, Cerris, Erythrobalanus, Protobalanus and other subgenera. Camus (Chevalier and Camus, 1954) divided Quercus into two subgenera, subgen. Euquercus and Subgen. Cyclobalanopsis. In 1993, Nixon (Nixon, 1993) adjusted some species of Quercus and divided Quercus into subgenera Subgen. Quercus and subgen. Cyclobalanopsis. Japanese scholar Shimaji thought that Quercus could be divided into three subgenera after analyzing the anatomical characteristics. It includes subgen. Erythrobalanus, subgen. Lepidobalanus and subgen. Cyclobalanopsis, respectively (Shimaji, 1962). Molecular evidence suggests that there are six large groups of present-day Quercus, namely group Lobatae (Red Oaks), group Protobalanus (Intermediate Oaks), group Ilex, group Cerris, group Quercus (White Oaks) and group Cyclobalanopsis (now a separate genus) (Manos et al., 1999; Manos and Stanford, 2001; Denk and Grimm, 2010). In China, botanists have divided Quercus into five groups according to the phylogeny and quantitative classification (Peng et al., 2007). They are sect. Engleriana, sect. Brachylepids, sect. Quercus, sect. Echinolepides and sect. Aegilops. Among them, sect. Quercus and sect. Aegilops usually deciduous broad-leaved plants, others are evergreen or semi-evergreen broad-leaved plants. Most of evergreen species are called sclerophylla oak because their leaves are leathery, hard and spiny (Chaudhri et al., 2022; Farooq et al., 2022; Ismail et al., 2022). There has been a great controversy about the relationship between species within the sclerophylla oak. In this work, 19 species of Quercus (17 evergreen or semi evergreen species and 2 deciduous species) and 2 species of Cyclobalanopsis were investigated using electrochemical fingerprinting. Electrochemical fingerprinting of all plant tissues was collected under two conditions. The collected results were used not only for plant identification, but also for phylogenetic investigation.
Materials and method
Sample collection
Leaves of Quercus rehderiana, Q. monimotricha, Q. gilliana, Q. variabilis, Q. pseudosemecarpofolia, Q. guajavifolia, Q. longispica, Q. spinosa, Q. engleriana, Q. fimbriata, Q. franchetii, Q. senescens, Q. baronii, Q. dolicholepis, Q. cocciferoides, Q. oxyphylla and Q. aquifolioides were collected during field investigation, Q. aliena, Q. phillyraeoides, Cyclobalanopsos myrsinifolia and Cyclobalanopsis glauca were collected from Chengdu City Park and Nanjing Botanical Garden Men. Sun Yat-Sen (Table 1). The voucher specimens are deposited in the herbarium of Chengdu Institute of biology (CDBI), Chinese Academy of Sciences and the herbarium of Nanjing Botanical Garden Men.Sun Yat-Sen (NAS). Only mature and healthy leaves were harvested. All samples were kept frozen (-20°C) before analysis.
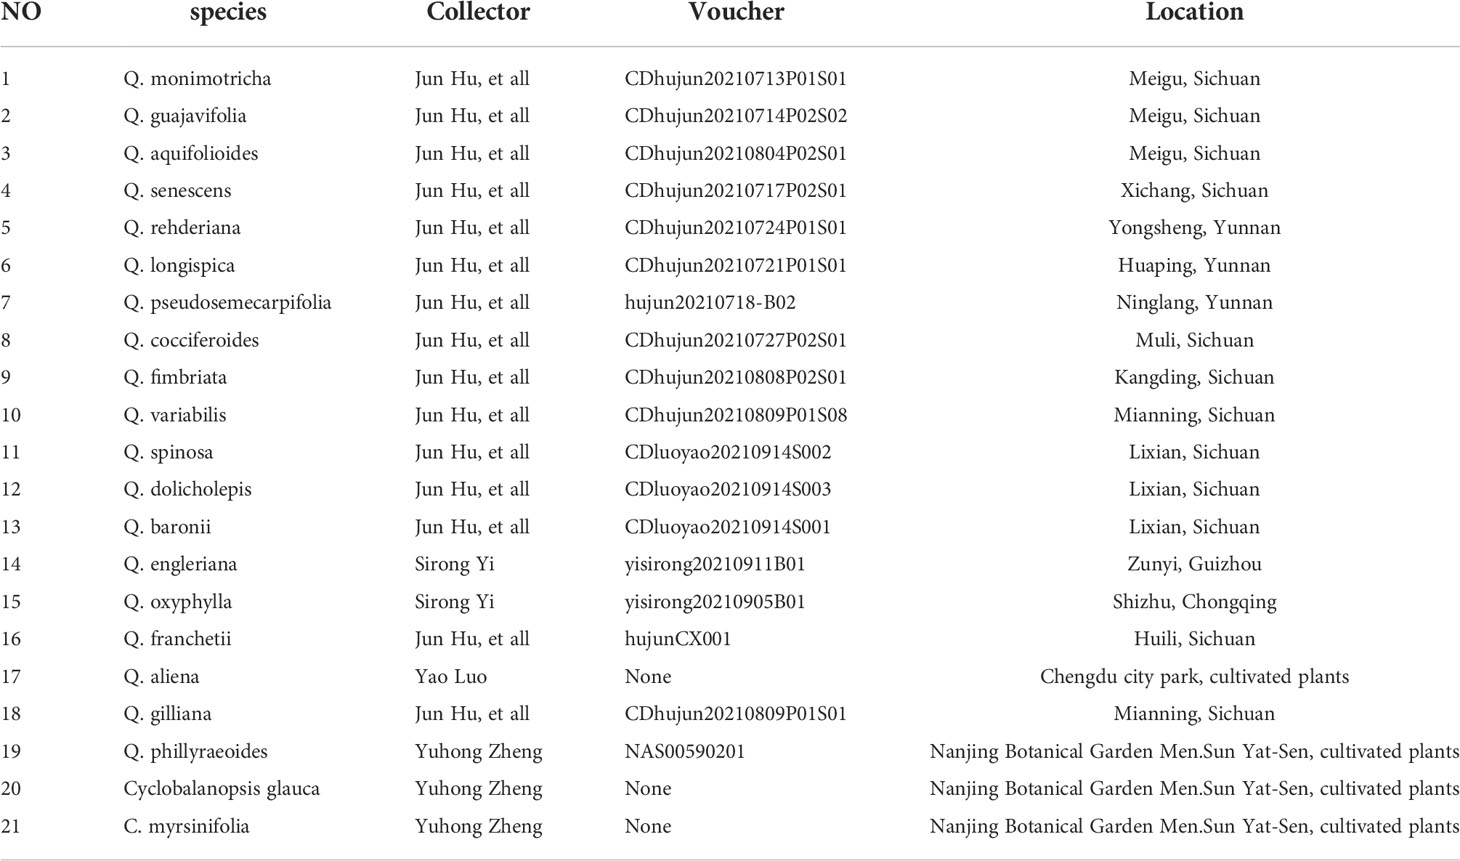
Table 1 Leaves for electrochemical analysis.
Extraction preparation
All extraction process was conducted under room temperature. Water and ethanol were used as the solvents in the extraction procedure. Specifically, 0.3 g leaves were cut and added to 5 mL of solvent. The mixture was supplemented with four grinding beads. The tube was put in a tissue grinding device (Meibi-96, Zhejiang, China) for 2 min extraction. After waiting for precipitation, the supernatant was collected for electrochemical fingerprint collection.
Electrochemical fingerprints collection
Phosphate buffer solution (PBS, 0.1 M) and acetic acid buffer (ABS, 0.1 M) were used as electrolytes to support electrochemical fingerprint collection. Electrochemical fingerprinting was determined using a traditional three-electrode system. A glassy carbon electrode, a platinum wire and an Ag/AgCl electrode were used as working electrode, counter electrode and reference electrode, respectively. All electrochemical experiments were conducted under a CHI 760E working station at room temperature. a differential pulse voltammetry (DPV) was recorded from -0.1 to 1.3 V. The experimental data was then normalized for further analysis.
Results and discussion
The information of electrochemically active molecules in plant tissues was collected by electrochemical fingerprinting. The anodic scanning representing the electrochemical oxidation behavior of molecules. As shown in Figure 1 (collected under PBS after extraction with water), in the range of 0-1.3V, Q. monimotricha, Q. engleriana, Q. aquifolioides, Q. rehderiana, Q. spinosa, Q. gilliana and Q. pseudosemecarpifolia all showed electrochemical oxidation behavior. In addition, these species show similar electrochemical oxidation trend, with an obvious electrochemical oxidation peak near 0.4 V. This similarity in electrochemical behavior is common among plants of the same genus. This is because species within the genus have relatively similar genes, and therefore have a high degree of similarity in the species of electrochemically active molecules in tissues (Ye et al., 2021). However, beyond the obvious large oxidation peak of about 0.4 V, different species showed different electrochemical behaviors. For example, Q. aquifolioides has a half-overlapped oxidation peak near 0.4 V. Q. rehderiana has a wide oxidation peak at about 0.6 V, representing a range of substances oxidized in this window. On the other hand, there are some species that are very similar in their electrochemical behavior, such as Q. engleriana and Q. pseudosemecarpifolia.
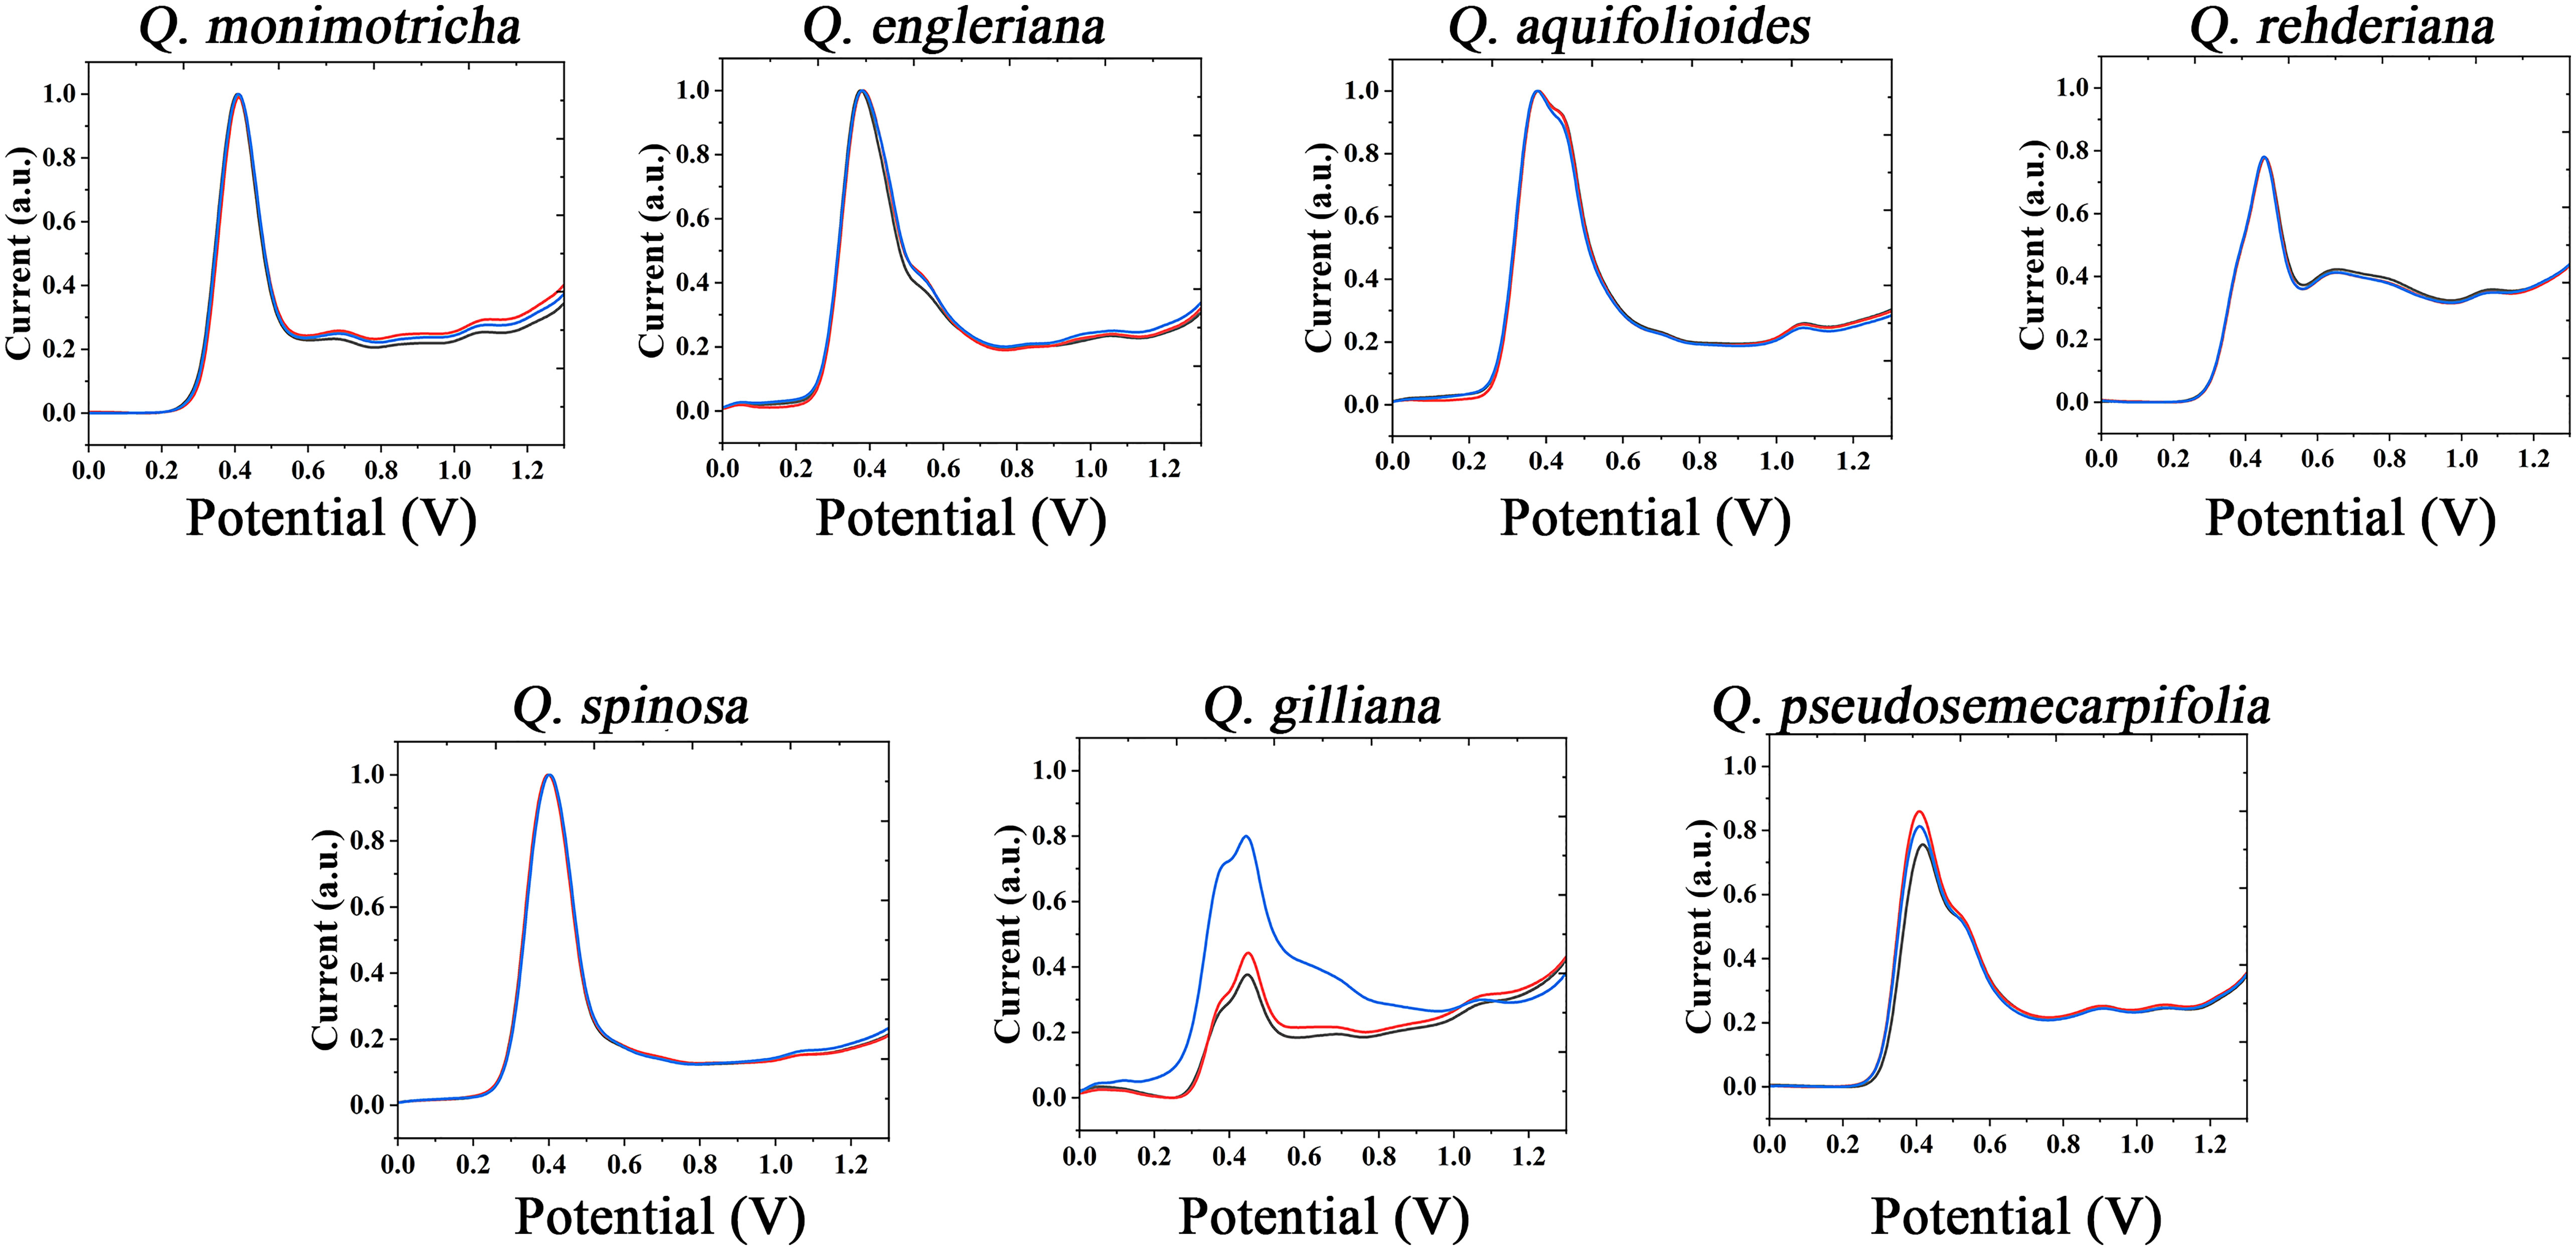
Figure 1 Electrochemical fingerprint of Q. monimotricha, Q. engleriana, Q. aquifolioides, Q. rehderiana, Q. spinosa, Q. gilliana and Q. pseudosemecarpifolia after water extraction and recorded under PBS condition with three repetitive tests.
Figures S1 and S2 show the electrochemical behavior of the remaining species collected under PBS after water extraction. All species exhibit essentially the electrochemical behavior described above. Some of these species exhibit similar electrochemical behavior, such as Q. oxyphylla and Q. variabilis. Three electrochemical fingerprints were taken for each sample. It can be seen that most of the samples have very good repeatability. However, the DPV curves of some samples do not coincide completely. However, the different fingerprints have a very consistent behavior, representing the same molecules involved in electrochemical oxidation (Zheng et al., 2021a). Some fingerprints had a higher current intensity than others, indicating a higher concentration of one type of electrochemically active molecule in the sample. This is very common in plant samples. Even among plants in the same area, different environmental factors will lead to changes in the content of molecules in tissues (Łaska et al., 2019; Ousaaid et al., 2021).
The use of the same solvent for plant tissue extraction and the use of the same electrolyte to support electrochemical fingerprinting can cause different species to exhibit relatively similar electrochemical behavior. Therefore, we also extracted the plant tissues with ethanol and collected the electrochemical fingerprints in ABS environment. Figure 2 shows DPV profiles of Q. monimotricha, Q. engleriana, Q. aquifolioides, Q. rehderiana, Q. spinosa, Q. gilliana and Q. pseudosemecarpifolia after ethanol extraction under ABS. It can be seen that all species exhibit very different electrochemical behavior under these conditions than in Figure 1. There are two factors that account for the difference in electrochemical behavior. First, different solvents extract different electrochemically active molecules from plant tissues (Moro et al., 2020). Therefore, there are different kinds of molecules involved in the process of electrochemical fingerprinting. On the other hand, ABS has an acidic pH, so the same electrochemically active molecule behaves differently in neutral and acidic environments (Fu et al., 2020). As can be seen from the figure, the electrochemical fingerprints similar in Figure 1, such as Q. engleriana and Q. pseudosemecarpifolia, show very large differences in Figure 2. Therefore, if the fingerprint of both conditions is combined, the species can be clearly identified. We further conducted MANOVA tests for our data. The p values of the DPVs recorded within species all larger than 0.05, indicating no significant differences. However, when comparing different species, the p-value is between 3.2e-07 to 6.9e-07. This result suggesting the significantly different. Therefore, the differences of electrochemical fingerprints between species are much larger than the same species. We believe the environmental factors such as habitat and fertilization certainly affect the content of many chemical constitutions (including electro-active compounds) and consequently change signal intensity. Many GC-MS based works also report the content variation of extracted compounds (Jin, 2009; Berkov et al., 2012). These works suggest the environmental factors can only slightly affect the ratio of compounds without changing compound types. Therefore, main pattern of voltammograms collected from different species will be largely unaffected.
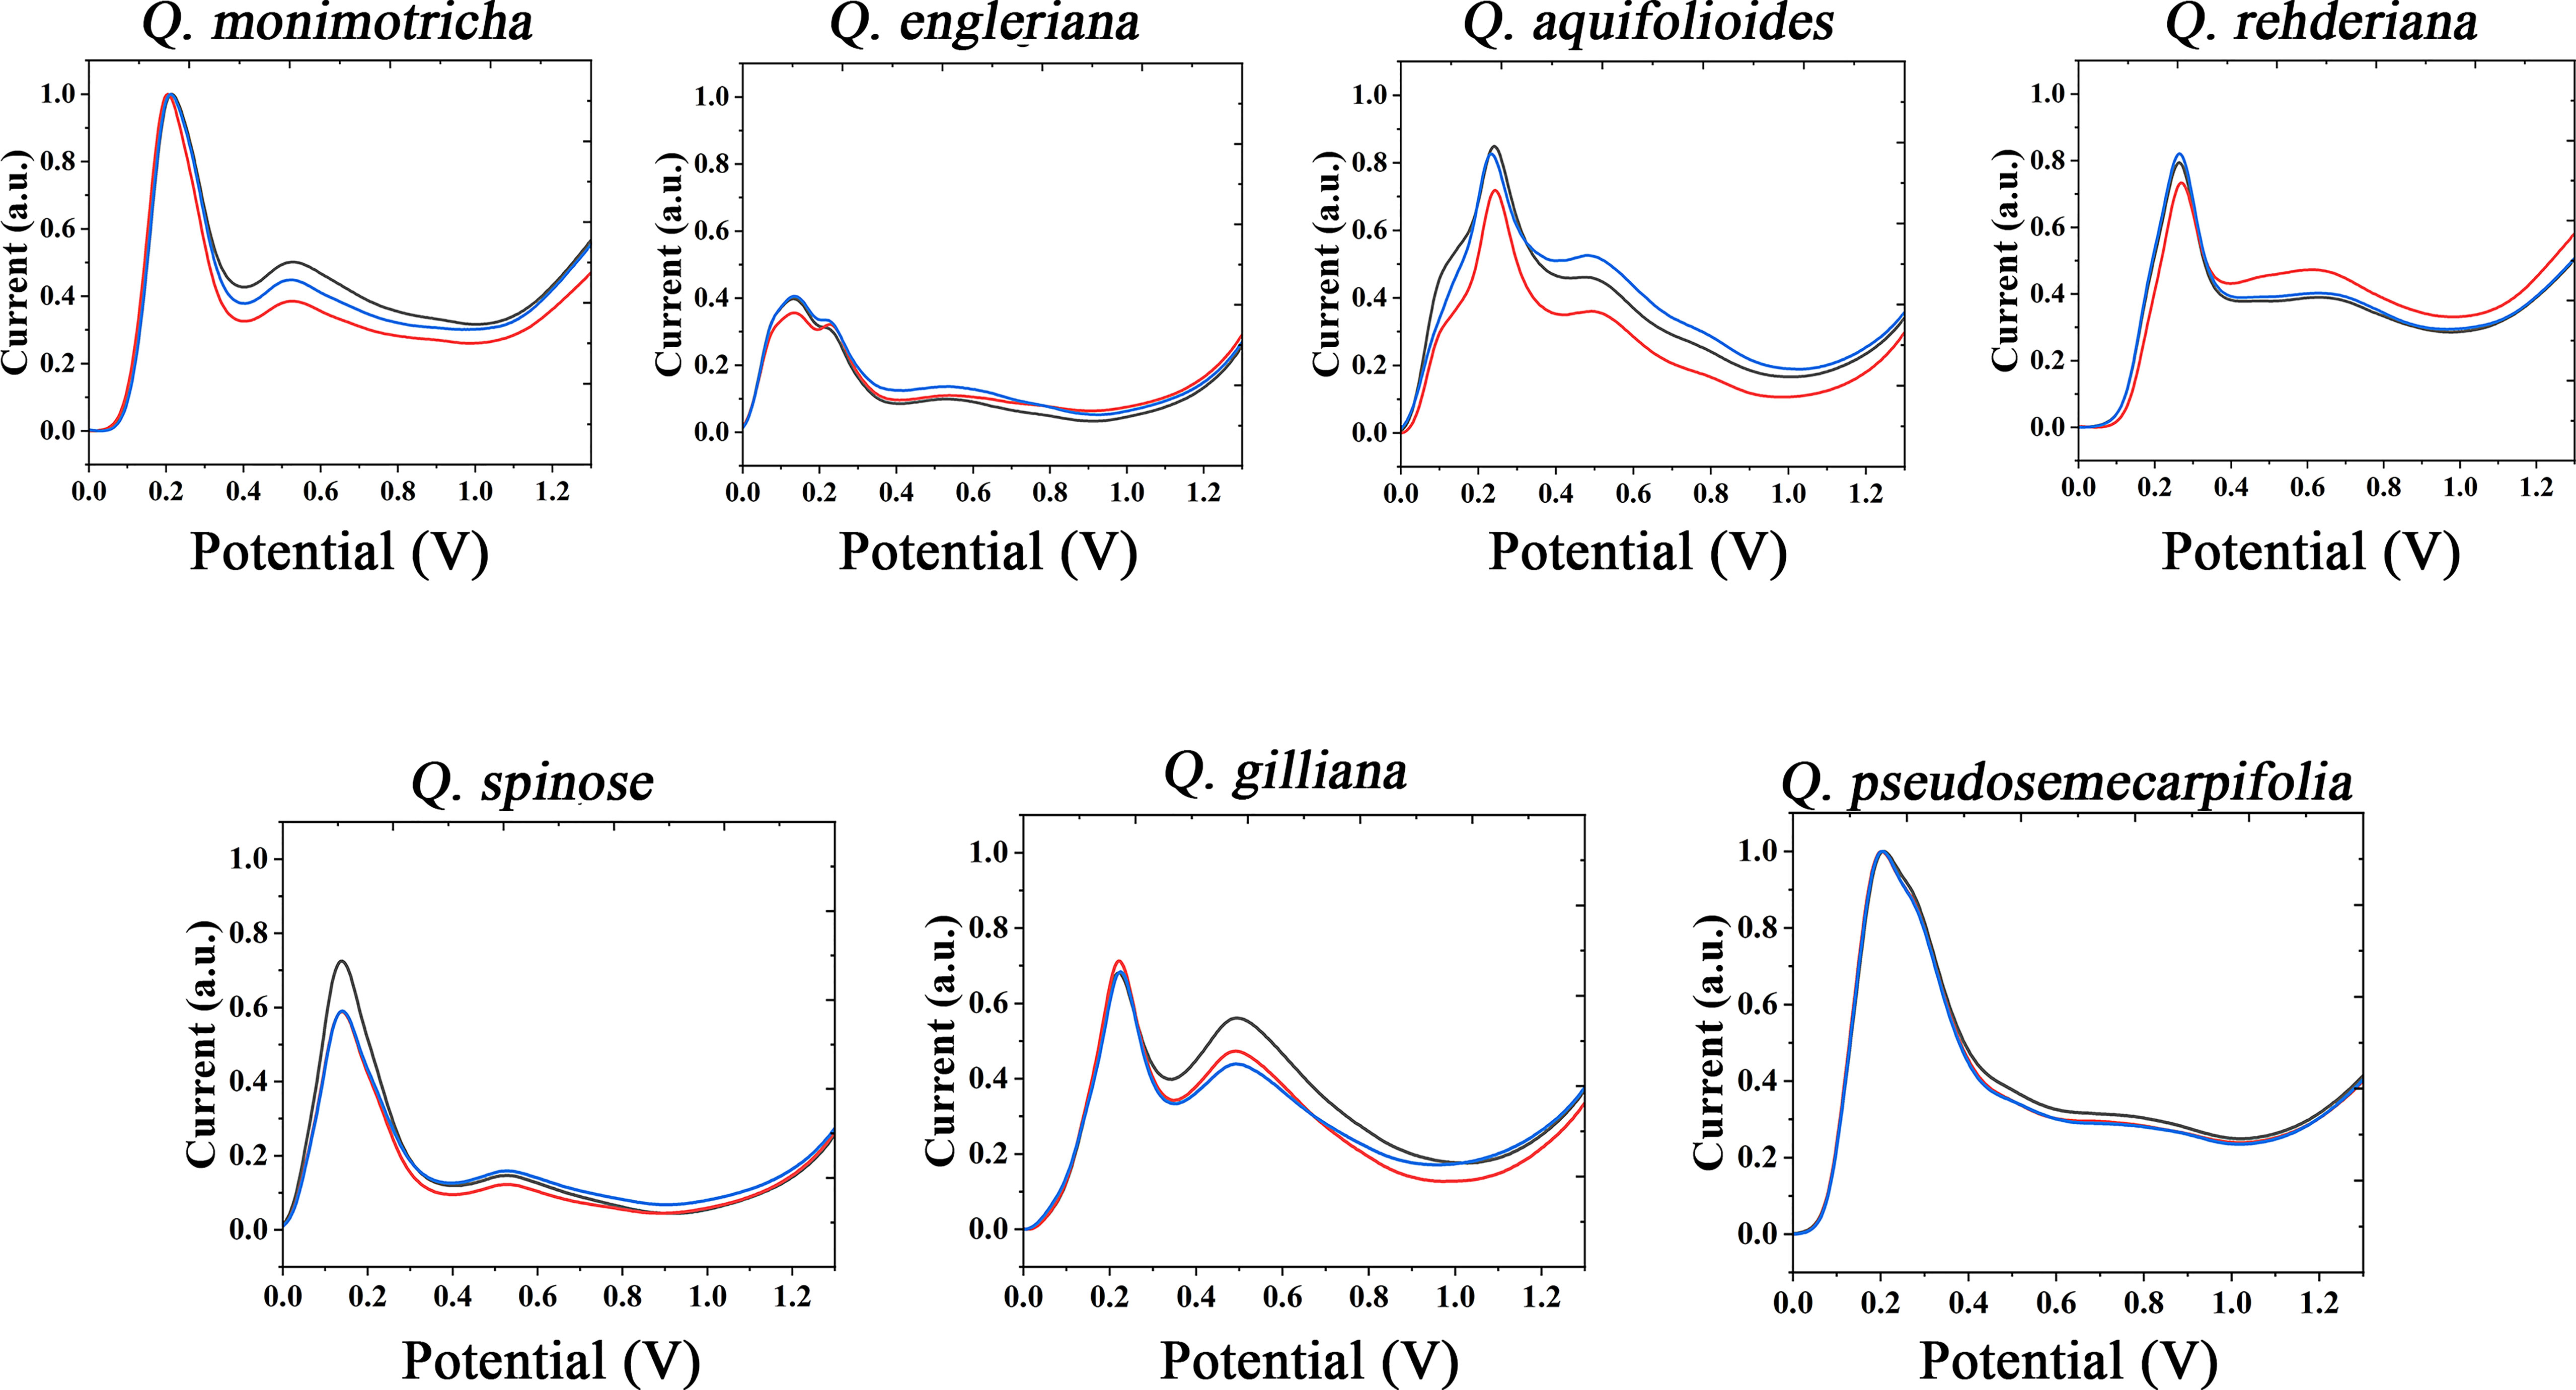
Figure 2 Electrochemical fingerprint of Q. monimotricha, Q. engleriana, Q. aquifolioides, Q. rehderiana, Q. spinosa, Q. gilliana and Q. pseudosemecarpifolia after ethanol extraction and recorded under ABS condition with three repetitive tests.
Figures S2 and S3 show the electrochemical behavior of the remaining species collected under ABS after ethanol extraction. The trends of these electrochemical fingerprints are very similar to those in Figures S1 and S2. Different species showed electrochemical oxidation behavior in the scanning window, indicating that chemically active molecules were involved in the reaction. Different species exhibit different behaviors, representing differences in the composition and amount of electrochemically active molecules in their tissues. These differences can be used not only for rapid identification of species, but also to reflect genetic differences.
It is not a fast method to use DPV curve to identify species, especially when some species have similar profiles. Therefore, it is a scientific way to construct the pattern using electrochemical fingerprint. Figure 3 shows the scatter plots of Q. monimotricha, Q. engleriana, Q. aquifolioides, Q. rehderiana, Q. spinosa, Q. gilliana and Q. pseudosemecarpifolia constructed by electrochemical fingerprints collected under two conditions. The data on the X-axis is the current value of the electrochemical fingerprint collected under PBS after water extraction of different species tissues, while the data on the Y-axis is the current value collected under ABS after ethanol extraction of these species. As you can see, when the two sets of fingerprint data are combined, different species present different scatter plots. Scatter plots of the remaining species are provided in Figures S5 and S6. It can be seen that the difference of scatter plots of different species is greater than the direct DPV profile. This is because the superposition of multidimensional data increases the abundance of data and thus improves the resolution (Dexter et al., 2018; Nonato and Aupetit, 2018). Species identification can be achieved by dividing the scatter map and counting the number of points in the region.
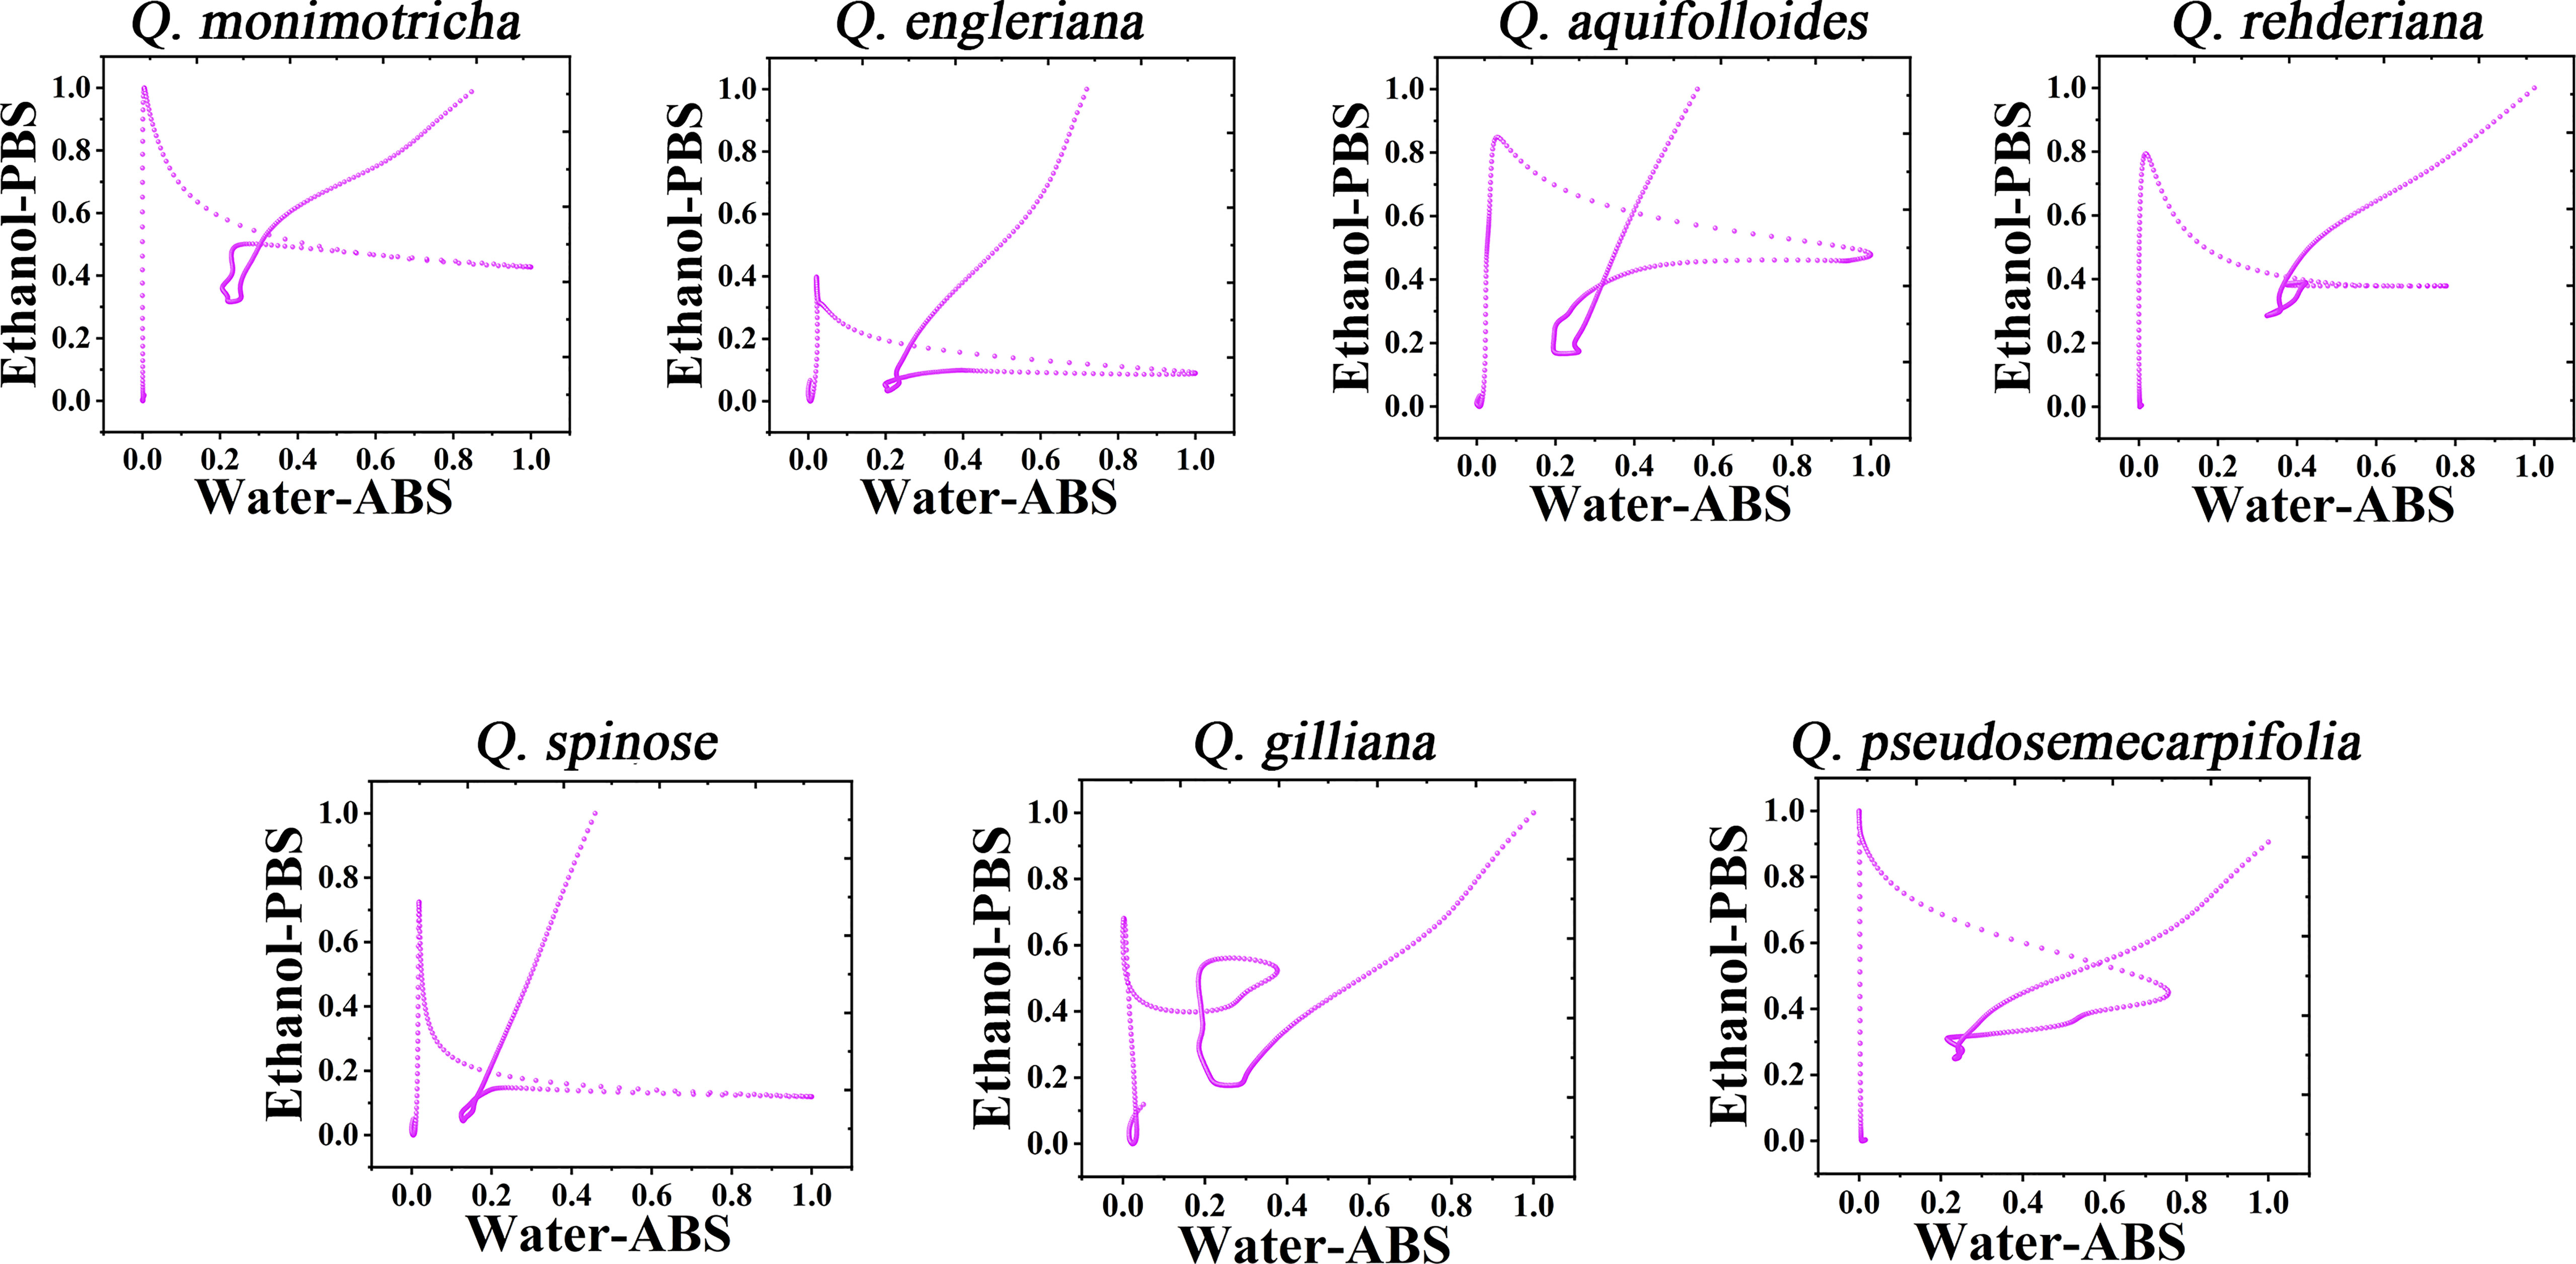
Figure 3 Scatter plots of Q. monimotricha, Q. engleriana, Q. aquifolioides, Q. rehderiana, Q. spinosa, Q. gilliana and Q. pseudosemecarpifolia combining the signals collected under ABS for the water extracts and under PBS for the ethanol extracts.
Further consideration of the distance between points in the scatter plots can obtain a two-dimensional density diagram. In this mode, areas with multiple points appear bright, while areas with fewer points appear dark. Figure 4 shows the 3D density plots of Q. monimotricha, Q. engieriana, Q. aquifolioides, Q. rehderiana, Q. spinosa, Q. gilliana and Q. pseudosemecarpifolia constructed by electrochemical fingerprints collected under two conditions. In this model, differences between species can be identified by targeting the highlighted area directly. For example, the similar Q. engieriana and Q. pseudosemecarpifolia in Figure 1 are not the same in the highlighted area here. More specifically, Q. engleriana was highlighted in (0.20, 0.03) while Q. pseudosemecarpifolia in (0.22, 0.31). 2D density plots of the remaining species are provided in Figures S7 and S8. The similar profiles of Q. engleriana and Q. pseudosemecarpifolia in Figure S1 are not the same in the highlighted area here as well. Q. oxyphylla was highlighted in (0.38, 0.21) while Q. variabilis in (0.25, 0.18).
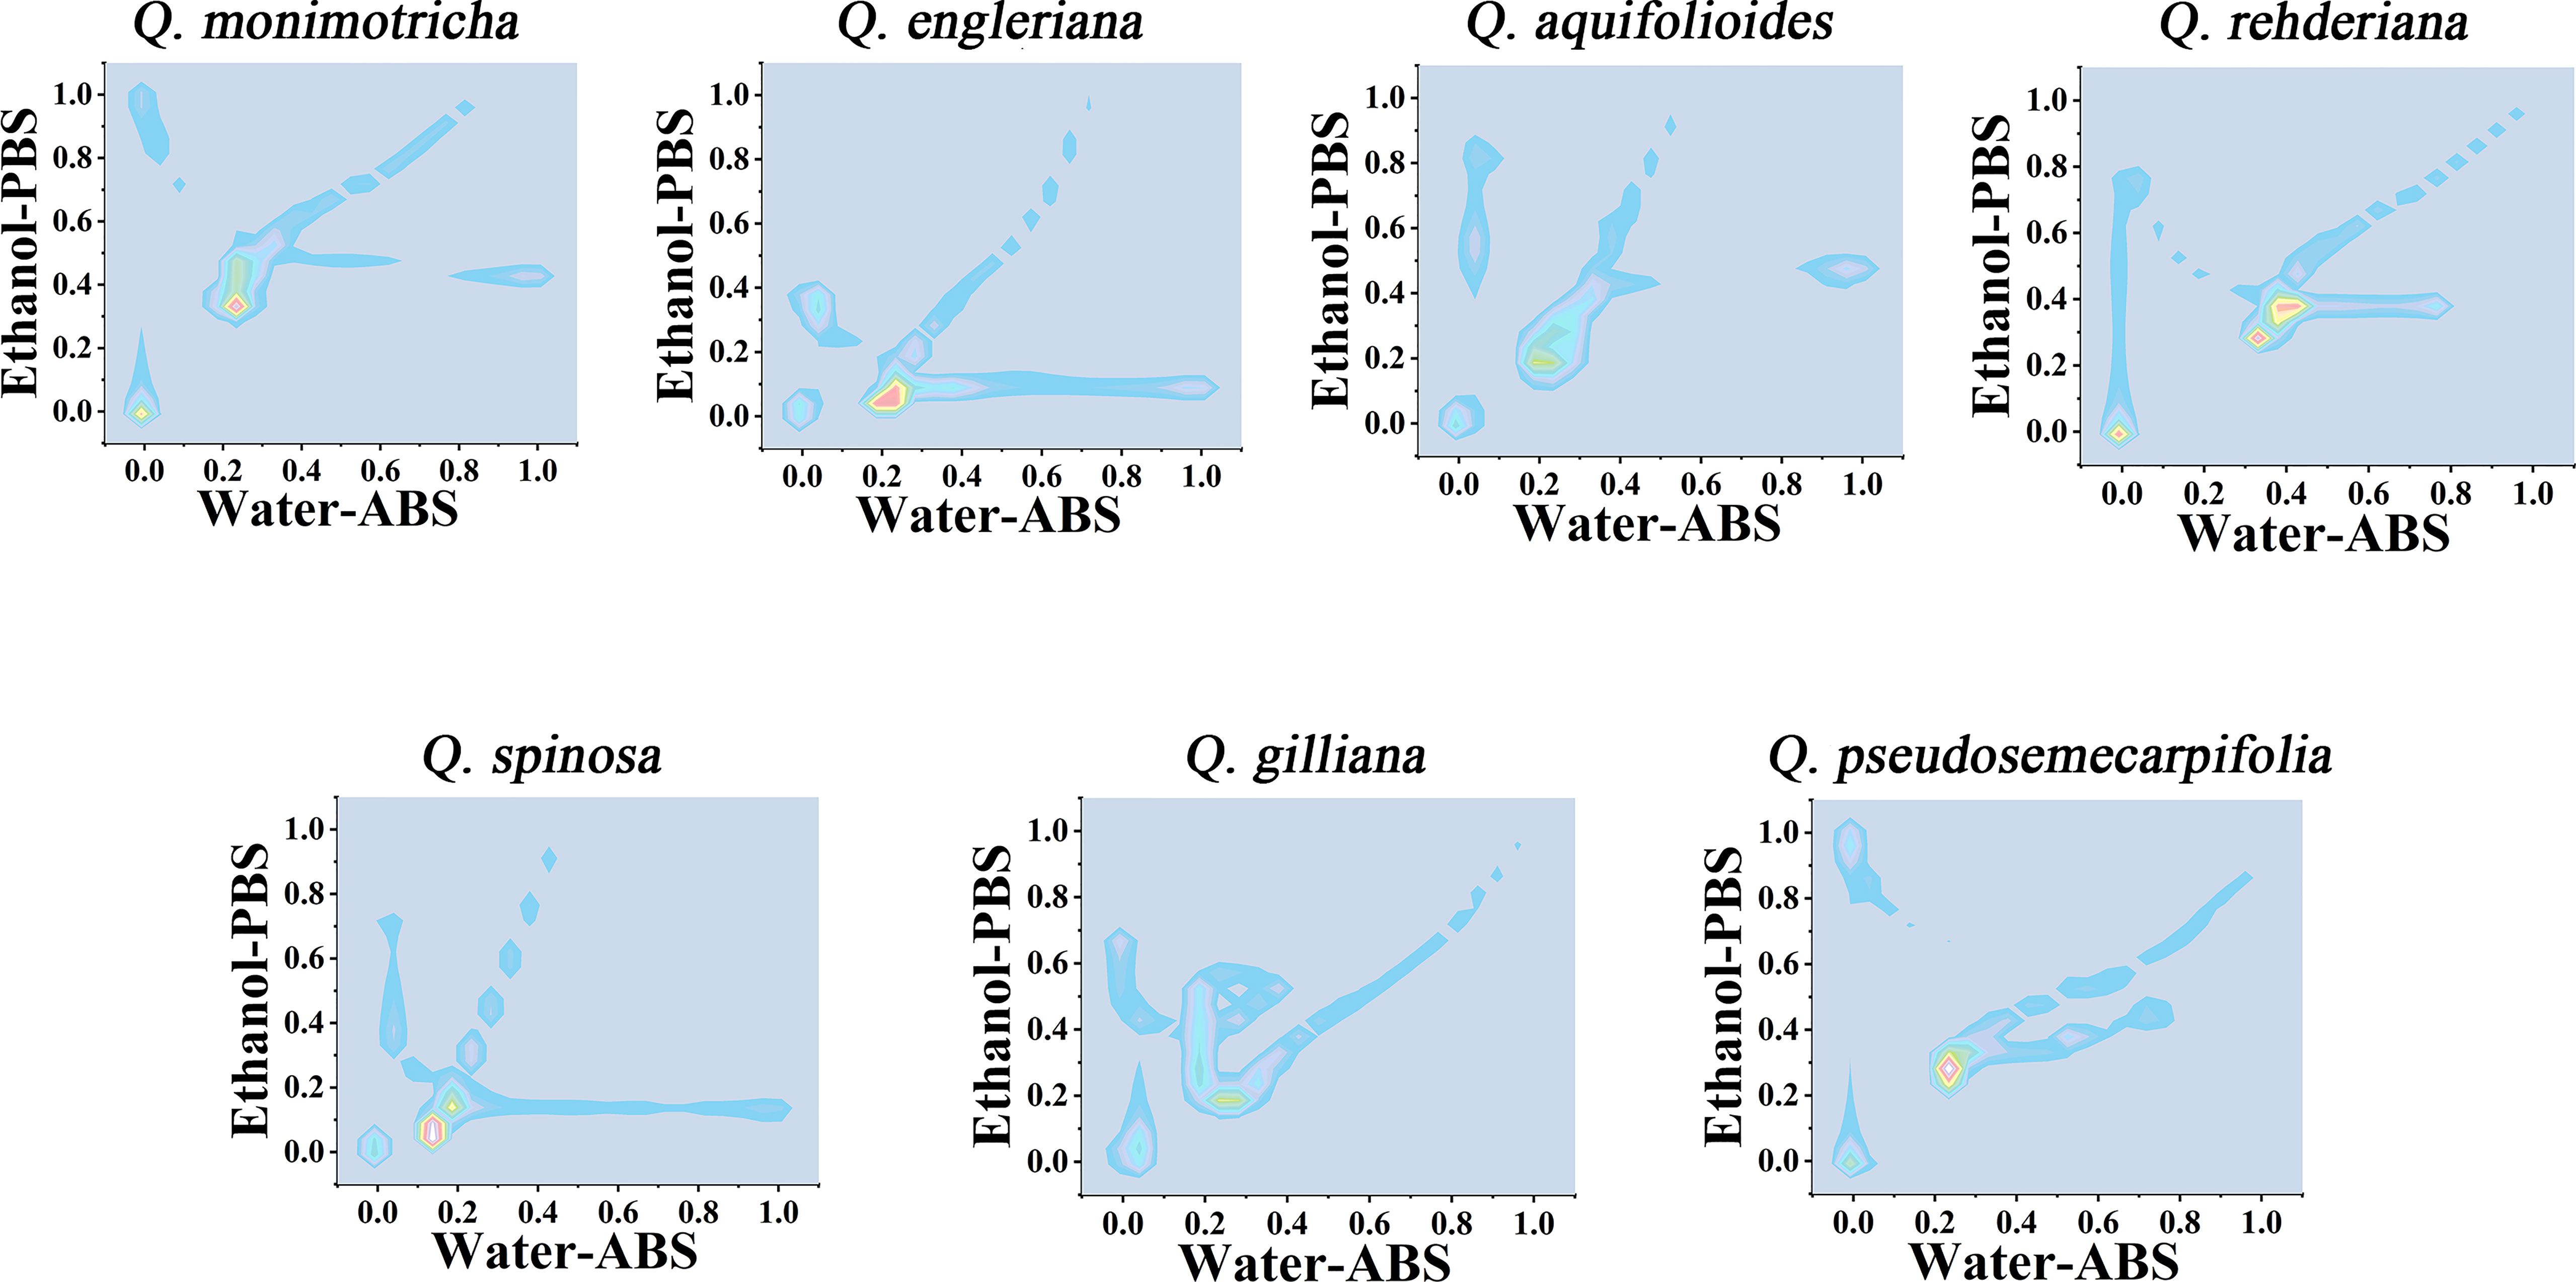
Figure 4 Two-dimensional density map of Q. monimotricha, Q. engleriana, Q. aquifolioides, Q. rehderiana, Q. spinosa, Q. gilliana and Q. pseudosemecarpifolia combining the signals collected under ABS for the water extracts and under PBS for the ethanol extracts.
From the 2D density plots, it was found that the highlights of most species were around 0.2 on the X-axis and 0.4 on the Y-axis. Considering the error of electrochemical fingerprint, this pattern recognition method has a certain probability of misjudgment in theory. However, it was not particularly convenient to determine the unhighlighted areas of the 2D density plots, so we further constructed the heat map using electrochemical fingerprinting. Figure 5 shows the heatmap of Q. monimotricha, Q. engieriana, Q. aquifolioides, Q. rehderiana, Q. spinosa, Q. gilliana and Q. pseudosemecarpifolia constructed by electrochemical fingerprints collected under two conditions. Heat maps can be graded according to the density of data points. Moreover, it divides the whole region equally, which is good for statistical purposes (Hervella et al., 2020). According to the scoring method of different grades, heat maps are more suitable for the identification of different species.
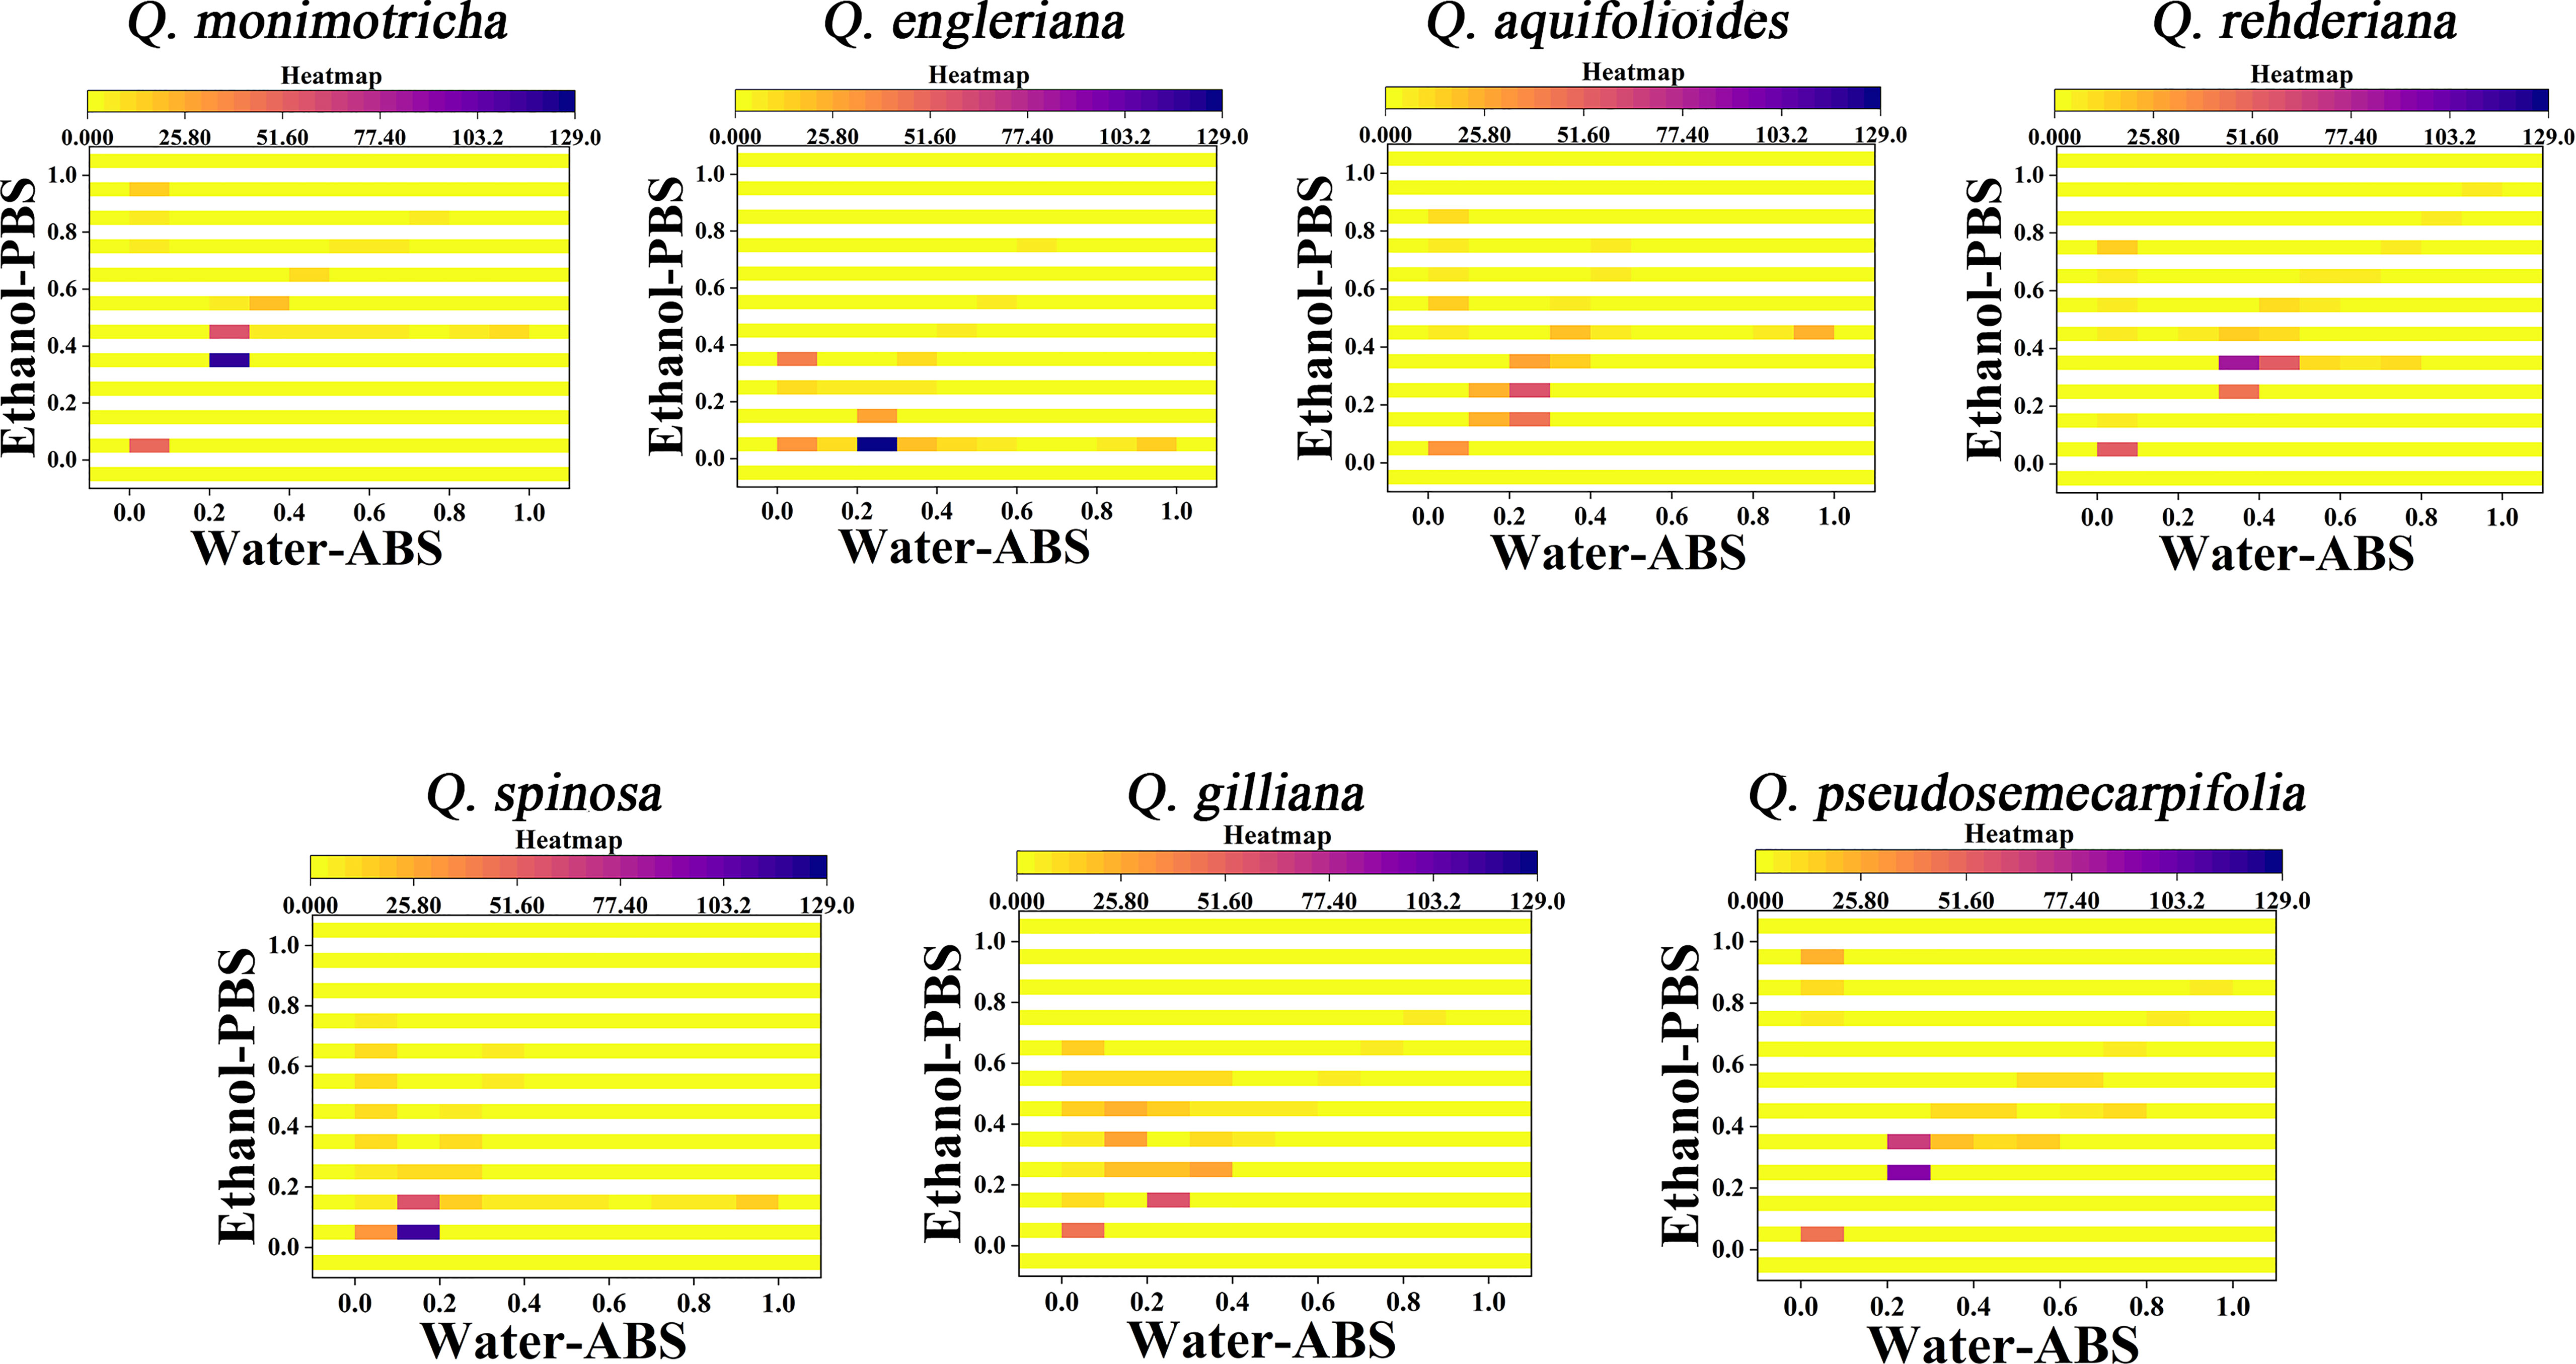
Figure 5 Heatmap of Q. monimotricha, Q. engieriana, Q. aquifolioides, Q. rehderiana, Q. spinosa, Q. gilliana and Q. pseudosemecarpifolia combining the signals collected under ABS for the water extracts and under PBS for the ethanol extracts.
In addition to species identification, another potential application of electrochemical fingerprinting is to use fingerprint differences to investigate phylogenetic position of species. This is because although electrochemical fingerprinting cannot be used for qualitative and quantitative analysis of active molecules in plant tissues, its current value is proportional to their amount. At the same time, the amount and types of electrochemically active substances in plant tissues are regulated by genes. Therefore, differences in electrochemical fingerprints can be used to reflect genetic differences between different species (Fu et al., 2019; Lu et al., 2020; Sun et al., 2021). The electrochemical fingerprint data under different conditions can be used for cluster analysis after the same processing. The collection of electrochemical fingerprinting for more than one condition can increase the abundance of data and provide a more complete picture of electrochemically active molecules in plant tissues. Figure 6 shows the clustering analysis graph constructed by using the electrochemical fingerprints collected under the two conditions. It can be seen from the figure that the whole system tree can be divided into five clusters. Cyclobalanopsis myrsinifolia and Cyclobalanopsis glauca were grouped together as outgroups. This is because they belong to a different genus than other species. However, Q. oxyphylla was also grouped together. We did not find previous reports on Q. oxyphylla in related phylogenetic studies, so we could not compare this result with previous investigations. This result deduced from electrochemical fingerprinting potentially provides a report for future research. Curiously, Q. aquifolioides did not cluster with any other species. In recent years, several molecular markers have been used to study the evolutionary history and population dynamics of Q. aquifolioides, and to reveal the influence of past climate and geological history on the intraspectic radiation evolution of this species (Du et al., 2017). Based on chloroplast fragments (cpDNA), ITS sequences, and microsatellite markers (nSSR), Feng et al. (2016) investigated the evolutionary history and population dynamics of Quercus pseudosemecarpifolia, Quercus aquifolioides, and Quercus rehderiana distributed in the Eastern Himalaya-Hengduan Mountains and their adjacent areas. They reveal the effects of the uplift of the Tibetan Plateau and the quaternary ice age upheaval on the distribution pattern of genetic variation of quercus sclerotiorum species in the region. However, due to the limited number of selected molecular markers and the limitations of selected sample materials, the current studies cannot fully explain their genetic evolution. Unfortunately, the results of electrochemical fingerprinting do not provide further evidence. The remaining species are divided mainly into three clusters. The first cluster is the largest cluster, which contains Q. rehderiana, Q. aliena, Q. monimotricha, Q. gilliana, Q. variabilis and Q. phillyraeoides. Previously, Q. rehderiana, Q. pseudosemecarpifolia and Q. gilliana were merged into a species based on AFLP markers (Zhou et al., 2003). Our results here support the merge of Q. rehderiana and Q. gilliana, but Q. pseudosemecarpifolia is in another cluster. The second cluster includes Q. pseudosemecarpifolia, Q. guajavifolia, Q. longispica, Q. spinosa, Q. engleriana, Q. fimbriata and Q. franchetii. Ju et al. (2019) reported in recent work that Q. pseudosemecarpifolia and Q. longispica can be clustered together. They also reported that Q. guajavifolia and Q. spinosa could be clustered together. The two species Q. engleriana and Q. franchetii are rarely studied and no taxonomic results have been reported. The third cluster includes Q. senescens, Q. baronii, Q. dolicholepis and Q. cocciferoides. This result is partly confirmed by the AFLP analysis (Shuxia et al., 2003; Shuxia et al., 2005). Although many taxonomists have studied Quercus, it is difficult to grasp the taxonomic characters of Quercus because of its large number of species and wide distribution. Many of these species have great morphological variation in different habitats. At the same time, the phenomenon of interspecific hybridization is common in natural environment, which brings some difficulties to phylogenetic study. Our phylogenetic results here, based on electrochemical fingerprinting, provide evidence for some of these arguments as well as new results. This provides a direction for future phylogenetic studies of Quercus.
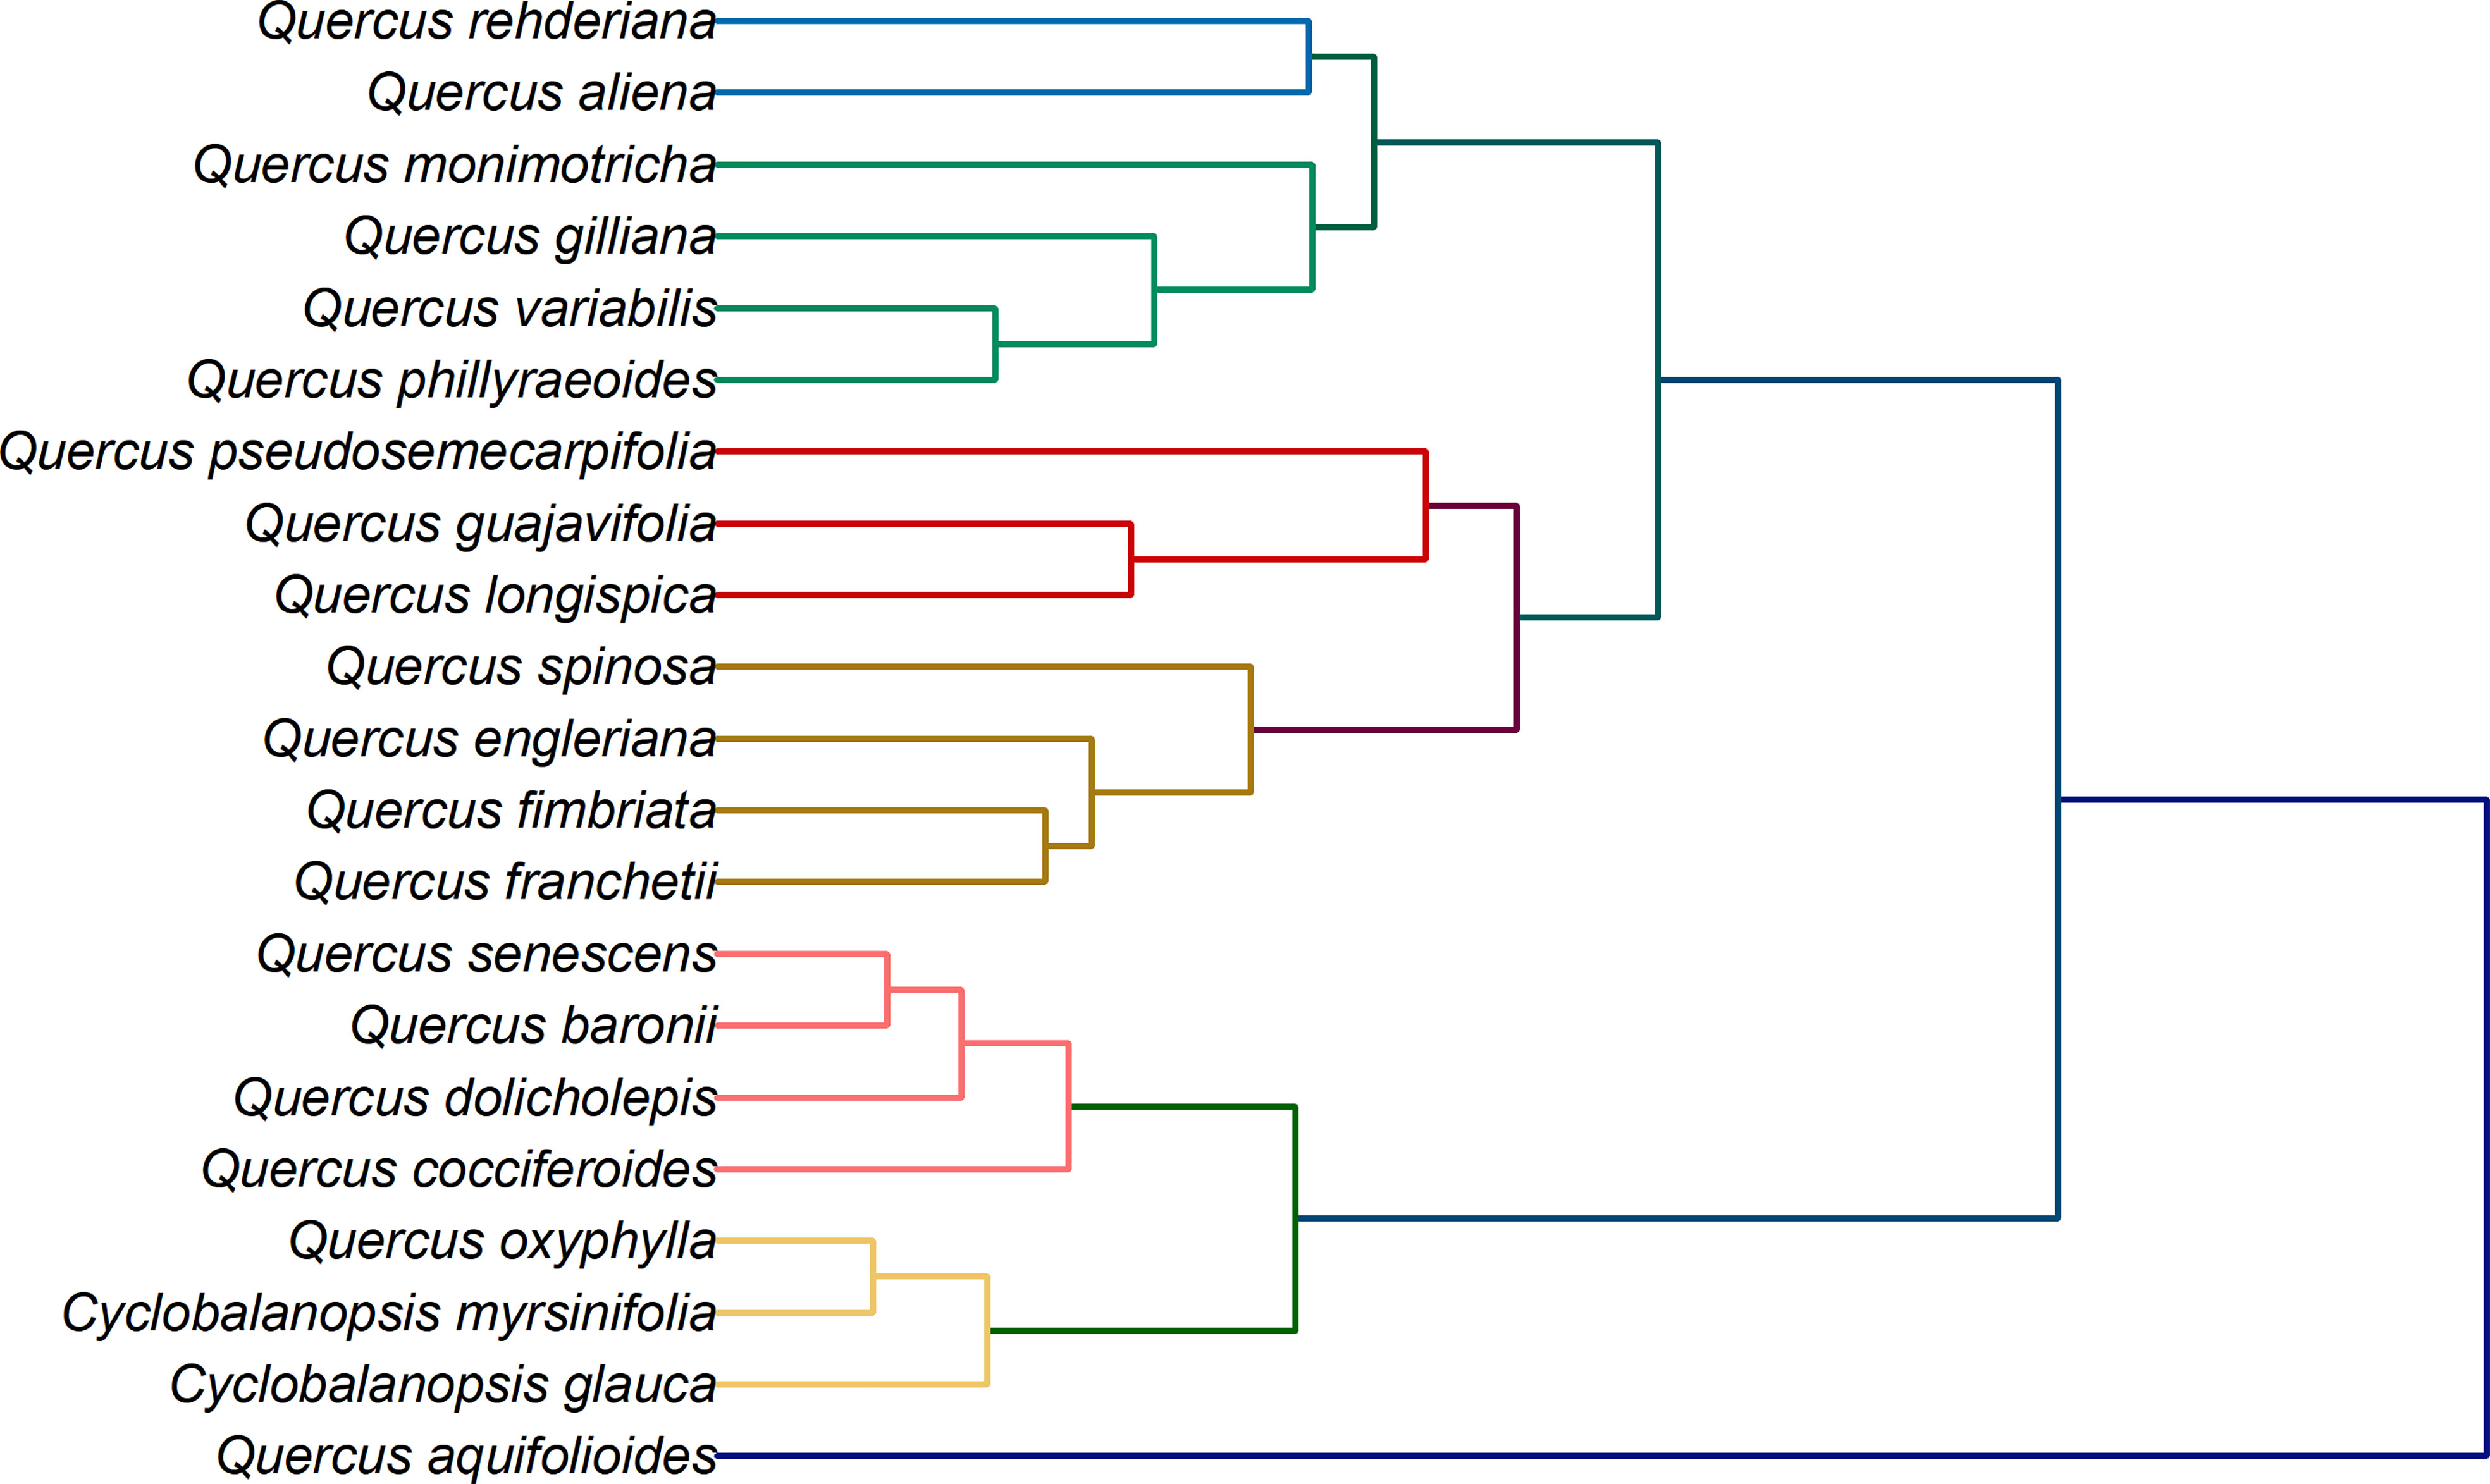
Figure 6 Dendrogram of Q. rehderiana, Q. aliena, Q. monimotricha, Q. gilliana, Q. variabilis, Q. phillyraroides, Q. pseudosemecarpofolia, Q. guajavifolia, Q. longispica, Q. spinosa, Q. engleriana, Q. fimbriata, Q. franchetii, Q. senescens, Q. baronii, Q. dolicholepis, Q. cocciferoides, Q. oxyphylla, Q. aquifolioides, Cyclobalanopsos myrsinifolia and Cyclobalanopsis glauca based on electrochemical fingerprints.
Conclusion
The electrochemical fingerprints of Q. rehderiana, Q. aliena, Q. monimotricha, Q. gilliana, Q. variabilis, Q. phillyraroides, Q. pseudosemecarpofolia, Q. guajavifolia, Q. longispica, Q. spinosa, Q. engleriana, Q. fimbriata, Q. franchetii, Q. senescens, Q. baronii, Q. dolicholepis, Q. cocciferoides, Q. oxyphylla, Q. aquifolioides, Cyclobalanopsos myrsinifolia and Cyclobalanopsis glauca were recorded by their leaf extract under electrolytes. Water and ethanol were selected as extraction solvents while the PBS and ABS were used as supporting electrolyte. The electrochemical fingerprints showed that all Quercus showed similar electrochemical oxidation trends, but each species still had its own unique characteristics. Species identification can be achieved by analyzing electrochemical fingerprints. The electrochemical fingerprints collected under the two conditions can be used to form different pattern recognition, which is faster and more effective than DPV profile. Electrochemical fingerprinting is used to construct phylogenetic trees because it can reflect the differences at the genetic level of different species. Our phylogenetic results here, based on electrochemical fingerprinting, provide evidence for some of these arguments as well as new results. This provides a direction for future phylogenetic studies of Quercus.
Data availability statement
The original contributions presented in the study are included in the article/Supplementary Material. Further inquiries can be directed to the corresponding authors.
Author contributions
LF, QL, and HK contributed conception and design of the study. JH, YS, YZ, and WZ conducted electrochemical experiments. JH, YS, and HK performed the statistical analysis. JH, YZ and QL wrote the manuscript. All authors contributed to the article and approved the submitted version.
Funding
This research was funded by the Second Tibetan Plateau Scientific Expedition and Research Program (STEP) (Grant no. 2019QZKK0301) and Major Program for Basic Research Project of Yunnan Province (202101BC070002).
Conflict of interest
The authors declare that the research was conducted in the absence of any commercial or financial relationships that could be construed as a potential conflict of interest.
Publisher’s note
All claims expressed in this article are solely those of the authors and do not necessarily represent those of their affiliated organizations, or those of the publisher, the editors and the reviewers. Any product that may be evaluated in this article, or claim that may be made by its manufacturer, is not guaranteed or endorsed by the publisher.
Supplementary material
The Supplementary Material for this article can be found online at: https://www.frontiersin.org/articles/10.3389/fpls.2022.962301/full#supplementary-material
References
Øersted, A. S. (1867). Bidrag til egeslægtens systematik. éditeur non identifié. Vidensk Meded Nat For Kjobenhavn, 18, 11–96
Abrams, M. D. (1990). Adaptations and responses to drought in quercus species of north America. Tree Physiol. 7, 227–238. doi: 10.1093/treephys/7.1-2-3-4.227
Berkov, S., Viladomat, F., Codina, C., Suárez, S., Ravelo, A., Bastida, J. (2012). GC-MS of amaryllidaceous galanthamine-type alkaloids. J. Mass Spectrom. 47, 1065–1073. doi: 10.1002/jms.3059
Cavender-Bares, J., Ackerly, D. D., Baum, D., Bazzaz, F. (2004a). Phylogenetic overdispersion in Floridian oak communities. Am. Nat. 163, 823–843. doi: 10.1086/386375
Cavender-Bares, J., Kitajima, K., Bazzaz, F. (2004b). Multiple trait associations in relation to habitat differentiation among 17 Floridian oak species. Ecol. Monogr. 74, 635–662. doi: 10.1890/03-4007
Chaudhri, S. N., Rajput, N. S., Alsamhi, S. H., Shvetsov, A. V., Almalki, F. A. (2022). Zero-padding and spatial augmentation-based gas sensor node optimization approach in resource-constrained 6G-IoT paradigm. Sensors 22, 3039. doi: 10.3390/s22083039
Chevalier, A., Camus, A. (1954). L’Œuvre de e. poilane en indochine de 1918 à 1942. J. Agric. Tradit. Bot. Appliquée 1, 385–406.
Denk, T., Grimm, G. W. (2010). The oaks of western Eurasia: traditional classifications and evidence from two nuclear markers. Taxon 59, 351–366. doi: 10.1002/tax.592002
Dexter, E., Rollwagen-Bollens, G., Bollens, S. M. (2018). The trouble with stress: A flexible method for the evaluation of nonmetric multidimensional scaling. Limnol. Oceanogr. Methods 16, 434–443. doi: 10.1002/lom3.10257
Du, F. K., Hou, M., Wang, W., Mao, K., Hampe, A. (2017). Phylogeography of quercus aquifolioides provides novel insights into the neogene history of a major global hotspot of plant diversity in south-west China. J. Biogeogr. 44, 294–307. doi: 10.1111/jbi.12836
Fan, B., Wang, Q., Wu, W., Zhou, Q., Li, D., Xu, Z., et al. (2021). Electrochemical fingerprint biosensor for natural indigo dye yielding plants analysis. Biosensors 11, 155. doi: 10.3390/bios11050155
Farooq, M. U., Wang, X., Hawbani, A., Khan, A., Ahmed, A., Alsamhi, S., et al. (2022). POWER: probabilistic weight-based energy-efficient cluster routing for large-scale wireless sensor networks. J. Supercomput. 78, 12765–12791. doi: 10.1007/s11227-022-04372-z
Feng, L., Zheng, Q.-J., Qian, Z.-Q., Yang, J., Zhang, Y.-P., Li, Z.-H., et al. (2016). Genetic structure and evolutionary history of three alpine sclerophyllous oaks in East himalaya-hengduan mountains and adjacent regions. Front. Plant Sci. 7, 1688. doi: 10.3389/fpls.2016.01688
Fu, L., Wu, M., Zheng, Y., Zhang, P., Ye, C., Zhang, H., et al. (2019). Lycoris species identification and infrageneric relationship investigation via graphene enhanced electrochemical fingerprinting of pollen. Sens. Actuators B Chem. 298, 126836. doi: 10.1016/j.snb.2019.126836
Fu, L., Zhang, X., Ding, S., Chen, F., Lv, Y., Zhang, H., et al. (2022). Recent developments in the electrochemical determination of sulfonamides. Curr. Pharm. Anal. 18, 4–13. doi: 10.2174/1573412917999201006195229
Fu, L., Zheng, Y., Wang, A., Zhang, P., Ding, S., Wu, W., et al. (2021). Identification of medicinal herbs in asteraceae and polygonaceae using an electrochemical fingerprint recorded using screen-printed electrode. J. Herb. Med. 30, 100512. doi: 10.1016/j.hermed.2021.100512
Fu, L., Zheng, Y., Zhang, P., Zhang, H., Xu, Y., Zhou, J., et al. (2020). Development of an electrochemical biosensor for phylogenetic analysis of amaryllidaceae based on the enhanced electrochemical fingerprint recorded from plant tissue. Biosens. Bioelectron. 159, 112212. doi: 10.1016/j.bios.2020.112212
Hervella, Á.S., Rouco, J., Novo, J., Penedo, M. G., Ortega, M. (2020). Deep multi-instance heatmap regression for the detection of retinal vessel crossings and bifurcations in eye fundus images. Comput. Methods Programs Biomed. 186, 105201. doi: 10.1016/j.cmpb.2019.105201
Ismail, A. S., Wang, X., Hawbani, A., Alsamhi, S., Abdel Aziz, S. (2022). Routing protocols classification for underwater wireless sensor networks based on localization and mobility. Wirel. Netw. 28, 797–826. doi: 10.1007/s11276-021-02880-z
Jin, Z. (2009). Amaryllidaceae and sceletium alkaloids. Nat. Prod. Rep. 26, 363–381. doi: 10.1039/b718044f
Ju, M.-M., Feng, L., Yang, J., Yang, Y.-C., Chen, X.-D., Zhao, G.-F. (2019). Evaluating population genetic structure and demographic history of quercus spinosa (Fagaceae) based on specific length amplified fragment sequencing. Front. Genet. 965. doi: 10.3389/fgene.2019.00965
Karimi-Maleh, H., Khataee, A., Karimi, F., Baghayeri, M., Fu, L., Rouhi, J., et al. (2021a). A green and sensitive guanine-based DNA biosensor for idarubicin anticancer monitoring in biological samples: A simple and fast strategy for control of health quality in chemotherapy procedure confirmed by docking investigation. Chemosphere 291, 132928. doi: 10.1016/j.chemosphere.2021.132928
Karimi-Maleh, H., Orooji, Y., Karimi, F., Alizadeh, M., Baghayeri, M., Rouhi, J., et al. (2021b). A critical review on the use of potentiometric based biosensors for biomarkers detection. Biosens. Bioelectron. 184, 113252. doi: 10.1016/j.bios.2021.113252
Łaska, G., Sieniawska, E., Świątek, Ł., Zjawiony, J., Khan, S., Boguszewska, A., et al. (2019). Phytochemistry and biological activities of polemonium caeruleum l. Phytochem. Lett. 30, 314–323. doi: 10.1016/j.phytol.2019.02.017
Lu, Y., Xu, Y., Shi, H., Zhang, P. Z. H., Fu, L. (2020). Feasibility of electrochemical fingerprinting for plant phylogeography study: A case of chimonanthus praecox. Int. J. Electrochem Sci. 15, 758–764. doi: 10.20964/2020.01.64
Manos, P. S., Doyle, J. J., Nixon, K. C. (1999). Phylogeny, biogeography, and processes of molecular differentiation in quercus subgenus quercus (Fagaceae). Mol. Phylogenet. Evol. 12, 333–349. doi: 10.1006/mpev.1999.0614
Manos, P. S., Stanford, A. M. (2001). The historical biogeography of fagaceae: tracking the tertiary history of temperate and subtropical forests of the northern hemisphere. Int. J. Plant Sci. 162, S77–S93. doi: 10.1086/323280
Moro, G., Barich, H., Driesen, K., Felipe Montiel, N., Neven, L., Domingues Mendonça, C., et al. (2020). Unlocking the full power of electrochemical fingerprinting for on-site sensing applications. Anal. Bioanal. Chem. 412, 5955–5968. doi: 10.1007/s00216-020-02584-x
Nixon, K. C. (1993). Infrageneric classification of quercus (Fagaceae) and typification of sectional names. Annales des Sciences Forestieres, 50 (Suppl.1), 25s–34s. doi: 10.1051/forest:19930701
Nonato, L. G., Aupetit, M. (2018). Multidimensional projection for visual analytics: Linking techniques with distortions, tasks, and layout enrichment. IEEE Trans. Vis. Comput. Graph. 25, 2650–2673. doi: 10.1109/TVCG.2018.2846735
Ousaaid, D., Mechchate, H., Laaroussi, H., Hano, C., Bakour, M., El Ghouizi, A., et al. (2021). Fruits vinegar: Quality characteristics, phytochemistry, and functionality. Molecules 27, 222. doi: 10.3390/molecules27010222
Peng, Y.-S., Chen, L., Li, J.-Q. (2007). Study on numerical taxonomy of quercus L.(Fagaceae) in China. J. Wuhan Bot. Res. 25, 149–157. doi: 10.3969/j.issn.2095-0837.2007.02.008
Shimaji, K. (1962). Anatomical studies on the phylogenetic interrelationship of the genera in the fagaceae. Bull. Tokyo Univ For 57, 1–60.
Wang, S., Hu, Y., Zhou, Z. (2003). AFLP analysis of genetic variation and structure of natural populations of Quercus senescens. Plant Divers. 25, 1. doi: CNKI:SUN:YOKE.0.2005-01-007
Wang, S., Hu, Y., Zhou, Z. (2005). AFLP analysis of genetic variation and structure of natural populations of Quercus senescen. Acta Bot. Yunnanica 27, 49–58. doi: 10.3969/j.issn.2095-0845.2005.01.006
Sun, Y., Gong, D., Sun, G. (2021). Quality monitoring and evaluation of powdered poppy capsule extractive by multiple wavelengths matching average fusion chromatographic fingerprint combined with electrochemical fingerprint. Microchem. J. 169, 106516. doi: 10.1016/j.microc.2021.106516
Trelease, W. L. (1924). The american oaks. Memoirs of the National Academy of Sciences (US Government Printing Office). 20, 1–255.
Wang, D., Li, D., Fu, L., Zheng, Y., Gu, Y., Chen, F., et al. (2021). Can electrochemical sensors be used for identification and phylogenetic studies in lamiaceae? Sensors 21, 8216. doi: 10.3390/s21248216
Xu, Y., Lu, Y., Zhang, P., Wang, Y., Zheng, Y., Fu, L., et al. (2020). Infrageneric phylogenetics investigation of chimonanthus based on electroactive compound profiles. Bioelectrochemistry 133, 107455. doi: 10.1016/j.bioelechem.2020.107455
Ye, W., Zheng, Y., Zhang, P., Fan, B., Li, Y., Fu, L. (2021). Identification of species in lycoris spp. from stigmatic exudate using electrochemical fingerprints. Int. J. Electrochem Sci. 16, 211041. doi: 10.20964/2021.10.56
Zheng, Y., Li, X., Han, F., Fu, L., Sun, J. (2021a). Identification of foliage plants heuchera based on electrochemical profile of active molecules. Int. J. Electrochem Sci. 16, 211136. doi: 10.20964/2021.11.44
Zheng, Y., Wang, D., Li, X., Wang, Z., Zhou, Q., Fu, L., et al. (2021b). Biometric identification of taxodium spp. and their hybrid progenies by electrochemical fingerprints. Biosensors 11, 403. doi: 10.3390/bios11100403
Zhou, Z., Pu, C., Chen, W. (2003). Relationships between the distributions of quercus sect heterobalanus (Fagaceae) and uplift of Himalayas. Adv. Earth Sci. 18, 884–890. doi: 10.11867/j.issn.1001-8166.2003.06.0884
Keywords: electrochemical fingerprint, phytochemistry, electrochemical sensor, pattern recognition, phylogenetics
Citation: Hu J, Shen Y, Zheng Y, Zhou W, Karimi-maleh H, Liu Q and Fu L (2022) Electrochemical fingerprinting sensor for plant phylogenetic investigation: A case of sclerophyllous oak. Front. Plant Sci. 13:962301. doi: 10.3389/fpls.2022.962301
Received: 06 June 2022; Accepted: 24 October 2022;
Published: 09 November 2022.
Edited by:
Paul Weckler, Oklahoma State University, United StatesReviewed by:
Linchun Shi, Institute of Medicinal Plant Development, Chinese Academy of Medical Sciences and Peking Union Medical College, ChinaSaeed Hamood Alsamhi, Ibb University, Yemen
Copyright © 2022 Hu, Shen, Zheng, Zhou, Karimi-maleh, Liu and Fu. This is an open-access article distributed under the terms of the Creative Commons Attribution License (CC BY). The use, distribution or reproduction in other forums is permitted, provided the original author(s) and the copyright owner(s) are credited and that the original publication in this journal is cited, in accordance with accepted academic practice. No use, distribution or reproduction is permitted which does not comply with these terms.
*Correspondence: Li Fu, ZnVsaUBoZHUuZWR1LmNu; Qing Liu, bGl1cWluZ0BjaWIuYWMuY24=