- Department of Plant Science, School of Agriculture and Biology, Shanghai Jiao Tong University, Shanghai, China
The root system is essential for the stable growth of plants. Roots help anchor plants in the soil and play a crucial role in water uptake, mineral nutrient absorption and endogenous phytohormone formation. Root-restriction (RR) cultivation, a powerful technique, confines plant roots to a specific soil space. In the present study, roots of one-year-old “Muscat Hamburg” grapevine under RR and control (nR) treatments harvested at 70 and 125 days after planting were used for transcriptome sequencing, and in total, 2031 (nR7 vs. nR12), 1445 (RR7 vs. RR12), 1532 (nR7 vs. RR7), and 2799 (nR12 vs. RR12) differentially expressed genes (DEGs) were identified. Gene Ontology (GO) enrichment analysis demonstrated that there were several genes involved in the response to different phytohormones, including abscisic acid (ABA), auxin (IAA), ethylene (ETH), gibberellins (GAs), and cytokinins (CTKs). Among them, multiple genes, such as PIN2 and ERF113, are involved in regulating vital plant movements by various phytohormone pathways. Moreover, following RR cultivation, DEGs were enriched in the biological processes of plant-type secondary cell wall biosynthesis, the defense response, programmed cell death involved in cell development, and the oxalate metabolic process. Furthermore, through a combined analysis of the transcriptome and previously published microRNA (miRNA) sequencing results, we found that multiple differentially expressed miRNAs (DEMs) and DEG combinations in different comparison groups exhibited opposite trends, indicating that the expression levels of miRNAs and their target genes were negatively correlated. Furthermore, RR treatment indeed significantly increased the ABA content at 125 days after planting and significantly decreased the IAA content at 70 days after planting. Under RR cultivation, most ABA biosynthesis-related genes were upregulated, while most IAA biosynthesis-related genes were downregulated. These findings lay a solid foundation for further establishing the network through which miRNAs regulate grapevine root development through target genes and for further exploring the molecular mechanism through which endogenous ABA and IAA regulate root architecture development in grapevine.
Introduction
Roots, which are the most crucial parts of plants, collectively form a root system, which is vital for growth and for anchoring plants into the soil and plays a pivotal role in water and mineral nutrient absorption as well as the formation of endogenous phytohormones (Tardieu, 1996; Hopmans and Bristow, 2002). Grapevine roots, which are fleshy, are crucial for storing essential nutrients. Thus, grapevine farmers continuously seek strategies to keep the root system healthy (Richards, 1983). Grapevine is propagated via cuttings because they are easily obtained, and roots quickly emerge from cuttings and maintain the characteristics of the female parent (Smart et al., 2006). Previous research indicated that the roots produced by grapevine cuttings can be classified into five stages based on the various development stages: initial cultivation (stage I), preliminary development (stage II), even change (stage III), root system formation (stage IV), and root architecture stability (stage V) (Li et al., 2020a). Other studies have demonstrated that multiple environmental factors, including soil substrate selection, nutrition, and irrigation, have an important role in fostering root vigor and vitality (Cornish et al., 1984; Van Zyl, 1984).
Root restriction (RR) cultivation is an agronomic technique that has been largely developed in recent years. It involves the use of some physical or ecological methods to control the range of plant root systems in a particular soil space as well as the regulation of vegetative and reproductive growth through the regulation of the development of roots for obtaining high yields and high efficiency in grapevine production (Wang et al., 2001, 2012; Yu et al., 2015). For example, the total sugar content of grape juice as well as grape berries under RR cultivation was found to be higher than that of control fruits, and acid invertase was the most critical enzyme that induces sugar accumulation (Xie et al., 2009). Duan et al. (2019) demonstrated that RR significantly affected the metabolome of berry pericarp tissue, especially the accumulation of anthocyanins before the veraison stage, accompanied by advanced veraison stage of grape berries. It has been reported that the grapevine root architecture under RR cultivation is different from that under standard cultivation; the root system displayed an increase in adventitious and lateral root numbers and root tip degeneration after RR cultivation. Moreover, the roots exhibited spiral curling, which contributed to an accelerated root metabolic rate; the ability of roots to absorb nutrients increased, which directly led to a significant improvement of fruit quality (Li et al., 2020b). During the growth of grapevine, the content of endogenous phytohormones changes significantly, along with the development of phenotypes and the improvement of fruit quality. Interestingly, it has been confirmed that the formation of several phenotypic parameters (sugar accumulation, pericarp coloration, and root architecture improvement) under RR cultivation is affected by endogenous ABA and IAA levels. Guo et al. (2014) reported that the ABA contents in the roots, stems, leaves and berries of grapevine under RR cultivation were significantly higher than those of the control group, while the IAA contents in roots, stems and leaves of grapevine under RR cultivation were significantly lower than those of the control group (Leng et al., 2018; Li et al., 2022c). Further investigation at the molecular level verified that 12 DEGs involved in ABA biosynthetic or catabolic pathways, including crtZ, ZEP/ABA1, NCED, ABA2, AAO3 and CYP707A, were identified under RR cultivation, which strongly indicated that root restriction had the greatest impact on the biosynthesis and catabolism of ABA and ultimately regulated the occurrence of a series of biological activities in grapevine plant by mediating the formation of ABA (Li D. et al., 2021). In addition, RR cultivation increased the ABA content in “Muscat Hamburg” grape berries and significantly increased the expression level of the ABA response factor VvGRIP55 in fruits at the early veraison stage, veraison stage and maturity stage. The binding of VvGRIP55 to the promoter of the transcription factor VvMYB15 transcription factor regulates sugar accumulation and activates VvMYB15 expression, and VvMYB15 transcription factor further binds to the promoter of the sugar transport gene VvSWEET10 and activates its expression, ultimately promoting sugar accumulation in grape berries (Li et al., 2022a). Moreover, both RR-inducible transcription factors (VvMYB15 transcription factor and VvWRKY40 transcription factor) specifically bind to the promoter regions of VvF3′5′H and VvUFGT, confirming that VvMYB15 transcription factor and VvWRKY40 transcription factor synergistically promote anthocyanin accumulation and increase the expression levels of anthocyanin biosynthesis-related genes (Li et al., 2022b). Because RR mainly restricts the growth of vine roots by physical means, the change in root configuration under RR cultivation has also been the focus of research. However, the relationship between the variation in ABA or IAA levels under RR cultivation and the differences in the grape root system remain unknown.
In recent years, sequencing technology has developed quickly and has played an essential role in studying biological issues (Slatko et al., 2018). Generally, the transcriptome refers to the collection of all the transcripts, including mRNA, rRNA, tRNA, and non-coding RNA, in a cell under a particular physiological condition (Longo et al., 2021). Transcriptomics can be used to study gene function and structure at the whole-plant level to study specific biological processes. Transcriptomics has been widely used in plant candidate gene discovery, functional identification, and genetic improvement. RNA sequencing (RNA-seq) technology has become a vital means of transcriptome research (An et al., 2018). At present, RNA-seq has been extensively applied to model plant species such as maize (Zea mays), Arabidopsis thaliana, rice (Oryza sativa), and tomato (Solanum lycopersicum) (Zhang et al., 2010; Hansey et al., 2012; Zhu et al., 2015; Klepikova et al., 2016). High-throughput sequencing technology has revolutionized the sequencing process in plant science. Specifically, transcriptome sequencing was performed on grape berries and roots after plastic film mulching and grass cover, the findings of which revealed changes in tannin, anthocyanin, soluble solids, and titratable acid contents in the berries (Mir et al., 2019). These changes may be related to high-affinity nitrate transporter 2.1 (NRT2.1), NRT2.4, and glutamine synthetase expression detected in the roots, indicating that mulching could improve fruit quality by activating nitrogen transport (Wang et al., 2020). In addition, the primary mechanism of calcium-induced anthocyanin biosynthesis revealed by transcriptome sequencing and the findings associated with DEGs show that this mechanism might affect grape pericarp coloring in multiple calcium transport and signal transduction pathways. Validating transcriptome sequencing is an indispensable step in revealing the improvement of plant phenotypes (Yu et al., 2020). The above findings provide ideas and directions for further research on combining transcriptome data to elucidate molecular mechanisms to illustrate the development of different grapevine organs. However, unfortunately, research on further revealing the changes in root architecture under RR cultivation by transcriptome sequencing has not yet been carried out.
In this study, a transcriptome sequencing-based study of gene expression variation in grapevine roots during conventional and RR cultivation was implemented. The mechanism through which miRNAs act on target genes during grapevine root development was examined, followed by a transcriptome sequencing correlation analysis with published miRNA sequencing data, aiming to determine the synergistic/antagonistic effects of transcriptional regulation and posttranscriptional regulation on root development in grapevine. Additionally, the contents of various endogenous phytohormones and the expression levels of ABA and IAA biosynthesis- and catabolism-related genes under the two cultivation modes were also measured to validate our previous hypothesis that endogenous ABA and IAA play vital roles in the changes in grape root architecture and to provide reliable reference data for prospective studies on the molecular mechanisms governing variations in root architecture regulated by endogenous ABA and IAA under RR cultivation.
Materials and methods
Plant materials and experimental design
A 1-year-old grapevine (Vitis vinifera L. cv. “Muscat Hamburg”) cuttings were planted in the greenhouse of the Fruit Tree Laboratory at Shanghai Jiao Tong University (31°110 N, 121°290 W) in 2017. All the cuttings were planted in a mixture of substrate soil, organic fertilizer, and perlite (1:1:1). The roots were restricted to a container with a diameter of 30 cm and a height of 30 cm; this container was separated from the ground by a tray during RR cultivation. Under regular cultivation (referred to as nR), the cuttings were cultivated on the ground in 40 cm tall beds consisting of mixed substrate. The aboveground management and irrigation practices were the same. All of treatments involved single-vine growth with no topping. Then, 24 grapevine root samples from the two different cultivation treatments were collected at 12 time points (10, 20, 30, 40, 50, 60, 70, 80, 90, 100, 110, and 125 days after planting). According to previous root morphology observations, the root architecture differed beginning 70 days after planting (DAP) under root restriction cultivation.
Transcriptome sequencing library construction
The same grapevine root samples previously harvested for miRNA sequencing (sampled at 70 and 125 days after planting) under RR and nR cultivation were used for transcriptome sequencing. These four root samples were named nR7, nR12, RR7, and RR12, as shown in Supplementary Figure 1. A total of three biological replicates were evaluated, recorded as A, B, and C. The sequencing was performed by staff at Shanghai OE Biomedical Technology Co., Ltd. (SHN, China).
According to the manufacturer’s instructions, total RNA was extracted from the roots using the CTAB method (Gambino et al., 2008). The concentration and purity of the RNA were detected with a NanoDrop 2000 (Thermo Fisher Scientific, United States) and an Agilent 2100 Bioanalyzer (Agilent Technologies, United States). Magnetic beads with Oligo (dT) were used for mRNA enrichment and were broken into short fragments. The fragmented mRNAs were reverse transcribed with six-base random primers to generate single-stranded cDNA, after which double-stranded cDNA was synthesized. After a purification process, the double-stranded cDNA was subjected to PCR amplification, polyadenylated, and ligated to sequencing adapters. The length and quality of the library were determined by an Agilent 2100 Bioanalyzer and sequenced using an Illumina HiSeq™ 2500. The raw RNA sequencing data have been uploaded and deposited into the National Center for Biotechnology Information (NCBI) BioProject database under accession number PRJNA808789.
Analysis of protein-coding gene expression
The raw sequencing data were preprocessed by Trimmomatic software (Bolger et al., 2014). The quality control steps included (1) removing the adaptors; (2) removing low-quality reads; and (3) removing low-quality bases from the 3′ and 5′ ends and obtaining clean reads. The clean read sequences were aligned to the grapevine Pinot Noir genome sequence1, and the number of mapped reads as well as the position information of the reads aligned to the genome was recorded. HTSeq-count software was used to compare the number of reads with the number of protein-coding genes in each sample (Anders et al., 2015), and cufflinks software was used to calculate the FPKM (fragments per kilobase per million reads) value of the protein-coding genes (Roberts et al., 2011). The calculation formula for FPKM is FPKM(A) = number of fragments aligned to gene A/number of components aligned to all genes × length of gene (A) × 109.
Analysis of differentially expressed genes
According to the calculated FPKM values, the genes differentially expressed between different samples were analyzed. The primary screening steps were as follows: (1) DESeq software was used to standardize the number of gene counts in each sample (finally, the basal value was used to estimate the expression level) (Anders and Huber, 2012), and the different expression fold-changes were calculated. (2) A negative binomial distribution test was performed to determine the significance of the different readings. Two criteria were used to determine the same gene’s differential expression between comparison samples. One is based on the expression fold-change, which is the fold-change of the expression level of the same gene between two samples. The other is based on the FDR value, which was calculated by first calculating the p value of each gene and then using the FDR error control method to correct the p value for multiple hypothesis testing. The criteria for the final screened DEGs were p < 0.05 and an expression fold-change greater than 2. GO (Gene Ontology) enrichment analysis was performed after obtaining the DEGs. The GO entries for which the number of DEGs was greater than 2 in the classification categories of biological function, cell composition, and molecular function were screened (Alexa and Rahnenführer, 2009).
MicroRNA target gene prediction
The TargetFinder website was used to predict the target genes of differentially expressed miRNAs using previously available miRNA sequencing data collected from grapevine under root restriction (accession number: PRJNA601829) (Bo and Wang, 2005). Moreover, we compared the predicted target genes with the DEGs in the transcriptome data to identify the combinations of differentially expressed miRNAs and target genes.
Extraction and determination of endogenous phytohormone contents
Abscisic acid, IAA, GA, methyl jasmonate (MeJA), brassinolide (BR), and zeatin riboside (ZR) were extracted according to our published methods, with minor modifications (Li J. et al., 2021). Grape berries without seeds were crushed into a powder in liquid nitrogen, and 50 mg of the powder and an extraction solution (80% methanol, v/v) were mixed together. After centrifuging at 10,000 rpm for 20 min, the supernatant was eluted through a SepPak C18 cartridge (Waters, MA, United States) to remove polar compounds. Finally, 0.5 mL extracting solution containing ABA, IAA, GA, MeJA, BR, and ZR were obtained, and three biological replicates were included.
A Poroshell EC-120 (3 μm × 4.6 mm × 100 mm) C18 column (Waters, MA, United States) installed in UPLC-HRMS system (Waters, MA, United States), was used for compound separation. The elution solutions included solvent A (0.1% acetic acid in water) and solvent B (0.05% acetic acid in acetonitrile). The flow rate in the UPLC-HRMS system was set to 0.3 mL/min. The gradient elution program was as follows: 0–6.25 min, 10% B; 6.25–7.5 min, 40% B; 7.5–10.6 min, 90% B; and 10.6–13.5 min, 10% B. Next, after measured the peak area of standards (ABA, IAA, GA, MeJA, BR, ZR with suitable concentration gradient) in the same UPLC-HRMS system, the standard curves of each phytohormone were obtained accordingly. In terms of above standard curves, the specific content of each phytohormone in treatment groups were finally conversed.
qRT-PCR analysis
The extraction of total RNA in the grape roots of the different treatments was carried out on an RNA Prep Pure Plant Plus Kit (TaKaRa, Dalian, China). A BIO-RADXR gel imaging analysis system (Bio-Rad, CA, United States) was used to determine the purity and integrity of the RNA extracted. One microgram of total RNA was extracted by the use of a PrimeScript™ RT Reagent Kit in combination with gDNA Eraser (Perfect Real Time) (TaKaRa, Dalian, China) according to the manufacturers’ instructions. Then, first-strand cDNA was obtained.
The total final volume was 10 μl, consisting of 1 μl of cDNA, 5 μl of TB Green® Fast qPCR Mix, 3 μl of ddH2O, and 1 μl of a forward and reverse primer mixture. Then, qRT-PCR was implemented in a CFX connect Real Time PCR Detection System (Bio-Rad, CA, United States), and the sequences of all the genes and transcription factors identified in this study were acquired from the EnsemblPlants database2. The qPrimerDB-qPCR Primer Database3 was used to design the primers used in this study. The specific information of all the primer sequences used is shown in Supplementary Table 1, and the reactions were carried out as follows: 95°C for 20 s, followed by 39 cycles of 95°C for 15 s, 55°C for 15 s and 60°C for 15 s. The 2–ΔΔCt method was used for the determination of relative gene expression.
Data analysis and figure construction
To assess the significant differences in different phytohormones contents between the nR cultivation and RR cultivation treatments, the independent sample T-test method of SPSS 16.0 (IBM, Armonk, NY, United States) was carried out, specifically, selected the test variables (phytohormone contents) and grouping variables (nR and RR), set the group values, and judged the significance according to the test results of variance homogeneity (if p < 0.05, indicated as *; if p < 0.01, indicated as **). GO enrichment and KEGG pathway enrichment analysis of DEGs were performed respectively using R based on the hypergeometric distribution (Kanehisa et al., 2007). A heatmap was also constructed to visualize the results of a hierarchical cluster analysis. Figures related to quantification of phytohormones were constructed by GraphPad Prism 9.0 (GraphPad Software, Inc., San Diego, CA, United States) and Visio 2020 (Microsoft, SEA, United States). Figures such as GO enrichment and cluster analysis were exported from R.
Results
Transcriptome sequencing data from different root samples
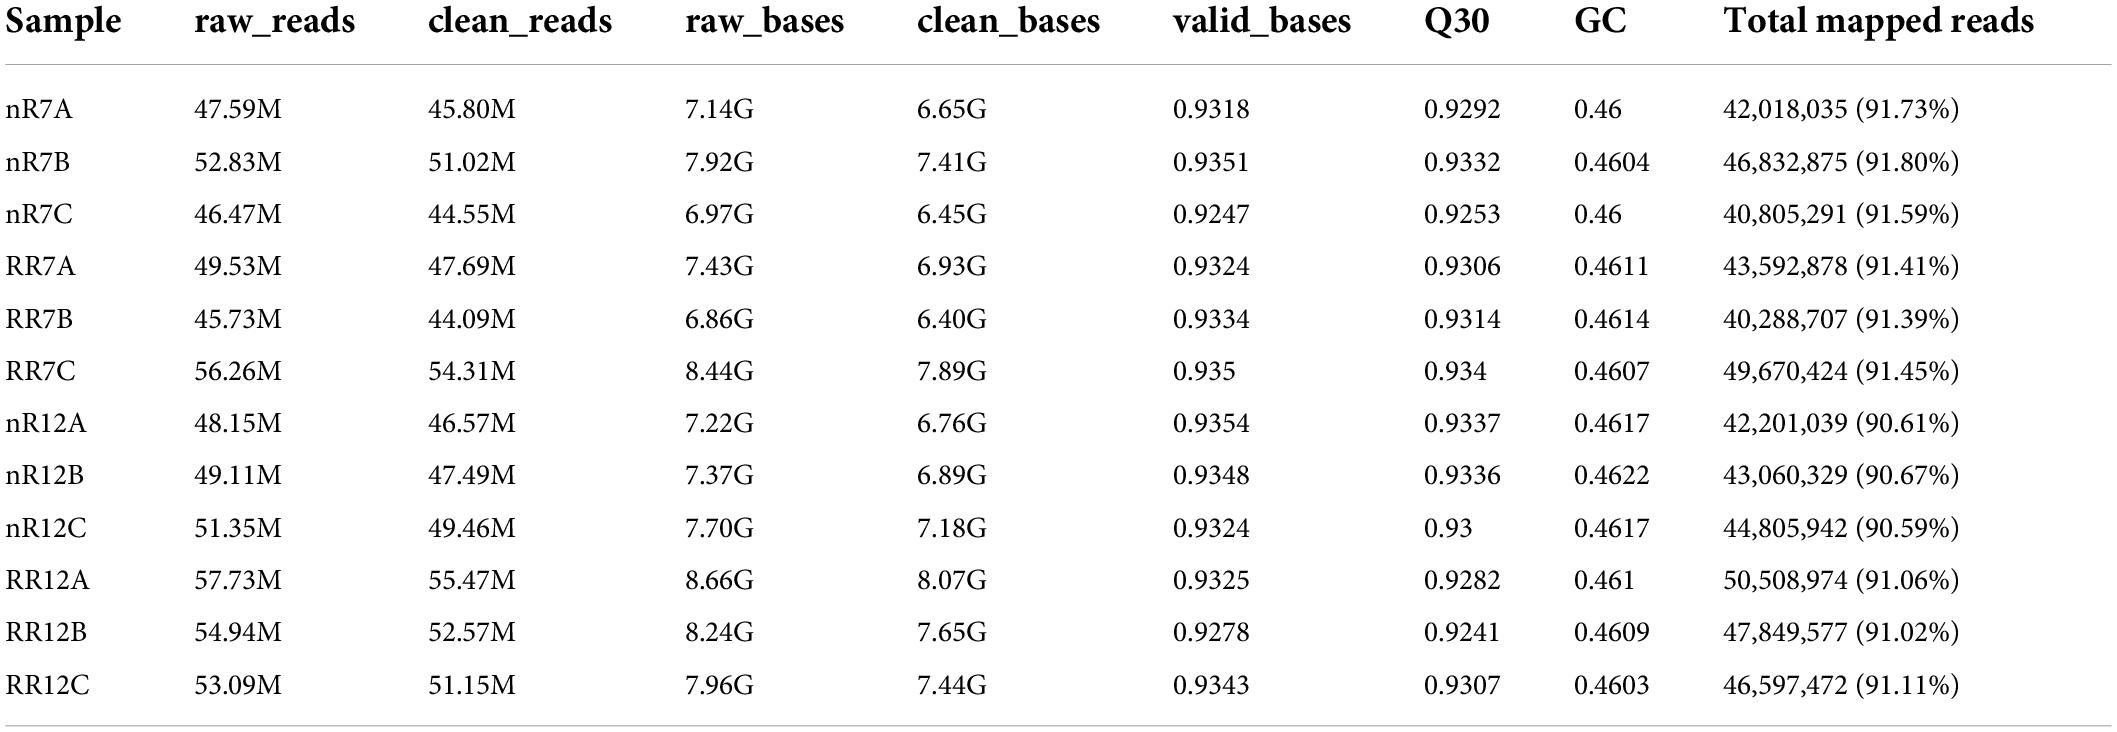
The 12 sequencing samples generated a total of 85.72 GB of clean data. The raw data ranged from 5.40 to 8.07 GB in each instance, while the clean reads ranged from 44.09 to 55.47 MB. The Q30 distribution was between 92.41% and 93.40%, and the average GC content was 45.10%. In total, 90.59 to 91.80% of the clean reads were mapped to the grapevine (Table 1).
The expression levels of each gene in the different samples showed that the FPKM values differed greatly. The FPKM values were divided into four intervals from 0 to 0.5 (Group A), 0.5−1 (Group B), 1−10 (Group C), and ≥10 (Group D). The results indicated that Group B contained the fewest genes (1462−1654 genes), while the number of genes in the other three groups showed no significant differences, each group of which had approximately 7000−8000 genes. In addition, the distribution of FPKM values among different cultivation treatments and different developmental stages was similar (Figure 1). In particular, analysis of gene expression levels between different samples revealed high correlation coefficients between replicates of the same root samples. Moreover, the correlation coefficients were also higher than 0.92 between different sequencing samples, which indicated that the repeatability between treatment groups was high, and the data associated with the nR and RR cultivation treatments were strongly correlated (Figure 2).
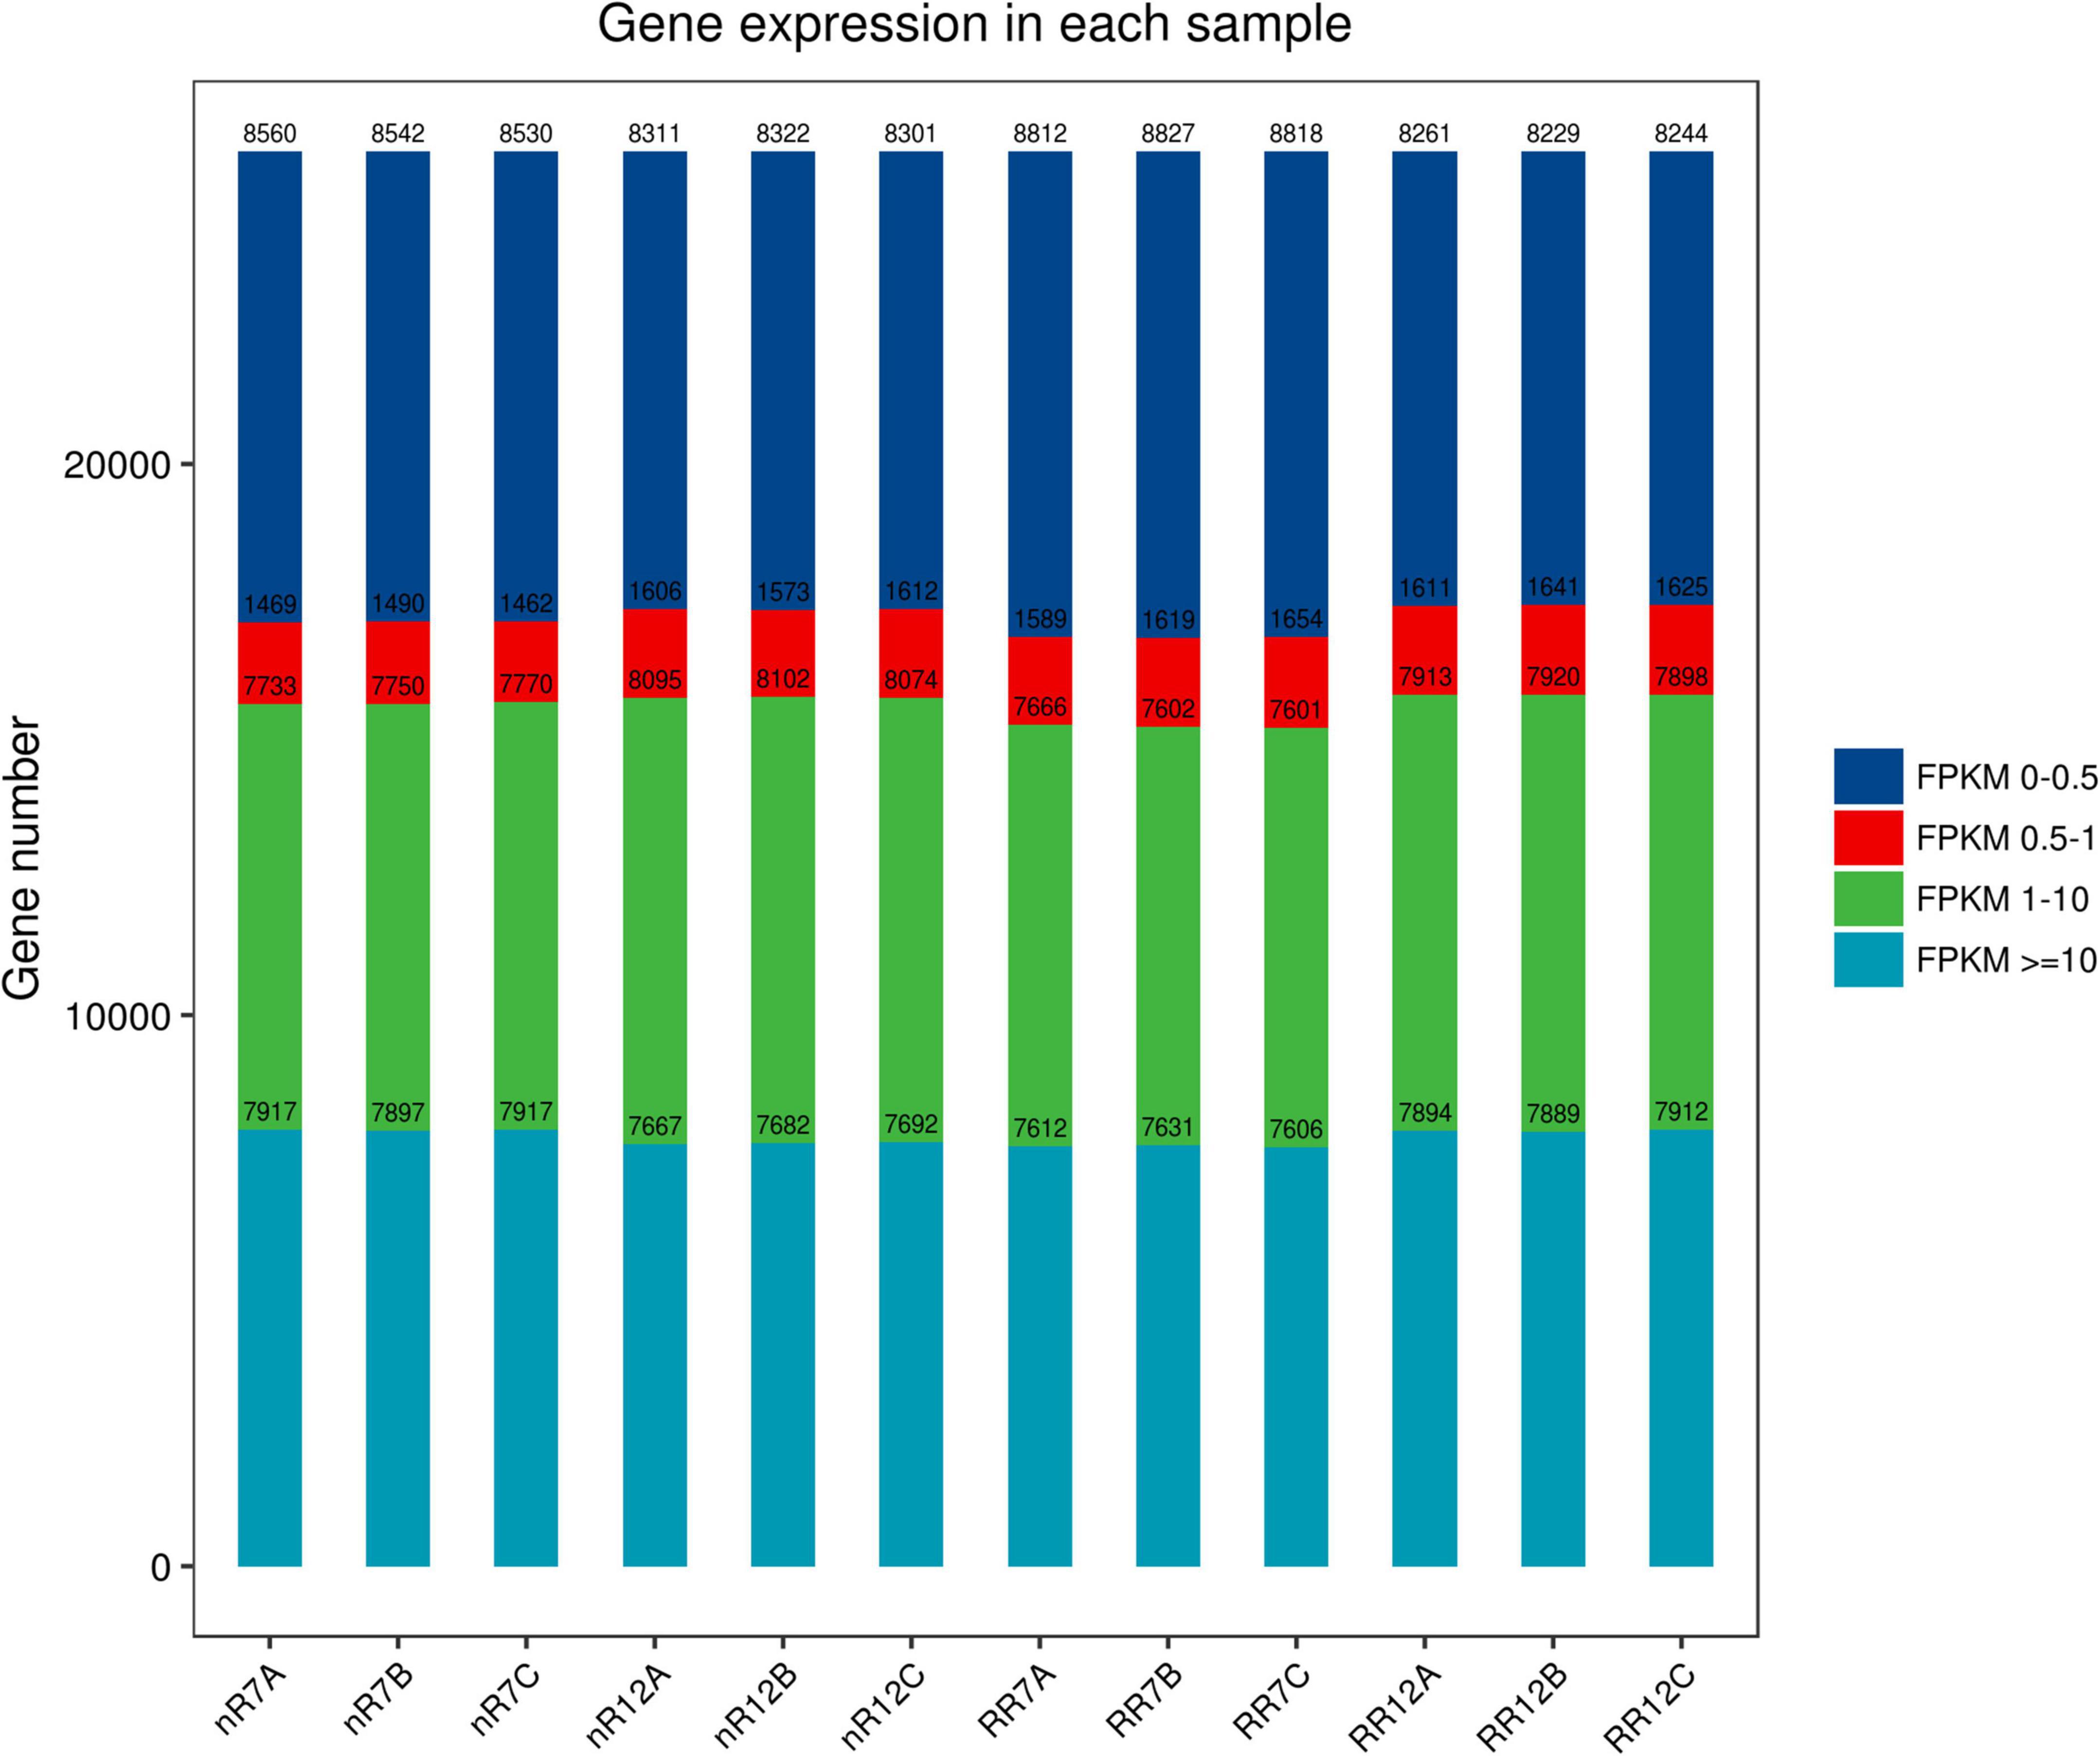
Figure 1. The distribution of FPKM expression in nR7, RR7, nR12, and RR12 represent at the 70 DAP (days after planting days) and 125 DAP sampling points under nR and RR cultivation. A total of four FRKM were classified in this study, including FRKM 0–0.5, FRKM 0.5–1, FRKM 1–10, and FRKM ≥ 10.
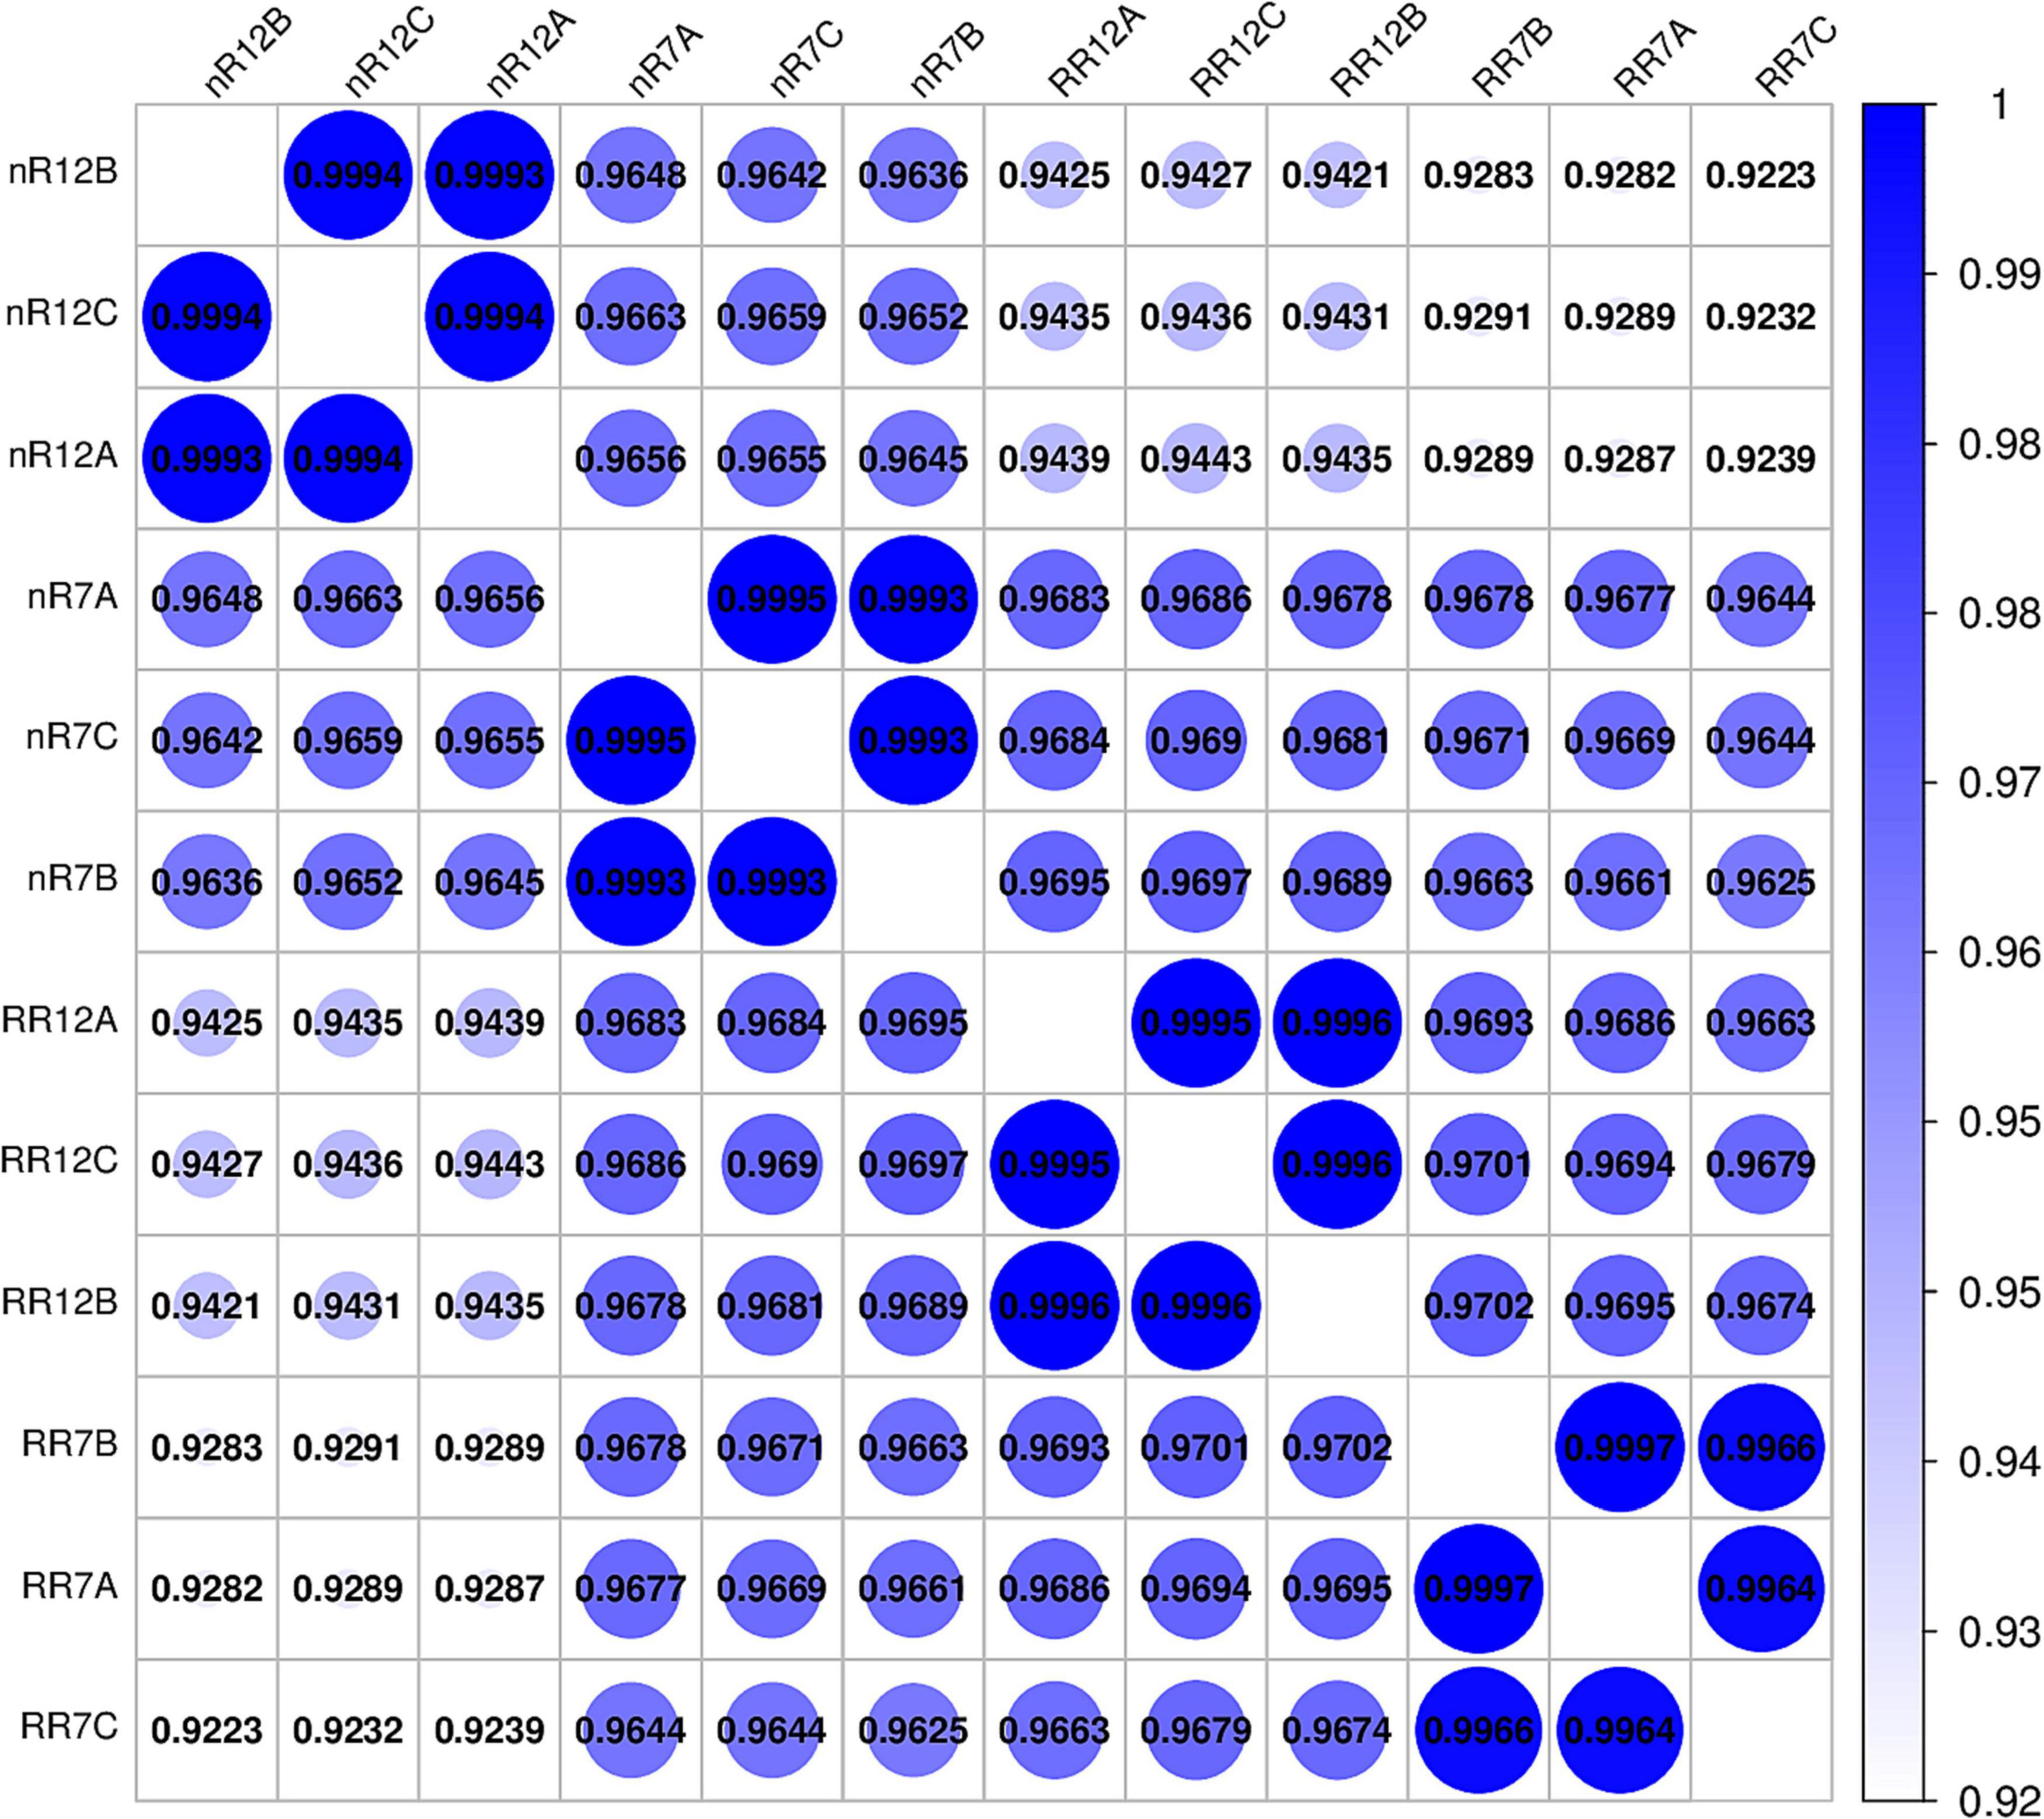
Figure 2. The heat map of the correlation coefficient between different samples, including nR7, RR7, nR12, and RR12 represents the 70 DAP and 125 DAP sampling points under nR and RR cultivation. The specific correlation value was reflected on the bubble.
Analysis of genes differentially expressed between different comparison groups
To further investigate the number of genes differentially expressed at different root development stages under RR cultivation and nR cultivation, we analyzed the DEGs between comparison groups. The results revealed 2,031 and 1,445 DEGs at different root developmental stages in the nR7 vs. nR12 and RR7 vs. RR12 comparison groups, respectively. The number of downregulated genes was much higher than that of upregulated genes—nearly twofold higher (Figure 3A). The number of upregulated and downregulated genes was similar in the different cultivation treatments. Moreover, the number of DEGs in the nR12 vs. RR12 comparison group was significantly higher than that of the nR7 vs. RR7 comparison group (Figure 3A).
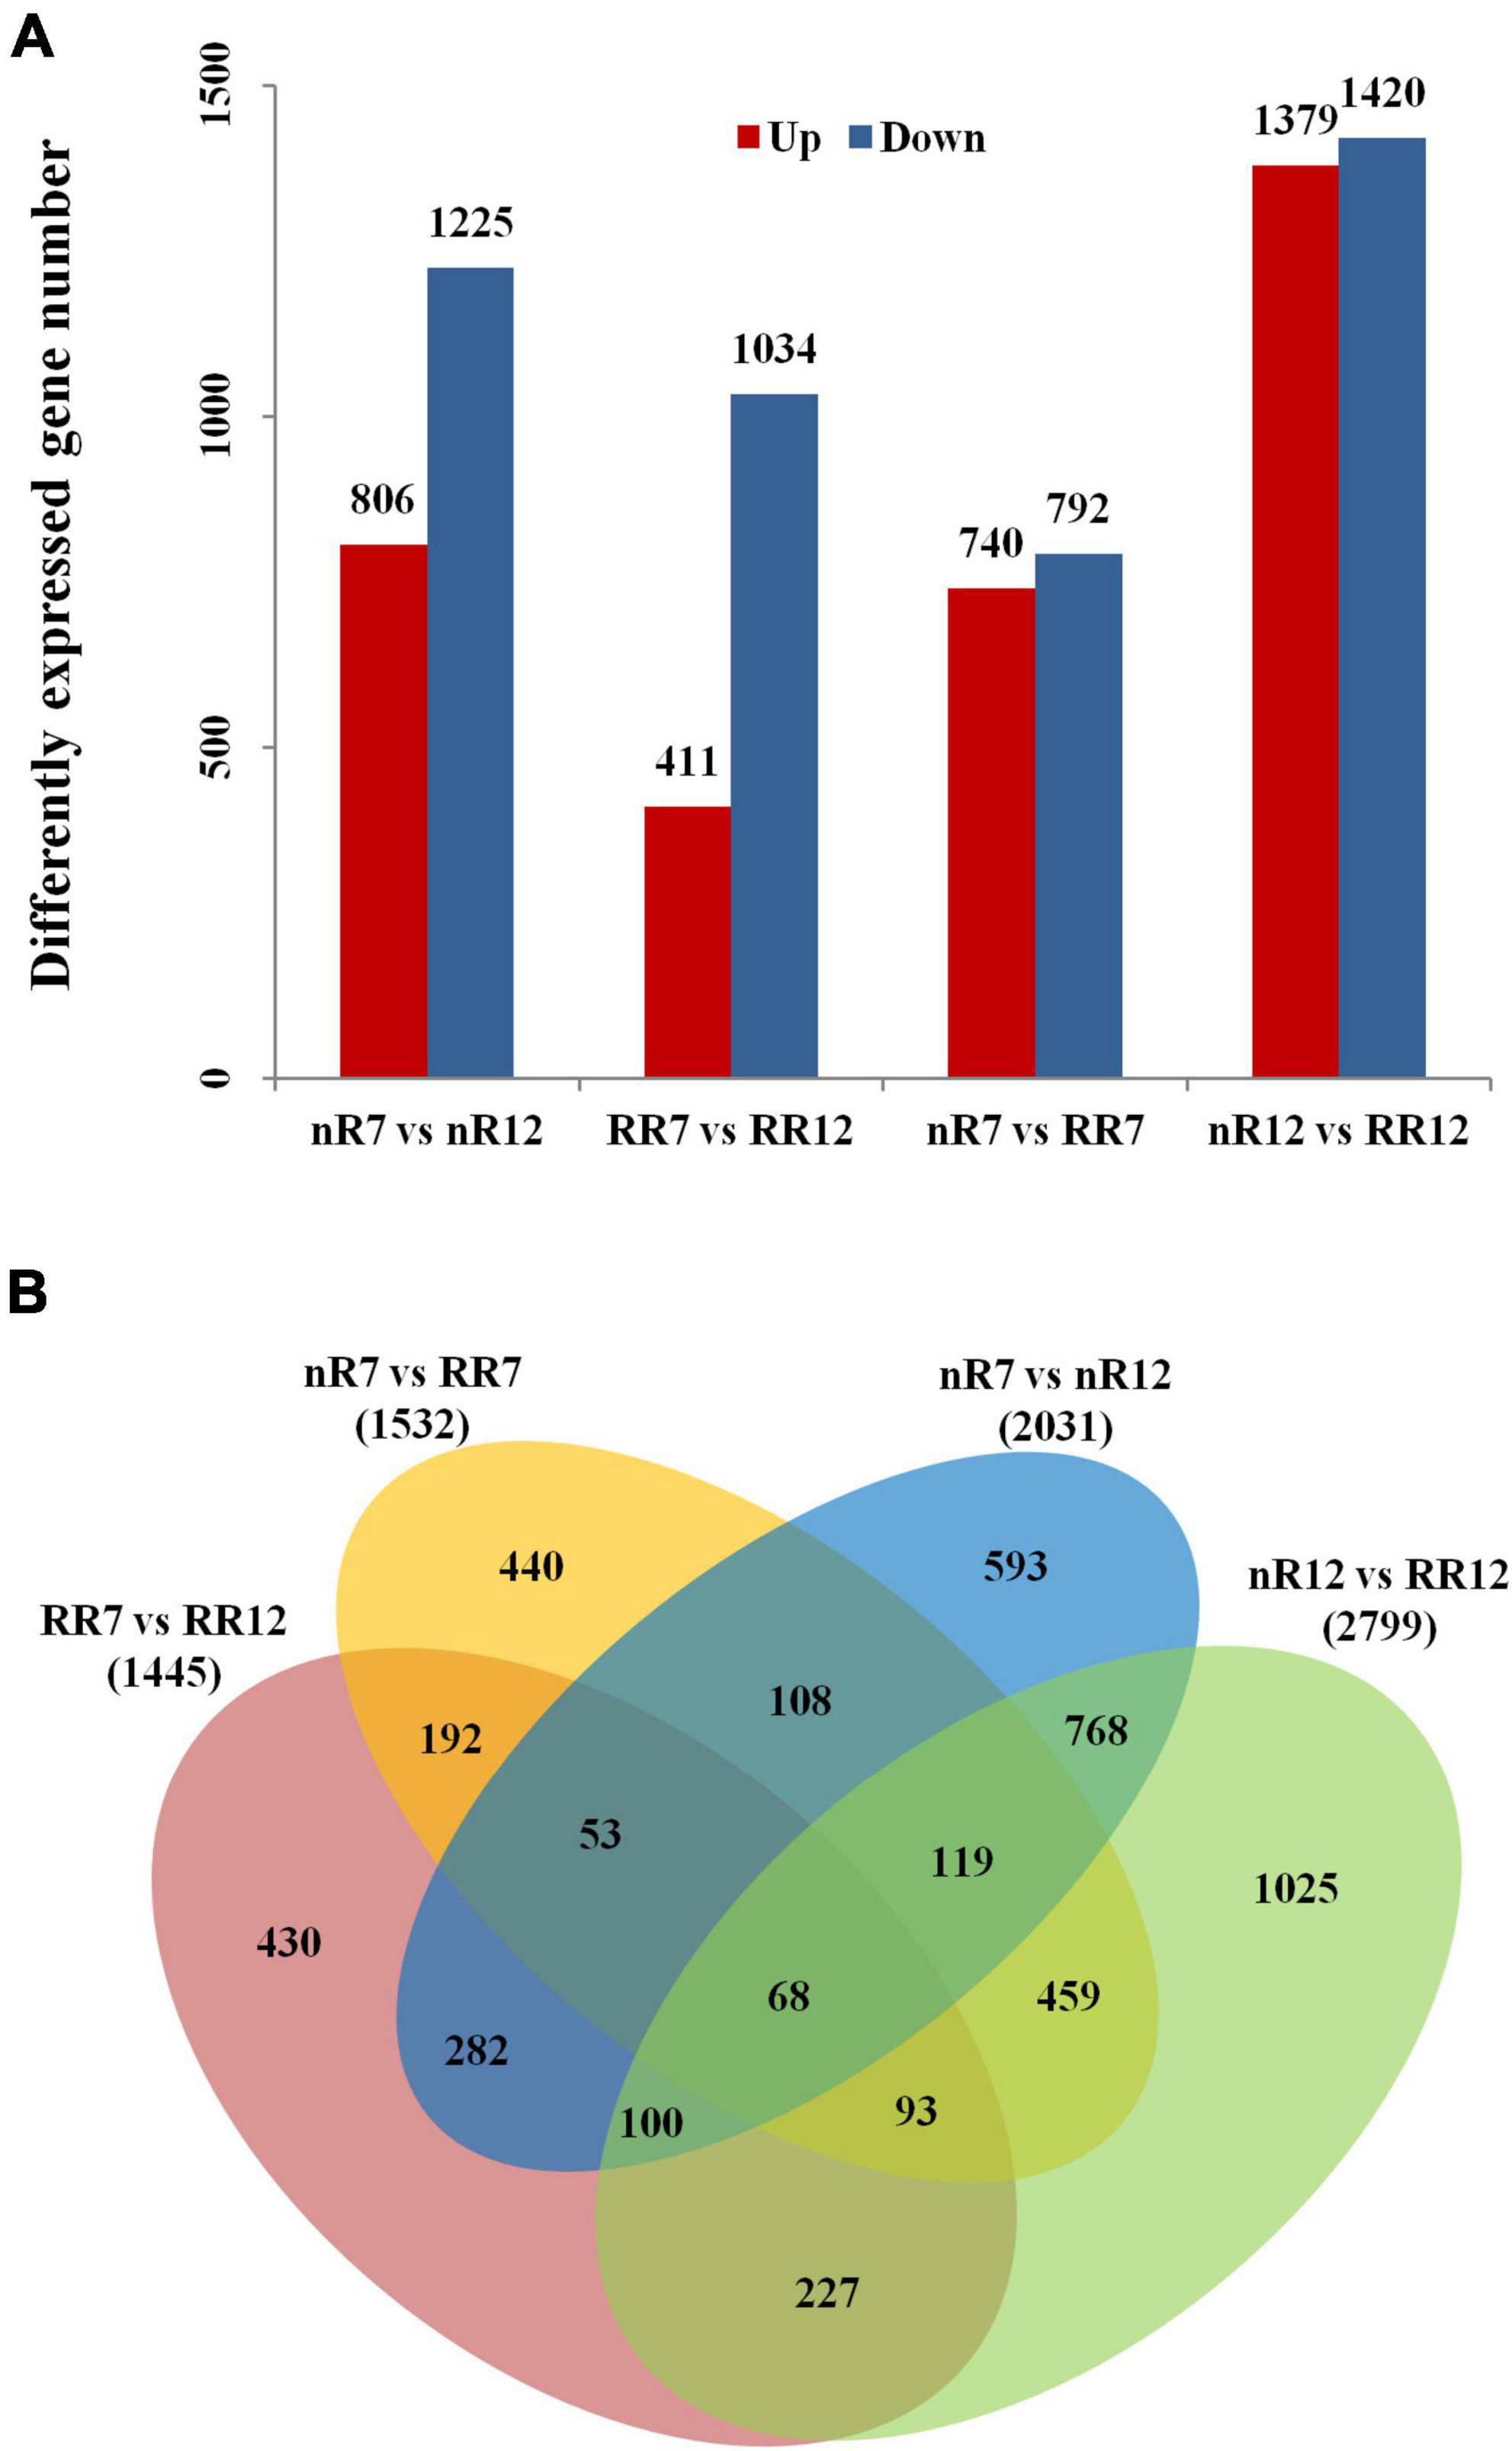
Figure 3. Differentially expressed gene number analysis. (A) Differentially expressed gene numbers between different comparison groups (nR7 vs. nR 12, RR7 vs. RR12, nR7 vs. RR7, and nR7 vs. RR12). The annotations of up and down mean the number of significantly up-regulated or down-regulated genes. (B) Mutual and unique differentially expressed genes between different comparison groups (nR7 vs. nR 12, RR7 vs. RR12, nR7 vs. RR7, and nR7 vs. RR12). nR7, RR7, nR12, and RR12 represent the 70 DAP and 125 DAP sampling points under nR and RR cultivation.
To further investigate the number of common and unique DEGs under the different cultivation treatments, as shown in Figure 3B, 1532 and 2799 DEGs were obtained in the nR7 vs. RR7 and nR12 vs. RR12 comparison groups. There were 503 common DEGs in the nR7 vs. nR12 and RR7 vs. RR12 comparison groups at different root development stages. Moreover, 739 common DEGs were obtained in the nR7 vs. RR7 and nR12 vs. RR12 comparison groups after root restriction cultivation (Figure 3B).
Gene ontology annotation analysis of genes differentially expressed between the different comparison groups
The expression of five endogenous phytohormone biosynthesis-related genes, including those involved in ABA, was visualized via a heatmap to further investigate the influence of nR and RR on endogenous phytohormone biosynthesis-related genes or transcription factors. The GO enrichment analysis showed several genes among the common DEGs that responded to other phytohormone processes. Each gene’s upregulation and downregulation patterns differed in the nR7 vs. RR7 and nR12 vs. RR12 comparison groups. Further classification analysis revealed that 14 DEGs responded to IAA, including the auxin-responsive proteins IAA3 and IAA29 and the PIN transporters PIN2 and PIN6. IAA3, IAA 29, and PIN6 showed an upregulation trend under nR treatment.
In contrast, PIN2 showed an upregulation trend under RR treatment. Moreover, 14 DEGs were found to respond to ABA, most of which were upregulated after RR cultivation. There were multiple senescence-specific SAG12 cysteine proteases, and only two DEGs (SUGTL2 and MFT) were downregulated; the others were all upregulated under the RR treatment. We also found that a total of 18 DEGs that responded to ETH, including multiple ethylene response factor (ERF) members that were downregulated under RR treatment, as well as MYB27 transcription factor and MYB48 transcription factor that were highly upregulated under RR treatment.
Furthermore, 12 DEGs responded to GA and were mostly upregulated after RR cultivation, including the typical GA biosynthesis-related genes gibberellin 20 oxidase 2 (GA20OX2, Vitvi04g01719) and gibberellin 20 oxidase 3 (GA20OX3, Vitvi02g01769) and multiple genes encoding MYB transcription factors. Moreover, except for gibberellin 20 oxidase 2-2 (GA20OX2-2, Vitvi16g00890), the majority of the DEGs were upregulated during the RR treatment. For DEGs related to the CTK response, the results demonstrated that two genes respond to CTK, and cytokinin riboside 5′-monophosphate phosphoribohydrolase (LOG4, LOC10025518) was upregulated under RR cultivation. At the same time, photosystem I chlorophyll a/b-binding protein 3-1 (LHCA3, LOC100232927) was downregulated after RR cultivation. Overall, some genes, such as SAG12s, responded to multiple phytohormone processes, especially those involving GA, ETH, and ABA. In addition, auxin efflux carrier component 2 (PIN2, LOC100256460) and photosystem I chlorophyll a/b-binding protein 3-1 (PIN6, LOC100250503) responded to IAA and ETH, ethylene-responsive transcription factors (ERF113, LOC100266913) responded to ETH and ABA, and MYB59 transcription factors (MYB59, LOC100260318) and ODORANT1 proteins (MYB48, LOC100263072) responded to GA and ETH (Figure 4). More information about the DEGs is provided in Table 2.
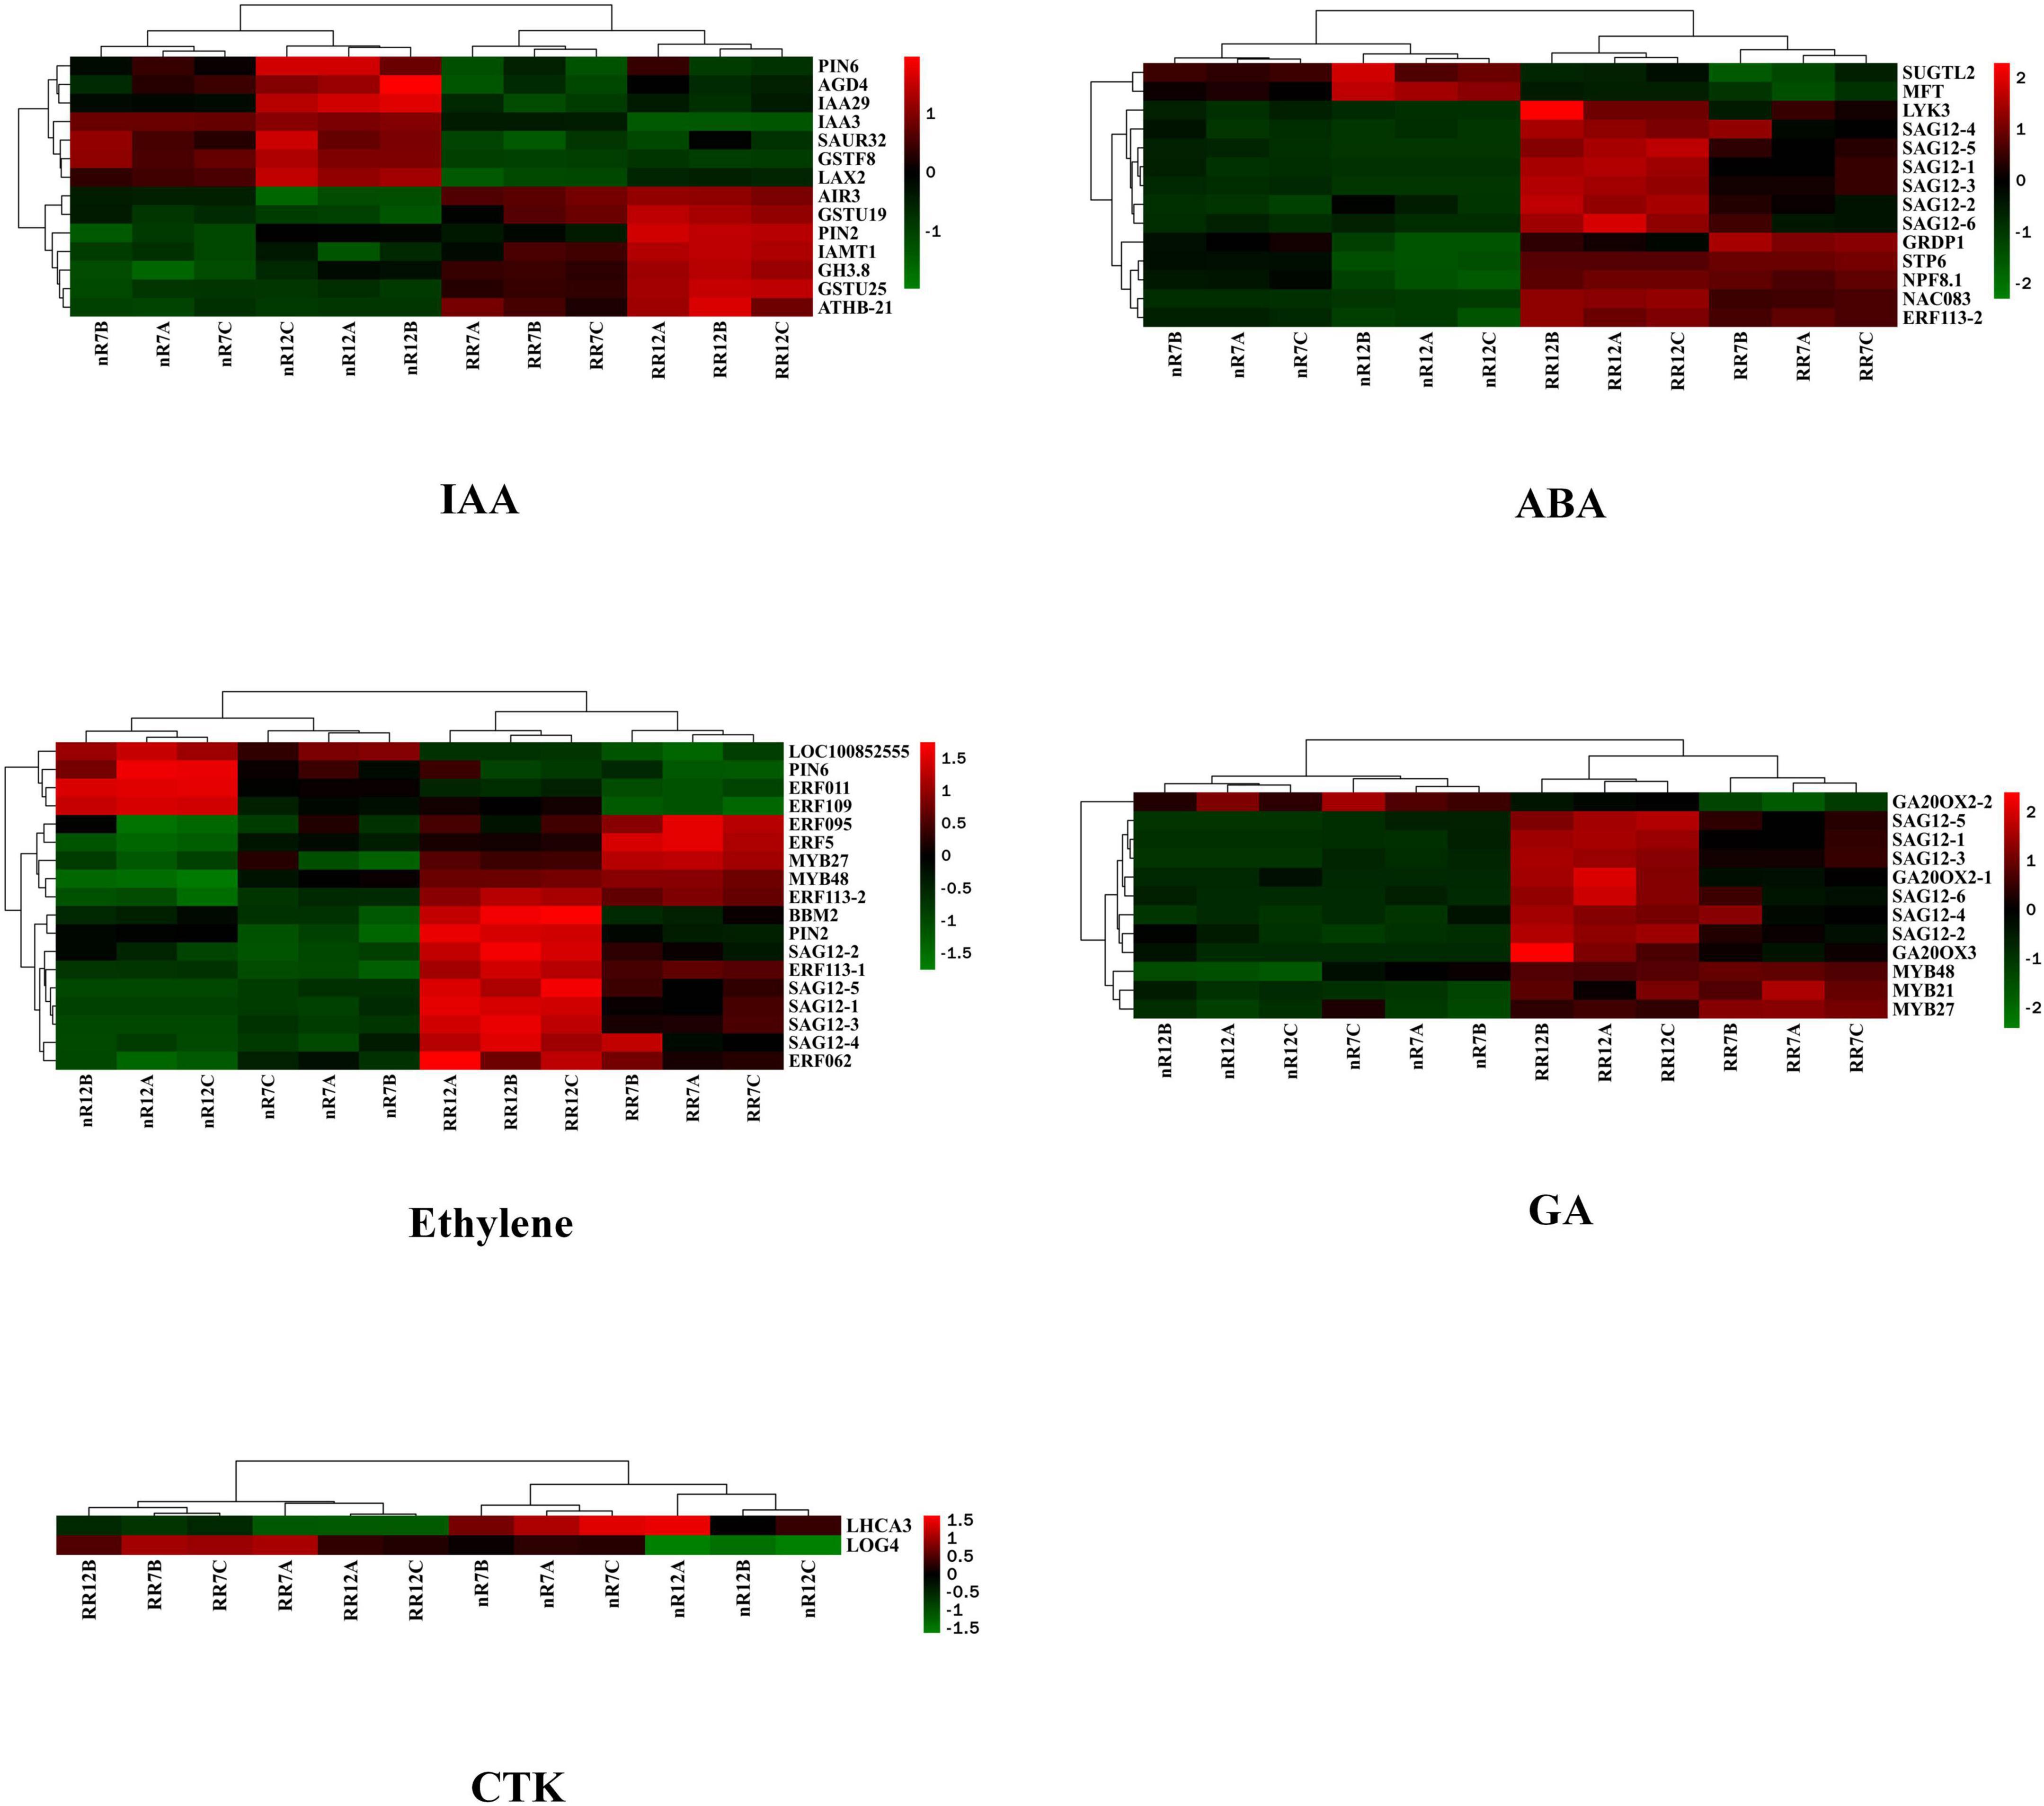
Figure 4. Heat map analysis of differentially expressed genes in response to phytohormones IAA, ABA, ETH, GA, and CTK. nR7, RR7, nR12, and RR12 represent the 70 DAP and 125 DAP sampling points under nR and RR cultivation.

Table 2. The annotation information of differentially expressed genes in response to plant hormones auxin (IAA), abscisic acid (ABA), ethylene (ETH), gibberellin (GA), brassinolide (BR), and cytokinins (CTKs) after root restriction cultivation.
In omics research, following the acquisition of transcriptome data, GO enrichment analysis is mainly utilized to address the issue of investigating a large number of molecular changes. GO enrichment analysis can categorize thousands of molecules (such as proteins or specific non-coding RNAs) based on their functional similarity and then evaluate them, significantly lowering the cost and difficulty of analysis. Therefore, GO enrichment analysis was also performed on the transcriptome data obtained in this study, and the results are shown in Figure 5. The GO enrichment analysis of the DEGs between different the comparison groups indicated that they were involved in various biological processes, cellular components, and molecular functions. In terms of nR7 vs. RR7, we discovered that amino acid export, apoplast, and hydroquinone:oxygen oxidoreductase activity were critical biological processes, cellular components, and molecular activities, respectively. For nR12 vs. RR12, the regulation of the glycolytic process, the extracellular region, and xylan O-acetyltransferase activity were the main biological processes, cellular components, and molecular functions. The top three cell components were the apoplast, extracellular region, and cell wall. Hydroquinone:oxygen oxidoreductase activity and oxidizing metal ions were the top molecular functions in nR7 vs. RR7, whereas xylan O-acetyltransferase activity and transcription factor activity were the top molecular functions in nR12 vs. RR12 (Figure 5A).
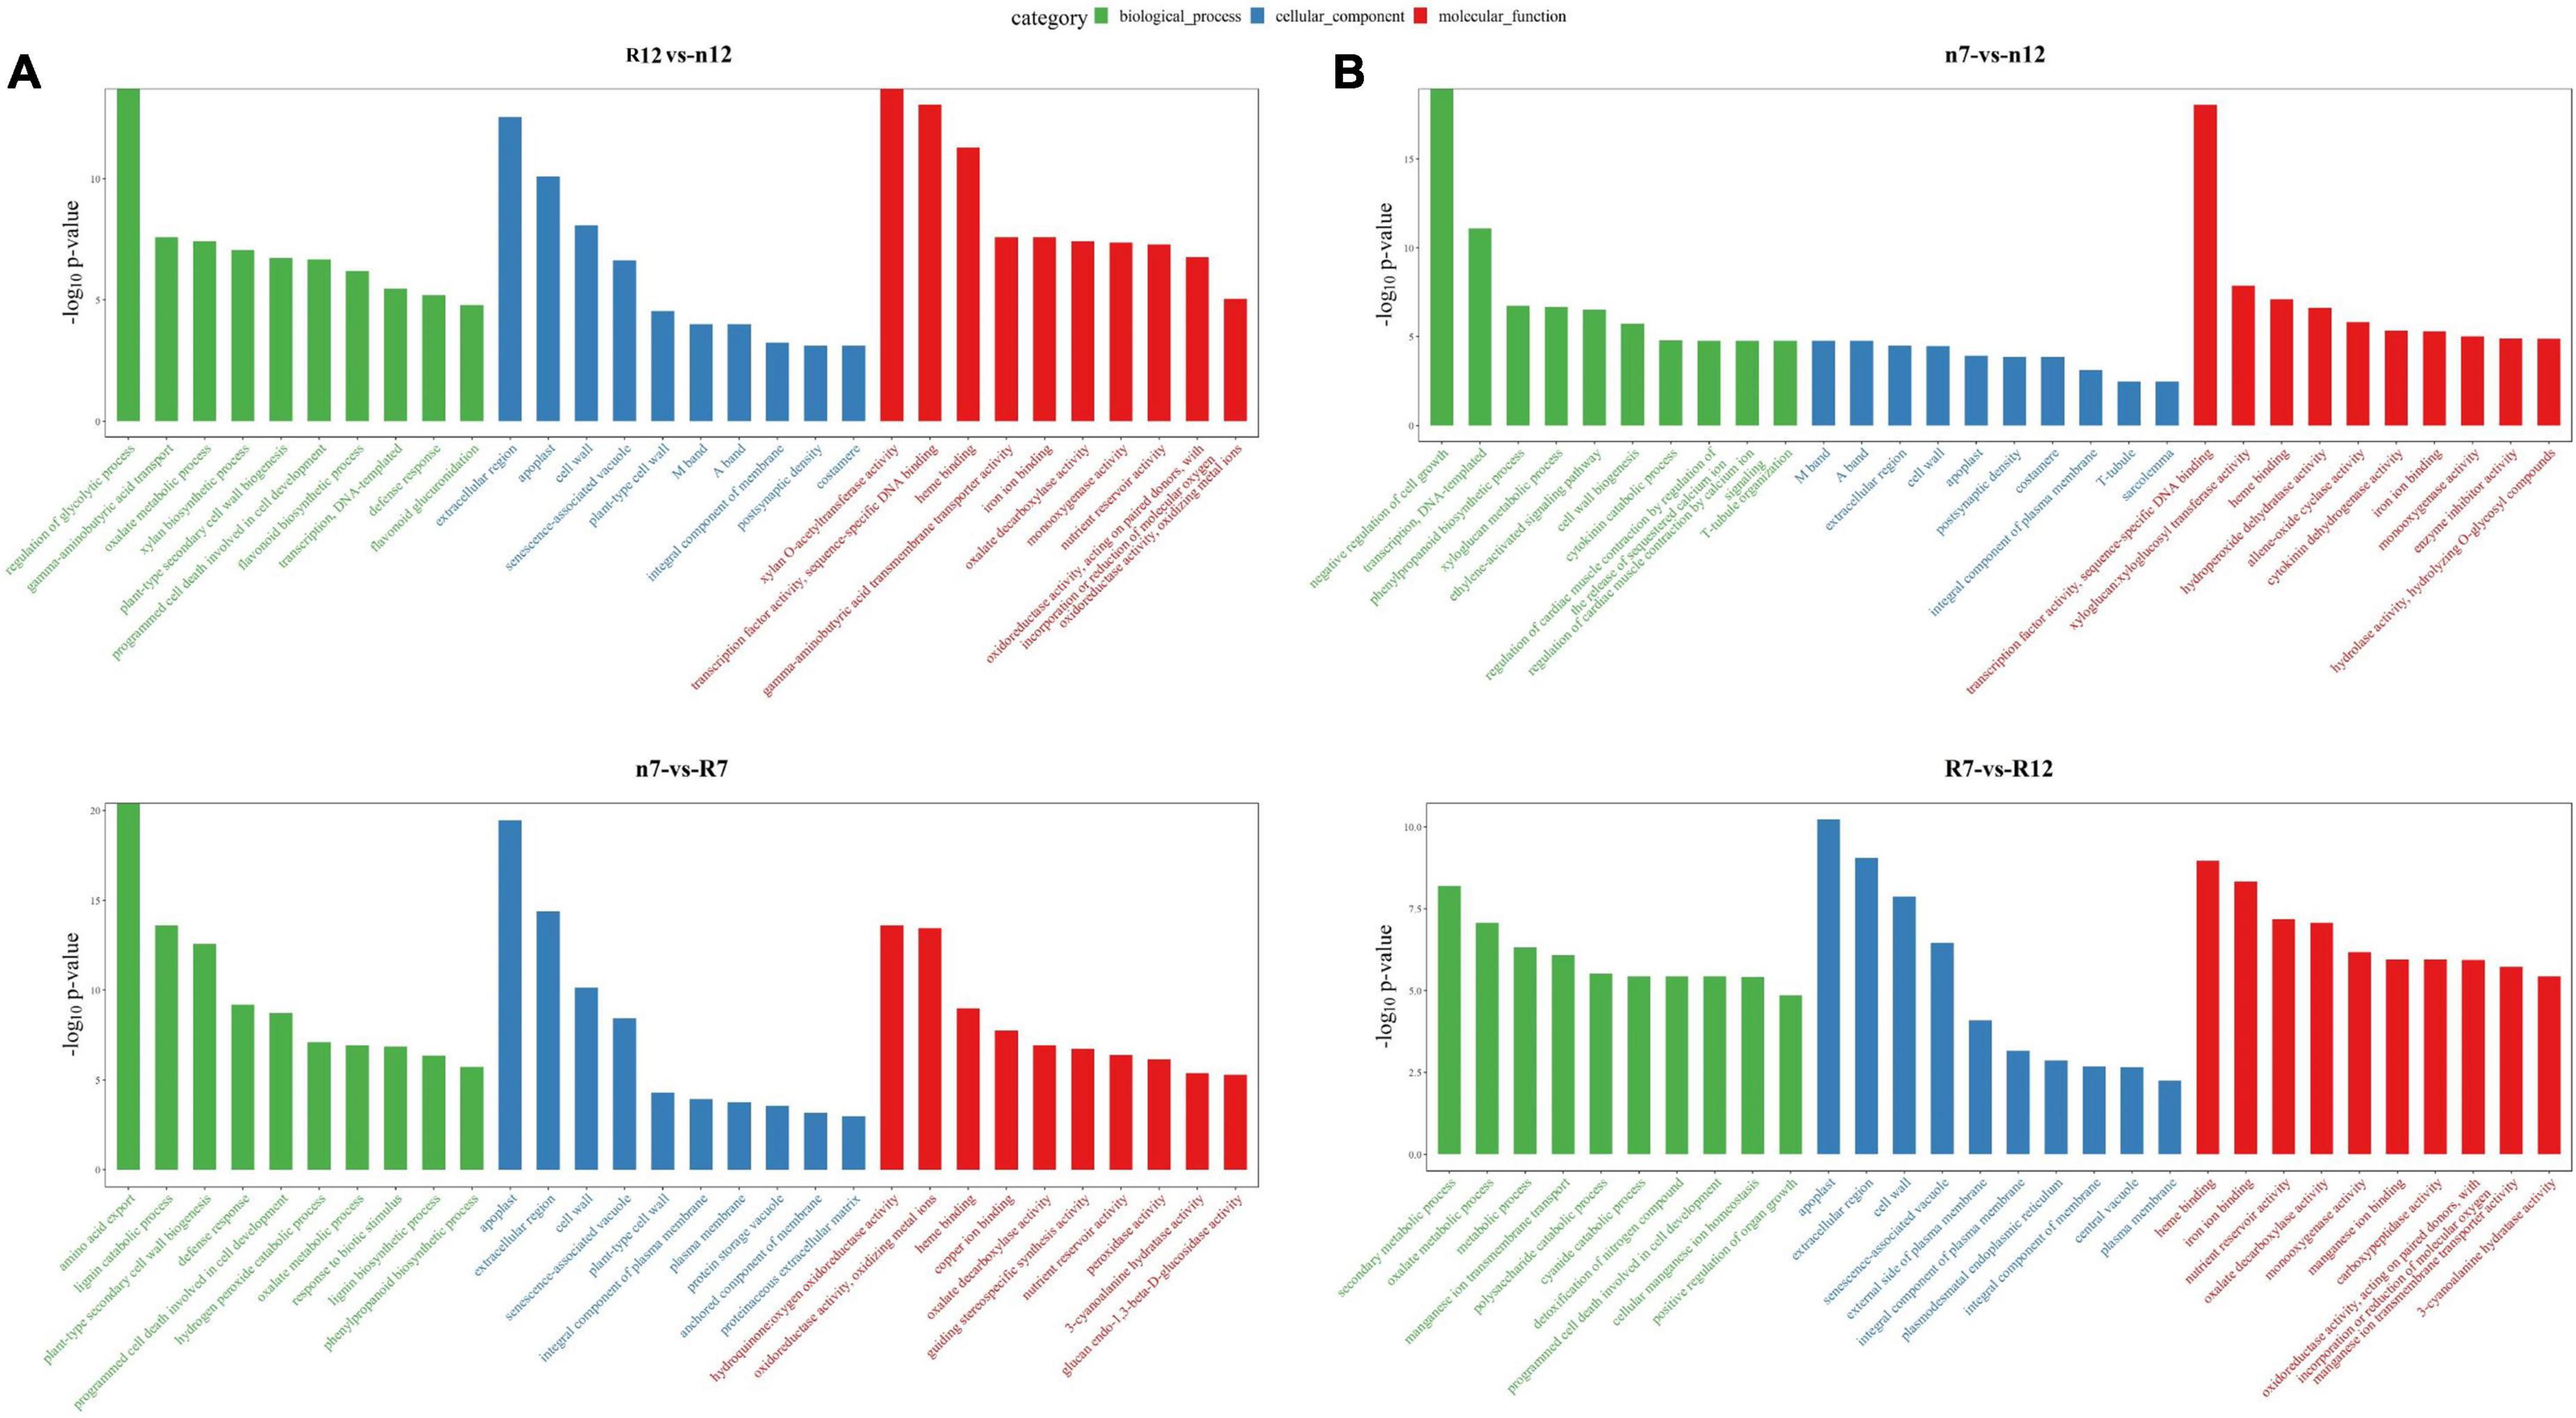
Figure 5. Gene ontology (GO) enrichment analysis results between different comparison groups (A) R12 vs. n12, n7 vs. R7. (B) n7 vs. n12, R7 vs. R12. n7, R7, n12, and R12 represent 70 DAP and 125 DAP sampling time points under nR and RR cultivation.
Further exploration of the effects of different growth stages on biological processes, cellular components, and molecular functions indicated that the natural processes of nR7 vs. nR12 were mainly enriched in the negative regulation of cell growth and transcription of DNA as a template. Moreover, the ethylene-activated signaling pathway and cytokinin catabolic process were implicated. The most enriched cell component was the M band, and the most enriched molecular function was transcription factor activity. In addition, compared with those of the other comparison groups, the biological processes of the RR7 vs. RR12 group had higher enrichment in secondary metabolic processes, oxalate metabolic processes, and metabolic processes. The most enriched cellular component was the apoplast, and the most enriched molecular function was heme binding (Figure 5B).
Combined transcriptome and microRNA sequencing analysis
Since the transcriptome data and previously published miRNA sequencing were collected from the same root samples of grapevine cv. “Muscat Hamburg,” a combined analysis of the differentially expressed miRNAs (DEMs) and DEGs was conducted. The results demonstrated that in each comparison group (nR7 vs. RR7, nR12 vs. RR12, nR7 vs. nR12, and RR7 vs. RR12), both DEMs and predicted targeted DEGs were found. Each DEM had one or two target DEGs, and the number of DEGs related to the DEMs was mainly 1-2, albeit with 5 and 4 differentially expressed target genes of miR396b and miR396c, respectively (Figure 6).
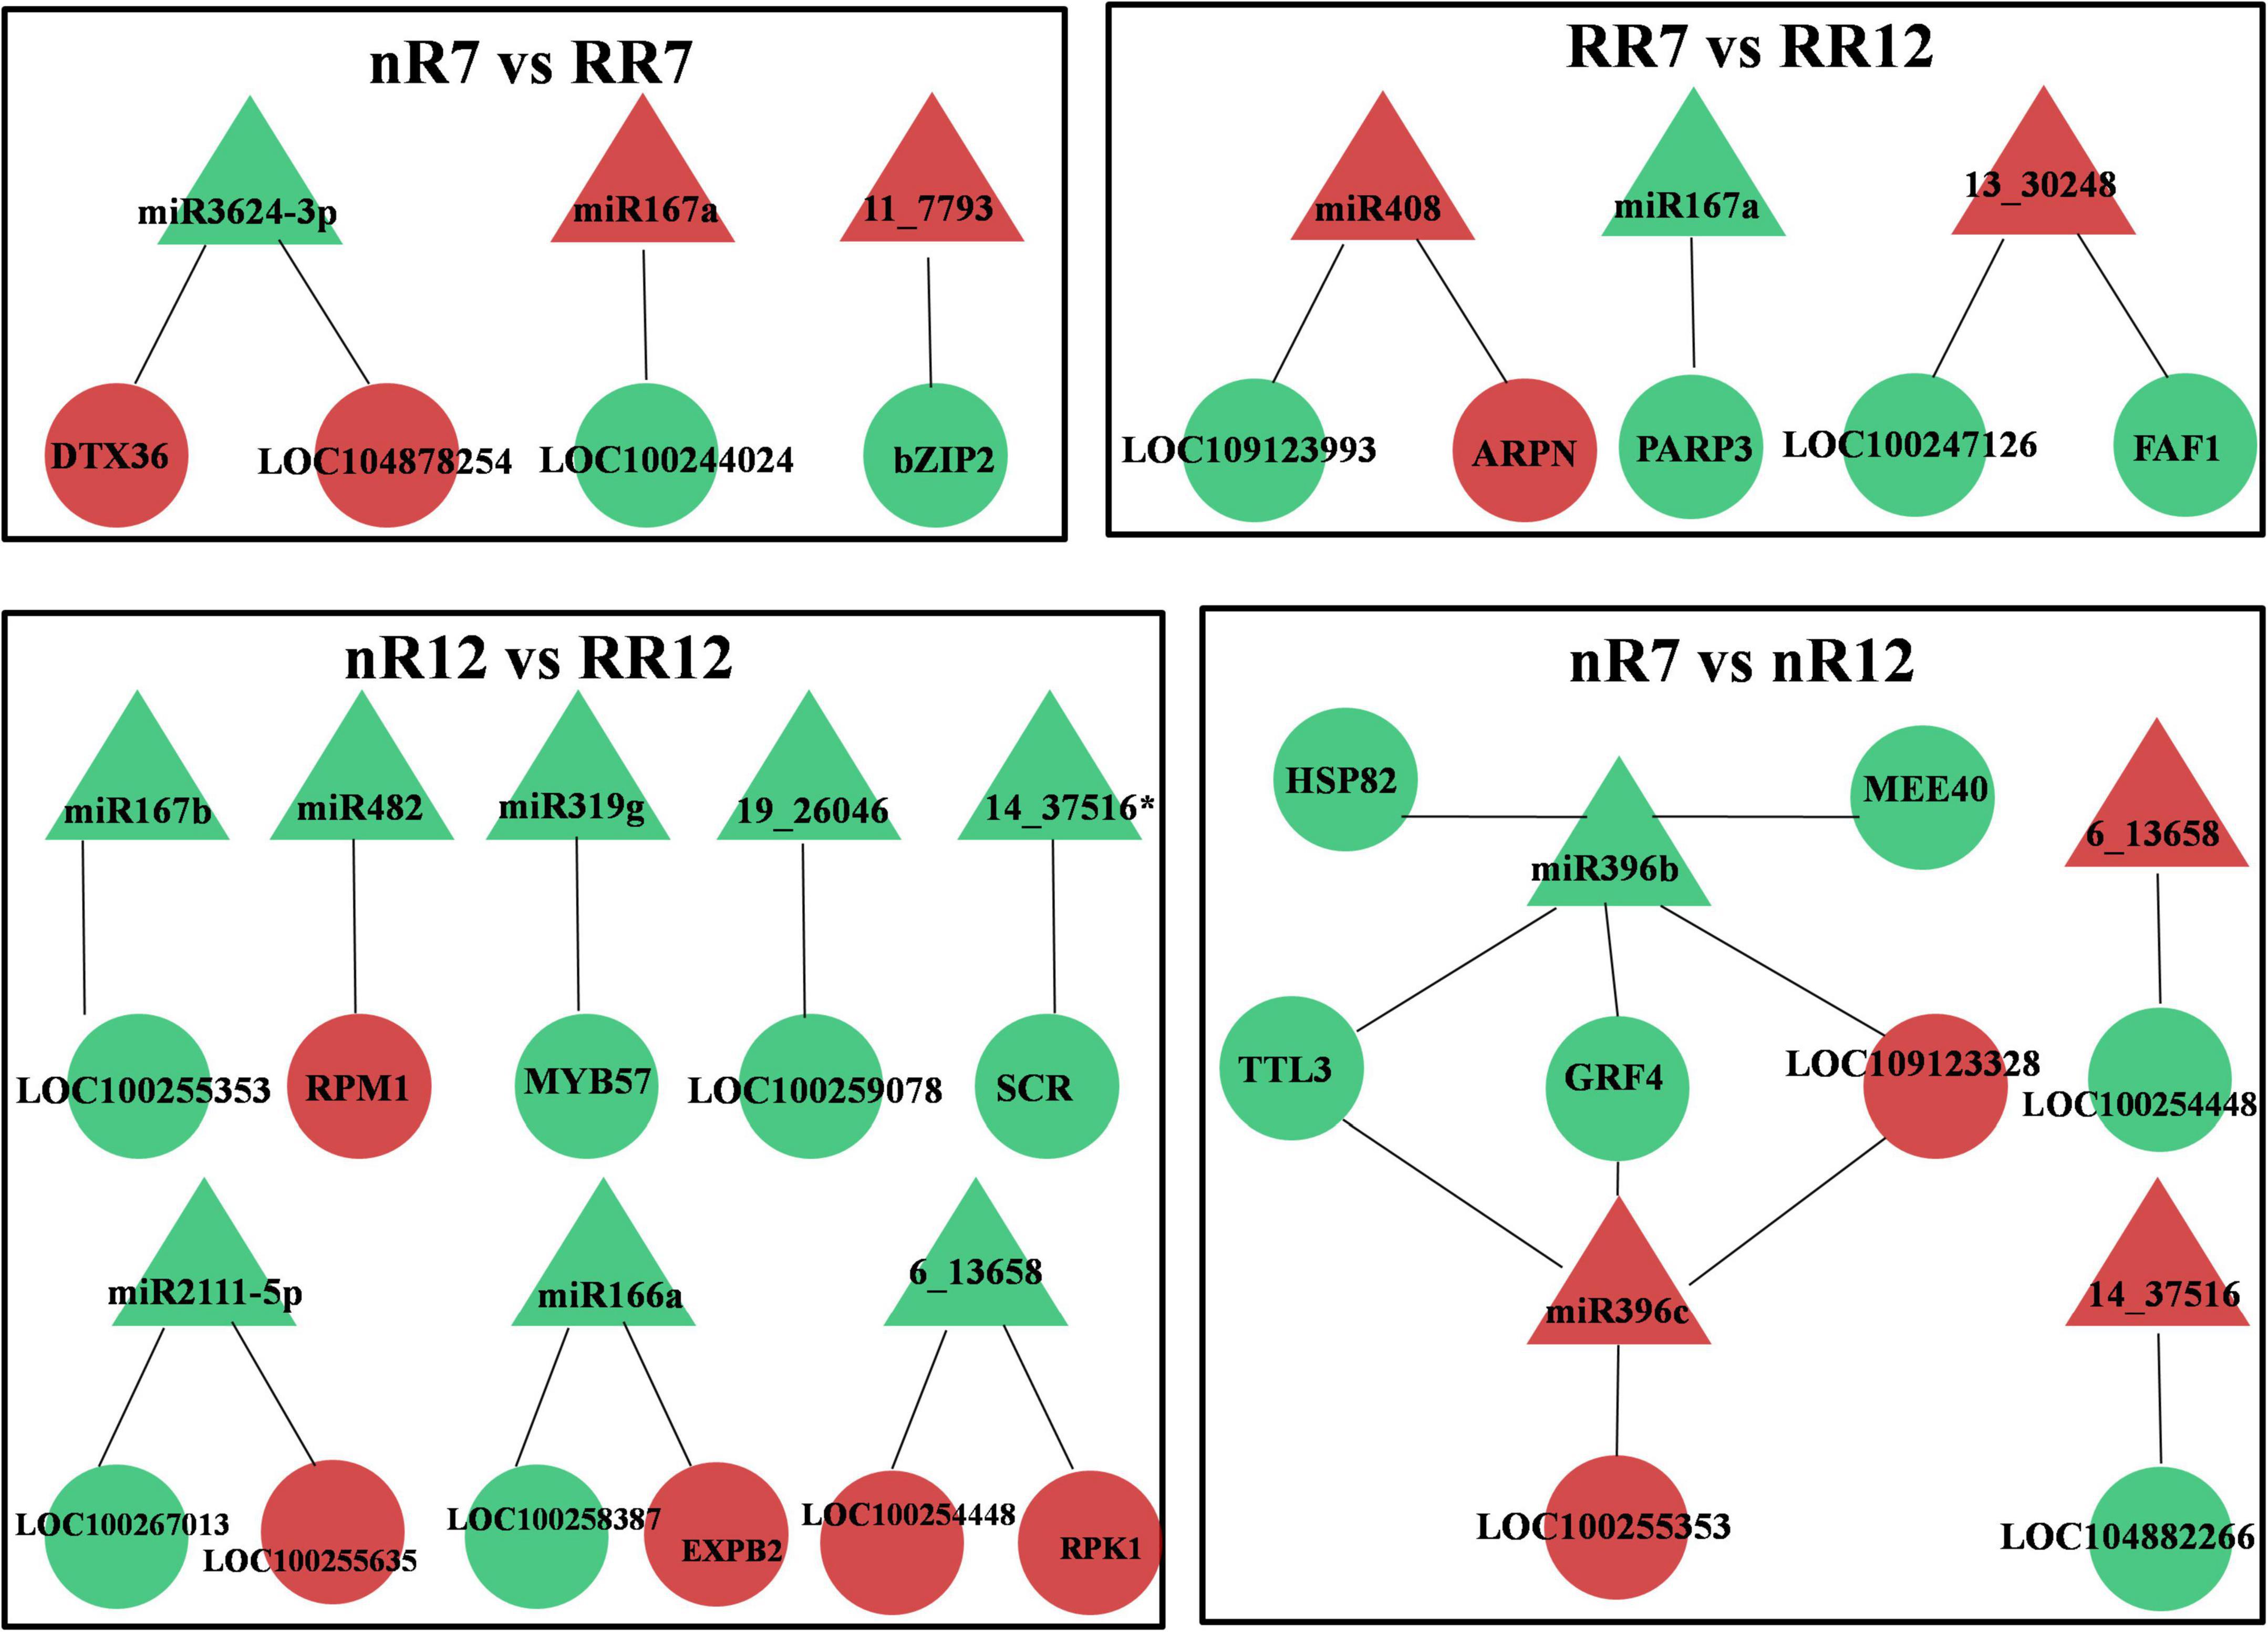
Figure 6. Conjoint analysis of differentially expressed miRNAs and differentially expressed target genes in different groups, including nR7 vs. nR12, RR7 vs. RR12, nR7 vs. RR7, and nR12 vs. RR12. Red indicates up-regulated expression, while green indicates down-regulated expression. nR7, RR7, nR12, and RR12 represent the 70 DAP and 125 DAP sampling time points under nR and RR cultivation. Circles represented DEGs and triangles represented DEMs.
miR3624-3p, miR167a/b, miR482, miR319g, miR2111-5p, and miR166a were found to be DEMs of the DEGs obtained from the roots of plants in the various comparison groups (nR7 vs. RR7 and nR12 vs. RR12). The target gene of miR3624-3p was the protein DETOXIFICATION 36 (DTX36, LOC100265485), and its product was a detoxified protein (mulatexin, LOC104878254). RPM1 is a disease resistance protein targeted by miR482, and the target gene of miR319g is the transcription factor MYB57 (MYB57, LOC104878254). In addition, there were novel miRNAs, namely, 11_7793, 19_26046, and 14_37516*, that were differentially expressed. Among these, the target gene of 11_7793 encoded the transcription factor bZIP2 (bZIP2, LOC104878442), and the target gene of 6_13658 encoded the LRR receptor-like serine/threonine-protein kinase. The DEMs and predicted targeted DEGs were also analyzed at different developmental stages (nR7 vs. nR12 and RR7 vs. RR12). The known DEMs were miR167a, miR408, and miR396b/c. The basic blue protein mavicyanin-like (ARPN, LOC109124259), which acts in redox processes, was miR408’s target gene. MiR396b/c targets include growth-regulating factor 3 (GRF4, LOC100242152) and heat shock cognate protein 80 (HSP82, LOC100246843). Moreover, the novel DEMs were 6_13658, 14_37516, and 13_30248, among which the target gene protein FANTASTIC FOUR 3 (FAF1, LOC100252736) of 13_30248 functions in the regulation of meristematic activity (Figure 6).
Fragments per kilobase per million reads is typically used to represent gene expression, and the calculation method of TPM is very similar to that of RPKM. The total TPM of each sample was the same after the gene length and sequencing depth were normalized (both were 10). This means that the TPM number reflects the proportion of reads compared to a gene, allowing direct comparison between samples. This fact also suggests that, compared with the FPKM method, the standardized method of TPM is more advantageous, and its standardization is currently recommended. Further analysis of the TPM and FPKM values of the known miRNAs and their target DEGs under root restriction cultivation in the four sequencing samples revealed that the expression trends of the DEMs and DEGs were opposite in the nR7 vs. RR7 and nR12 vs. RR12 comparison groups. For example, the expression of miR3624-3p in RR7 and RR12 increased after root restriction cultivation compared with that of nR7 and nR12 in the same period. The target gene protein DETOXIFICATION 41 (DTX36, LOC100255800) showed downregulated expression, and mulatexin (MYB57 transcription factor, LOC104878254) showed upregulated expression. For miR167b, we found that the target gene putative germin-like protein 9-2 (LOC100255353) showed upregulated expression in RR12 and downregulated expression in nR7, RR7, and nR12. For miR167a, we found that the target gene ankyrin repeat-containing protein (LOC100244024) showed upregulated expression in RR7, nR12, and RR12.
Moreover, the expression of miR482 in nR7 and nR12 was upregulated, and its target gene disease resistance protein RPM1 (LOC100854691) showed an upregulated trend in RR7 and RR12. In nR12, miR319g expression was increased while its target gene, mulatexin (MYB57 transcription factor, LOC104878254), was more highly expressed in nR7, RR7, and RR12. Furthermore, the results also indicated that miR2111-5p had two target genes (LOC100255635, LOC100267013), and their expression was upregulated in nR7 and nR12. MiR166a expression was similarly upregulated in nR7, and its target gene putative expansin-B2 (EXPB2, LOC100253046) was upregulated in nR12; however, the target gene glucan endo-1,3-beta-glucosidase 11 (Glc5-1-11, LOC100258387) was exclusively upregulated in RR7 and RR12 (Figure 7).
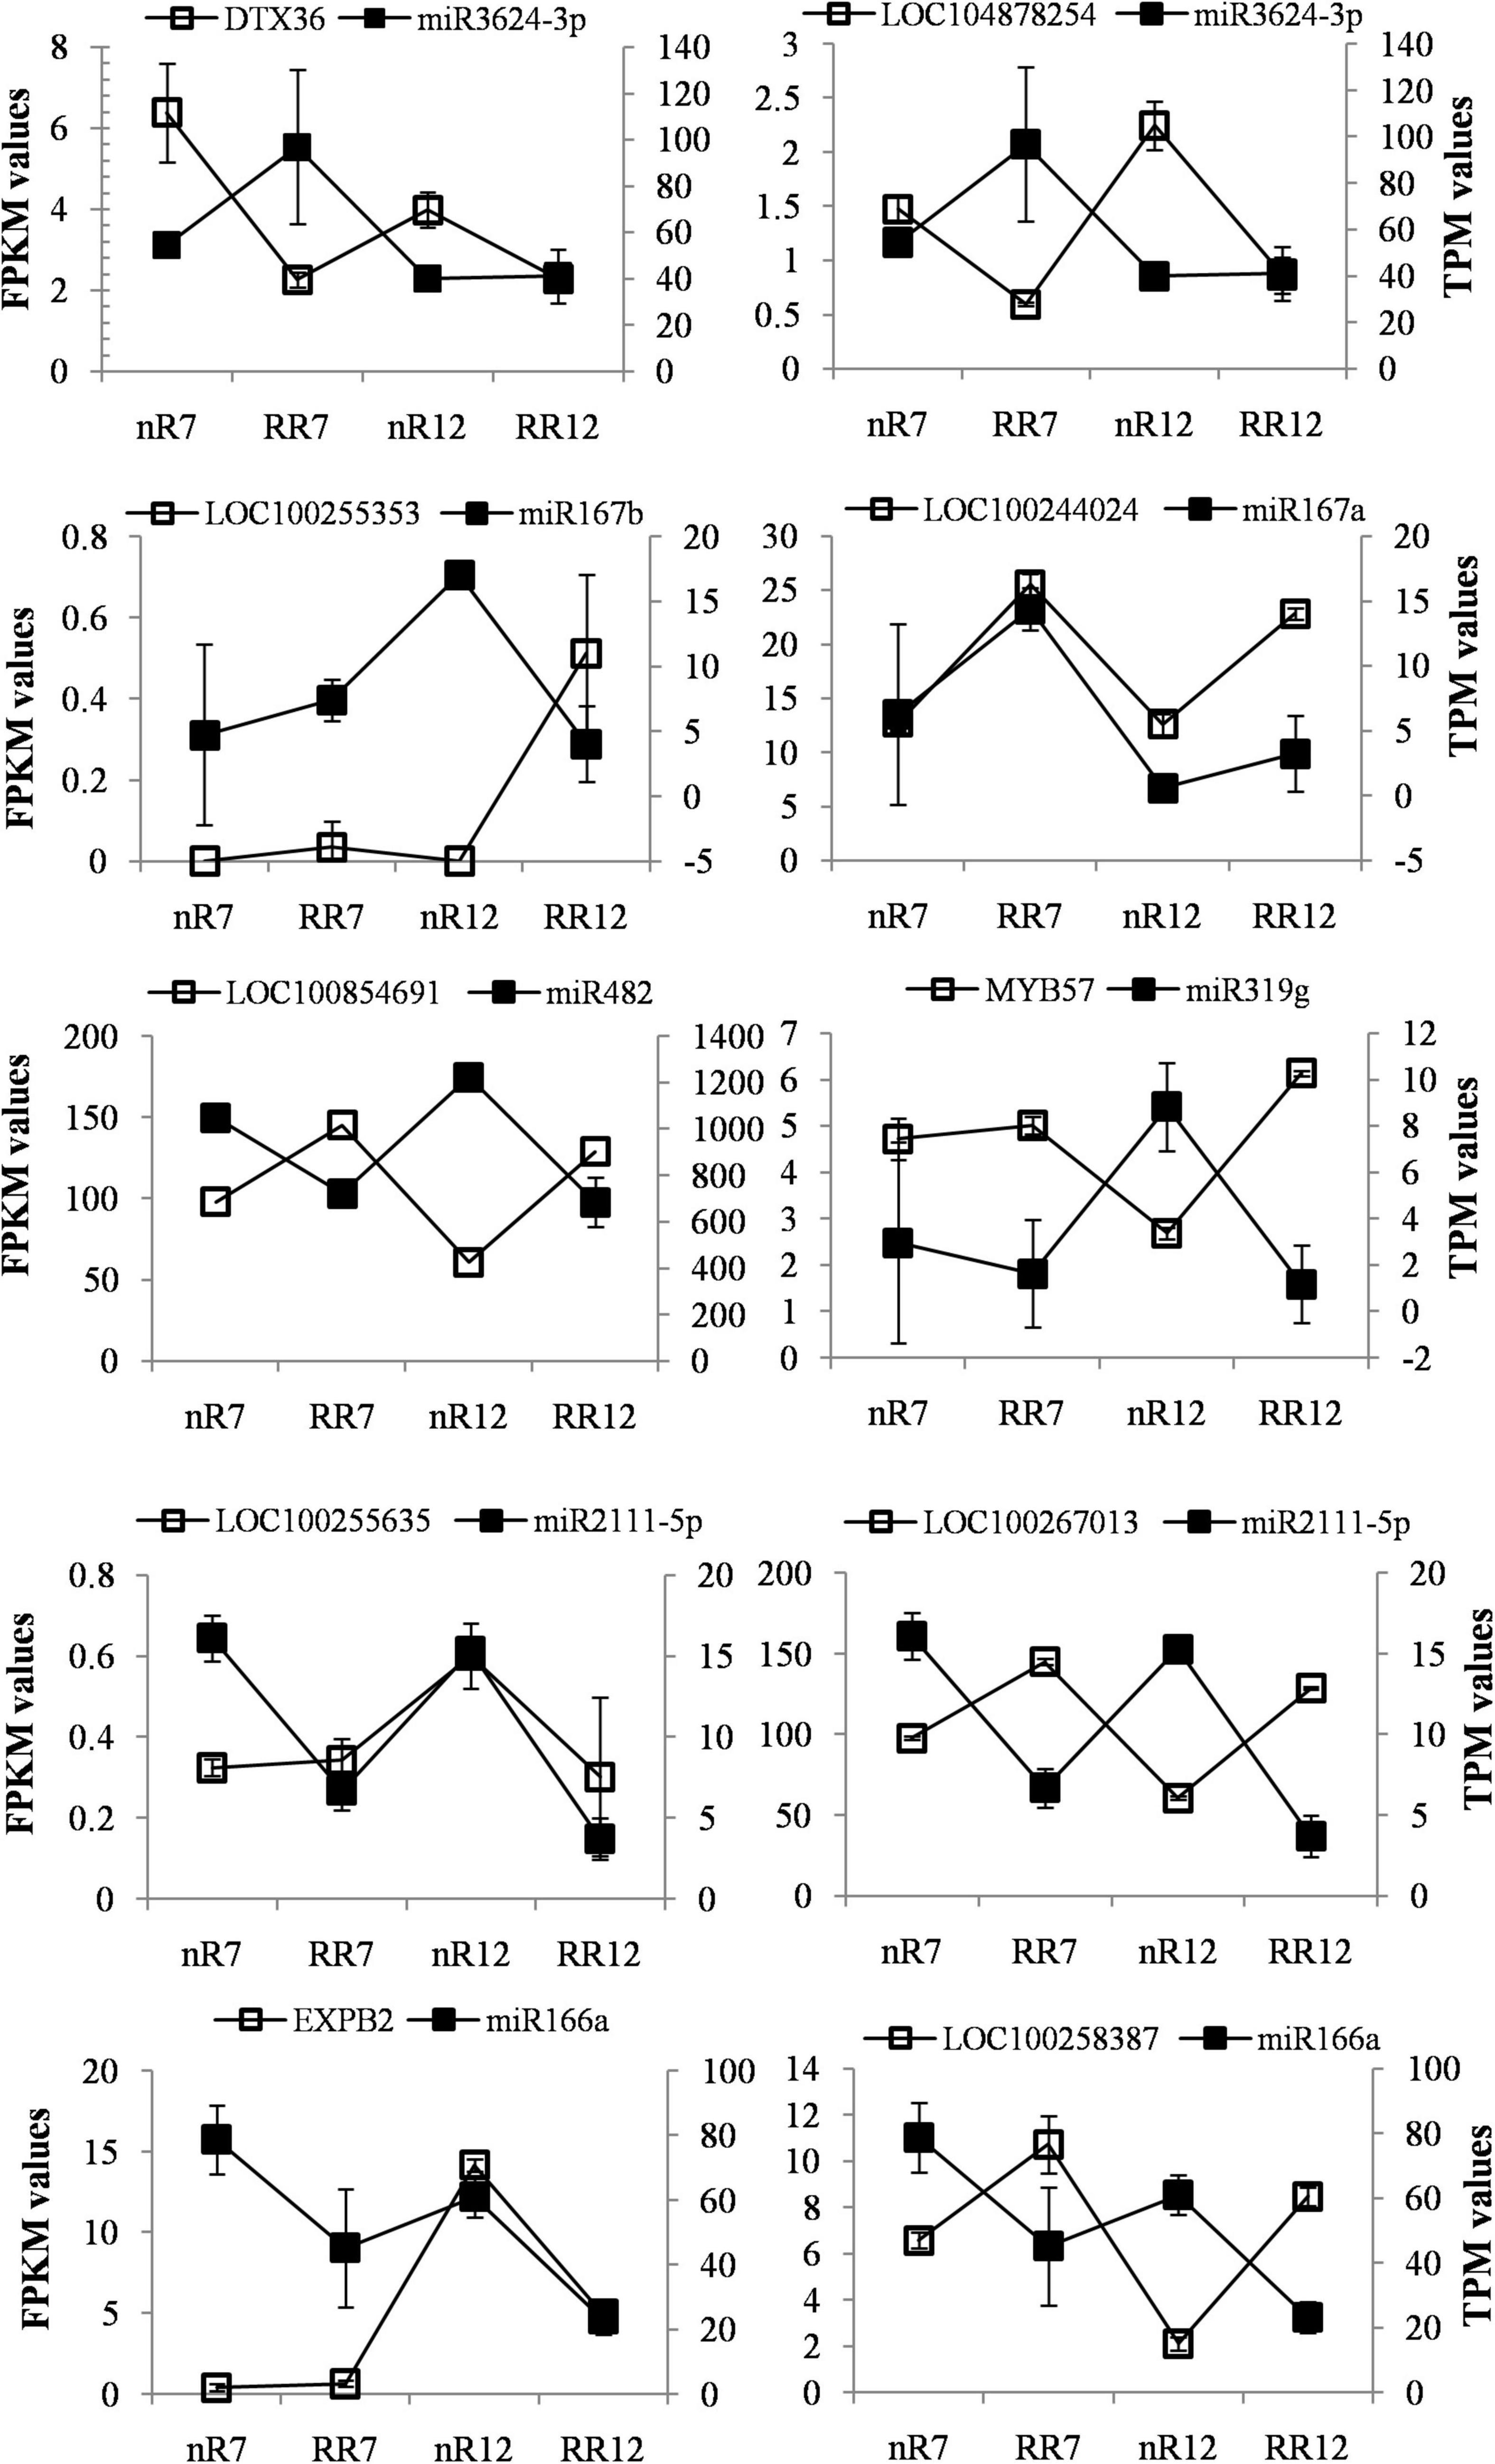
Figure 7. FPKM and TPM values of differential expression known miRNAs and their target genes under different cultivation methods comparing groups of the nR7 vs. RR7 and nR12 vs. RR12 in four sequencing samples. nR7, RR7, nR12, and RR12 represent the 70 days DAP and 125 DAP sampling points under nR and RR cultivation.
Effect of root restriction treatment on the endogenous phytohormone contents of grapevine roots
The endogenous contents of the phytohormones measured in the grapevine roots of the RR group and the nR group are shown in Figure 8. RR treatment significantly increased the ABA content at 125 DAA and significantly inhibited IAA accumulation in the roots at 70 DAA, but RR treatment had no significant effect on the contents of MeJA, GAs, ZR, or BR.
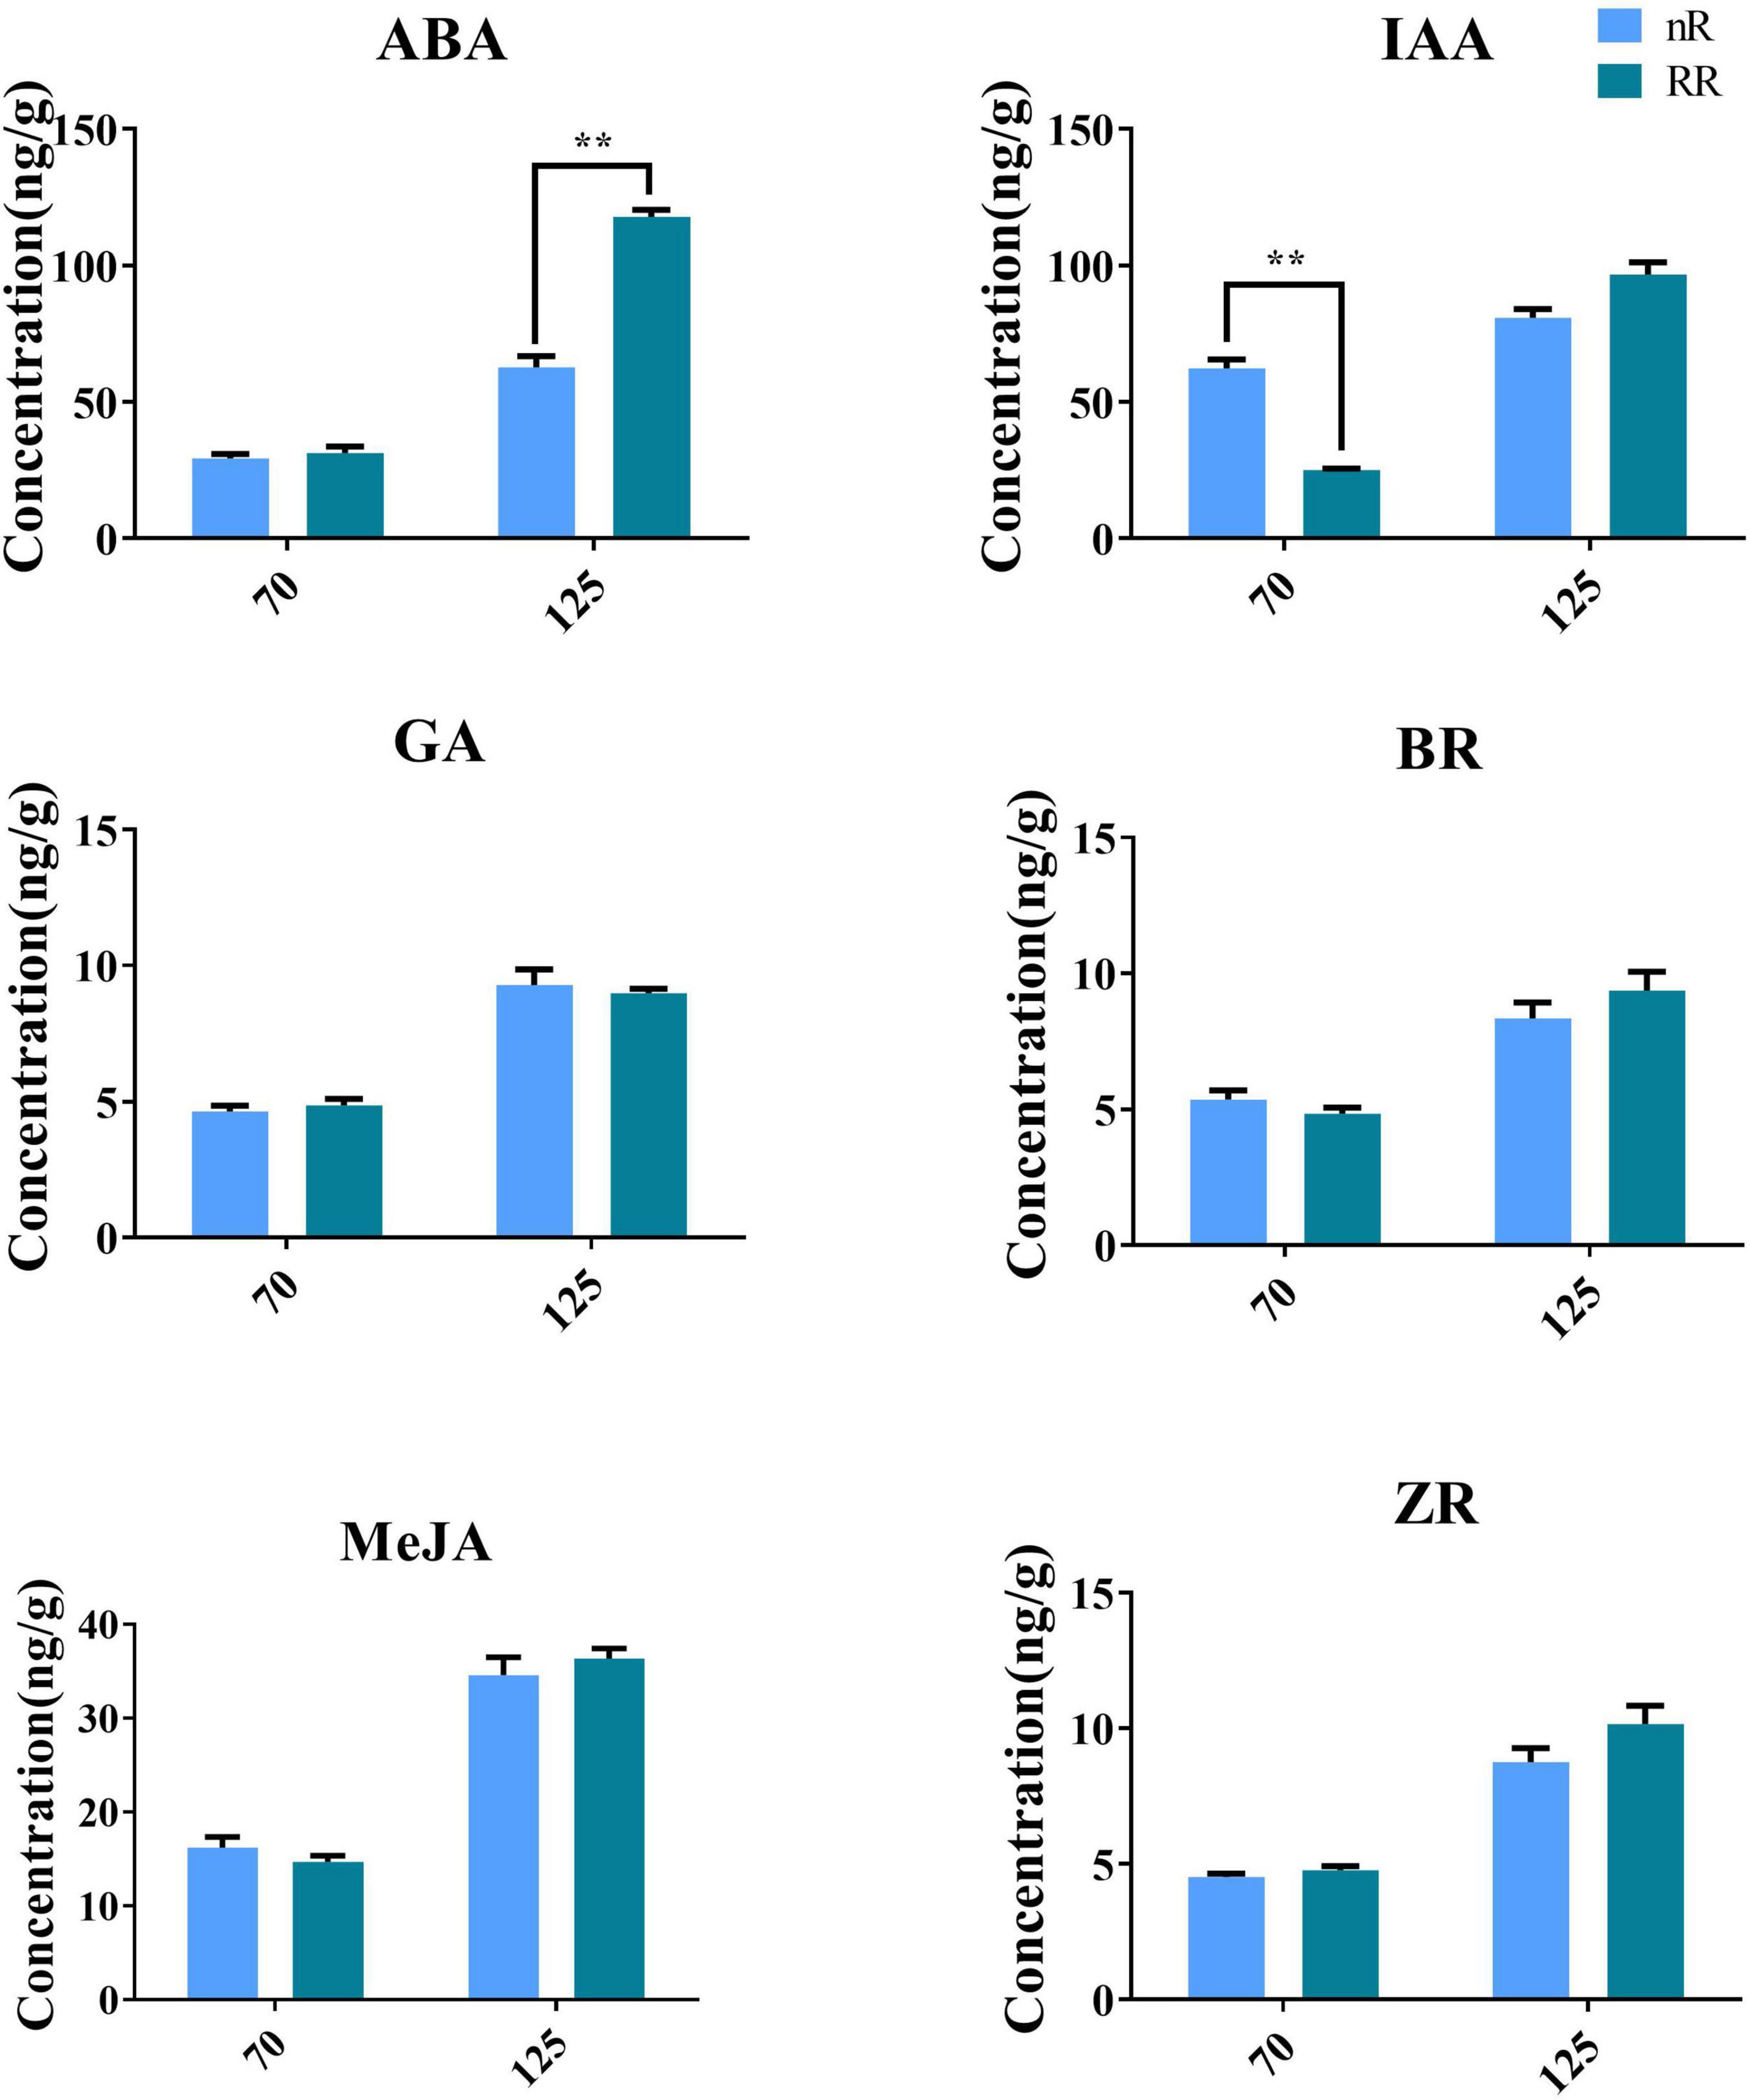
Figure 8. Effect of RR treatment and nR treatment on the contents of endogenous phytohormones in grapevine roots of different developmental stages. A total of six phytohormones were detected in this study, including ABA, IAA, MeJA, GA, BR, and ZR. The ** indicated whether there is a significant difference between the two treatments.
qRT-PCR-based validation of differentially expressed genes involved in the abscisic acid biosynthesis and metabolic pathways
Because the ABA content under RR cultivation was significantly higher than that in the control group at the late stage of root development, the expression pattern of genes involved in ABA biosynthesis was also quantified further to understand the effects of RR cultivation on ABA biosynthesis at the transcriptional level. Twenty-six DEGs involved in the ABA pathway were identified and visualized within a path map (Figure 9). The genes VvPSY1 and VvPSY3 (responsible for GGPP to phytoene conversion) were upregulated in RR12, as were the genes LCY1 (responsible for carotene biosynthesis) in both RR7 and RR12 and the genes CCD4a and CCD4b (responsible for norisoprenoid biosynthesis) in RR12. In addition, genes contributing to zeaxanthin formation (β-carotene isomerase, β-carotene hydroxylase 2, zeta-carotene isomerase) were expressed at a higher level in RR12 than in the other groups. In comparison, genes contributing to zeaxanthin metabolism (ZEP) were expressed at a higher level in nR7 than in the other groups. Interestingly, most genes directly related to ABA biosynthesis (NCED1, NCED3, NCED4, ABA2-2) were upregulated in RR12, while genes related to ABA metabolism (ABA8H1, ABA8H2) were upregulated in nR12.
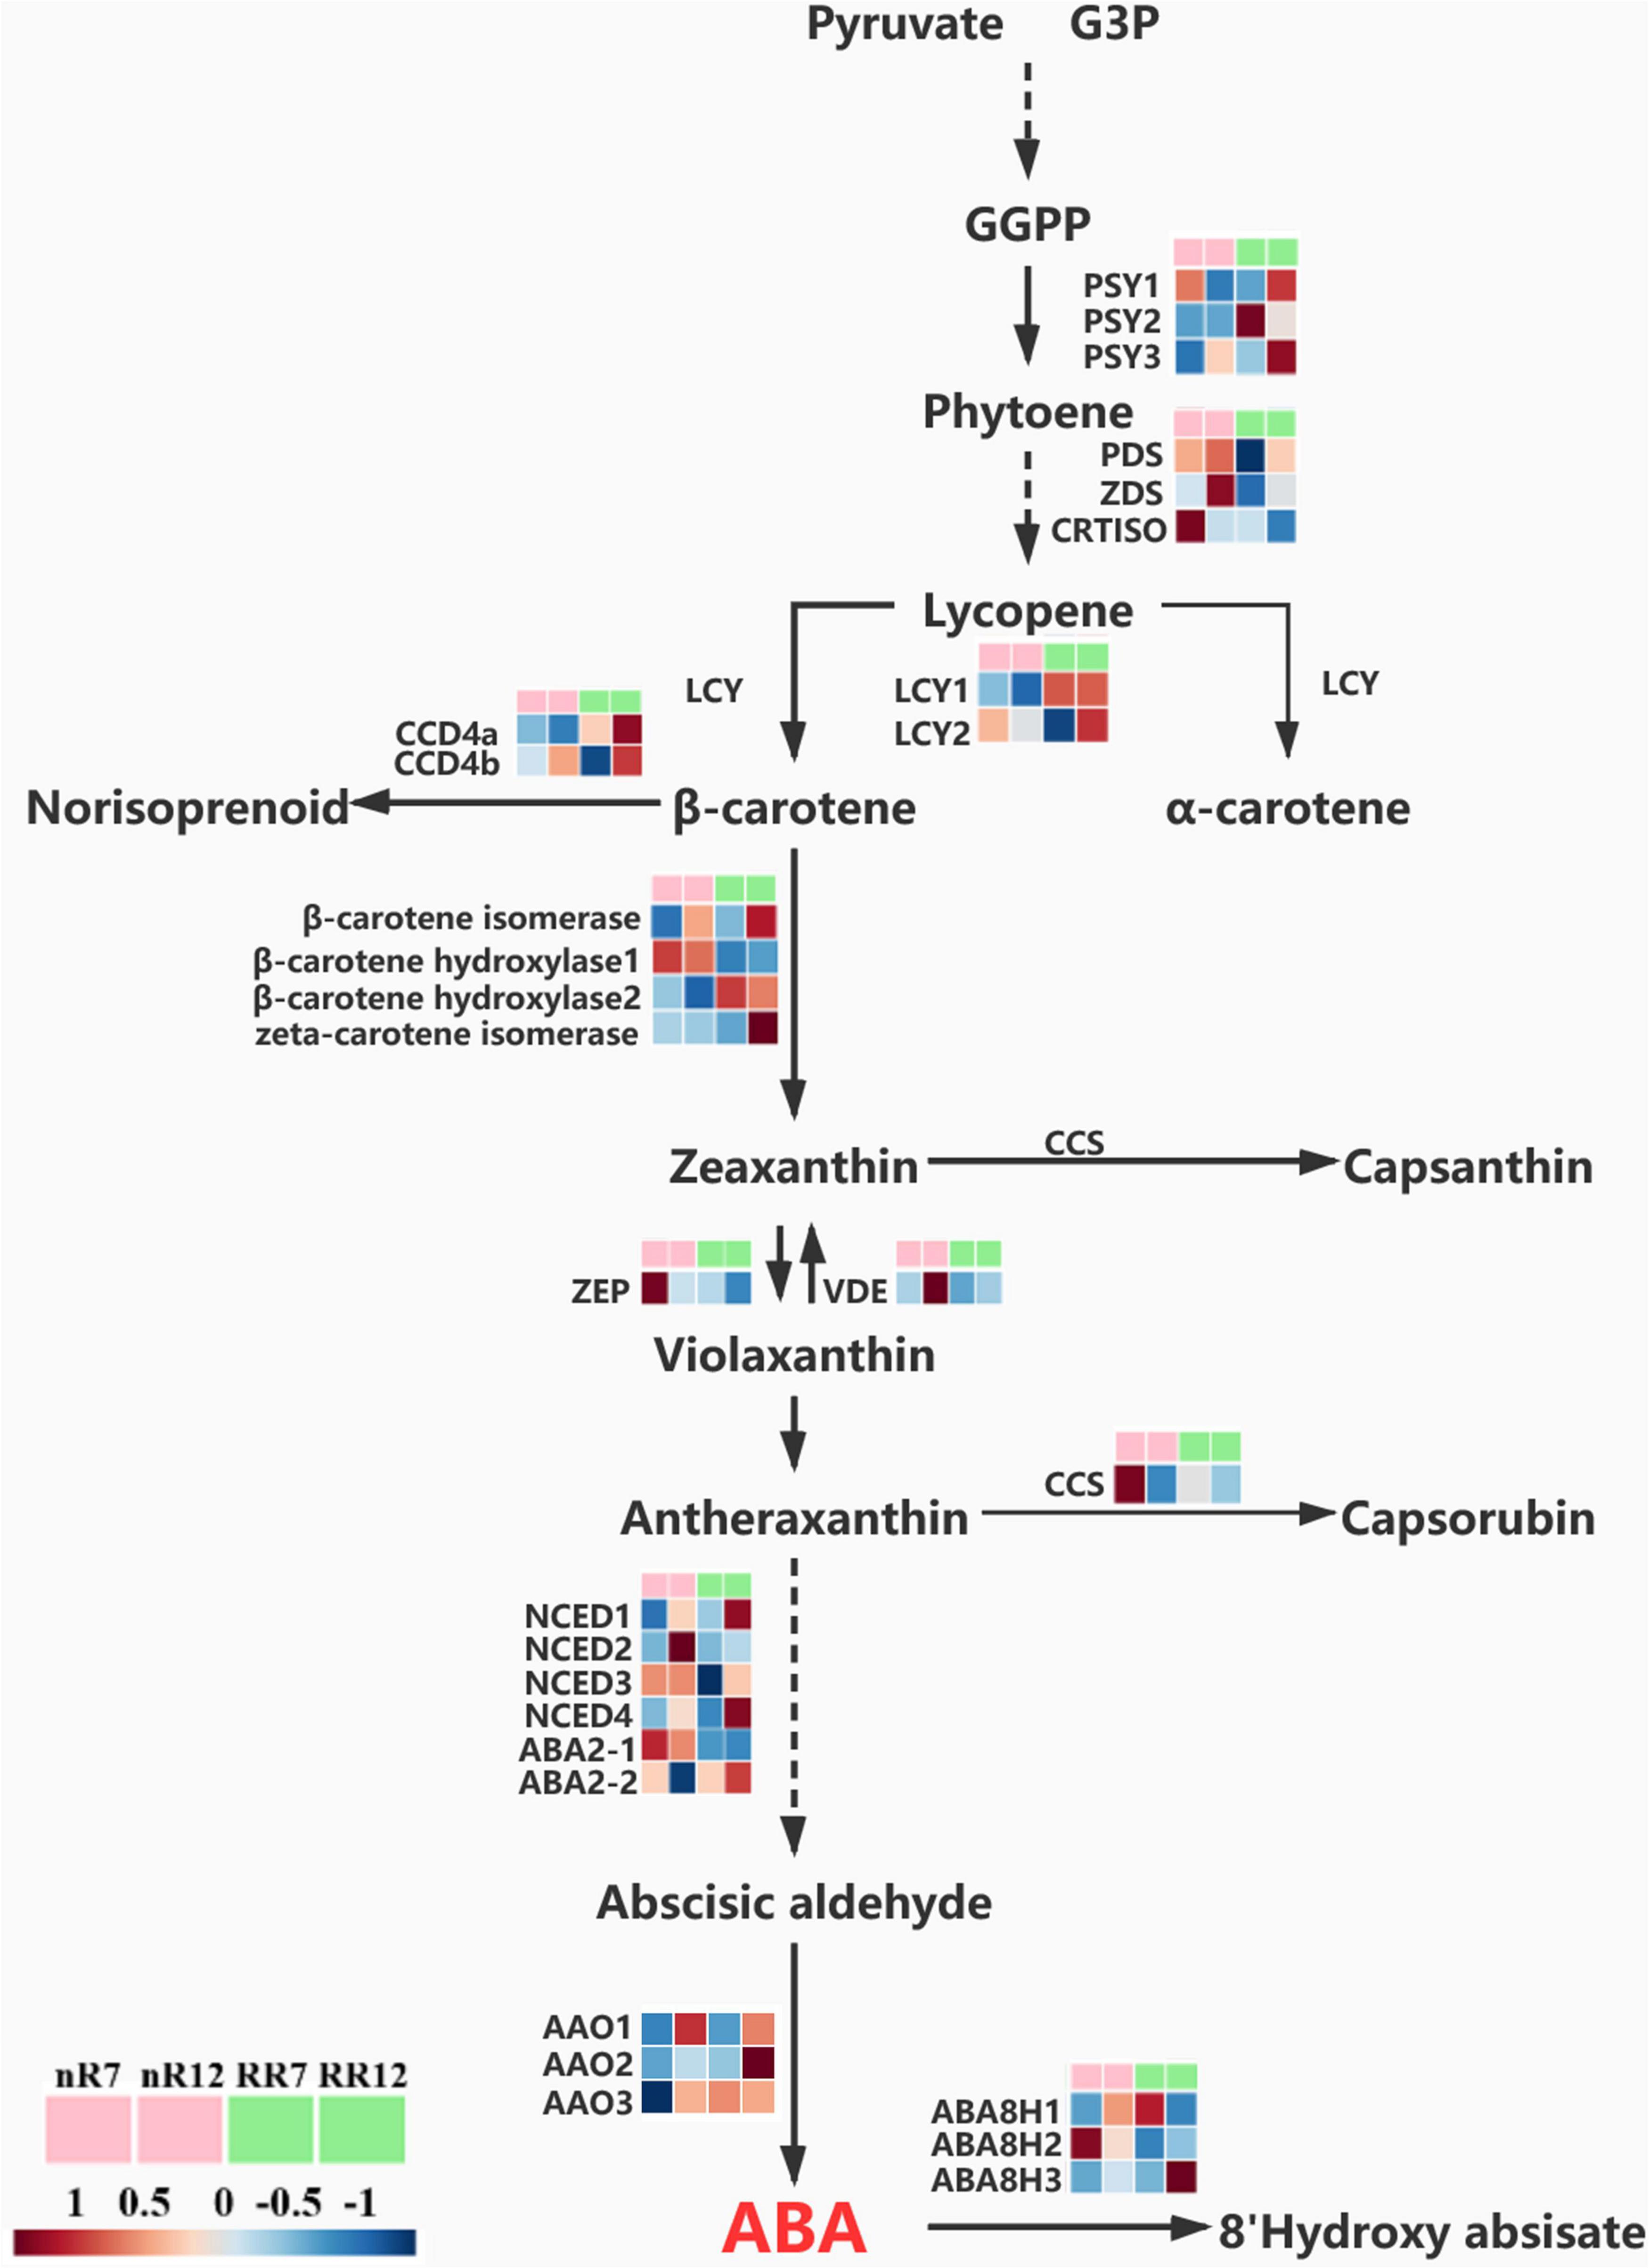
Figure 9. Relative expression levels of genes in ABA biosynthesis and metabolism pathway. The expression levels of a total of 26 genes under different cultivation modes (nR and RR) and at different developmental stages (70 DAP and 125 DAP) are shown in heat maps, with red representing up-regulation and blue representing down-regulation.
qRT-PCR-based validation of differentially expressed genes involved in the auxin biosynthesis and metabolic pathways
Twenty-six DEGs involved in the IAA pathway were identified and visualized within a path map (Figure 10). The genes TAR1 and TAA1 (responsible for the conversion of indoles to IPA), CYP79B (responsible for TRP catabolism), YUC1 (responsible for TAM catabolism), AAO (responsible for IAAId to IAA conversion) and NIT (responsible for IAN/HTAM to IAA conversion) were downregulated in RR7 and upregulated in RR12. In contrast, the gene AMI (responsible for IAM to IAA conversion) was downregulated in RR7, nR12 and RR12, while the decreasing trend was more obvious in nR7 than in the other groups.
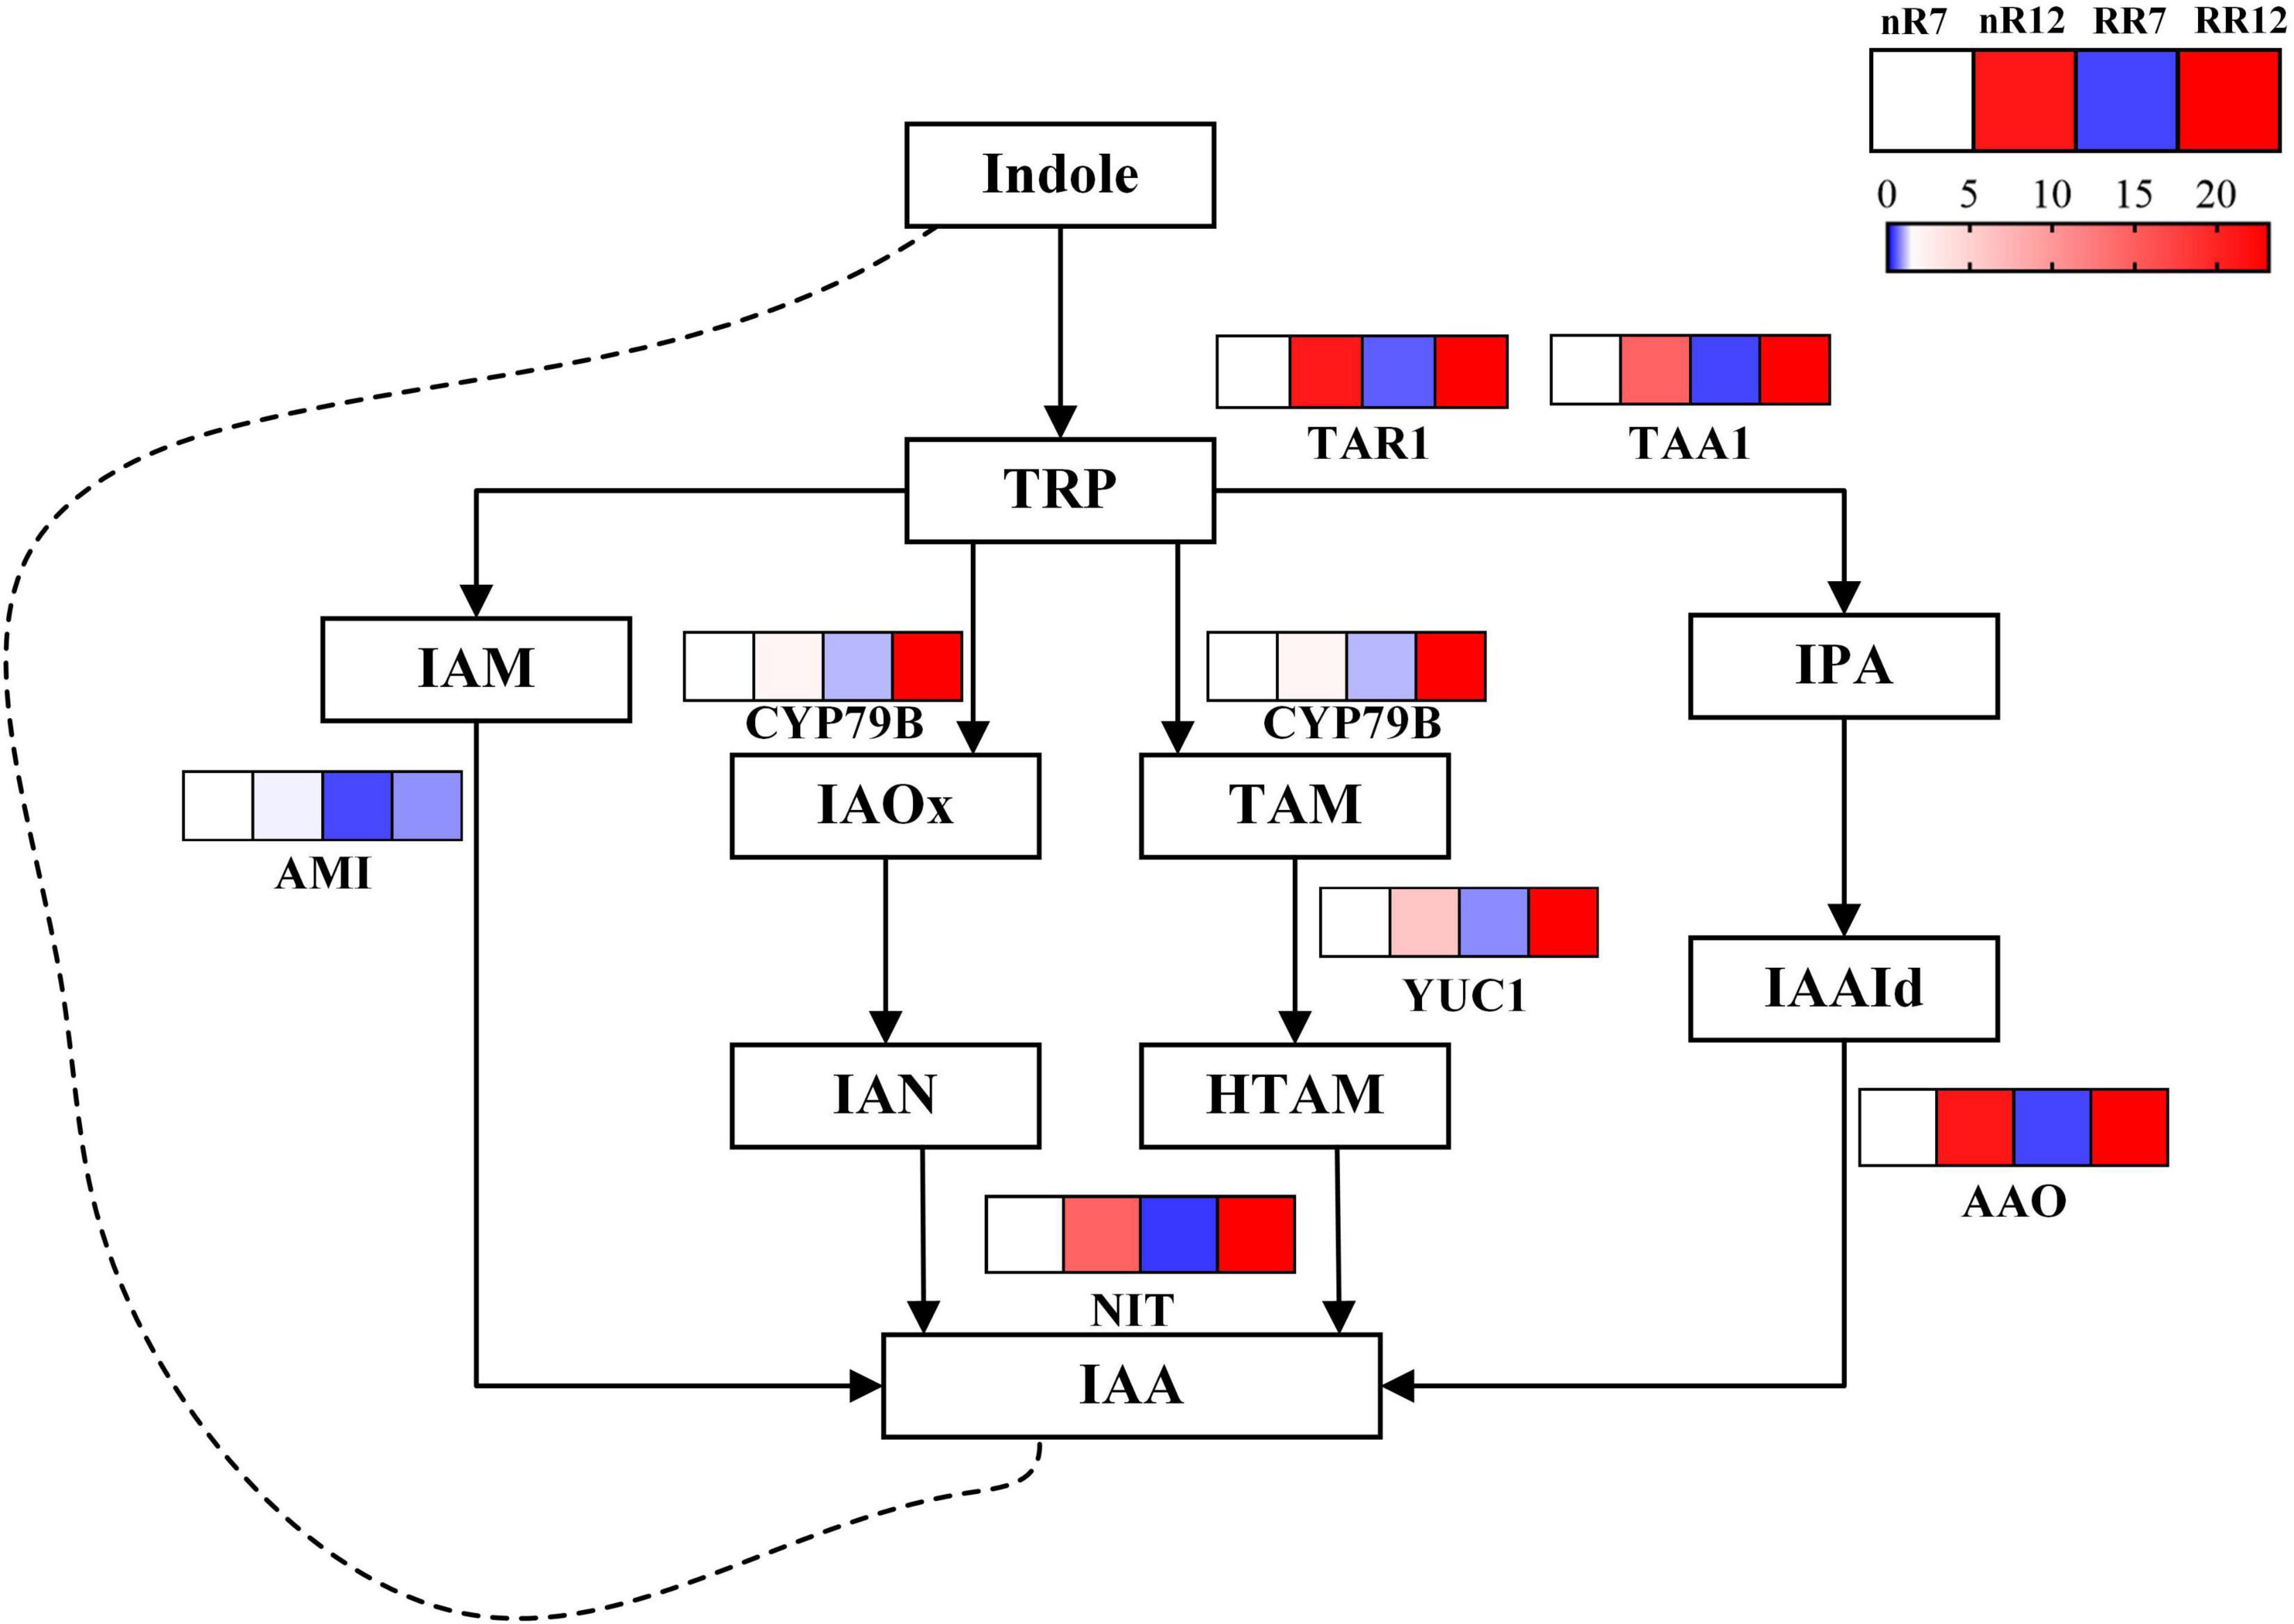
Figure 10. Relative expression levels of genes in IAA biosynthesis and metabolism pathway. The expression levels of a total of 7 genes under different cultivation modes (nR and RR) and at different developmental stages (70 DAP and 125 DAP) are shown in heat maps, with red representing up-regulation and blue representing down-regulation.
Discussion
Transcriptome sequencing revealed the expression profiles of root phytohormones-related genes under different cultivation modes
The sequencing depth and repeatability were indexed to evaluate the sequencing quality. For the transcriptome sequencing results obtained in our study, the amount of high-quality data of each sequenced sample was greater than 5 GB worth, the Q30 base distribution was greater than 92%, and the rate of obtained clean reads that mapped to the grapevine genome was greater than 90%. Taken together, all of these results illustrated that the quality and depth of the samples were high. Furthermore, the correlation coefficient between the replicates of each root sample was more than 0.99, reflecting the excellent repeatability between the samples.
In this study, 2799 DEGs were discovered in the nR12 vs. RR12 comparison group, the number of which was much greater than the 1,532 DEGs discovered in the nR7 vs. RR7 comparison group. These results indicated that other variations occurred at the transcriptome level, aside from the more visible root phenotypic changes associated with the root length following RR culture. This was also consistent with the finding of more DEMs in the root samples 125 days after planting under RR cultivation following miRNA sequencing. There were more downregulated genes than upregulated genes, which was more evident in the different nR7 vs. nR12 and RR7 vs. RR12 developmental stage comparison groups.
Gene Ontology enrichment analysis of the DEGs revealed that multiple genes respond to the process of phytohormone signal transduction. As an essential endogenous regulator of plant growth, phytohormones are active substances that can regulate plant physiological responses at low concentrations and are synthesized in plant cells receiving specific environmental signals. Among them, IAA, ABA, CTK, GAs, and ETH play essential roles in root development in some or all stages of plant growth. Specifically, IAA participates in all aspects of plant root growth, including regulating the growth of the primary roots, lateral roots, adventitious roots, root hairs, and vascular tissue (Bhalerao et al., 2002). Several DEGs (i.e., PINs) can affect the IAA distribution in the roots, play an essential role in the transport of intercellular IAA, and regulate gravitropism (Kleine-Vehn et al., 2010). ABA is another important phytohormone related to plant stress that mediates the plant responses to environmental factors, such as temperature, nitrate, and water stress (Lee and Luan, 2012; Hong et al., 2013). These environmental factors can affect plant growth, especially that of the root structure, and promote the growth of roots in one area while inhibiting the growth of roots in another area (Zhu et al., 2010). Many studies have reported that ABA contributes greatly to root development in model plant species, and ectopic expression of OBP4 or loss of RSL2 function in Arabidopsis thaliana has been shown to lead to ABA-insensitive root hair growth, confirming that OBP4-mediated RSL2 transcriptional inhibition contributes to ABA-dependent inhibition of root hair growth (Rymen et al., 2017). In this study, qRT-PCR showed that RR induced the expression of most genes involved in the ABA biosynthesis pathway, which might also be a factor in configuration changes, such as the increase in the number of fine roots. In addition, the crosstalk between several endogenous phytohormones also influences the changes in root architecture; IAA might affect ETH accumulation in root biomass independently, and the sensitivity of Arabidopsis thaliana to ETH also increases the reactivity of IAA (Alla et al., 2018). The Arabidopsis thaliana dysfunctional mutant ACC oxidase 2 and constitutive triplet reaction 1 (ETH signaling) is defective in terms of the ABA-induced reversal of the inhibition of seed germination mediated by 1-aminocyclopropane-1-carboxylic acid (ACC). In contrast, ETH production by the ACC oxidase orthologs Lepidium ACO2 and Arabidopsis ACO2 appears to be a critical regulatory step (Linkies et al., 2009). One phytohormone often stimulates the biosynthesis of other phytohormones or alters their distribution (Müller, 2021). In this study, several genes identified in this work responded to the activity of various phytohormone pathways, namely, PIN2 and PIN6 in response to IAA and ETH simultaneously, ERF113 in response to ETH and ABA, and MYB27 and MYB48 transcription factors in response to GAs and ETH. Most of the downstream genes of IAA biosynthesis were upregulated in RR7 and downregulated in RR12 and were associated with the ratio of IAA concentration under RR treatment to the control increasing from 2:1 to 1:1.2, which may be one of the factors responsible for RR-induced changes in root architecture (increased number and ratio of fine roots). The above results provide reference information for verifying the interaction of multiple phytohormones in regulating grape root development, and the DEGs identified in this study are worthy of further research on the function of phytohormone interactions during root development.
Several microRNAs and their target genes played an antagonistic role in the regulation of grape root development
MicroRNAs (miRNAs) play essential roles in plant growth, development, and response to stress, and numerous studies in different plant species have confirmed that miRNAs regulate gene expression and traits by regulating target genes, thus controlling the variation in plant phenotypes (Gao et al., 2019). Plant roots absorb water and nutrients and therefore are the sites through which plants interact with the soil environment. Some miRNAs and their targets, such as miR164 and its plant-specific transcription factor, are involved in plant lateral root growth. NAC1 DOMAIN-CONTAINING PROTEIN 1 (NAC1), which regulates lateral root formation in Arabidopsis and maize, has been identified (Jiang et al., 2019; Singh et al., 2021). In this study, GO analysis of the transcriptome sequencing data and miRNA sequencing data found that miRNAs AR important in root development; specifically, MiR165/166 can be used as a positional cue for regulating root tip meristem. Previous studies in Arabidopsis have found that, after being synthesized in the vascular column, the short root (SHR) protein can activate the transcription of miR165A and miR166B, while miR165/166 regulates root apical meristems. SHR also affects primary root growth through non-cell-autonomous restriction of HD-ZIP III transcription factors (Carlsbecker et al., 2010). In addition, miR396 was found to target the expression of growth regulatory factors and affects the size of root meristems (Liu et al., 2012). Moreover, miR408 can target the CUPREDOXIN gene to regulate root cap formation, lateral root development, and root elongation (Walch-Liu et al., 2006). The auxin-responsive factors ARF6 and ARF8 are positive regulators that promote the growth of plant adventitious roots, and miR167 strictly regulates both. In contrast, the targets of miR160 and ARF17 (auxin-responsive factor) are negative regulators that control adventitious rooting. These three ARF proteins have overlapping expression domains that interact with genes and regulate each other’s expression at the transcriptional and posttranscriptional levels through regulation of the availability of miR160 and miR167 (Gutierrez et al., 2009). Previous studies have also demonstrated that miR2111 is the only miRNA somewhat expressed in stems, and its presence in roots is mainly due to long-distance transport and affects the occurrence of root nodules in legumes. Furthermore, overexpression of miR2111 in Arabidopsis can promote the development of primary roots and lateral roots (Tsikou et al., 2018). Taken together, these findings have laid a solid foundation for further research on the regulatory network of miRNAs regulating grapevine root development through target genes. In this study, by combining the transcriptome sequencing results and miRNA sequencing results obtained earlier in our laboratory, we concluded that a large number of miRNAs and their target genes play an antagonistic role in the regulation of grape root development.
Root-restriction cultivation indeed hugely influenced the formation of abscisic acid and auxin in grapevine roots
Root-restriction treatment has been reported to affect the formation of endogenous phytohormones in different grape organs and plays a crucial role in promoting ABA accumulation as well as inhibiting IAA biosynthesis (Li et al., 2022c). To further verify the changes in endogenous phytohormone contents in the roots at different developmental stages under the two cultivation treatments, the contents of six plant hormones, including ABA and IAA, were measured in this study. The results strongly supported those of previous studies, confirming that there were significant differences in the contents of ABA and IAA under the two different cultivation treatments, while the contents of the other four phytohormones exhibited no significant differences. Previously, through quantitative expression analysis of ABA-related rate-limiting enzyme genes in different tissues, we discovered that that VvPYL1 exhibited the highest expression in the roots. Spatiotemporal expression analysis showed that VvPYL1 was highly expressed in stages II and III and that VvPYL1 was highly expressed in the lateral roots of grape seedlings. Overexpression of VvPYL1 in Arabidopsis thaliana resulted in root hairs longer than those of the wild type, and the root hair length of transgenic lines was affected by exogenous ABA (Li et al., 2020b). In addition, qRT-PCR analysis of the key genes of the IAA biosynthesis pathway, including VvTAR1, VvTAA1, VvCYP79B, VvYUC1, VvAAO and VvNIT, revealed that most were significantly downregulated under RR cultivation at the early stage of root development (RR7). Previously, our expression analysis of IAA-related rate-limiting enzyme genes in different organs revealed that VvNIT as well as VvAAO, which directly determine IAA biosynthesis, had the highest expression in the roots, and RR treatment could significantly inhibit its accumulation at the early development stage of the roots, leading to a significant difference in grapevine phenotypes (Li et al., 2022c). Overall, the above findings suggested that RR cultivation could regulate the expression of the root hair elongation-related gene VvPYL by increasing endogenous ABA contents while regulating the expression of the IAA biosynthesis-related genes VvNIT and VvAAO to regulate steady-state IAA levels, giving rise to root architecture changes of grape seedlings as well as growth differences in grapevine. Because IAA can promote rooting, the effect of ABA on rooting is not clear (Zhang et al., 2022). By combining the data concerning the contents of ABA and IAA obtained and the qRT–PCR data in this study, we also made a reasonable assumption that ABA and IAA had a synergistic effect in the process of mediating grape rooting: IAA played a role in the early stage of root development, while ABA played a role in the late stage of root development. However, the specific underlying molecular mechanism remains unknown.
Conclusion
Overall, the results indicated that there were 2031, 1445, 1532, and 2799 DEGs in the various comparison groups (nR7 vs. nR12, RR7 vs. RR12, nR7 vs. RR7, and nR12 vs. RR12, respectively). Compared with the root system at 70 DAP, the root system under RR cultivation at 125 DAP exhibited greater phenotypic differences and significantly increased numbers of DEGs. By combining the results of our analysis of the transcriptome data and previously published miRNA sequencing data, we found that DEM and DEG combinations in different comparison groups showed opposite trends, as which most DEGs were expressed at a higher level than DEMs. Further investigation indicated the accumulation of IAA was inhibited at the early stage of root development, while the formation of ABA was promoted at the later stage of root development, eventually caused the differences in root architecture under the two cultivation regimes. Moreover, different genes related to IAA and ABA biosynthesis were expressed at different levels under the different cultivation treatments. Taken together, these findings lay a foundation for further investigation of the DEGs responsible for root architecture changes under RR cultivation, providing theoretical reference information for future research in potential binding targets of miRNAs to elucidate the molecular mechanisms of transcriptional and posttranscriptional regulation on grape root development. Moreover, studies investigating the specific molecular mechanism through which endogenous ABA/IAA contents affect root architecture need to be further carried out.
Data availability statement
The datasets presented in this study can be found in online repositories. The names of the repository/repositories and accession number(s) can be found in the article/Supplementary material.
Author contributions
LW and HL designed the research. JL and GL implemented and related the qRT-PCR experiments. HL, JL, and XL analyzed the data, composed the manuscript, and drew the figures. JL and MZ reviewed and revised the manuscript. DL, CM, WX, SS, and SW reviewed the manuscript. XL and SW took responsibility for this experiment. All authors contributed to the article and approved the submitted version.
Funding
This work was supported by the National Natural Science Foundation of China (31701888 and 31972383), Yunnan (Kunming) academician expert workstation “YSZJGZZ-2021061” and the China Agriculture Research System of MOF and MARA.
Acknowledgments
We are grateful for the careful revising and selfless assistance provided by reviewers and editors.
Conflict of interest
The authors declare that the research was conducted in the absence of any commercial or financial relationships that could be construed as a potential conflict of interest.
Publisher’s note
All claims expressed in this article are solely those of the authors and do not necessarily represent those of their affiliated organizations, or those of the publisher, the editors and the reviewers. Any product that may be evaluated in this article, or claim that may be made by its manufacturer, is not guaranteed or endorsed by the publisher.
Supplementary material
The Supplementary Material for this article can be found online at: https://www.frontiersin.org/articles/10.3389/fpls.2022.959693/full#supplementary-material
Supplementary Figure 1 Grapevine roots pictures of different treatment groups (nR7, RR7, nR12, RR12).
Supplementary Table 1 Primers for qRT-PCR quantification. The sequences of genes in ABA and IAA biosynthesis pathways are all obtained in EnsemblPlants (http://plants.ensembl.org/info/about/index.html).
Footnotes
- ^ https://www.ncbi.nlm.nih.gov/data-hub/taxonomy/3603/
- ^ http://plants.ensembl.org/info/about/index.html
- ^ https://biodb.swu.edu.cn/qprimerdb/browse_plants
References
Alexa, A., and Rahnenführer, J. (2009). Gene set enrichment analysis with topGO. Bio. Improv. 27, 1–26.
Alla, K., Anna, V., Anastasia, K., Maria, S., and Guzel, K. (2018). Cross-regulation of Arabidopsis root growth by plant hormones auxins and ethylene. Biol. Commun. 63:404.
An, D., Cao, H. X., Li, C., Humbeck, K., and Wang, W. (2018). Isoform sequencing and state-of-art applications for unravelling complexity of plant transcriptomes. Genes 9:43. doi: 10.3390/genes9010043
Anders, S., and Huber, W. (2012). Differential Expression of RNA-Seq Data At The Gene Level–The DESeq Package. Heidelberg, Germany: European Molecular Biology Laboratory (EMBL).
Anders, S., Pyl, P. T., and Huber, W. (2015). HTSeq—a python framework to work with high-throughput sequencing data. Bioinformatics 31, 166–169. doi: 10.1093/bioinformatics/btu638
Bhalerao, R. P., Eklöf, J., Ljung, K., Marchant, A., Bennett, M., and Sandberg, G. (2002). Shoot-derived auxin is essential for early lateral root emergence in Arabidopsis seedlings. Plant J. 29, 325–332. doi: 10.1046/j.0960-7412.2001.01217.x
Bo, X., and Wang, S. (2005). TargetFinder: A software for antisense oligonucleotide target site selection based on MAST and secondary structures of target mRNA. Bioinformatics 21, 1401–1402. doi: 10.1093/bioinformatics/bti211
Bolger, A. M., Lohse, M., and Usadel, B. (2014). Trimmomatic: A flexible trimmer for Illumina sequence data. Bioinformatics 30, 2114–2120. doi: 10.1093/bioinformatics/btu170
Carlsbecker, A., Lee, J. Y., Roberts, C. J., Dettmer, J., Lehesranta, S., Zhou, J., et al. (2010). Cell signalling by microRNA165/6 directs gene dose-dependent root cell fate. Nature 465, 316–321. doi: 10.1038/nature08977
Cornish, P. S., So, H. B., and McWilliam, J. R. (1984). Effects of soil bulk density and water regimen on root growth and uptake of phosphorus by ryegrass. Austr. J. Agric. Res. 35, 631–644. doi: 10.1071/AR9840631
Duan, S., Wu, Y., Fu, R., Wang, L., Chen, Y., Xu, W., et al. (2019). Comparative metabolic profiling of grape skin tissue along grapevine berry developmental stages reveals systematic influences of root restriction on skin metabolome. Int. J. Mol. Sci. 20:534. doi: 10.3390/ijms20030534
Gambino, G., Perrone, I., and Gribaudo, I. (2008). A rapid and effective method for RNA extraction from different tissues of grapevine and other woody plants. Phytochem. Analy. 19, 520–525. doi: 10.1002/pca.1078
Gao, Z., Li, J., Luo, M., Li, H., Chen, Q., Wang, L., et al. (2019). Characterization and cloning of grape circular RNAs identified the cold resistance-related Vv-circATS1. Plant Physiol. 180, 966–985. doi: 10.1104/pp.18.01331
Guo, L., Xu, W., Zhu, L., Zhang, C., and Wang, S. (2014). Effect of root-zone restriction on vine growth, berry quality and the content of endogenous abscisic acid of ‘kyoho’ grapevine. J. Fruit Sci. 31, 231–237.
Gutierrez, L., Bussell, J. D., Pacurar, D. I., Schwambach, J., Pacurar, M., and Bellini, C. (2009). Phenotypic plasticity of adventitious rooting in Arabidopsis is controlled by complex regulation of AUXIN RESPONSE FACTOR transcripts and microRNA abundance. Plant Cell. 21, 3119–3132. doi: 10.1105/tpc.108.064758
Hansey, C. N., Vaillancourt, B., Sekhon, R. S., De Leon, N., Kaeppler, S. M., and Buell, C. R. (2012). Maize (Zea mays L.) genome diversity as revealed by RNA-sequencing. PLoS One 7:e33071. doi: 10.1371/journal.pone.0033071
Hong, J. H., Seah, S. W., and Xu, J. (2013). The root of ABA action in environmental stress response. Plant Cell Rep. 32, 971–983. doi: 10.1007/s00299-013-1439-9
Hopmans, J. W., and Bristow, K. L. (2002). Current capabilities and future needs of root water and nutrient uptake modeling. Adv. Agron. 77, 103–183. doi: 10.1016/S0065-2113(02)77014-4
Jiang, D., Zhou, L., Chen, W., Ye, N., Xia, J., and Zhuang, C. (2019). Overexpression of a microRNA-targeted NAC transcription factor improves drought and salt tolerance in rice via ABA-mediated pathways. Rice 12, 1–11. doi: 10.1186/s12284-019-0334-6
Kanehisa, M., Araki, M., Goto, S., Hattori, M., Hirakawa, M., Itoh, M., et al. (2007). KEGG for linking genomes to life and the environment. Nucleic Acids Res. 36, D480–D484. doi: 10.1093/nar/gkm882
Kleine-Vehn, J., Ding, Z., Jones, A. R., Tasaka, M., Morita, M. T., and Friml, J. (2010). Gravity-induced PIN transcytosis for polarization of auxin fluxes in gravity-sensing root cells. Proc. Natl. Acad. Sci. U.S.A. 107, 22344–22349. doi: 10.1073/pnas.1013145107
Klepikova, A. V., Kasianov, A. S., Gerasimov, E. S., Logacheva, M. D., and Penin, A. A. (2016). A high resolution map of the Arabidopsis thaliana developmental transcriptome based on RNA-seq profiling. Plant J. 88, 1058–1070. doi: 10.1111/tpj.13312
Lee, S. C., and Luan, S. (2012). ABA signal transduction at the crossroad of biotic and abiotic stress responses. Plant Cell Environ. 35, 53–60. doi: 10.1111/j.1365-3040.2011.02426.x
Leng, F., Cao, J., Wang, S., Jiang, L., Li, X., and Sun, C. (2018). Transcriptomic analyses of root restriction effects on phytohormone content and signal transduction during grape berry development and ripening. Int. J. Mol. Sci. 19:2300. doi: 10.3390/ijms19082300
Li, D., Liu, B., Wang, Z., Li, X., Sun, S., Ma, C., et al. (2022a). Sugar accumulation may be regulated by a transcriptional cascade of ABA-VvGRIP55-VvMYB15-VvSWEET15 in grape berries under root restriction. Plant Sci. 2022:111288. doi: 10.1016/j.plantsci.2022.111288
Li, D., Wang, Z., Sun, S., Xiao, K., Cao, M., Li, X., et al. (2022b). VvMYB15 and VvWRKY40 positively co-regulated anthocyanin biosynthesis in grape berries in response to root restriction. Front. Plant Sci. 13:850160.
Li, J., Li, D., Liu, B., Wang, R., Yan, Y., Li, G., et al. (2022c). Effects of root restriction on phytohormone levels in different growth stages and grapevine organs. Sci. Rep. 12, 1–15. doi: 10.1038/s41598-021-04617-6
Li, D., Pang, Y., Li, H., Guo, D., Wang, R., Ma, C., et al. (2021). Comparative analysis of the gene expression profile under two cultivation methods reveals the critical role of ABA in grape quality promotion. Sci. Hortic. 281:109924. doi: 10.1016/j.scienta.2021.109924
Li, J., Liu, B., Li, X., Li, D., Han, J., Zhang, Y., et al. (2021). Exogenous abscisic acid mediates berry quality improvement by altered endogenous plant hormones level in “Ruiduhongyu” grapevine. Front. Plant Sci. 12:739964. doi: 10.3389/fpls.2021.739964
Li, H., Gao, Z., Chen, Q., Li, Q., Luo, M., Wang, J., et al. (2020a). Grapevine ABA receptor VvPYL1 regulates root hair development in transgenic Arabidopsis. Plant Physiol. Biochem. 149, 190–200. doi: 10.1016/j.plaphy.2020.02.008
Li, H., Gao, Z., Zahid, M. S., Li, D., Javed, H. U., Wang, L., et al. (2020b). Small RNA sequencing analysis of miRNA expression reveals novel insihts into root formation under root restriction cultivation in grapevine (Vitis vinifera L.). Int. J. Mol. Sci. 21:3513. doi: 10.3390/ijms21103513
Linkies, A., Müller, K., Morris, K., Turecková, V., Wenk, M., Cadman, C. S., et al. (2009). Ethylene interacts with abscisic acid to regulate endosperm rupture during germination: A comparative approach using Lepidium sativum and Arabidopsis thaliana. Plant Cell. 21, 3803–3822. doi: 10.1105/tpc.109.070201
Liu, Z., Kumari, S., Zhang, L., Zheng, Y., and Ware, D. (2012). Characterization of miRNAs in response to short-term waterlogging in three inbred lines of Zea mays. PLoS One 7:e39786. doi: 10.1371/journal.pone.0039786
Longo, S. K., Guo, M. G., Ji, A. L., and Khavari, P. A. (2021). Integrating single-cell and spatial transcriptomics to elucidate intercellular tissue dynamics. Nat. Rev. Genet. 22, 627–644. doi: 10.1038/s41576-021-00370-8
Mir, R. R., Reynolds, M., Pinto, F., Khan, M. A., and Bhat, M. A. (2019). High-throughput phenotyping for crop improvement in the genomics era. Plant Sci. 282, 60–72. doi: 10.1016/j.plantsci.2019.01.007
Müller, M. (2021). Foes or friends: ABA and ethylene interaction under abiotic stress. Plants 10:448. doi: 10.3390/plants10030448
Roberts, A., Pimentel, H., Trapnell, C., and Pachter, L. (2011). Identification of novel transcripts in annotated genomes using RNA-Seq. Bioinformatics 27, 2325–2329. doi: 10.1093/bioinformatics/btr355
Rymen, B., Kawamura, A., Schäfer, S., Breuer, C., Iwase, A., Shibata, M., et al. (2017). ABA suppresses root hair growth via the OBP4 transcriptional regulator. Plant Physiol. 173, 1750–1762. doi: 10.1104/pp.16.01945
Singh, S., Koyama, H., Bhati, K. K., and Alok, A. (2021). The biotechnological importance of the plant-specific NAC transcription factor family in crop improvement. J. Plant Res. 134, 475–495. doi: 10.1007/s10265-021-01270-y
Slatko, B. E., Gardner, A. F., and Ausubel, F. M. (2018). Overview of next-generation sequencing technologies. Curr. Prot. Mol. Biol. 122:e59. doi: 10.1002/cpmb.59
Smart, D. R., Schwass, E., Lakso, A., and Morano, L. (2006). Grapevine rooting patterns: A comprehensive analysis and a review. Am. J. Enol. Vitic. 57, 89–104.
Tardieu, F. (1996). Drought perception by plants do cells of droughted plants experience water stress? Plant Growth Regulat. 20, 93–104. doi: 10.1007/BF00024005
Tsikou, D., Yan, Z., Holt, D. B., Abel, N. B., Reid, D. E., Madsen, L. H., et al. (2018). Systemic control of legume susceptibility to rhizobial infection by a mobile microRNA. Science 362, 233–236. doi: 10.1126/science.aat6907
Van Zyl, J. L. (1984). Response of colombar grapevines to irrigation as regards quality aspects and growth. Soc. Afr. J. Enol. Vitic. 5, 19–28. doi: 10.21548/5-1-2365
Walch-Liu, P. I. A., Ivanov, I. I., Filleur, S., Gan, Y., Remans, T., and Forde, B. G. (2006). Nitrogen regulation of root branching. Ann. Bot. 97, 875–881. doi: 10.1093/aob/mcj601
Wang, B., He, J., Duan, C., Yu, X., Zhu, L., Xie, Z., et al. (2012). Root restriction affects anthocyanin accumulation and composition in berry skin of ‘Kyoho’grape (Vitis vinifera L.× Vitis labrusca L.) during ripening. Sci. Hortic. 137, 20–28. doi: 10.1016/j.scienta.2011.10.006
Wang, R., Sun, Q., and Xing, X. (2020). Root transcriptome reveals responses to plastic film mulching and grass cover in wine grape’cabernet sauvignon’root and berry. Vitis J. Grapev. Res. 59, 1–8.
Wang, S., Okamoto, G., Hirano, K., Lu, J., and Zhang, C. (2001). Effects of restricted rooting volume on vine growth and berry development of Kyoho grapevines. Am. J. Enol. Vitic. 52, 248–253.
Xie, Z., Li, B., Forney, C. F., Xu, W., and Wang, S. (2009). Changes in sugar content and relative enzyme activity in grape berry in response to root restriction. Sci. Hortic. 123, 39–45. doi: 10.3390/genes13020281
Yu, J., Zhu, M., Wang, M., Xu, Y., Chen, W., and Yang, G. (2020). Transcriptome analysis of calcium-induced accumulation of anthocyanins in grape skin. Sci. Hortic. 260:108871. doi: 10.1016/j.scienta.2019.108871
Yu, X. M., Li, J. F., Zhu, L. N., Bo, W. A., Lei, W. A., Yang, B. A. I., et al. (2015). Effects of root restriction on nitrogen and gene expression levels in nitrogen metabolism in Jumeigui grapevines (Vitis vinifera L.× Vitis labrusca L.). J. Int. Agric. 14, 67–79. doi: 10.1016/S2095-3119(14)60876-5
Zhang, G., Guo, G., Hu, X., Zhang, Y., Li, Q., Li, R., et al. (2010). Deep RNA sequencing at single base-pair resolution reveals high complexity of the rice transcriptome. Geno., Res. 20, 646–654. doi: 10.1101/gr.100677.109
Zhang, L., Chen, Q., Liu, J., Dou, F., Wang, H., Song, Y., et al. (2022). Identification of grape miRNA revealed Vvi-miR164b involved in auxin induced root development. Sci. Hortic. 295:110804. doi: 10.1016/j.scienta.2021.110804
Zhu, B., Yang, Y., Li, R., Fu, D., Wen, L., Luo, Y., et al. (2015). RNA sequencing and functional analysis implicate the regulatory role of long non-coding RNAs in tomato fruit ripening. J. Exp. Bot. 66, 4483–4495. doi: 10.1093/jxb/erv203
Keywords: Vitis vinifera L., root restriction, abscisic acid, auxin, root system, high-throughput sequencing
Citation: Wang L, Li H, Li J, Li G, Zahid MS, Li D, Ma C, Xu W, Song S, Li X and Wang S (2022) Transcriptome analysis revealed the expression levels of genes related to abscisic acid and auxin biosynthesis in grapevine (Vitis vinifera L.) under root restriction. Front. Plant Sci. 13:959693. doi: 10.3389/fpls.2022.959693
Received: 02 June 2022; Accepted: 01 August 2022;
Published: 24 August 2022.
Edited by:
Mikihisa Umehara, Toyo University, JapanReviewed by:
Qingping Ma, Liaocheng University, ChinaTing Zheng, Nanjing Agricultural University, China
Copyright © 2022 Wang, Li, Li, Li, Zahid, Li, Ma, Xu, Song, Li and Wang. This is an open-access article distributed under the terms of the Creative Commons Attribution License (CC BY). The use, distribution or reproduction in other forums is permitted, provided the original author(s) and the copyright owner(s) are credited and that the original publication in this journal is cited, in accordance with accepted academic practice. No use, distribution or reproduction is permitted which does not comply with these terms.
*Correspondence: Xiangyi Li, bGl4aWFuZ3lpQHNqdHUuZWR1LmNu; Shiping Wang, RnJ1aXRAc2p0dS5lZHUuY24=
†These authors have contributed equally to this work
 Lei Wang
 Hui Li†
 Jiajia Li
 Muhammad Salman Zahid
 Dongmei Li
 Chao Ma
 Wenping Xu
 Xiangyi Li
 Shiping Wang