 María Jimena Ruiz-Diaz1†
 Daniel Matsusaka1†Jimena Cascales1
 Diego H. Sánchez1
 Maximiliano Sánchez-Lamas2
 Pablo D. Cerdán2Javier F. Botto1‡*
- 1IFEVA (CONICET-UBA), Facultad de Agronomía, Universidad de Buenos Aires, Buenos Aires, Argentina
- 2Fundación Instituto Leloir, IIBBA-CONICET, Buenos Aires, Argentina
Arabidopsis thaliana shows a wide range of natural genetic variation in light responses. Shade avoidance syndrome is a strategy of major adaptive significance that includes seed germination, elongation of vegetative structures, leaf hyponasty, and acceleration of flowering. Previously, we found that the southernmost Arabidopsis accession, collected in the south of Patagonia (Pat), is hyposensitive to light and displays a reduced response to shade light. This work aimed to explore the genetic basis of the shade avoidance response (SAR) for hypocotyl growth by QTL mapping in a recently developed 162 RIL population between Col-0 and Pat. We mapped four QTL for seedling hypocotyl growth: WL1 and WL2 QTL in white light, SHADE1 QTL in shade light, and SAR1 QTL for the SAR. PHYB is the strongest candidate gene for SAR1 QTL. Here we studied the function of two polymorphic indels in the promoter region, a GGGR deletion, and three non-synonymous polymorphisms on the PHYB coding region compared with the Col-0 reference genome. To decipher the contribution and relevance of each PHYB-Pat polymorphism, we constructed transgenic lines with single or double polymorphisms by using Col-0 as a reference genome. We found that single polymorphisms in the coding region of PHYB have discrete functions in seed germination, seedling development, and shade avoidance response. These results suggest distinct functions for each PHYB polymorphism to the adjustment of plant development to variable light conditions.
Introduction
Light responses of plant populations differ between contrasting habitats and show adaptive variation (Maloof et al., 2001; Alonso-Blanco et al., 2009). Different physiological responses are mediated by light perception through photoreceptors including phytochromes, cryptochromes, phototropins, and UVR8 (Chen et al., 2004; Bae and Choi, 2008; Legris et al., 2019). In Arabidopsis, the phytochromes are encoded by PHYA, PHYB, PHYC, PHYD, and PHYE genes. Phytochromes (phys) perceive red (R) and Far-red (FR) signals and induce seed germination, seedling de-etiolation, and shade avoidance responses, among others. Light can promote seed germination through a Red/Far-Red (R/FR) reversible response principally by phyB and secondarily by phyC, phyD, and phyE (Bae and Choi, 2008; Tognacca and Botto, 2021). After germination, the light signal transduced by phytochromes and cryptochromes triggers seedling de-etiolation, inhibits hypocotyl growth, and promotes the opening and greening of cotyledons (Bae and Choi, 2008; Legris et al., 2019). Then, young plants compete for photosynthesis light with neighbors. The plant canopy efficiently absorbs blue and R photons by photosynthetic pigments and increases the relative amount of FR photons. Plants perceive R/FR ratio changes even before being shaded by other plants, enhancing the elongation of vegetative structures, leaf hyponasty, and acceleration of flowering, collectively known as shade avoidance responses (SARs; Casal, 2013; Ballaré and Pierik, 2017).
A huge natural genetic variation in SARs has been pioneeringly documented in Arabidopsis (Botto and Smith, 2002). A higher light sensitivity to shade was documented for flowering and dry biomass in coastal than mountain populations of Arabidopsis being the SAR plasticity increased with higher temperatures and lower rainfall occurring on the coast (Botto, 2015). Latitudinal origin of natural populations of Cardamine is also responsible for differences in light sensitivities being higher latitude species more sensitive to red light than lower latitude sister (Ikeda et al., 2021). The genetic architecture of the SARs has been deciphered through quantitative genetics using mapping populations such as recombinant inbred lines (RILs), nested association mapping (NAM) population (Ta et al., 2020), or genome-wide association study (Filiault and Maloof, 2012). By Quantitative Trait Loci (QTL) mapped in different RIL populations, several studies have proposed candidate genes for SARs (Jiménez-Gómez et al., 2010; Coluccio et al., 2011; Kasulin et al., 2013; Jiang et al., 2019; Ta et al., 2020). For example, PHYB has been associated as a gene candidate to detect low plant density in the Ler × No-0 and Ler × Cvi RIL populations (Botto and Coluccio, 2007), and ELF3 was documented as the SAR causal gene for hypocotyl growth and flowering in the Bay × Sha RIL population (Jiménez-Gómez et al., 2010; Coluccio et al., 2011). Interestingly, two close mapped genes, PHYB and ERECTA, have been suggested as candidate genes for the SAR regarding the genetic background in three RIL populations sharing Col-0 as the same parental line (Kasulin et al., 2013). Together these results suggest that the SAR includes complex traits associated with the genetic background in combination with the environmental circumstances experienced by plants. Similar conclusions arrived after studying the genetic architecture of SARs in late-vegetative and reproductive traits using a NAM population of Arabidopsis plants (Ta et al., 2020).
The principal R-light photoreceptor mediating the SARs is the phyB being its holoprotein relatively stable (Legris et al., 2019). PhyB is synthesized in the Pr inactive form and photo-transformed to the Pfr active form upon absorption of R photons. Plant phytochromes are dimeric, each monomer consists of ~1,150 amino acids covalently bound to its chromophore, a linear tetrapyrrole named phytochromobilin (PΦB). The PHYB apoprotein has an N-terminal photosensory module (PSM), which consists of the N-terminal extension (NTE), and three structurally related domains known as PAS (Period/Arnt/SIM), GAF (cGMP phosphodiesterase/adenylyl cyclase/FhlA) and PHY phytochrome-specific domain. The C-terminal module (CTM) contains two PAS domains and a histidine kinase-related domain (HKRD). The chromophore is bound covalently to a conserved cysteine in the GAF domain, which has intrinsic chromophore lyase activity (Burgie et al., 2014). After light perception, the isomerization and conformational change of the PΦB chromophore leads to a cascade of structural modifications in the protein by the interaction with the GAF domain by non-covalent interactions with residues from the rest of PSM domains (Burgie et al., 2014). The Initial conformational rearrangements in the PSM lead to structural changes affecting the CTM. Ultimately, the light-induced Pfr interacts with other proteins necessary for nuclear localization and signaling, such as PHYTOCHROME INTERACTING FACTOR (PIF) transcription factors (Leivar et al., 2012), ubiquitin E3 ligase complexes (Podolec and Ulm, 2018), and SUMOylation complexes (Sadanandom et al., 2015).
A natural variation study of the PHYB gene in 33 accessions of Arabidopsis found 14 non-synonymous polymorphisms mapped in the coding region (Filiault et al., 2008). Four polymorphisms were mapped on the PSM module while 10 polymorphisms were located on the CTM module (Filiault et al., 2008). Seven of those non-synonymous polymorphisms were documented between Ler and Cvi accessions. By transgenic analysis, the complete Cvi-PHYB variant in the phyB-9 mutant background caused a low red-light sensitivity in seedling de-etiolation compared with the Ler-PHYB allele (Filiault et al., 2008). Recently, it has been demonstrated that fine tuning Pfr stability is a fundamental mechanism for plants to optimise phytochrome-related traits in a comparative study between two sister species of Cardamine, a close Brassicaceae relative of Arabidopsis. In fact, the higher latitude species (Cardamine bellidifolia; Cb) is more sensitive to R light compared with its lower latitude sister (C. nipponica; Cn). Moreover, CbPHYB is less sensitive to high temperatures in the phyB-deficient mutant of Arabidopsis thaliana than CnPHYB: that is Pfr CbphyB was more stable in nuclei than CnphyB (Ikeda et al., 2021). However, we lack information about the individual contribution of each PHYB polymorphism in the diversity of plant light responses.
The native range of Arabidopsis distribution is Eurasia and North Africa (Al-Shehbaz and O'Kane, 2002; Durvasula et al., 2017). Arabidopsis has been introduced worldwide, especially around the Northern Hemisphere (Exposito-Alonso et al., 2019). In South America, Arabidopsis was probably introduced in the last century together with the first European immigrants arriving in the Occidental District of Patagonia. Patagonia germplasm (Pat) represents a single haplogroup (Kasulin et al., 2017). In the field, Pat showed a strong plasticity according with the place of collection. Accelerated flowering plants with low dry biomass were collected behind shrubs, while still green plants with profuse lateral branching were found in open areas (Kasulin et al., 2017). In the laboratory, Pat plants show low sensitivity to light and have a strong vernalization requirement for flowering that correlates with impaired expression of phytochrome and FLC signaling-related genes (Kasulin et al., 2017). Here, we hypothesize that the contrasting light responses between Col-0 and Pat could be explored to study the genetic architecture of the SAR. We mapped QTLs in the SAR mediating hypocotyl growth by using a new genetic resource of the Col-0 × Pat RIL population (Matsusaka et al., 2021). We found SAR1 QTL mapped on chromosome II, being PHYB the strongest candidate gene. Then, we examined the contribution of individual or combined Pat-PHYB polymorphisms on physiological responses mediated by the phyB using Col-0 as the reference genome. We demonstrated that individual polymorphisms on the coding region of PHYB, but not in the promoter, have discrete functions in seed germination, seedling de-etiolation, and shade avoidance.
Materials and methods
Plant material and growth conditions
Arabidopsis plants were grown under long-day conditions (16 h light/8 h dark, PAR = 100 μmol m−2 s−1) with an average temperature of 21 ± 2°C. Seeds of each genotype were harvested as a single bulk consisting of at least 5 plants. Seeds were stored in open tubes inside a closed box that was maintained in darkness with silica gel at 4°C until experiments were performed. We used Columbia-0 (Col-0), Pat, and other accessions sharing the same Pat-PHYB polymorphisms (Supplementary Table S1). Heterogenous inbred families (HIF20 and HIF71) were used to confirm SHADE1 QTL and developed previously (Matsusaka et al., 2021). The seeds used in this work were provided by the Nottingham Arabidopsis Stock Centre (NASC).
Physiological experiments
For the seed germination experiment, samples of 20 seeds per genotype were sown in clear plastic boxes (40–33-mm2 15-mm height), each containing 3 ml of 0.8% (w/v) agar in demineralized water. The seeds were incubated at 7°C in darkness for 3 days. Then, the seeds were treated with 30 min pulse of either FR (42 μmol m−2 s−1) or R (30 μmol m−2 s−1, Supplementary Figure S1). The FR pulse established a photoequilibrium (Pfr/Pr + Pfr) of 0.03 and the R pulse of 0.87 in the seed tissues (Botto et al., 1995, 1996). Then, the seeds were incubated in darkness at 25°C until germination was counted after 4 days. The criterion for germination was the emergence of the radicle, and the average germination of 20 seeds in each box was a replicate. The R/FR response (%) was calculated as the difference between germination in R pulse minus FR pulse.
For the seedling de-etiolation experiment, samples of 15 seeds per genotype were sown in transparent plastic boxes and stratified as indicated above. Then, the seeds were exposed to a 2 h-R pulse and kept in darkness for the promotion of seed germination. After 24 h in darkness, the seedlings were exposed to continuous R (Rc = 30 μmol m−2 s−1, Supplementary Figure S1) or kept in darkness at 22°C. On the fourth day, the hypocotyl length was measured for the 10 tallest seedlings in each box (a replicate). We estimated the hypocotyl length in red continuous relative to darkness to have a real measure of the seedling de-etiolation response for each genotype. For other references see Matsusaka et al. (2021).
For the SAR experiment, samples of 15 seeds per genotype were sown in transparent plastic boxes and stratified as indicated above. Then, the seeds were exposed to a 2 h-R pulse and kept in darkness for the promotion of seed germination. After 24 h of darkness, the seedlings were transferred to continuous white light at 22°C for complete seedling de-etiolation. After 2 days, seedlings were transferred to white light with incandescent lamps (WL) or simulated shade with a photoperiod of 10 h light/14 h darkness for 5 days. In WL, the PAR (Photosynthetic Active Radiation) was 130 μmol m-2 s-1 (R = 13, FR = 12, and B = 9 μmol m−2 s−1, Supplementary Figure S1). The simulated shade was obtained with a green acetate filter (code #089, Lee Filters, http://www.leefilters.com) that established the PAR = 14 μmol m−2 s−1 (R = 0.27, FR = 2.72, and B = 1.20 μmol m−2 s−1, Supplementary Figure S1). The R/FR ratio was 1.1 in WL and 0.10 in the simulated shade condition. On the fifth day, the hypocotyl length was measured for the 10 tallest seedlings in each box (a replicate). We estimated the SAR index as the ratio between the hypocotyl length in simulated shade and WL.
At the end of the de-etiolation and SAR experiments, we photographed the seedlings with a digital camera (PowerShot; Canon, Tokyo, Japan), and the hypocotyl length was determined using the Image J program (Schneider et al., 2012). Light measurements were done with a Spectroradiometer SPECTROSENSE2/2 + Meter (Skye Instruments Ltd., Powys, United Kingdom). In all cases, data were statistically analyzed by ANOVA and paired comparisons by Bonferroni’s test. For the analysis we used the Info Stat Software version 2017 (Grupo Info Stat, FCA, Universidad Nacional de Córdoba, Argentina).
QTL mapping in shade avoidance
For QTL mapping in SAR, the hypocotyl length values of seedlings exposed to WL and simulated shade were used as the average of three replicates for each RIL and 12 replicates for parental lines. Each replicate was the average of the 10 tallest seedlings. To perform QTL mapping, we initially applied Box-Cox of MASS library transformation to turn phenotypic non-normal residuals into a normal distribution with homoscedasticity. With lme4 package, we extracted the fitted values from the best model calculating the best-linear-unbiased estimates (BLUEs) and best-linear-unbiased-predictions (BLUPs). These were used for quantitative-trait-loci (QTL) mapping, conducted with the R/qtl package (Arends et al., 2010). We removed non-informative markers with drop.nullmarkers function, used est.rf function to estimate pairwise recombination fractions between all marker pairs and plot them, and applied calc.genoprob function to calculate conditional genotypes probabilities given the multipoint marker data with possible allowance for genotyping errors. Subsequently, composite-interval-mapping (CIM) with “hk” method was applied to calculate the genetic interval coordinates and the LOD (Logarithm-of-the-Odds score). LOD was considered significant when α < 0.1 after 10,000 permutations performed with n.perm function (Arends et al., 2010). For other references see Matsusaka et al. (2021).
Exploration of candidate genes
We explored candidate genes for those mapped into the QTLs. Having no a priori evidence that variation is based on differential expression or structure, we focused on analyzing each gene’s Pat SNPs, clustering polymorphisms according to SnpEff high functional impact categories such as missense variant, splice donor variant, splice acceptor variant, start lost, stop gained and stop lost codon (Cingolani et al., 2012). We then searched and retrieved light-regulated relevant genes within QTLs from manually-curated-published reports and GO terms analysis using different databases annotated coding features. For additional references see Matsusaka et al. (2021).
Construction and selection of PHYB transgenic plants
The genomic sequence of PHYB locus was extracted from Arabidopsis thaliana chromosome II sequence (Genbank Accession number NC 003071) and the sequence of phyB cDNA was obtained from Genbank Accession number NM_127435.3. The PHYB transgenic lines were generated as previously described Sánchez-Lamas et al. (2016). Briefly, the phytochrome cDNAs were obtained by retrotranscription from Col-0 and Pat RNA and cloned into the pCHF5 plasmid fused to the C-terminus HA tag. Single locus insertion lines from the T3 generation were selected. Two independent transgenic events for each type of polymorphism were generated. For cloning, the complete coding sequence of PHYB was PCR-amplified from retrotranscribed cDNA obtained by retrotranscription of total RNA. Five prime and 3′ primers included BamHI and XbaI sites to clone the fragments in pBluescript vector. Before cloning, relevant restriction sites were eliminated from the coding PHYB region by introducing silent mutations by using PCR with specific primers. We used a similar approach to introduce the Pat polymorphisms in the Col PHYB sequence. Fragments were then assembled by fusion-PCR, and restriction sites were added to both 5′ and 3′ ends with primers bearing BamHI and XbaI sites as described above. Each cDNA was cloned in the pBlueScript plasmid as a BamHI-XbaI fragment, and the sequence was confirmed by Sanger sequencing. Finally, each fragment was subcloned in the CHF5 binary vector as a BamHI-SalI fragment, under the CAMV 35S promoter and with a HA tag fused to the C-terminus. Primers used in this study are listed in Supplementary Table S2.
PHYB gene expression analysis
Samples were harvested in liquid nitrogen 3 h after the beginning of day 4. Total RNA was extracted with the Spectrum Plant Total RNA Kit (Sigma-Aldrich) and subjected to a DNAse treatment with RQ1 RNase-Free DNase (Promega). cDNA derived from this RNA was synthesized using Invitrogen SuperScript III and an oligo-dT primer. The synthesized cDNAs were amplified with FastStart Universal SYBRGreen Master (Roche) using the 7500 Real-Time PCR System (Applied Biosystems, available from Invitrogen). The UBIQUITIN-CONJUGATING ENZYME 10 (UBC10) gene was used as the normalization control.
LUC bioluminescence assay
For the LUC bioluminescence assay, Col-0 and Pat were transformed with the p.PHYBpat::LUC and p.PHYBCol::LUC reporter using the floral dip method. Seedlings were grown directly on half-strength Murashige and Skoog 0.8% agar medium supplemented with 1% sucrose in a 96-well plate. One seed was placed per well and the seedlings were entrained under 16-h light/8-h dark cycles. After 7 days, 40 μl of luciferin (20 mM) was added to each well. The plate was transferred to constant light conditions and dark conditions and placed in a microplate luminometer LB-960 (Berthold Technologies, Bad Wildbad, Germany) to measure the bioluminescence emitted by each seedling every hour. Data analysis was conducted using the Mikrowin 2000 software (version 4.29, Labsis Laborsysteme GmbH, Neunkirchen-Seelscheid, Germany). Period estimates were calculated with Brass 3.0 software and analyzed using FFT-NLLS.
Protein extraction and blots
Arabidopsis seedlings were ground in liquid nitrogen and resuspended in cold extraction buffer (50 mM Tris–HCl pH 7.5, 150 mM NaCl, 0.1% p/v NP40, 10% glycerol) at a ratio of 1 g of tissue per ml of extraction buffer. The extract was centrifuged at 13,000 g for 30 min. When necessary, aliquots were stored at −80°C to quantify proteins by the method of Lowry. When used for gel loading, one volume of 2X SDS sample buffer was added to each extract and boiled for 5 min.
For immunoblot, proteins were run on 8%–10% SDS-PAGE and transferred to a nitrocellulose membrane (Hybond-ECL, Amersham Biosciences, RPN303D). The HA tag was detected with a monoclonal anti-HA peroxidase (Roche 3F10, 2013819) at a dilution of 1:500. The signal was developed with the Millipore chemiluminescent HRP substrate kit.
For dotblots, the indicated extracts and dilutions were spotted onto nitrocellulose membrane (Hybond-ECL, Amersham Biosciences, RPN303D) and developed with the monoclonal anti-HA peroxidase (Roche 3F10, 2013819), as described above. Luminiscence was imaged with an ImageQuant™ LAS 4000 (GE Healthcare).
Results
Col-0 and Pat phenotypes in shade avoidance
We studied the hypocotyl growth of Col-0 and Pat seedlings in the SAR. After de-etiolation, we transferred the transparent boxes with seedlings to WL or simulated shade for additional 5 days. In both light conditions, the hypocotyl length was shorter in Col-0 than Pat being the effects higher in WL (Figure 1A). We calculated the SAR index as the ratio between the hypocotyl length in simulated shade and WL. As expected, the SAR index was higher in Col-0 than in Pat (p < 0.0001; 2.11 ± 0.02 and 1.74 ± 0.06, respectively). These results confirm that Pat seedlings are less responsive to light than Col-0 (Kasulin et al., 2017; Matsusaka et al., 2021).
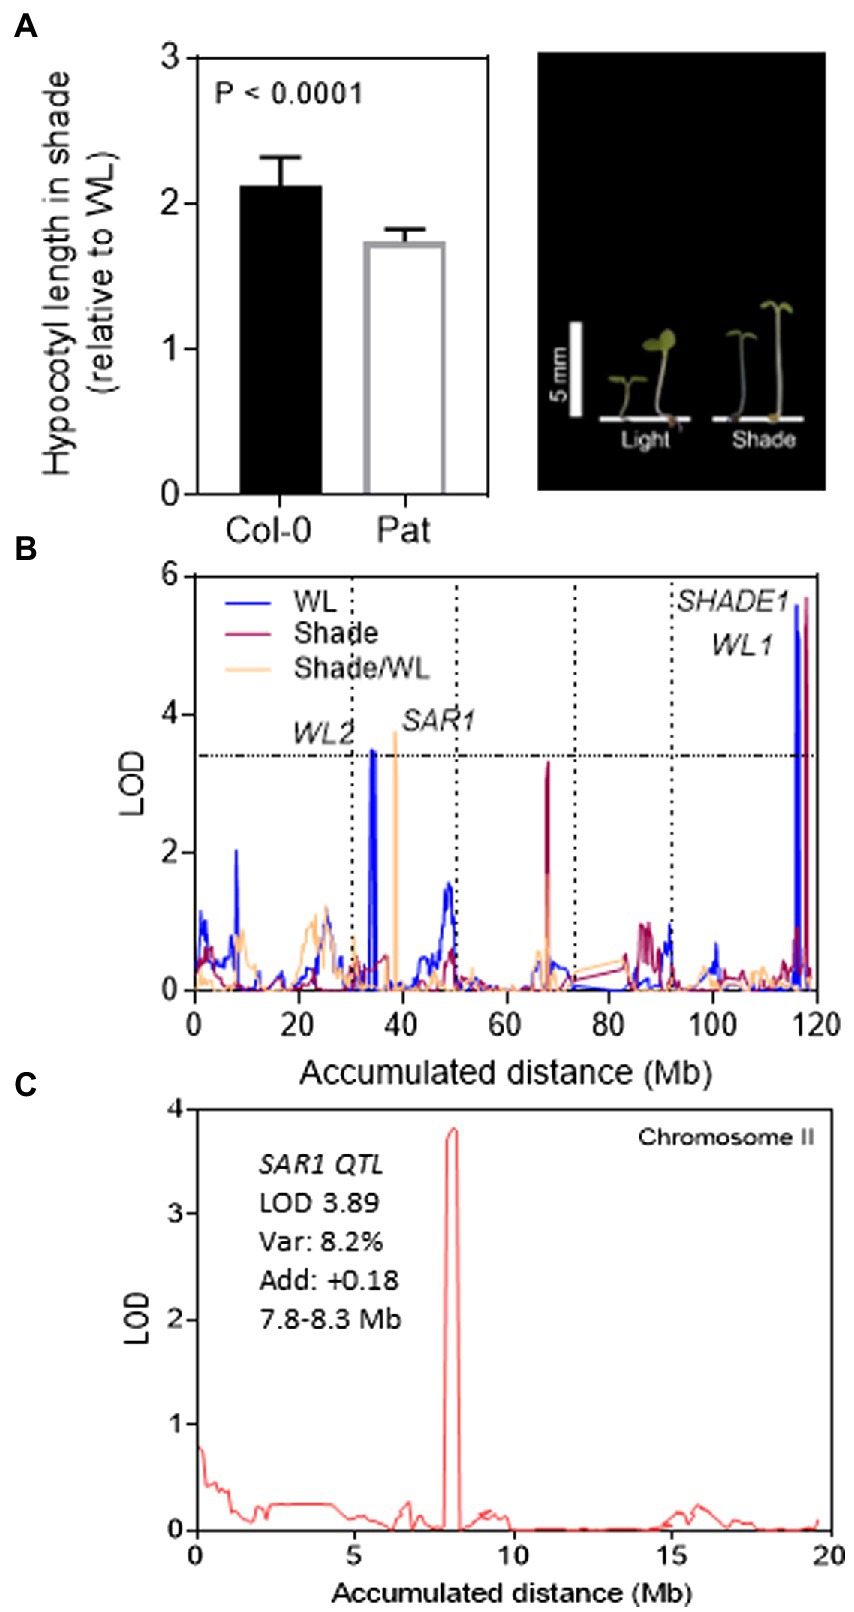
Figure 1. QTL mapping for shade avoidance response in Col-0 and Pat RIL population. (A) SAR index for Col-0 and Pat seedlings calculated as the ratio of hypocotyl length in simulated shade and WL. The photo shows representative Col-0 (left) and Pat (right) seedlings in WL and simulated shade. (B) QTL mapping for hypocotyl growth in WL, simulated shade, and SAR index in the Col-0 and Pat RIL population. LOD score is shown for the accumulated distance of the five chromosomes separated by vertical dashed lines. The horizontal dashed line indicates the LOD significance threshold value. (C) LOD score is shown for the absolute distance of chromosome II (Mb). PHYB is the candidate gene mapped into the confidence interval of SAR1 QTL. For SAR1 QTL, is indicated the LOD, % explained variability, additive effects (positive additive effects mean a higher contribution of Col-0 alleles) and confidence interval.
QTL mapping for shade avoidance
Regarding the shade avoidance contrasting phenotypes between Col-0 and Pat, we mapped QTLs for hypocotyl length in WL, simulated shade, and SAR index in a new re-sequenced RIL population of Col-0 × Pat (Matsusaka et al., 2021). A wide phenotypic transgression was found for the three traits in the RIL population being wider in WL than simulated shade and SAR index (Supplementary Figure S2). The broad-sense heritability ranged between 0.50 and 0.83 confirming that enough genetic variation can be explored by QTL mapping (Supplementary Table S3). We mapped 2 QTLs in WL (WL1 and WL2), one QTL in the simulated shade (SHADE1), and another QTL for SAR index (SAR1; Figure 1B; Table 1). WL1 and SHADE1 QTL mapped close together on the lower arm of chromosome V, and WL2 and SAR1 QTL mapped on chromosome II. The phenotypic variation explained for each QTL ranged between 15 and 7% (Table 1). SHADE1 QTL (LOD = 6.3, Var = 14.6%) was also mapped for hypocotyl length in seedling de-etiolation in darkness, blue and FR continuous light (Matsusaka et al., 2021).
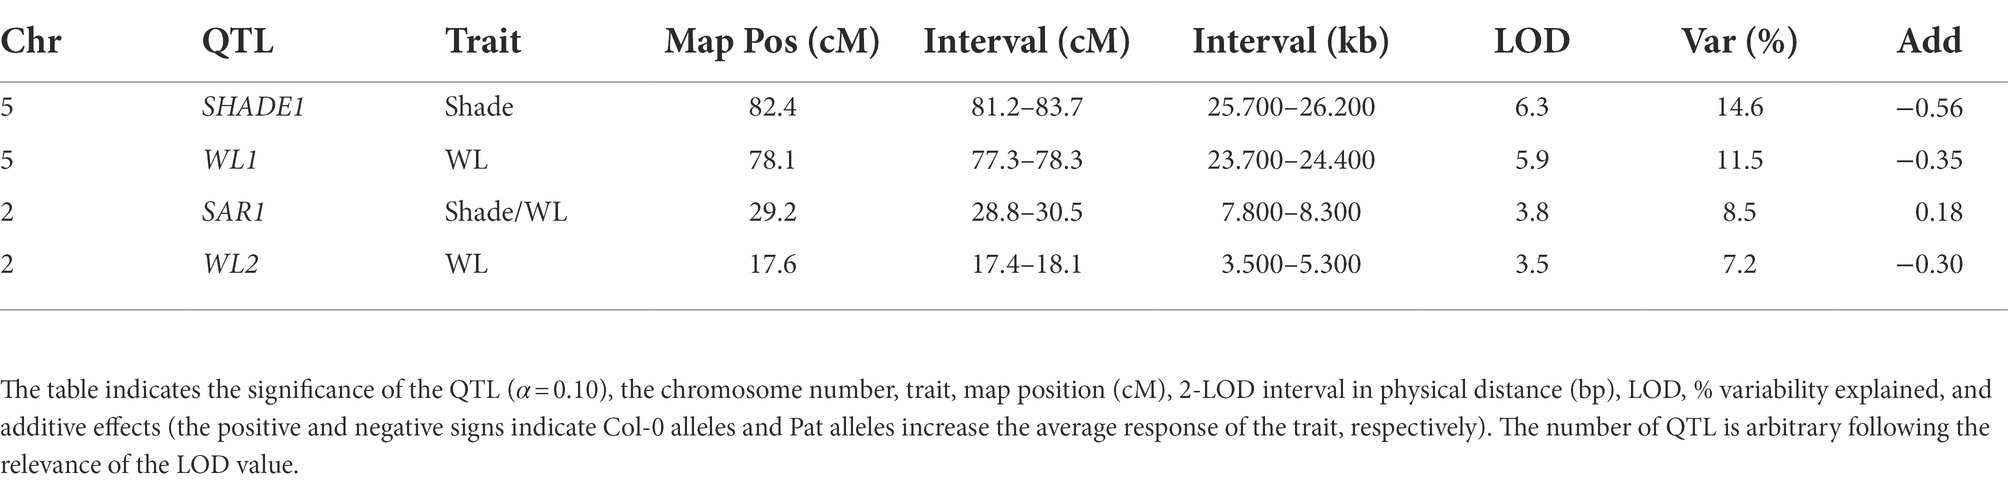
Table 1. QTL mapping for WL, simulated shade, and SAR index calculated as the ratio of hypocotyl length in simulated shade and WL in the Col-0 and Pat RIL population.
Exploration of candidate genes for shade avoidance
The re-sequencing of the new RIL population enabled the unambiguous physical anchoring of ultra-high-density molecular markers, resulting in shorter genetically associated intervals bearing in principle a reduced set of potentially causative genes. For each QTL, we found between 132 and 399 annotated Col-0 genes (Supplementary Table S4). Subsequently, variant-call scrutiny of deep sequenced Pat genome compared to Col-0 allowed the recognition of potentially functional significant Pat alleles. We documented 323 transcripts (260 annotated coding features), in the four QTLs, presented high impactful Pat SNPs such as missense, nonsense, splice donor or splice acceptor variants, and start and stop lost codons (Supplementary Table S5). We searched and retrieved light-regulated relevant genes within QTLs from manually curated published reports and GO terms analysis. Cross-examination of this information finally revealed three annotated coding features in SAR1 QTL and one gene in SHADE1 QTL (Supplementary Table S6) exhibited documented roles in light responses and at the same time impactful Pat alleles.
We confirmed the additive effects of SHADE1 QTL by two independent HIFs (Heterogeneous inbred families, HIF20 and HIF71, Supplementary Figure S3). According to the QTL mapping output, the Pat alleles increased the hypocotyl length in HIF20 and HIF71 seedlings cultivated under simulated shade. PHYB maps within the confidence interval of SAR1 QTL (LOD = 3.9, Var = 8.2%) and, as expected, the Col-0 alleles increase the SAR (Figure 1C; Table 1). Interestingly, SAR1 QTL mapped close to RED/DARK QTL found previously for seedling de-etiolation in red light (Matsusaka et al., 2021). Using the ultra-high-density SNPs markers in this region, we found that SAR1 QTL did not colocalize with RED/DARK QTL for seedling de-etiolation in the R/dark trait (Supplementary Figure S4).
Natural variation for PHYB polymorphisms between Col-0 and Pat
We hypothesized that PHYB is the strongest gene candidate for SAR1 QTL because (i) PHYB gene mapped into the confidence interval of SAR1 QTL interval containing 132 genes (Supplementary Table S4), (ii) PHYB gene has been documented to have a prominent function in SAR, and (iii) Pat seedlings show reduced response to light and partially resemble the phyB-mutant phenotype for hypocotyl length in WL. Firstly, we found SNPs in the Pat-PHYB into the promoter (−2,000 bp) and encoded gene comparing with Col-0 reference genome using the DNAseq of five Pat previously published genomes (one ancestral and 4 different lines collected in Patagonia, for other references see Kasulin et al., 2017). In this analysis, we found 6 variants in the promoter, 2 variants in the 5’UTR, 4 synonymous, and 3 non-synonymous polymorphisms in the cDNA including 3 variants in the introns of the Pat-PHYB (Supplementary Table S7). Then, we sequenced the promoter and the coding region of PHYB-Pat by sanger and confirmed the three non-synonymous polymorphisms in the coding region (M2, M3, and M4, Figure 2A). In addition, we identified a GGGR deletion between 13–16 amino-acid positions on the amino terminus (M1, Figures 2A,B); and a two-base insertion and eight- base deletion on the promoter of the Pat-PHYB (−318/−319 and −334/−341, respectively; Figure 2C). These three indels were validated by Sanger sequencing using specific primers and confirmed with available Pat DNAseq data (Kasulin et al., 2017).
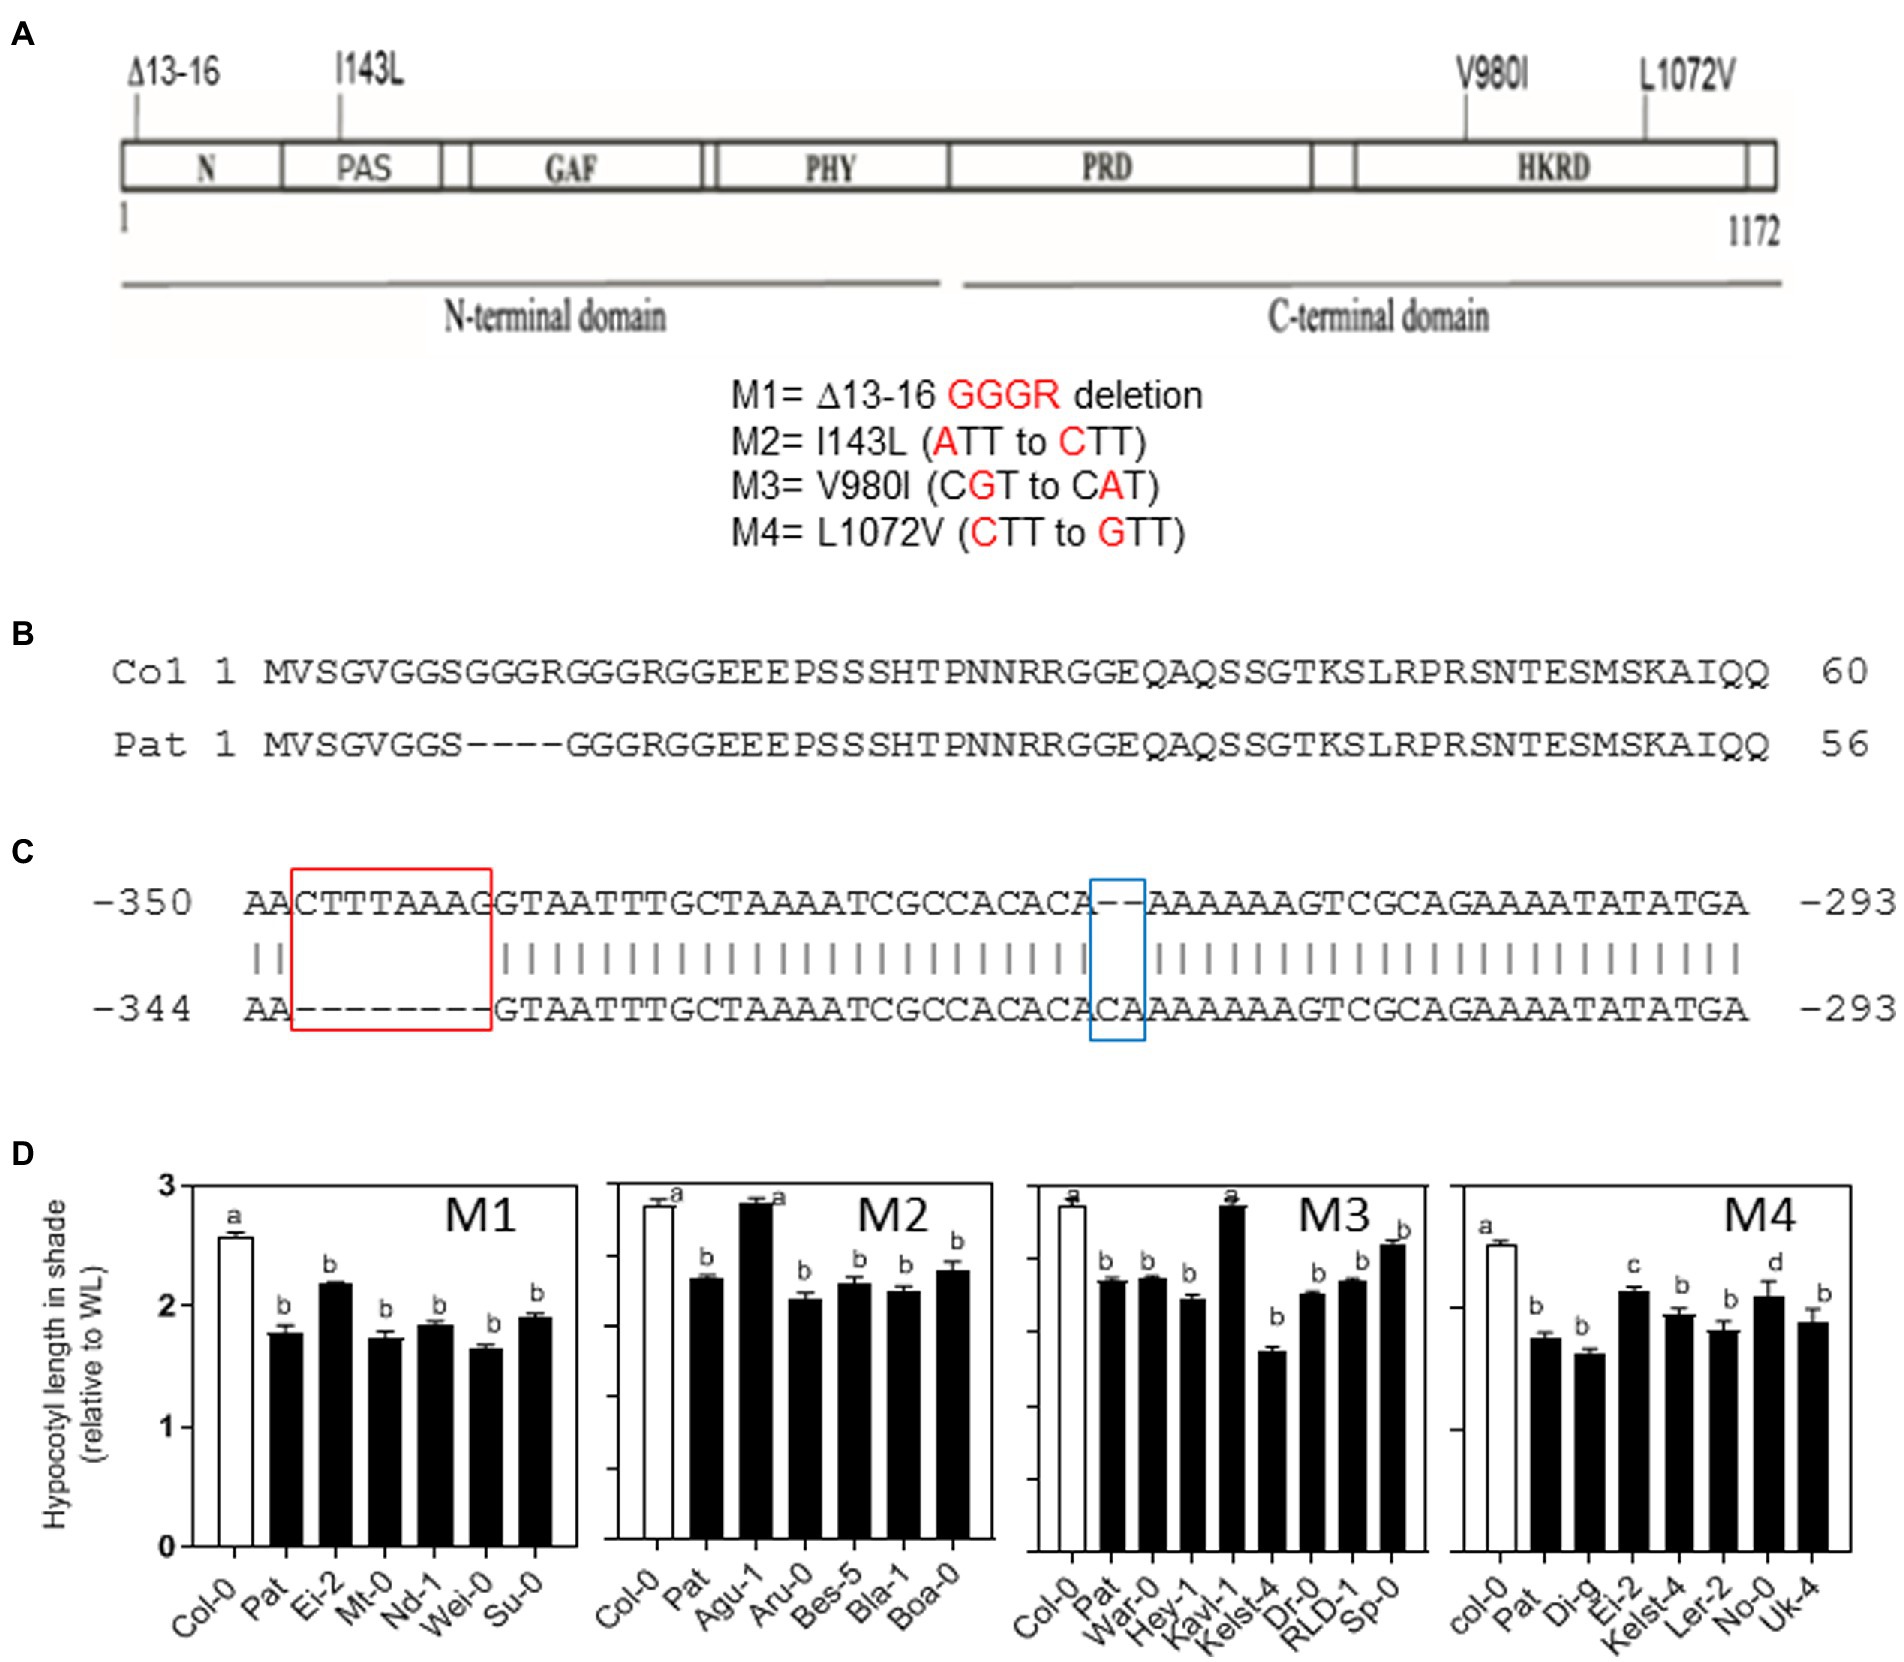
Figure 2. PHYB polymorphisms between Col-0 and Pat accessions. (A) PHYB polymorphisms in the coding region between Col-0 and Pat. The diagram shows the four polymorphisms in the N-and C-termini domains (M1 = deletion, M2 = I143L, M3 = V980I, and M4 = L1072V). (B) Col-0 and Pat amino-acid sequences show the GGGR deletion of Pat in the amino termini of PHYB protein. (C) The two indels polymorphisms in the promoter of PHYB gene between Col-0 and Pat tested in this study. The deletion of 8 nucleotides at position −341/−334, and the insertion of 2 nucleotides at position −318/−319 in the Pat promoter up to ATG starting codon. (D) Natural variation for hypocotyl SAR index calculated as the ratio of hypocotyl length in simulated shade and WL between accessions sharing the same PHYB-Pat polymorphism at the positions M1, M2, M3, and M4. Significant differences between means are shown with different letters by one-way ANOVA followed by Bonferroni post-test (p < 0.05). Each bar represents mean ± SE (n = 6).
We hypothesized that the four Pat-PHYB polymorphisms in the coding region can be conserved in other Arabidopsis accessions if they are functional in SAR. We studied the SAR for hypocotyl length in 22 accessions that share the same Pat-PHYB polymorphisms at the GGGR deletion between 13 and 16 amino-acids, and the three non-synonym substitutions at I143L, V980I, and L1072V positions. We selected between 5 and 7 accessions sharing a unique and common polymorphism with Pat in each of the four positions: the deletion and the I143L substitution were mapped on the N-terminal PSM, and the V980I and L1072V substitutions were mapped on the HKRD domain of the C-terminal CTM (Figures 2A,B). Globally, the seedlings from different accessions sharing the Pat polymorphisms on the PHYB coding region showed a reduced SAR as Pat (Figure 2D). This is true for all the accessions with the GGGR deletion and L1072V (M1 and M4, respectively), and almost all accessions with I143L and V980I polymorphisms, respectively (except for Agu-1 for M2, and Kavl-1 for M3, Figure 2D). These results suggest that the four PHYB-Pat polymorphisms contribute independently to the SAR of hypocotyl length in different genetic backgrounds.
Discrete functions of PHYB polymorphisms in shade avoidance
We reasoned that those non-synonymous polymorphisms in the PHYB coding region can contribute discretely to SAR. To assess this, we complemented the phyB-9 null mutant in the Col-0 background with the 35S promoter transgenes expressing single or combined Pat-PHYB polymorphisms into the Col-PHYB cDNA fused to the Hemagglutinin tag (HA), as previously described in Sánchez-Lamas et al. (2016). As the control, we used the transgenic lines with Col-PHYB cDNA fused to the HA tag. We generated 12 transgenic lines, four of them individually expressing the previously mentioned Pat-PHYB polymorphisms (M1, M2, M3, and M4), and two additional lines expressing the combination of the two polymorphisms in the N-termini PSM (M1 + M2) and C-termini CTM (M3 + M4) to evaluate the functional relevance of both modules. At least two independent transgenic events were done for each mutation (M1, M2, M3, and M4) or combination (M1 + M2 and M3 + M4). We validated the quality of the generated material by measuring the mRNA levels of the transgenes (Supplementary Figure S5), and the protein levels in transgenic lines using a monoclonal anti-HA coupled to peroxidase (Roche 3F10; 2013819; Supplementary Figure S6).
We evaluated the contribution of Pat-PHYB polymorphisms in the SAR. After de-etiolation, seedlings were exposed to WL or simulated shade for 5 days. We measured the hypocotyl length in WL, and simulated shade to estimate the SAR index as the ratio between simulated shade and WL. The SAR index for Col-0 was 2.3 and for phyB-9 was 1.3 (Figure 3A). As expected, Pat seedlings showed a reduced SAR of 1.7 (Figure 3A). Transgenic seedlings with the full version of Col-PHYB in the phyB-9 background rescued the Col-type phenotype (Figure 3A). Transgenic lines with the Pat polymorphisms on the N-termini domain (M1 = GGGR deletion) and the two polymorphisms on the C-termini domain (M3 = V980I and M4 = L1072V) showed a reduced SAR like Pat seedlings (Figure 3A). In opposition, transgenic seedlings with the M2 = I143L polymorphism showed a stronger SAR than the control (Figure 3A). The combination of Pat polymorphisms in the PSM rescued the phenotype of the control line suggesting that M1 and M2 operate in opposite manner (Figure 3A), and this is evident in WL condition (Supplementary Figure S7). We conclude that the I143L non-synonymous polymorphism promotes and the other Pat-PHYB polymorphisms reduce the SAR.
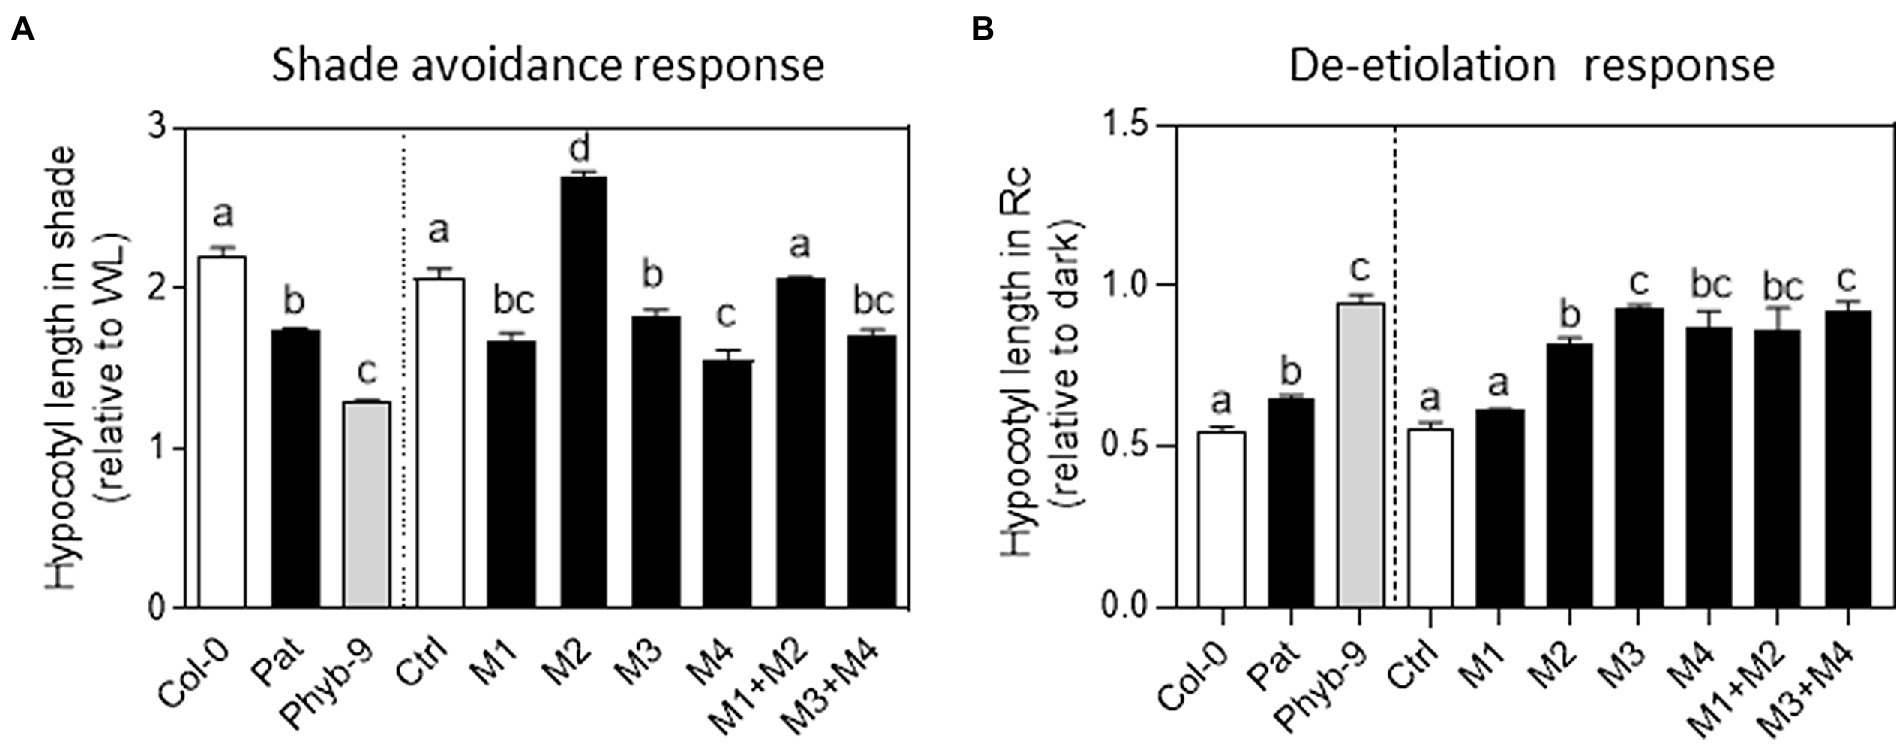
Figure 3. Functional variation of PHYB polymorphisms in shade avoidance response (SAR) and seedling de-etiolation response. (A) SAR index calculated as the ratio of hypocotyl length in simulated shade and WL. Each bar represents Mean ± SE (n = 4). Significant differences between means are shown with different letters by one-way ANOVA followed by Bonferroni post-test (p < 0.05). (B) Inhibition of hypocotyl length in red continuous light (relative to darkness) during seedling de-etiolation. Each bar represents Mean ± SE (n = 4). Significant differences between means are shown with different letters by one-way ANOVA followed by Bonferroni post-test (p < 0.05).
Discrete functions of PHYB polymorphisms for seedling de-etiolation
We studied the role of PHYB polymorphisms in seedling de-etiolation regarding its known function in the inhibition of hypocotyl growth in R light (Casal et al., 1998). In continuous red light, the hypocotyl inhibition was around 50% in Col-0 and completely impaired in phyB-9 seedlings (Figure 3B). Pat seedlings showed an intermediate light hyposensitive response being the hypocotyl inhibition around 65% under continuous red light. The transgenic seedlings with the Col-PHYB in the phyB-9 background showed a similar response to Col-0 (Figure 3B). Seedlings with non-synonymous Pat-PHYB polymorphisms showed an impaired response like phyB-9 seedlings except for the GGGR deletion polymorphism (i.e., M1, Figure 3B). In fact, continuous red light was most effective to inhibit hypocotyl length in M1 than those transgenic lines with other PHYB polymorphisms (Supplementary Figure S8). These results confirm that the three non-synonymous PHYB-Pat polymorphisms are responsible for the low red sensitivity response in seedling de-etiolation.
Discrete functions of PHYB polymorphisms for seed germination
The phyB is the principal photoreceptor mediating seed germination promoted by red light (Shinomura et al., 1994; Botto et al., 1995; Lee et al., 2012; Arana et al., 2014; Tognacca et al., 2019). We studied the contribution of the Pat-PHYB polymorphisms in the R/FR reversible response of seed germination (Figure 4). We evaluated the germination with a saturated far-red pulse (FRp) or red pulse (Rp) after incubation with chilling at 7°C for 3 days. Col-0 seeds showed an R/FR reversible response of 40%, while Pat seeds germinated independently of the light pulse suggesting that the light-dependent dormancy is completely lost (Figure 4). As expected, seeds of phyb-9 null mutant did not germinate with an Rp or FRp (Figure 4A). The low seed germination induced by light is a common feature for all transgenic lines and this is evident when seeds were exposed to a FR pulse suggesting that they are more dormant than Col-0 and Pat seeds (Figure 4A; Supplementary Figure S9). Control transgenic seeds that expressed the complete version of the Col-PHYB showed 60% for the R/FR reversible response like Col-0 seeds (Figure 4B). Except for M2 and M1 + M2 transgenic lines, the rest of the mutations showed a reduced R/FR reversible response compared with the control (Figure 4B). M1 + M2 seeds rescued the germination phenotype of the WT control showing that both polymorphisms operate antagonistically as it was documented previously for the SAR (Figure 3A). We conclude that the GGGR deletion and I143L polymorphisms contribute oppositely to the R/FR reversible of seed germination, while V980I and L1072V polymorphisms on the C-termini are responsible for the reduced light sensitivity in seed germination mediated by the phyB.
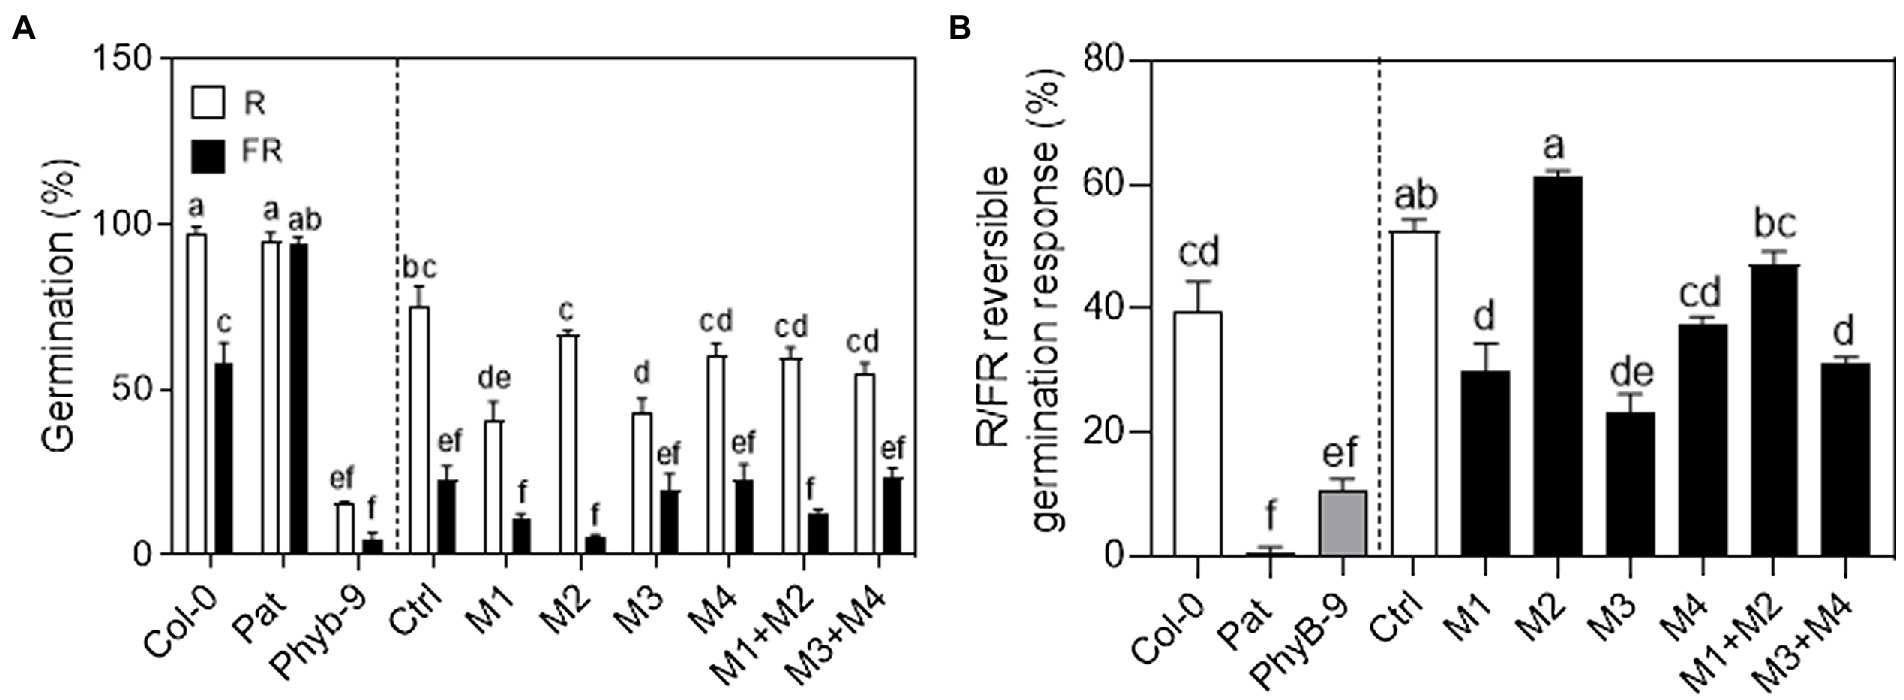
Figure 4. Functional variation of PHYB polymorphisms in seed germination. (A) Germination (%) with an R or FR saturated pulse and then incubated in darkness for 4 days at 25°C before germination was counted. The seeds were imbibed in water for 3 days at 7°C before the light pulse. (B) R/FR reversible response (%) calculated as the germination with a red pulse minus the germination with a far-red pulse. Mean ± SE (n = 6). Significant differences between means are shown with different letters by Two-way ANOVA (A) or One-way ANOVA (B) followed by Bonferroni post-test (p < 0.05).
PHYB polymorphisms on the promoter are not responsible for light hyposensitivity
We studied the function of the two indels Pat-PHYB polymorphisms on the promoter (i.e., the two-base insertion and the eight-base deletion at −318/−319 and −334/−341, respectively; Figure 2C). Two previous reports suggested that the phyB forms a regulatory loop within the circadian clock, besides setting the clock by transducing the light signal to the central oscillator. In fact, It has been demonstrated that PHYB::LUC reporter lines showed strong circadian oscillations under free running conditions under the control of the circadian clock (Bognár et al., 1999; Tóth et al., 2001). Regarding these previous results, we generated transgenic plants with the Pat and Col-0 promoters fused to the firefly Luciferase (LUC) in both genetic backgrounds to evaluate the function of the two polymorphisms of PHYB in the control of the circadian oscillations of the clock. We studied the circadian expression of the LUC reporter in continuous light and darkness for 4 days (Figure 5). Both promoter constructs behaved similarly in different genetic backgrounds. Together with previous reports In the expression of PHYB mRNA in Col-0 and Pat backgrounds (Kasulin et al., 2017), these results suggest that the polymorphisms on the promoter of PHYB between Col-0 and Pat are not responsible for the reduced light responses in the Pat accession.
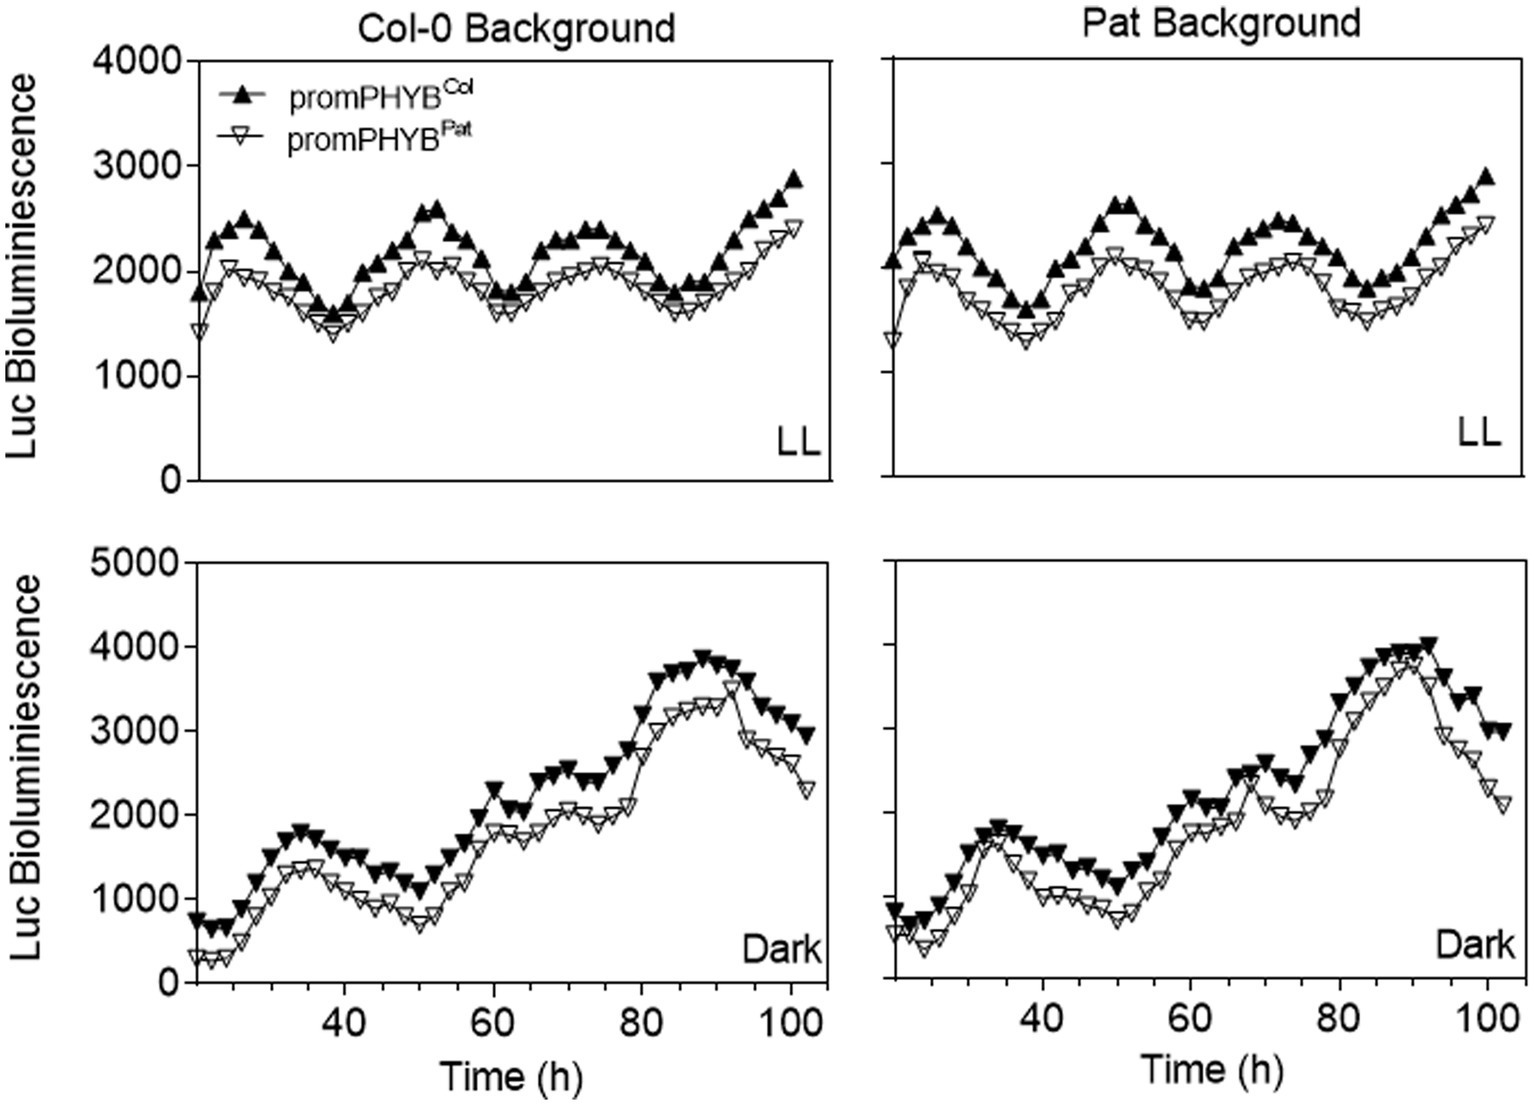
Figure 5. Functional analysis of PHYB polymorphisms on the promoter region by LUC analysis. Luc bioluminescence (units) for transgenic plants carrying the promotor of PHYB-Col or PHYB-Pat in the Col and Pat backgrounds. LL continuous light treatment. Each point represents the media of n ≥ 4.
Discussion
Pat accession shows a reduced response to light (Kasulin et al., 2017; Matsusaka et al., 2021). The genetic architecture of the SAR was explored by QTL mapping in a new 162 RIL population between Col-0 and Pat (Figure 1). PHYB (At2g18790, 8,139–8,144 kb) is the gene candidate for SAR1 QTL (LOD = 3.9, Var = 8.2%) because (i) PHYB gene falls into the 7,800–8,300 kb confidence interval of SAR1 QTL, (ii) PHYB-Col-0 alleles at SAR1 QTL contributes positively to the SAR, and (iii) the Pat phenotype is hyposensitive to light resembling the phyB mutant phenotype in WL (Figure 1; Table 1). SAR1 QTL was mapped in the middle of chromosome II and colocalizes with other QTL for light traits mapped in different RIL populations. Kasulin et al. (2013) suggest that the PHYB gene is responsible for the FR-EOD shade response in Ler × Cvi, but not in Ler × Col and Bay × Sha RIL populations. These results reflect the relevance of the genetic background and the environmental context for the expression of the QTL. More recently, a study with a NAM population of Arabidopsis plants highlights the importance of an integrated view of the genotype–phenotype relationship accounting for genetics and environment together with phenotype relationships among shade avoidance traits throughout time (Ta et al., 2020).
PHYB was also mapped for seedling de-etiolation into the interval of a QTL mapped in WL and red continuous (Rc) light in the Ler × Cvi RIL population (Borevitz et al., 2002). Furthermore, a contrasting response for seedling de-etiolation in Rc light was documented in transgenic lines with Ler-PHYB and Cvi-PHYB alleles (Filiault et al., 2008). Interestingly, SAR1 QTL mapped close to Rc2 QTL for seedling de-etiolation in Rc light in the novel Col-0 × Pat RIL population used in this study (Matsusaka et al., 2021), but recombination points in RIL lines allowed the dissection of two independent QTLs (Supplementary Figure S3). Previously, PHYB was also mapped close, but outside, of the RED2 QTL interval for seedling de-etiolation in Rc light in the Col-gl1 × Kas1 RIL population (Wolyn et al., 2004). Overall, these results suggest that the SAR and the seedling de-etiolation are developmental processes mediated by the phyB and by other genetic regulators which map remarkably close to PHYB depending on the genetic backgrounds.
PHYB apoprotein variants are responsible for phenotypic differences between Pat and Col-0 accessions. Here, we evaluated individual and combined contributions of PHYB polymorphisms that mapped into the same functional module (PSM and CTM). Globally, our results suggest that (i) Pat-PHYB polymorphisms have discrete functions in seed germination, seedling de-etiolation, and shade avoidance response; (ii) PHYB-Pat polymorphisms on both PSM and CTM contribute to the hyposensitive light response; and (iii) the Pat polymorphisms have positive, neutral or negative effects depending on the phyB-mediated response. Pat polymorphisms on the CTM (i.e., V980I and L1072V) always reduce the light response independently of the physiological response (Figures 3, 4). However, Pat polymorphisms on the PSM can show opposite effects according with the physiological response. For example, the GGGR deletion at the N-termini extension in Pat-PHYB reduces the light response in germination and shade, while the I143L promotes the shade avoidance response (Figures 3A, 4). The present study corroborates the results of Nicholson et al. (2011) indicating that a GGGR deletion at 9–12 position in the N-termini extension of Col-0 reduces the activity of the phyB in WL and R light. Interestingly, it has been demonstrated the pivotal role of the 1–90 amino-acid N-termini extension of serine-rich region, proximal to the PAS-GAF interface, for the phyB Pfr stability impeding the binding to PIF3 (Rockwell and Lagarias, 2006; Oka et al., 2008).
The function of the PAS domain in the photosensory module where locates the I143L polymorphism is currently unclear. It has been suggested that the PAS and GAF tight connection via the knots provides a backstop to direct motion from the GAF domain towards the PHY domain (Burgie et al., 2014). Interestingly, the I143L polymorphism has contrasting effects in the control of hypocotyl growth in seedling de-etiolation and SAR (Figure 3) being this polymorphism crucial for the phytochrome interactions with downstream signaling proteins instead of altered photobiological phytochrome properties.
The CTM is involved in dimerization, nuclear import, and localization into subnuclear photobodies structures, and also engages in light-regulated interactions and posttranscriptional modifications with SUMOylation limiting the ability of active phyB to interact with downstream signaling targets (Legris et al., 2019). The two Pat-PHYB polymorphisms belonging to the CTM module located in the plant-specific HKRD domain contribute to reducing the response to light. Pat polymorphisms at V980I and L1072V affect seedling de-etiolation and SAR in an epistatic manner suggesting that the same protein interactions can be altered (Figure 3).
This work demonstrates that the PHYB-Pat polymorphisms generate functional variants that account for the light sensitivity responses correlated with the phenotypes observed in the colonization areas of Pat in Patagonia (Kasulin et al., 2017), and suggests a versatile function of the individual PHYB polymorphisms for the adjustment of plant development to variable light conditions. We conclude that the study of polymorphisms of relevant genes in plant signaling and development might contribute to understanding the natural genetic basis of plant’s adaptation to their environment.
Data availability statement
The datasets presented in this study can be found in online repositories. The names of the repository/repositories and accession number(s) can be found at: NCBI GenBank – NC 003071, NM_127435.3.
Author contributions
JB conceived the project and designed the experiments. MR-D and DM performed the experiments with the assistance of JC and MS-L for gene constructions. DM and DS performed QTL mapping. PC contributed with reagents and materials. MR-D, PC, and JB analyzed the data. JB wrote the manuscript with the contribution of all the authors. All authors contributed to the article and approved the submitted version.
Funding
This wok was supported by grants from the University of Buenos Aires to JB (UBACYT 20020170100265BA and SPU VT38-UBA9537) and the Agencia Nacional de Promoción Científica y Tecnológica of Argentina (PICT2017-0583 and PICT2019-2807).
Acknowledgments
We thank Justin Borevitz, Daniele Filiault and Beth Rowan for preliminary discussions of this project. We also thank Marcos Castellanos from the Nottingham Arabidopsis Stock Centre (NASC) for the provision of seeds.
Conflict of interest
The authors declare that the research was conducted in the absence of any commercial or financial relationships that could be construed as a potential conflict of interest.
Publisher’s note
All claims expressed in this article are solely those of the authors and do not necessarily represent those of their affiliated organizations, or those of the publisher, the editors and the reviewers. Any product that may be evaluated in this article, or claim that may be made by its manufacturer, is not guaranteed or endorsed by the publisher.
Supplementary material
The Supplementary material for this article can be found online at: https://www.frontiersin.org/articles/10.3389/fpls.2022.952214/full#supplementary-material
SUPPLEMENTARY FIGURE S1 | Light spectrums used in the work. (A) white light, (B) shade light, (C) red light and (D) far-red light.
SUPPLEMENTARY FIGURE S2 | Frequency distribution for WL, simulated shade, and SAR index was calculated as the ratio of hypocotyl length in the simulated shade and WL in the Col-0 and Pat RIL population. The average response in each light condition of parental lines is indicated with arrows (red= Col-0 and blue= Pat).
SUPPLEMENTARY FIGURE S3 | Confirmation of SHADE1 QTL in the simulated shade by two independent HIFs. The markers used for the selection of HIF20 and HIF71 include the interval between 25.089 kb and 26.796 kb into the chromosome V. For more information about the construction of both HIFs see Matsusaka et al., 2021.
SUPPLEMENTARY FIGURE S4 | QTL mapping for Rc/dark (data from Matsusaka et al., 2021) and SAR index (data from this study) in the or Col-0 × Pat RIL population. LOD values for each trait corresponding to chromosome II. Note that the confidence interval of Rc/Dark QTL falls outside of the SAR1 QTL where maps PHYB gene. LOD score is shown for the absolute distance of chromosome II (Mb).
SUPPLEMENTARY FIGURE S5 | qPCR PHYB gene expression in Col-0, Pat and transgenics plants. The PHYB expression was estimated in at least two independent lines generated for each mutation. Ctrl = PHYB-Col-0 into phyb-9 null background, M1= GGGR deletion, M2= I143L, M3= V980I, and M4= L1072V, M5= M1+M2 and M6= M3+M4 correspond to transgenic lines with single or combined PHYB-Pat polymorphisms.
SUPPLEMENTARY FIGURE S6 | Dot-Blot for the quantification of PHYB protein of independent transgenic lines for each polymorphism. (A) Western blot for each representative polymorphism of PHYB. The blot shows the PHYB intensity band for each genotype, ctrl+: PHYB-Col-0 in phyB-9, ctrol-: the empty vector in phyB-9. (B) Calibration curve between signal intensity and HA concentration. The Ag sensor was loaded at concentrations ranging from 160 ng/ml to 20 μg/ml. Samples were loaded at different dilutions as indicated on a representative blot for duplicate. The adjust of the regression of the averaged signal with the calibration sensor was estimated R2 = 0.9508. (C) The HA concentration for PHYB quantification in each transgenic line is calculated with the parameters obtained in (B). (D) Dot blot of independent transgenic lines for each polymorphism at different dilutions.
SUPPLEMENTARY FIGURE S7 | Functional variation of PHYB polymorphisms in shade avoidance response (SAR). Hypocotyl length in white light and shade light (A) or the SAR index (B) calculated as the ratio of hypocotyl length in simulated shade and WL for each PHYB polymorphism in independent transgenic lines. Mean ± SE (n=2).
SUPPLEMENTARY FIGURE S8 | Functional variation of PHYB polymorphisms in seedling de-etiolation response. Hypocotyl length in darkness and red continuous light (A) or the de-etiolation inhibition response (B) calculated as the ratio of hypocotyl length in red continuous and darkness for each PHYB polymorphism in independent transgenic lines. Mean ± SE (n=2).
SUPPLEMENTARY FIGURE S9 | Functional variation of PHYB polymorphisms in seed germination induced by a red or far-red pulse for each PHYB polymorphism in independent transgenic lines. Mean ± SE (n = 3).
SUPPLEMENTARY TABLE S7 | SNPs into the PHYB gene detected in the five samples of RNAseq of Patagonia (for more references see Kasulin et al., 2017). The table shows the SNPs in the promoter (−2,000b), 5′UTR, exons, and introns of the PHYB. The three non-synonymous polymorphisms detected in the cDNA of the PHYB correspond to M2 (I143L), M3 (V980I), and M4 (L1072V).
References
Alonso-Blanco, C., Aarts, M., Bentsink, L., Keurentjes, J., Reymond, M., Vreugdenhil, D., et al. (2009). What has natural variation taught us about plant development, physiology, and adaptation? Plant Cell 21, 1877–1896. doi: 10.1105/tpc.109.068114
Al-Shehbaz, I. A., and O'Kane, S. L. (2002). Taxonomy and phylogeny of Arabidopsis (Brassicaceae). Arabidopsis Book 1:e0001. doi: 10.1199/tab.0001
Arana, M. V., Sánchez-Lamas, M., Strasser, B., Ibarra, S. E., Cerdán, P. D., Botto, J. F., et al. (2014). Functional diversity of phytochrome family in the control of light and gibberellin-mediated germination in Arabidopsis. Plant Cell Environ. 37, 2014–2023. doi: 10.1111/pce.12286
Arends, D., Prins, P., Jansen, R. C., and Broman, K. W. (2010). R/QTL: high-throughput multiple QTL mapping. Bioinformatics (Oxford, England) 26, 2990–2992. doi: 10.1093/bioinformatics/btq565
Bae, G., and Choi, G. (2008). Decoding of light signals by plant phytochromes and their interacting proteins. Annu. Rev. Plant Biol. 59, 281–311. doi: 10.1146/annurev.arplant.59.032607.092859
Ballaré, C. L., and Pierik, R. (2017). The shade-avoidance syndrome: multiple signals and ecological consequences. Plant Cell Environ. 40, 2530–2543. doi: 10.1111/pce.12914
Bognár, L. K., Hall, A., Adám, E., Thain, S. C., Nagy, F., and Millar, A. J. (1999). The circadian clock controls the expression pattern of the circadian input photoreceptor, phytochrome B. Proc. Natl. Acad. Sci. U. S. A. 96, 14652–14657. doi: 10.1073/pnas.96.25.14652
Borevitz, J. O., Maloof, J. N., Lutes, J., Dabi, T., Redfern, J. L., Trainer, G. T., et al. (2002). Quantitative trait loci controlling light and hormone response in two accessions of Arabidopsis thaliana. Genetics 160, 683–696. doi: 10.1093/genetics/160.2.683
Botto, J. F. (2015). Plasticity to simulated shade is associated with altitude in structured populations of Arabidopsis thaliana. Plant Cell Environ 38, 1321–1332. doi: 10.1111/pce.12481
Botto, J. F., and Coluccio, M. P. (2007). Seasonal and plant-density dependency for quantitative trait loci affecting flowering time in multiple populations of Arabidopsis thaliana. Plant Cell Environ. 30, 1465–1479. doi: 10.1111/j.1365-3040.2007.01722.x
Botto, J., Sánchez, R. A., and Casal, J. (1995). Role of phytochrome B in the induction of seed germination by light in Arabidopsis thaliana. J. Plant Physiol. l46, 307–312.
Botto, J. F., Sánchez, R. A., Whitelam, G. C., and Casal, J. J. (1996). Phytochrome A mediates the promotion of seed germination by very low fluences of light and canopy shade light in Arabidopsis. Plant Physiol. 110, 439–444. doi: 10.1104/pp.110.2.439
Botto, J. F., and Smith, H. (2002). Differential genetic variation in adaptive strategies to a common environmental signal in Arabidopsis accessions: phytochrome-mediated shade avoidance. Plant Cell Environ. 25, 53–63. doi: 10.1046/j.0016-8025.2001.00812.x
Burgie, E. S., Bussell, A. N., Walker, J. M., Dubiel, K., and Vierstra, R. D. (2014). Crystal structure of the photosensing module from a red/far-red light-absorbing plant phytochrome. Proc. Natl. Acad. Sci. 111, 10179–10184. doi: 10.1073/pnas.1403096111
Casal, J. J. (2013). Photoreceptor signaling networks in plant responses to shade. Annu. Rev. Plant Biol, 64, 403–427. doi: 10.1146/annurev-arplant-050312-120221
Casal, J. J., Sanchez, R. A., and Botto, J. F. (1998). Modes of responses. J. Exp. Bot. 49, 127–138. doi: 10.1093/jxb/49.319.127
Chen, M., Chory, J., and Fankhauser, C. (2004). Light signal transduction in higher plants. Annu. Rev. Genet. 38, 87–117. doi: 10.1146/annurev.genet.38.072902.092259
Cingolani, P., Platts, A., Wang, L. L., Coon, M., Nguyen, T., Wang, L., et al. (2012). A program for annotating and predicting the effects of single nucleotide polymorphisms. SnpEff. Fly 6, 80–92. doi: 10.4161/fly.19695
Coluccio, M. P., Sanchez, S. E., Kasulin, L., Yanovsky, M. J., and Botto, J. F. (2011). Genetic mapping of natural variation in a shade avoidance response: ELF3 is the candidate gene for a QTL in hypocotyl growth regulation. J. Exp. Bot. 62, 167–176. doi: 10.1093/jxb/erq253
Durvasula, A., Fulgione, A., Gutaker, R. M., Alacakaptan, S. I., Flood, P. J., Neto, C., et al. (2017). African genomes illuminate the early history and transition to selfing in Arabidopsis thaliana. Proc. Natl. Acad. Sci. 114, 5213–5218. doi: 10.1073/pnas.1616736114
Exposito-Alonso, M., 500 Genomes Field Experiment Team, Burbano, H. A., Bossdorf, O., Nielsen, R., and Weigel, D. (2019). Natural selection on the Arabidopsis thaliana genome in present and future climates. Nature 573, 126–129. doi: 10.1038/s41586-019-1520-9
Filiault, D. L., and Maloof, J. N. (2012). A genome-wide association study identifies variants underlying the Arabidopsis thaliana shade avoidance response. PLoS Genet. 8:e1002589. doi: 10.1371/journal.pgen.1002589
Filiault, D. L., Wessinger, C. A., Dinneny, J. R., Lutes, J., Borevitz, J. O., Weigel, D., et al. (2008). Amino acid polymorphisms in Arabidopsis phytochrome B cause differential responses to light. Proc. Natl. Acad. Sci. 105, 3157–3162. doi: 10.1073/pnas.0712174105
Ikeda, H., Suzuki, T., Oka, Y., Gustafsson, A. L. S., Brochmann, C., Mochizuki, N., et al. (2021). Divergence in red light responses associated with thermal reversion of phytochrome B between high- and low-latitude species. New Phytol. 231, 75–84. doi: 10.1111/nph.17381
Jiang, Y., Yang, C., Huang, S., Xie, F., Xu, Y., Liu, C., et al. (2019). The ELF3-PIF7 interaction mediates the circadian gating of the shade response in Arabidopsis. iScience 22, 288–298. doi: 10.1016/j.isci.2019.11.029
Jiménez-Gómez, J. M., Wallace, A. D., and Maloof, J. N. (2010). Network analysis identifies ELF3 as a QTL for the shade avoidance response in Arabidopsis. PLoS Genet. 6:e1001100. doi: 10.1371/journal.pgen.1001100
Kasulin, L., Agrofoglio, Y., and Botto, J. F. (2013). The receptor-like kinase ERECTA contributes to the shade-avoidance syndrome in a background-dependent manner. Ann. Bot. 111, 811–819. doi: 10.1093/aob/mct038
Kasulin, L., Rowan, B. A., León, R. J. C., Schuenemann, V. J., Weigel, D., and Botto, J. F. (2017). A single haplotype hyposensitive to light and requiring strong vernalization dominates Arabidopsis thaliana populations in Patagonia. Argentina. Molecular Ecology 26, 3389–3404. doi: 10.1111/mec.14107
Lee, K. P., Piskurewicz, U., Turečková, V., Carat, S., Chappuis, R., Strnad, M., et al. (2012). Spatially and genetically distinct control of seed germination by phytochromes A and B. Genes Dev. 26, 1984–1996. doi: 10.1101/gad.194266.112
Legris, M., Ince, Y. Ç., and Fankhauser, C. (2019). Molecular mechanisms underlying phytochrome-controlled morphogenesis in plants. Nat. Commun. 10:5219. doi: 10.1038/s41467-019-13045-0
Leivar, P., Tepperman, J. M., Cohn, M. M., Monte, E., Al-Sady, B., Erickson, E., et al. (2012). Dynamic antagonism between Phytochromes and PIF family basic helix-loop-helix factors induces selective reciprocal responses to light and shade in a rapidly responsive transcriptional network in Arabidopsis. Plant Cell 24, 1398–1419. doi: 10.1105/tpc.112.095711
Maloof, J. N., Borevitz, J. O., Dabi, T., Lutes, J., Nehring, R. B., Redfern, J. L., et al. (2001). Natural variation in light sensitivity of Arabidopsis. Nat. Genet. 29, 441–446. doi: 10.1038/ng777
Matsusaka, D., Filiault, D., Sanchez, D. H., and Botto, J. F. (2021). Ultra-high-density QTL marker mapping for seedling Photomorphogenesis mediating Arabidopsis establishment in southern Patagonia. Front. Plant Sci. 12:677728. doi: 10.3389/fpls.2021.677728
Nicholson, S. J., Hoecker, U., and Srivastava, V. (2011). A novel Phytochrome B allele in Arabidopsis thaliana exhibits partial mutant phenotype: a short deletion in N-terminal extension reduces Phytochrome B activity. Plant Growth Regul. 65, 207–212. doi: 10.1007/s10725-011-9576-z
Oka, Y., Matsushita, T., Mochizuki, N., Quail, P. H., and Nagatani, A. (2008). Mutant screen distinguishes between residues necessary for light-signal perception and signal transfer by Phytochrome B. PLoS Genet. 4:e1000158. doi: 10.1371/journal.pgen.1000158
Podolec, R., and Ulm, R. (2018). Photoreceptor-mediated regulation of the COP1/SPA E3 ubiquitin ligase. Curr. Opin. Plant Biol. 45, 18–25. doi: 10.1016/j.pbi.2018.04.018
Rockwell, N. C., and Lagarias, J. C. (2006). The structure of phytochrome: a picture is worth a thousand spectra. Plant Cell 18, 4–14. doi: 10.1105/tpc.105.038513
Sadanandom, A., Ádám, É., Orosa, B., Viczián, A., Klose, C., Zhang, C., et al. (2015). SUMOylation of phytochrome-B negatively regulates light-induced signaling in Arabidopsis thaliana. Proc. Natl. Acad. Sci. 112, 11108–11113. doi: 10.1073/pnas.1415260112
Sánchez-Lamas, M., Lorenzo, C. D., and Cerdán, P. D. (2016). Bottom-up assembly of the Phytochrome network. PLoS Genet. 12:e1006413. doi: 10.1371/journal.pgen.1006413
Schneider, C. A., Rasband, W. S., and Eliceiri, K. W. (2012). NIH image to ImageJ: 25 years of image analysis. Nat. Methods 9, 671–675. doi: 10.1038/nmeth.2089
Shinomura, T., Nagatani, A., Chory, J., and Furuya, M. (1994). The induction of seed germination in Arabidopsis Thaliana is regulated principally by Phytochrome B and secondarily by Phytochrome A. Plant Physiol. 104, 363–371. doi: 10.1104/pp.104.2.363
Ta, J., Palmer, C., Brock, M., Rubin, M., Weinig, C., Maloof, J., et al. (2020). Multiple loci control variation in plasticity to foliar shade Throughout development in Arabidopsis thaliana. G3 Genes|Genomes|Genetics 10, 4103–4114. doi: 10.1534/g3.120.401259
Tognacca, R. S., and Botto, J. F. (2021). Post-transcriptional regulation of seed dormancy and germination: current understanding and future directions. Plant Commun. 2:100169. doi: 10.1016/j.xplc.2021.100169
Tognacca, R. S., Servi, L., Hernando, C. E., Saura-Sanchez, M., Yanovsky, M. J., Petrillo, E., et al. (2019). Alternative splicing regulation during light-induced germination of Arabidopsis thaliana seeds. Front. Plant Sci. 10:1076. doi: 10.3389/fpls.2019.01076
Tóth, R., Kevei, E., Hall, A., Millar, A. J., Nagy, F., and Kozma-Bognár, L. (2001). Circadian clock-regulated expression of phytochrome and cryptochrome genes in Arabidopsis. Plant Physiol. 127, 1607–1616. doi: 10.1104/pp.010467
Keywords: natural genetic variation, Arabidopsis, QTL mapping, shade avoidance response, PHYB
Citation: Ruiz-Diaz MJ, Matsusaka D, Cascales J, Sánchez DH, Sánchez-Lamas M, Cerdán PD and Botto JF (2022) Functional analysis of PHYB polymorphisms in Arabidopsis thaliana collected in Patagonia. Front. Plant Sci. 13:952214. doi: 10.3389/fpls.2022.952214
Edited by:
Hirokazu Tsukaya, The University of Tokyo, JapanCopyright © 2022 Ruiz-Diaz, Matsusaka, Cascales, Sánchez, Sánchez-Lamas, Cerdán and Botto. This is an open-access article distributed under the terms of the Creative Commons Attribution License (CC BY). The use, distribution or reproduction in other forums is permitted, provided the original author(s) and the copyright owner(s) are credited and that the original publication in this journal is cited, in accordance with accepted academic practice. No use, distribution or reproduction is permitted which does not comply with these terms.
*Correspondence: Javier F. Botto, Ym90dG9AYWdyby51YmEuYXI=
†These authors have contributed equally to this work
‡ORCID: Javier F. Botto, https://orcid.org/0000-0003-4297-165X