 Rongting Ji
 Weiming Shi
 Yuan Wang
 Hailin Zhang
 Ju Min
- 1State Key Laboratory of Soil and Sustainable Agriculture, Institute of Soil Science, Chinese Academy of Sciences, Nanjing, China
- 2Nanjing Institute of Environmental Sciences, Ministry of Ecology and Environment of the People’s Republic of China, Nanjing, China
- 3Department of Plant and Soil Sciences, Oklahoma State University, Stillwater, OK, United States
Precise and site-specific nitrogen (N) fertilizer management of vegetables is essential to improve the N use efficiency considering temporal and spatial fertility variations among fields, while the current N fertilizer recommendation methods are proved to be time- and labor-consuming. To establish a site-specific N topdressing algorithm for bok choy (Brassica rapa subsp. chinensis), using a hand-held GreenSeeker canopy sensor, we conducted field experiments in the years 2014, 2017, and 2020. Two planting densities, viz, high (123,000 plants ha–1) in Year I and low (57,000 plants ha–1) in Year II, whereas, combined densities in Year III were used to evaluate the effect of five N application rates (0, 45, 109, 157, and 205 kg N ha–1). A robust relationship was observed between the sensor-based normalized difference vegetation index (NDVI), the ratio vegetation index (RVI), and the yield potential without topdressing (YP0) at the rosette stage, and 81–84% of the variability at high density and 76–79% of that at low density could be explained. By combining the densities and years, the R2 value increased to 0.90. Additionally, the rosette stage was identified as the earliest stage for reliably predicting the response index at harvest (RIHarvest), based on the response index derived from NDVI (RINDVI) and RVI (RIRVI), with R2 values of 0.59–0.67 at high density and 0.53–0.65 at low density. When using the combined results, the RIRVI performed 6.12% better than the RINDVI, and 52% of the variability could be explained. This study demonstrates the good potential of establishing a sensor-based N topdressing algorithm for bok choy, which could contribute to the sustainable development of vegetable production.
Introduction
Nitrogen (N) is the key nutritional driver determining crop yield and quality, especially for vegetables (Dunn et al., 2015). However, N fertilizer use is highly inefficient, and often only 10–30% of the N applied in the field can be absorbed by the crop, with a substantial amount of N loss to the environment, resulting in soil and water quality deterioration (Zhu et al., 2005; Shi et al., 2009; Song et al., 2009). The amount and timing of the N application are the two important factors determining the N-use efficiency (NUE) (Bijay-Singh et al., 2015; Zotarelli et al., 2015). In this sense, the diagnosis of field plant N status and appropriate fertilizer-application recommendations have become a critical component of ensuring high yields and good quality vegetable crops. Since small farms characterize agriculture in many countries, as reported, 73% of farms are smaller than 1 ha and 85% are smaller than 2 ha, especially in China where over 80% of households operate less than 0.6 ha of farmland (Tan et al., 2013; Lowder et al., 2016). Fine-tuned monitoring of N status of both field and crop has been challenging, and over-fertilization is a common occurrence. In these smaller-scale operations, further complicated by variable fertility histories and rotation systems, the temporal and spatial variation in soil fertility among fields has additionally restricted efficient fertilizer-N utilization (Jin and Jiang, 2002; Lowder et al., 2016). Therefore, a site-specific topdressing N-management strategy must be developed that reflects spatial variabilities and plant N availability to improve NUE in vegetable production systems (Dobermann et al., 2003).
Numerous recommendation systems have been developed and tested for improving the N-fertilizer management of vegetable crops, such as the Nmin methods, the Kulturbegleitenden Nmin-Sollwerte System, and the N-Expert system (Burns, 2006; Schmidt et al., 2009). These existing systems are mainly based on soil testing and plant analysis; however, the cost and time required for soil and plant testing, the slow turnaround time, and high prediction errors among fields have limited the adoption of these methods by local farmers (Jin and Jiang, 2002; Ma et al., 2007). In recent years, significant progress in investigating remote-sensing technology as a real-time N diagnostic tool has been made, and related approaches have been applied to many crops (Samborski et al., 2009). Some proximal optical sensors, such as chlorophyll meters, Dualex instruments, and portable canopy sensors, have been used for determining the N status of vegetables (Gianquinto et al., 2011; Padilla et al., 2018). Among these, hand-held active canopy sensors have shown the potential to detect plant N status with high temporal and spatial resolution at the canopy level and have received much attention because of their superior operational efficiency over direct contact leaf sensors and relatively low cost compared to hyperspectral sensors (Raun et al., 2005; Xia et al., 2016).
One of the commonly used hand-held active canopy sensors is the GreenSeeker optical sensor, which measures reflectance from the plant canopy in the red and near-infrared wavelength region and provides two typical plant indices: the normalized difference vegetation index (NDVI) and the ratio vegetation index (RVI) (Yao et al., 2012). The canopy reflectance to visible light is primarily dependent on the chlorophyll content contained in the leaf palisade layer and the near-infrared reflectance depended upon the structure of the mesophyll cell and the cavities between cells, thus the NDVI and RVI indices can detect plant N status and make N recommendation (Olfs et al., 2005). Canopy characteristics have been used to guide the N management of many cereal crops, e.g., winter wheat, corn, and rice (Lukina et al., 2001; Barker and Sawyer, 2010; Ali et al., 2014). Although the GreenSeeker sensor has been widely used for cereal crops, there has been limited use for N-fertilizer management in vegetable crops due to their special nutritional characteristics, fertilization, regimes, and soil fertility level; therefore, it cannot be used by just replacing the crop in the equation, and the usability, application procedures, and accuracy of the GreenSeeker sensor need to be restudied in the new system (Tremblay et al., 2011; Ji et al., 2017). Previous studies have mainly focused on in-season N-status estimation of a specific vegetable, but protocols for determining the variable N-application rate considering the spatial variation of vegetable crops are urgently needed (Jones et al., 2007; Tremblay et al., 2011; Dunn et al., 2015; Padilla et al., 2018). Moreover, plant density is one of the most important agronomic factors in practice, and sensor readings and N requirements change at different densities (Raun et al., 2002). It is unknown whether a hand-held active canopy sensor like the GreenSeeker sensor can be used for the N management of leafy vegetables with different plant densities.
Bok choy (Brassica rapa subsp. chinensis) is a popular leafy vegetable that originated in China over 1,500 years ago. Currently, it is widely cultivated and consumed in China and north-eastern Asia for its antioxidant benefits and winter hardiness (Heimler et al., 2006; Zhang et al., 2014). In particular, it is a popular leafy vegetable in the Taihu Lake region of southern China, and compared with a previous study, there seems to be a large opportunity for N-fertilizer reduction for bok choy in this region (Zhang et al., 2016). Key questions, therefore, were whether the GreenSeeker sensor may be employed to produce N-fertilizer recommendations for bok choy and whether a sensor-based topdressing N-management strategy could reduce N-fertilizer applications without sacrificing yields. We hypothesize that the GreenSeeker sensor would be used to make N recommendation of bok choy with different densities, and the N fertilizer rate would be reduced considering temporal and spatial soil fertility. In our study, a 3-year field experiment of bok choy with different densities and N-application rates was conducted in the Taihu Lake region. The objectives were to (i) determine whether the sensor-based N diagnosis model could be applied to bok choy with different plant densities, (ii) identify the suitable growth stage and plant index between NDVI and RVI for bok choy to make accurate predictions of yield without additional N (YP0) and the response index (RI) with topdressing N, and (iii) develop an accurate sensor-based N-fertilizer topdressing strategy for bok choy to improve the N-use efficiency.
Materials and methods
Study site
Field experiments with bok choy (Brassica rapa subsp. chinensis) were conducted in 2014 (Year I), 2017 (Year II), and 2020 (Year III) in Yixing (31°16′N, 119°54′E), Jiangsu Province, which is located in the center of the Taihu Lake region in south-eastern China. This region has a sub-tropical monsoon climate, with a mean annual air temperature and rainfall of 15.7°C and 1,177 mm, respectively. The distribution of precipitation and temperature during the experimental period is shown in Figure 1. Bok choy was planted in a new vegetable field (a traditional bok choy-radish-cabbage rotation was applied in each field every year), and the soil type at the experiment site was classified as hydroagric Stagnic Anthrosol by the Chinese soil taxonomic classification (Gong, 1999), with a pH (H2O) of 6.25, an electrical conductivity (EC) of 0.48 mS cm–1, and the soil organic matter content, total N, NO3–-N, and NH4+-N were 18.5 g kg–1, 1.06 g kg–1, 84.2 mg kg–1, and 24.6 mg kg–1, respectively.
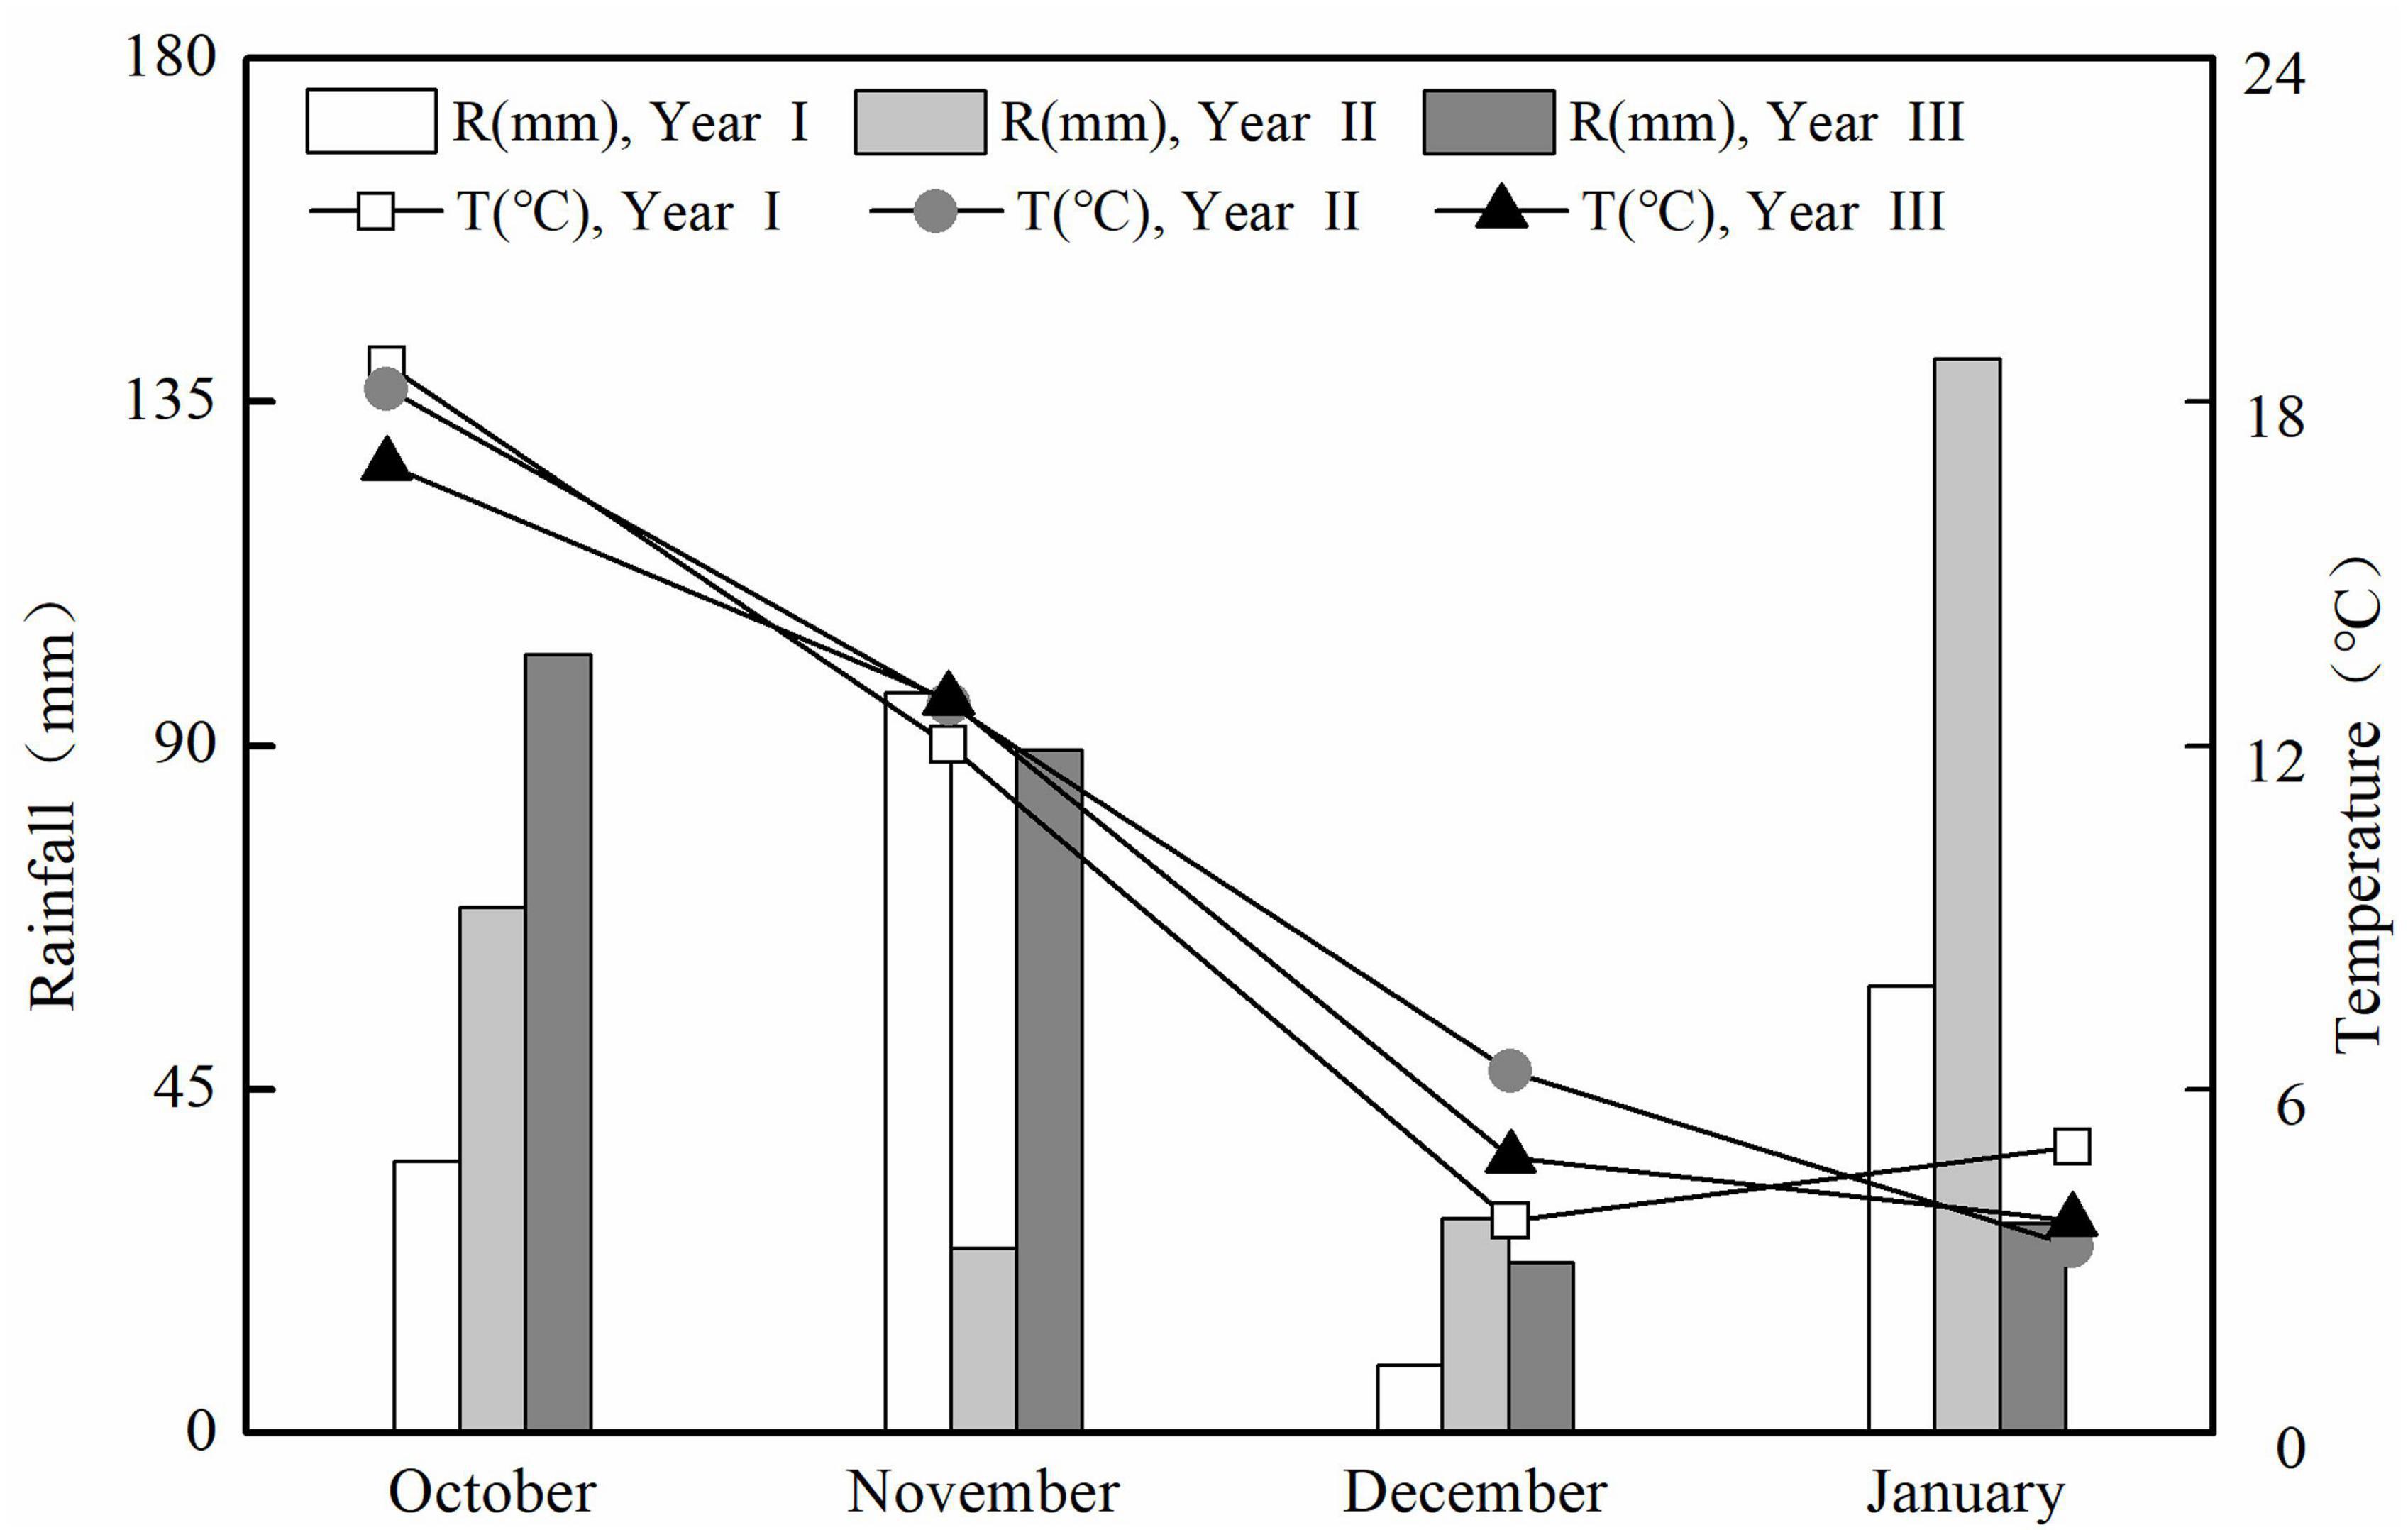
Figure 1. Monthly precipitation (R, mm) and average air temperature (T, °C) at the experiment site in cropping Years I, II, and III.
Experimental design
In Years I and II, 2,680 kg ha–1 manure (consisting of 45 kg N ha–1) and 24 kg P ha–1 from calcium superphosphate and 47 kg K ha–1 using potassium sulfate were applied to all treatments at transplanting as basal fertilizer. In addition, four chemical N rates were employed, designated as N1, N2, N3, and N4 (0, 64, 112, and 160 kg N ha–1, respectively), supplied as urea. The inorganic N fertilizer was applied in two splits: 30% at transplanting and 70% at the beginning of the 5–6 true-leaf stage. A randomized complete block design with three replications was used, and each plot measured 33.6 m2 (7.0 m × 4.8 m). To test the influence of plant densities, a high density (HD) was employed in Year I, with 123,000 plants ha–1, while in Year II, a low density (LD) with 57,000 plants ha–1 was used. In Year III, a split experiment was conducted with two densities of HD and LD, and each plot measured 16.8 m2 (3.5 m × 4.8 m). And two no-N fertilizer treatments (only 24 kg P ha–1 from calcium superphosphate and 47 kg K ha–1 using potassium sulfate) under HD and LD, with three replications each, were added to test the effect of soil background nitrogen supply potential.
Seedlings were grown in a small nursery first and then transplanted at the two-leaf stages into the experimental plots. In Year III, 24 plots (4.0 m2 plot each–1) located adjacent to the experiment site were established as a validation field; a moderate plant density (87,500 plants ha–1) was chosen in the validation field. The N management of the validation field was designed according to local farmer practice, and the plots were arranged randomly. The corrective N-management strategy was tested to determine N fertilizer application at the rosette stage using the experimental data, and the detailed experimental design is shown in Table 1.
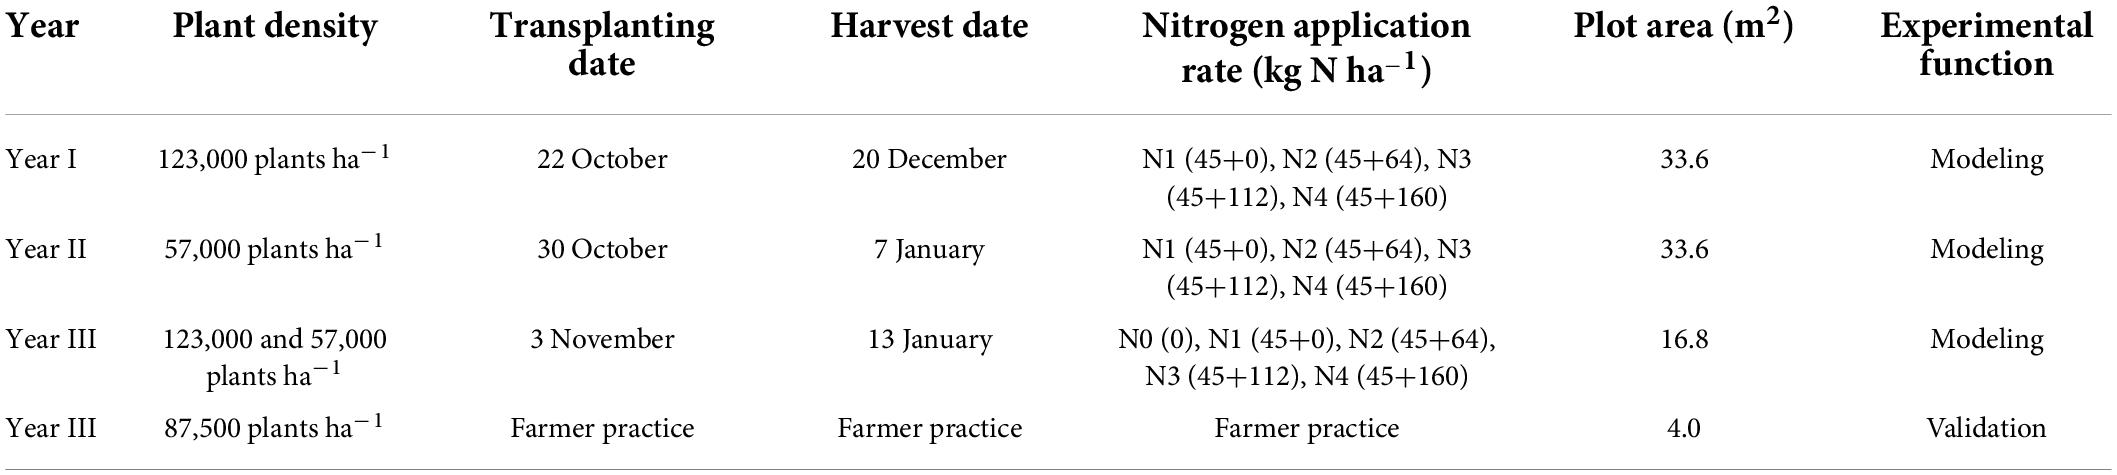
Table 1. Detailed experimental design.
Data collection
A GreenSeeker™ (Trimble Inc., Sunnyvale, CA, United States) hand-held sensor was used to collect reflectance data using red (671 ± 6 nm) and near-infrared (780 ± 6 nm) radiation. The sensor was positioned horizontally and parallel to the crop row approximately 60 cm above the crop canopy in each plot except the border rows by holding the GreenSeeker and walking at a constant speed, and the average of four measurements of independent rows from each plot was reported. Two vegetation indices (NDVI and RVI) were calculated by the internal software, and the calculations are as follows (Tremblay et al., 2009):
Where:
ρ NIR = reflectance at the near-infrared (NIR) region;
ρ Red = reflectance at the red region.
Sensor readings were collected at four growth stages (the 5–6 true-leaf, rosette, cupping, and harvest stage), and the exact sensing dates are presented in Table 2. The yield of each plot was determined from the aboveground fresh biomass of the bok choy adjusted to the water content of 90%. As for the validation field, the sensor readings of four stages and harvest yield were collected like those in the experimental plots. Additionally, the average N concentration of harvest bok choy was estimated by randomly sampling plants from 24 validation fields in the research region. Plant samples were oven-dried at 105°C for 30 min, then dried at 70°C to a constant weight, and later ground into fine powder to determine N concentration by a modified Kjeldahl digestion method (Xia et al., 2016).

Table 2. Sensing dates of bok choy at the four specific growth stages.
YP0, YPN, RI calculation, and N-fertilizer use efficiency evaluation
To evaluate the potential of using the GreenSeeker sensor to estimate bok choy yield potential without additional N (YP0), only treatments that received preplant N applications were used for the yield prediction model (including N1 treatment in Years I and II and N0 and N1 treatment in Year III). And YP0 can be estimated by the empirical exponential relationship between yield and NDVI or RVI measurements of all N treatments collected by the GreenSeeker sensor, YP0 = a*eb*NDVI or YP0 = a*eb*RVI (Teal et al., 2006; Ji et al., 2017). The YPN was calculated by multiplying the YP and RIHarvest values estimated by RINDVI (RIRVI) (Raun et al., 2005; Yao et al., 2012). Johnson and Raun (2003) introduced the response index (RI) as a measure of a plant’s response to additional N fertilizer. The RI is determined by comparing treatments or farm practice with a reference plot, which was traditionally used as the highest N-rate plot and represents an area where N is not a yield-limiting factor (Johnson and Raun, 2003; Lofton et al., 2012a). In our study, a 205 kg N ha–1 (160 kg N ha–1 from chemical fertilizer plus 45 kg N ha–1 from manure) treatment for bok choy was used as the reference plot. RINDVI (RIRVI) was calculated by dividing the mean NDVI (RVI) of the reference plots by the average measurement of other N-treated plots, while RIHarvest was calculated by dividing the mean yield of the reference plots by the yield of other N-treated plots.
The recovery efficiency (RE) and agronomic efficiency (AE) were computed as follows to assess the N-use efficiency of N-fertilizer input (Ali et al., 2014):
Statistical analysis
NDVI, RVI, and yield variation between different N fertilizer treatments and plant densities were subjected to one-way and two-way analyses of variance (ANOVA) and a Duncan multiple-comparison test with SPSS (ver. 20.0 for Windows, SPSS Inc., Chicago, IL, United States). All the regression coefficients in the study were calculated and plotted by Origin 8.5 (OriginLab Corporation, Northampton, MA, United States).
Results
Yield responses to different N rates and plant densities
Bok choy yields showed a significant response to different N rates and densities (Figure 2; Supplementary Table 1). The yields were greatly enhanced by increasing N rates in both years and densities. The yields of bok choy under N2, N3, and N4 treatments were increased by 31.9, 50.6, and 50.4% in Year I and 9.8, 44.4, and 48.4% in Year II. In Year III, yields under N1 to N4 treatments were 8.5–78.4% and 13.8–63.9% higher than the N0 treatment, and 29.8–64.3% and 7.9–40.9% higher than the N1 treatment at high- or low density, respectively. The yields increased as the N rate increased up to N3, but no further significant increase was observed beyond N3, suggesting that 112 kg N ha–1 as urea accompanied 45 kg N ha–1 from organic fertilizer was the optimum N rate for bok choy. As shown in Figure 2A, the yield difference between Years I and II was rather significant, and the actual yield of bok choy in Year II was 36.3–46.9% lower than that in Year I, suggesting that plant density has a significant influence on the final yields of bok choy at harvest, since the plant population in Year II was less than half of that in Year I. The yield in Year III also confirmed the effect of plant density, and 26.6–40.2% gap was observed (Figure 2B). Also, because of frost damage during the growing period, the yield in Year III was significantly lower than that in Years I and II, but a similar yield response trend was observed. Thus, the yield of bok choy was significantly increased as the N-application rate up to 157 kg N ha–1, and plant densities may have a remarkable influence on yields at harvest.
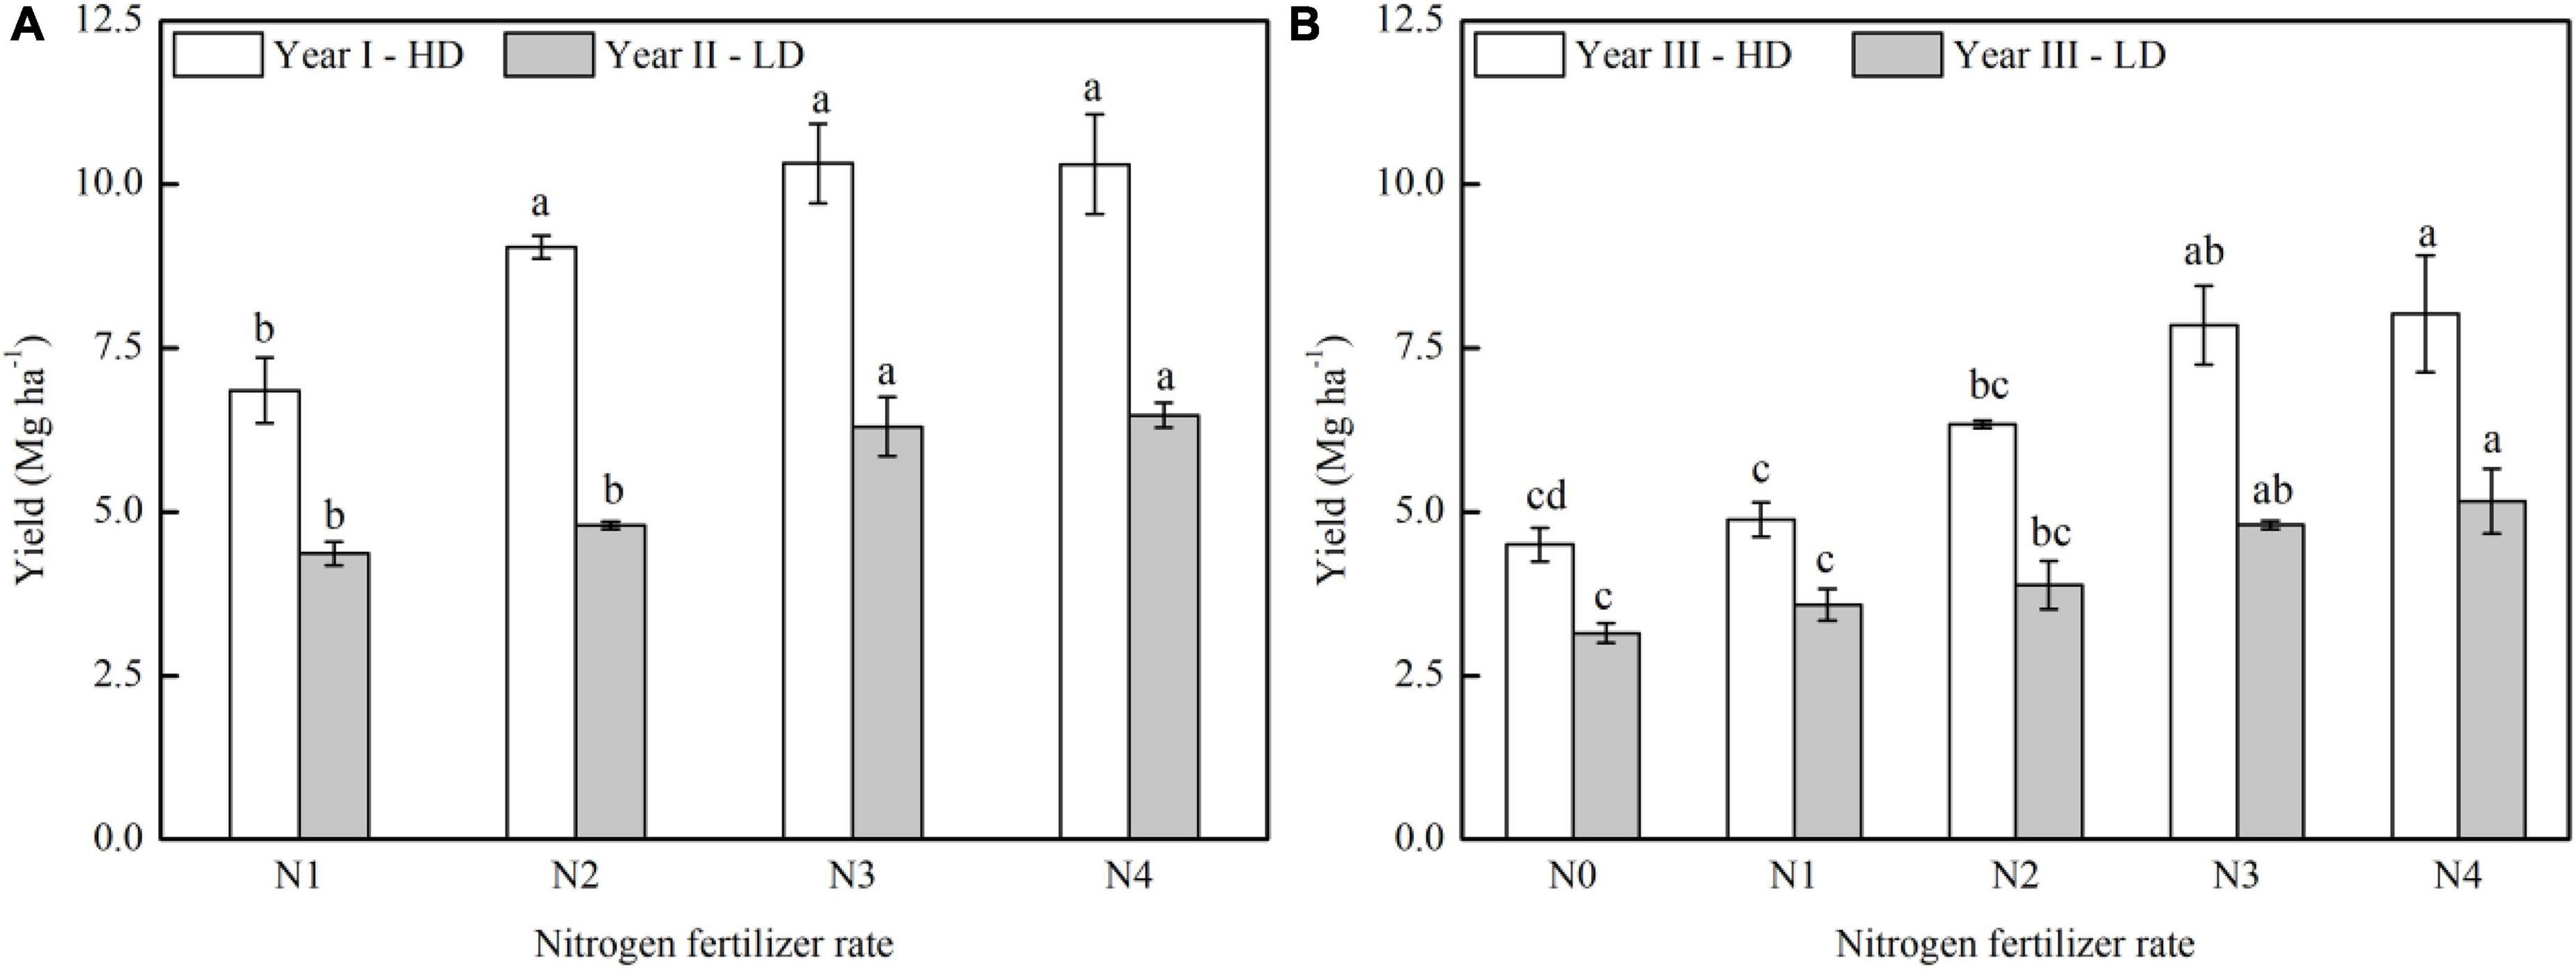
Figure 2. Yield responses of bok choy to different chemical N fertilizer rates in Years I, II (A), and Year III (B). Treatments N0, N1, N2, N3, and N4 received 0, 45, 109, 157, and 205 kg⋅N⋅ha–1 in the growth season, respectively. Different letters indicate significant differences among various N application rates in the specific year at the P < 0.05 level.
In-season prediction of YP0
Current N recommendation strategies are mainly “yield-based,” and YP0 is the possible attainable yield with no additional N (Raun et al., 2002). In practice, accurately estimating YP0 at the early stage was the first step in determining a site-specific N-management strategy to achieve optimum yields. Compared with three common types of regression equations (Supplementary Table 2), the empirical exponential model was used to determine the relationship between YP0 and the sensor-based vegetation indices (NDVI and RVI) for bok choy across growth stages (Table 3). NDVI and RVI could accurately estimate YP0, but the relationship was not robust across all stages. At the 5–6 true-leaf stage, a low correlation was noted between sensor measurements and YP0, and the determination coefficient ranged from 0.68 to 0.72 (Table 3). The highest R2 was obtained at the rosette stage, and 81–84% of YP0 of the variability under HD and 76–79% of the variability under LD could be explained by RVI and NDVI. However, at the cupping and harvest stage, a significantly weaker relationship was observed, and 1–21% of the yield variations could be explained (Table 3). In a comparison between the two sensor-based vegetation indices, NDVI and RVI, almost the same accuracy in predicting YP0 was found at each stage.
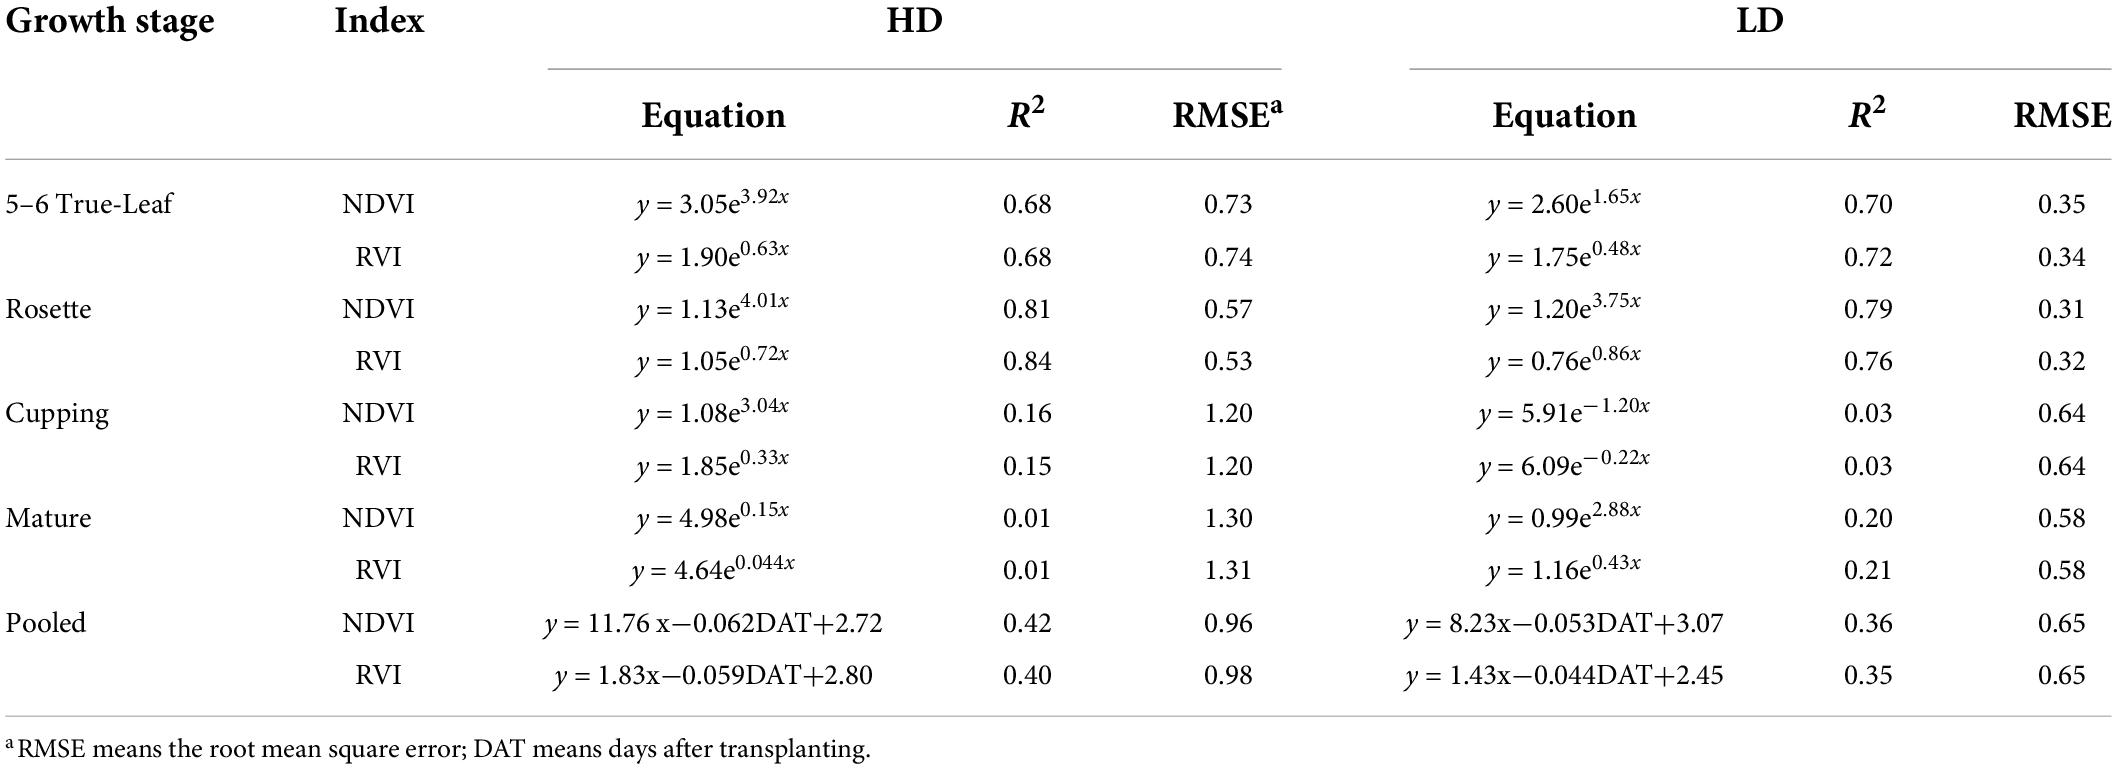
Table 3. Relationships between sensor-based measurements (NDVI and RVI) and yield potential without additional topdressing N application (YP0) of bok choy at different densities of high density (HD) and low density (LD).
Regression analyses (Table 3) suggest that the rosette stage was the most appropriate stage for YP0 prediction in both years and densities, which coincides with the optimum time for topdressing N to bok choy during production. However, for practical application purposes, it would be more convenient to build a general model to predict the yield potential of vegetables with different plant densities. The fitting curves of pooled sensor readings (NDVI and RVI) and YP0 with different densities among years at the rosette stage are presented in Figure 3. By combining all years-densities data, the sensor-based yield prediction model could explain 89–90% of the YP0 variation. Between the two indices, RVI performed similarly to NDVI. Additionally, the plant density showed a significant effect on YP0, and the YP0 under HD treatments were much higher than that of LD; thus, the data points for HD treatment are located on the upper section of the line, while LD treatment data are positioned on the lower portion of the fitting curves; however, the trend was similar for both densities (Figure 3).
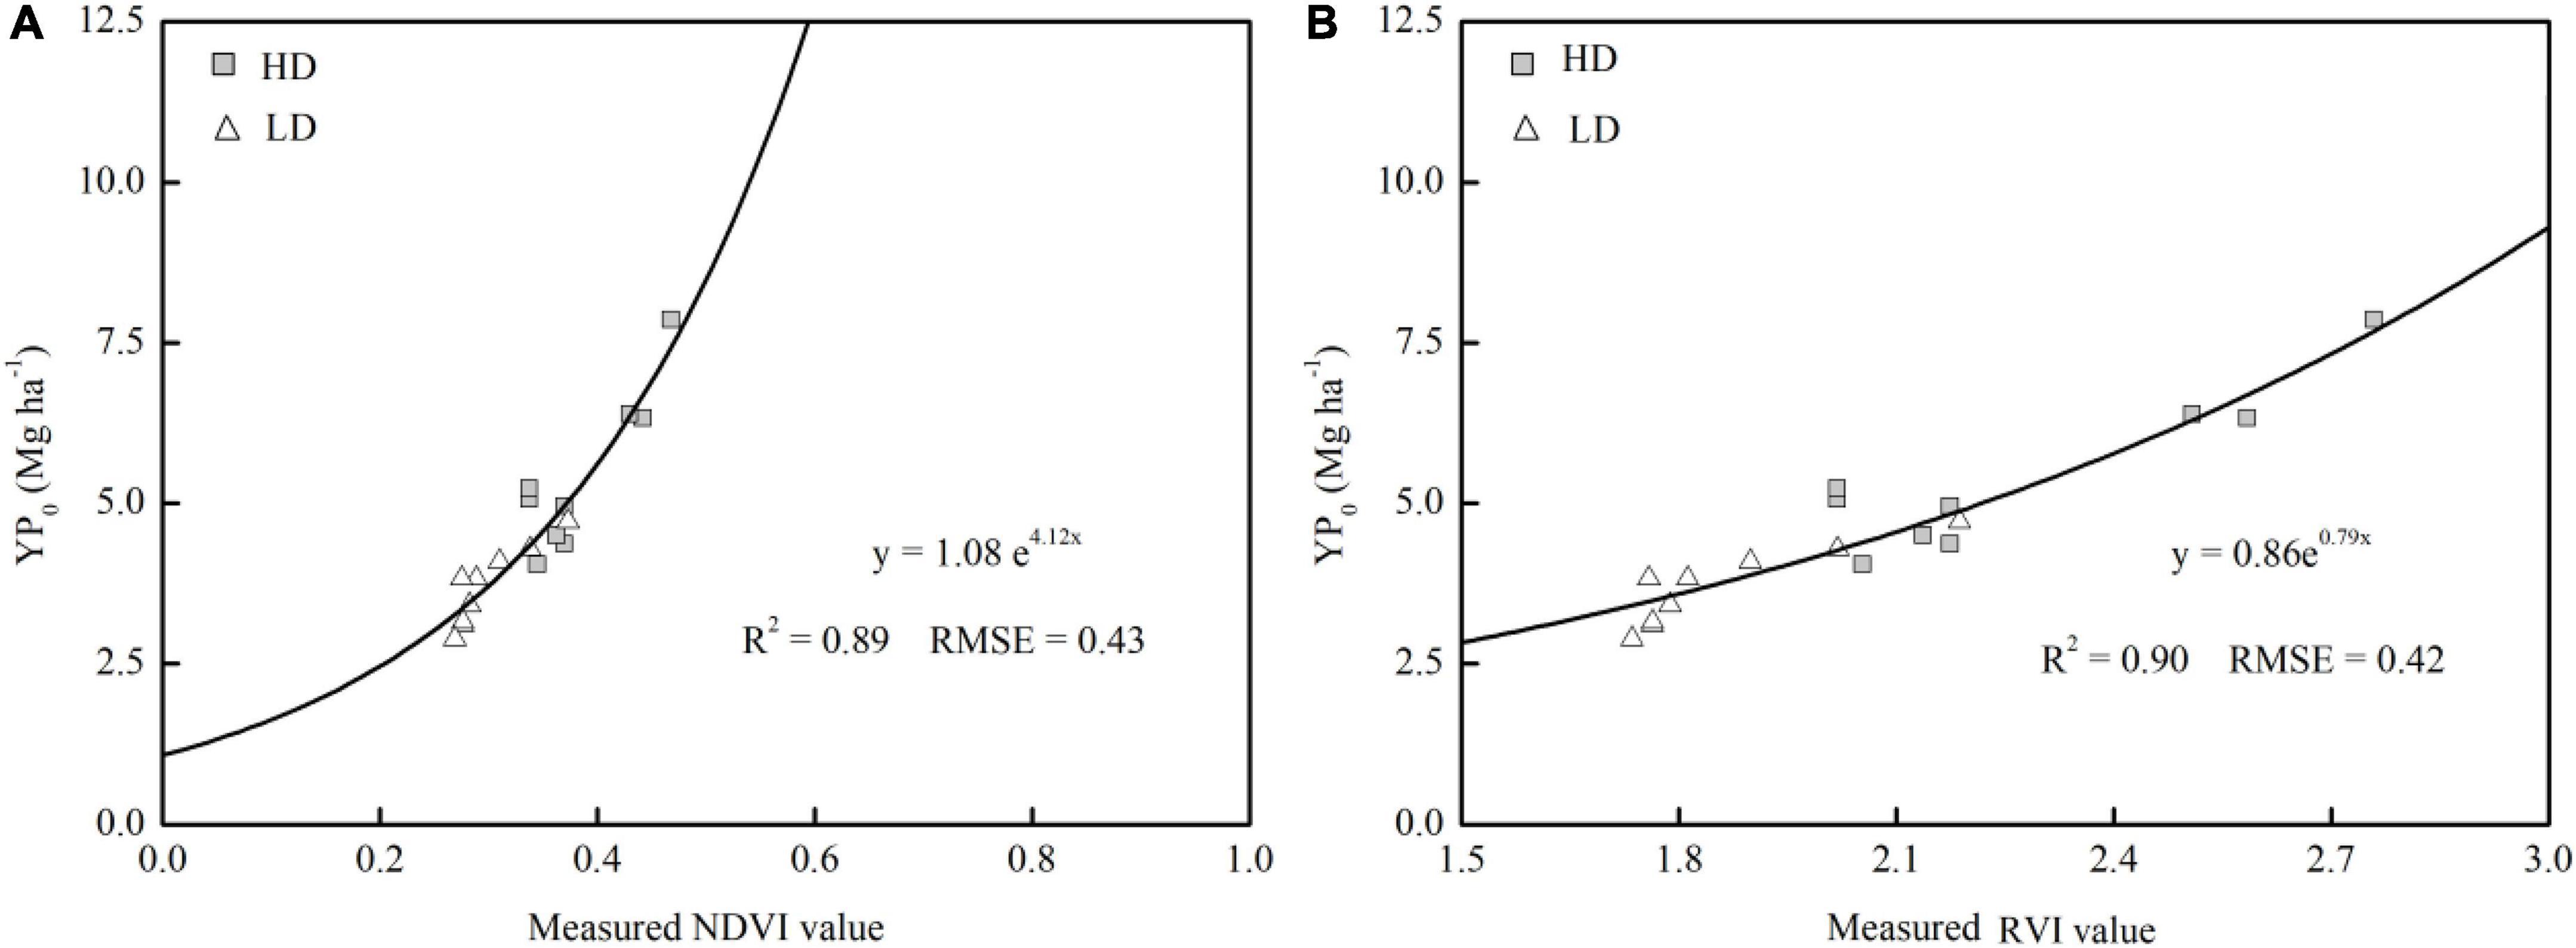
Figure 3. Relationship between in-season estimates of yield potential without additional N topdressing (YP0) at the rosette stage calculated using the normalized difference vegetation index (NDVI) (A) and the ratio vegetation index (RVI) (B) in Years I, II, and III.
In-season prediction of N response index
Aside from the accurate prediction of YP0, the degree to which a crop responded to additional N fertilizer was also a key component in determining the appropriate N-management strategy. Table 4 shows the relationships between RIHarvest and RINDVI (or RIRVI), which were computed from the NDVI (or RVI) readings collected at each stage. RINDVI and RIRVI were significantly correlated with RIHarvest, but the parameters were different among the stages. The sensor-based RIs can accurately predict RIHarvest after the 5–6 true-leaf stage, and the rosette stage was the earliest stage for which RIHarvest estimation was conducted, with R2 values of 0.59–0.67 under HD treatment and 0.53–0.65 under LD treatment. After the rosette stage, a weaker relationship was observed for both RINDVI and RIRVI; furthermore, those later stages were too late for topdressing N. Therefore, the rosette stage was the most appropriate stage for conducting the RIHarvest prediction, which was consistent with the growth stage for YP0 prediction. After using a combined equation to explain the variation across years and densities at this stage, a weaker, but still significant, relationship was observed relative to that of individual densities. The accuracy of the RVI-based model and the RMSE value was 6.12% higher and 8.70% lower, respectively, than that seen with the NDVI-based model (Figure 4), with RVI explaining 52% of RIHarvest variability. This result confirms the superiority of the RVI-based model in explaining RIHarvest variability.
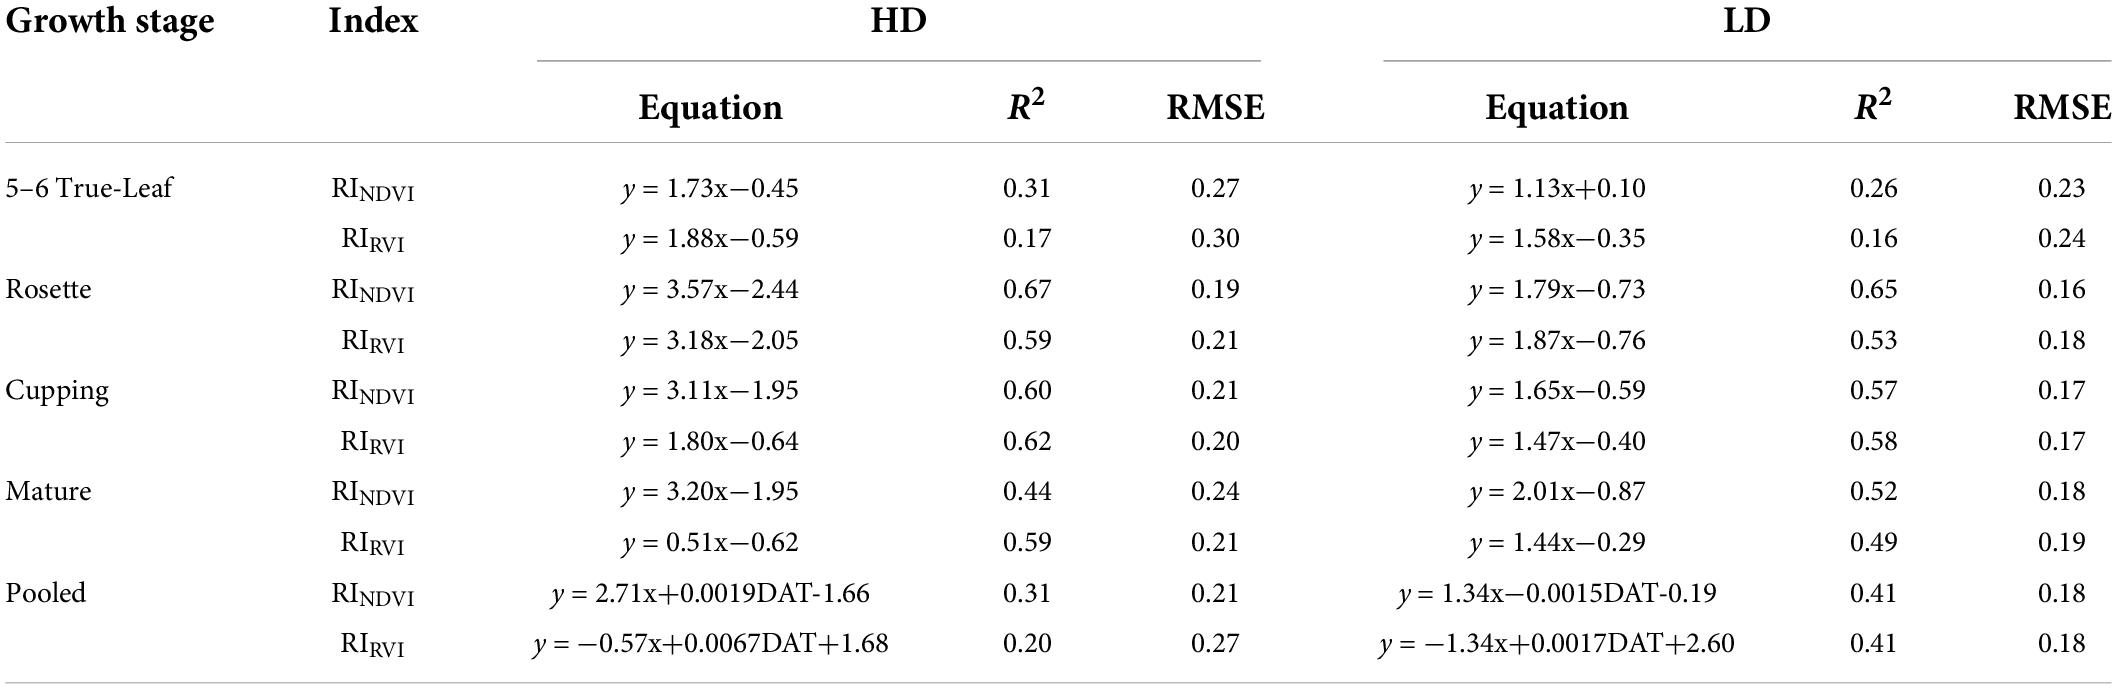
Table 4. Relationship between RINDVI and RIRVI with RIHarvest (y in the equations) of bok choy across years at different densities of high density (HD) and low density (LD).
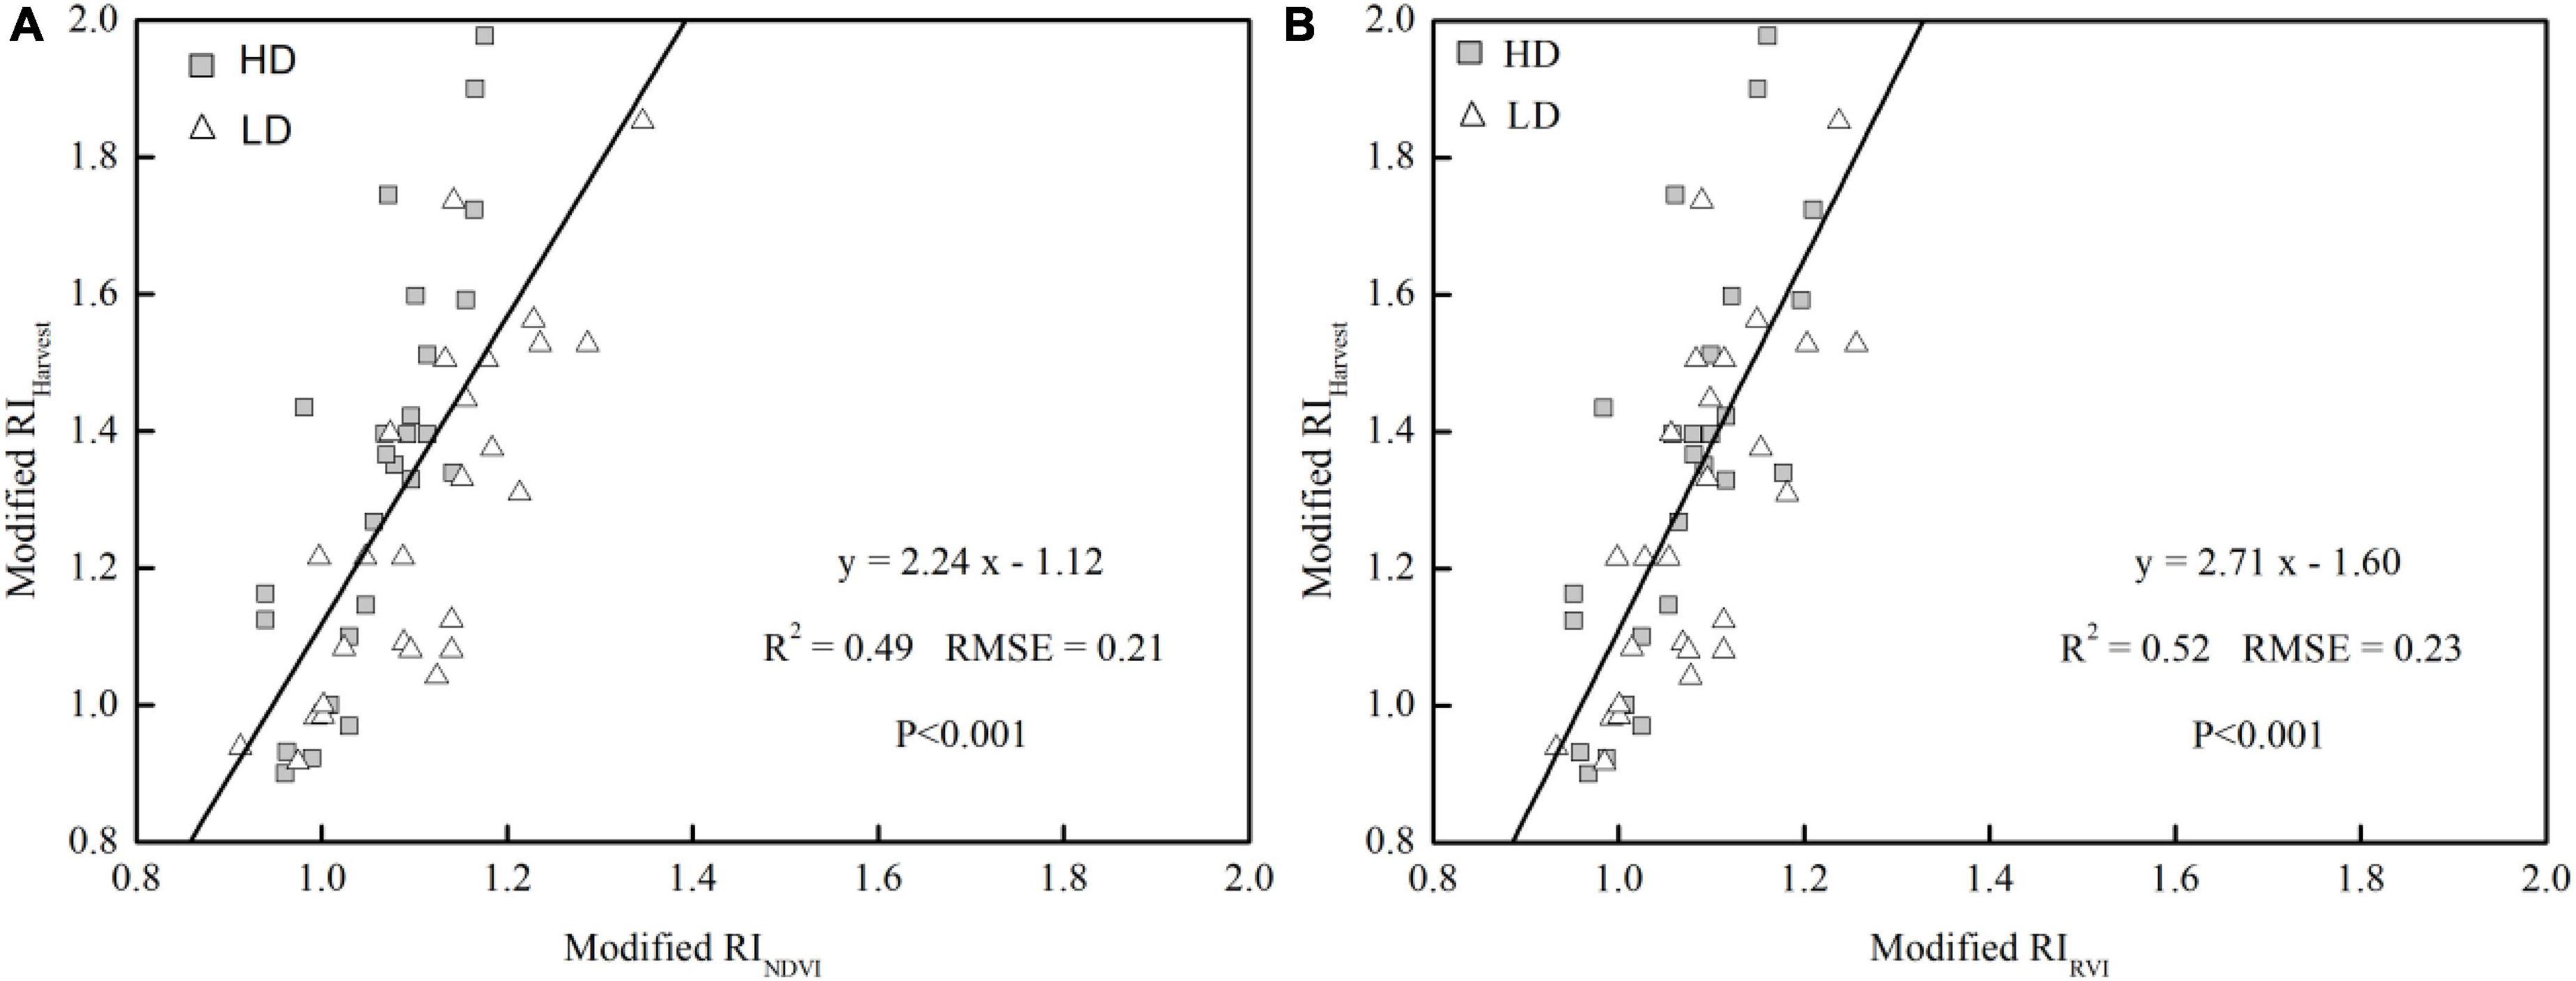
Figure 4. Relationships between the response index calculated with yield (RIHarvest) and the response index calculated with NDVI (RINDVI) (A) and RVI (RIRVI) (B) at the rosette stage of bok choy growth in Years I, II, and III.
Model validation
The exponential and linear equations developed from the RVI measurements at the rosette stage were used to predict YP0 (YP0 = 0.86e0.79 × RVI, R2 = 0.90) and RIHarvest (RI = 2.71 × RIRVI-1.60, R2 = 0.52) at either the high or low plant density of bok choy. To validate the reliability of the YP0 and RIHarvest prediction model for different densities, we tested the model using an independent data set obtained from the validation field with a moderate plant density (87,500 plants ha–1) in Year III. According to the results of the YP0 and RI prediction models, the rosette stage was the most suitable growth stage, so RVI measurements obtained at that stage were used for validation to determine the relationship between the predicted YP0 and RIHarvest and the actual values. As shown in Figure 5, the observed YP0 was highly correlated with the predicted YP0 (R2 = 0.60) in almost a 1:1 relationship, with a slope of 0.89. For RIHarvest, the predicted value was slightly higher than the observed results, but a good relationship (R2 = 0.84) was observed, with a slope of 1.12. In general, the data points of the two validation equations were all scattered evenly around the 1:1 line. This confirms the potential of applying the in-season YP0 and RIHarvest prediction model to various plant populations.
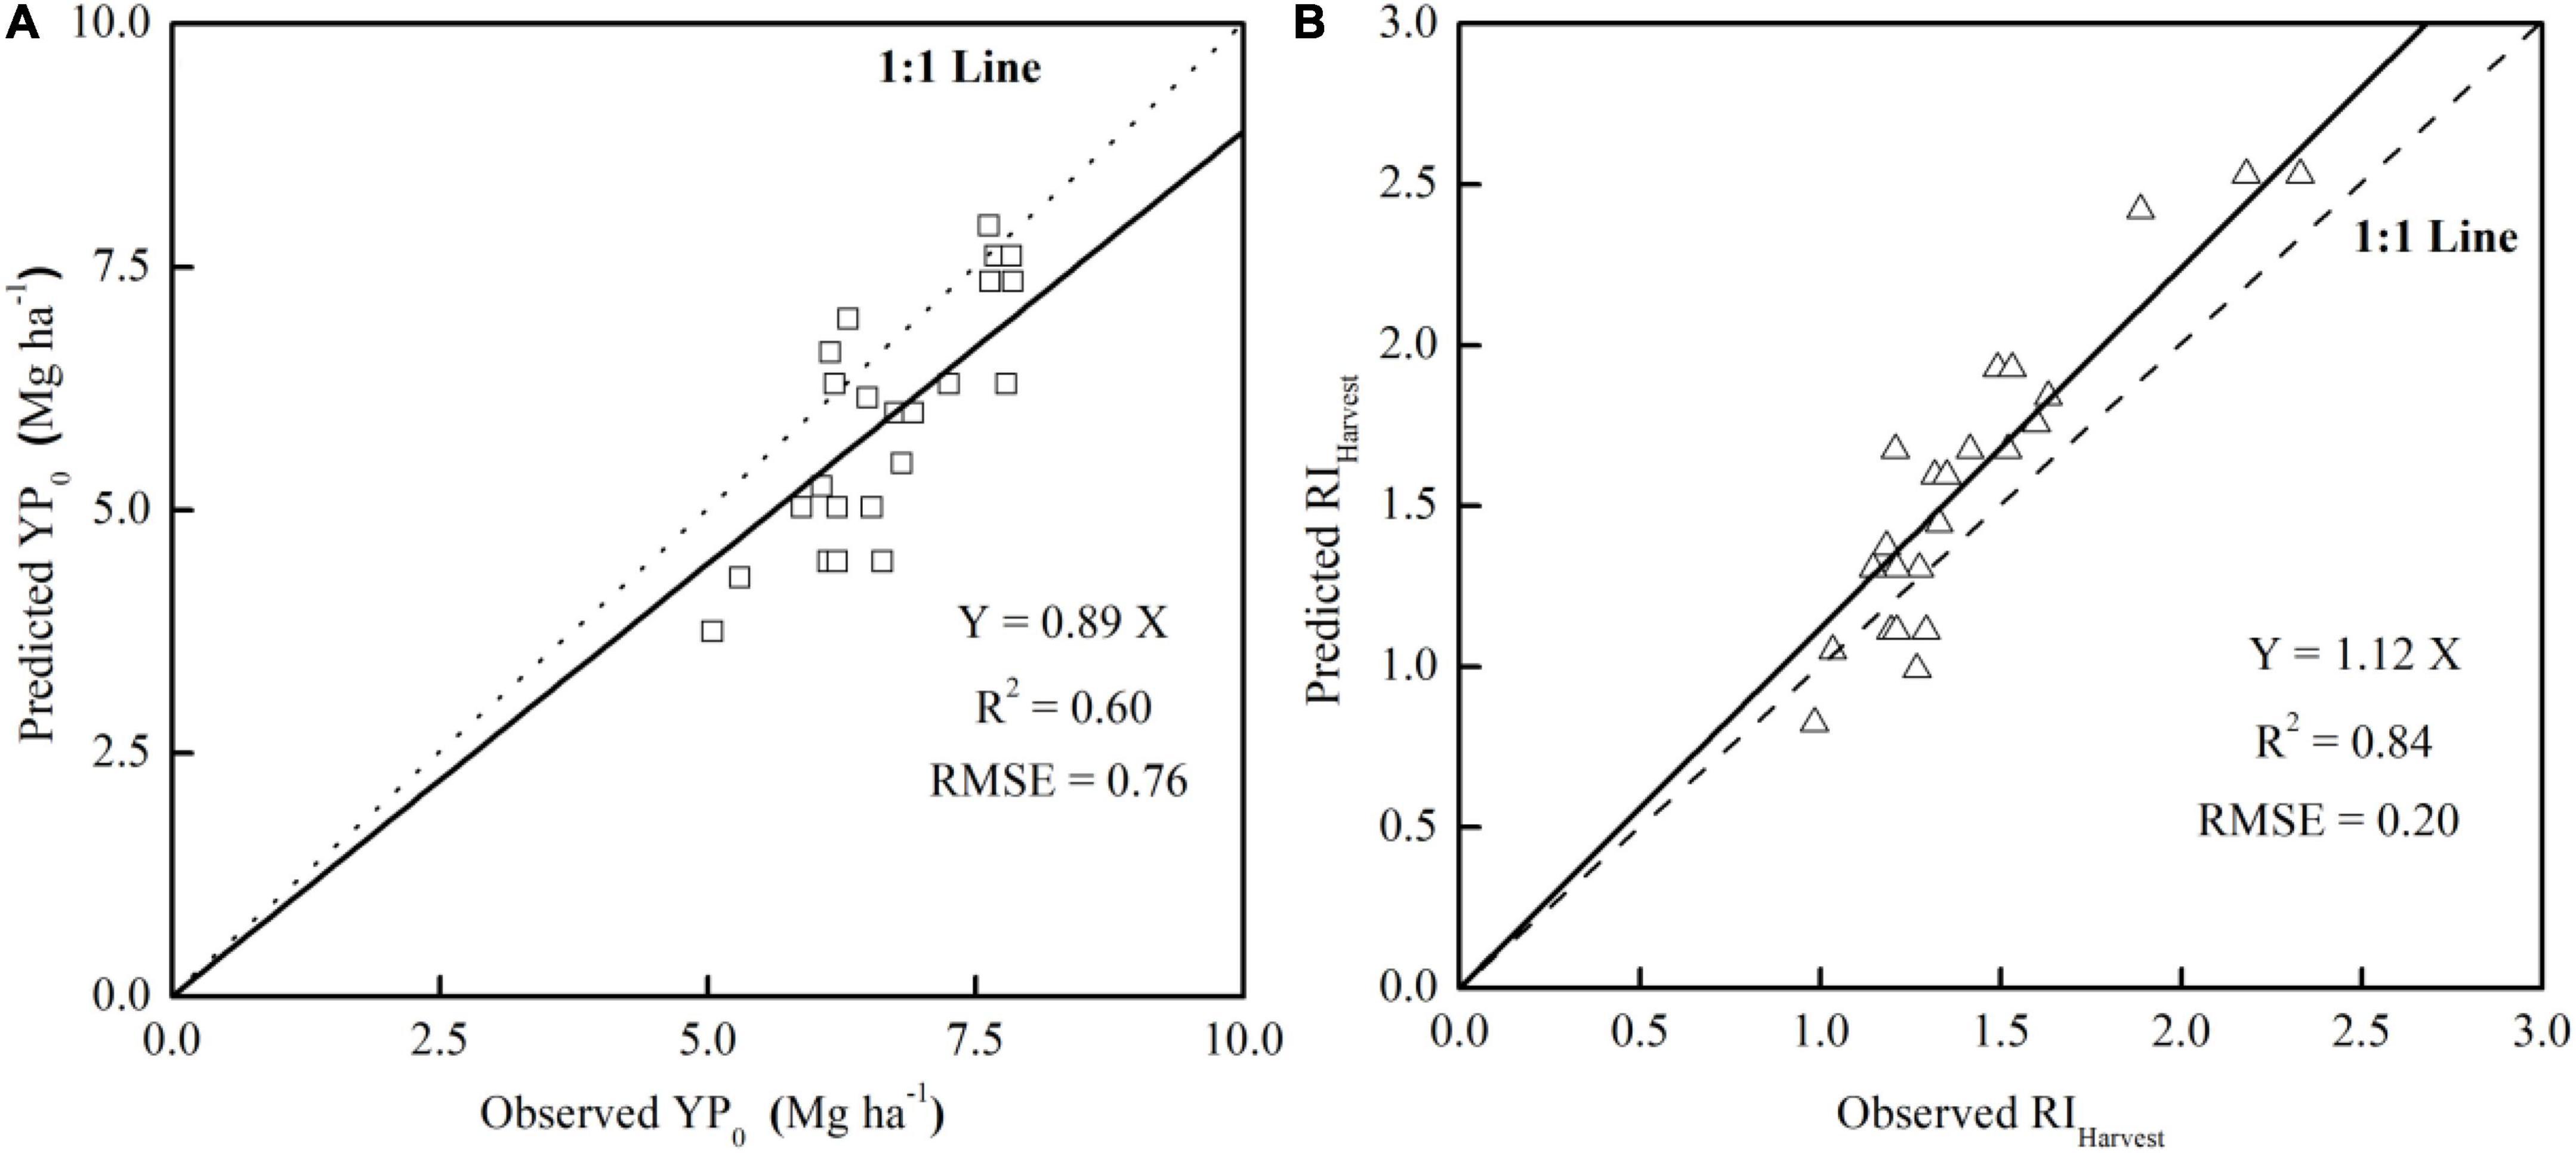
Figure 5. Relationship between the observed and predicted YP0 (A) and RIHarvest (B) in the validation field.
Strategy for in-season site-specific N management for bok choy
In practice, the potential yield with added N fertilization (YPN) can be estimated by multiplying YP0 and RI; the N requirement is then determined by multiplying the yield response by plant N concentration and average NUE (Raun et al., 2005). In our study, the RVI is superior to the NDVI measurement for predicting YP0 and RIHarvest.
Thus, the site-specific N-topdressing algorithm for bok choy is expressed as follows (Raun et al., 2005; Yao et al., 2012):
where YP0 = 0.86e0.79 × RVI and RI = 2.71 × RIRVI-1.60.
The NUE used in the formula is defined as the NUE of the additional N input. However, there is no consensus yet on determining the vegetables’ NUE, as it depends on various soil and environmental factors, fertilizer management, and treatments applied (Barker and Sawyer, 2010; Li et al., 2017). In our study, the average NUE in the research region of vegetable crops topdressing N fertilizer was approximately 15%; thus, the NUE in the formula was initially set at 15% for bok choy. Additionally, the N% expressed in the model was the average N content of bok choy at harvest; according to our investigation, the harvested N concentration of bok choy in the Taihu Lake region was approximately 5.5% (Supplementary Table 3). Based on the above discussion, the NFOA for bok choy can be established.
Evaluation of the sensor-based N topdressing algorithm of bok choy
Practically, a field optimum N rate is typically recommended for the whole region and then adjusted to the specific rate for a certain field based on the spatial variation (Zhu, 2006; Yao et al., 2012). Therefore, a practical precision-driven N topdressing algorithm for bok choy was proposed for the Taihu Lake region, using 45 kg N ha–1 from manure as basal N fertilizer plus a 112 kg N ha–1 chemical N fertilizer split-applied at the transplanting and 5–6 true-leaf stage, at 30 and 40% proportion according to the nutrient requirement pattern followed by determination of the need for additional topdressing N at the rosette stage using the RVI-based NFOA (Zanão Júnior et al., 2005).
To address whether the sensor-based topdressing N-management strategy could reduce N fertilizer application without sacrificing yields, we examined the proposed N-management strategy using the plots with approximately equal N application rates in Years I, II, and III at high or low density. The data in Table 5 show the outcomes of normal farm practice and the sensor-based N-topdressing strategy. A similar yield was obtained under the traditional farm fertilizer practice and the sensor-based topdressing strategy, at both high and low density (Table 5). According to our calculation, the amount of N recommended ranged from 43.41 to 58.77 kg N ha–1 under the high-density treatment and from 29.07 to 37.97 kg N ha–1 under the low-density treatment. The recommended rate was significantly lower than that employed as part of the normal farm practice, especially for the low-density treatment. When appropriately prescriptive N fertilizer amounts were applied and a sensor-based corrective N strategy was conducted, average increases of 14.91 and 31.17% of RE and 3.60 and 4.58 kg yield/kg N of AE by fertilizer N over normal farm practice were observed at high and low densities, respectively. Therefore, a reduction of 18.16–32.65% N can be achieved by using the sensor-based approach compared to N-management practice in conventional farming. Additionally, when compared with the optimum N rate at 157 kg N ha–1, the amount of the sensor-based NFOA was almost equal to, or slightly less than, the optimum N rate, and the fertilizer rate gap between the NFOA-calculated fertilizer rate and the optimum N rate reflecting the soil fertility variation among plots.
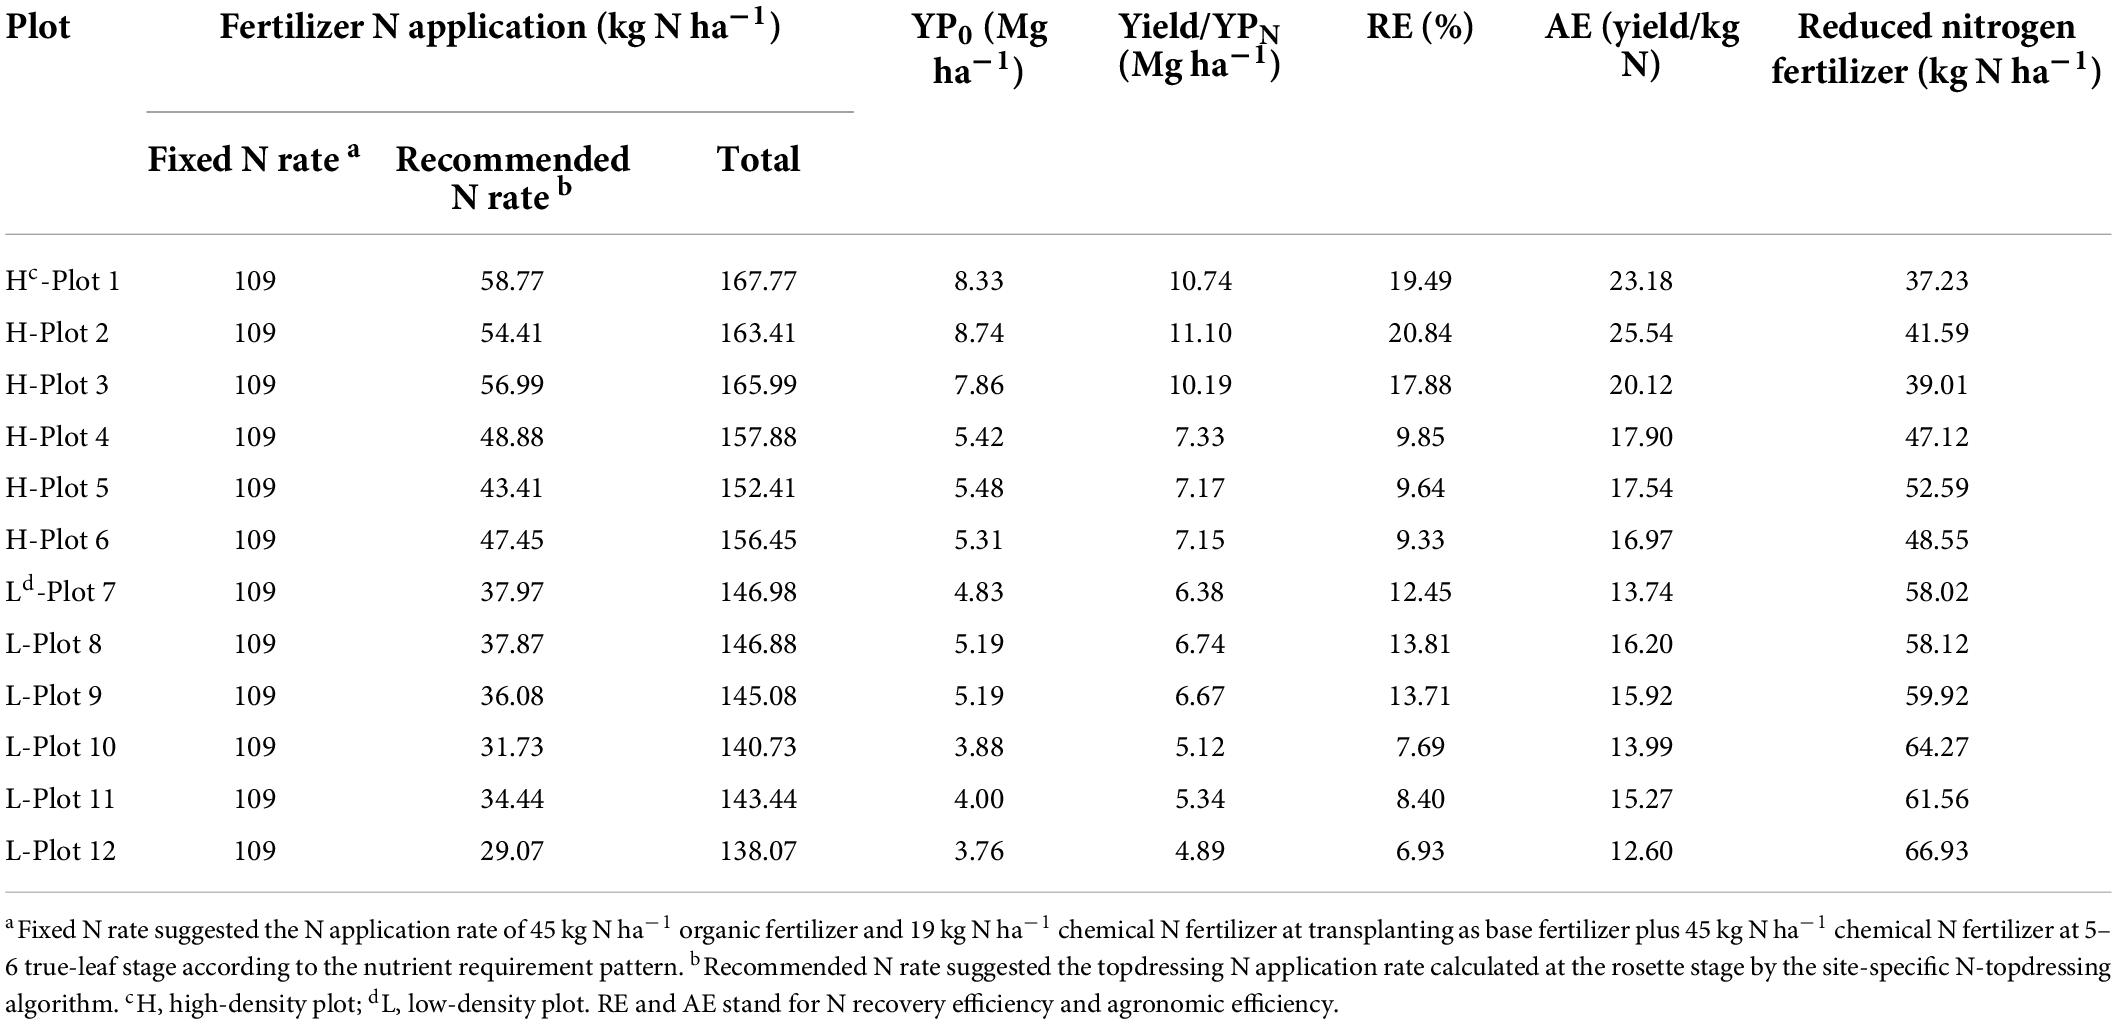
Table 5. Estimation of sensor-based topdressing N amounts at different densities using the experimental data for bok choy.
Discussion
Sensor-based approaches used for assessing the crop N management of vegetable crops
Optical sensors have been a promising alternative approach for non-destructive crop monitoring (Ali et al., 2020). However, few studies have paid attention to the sensor-based N fertilizer management in vegetable production systems. This phenomenon was partly owing to the complicated canopy architecture of vegetable crops which would complicate the work of the sensor (Padilla et al., 2018). The RVI determined by the GreenSeeker sensor had a significant relationship with YP0 (R2 = 0.90) and RIHarvest (R2 = 0.52) (Figures 3, 4), the RVI performed better than the NDVI on account of its higher sensitivity vis-a-vis the former during the early vegetation and maturity stages, especially at high plant densities (Li et al., 2013). Given the different fitting results of the YP0 and RIHarvest prediction model in Years I, II, and III, it may be influenced by the climate differences between years to some degree (Figure 1), and this need to have more validation (Raun et al., 2005; Ji et al., 2017). When considering the variation in yield between years, which may be due to the impact of vegetable stubble changes, pests and diseases pests during a particular year, and adverse weather, it did not influence the use of optical sensors (Liu et al., 2008; Li et al., 2017). Moreover, the YP0 and RIHarvest prediction model would not be affected even if the relatively yield fluctuates (Figures 3, 4). To sum up, compared with the results for rice and sugarcane, the findings of our study were as good as, or better than, the predictions for other crops (Lofton et al., 2012b; Yao et al., 2012); therefore, the YP0 and RI index of bok choy could be reliably assessed by using the GreenSeeker sensor.
A sensor-based site-specific N topdressing strategy of bok choy
Determining the correct amount of topdressing N is a critical step toward enhancing NUE and ensuring the productivity and quality of vegetable crops (Zhou et al., 2017). However, the complicated canopy architecture and the relatively short growth cycle of bok choy and other vegetables relative to that of grain crops (e.g., corn and rice) has caused difficulty in determining the proper timing and amounts of topdressing N for vegetables (Lukina et al., 2001; Barker and Sawyer, 2010; Lofton et al., 2012b; Ali et al., 2014; Xia et al., 2016). In addition, the coexistence model of chemical N fertilizer and organic fertilizer in the vegetable production system and the uncertainty of the N mineralization capacity of organic fertilizer significantly increases the difficulty of determining the amount of topdressing N (Chen et al., 2006; Ren et al., 2014). As found, the total yield of N4 in Years I, II, and III was slightly lower or equal to that of N3 treatment, and no significant difference was observed, therefore the N4 rate was selected as the non-N limiting treatment. And an average organic fertilizer application rate used by local farmers (about 45 kg N ha–1) from manure was applied as the basal fertilizer to all treatments as part of the total N input, and, thus, the amount of topdressing N could be quantitatively assessed and the sensor-based NFOA was used in our study to establish the amount of topdressing N fertilizer at the rosette stage of bok choy Eq. 5, and the recommended N-fertilizer strategy was thus proposed for the Taihu Lake region (Zanão Júnior et al., 2005; Zhu, 2006; Yao et al., 2012). According to preliminary estimation, the sensor-based topdressing strategy could reduce the total N input by 18.16–32.65% without sacrificing yields and could improve RE by 14.91–31.17% and AE by 16.10–30.82% over traditional farming practices (Table 5), which is consistent with findings for rice, where site-specific sensor-based N management increased the partial factor productivity of farmers by 48% without significantly affecting grain yield (Li et al., 2009).
Effect of plant density on yield and the sensor-based prediction model
Plant density is one of the most important agro nomic management practices that influence crop yields (Lama et al., 2018; Adams et al., 2019). The yield of high-density plots (123,000 plants ha–1) was 26.6–46.9% higher than that of low-density plots (57,000 plants ha–1) under each N-application rate (Figure 2). This result is consistent with the finding for willow, where a plant density of 20,000 plants ha–1 resulted in a higher yield than a density of 15,000 plants ha–1 (Wilkinson et al., 2007). Plant density can also influence vegetation coverage and measured vegetation indices and, thus, affects sensor-based N predictions (Yao et al., 2015). In addition, as the plant population or density increases, vegetation coverage also increases, and the by-plot coefficient of variation decreases (Supplementary Table 4; Arnall et al., 2006), thus the effect of plant density on the YP0 and RIHarvest predictions was assessed. The combined year-density fitting curves showed a more precise prediction of YP0 than the individual ones, with the R2 value increasing by 5.62–15.56% (Table 3 and Figure 3), suggesting that plant density would affect sensor readings, and higher plant densities resulted in higher sensor values; however, plant density had no effect on YP0 predictions. The validation result of the YP0 and RIHarvest predictions, at a moderate plant density (87,500 plants ha–1), confirmed the possibility of applying the estimation model to various densities (Figure 5), which is consistent with previous research on rice (Xue et al., 2014).
Optimum timing for making accurate YP0 and RIHarvest predictions
The growth stage is an important factor in predicting YP0 and RIHarvest by canopy sensors (Yao et al., 2012; Bijay-Singh et al., 2015). The NDVI and RVI had a significant relationship with YP0, but the relationship was not stable across different stages (Table 3), which was similar to that for rice, where NDVI and RVI could explain at most 50% of the aboveground biomass variability due to interference from soil and water background in the early growth stages (Gnyp et al., 2014). The totally poor accuracy of the YP0 prediction model observed under low density relative to that observed at high density was partly due to the relatively lower plant density and stronger soil background interference in the growth stages (Table 3; Cao et al., 2015). At the rosette stage, the accuracy of the YP0 prediction increased for both years and densities, and the R2 was significantly higher than that in other growth stages. However, at later stages, the relationship seemed weak, as the plant canopy began to close and the sensor became saturated at this stage and could not make satisfactory predictions (Ali et al., 2014; Ji et al., 2017). Thus, the rosette stage was the most appropriate stage for YP0 estimation.
Similarly, the RIHarvest prediction was variable across stages (Table 4). For both the NDVI- and RVI-based RIHarvest prediction models, accuracy was relatively low at the 5–6 true-leaf stage for the possible effect of input N had not yet manifested. At later growth stages, the R2 of the RIHarvest prediction model increased by over 90.32–150.00% that of the 5–6 true-leaf stage in experimental years. However, sensor measurements at the harvest stage were not conducted, since it is not desirable to apply N at this stage of growth (Xue et al., 2014). That is consistent with the results of Lofton et al. (2012b) for sugarcane, where a short interval after fertilization was not suitable for estimating the RIHarvest of cane tonnage and sugar yield, but the RINDVI at 4 and 5 weeks after fertilization could capture changes in RIHarvest (Lofton et al., 2012b). Therefore, the rosette stage represented the optimum stage for conducting RIHarvest prediction, and this period was also ideal for topdressing N if needed.
Conclusion
The development of a sensor-based N-management strategy can provide an effective tool for site-specific topdressing recommendations. It was hypothesized that the GreenSeeker sensor could be used for in situ N fertilizer management and topdressing recommendation of bok choy. Through the three-year field experiment, it was confirmed that the active canopy sensor could be used to reliably estimate the YP0 and RIHarvest of bok choy at the rosette stage, and the RVI functioned better than the NDVI. In addition, the across-years/densities models and the validation results confirmed the potential of the sensor-based model to be applied to different plant densities. A practical and environmentally friendly N management strategy for bok choy in the Taihu Lake region is proposed, and it consists of using 45 kg N ha–1 from manure as basal N fertilizer and a 112 kg N ha–1 split-applied at the transplanting and 5–6 true-leaf stage, at 30 and 40% of the total. The remaining N should be based on the optical sensor prediction at the rosette stage. According to our estimation, a reduction of 1/5–1/3 N can be achieved by using the sensor-based approach. This strategy can improve the NUE of bok choy, is more suitable for practical applications, and has the potential to contribute to the sustainable development of vegetable crops. The current experiment represents an important field validation for the development and implementation of vegetable N-management strategies but was conducted with a limited site-year design, and NFOA parameters warrant optimization and testing with more data in future work. Further work is needed to validate the fertilizer reduction potential in on-farm applications and to explore its applicability with more site-year data.
Data availability statement
The raw data supporting the conclusions of this article will be made available by the authors, without undue reservation.
Author contributions
WS and JM conceived and designed the experiments. RJ performed the experiments and wrote the manuscript. JM and YW analyzed the data. JM contributed to the reagents, materials, and analysis tools. HZ revised the manuscript. All authors contributed to the article and approved the submitted version.
Funding
This work was supported by the National Natural Science Foundation of China (31872185) and the Enterprise Cooperation Projects (Am20210407RD).
Conflict of interest
The authors declare that the research was conducted in the absence of any commercial or financial relationships that could be construed as a potential conflict of interest.
Publisher’s note
All claims expressed in this article are solely those of the authors and do not necessarily represent those of their affiliated organizations, or those of the publisher, the editors and the reviewers. Any product that may be evaluated in this article, or claim that may be made by its manufacturer, is not guaranteed or endorsed by the publisher.
Supplementary material
The Supplementary Material for this article can be found online at: https://www.frontiersin.org/articles/10.3389/fpls.2022.951181/full#supplementary-material
References
Adams, C., Thapa, S., and Kimura, E. (2019). Determination of a plant population density threshold for optimizing cotton lint yield: a synthesis. Field Crop. Res. 230, 11–16. doi: 10.1016/j.fcr.2018.10.005
Ali, A. M., Ibrahim, S. M., and Singh, B. (2020). Wheat grain yield and nitrogen uptake prediction using at Leaf and GreenSeeker portable optical sensors at jointing growth stage. Inform. Process. Agriculture 7, 375–383. doi: 10.1016/j.inpa.2019.09.008
Ali, A. M., Thind, H. S., Varinderpal, S., and Bijay, S. (2014). A framework for refining nitrogen management in dry direct-seeded rice using Greenseeker™ optical sensor. Comput. Electron. Agr. 110, 114–120. doi: 10.1016/j.compag.2014.10.021
Arnall, D. B., Raun, W. R., Solie, J. B., Stone, M. L., Johnson, G. V., Girma, K., et al. (2006). Relationship between coefficient of variation measured by spectral reflectance and plant density at early growth stages in winter wheat. J. Plant Nurt. 29, 1983–1997. doi: 10.1080/01904160600927997
Barker, D. W., and Sawyer, J. E. (2010). Using active canopy sensors to quantify corn nitrogen stress and nitrogen application rate. Agron J. 102, 964–971. doi: 10.2134/agronj2010.0004
Bijay-Singh, B., Varinderpal-Singh, V., Jaspreet Purba, J., Purba, R. K., Sharma, R. K., Sharma, M. L., et al. (2015). Site-specific fertilizer nitrogen management in irrigated transplanted rice (Oryza sativa) using an optical sensor. Precision Agric. 16, 455–475. doi: 10.1007/s11119-015-9389-6
Burns, I. G. (2006). Assessing N fertiliser requirements and the reliability of different recommendation systems. Acta Hort. 700, 35–48. doi: 10.17660/ActaHortic.2006.700.2
Cao, Q., Miao, Y. X., Feng, G. H., Gao, X. W., Li, F., Liu, B., et al. (2015). Active canopy sensing of winter wheat nitrogen status: an evaluation of two sensor systems. Comput. Electron. Agr. 112, 54–67. doi: 10.1016/j.compag.2014.08.012
Chen, Q., Zhang, H. Y., Zhang, X. S., Li, X. L., and Liebig, H. P. (2006). Field application of N-expert system on N recommendation of autumn spinach (in Chinese with English abstract). Acta Agriculturae Boreali-Sinica 04, 128–134. doi: 10.1007/s11769-002-0038-4
Dobermann, A., Witt, C., Abdulrachman, S., Gines, H. C., Nagarajan, R., Son, T. T., et al. (2003). Soil fertility and indigenous nutrient supply in irrigated rice domains of Asia. Agron. J. 95, 913–923. doi: 10.2134/agronj2003.0913
Dunn, B., Shrestha, A., and Goad, C. (2015). Use of nondestructive sensors to quantify ornamental kale nitrogen status. J. Plant Nurt. 39, 1123–1130. doi: 10.1080/01904167.2015.1069342
Gianquinto, G., Orsini, F., Sambo, P., and D’Urzo, M. P. (2011). The use of diagnostic optical tools to assess nitrogen status and to guide fertilization of vegetables. HortTechnology 21, 287–292. doi: 10.1016/j.scienta.2011.03.038
Gnyp, M. L., Miao, Y. X., Yuan, F., Ustin, S. L., Yu, K., Yao, Y. K., et al. (2014). Hyperspectral canopy sensing of paddy rice aboveground biomass at different growth stages. Field Crop Res. 155, 42–55. doi: 10.1016/j.fcr.2013.09.023
Gong, Z. T. (1999). Chinese Soil Taxonomy: Theory Approaches and Application. Beijing: China Science Press, 160–165.
Heimler, D., Vignolini, P., Dini, M. G., Vincieri, F. F., and Romani, A. (2006). Antiradical activity and polyphenol composition of local brassicaceae edible varieties. Food Chem. 99, 464–469. doi: 10.1016/j.foodchem.2005.07.057
Ji, R. T., Min, J., Wang, Y., Cheng, H., Zhang, H. L., and Shi, W. M. (2017). In-season yield prediction of cabbage with a hand-held active canopy sensor. Sensors 17:2287. doi: 10.3390/s17102287
Jin, J. Y., and Jiang, C. (2002). Spatial variability of soil nutrients and sitespecific nutrient management in the P.R. China. Comput. Electron. Agr. 36, 165–172. doi: 10.1016/S0168-1699(02)00099-6
Johnson, G. V., and Raun, W. R. (2003). Nitrogen response index as a guide to fertilizer management. J. Plant Nurt. 26, 249–262. doi: 10.1081/PLN-120017134
Jones, C. L., Weckler, P. R., Maness, N. O., Jayasekara, R., Stone, M. L., and Chrz, D. (2007). Remote sensing to estimate chlorophyll concentration in spinach using multi-spectral plant reflectance. Tasabe 50, 2267–2273. doi: 10.13031/2013.24079
Lama, A. D., Klemola, T., Saloniemi, I., Niemela, P., and Vuorisalo, T. (2018). Factors affecting genetic and seed yield variability of Jatropha curcas (L.) across the globe: a review. Energy Sustain Dev. 42, 170–182. doi: 10.1016/j.esd.2017.09.002
Li, B., Bi, Z. C., and Xiong, Z. Q. (2017). Dynamic responses of nitrous oxide emission and nitrogen use efficiency to nitrogen and biochar amendment in an intensified vegetable field in southeastern China. GCB Bioenergy 9, 400–413. doi: 10.1111/gcbb.12356
Li, F., Jiang, X., Wang, X. F., Zhang, X. Q., Zheng, J. J., and Zhao, Q. J. (2013). Estimating grassland aboveground biomass using multitemporal MODIS data in the West Songnen Plain, China. J. Appl. Remote Sens. 7:073546. doi: 10.1117/1.JRS.7.073546
Li, F., Miao, Y., Zhang, F., Cui, Z., Li, R., Chen, X., et al. (2009). In-season optical sensing improves nitrogen-use efficiency for winter wheat. Soil Sci. Soc. Am. J. 73, 1566–1574. doi: 10.2136/sssaj2008.0150
Liu, Z. H., Jiang, L. H., Li, X. L., Hardter, R., Zhang, W. J., Zhang, Y. L., et al. (2008). Effect of N and K fertilizers on yield and quality of greenhouse vegetable crops. Pedosphere 18, 496–502. doi: 10.1016/S1002-0160(08)60040-5
Lofton, J., Tubana, B. S., Kanke, Y., Teboh, J., and Viator, H. (2012a). Predicting sugarcane response to nitrogen using a canopy reflectance-based response index. Agron J. 104, 106–113. doi: 10.2134/agronj2011.0254
Lofton, J., Tubana, B. S., Kanke, Y., Teboh, J., Viator, H., and Dalen, M. (2012b). Estimating sugarcane yield potential using an in-season determination of normalized difference vegetative index. Sensors 12, 7529–7547. doi: 10.3390/s120607529
Lowder, S. K., Skoet, J., and Raney, T. (2016). The number, size, and distribution of farms, smallholder farms, and family farms worldwide. World Dev. 87, 16–29. doi: 10.1016/j.worlddev.2015.10.041
Lukina, E. V., Freeman, K. W., Wynn, K. J., Thomason, W. E., Mullen, R. W., Stone, M. L., et al. (2001). Nitrogen fertilization optimization algorithm based on in-season estimates of yield and plant nitrogen uptake. J. Plant Nurt. 24, 885–898. doi: 10.1081/pln-100103780
Ma, B. L., Subedi, K. D., and Zhang, T. Q. (2007). Pre-sidedress nitrate test and other crop-based indicators for fresh market and processing sweet corn. Agron J. 99, 174–183. doi: 10.2134/agronj2006.0028
Olfs, H. W., Blankenau, K., Brentrup, F., Jasper, J., Link, A., and Lammel, J. (2005). Soil- and plant-based nitrogen-fertilizer recommendations in arable farming. J. Plant Nutr. Soil Sc. 168, 414–431. doi: 10.1002/jpln.200520526
Padilla, F. M., Gallardo, M., Pena-Fleitas, M. T., de Souza, R., and Thompson, R. B. (2018). Proximal optical sensors for nitrogen management of vegetable crops: a review. Sensors 18:2083. doi: 10.3390/s18072083
Raun, W. R., Solie, J. B., Johnson, G. V., Stone, M. L., Mullen, R. W., Freeman, K. W., et al. (2002). Improving nitrogen use efficiency in cereal grain production with optical sensing and variable rate application. Agron J. 94, 815–820. doi: 10.2134/agronj2002.0815
Raun, W. R., Solie, J. B., Stone, M. L., Martin, K. L., Freeman, K. W., Mullen, R. W., et al. (2005). Optical sensor-based algorithm for crop nitrogen fertilization. Commun. Soil Sci. Plant. 36, 2759–2781. doi: 10.1080/00103620500303988
Ren, T., Wang, J. G., Chen, Q., Zhang, F. S., and Lu, S. C. (2014). The effects of manure and nitrogen fertilizer applications on soil organic carbon and nitrogen in a high-input cropping system. PLoS One 9:e97732. doi: 10.1371/journal.pone.0097732
Samborski, S. M., Tremblay, N., and Fallon, E. (2009). Strategies to make use of plant sensors-based diagnostic information for nitrogen recommendations. Agron J. 101, 800–816. doi: 10.2134/agronj2008.0162Rx
Schmidt, J. P., Dellinger, A. E., and Beegle, D. B. (2009). Nitrogen recommendations for corn: an on-the-go sensor compared with current recommendation methods. Agron J. 101, 916–924. doi: 10.2134/agronj2008.0231x
Shi, W. M., Yao, J., and Yan, F. (2009). Vegetable cultivation under greenhouse conditions leads to rapid accumulation of nutrients, acidification and salinity of soils and groundwater contamination in south-eastern China. Nut. Cycl. Agroecosys 83, 73–84. doi: 10.1007/s10705-008-9201-3
Song, X. Z., Zhao, C. X., Wang, X. L., and Li, J. (2009). Study of nitrate leaching and nitrogen fate under intensive vegetable production pattern in northern China. C. R. Biol. 332, 385–392. doi: 10.1016/j.crvi.2008.11.005
Tan, M. L., Robinson, G. M., Li, X. B., and Xin, L. J. (2013). Spatial and temporal variability of farm size in China in context of rapid urbanization. Chinese Geogr. Sci. 23, 607–619. doi: 10.1007/s11769-013-0610-0
Teal, R. K., Tubana, B., Girma, K., Freeman, K. W., Arnall, D. B., Walsh, O., et al. (2006). In-season prediction of corn grain yield potential using normalized difference vegetation index. Agron J. 98, 1488–1494. doi: 10.2134/agronj2006.0103
Tremblay, N., Wang, Z. J., and Cerovic, Z. G. (2011). Sensing crop nitrogen status with fluorescence indicators. a review. Agron Sustain Dev. 32, 451–464. doi: 10.1007/s13593-011-0041-1
Tremblay, N., Wang, Z. J., Ma, B. L., Belec, C., and Vigneault, P. (2009). A comparison of crop data measured by two commercial sensors for variable-rate nitrogen application. Precis Agric. 10, 145–161. doi: 10.1007/s11119-008-9080-2
Wilkinson, J. M., Evans, E. J., Bilsborrow, P. E., Wright, C., Hewison, W. O., and Pilbeam, D. J. (2007). Yield of willow cultivars at different planting densities in a commercial short rotation coppice in the north of England. Biomass Bioenerg. 31, 469–474. doi: 10.1016/j.biombioe.2007.01.020
Xia, T. T., Miao, Y. X., Wu, D. L., Shao, H., Khosla, R., and Mi, G. H. (2016). Active optical sensing of spring maize for in-season diagnosis of nitrogen status based on nitrogen nutrition index. Remote Sens. 8:605. doi: 10.3390/rs8070605
Xue, L. H., Li, G. H., Qin, X., Yang, L. Z., and Zhang, H. L. (2014). Topdressing nitrogen recommendation for early rice with an active sensor in south China. Precis Agric. 15, 95–110. doi: 10.1007/s11119-013-9326-5
Yao, H. S., Zhang, Y. L., Yi, X. P., Hu, Y. Y., Luo, H. H., Gou, L., et al. (2015). Plant density alters nitrogen partitioning among photosynthetic components, leaf photosynthetic capacity and photosynthetic nitrogen use efficiency in field-grown cotton. Field Crop. Res. 184, 39–49. doi: 10.1016/j.fcr.2015.09.005
Yao, Y. K., Miao, Y. X., Huang, S. Y., Gao, L., Ma, X. B., Zhao, G. M., et al. (2012). Active canopy sensor-based precision N management strategy for rice. Agron Sustain Dev. 32, 925–933. doi: 10.1007/s13593-012-0094-9
Zanão Júnior, L. A., Lana, R. M. Q., and Sá, K. A. (2005). Split forms and sources of nitrogen fertilization for the flowering white cabbage production. Hortic Bras. 23, 965–969.
Zhang, M., Chen, Z. Z., Li, Q. L., Fan, C. H., and Xiong, Z. Q. (2016). Quantitative relationship between nitrous oxide emissions and nitrogen application rate for a typical intensive vegetable cropping system in southeastern China. CLEAN-Soil Air Water 44, 1725–1732. doi: 10.1002/clen.201400266
Zhang, Y. J., Chen, G. P., Dong, T. T., Pan, Y., Zhao, Z. P., Tian, S. B., et al. (2014). Anthocyanin accumulation and transcriptional regulation of anthocyanin biosynthesis in purple bok choy (Brassica rapa var. chinensis). J. Agric Food Chem. 62, 12366–12376. doi: 10.1021/jf503453e
Zhou, Z. J., Plauborg, F., Thomsen, A. G., and Andersen, M. N. (2017). A RVI/LAI-reference curve to detect N stress and guide N fertigation using combined information from spectral reflectance and leaf area measurements in potato. Eur. J. Agron. 87, 1–7. doi: 10.1016/j.eja.2017.04.002
Zhu, J. H., Li, X. L., Christie, P., and Li, J. L. (2005). Environmental implications of low nitrogen use efficiency in excessively fertilized hot pepper (Capsicum frutescens L.) cropping systems. Agr. Ecosyst. Environ. 111, 70–80. doi: 10.1016/j.agee.2005.04.025
Zhu, Z. L. (2006). On the methodology of recommendation for application rate of chemical fertilizer nitrogen to crops (in Chinese with English abstract). Plant Nutr. Fert. Sci. 12, 1–4. doi: 10.1360/aps040178
Keywords: active canopy sensor, bok choy, N response index, N topdressing strategy, yield potential
Citation: Ji R, Shi W, Wang Y, Zhang H and Min J (2022) Development of a sensor-based site-specific N topdressing algorithm for a typical leafy vegetable. Front. Plant Sci. 13:951181. doi: 10.3389/fpls.2022.951181
Received: 23 May 2022; Accepted: 05 August 2022;
Published: 26 August 2022.
Edited by:
Stefania Astolfi, Tuscia University, ItalyReviewed by:
Nasim Ahmad Yasin, University of the Punjab, PakistanNazim Hussain, Independent Researcher, Sharjah, United Arab Emirates
Copyright © 2022 Ji, Shi, Wang, Zhang and Min. This is an open-access article distributed under the terms of the Creative Commons Attribution License (CC BY). The use, distribution or reproduction in other forums is permitted, provided the original author(s) and the copyright owner(s) are credited and that the original publication in this journal is cited, in accordance with accepted academic practice. No use, distribution or reproduction is permitted which does not comply with these terms.
*Correspondence: Ju Min, am1pbkBpc3Nhcy5hYy5jbg==