 Sean Fenstemaker
 Jin Cho1
 Jack E. McCoy
 Kristin L. Mercer
 David M. Francis
94% of researchers rate our articles as excellent or good
Learn more about the work of our research integrity team to safeguard the quality of each article we publish.
Find out more
ORIGINAL RESEARCH article
Front. Plant Sci. , 28 July 2022
Sec. Technical Advances in Plant Science
Volume 13 - 2022 | https://doi.org/10.3389/fpls.2022.947538
This article is part of the Research Topic Wild Plant Genetic Resources: A Hope for Tomorrow View all 9 articles
Crop wild relatives have been used as a source of genetic diversity for over one hundred years. The wild tomato relative Solanum galapagense accession LA1141 demonstrates the ability to tolerate deficit irrigation, making it a potential resource for crop improvement. Accessing traits from LA1141 through introgression may improve the response of cultivated tomatoes grown in water-limited environments. Canopy temperature is a proxy for physiological traits which are challenging to measure efficiently and may be related to water deficit tolerance. We optimized phenotypic evaluation based on variance partitioning and further show that objective phenotyping methods coupled with genomic prediction lead to gain under selection for water deficit tolerance. The objectives of this work were to improve phenotyping workflows for measuring canopy temperature, mapping quantitative trait loci (QTLs) from LA1141 that contribute to water deficit tolerance and comparing selection strategies. The phenotypic variance attributed to genetic causes for canopy temperature was higher when estimated from thermal images relative to estimates based on an infrared thermometer. Composite interval mapping using BC2S3 families, genotyped with single nucleotide polymorphisms, suggested that accession LA1141 contributed alleles that lower canopy temperature and increase plant turgor under water deficit. QTLs for lower canopy temperature were mapped to chromosomes 1 and 6 and explained between 6.6 and 9.5% of the total phenotypic variance. QTLs for higher leaf turgor were detected on chromosomes 5 and 7 and explained between 6.8 and 9.1% of the variance. We advanced tolerant BC2S3 families to the BC2S5 generation using selection indices based on phenotypic values and genomic estimated breeding values (GEBVs). Phenotypic, genomic, and combined selection strategies demonstrated gain under selection and improved performance compared to randomly advanced BC2S5 progenies. Leaf turgor, canopy temperature, stomatal conductance, and vapor pressure deficit (VPD) were evaluated and compared in BC2S5 progenies grown under deficit irrigation. Progenies co-selected for phenotypic values and GEBVs wilted less, had significantly lower canopy temperature, higher stomatal conductance, and lower VPD than randomly advanced lines. The fruit size of water deficit tolerant selections was small compared to the recurrent parent. However, lines with acceptable yield, canopy width, and quality parameters were recovered. These results suggest that we can create selection indices to improve water deficit tolerance in a recurrent parent background, and additional crossing and evaluation are warranted.
Approximately 1.2 billion people worldwide reside in areas with water scarcity, and this number is growing (Food and Agriculture Organization [FAO], 2021 accessed at: https://www.fao.org/land-water/water/drought/en/). In arid regions, population growth and economic development are exhausting renewable but finite water resources (Food and Agriculture Organization [FAO], 2021). Water deficit tolerance is imparted through morphological and physiological traits in plants. Traits used to indicate plant response to water deficit include, but are not limited to, leaf rolling, flower and fruit set, water use efficiency, recovery after re-watering, stomatal conductance, plant survival, leaf water potential, leaf osmotic potential, osmoregulation, transpiration rate, photosynthetic rate, enzymatic activities, pollen viability, and seed germination (Foolad, 2007; Galmés et al., 2011). Mechanical reduction of water loss can be imparted by changes in plant morphology or mechanisms that promote stomatal closure. Morphological traits, such as leaf size, shape, thickness, orientation, reflective capabilities, trichomes, and leaf angle, can modulate physiological response to deficit irrigation (Inoue et al., 1990; Kitaya et al., 1998). Additionally, water deficit stress may influence leaf expansion, osmotic adjustment, biomass partitioning, and stomatal characteristics (Koch et al., 2019; Pardo and VanBuren, 2021). Other tolerance mechanisms may include adjustments of carbon concentration and a reduction of photorespiration, leading to increased water use efficiency (Pardo and VanBuren, 2021). Morphological and physiological responses are often challenging to measure in studies with many treatments or large population sizes because there is a limited window of time to capture a response that is physiologically meaningful and genetically relevant (Smith et al., 2021).
Optimizing strategies to select for water stress tolerance may be a key to successfully exploiting genes from exotic germplasm. Plant canopy temperature has been proposed as a proxy to indicate stress under water deficit (Perera et al., 2020) and may provide an efficient phenotyping alternative to physiological measurements (Grossiord et al., 2020). Therefore, image-based phenotyping may provide an opportunity to increase the precision and throughput of trait measurement. For example, estimates of canopy temperature obtained from images could substitute as a measure of water deficit stress and is potentially a viable trait for the efficient assessment of plant physiological responses. Quantifying the genetic variation associated with specific traits offers a framework to identify and optimize appropriate phenotyping strategies. For plant breeding applications, improving the genetic resolution of trait measurements can increase the relative efficiency of selection procedures on a per cycle, per cost, and per time basis (Heffner et al., 2010).
The foundation of crop improvement is based on genetic variation underlying traits of interest. Previous studies have shown that wild tomato species possess tolerances to predatory insects, excessive moisture, salinity, and water deficit (Rick, 1973). The introgression of genes from wild tomato species that impart tolerance to abiotic stress specifically has been reported from Solanum pimpinellifolium, Solanum peruvianum, Solanum cheesmaniae, Solanum habrochaites, Solanum chmielewskii, and Solanum pennellii (Rick, 1978; Saeed and Fatima, 2021). Introgressions from the wild relative S. pennellii have improved tomato response under water deficit (Dariva et al., 2020). Accessing traits from wild relatives by conventional breeding is challenging because of reproductive barriers and linkage drag (Swarup et al., 2021). A wild tomato species endemic to the Galápagos Islands, Solanum galapagense (Darwin et al., 2003), is a potential donor of abiotic stress tolerance (Brozynska et al., 2016). S. galapagense is adapted to harsh environments, including low moisture and saline coastal habitats (Rick, 1956; Rush and Epstein, 1976; Pailles et al., 2020). The relative merit of a wild accession as a source of tolerance can be determined by using the observations made by collectors in native habitats (Rick, 1973, 1978). S. galapagense accession LA1141 was found growing on the interior walls of a crater on the island of Santiago on the north-facing slope, which received average annual precipitation from 1991 to 2020 of 7.7 cm (World Bank Group, 2021, accessed at: climateknowledgeportal.worldbank.org). The habitat described in the collection notes suggested that LA1141 is adapted to an arid environment (Castro, 1968, accessed at: tgrc.ucdavis.edu/Data/Acc/dataframe.aspx?start=AccSearch.aspx&navstart=nav.html) and is plausibly a suitable candidate to improve cultivated tomatoes through introgression. Introgression of tolerance from wild accessions from the more closely related red-fruited tomato, such as S. galapagense, may have advantages, such as greater recombination and potentially less linkage drag, compared to crosses with a more distantly related, green-fruited wild tomato relative like S. pennellii (Hamlin et al., 2020).
The objectives of this study were to evaluate methods of measuring plant response to water deficit and compare selection strategies to identify germplasm with lower canopy temperature, higher turgidity, higher stomatal conductance, and lower vapor pressure deficit (VPD). Using an inbred backcross strategy (Kabelka et al., 2002; Robbins et al., 2009), we created tomato populations derived from the tolerant donor parent, S. galapagense accession LA1141 (Fenstemaker et al., 2022). This population was used to do the following: (1) Improve and compare phenotyping workflows for measuring canopy temperature based on high throughput image analysis to indicate water deficit tolerance. (2) Associate measures of water deficit stress with single nucleotide polymorphisms (SNPs) to describe the genetic basis of low canopy temperature and high turgidity under water deficit in LA1141. (3) Discover and introgress chromosomal regions contributing to canopy temperature and severity of wilt in regions of the genome derived from accession LA1141. (4) Evaluate phenotypic and genomic-based selection strategies to identify water deficit tolerant progenies and evaluate the recovery of horticultural traits from an elite commercial parent in tolerant selections. Results from this study can be directly used to enhance the introgression of water deficit tolerance from wild relatives of tomato.
An inbred backcross (IBC) population was created using S. galapagense S.C. Darwin and Peralta (formerly Lycopersicon cheesmaniae f. minor) (Hook. f) C.H.Mull.) accession LA1141, as a source of traits for tomato improvement, and Solanum lycopersicum L. (formerly Lycopersicon esculentum Mill) OH8245 (Berry et al., 1991), as the recurrent parent (Fenstemaker et al., 2022). The IBC population was derived from an initial hybridization of S. galapagense LA1141 as the female parent and OH8245 as the male. BC1 progenies were used as females for further crosses to OH8245. The C.M. Rick Tomato Genetic Resources Center, University of California, Davis, provided the seed for LA1141. During these studies, IBC selections were further inbred to BC2S5. Selected BC2S5 progenies were advanced based on BC2S3 phenotypic values, genomic estimated breeding values (GEBVs), and random selection.
Seedling care for greenhouse and field trials followed the same protocol. Seeds were sown in 288-cell trays with a cell volume of 13 mL. Greenhouse temperatures were set to 27°C during the day and 25°C at night with a 16 h photoperiod. Photosynthetically active radiation (PAR) was supplied by natural sunlight, 1,000-W metal-halide lamps (Multi-Vapor® GE Lighting, East Cleveland, OH, United States), and 1,000-W high-pressure sodium lamps (Ultra Sun® Sunlight Supply, Vancouver, WA, United States) with a target threshold of 250 m–2 s–1 for natural sunlight before initiating artificial lighting to maintain light levels. PAR values in the greenhouse ranged from 250 to 637 μmol m–2 s–1 with an average of 391.4 μmol m–2 s–1. Fertilization was applied using a 20-20-20 fertilizer (20% N, 20% P2O5, and 20% K2O) (Jack’s professional All-Purpose Fertilizer, JR Peters INC., Allentown, PA, United States) and delivered at a concentration of 200 mg L–1 twice per week. For greenhouse evaluations, plants with three to five expanded leaves were transferred to 3.7-L plastic containers, filled with PRO-MIX (Premier Horticulture, Quakerstown, PA, United States), and spaced 30 cm apart on a greenhouse bench. Transplants in 3.7-L plastic containers were automatically irrigated four times per day, for 6 min, at a volume of 220 mL per irrigation cycle.
Greenhouse trials were conducted to evaluate water-deficit stress in the LA1141 and OH8245 parents, the segregating LA1141 × OH8245 BC2S3 families, and selections were advanced to the BC2S5 generation using phenotypic, genomic, and combined selection strategies or randomly chosen BC2S3 families advanced to the BC2S5 generation. The LA1141 and OH8245 parents were evaluated using a randomized complete block design with three blocks and three replicates within each block. The segregating BC2S3 families were evaluated in augmented designs as single replicates, with 36 replicates of each LA1141 and OH8245 parent distributed in a grid-like pattern corresponding to the row and column blocks across environmental gradients established between cooling pads, fans, and differences in solar radiation. The LA1141 and OH8245 parents were both used as over-replicated controls to correct for environmental variation in the greenhouse (Federer and Raghavarao, 1975; Bojacá et al., 2009). The BC2S3 families were evaluated in the greenhouse twice, in a summer environment and a fall environment. The BC2S5 advanced lines selected randomly or using phenotypic, genomic, and combined strategies were evaluated in an augmented design with three blocks, and a single replicate within each block. In the BC2S5 evaluation, each LA1141 and OH8245 parent was replicated nine times in each unique row by column spatial designation to account for environmental variation in the greenhouse as described above.
Water deficit treatments followed the same protocol in all greenhouse evaluations. When the plants reached the growth stage of six to eight expanded leaves in 3.7-L containers, irrigation was simultaneously withheld on all genetic treatments, and plants were evaluated daily, and the first evaluation happened at saturation. Pots were weighed at saturation, after 72 h of deficit irrigation, and at 144 h to estimate evapotranspiration. A Decagon GS3 sensor (Decagon Devices, Pullman, WA, United States) was calibrated for soilless potting media and used to measure volumetric water content (VWC) at saturation. The Decagon GS3 sensor utilized capacitance probes that measure real dielectric permittivity values and are generally preferred for water deficit evaluations compared to instruments that use time-domain reflectometry to measure soil water content changes in greenhouse pot experiments (Sharma et al., 2017). Estimates of VWC and gravimetric evaluations confirmed that starting saturation was even and consistent at the beginning of each experiment.
The leaf turgor status of individual genetic treatments was assessed daily during the dry-down phase on a whole plant basis using a visual turgor index as an estimation of whole plant wilt severity. Turgor index ratings ranged from 1 to 5 (5 = turgid, 4 = soft to the touch, 3 = beginning to wilt, 2 = wilted with complete loss of turgor, and 1 = dead), consistent with previous studies (Waterland et al., 2010). The turgor index was used to rate whole plant wilt status with higher scores indicating higher turgidity. Canopy temperature was measured with a handheld infrared thermometer (IRT) (Zhuhai JiDa Huapu Instrument Co., Hong Kong) and with an image-based methodology (see section High-throughoutput thermal image analysis). Canopy temperature was estimated with IRT by measuring the surface temperature (°C) of two fully expanded leaves per plant. IRT-estimated canopy temperature was monitored daily under ambient environmental conditions in the greenhouse between 10:00 and 12:00. The IRT was calibrated against a standard laboratory thermometer using a water bath calibration method (Horwitz, 1999). Additionally, the IRT was set to a constant emissivity of 0.97 for measurements of plant canopy consistent with previous studies (Kustas et al., 2012). Image-based whole plant canopy temperature was estimated using a FLIRONE GEN3 iOS thermal camera (FLIR Systems Wilsonville, OR, United States) and calibrated relative to water baths at a known temperature (Horwitz, 1999). The thermal camera was also set to a constant emissivity of 0.97. Images were captured against a standardized background using a 50 cm × 76 cm black polystyrene core foam board (Elmer’s Westerville, OH, United States) at 1 m; extraction of temperature data from images is further detailed in section “High-throughput thermal image analysis.” The IRT measurements and thermal images were recorded simultaneously.
The physiological response of LA1141, OH8245, and BC2S5 advanced selections were assessed daily during the dry-down phase and measured on a single, upper, and fully expanded leaf using the LI-600 porometer/fluorometer (LI-COR Biosciences, Lincoln, NE, United States). Measurements of stomatal conductance (gsw), vapor pressure deficit (VPD), and light-adapted chlorophyll fluorescence (PhiPS2) were taken under ambient conditions in the greenhouse between 10:00 and 12:00.
Phenotypic data collected on LA1141 and OH8245 plants grown under water deficit were analyzed as a fixed-effects model using the function “lm” in the R core package version 4.0.3 (R Core Team, 2020). The model Yij = μ + genotypei + Blockj + εij: where Yij was the response variable, μ was the mean response of the parents, genotypei represented the replicated LA1141 donor parent (N = 9) and OH8245 recurrent parent (N = 9), Blockj was used to estimate variation in the greenhouse across the air movement gradient established between cooling pads and fans, and εij was the associated experimental error. Factors with significant p-values (p < 0.05) were analyzed using Tukey’s Honest Significant Difference test, with the “HSD.test” function in the R package Agricolae (De Mendiburu, 2017).
The random-effects model, Yij = μ + genotypei + Rowij + Columnij + εij, was used to evaluate the BC2S3 families and over-replicated parental controls. The analysis was conducted using the “lmer” function in the R package lme4 (Bates et al., 2015). For this analysis, Yij was the response variable, genotypei represented 160 individuals from the population as single replicates, and 36 replicates each of OH8245 and LA1141 as over-replicated controls. The environmental terms Rowij and Columnij were used to capture spatial variation within the greenhouse as described above, and εij was the associated error. Data were analyzed in the R core package version 4.0.3 (R Core Team, 2020). The significance of the main effects in these tests was determined by comparing a fully parameterized model to a model with a single term dropped using a likelihood ratio test based on a chi-square distribution (Snijdgers and Bosker, 2012). A significant p-value was interpreted as evidence that the parameter dropped was important to the fit of the model, and Bayesian Information Content (BIC) values were used to confirm that the full model provided a better fit to confirm the significance of genetic and environmental terms.
The germplasm screen of BC2S3 families was repeated twice, once in July and once in November. Best Linear Unbiased Predictors (BLUPs) were extracted for genetic treatments in the model using the “ranef” function in lme4 (Bates et al., 2015). BLUP values for canopy temperature and turgor response variables represented the spatially adjusted values for each BC2S3 family in each germplasm screen. The BLUPs estimated for canopy temperature and plant turgidity and were then averaged across the two experiments and used for the quantitative trait loci (QTL) mapping study and for developing phenotypic and genomic selection indices. Similarly, the random model described above was used to evaluate and analyze BC2S5 progenies in the selection strategies validation experiment. For this analysis, Yij was the response variable, genotypei represented 30 individuals from the population replicated three times. The LA1141 and OH8245 parents were each replicated nine times. Rowij and Columnij were used to capture environmental variation as mentioned previously.
Thermal images were captured with a FLIRONE GEN3 iOS thermal camera as described above. Images were analyzed in a workflow that entailed extracting radiometric data as an integer matrix using the “readflirJPG” function in the R package Thermimage (Tattersall, 2021). The function “raw2temp” was used to convert the raw values obtained from the binary thermal image into estimated temperature with the equation (Eq. 1):
Where PB was Planck’s constant B, the log was the base 10 logarithm, PR1 was Planck’s constant R1, PR2 was Planck’s constant R2, raw was a 16-bit encoded value associated with the radiance hitting the thermal camera sensor, PO was Planck’s constant O, PF was Planck’s constant F, and –273.15 was the conversion of temperature from K to °C. The Planck constant values were calibration constants that are specific to each FLIR thermal camera and were extracted using the software ExifTool (Harvey, 2020) as implemented in the R package “Thermimage” using the function “flirsettings (camvals = -*Planck*)”. The emissivity of the plant object, atmospheric temperature, and temperature of the ambient surroundings were extracted from the sensor on the FLIRONE GEN3 iOS thermal camera and were used to estimate plant canopy temperature.
Raw files with pixel values corresponding to the plant canopy surface temperature were then imported into the open-source software ImageJ (Java-based distribution Fiji) (Schindelin et al., 2012) for image processing and analysis. A collection of ImageJ functions and macros called “ThermImageJ” (Tattersall, 2019) was used to import data extracted from the thermal images, isolate regions of interest (ROI), and estimate plant canopy temperature. Histogram-based thresholding algorithms were accessed in the core ImageJ package using the steps “Image” > “Adjust” > “Threshold”. Image thresholding was performed to isolate the plant canopy ROI from the background of the image and employed the labeling operator Tr which labeled a pixel in the image only if its intensity g exceeded a specific threshold value Tmin (Eq. 2):
Where 1 was the binary pixel label denoting the foreground value and g was the pixel intensity at the vector x (Prodanov and Verstreken, 2012). Tmin values can be determined using specific thresholding methods and we used “MEAN” described in Glasbey (1993). The “MEAN” method was chosen for our workflow because the proportion of total phenotypic variance attributed to genetic factors associated with canopy temperature was higher than the other tested thresholding methods (Supplementary Table 1). The “MEAN” thresholding algorithm was applied following these steps: “MEAN” > “Apply” > “set to NaN”, resulting in a 32-bit image with the plant canopy ROI isolated from the image background. We estimated canopy temperature from our final image following the steps: “Analyze” > “Measure”, which calculated the average estimated surface temperature of the plant canopy remaining in the image. Macros were written to automate and standardize the processes described above and to facilitate batch image analysis.
Phenotypic measurements for selected BC2S5 progenies were compared using linear regression and variance partitioning to identify traits with higher genetic variance. The slope of the regression line was used to estimate the relationship of thermal image estimated canopy temperature to IRT, turgor ratings, and physiological traits measured with the LI-600. The random model described in section 3.2, above, was used to estimate the proportions of variance due to genetics (genotypei), environmental factors (Rowij and Columnij), and experimental error (εij) in the models. The proportions of environmental and genetic variance provided an estimate of the broad-sense heritability and repeatability of each trait (Falconer and Mackay, 1996).
Genomic DNA was isolated from fresh, young leaf tissue from the 160 BC2S3 families and parental lines using a modified CTAB method (Fenstemaker et al., 2022). The 157 polymorphic SNP markers and linkage map construction were described previously (Fenstemaker et al., 2022). Briefly, a genetic linkage map was constructed using the R/qtl package version 1.47-9 in the R statistical software environment version 4.0.3 (Broman et al., 2003; Shannon et al., 2013; R Core Team, 2020) based on the LA1141 × OH8245 BC2S3 population (Fenstemaker et al., 2022). Marker data corresponding to the LA1141 × OH8245 BC2S3 was deposited in Zenodo.1 Map construction with the BC2S3 population was a compromise that provided genetic structure, captured a high percentage of elite parent background underlying important agronomic and horticultural traits, and offered opportunities to fix desirable donor alleles in further generations.
The QTL analysis was conducted with composite interval mapping (Zeng, 1994) using the “cim” function in the R/qtl package. Analysis was performed using a 2 centimorgan (cM) step, one marker selected as a cofactor, and a marker window set to 40 cm. The marker cofactor number and window size was due to limited recombination in the BC2S3 population. The Haley Knott regression (Haley and Knott, 1992) method was used for QTL detection. A significance threshold of LOD = 3.3 for both canopy temperature and plant turgor was determined by resampling the data (α = 0.05, n = 1,000; Churchill and Doerge, 1994). A cut-off of LOD = 2.4 significance threshold corresponded to p < 0.01. Genetic effects were estimated as differences between phenotypic averages expressed as regression coefficients using the “fitqtl” function with the argument “get.ests = TRUE” and “dropone = FALSE” in the R/qtl package. The percentage of phenotypic variance explained was estimated using the “fitqtl” function with the argument “dropone = TRUE” in the R/qtl package.
Genomic estimated breeding values were calculated using ridge regression (RR) as implemented in the rrBLUP package in the R statistical software environment version 4.0.3 (Endelman, 2011; R Core Team, 2020). The RR computations were performed using the function “mixed.solve” in rrBLUP. Markers were considered as random effects associated with plant turgor and canopy temperature response variables. The estimated marker effects were used to calculate the GEBV of each LA1141 × OH8245 BC2S3 family. The equation used was: GEBV = X × MV: where GEBV was the vector of dimension (n, 1) containing the GEBVs for n families, X (n, m) was the matrix of scores for m markers and n families, and MV (m, 1) was a vector of marker effects for the m markers. GEBVs estimated from RR were used for genomic selection.
The phenotypic selection was based on the BC2S3 family visual ratings corresponding to plant turgor and canopy temperature values estimated using image-based methods. Phenotypic values were expressed as BLUPs estimated from the population screens described in section “High Throughput Phenotyping Using Thermal Images.” The BLUP values corresponding to each trait were sorted numerically and assigned a rank. The BC2S3 family with the highest value associated with plant turgor was ranked 1 (best), and the family with the lowest value associated with canopy temperature was ranked 1 (best). Plant turgor and canopy temperature BLUP ranks were summed into a single value that resulted in a rank-sum list. Top-ranking progenies (N = 10) were chosen according to this simplified multi-trait index (MTI). The selection intensity K was defined in standard deviation (SD) units relative to the mean. All phenotypic selections for plant turgor were made at a selection intensity of K = 1. Three canopy temperature phenotypic selections were made at a selection intensity of K = 2, and seven were made at a selection intensity of K = 1.
The genomic selection model mentioned above was used to calculate GEBVs for each trait. The GEBVs were sorted numerically and assigned a rank as described above. Canopy temperature GEBV and plant turgor GEBV ranks were summed into a single value used as an MTI as described in the section above, and top progenies were chosen based on this GS selection index. The top six selections for plant turgor GEBV were made at K = 2, with four additional selections at K = 1. All genomic selections for canopy temperature were made at K = 2. The final groups of selections consisted of phenotypic selections (Pheno, N = 9), genomic selections (GS, N = 8), randomly selected (Random, N = 10) families, and a group that was co-selected as top-ranking phenotypic and genomic selections (Pheno + GS, N = 3). These groups consisted of the top 10 ranking phenotypic selections, top 10 ranking genomic selections, and 10 randomly selected families totaling 30 progenies for further inbreeding.
The prediction abilities of the GS models were evaluated using cross-validation (theoretical accuracy) and empirical validation (realized accuracy). Cross-validation was conducted using a leave-one-out strategy (Liabeuf et al., 2018) on the BC2S3 families, which were considered our training population. Empirical validation was conducted using greenhouse performance data for plant turgor and canopy temperature measured on advanced BC2S5 lines derived from inbreeding selected BC2S3 families from the training population. The abilities of GS models to predict performance were estimated by two different models. First, the cross-validation prediction accuracy (rg) was evaluated using the Pearson coefficient of the correlations between GEBVs and phenotypic BLUPs in the BC2S3 families. Second, empirical validation rg was evaluated using the Pearson coefficient of the correlations between the BC2S3 family GEBV and phenotypic BLUPs in the advanced BC2S5 selections. Additionally, the percentage of co-selection (% co-selection) was calculated using the number of selected families identified as both top 10 ranking phenotypic values at a minimum selection intensity of K = 1 and top 10 ranking GEBVs at a minimum selection intensity of K = 2 divided by the total number BC2S3 families selected using phenotypic values and GEBVs (N = 20).
The LA1141 × OH8245 BC2S3 phenotypic, genomic, and randomly selected families were advanced to the BC2S5 generation and evaluated in an augmented design in the greenhouse as described in section “Greenhouse evaluations of plants under water deficit.”
Trait BLUP values from selections were combined according to selection strategy, which was considered a treatment factor in the analysis. A fixed-effects model with selection strategy as a factor was used to determine if BC2S5 progenies chosen using selection strategies were significantly different from randomly advanced lines. The linear model used was Y ∼ μ + Selection+ ε: where Y was the trait BLUP, μ was the trial mean, Selection was the selection strategy used (GS, Phenotypic, Pheno + GS, and Random), and ε was experimental error. Factors with a significant p-value (p < 0.05) were analyzed using Tukey’s Honest Significant Difference with the “HSD.test” function in the R package Agricolae (De Mendiburu, 2017). The traits evaluated in the selection strategy validation experiment were turgor, canopy temperature, gsw, and VPD.
Advanced genomic and phenotypic selections were also evaluated in a field trial to assess whether OH8245 horticultural traits were recovered. The field trial was designed as a randomized complete block design with two blocks and a single replicate in each block. The experimental unit was the plot. The field site was located at the Horticulture Unit 1 Research Farm in Wooster, Ohio. Each plot consisted of seven to ten plants and was spaced 30 cm apart in rows, with each row separated by 1.5 m. Maintenance of field plots followed standard practices for tomato production in the Midwest (Philips et al., 2021 accessed at: mdc.itap.purdue.edu). The genetic treatments consisted of the OH8245 recurrent parent, the BC2S5 phenotypic selections (N = 10), and BC2S5 genomic selections (N = 10). Seedlings were transplanted to the field four weeks after emergence. Plots were harvested when 80% of fruit in a plot reached the red ripe stage of maturity, which averaged 107 Julian calendar days. Before harvest, the plant canopy’s width and height were measured in cm by hand. Three plants were hand-harvested from the middle of each plot. The fruit was sorted into ripe, green, and cull maturity categories, and each group was weighed separately. Cull fruits were fruit with cracks, blemishes, or disease. Total yield was measured as the combined harvested weight of the three groups. A sub-sample of 20 fruit was analyzed using color and chemical traits associated with tomato fruit quality. Fruit color was measured on a cross-section of 11 fruit and shoulder cuts of nine fruit using the image-based software Tomato Analyzer (Darrigues et al., 2008). Soluble solids (Brix°) were quantified by filtering juice through a Kimwipe™ (Kimberly-Clark Corp., Neenah, WI, United States) and measured using a handheld refractometer (PAL-1, Atago U.S.A., Bellvue, WA, United States).
Field performance of OH8245 and BC2S5 advanced lines that were chosen using phenotypic and genomic selection was evaluated using the fixed effects model Yij = μ + genotypei + Blockj+ εij: where Yij was the response variable, genotypei represented the BC2S5 selections (N = 20), and the OH8245 recurrent parent, Blockj was replication within the field, μ was the trial mean associated with the yield or quality parameters, and εij was the error. Genetic and environmental factors with a significant p-value (p < 0.05) were analyzed with Tukey’s Honest Significant Difference using the “HSD.test” function in the R package Agricolae (De Mendiburu, 2017).
Based on plant turgor, canopy temperature, and physiological measurements, LA1141 is more tolerant to water deficit stress than the OH8245 recurrent parent (Figures 1, 2 and Supplementary Table 2). Experiments were conducted over 144 h of deficit irrigation, with differences in turgor and canopy temperature observed between parents at 48 h through termination of the experiment (Supplementary Table 2). For simplicity, turgor and canopy temperatures are reported when they reach their maximums. Significant differences in turgor between LA1141 and OH8245 (p = 1.50e-15) are shown at 72 h (Figures 1, 2A and Supplementary Table 2). Accession LA1141 maintained a lower canopy temperature as measured by both an infrared thermometer (IRT) (p = 0.032) and thermal images (p = 0.049) (Figures 2B,C and Supplementary Table 2). Accession LA1141 and OH8245 exhibit different physiological responses, which become significant at 72 h of deficit irrigation (Supplementary Table 2). LA1141 maintains higher stomatal conductance (gsw) (p = 1.80e-07), lower vapor pressure deficit (VPD) (p = 0.025), and higher light-adapted chlorophyll fluorescence (PhiPS2) (p = 0.009) compared to OH8245 (Figures 2D–F and Supplementary Table 2). Observable and measurable differences in response between accession LA1141, OH8245, and their progenies (Figure 1) provided the basis for genetic studies describing water deficit tolerance derived from S. galapagense.
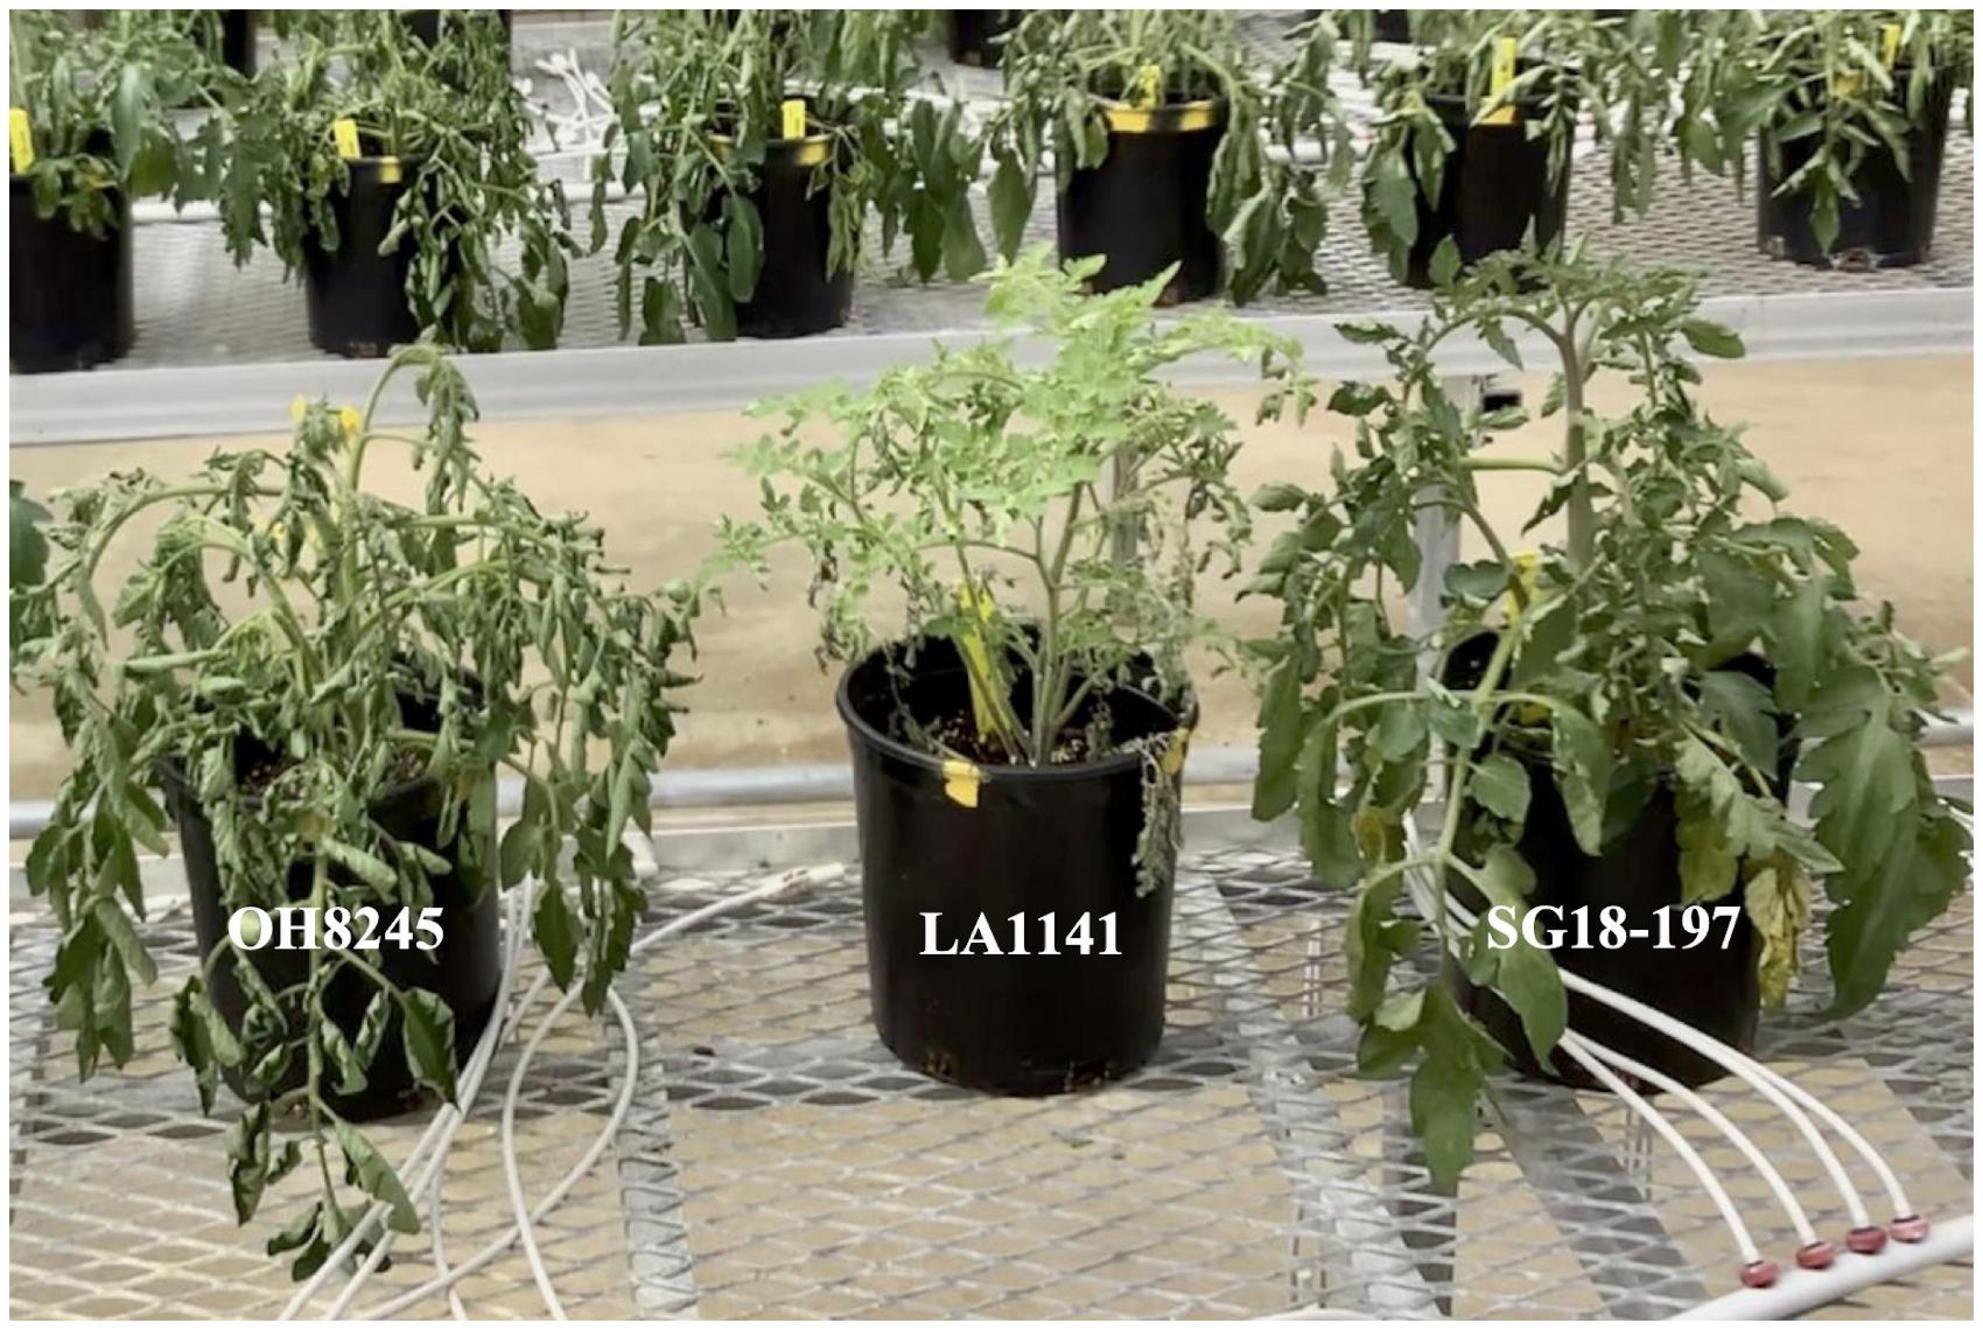
Figure 1. Response of, Solanum lycopersicum OH8245, S. galapagense accession LA1141 and LA1141 × OH8245 inbred backcross line SG18-197 at 72 h of water deficit. Turgor ratings ranged from 1 to 5 (5 = turgid, 4 = soft to the touch, 3 = beginning to wilt, 2 = wilted with complete loss of turgor, and 1 = dead), consistent with previous studies (Waterland et al., 2010). Accession LA1141 (labeled) (center) received a rating of 5, OH8245 (left) received a rating of 3, and LA1141 × OH8245 inbred backcross line SG18-197 (right) received a rating of 4.
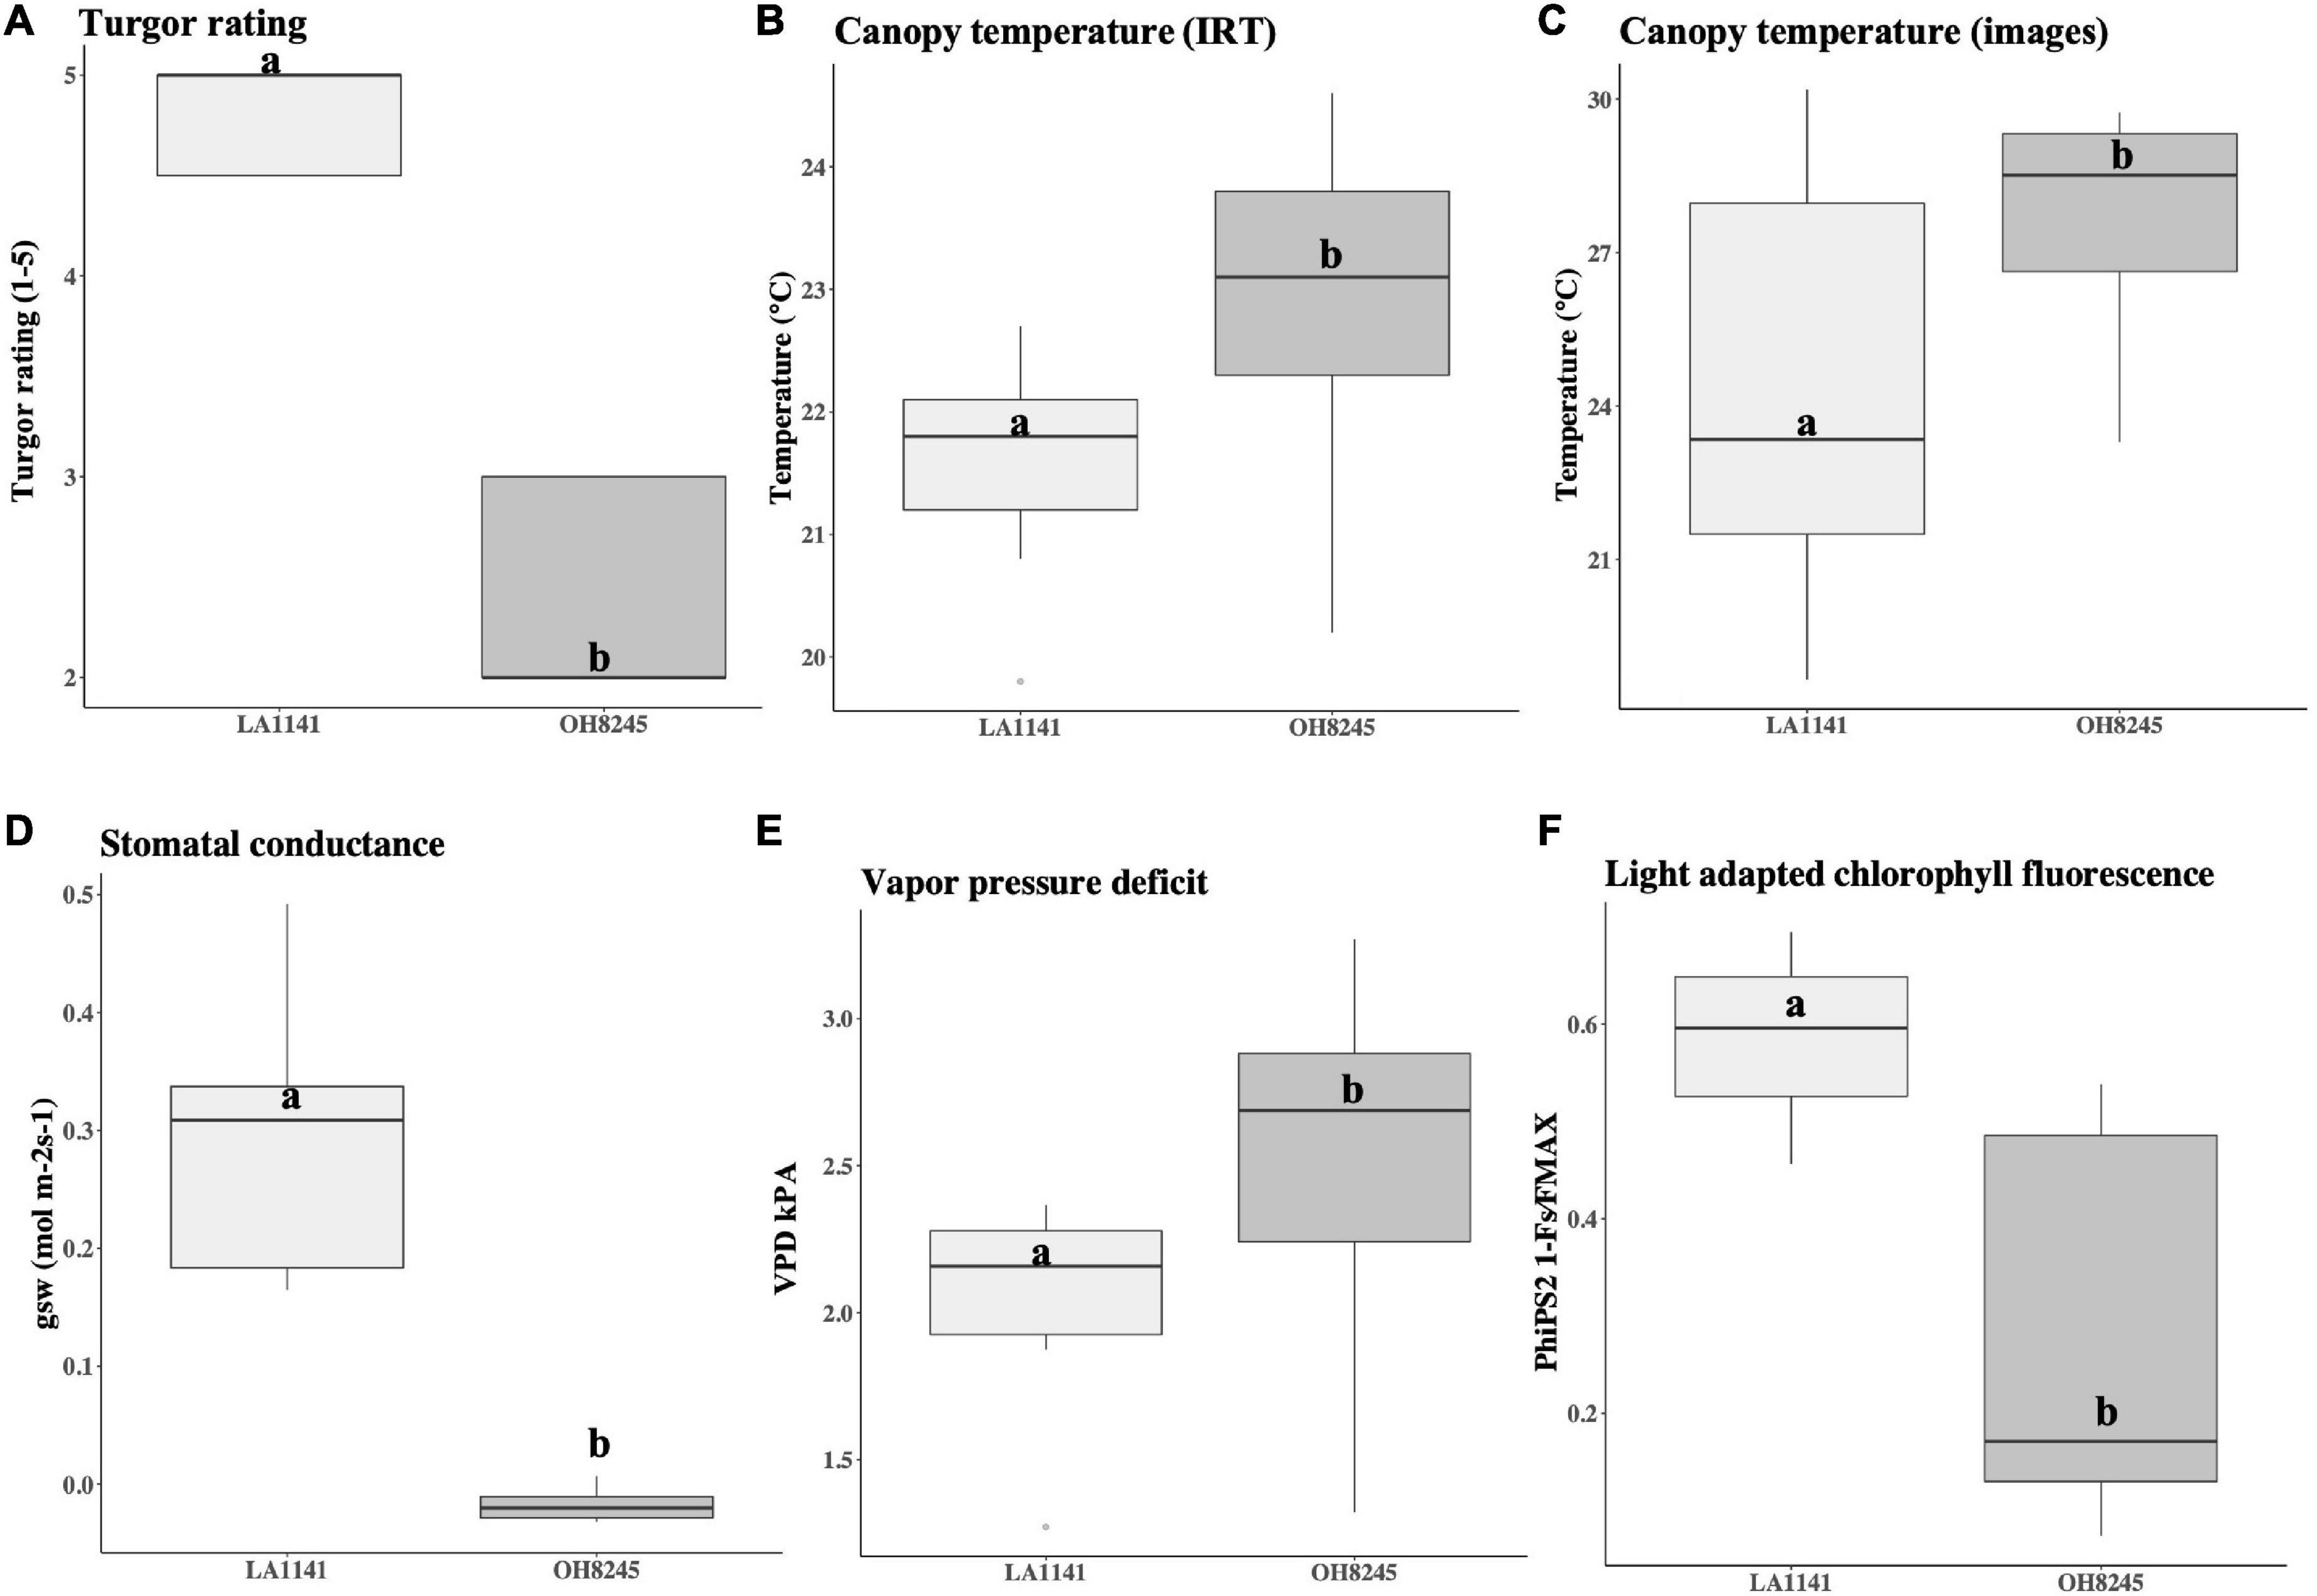
Figure 2. Boxplots comparing water-deficit stress response of the Solanum galapagense accession LA1141 donor parent (N = 9) to the S. lycopersicum OH8245 recurrent parent (N = 9). The traits measured were (A) turgor ratings ranging from 1 to 5 (5 = turgid, 4 = soft to the touch, 3 = beginning to wilt, 2 = wilted with complete loss of turgor, and 1 = dead) consistent with previous (Waterland et al., 2010). (B) Canopy temperature estimated using a handheld infrared thermometer (IRT) (Zhuhai JiDa Huapu Instrument Co., Hong Kong), and (C) from images captured with the FLIRONE GEN3 iOS thermal camera (FLIR Systems Wilsonville, OR, United States). Physiological measurements were taken with the LI-600 Porometer/ Fluorometer (LI-COR Biosciences, Lincoln, NE, United States) and included (D) stomatal conductance (gsw mol m–2 s–1), (E) vapor pressure deficit (VPD kPa), and (F) light-adapted chlorophyll fluorescence (PhiPS2 1-Fs/FMAX). Values are reported at the time point where they reach their maximums. Different letters indicate statistically significant differences among groups (Tukey’s Honest Significant Difference, p < 0.05).
Thermal image-based phenotyping and analysis detected greater differences in canopy temperatures between genotypes under water deficit compared to canopy temperature measured with the infrared thermometer (IRT) (Figure 3). To test whether the high-throughput thermal image analysis pipeline offered advantages over the IRT, we evaluated LA1141, OH8245, and LA1141 × OH8245 BC2S3 families and BC2S5 selections for canopy temperature using both phenotyping approaches. Regression of canopy temperature measured with the IRT to values estimated by thermal images in the BC2S3 families showed a significant linear relationship (p < 2.20e-16, R2 = 0.30) (Supplementary Figure 3). Variance components for “Genotype” and experimental factors attributed to the environment, including “Row,” “Column,” and “error,” were partitioned to estimate the proportion of genetic variance associated with canopy temperature (Table 1). The total phenotypic variation partitioned into genetic effects associated with canopy temperature measured with IRT was 19.23% (Table 1). In contrast, the percentage of total phenotypic variance attributed to genetic factors measured with thermal images was 22.16% (Table 1). Thermal image estimated canopy temperature, therefore, provides higher repeatability.
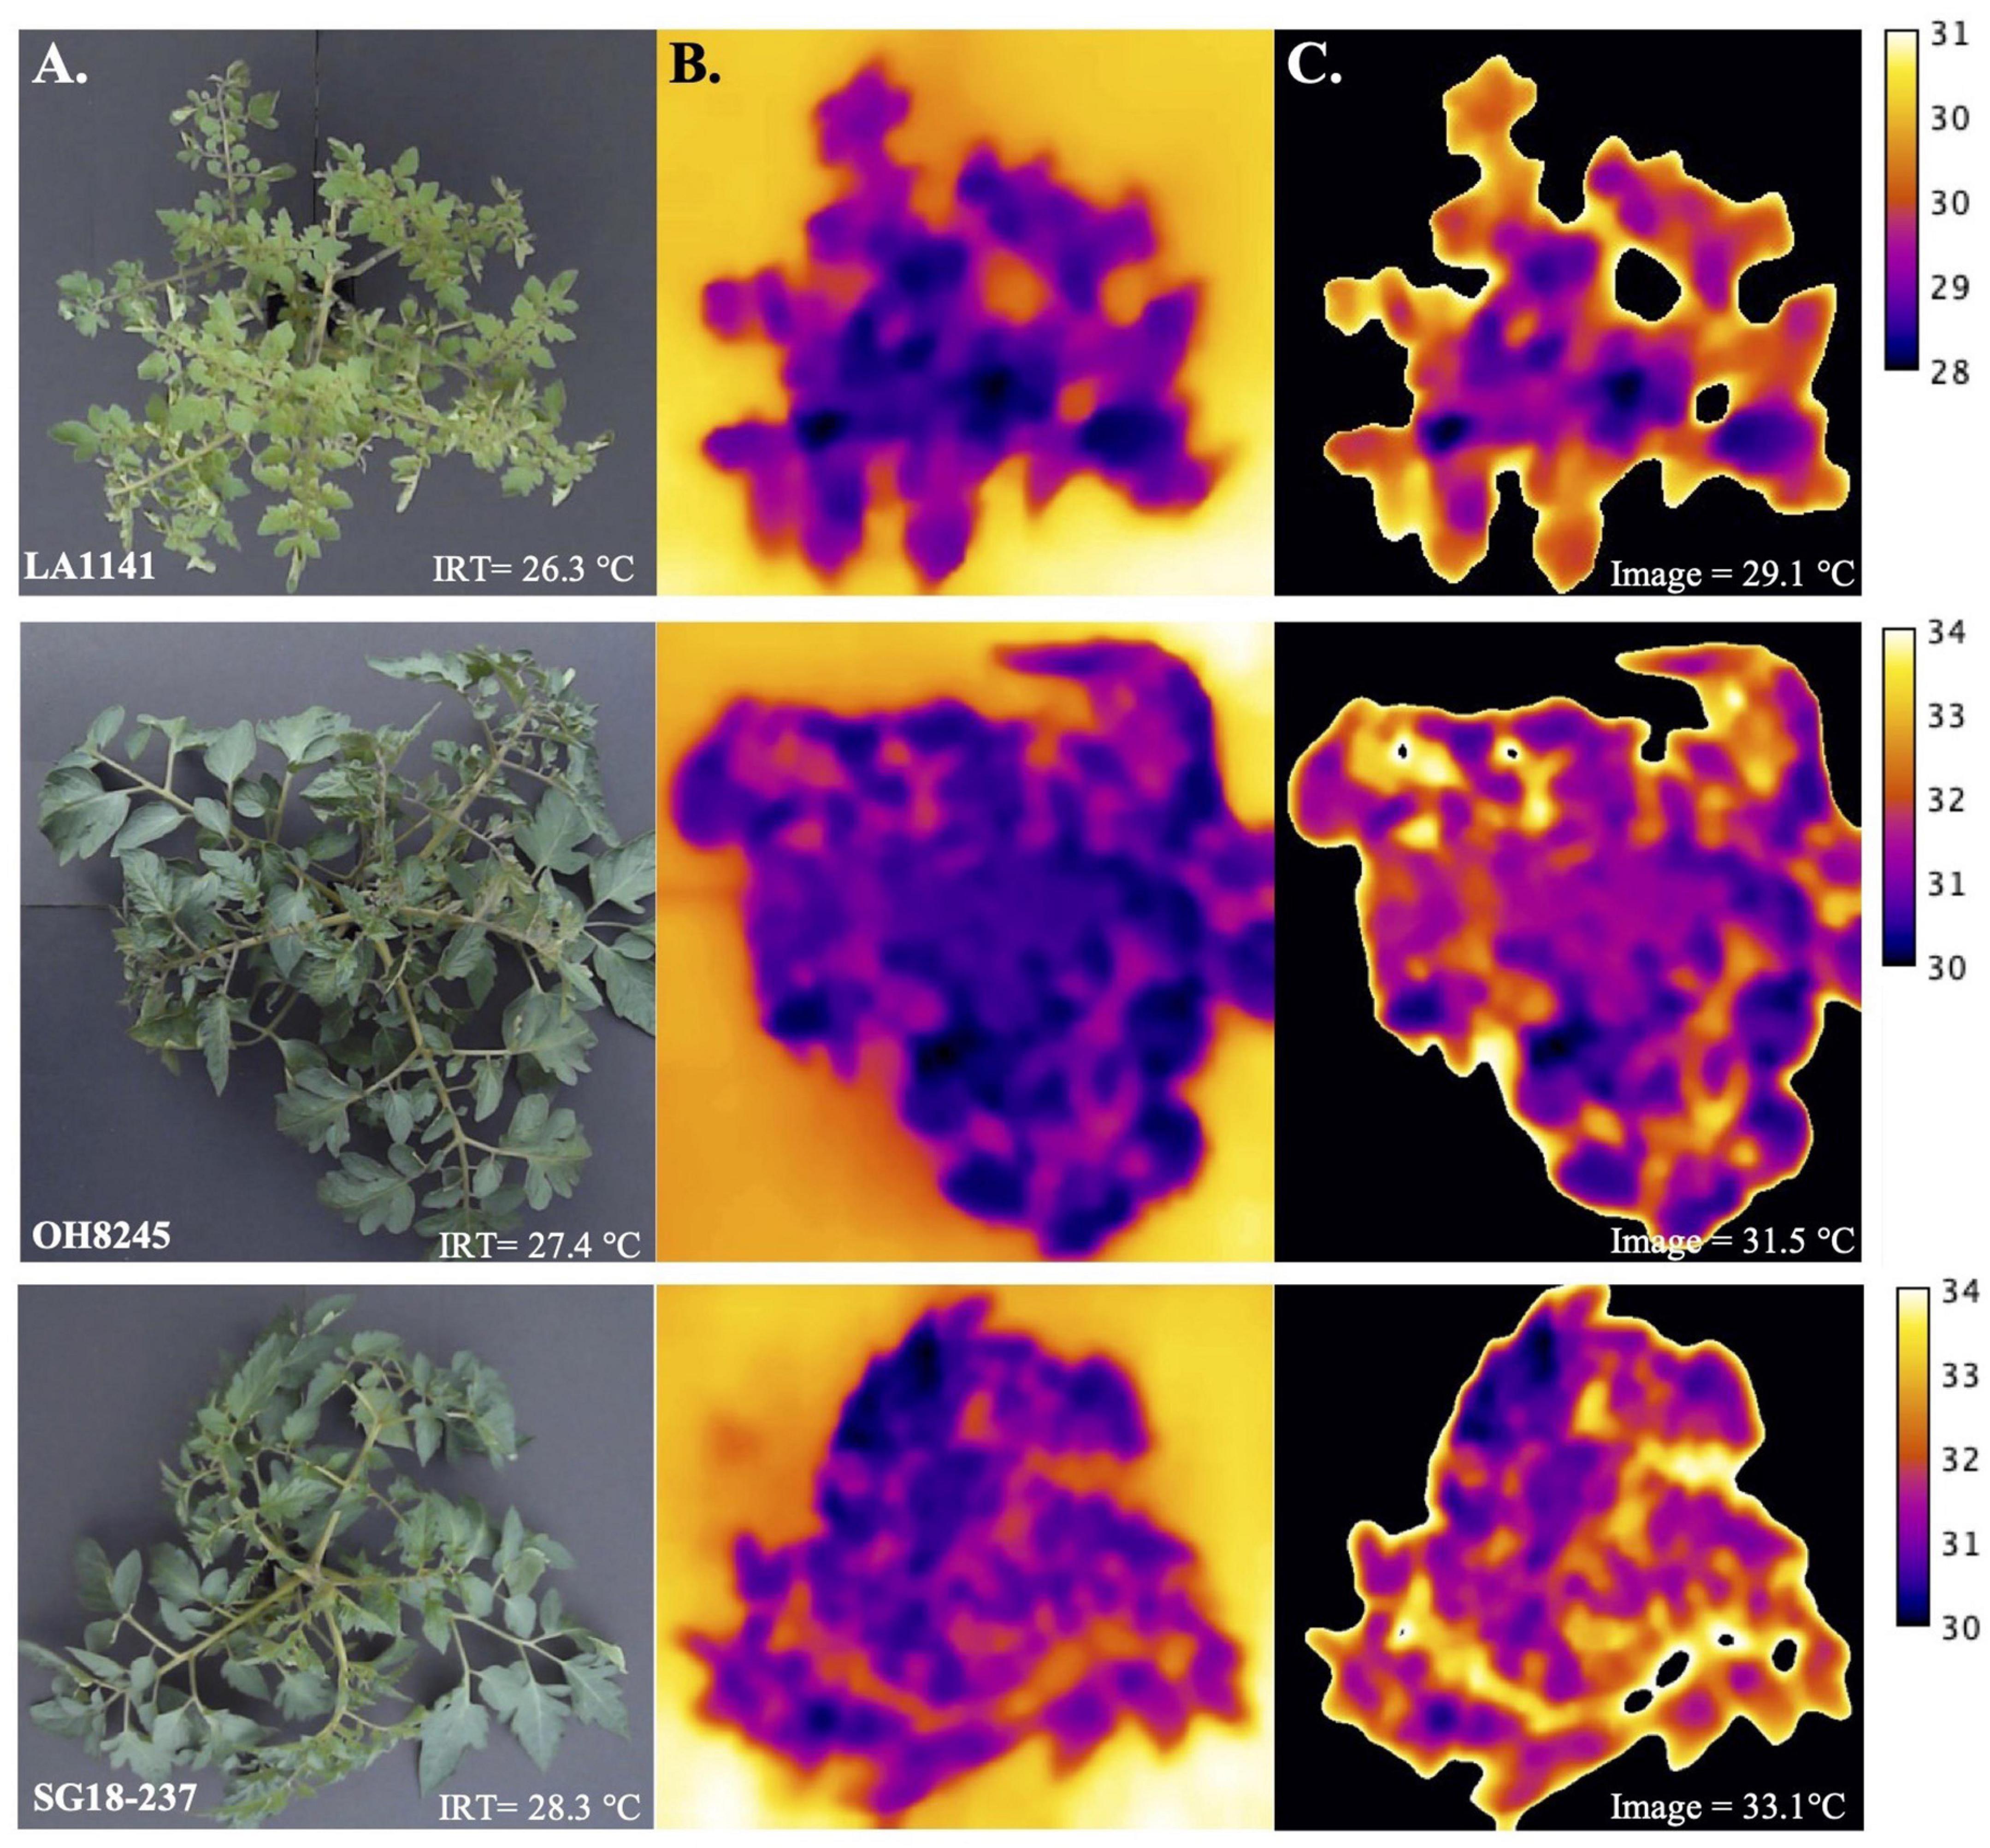
Figure 3. Estimating canopy temperature (°C) using images and an infrared thermometer (IRT) as a measure of plant water deficit stress. (A) Original images of LA1141 (top), OH8245 (middle), and inbred backcross line SG18-237 (bottom). The original image of the plant canopy was captured with the FLIRONE GEN3 iOS thermal camera (FLIR Systems Wilsonville, OR) and temperature (°C) was measured using a handheld IRT (Zhuhai JiDa Huapu Instrument Co., Hong Kong) simultaneously. (B) Plots of the temperature data extracted from thermal images using the function “plotTherm” in the R package Thermimage (Tattersall, 2021). (C) Histogram-based thresholding using “MEAN” (Glasbey, 1993) in the JAVA-based distribution of ImageJ “Fiji” (Schindelin et al., 2012). Images were analyzed in a workflow that entailed extracting radiometric data using the “readflirJPG” function in the R package Thermimage (Tattersall, 2021). Raw files with pixel values corresponding to the plant canopy surface temperature were then imported into the open-source software ImageJ (Schindelin et al., 2012) for image processing and analysis. A collection of ImageJ functions and macros called “ThermImageJ” (Tattersall, 2019) was used to import the temperature data extracted from the thermal images, isolate regions of interest (ROI), and estimate temperature. The image calibration bar was added to each individual image in panel C using the ImageJ macro “ThermImageJ” (Tattersall, 2019).
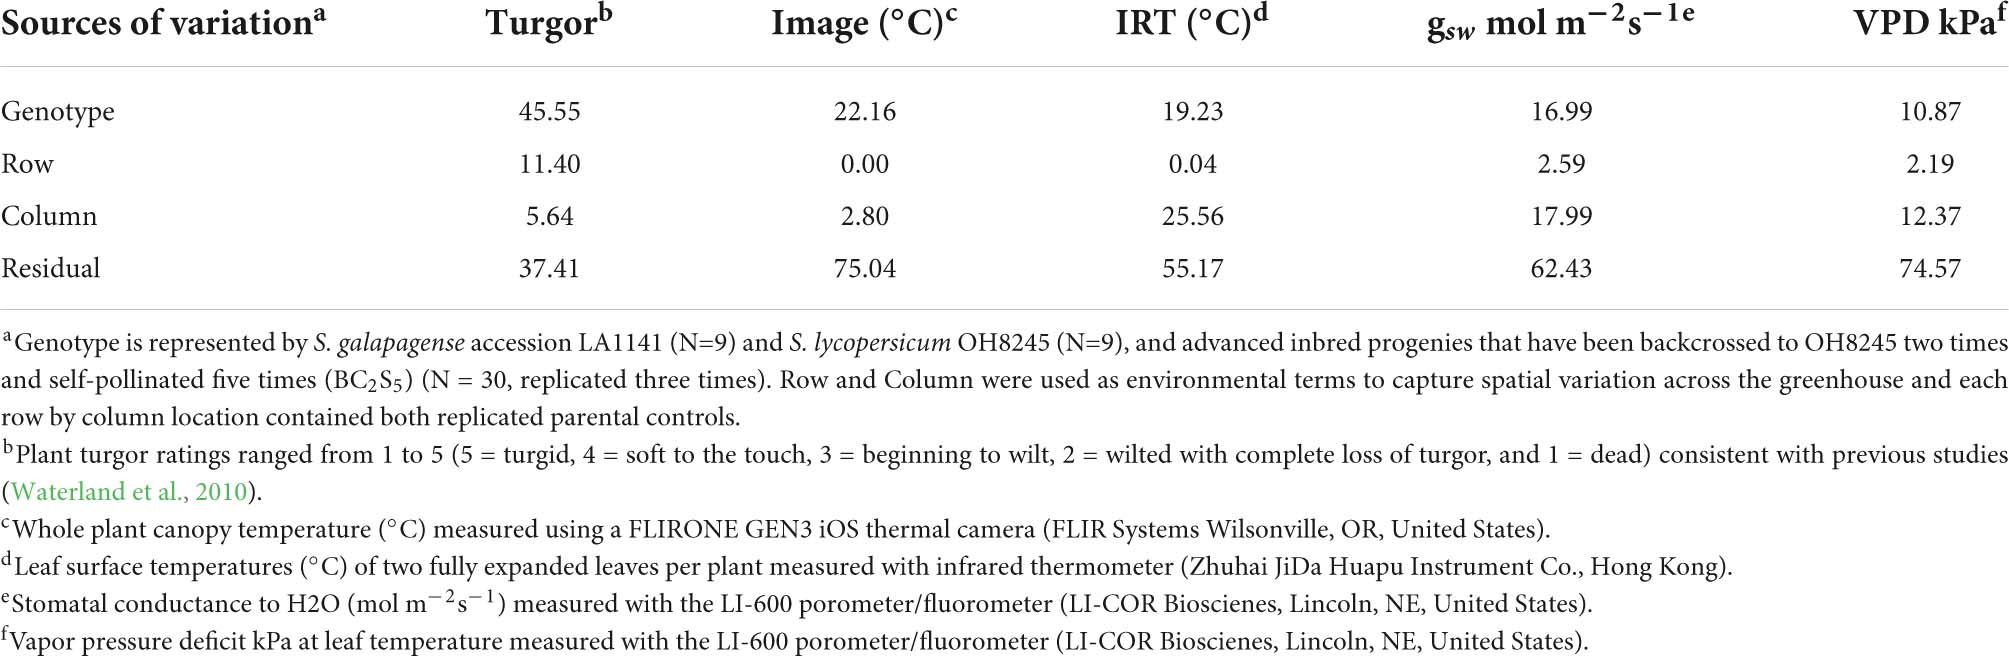
Table 1. Percentage of total variance estimates for turgor ratings, canopy temperature, and LI-600 physiological measurements in S. galapagense LA1141, S. lycopersicum OH8245, and LA1141 × OH8245 BC2S5 progenies.
Comparisons between image-based canopy temperature at 48 h and turgor ratings at 72 h show a significant correlation (p = 0.031), suggesting that canopy temperature can predict the onset of wilt (Supplementary Figure 4A). Image-based canopy temperature measurements at 48 h are also significantly correlated to gsw (p = 0.023) and VPD (p = 0.002), but not to PhiPS2 (p = 0.583) at 72 h, suggesting that canopy temperature is predictive of gsw and VPD (Supplementary Figures 4B–D). Notably, a higher percentage of phenotypic variance is partitioned into genetic effects associated with canopy temperature than gsw, VPD, and PhiPS2 (Table 1). However, the percentage of phenotypic variance partitioned into genetic effects associated with turgor is higher than canopy temperature and physiological measurements (Table 1). Still, an image-based canopy temperature appears to be a suitable proxy for more intensive physiological measurements, such as gsw and VPD in our water deficit germplasm screens. Finally, the ability of images to predict the onset of wilt demonstrates that image-based measurements can improve the efficiency of germplasm screens.
The BC2S3 families that differed from the trial mean by a selection intensity of K = 1 indicated tolerance or susceptibility to water deficit stress. Tolerance in specific LA1141 × OH8245 BC2S3 families for canopy temperature and turgor was recovered. Germplasm evaluations were conducted in the greenhouse in two seasonal environments (July and November). A summary of greenhouse conditions in summer and fall environments is provided (Supplementary Table 5). Genetic effects for turgor (p < 2.20e-16) and canopy temperature (p = 8.17e-07) were significantly different (Supplementary Table 6). Additionally, summer and fall environments were significantly different for turgor (p < 2.20e-16) but not significantly different for canopy temperature (p = 0.736) (Supplementary Table 6). The environmental term “Column” corresponds to a solar radiation gradient in these experiments. The term “Row” corresponds to an air movement gradient between the greenhouse cooling pad and fans. The interaction between the seasonal environment and row, or column, terms represent a unique greenhouse position within each environment. The “Environment × Row” term was significantly different for turgor (p = 0.007) but not canopy temperature (p = 0.371) (Supplementary Table 6). However, Environment × Column was significantly different for both turgor (p = .0002) and canopy temperature (p = 5.05e-14) (Supplementary Table 6). The experimental design used over-replicated checks to estimate the best linear unbiased predictors (BLUPs) as described in the methods section “Greenhouse evaluations of plants under water deficit” to account for the variation in the greenhouse described above. Trait values expressed as BLUPs exhibit shrinkage around the mean and provided conservative estimates of turgor and canopy temperature adjusted to environmental differences based on the over-replicated LA1141 and OH8245 parental checks.
Additionally, estimates of evapotranspiration were not significantly different based on genotype (p = 0.461) but were significantly different between experimental environments (p = 3.42e-08) (Supplementary Table 6). However, the environmental interaction factors Environment × Row (p = 0.089) and Environment × Column (p = 0.732) were not significantly different (Supplementary Table 6). These results suggested that the position in the greenhouse and genetic differences for estimated evapotranspiration within an experimental environment did not explain significant differences in water-deficit stress response. Differences detected between the screening environments are not surprising because the average temperature in the greenhouse was higher in the summer compared to the fall (Supplementary Table 5). Consequently, observed genetic variation in the germplasm appears to be independent of estimated evapotranspiration, both for canopy temperature and plant turgor. These traits were subsequently used in interval mapping studies, genomic selection models, and the development selection indices.
Four putative QTLs were identified, and explained between 6.6 and 9.49% of the phenotypic variation for canopy temperature and turgor (Figure 4 and Table 2). Phenotypic values were expressed as an average of trait BLUPs across environments with a mean of 0, and the effect of an allele substitution was expressed relative to the mean. All QTLs contributing to water deficit tolerance were derived from the LA1141 donor parent (Table 2). A region on the distal arm of chromosome 1 (linkage group 1b) had a LOD score of 2.66, explained 6.6 % of the total phenotypic variation, and lowered canopy temperature by 0.02°C (Table 2). A region on the proximal arm of chromosome 6 had a LOD score of 3.46, explained between 6.02 and 9.09 % of the total phenotypic variation, and lowered canopy temperature by 0.03°C (Table 2). A region on the proximal arm of chromosome 5 had a LOD score of 3.33, explained 9.14 % of the total phenotypic variation, and increased turgor ratings between 0.33 and 0.36 units (Table 2). A region on the distal arm of chromosome 7 had a LOD score of 2.5, explained 6.78% of the phenotypic variation, and increased ratings associated with higher turgor by 0.42 units (Table 2). The QTL found on chromosomes 1, 5, and 7 were detected in both individual screens and the combined dataset (Table 2). The QTL associated with canopy temperature detected on chromosome 6 was detected in the summer and combined environments but not the fall environment (Table 2).
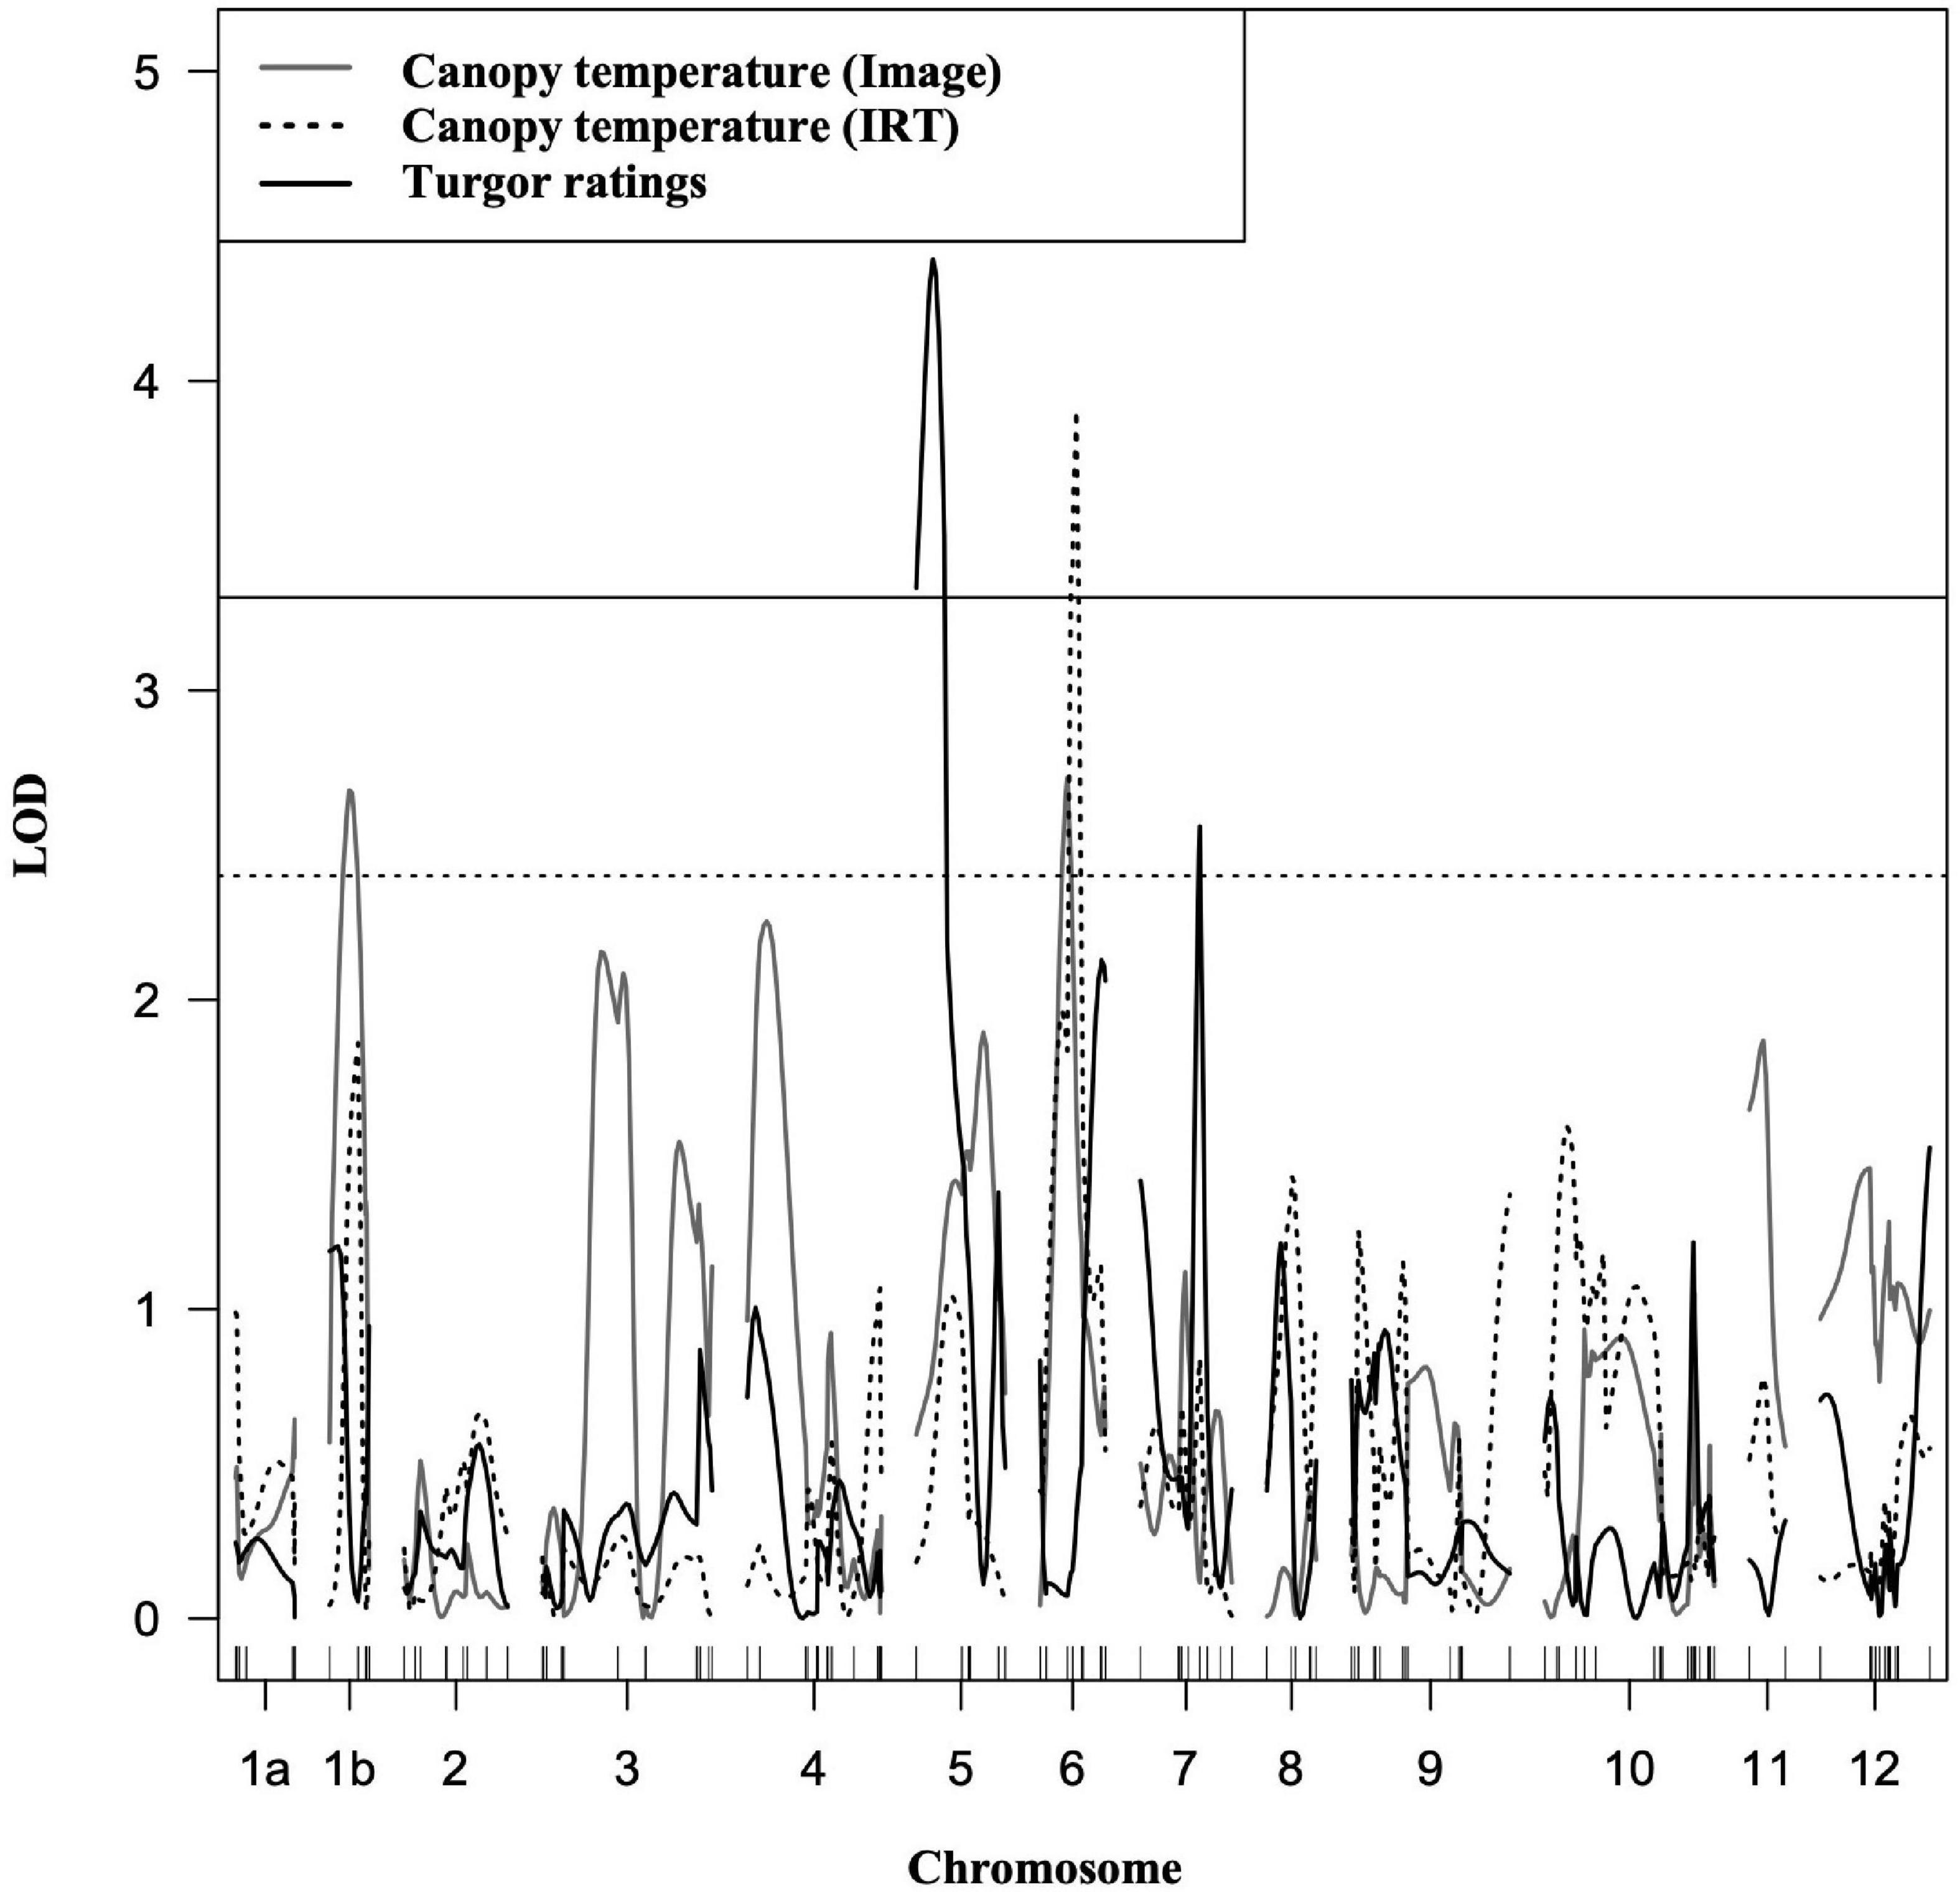
Figure 4. Composite interval mapping of LA1141-derived tolerance to water deficit stress. The traits measured were canopy temperature estimated using images (grey), canopy temperature estimated with an infrared thermometer (dotted), and plant turgor ratings (black) ranging from 1 to 5 (5 = turgid, 4 = soft to the touch, 3 = beginning to wilt, 2 = wilted with complete loss of turgor, and 1 = dead) consistent with previous studies (Waterland et al., 2010). Traits were measured in the LA1141 × OH8245 BC2S3 inbred backcross families (N = 160). The y-axis is the logarithm of the odds (LOD). The solid (black) horizontal line (LOD = 3.3) is the resampled LOD significance cutoff (α = 0.05, N = 1,000 permutations). The dotted (gray) horizontal line (LOD = 2.4) represents a significance level of p < 0.01. The x-axis represents linkage groups corresponding to the 12 chromosomes in tomato and chromosome distance in centimorgans (cM). The genetic distance was calculated using the Kosambi function Kosambi (1943) to correct for multiple crossovers.
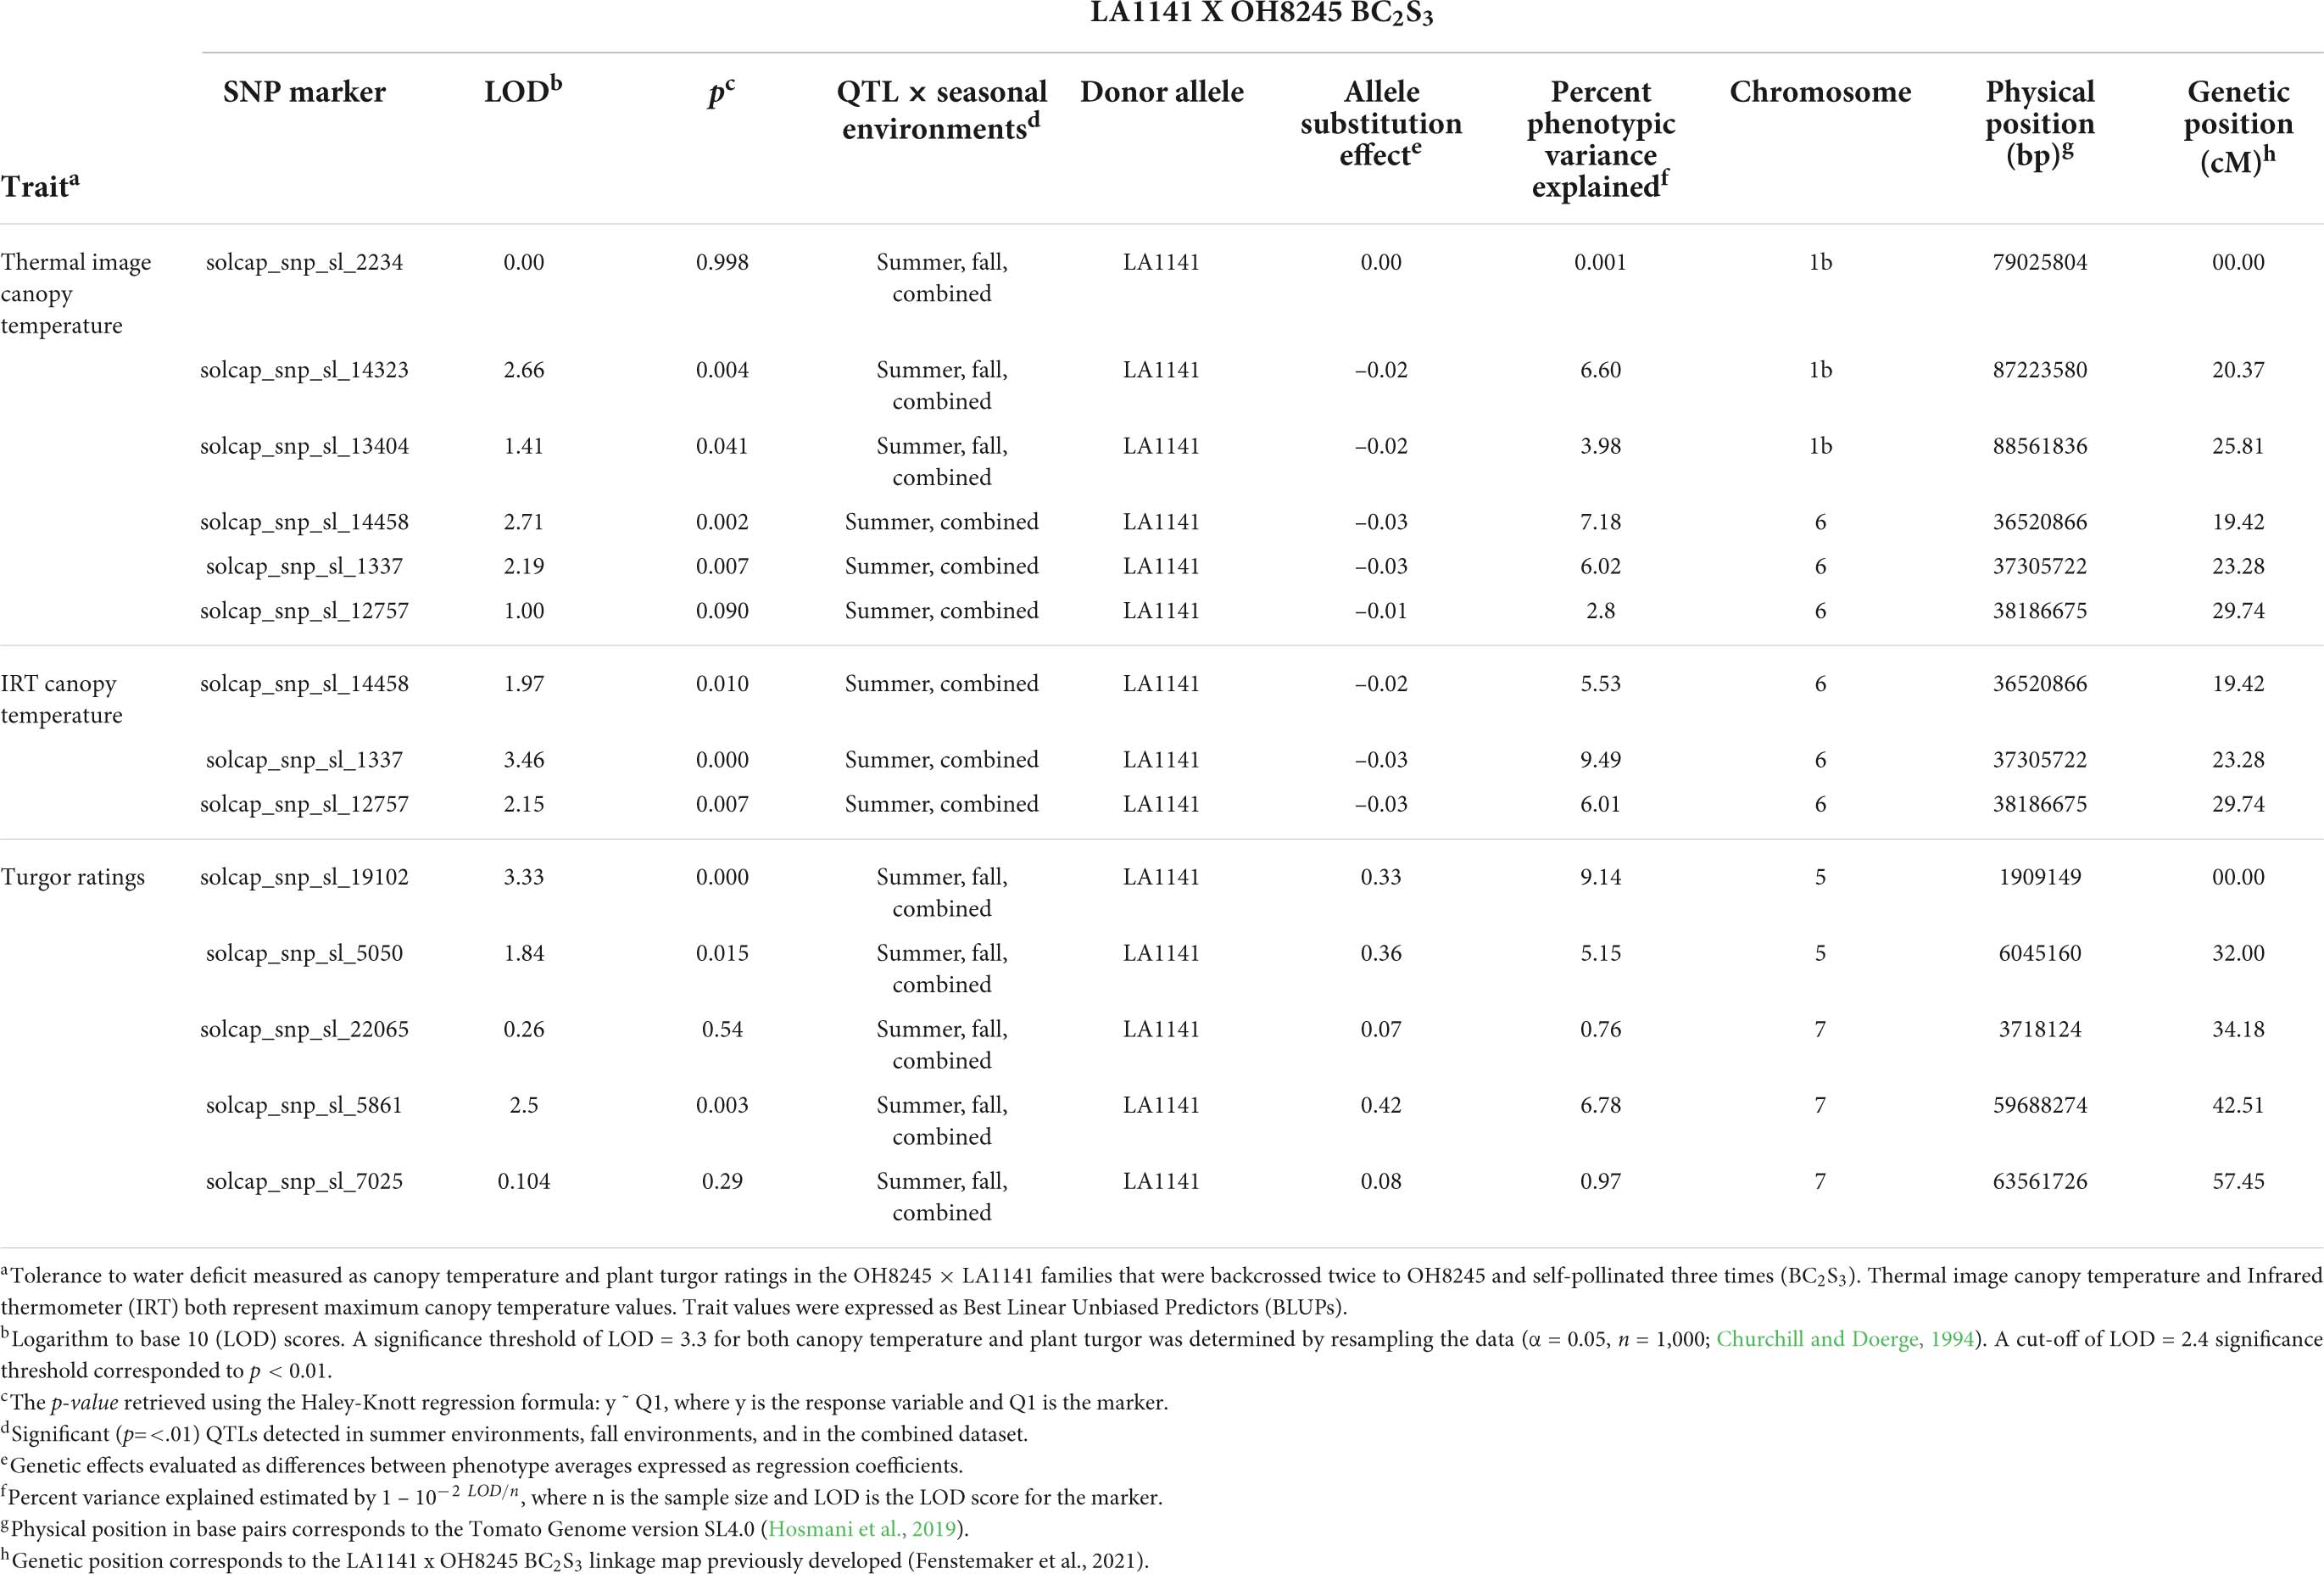
Table 2. Quantitative trait loci (QTL) and flanking single nucleotide polymorphism (SNP) markers associated with canopy temperature and turgor ratings in S. galapagense LA1141 x S. lycopersicum OH8245 BC2S3 families.
Prediction accuracy (rg) was evaluated with cross validation in the LA1141 × OH8245 BC2S3 training population and empirically in BC2S5 lines derived from further inbreeding. Cross-validation correlations between GEBVs and phenotype were significant for canopy temperature (p = 1.53e-15), and accuracy was rg = 0.57. Similarly, correlations for turgor were significant (p = 4.61e-09) with an accuracy of rg = 0.44 (Table 3). Correlations between GEBVs based on the BC2S3 training population and observed values of BC2S5 lines were significant for canopy temperature (p = 0.009, rg = 0.57) and turgor (p = 0.021 rg = 0.31) (Table 3).
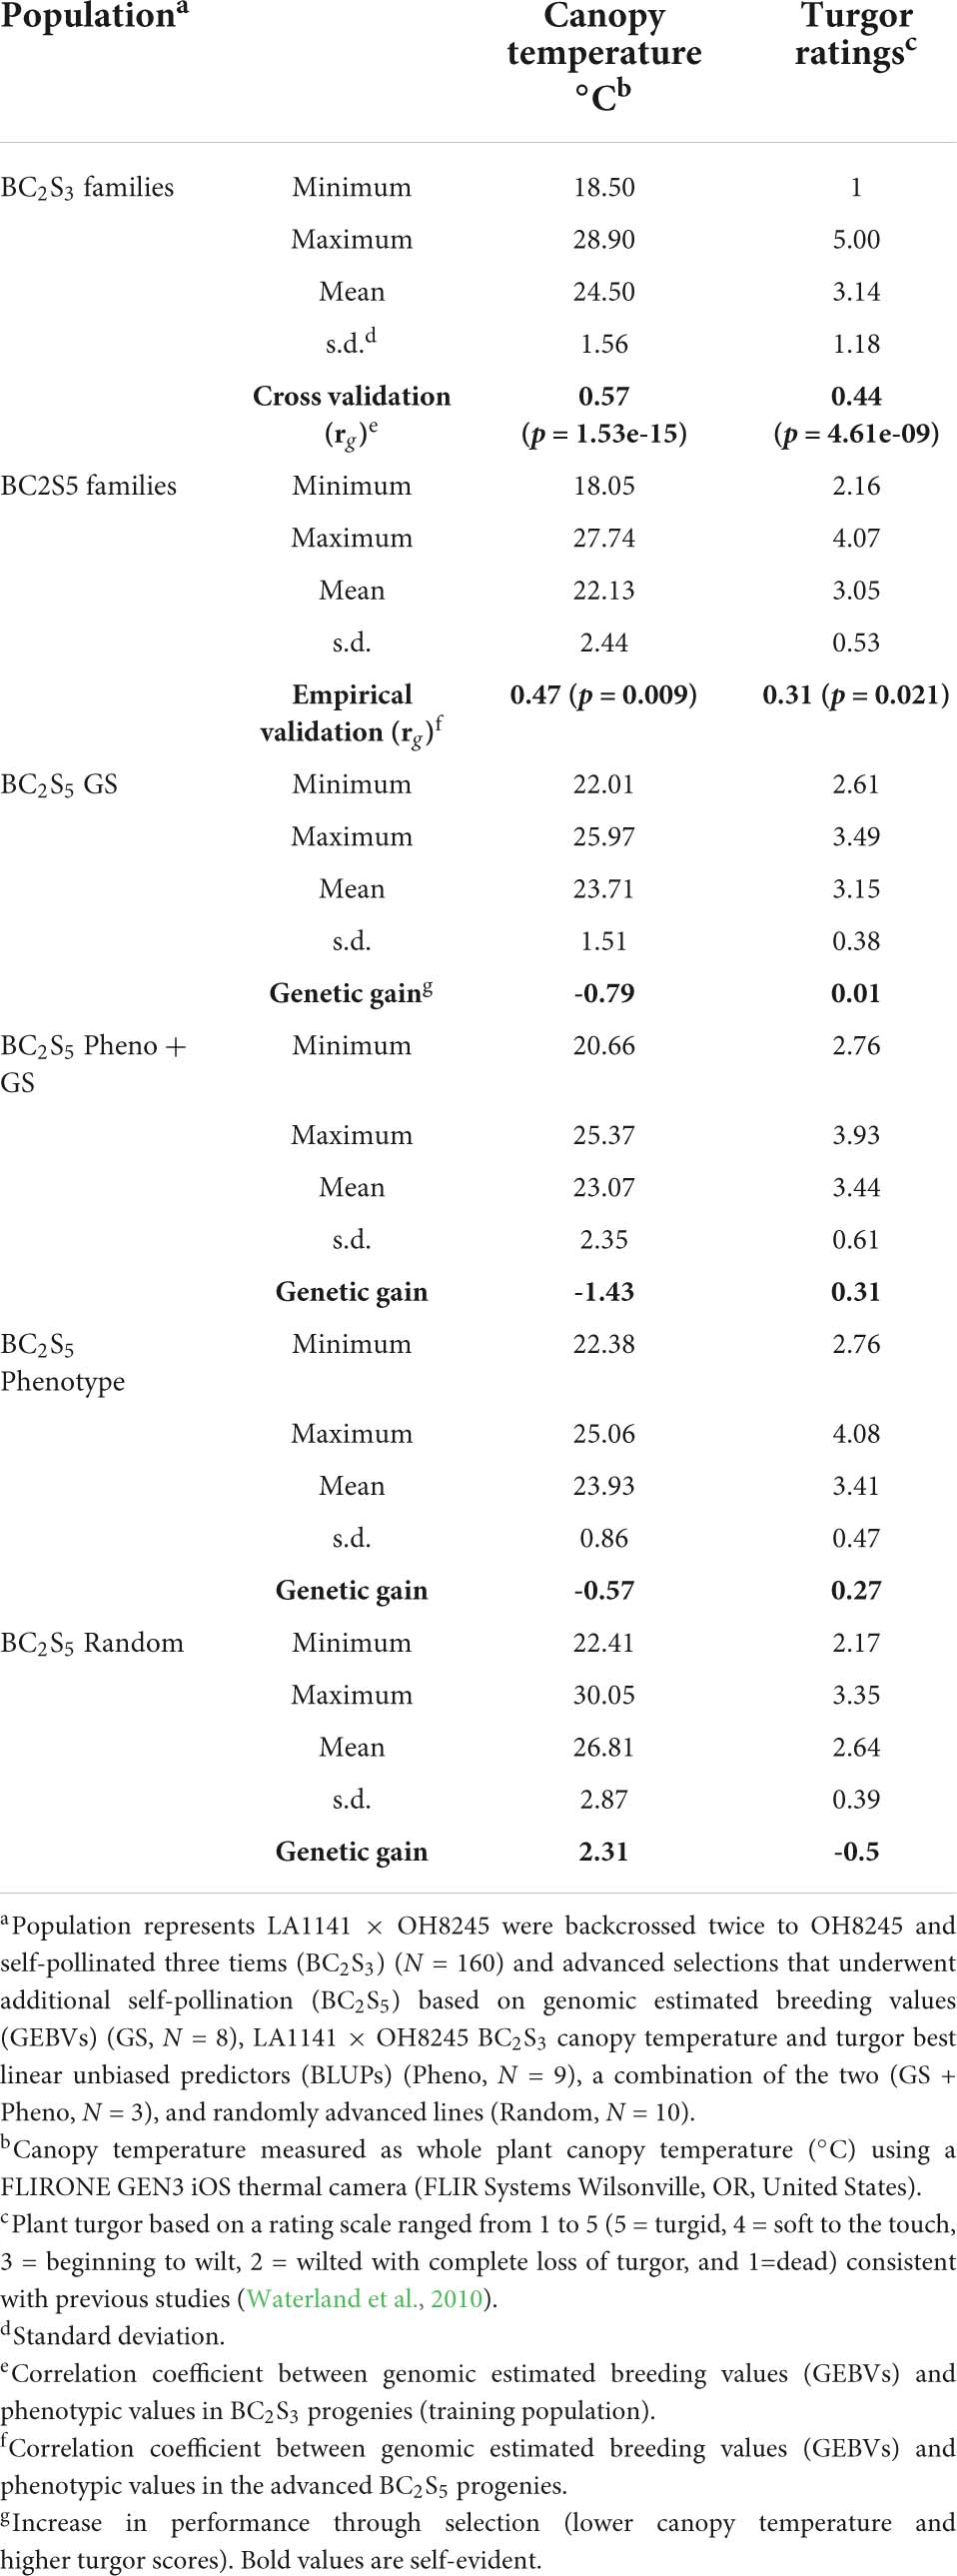
Table 3. Evaluation of accuracy and genetic gain for selection strategies during inbreeding of the S. galapagense LA1141 × S. lycopersicum OH8245 population.
Improvement in plant performance in our experiments is demonstrated by high plant turgor, low canopy temperature, high gsw, and low VPD. Selection strategies based on phenotype, genomic selection models and a combination of the two were compared to randomly advanced lines. The selection strategy was significantly different from random selections for turgor (p = 0.004), canopy temperature (p = 0.006), gsw (p = 0.026), and VPD (p = 0.046) (Supplementary Table 7). Phenotypic, genomic, and combined strategies resulted in positive gain under selection, with selected lines showing higher turgor and lower canopy temperatures under water deficit. Differences between the BC2S3 families and BC2S5 lines chosen based on GEBV resulted in gain under selection by increasing turgor by 0.01 units (Table 3). Lines selected using combined strategies resulted in gain under selection by increasing turgor ratings by 0.31 on the five-point scale (Table 3). Phenotypically selected BC2S5 advanced lines resulted in gain under the selection of 0.27 units (Table 3). In contrast, differences between the BC2S3 training population and the randomly advanced BC2S5 progenies did not result in gain under this selection and lowered turgor ratings by 0.50 on the five-point scale (Table 3). Importantly, phenotypic, and combined strategies had higher turgor compared to randomly advanced progenies (Figure 5A). However, chosen progenies using genomic selection alone did not have different turgor ratings when compared to phenotypic, combined, or random selection (Figure 5A).
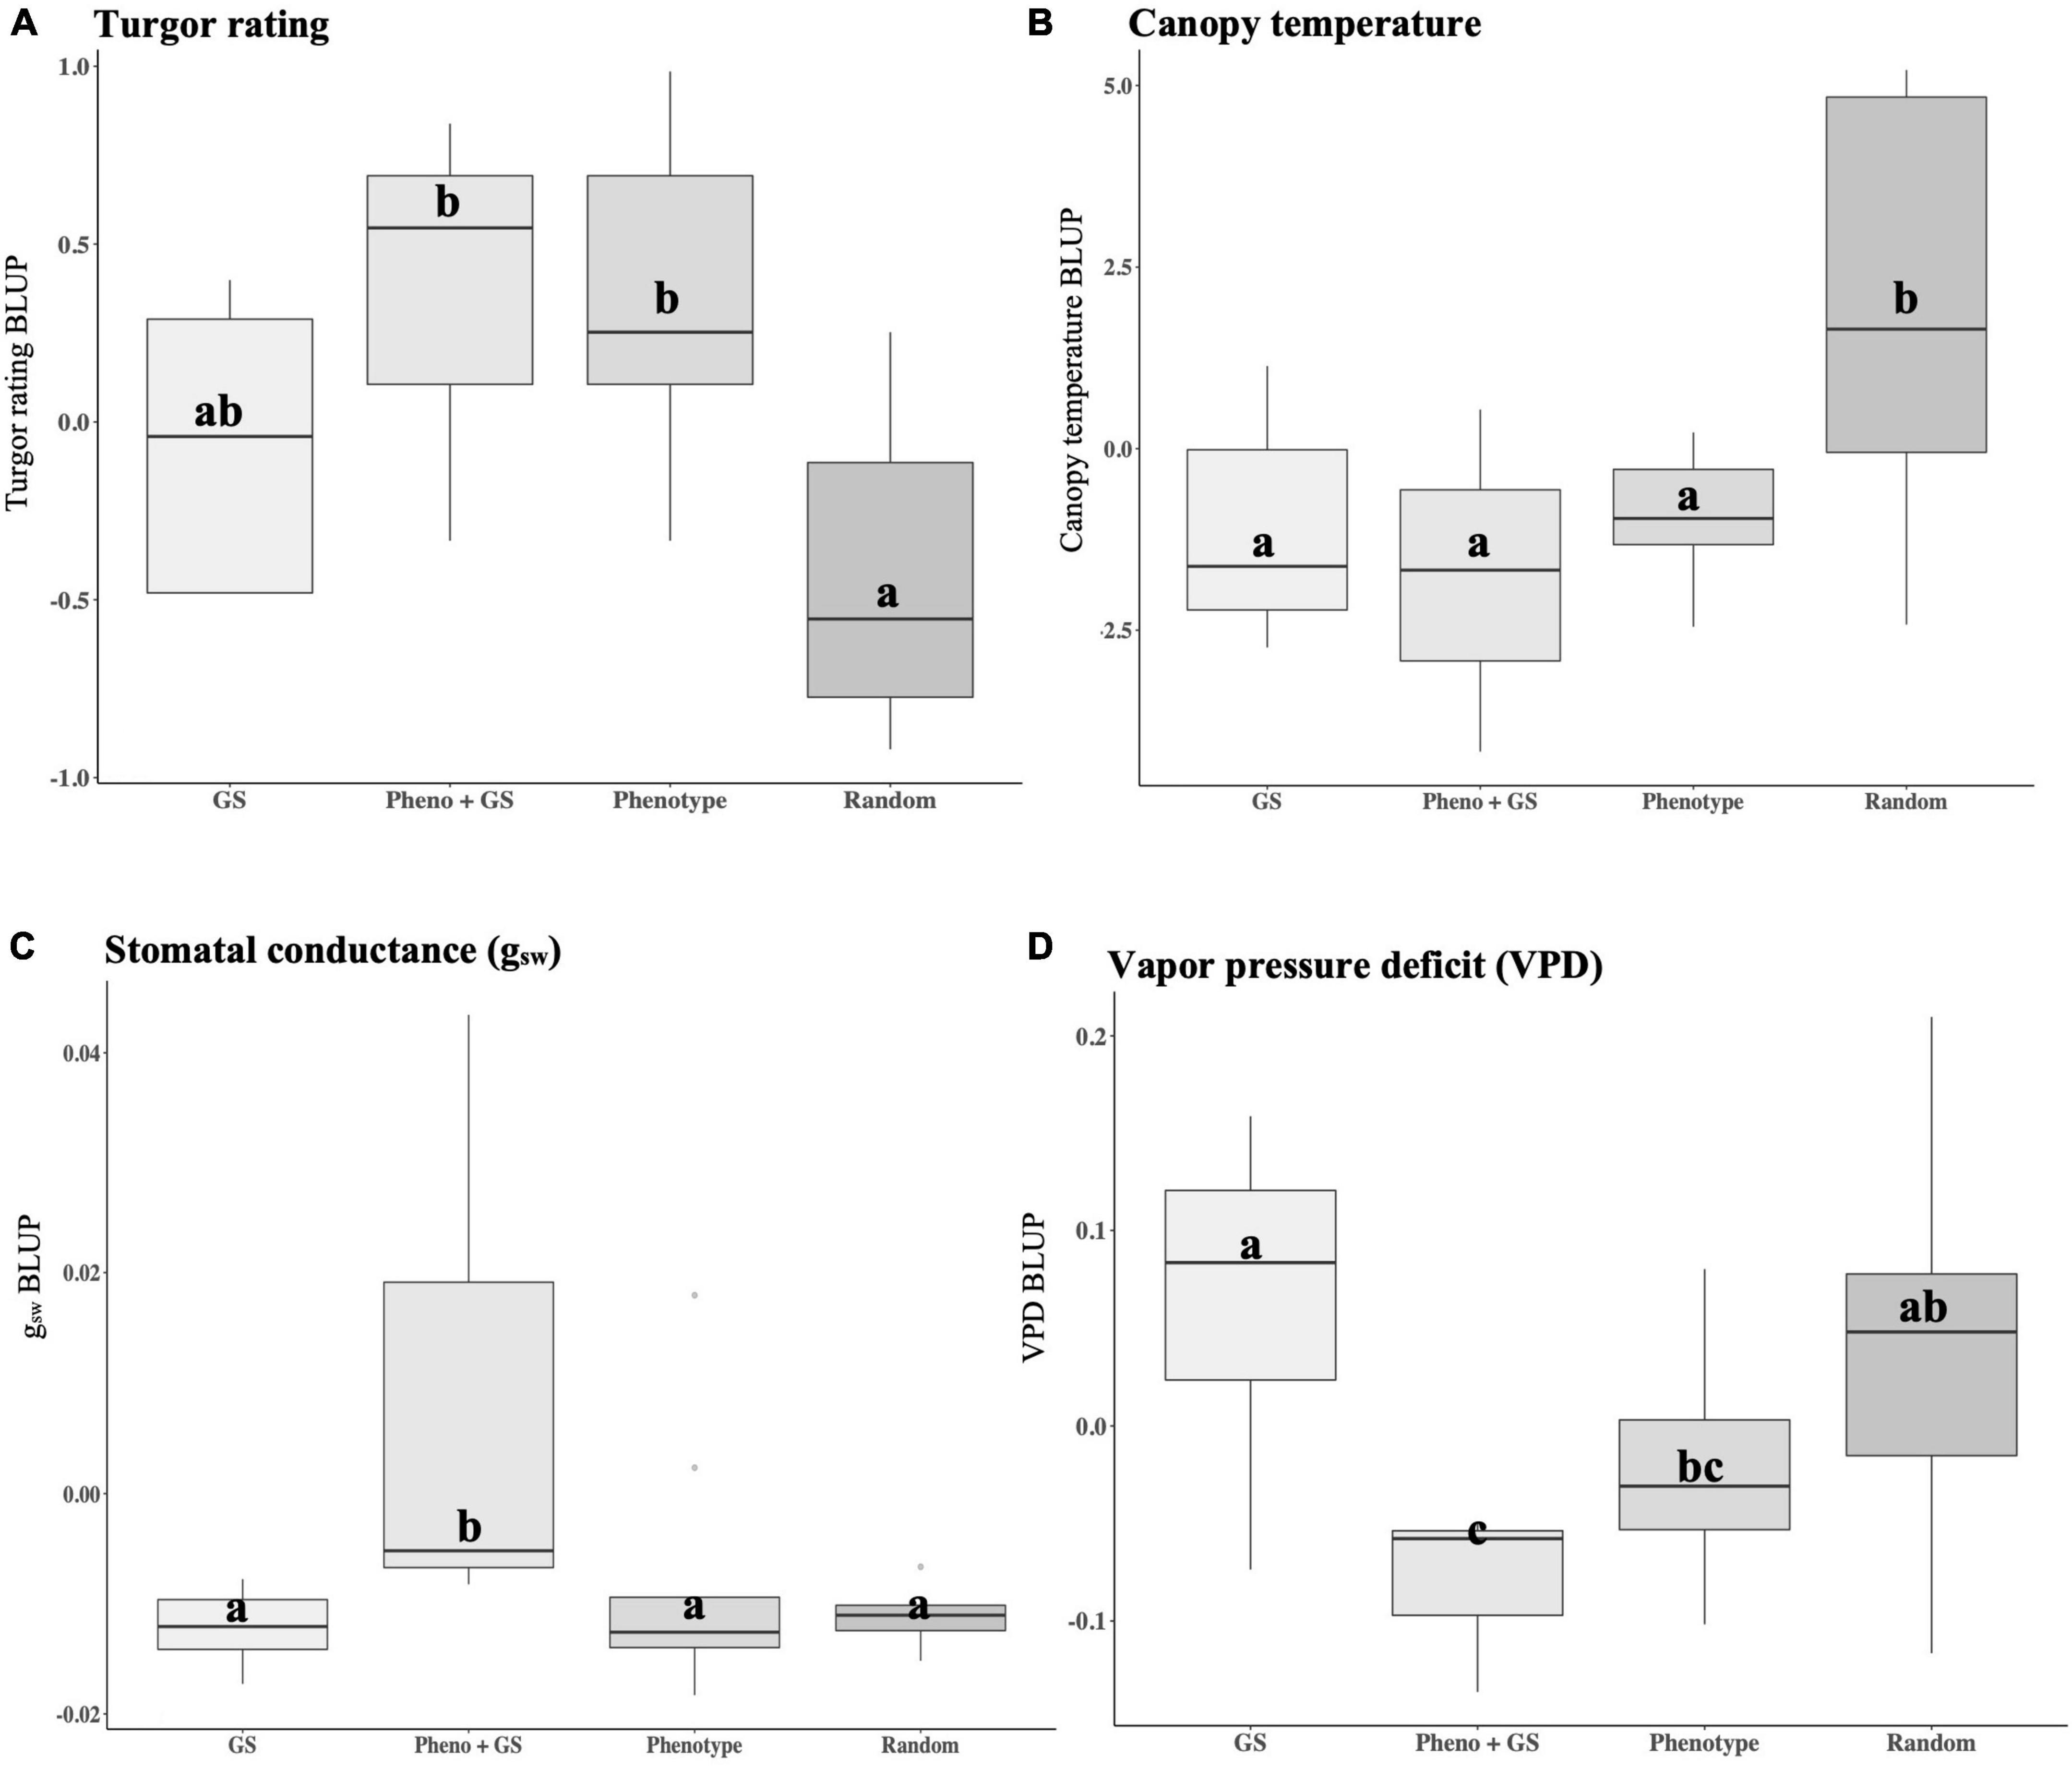
Figure 5. Boxplots comparing group performance of groups corresponding to selection strategies under water deficit. Traits were measured as best linear unbiased predictors (BLUPs) and include (A) plant turgor ratings, (B) canopy temperature, (C) stomatal conductance (gsw), and (D) vapor pressure deficit (VPD). Selection strategy groups were based on GEBVs (GS, N = 8), LA1141 × OH8245 BC2S3 canopy temperature, and turgor BLUPs (Pheno, N = 9), a combination of the two (GS + Pheno, N = 3), and randomly advanced lines (Random, N = 10). Each IBL was replicated three times within the selection strategy. Turgor ratings ranged from 1 to 5 (5 = turgid, 4 = soft to the touch, 3 = beginning to wilt, 2 = wilted with complete loss of turgor, and 1 = dead) as described previously (Waterland et al., 2010). Canopy temperature was estimated using the FLIRONE GEN3 iOS thermal camera (FLIR Systems Wilsonville, OR, United States). Physiological measurements were measured with the LI-600 Porometer/Fluorometer (LI-COR Biosciences, Lincoln, NE, United States) and included stomatal conductance (gsw mol m–2 s–1) and vapor pressure deficit (VPD kPa). Values are reported at the time point where they reach their maximums. Different letters indicate statistically significant differences among groups (Tukey’s honestly significant difference, p < 0.05).
Similarly, selection for lower canopy temperature resulted in observed genetic gains. Differences between the BC2S3 families and BC2S5 lines chosen based on GEBVs for canopy temperature lowered the canopy temperature to 0.79°C (Table 3). Lines selected using combined strategies lowered the canopy temperature to 1.43°C (Table 3). Phenotypically selected BC2S5 progenies resulted in gain under selection by lowering canopy temperature to 0.57°C (Table 3). In contrast, random selection raised canopy temperature by 2.31°C (Table 3). In conclusion, all selection strategies lowered canopy temperature compared to random selection (Figure 5B).
Selected water deficit tolerance based on high turgor and low canopy temperature also had the result of improving physiological measurements. Statistical differences for physiological measurements were observed for advanced lines chosen using combined selection strategies. Selected lines based on combined strategies maintained higher gsw and lower VPD compared to randomly advanced lines (Figures 5C,D) suggesting that genomic selection can be used to augment phenotypic selection and indirectly select for improved plant physiological status under water deficit. Therefore, genomic, and phenotypic selection for turgor and canopy temperature are indirect methods to improve plant physiological response under water deficit stress. On average, genomic, phenotypic, and the combined strategies had gsw values that were 0.007 mol H2O m–2 s–1 higher and VPD values that were 0.047 kPa lower relative to randomly advanced lines (Figure 5). These results suggested that progress toward tolerance to water deficit stress measured by turgor, canopy temperature, gsw, and VPD was achieved with phenotyping workflows and selection indices.
To gain additional insight into the genetics of low canopy temperature and high turgor under water deficit stress, we evaluated our selections for recovery of putative QTL derived from LA1141. Four selections based on phenotype (20% of total selections) possess the LA1141 introgression on chromosome 1b associated with canopy temperature (Table 2). First selection based on GEBV and second selection based on phenotype (15% of total selections) have the introgression from LA1141 on chromosome 6 associated with canopy temperature (Table 2). Three selections based on GEBV, four based on phenotype, and one selected with combined strategies (40% of total selections) have the introgressions from LA1141 on chromosome 5 associated with high turgor (Table 2). Three selections based on phenotype, one selected by combined strategies, and one selected based on genomic selection (20% of total selections) have the introgression from LA1141 on chromosome 7 associated with high turgor (Table 2). The expected frequency of a LA1141 allele in the BC2S3 population is 12.5%. The observed frequency of QTLs is, therefore, higher than expected on chromosome 1b (χ2 = 5.14, p = 0.022), chromosome 5 (χ2 = 69.14, p = 0.001), and chromosome 7 (χ2 = 5.14, p = 0.022). However, recovery of the QTL on chromosome 6 approaches the expected frequency (χ2 = 0.57, p = 0.450).
A field trial was conducted to evaluate the performance of advanced BC2S5 selections that were chosen using genomic and phenotypic strategies to establish whether important agronomic and quality traits from the OH8245 recurrent parent were recovered. The fruit size of all BC2S5 selections was smaller (p = 8.07e-13) than the OH8245 (Table 4). However, some BC2S5 selections have acceptable yield, canopy width, fruit color, and fruit quality (Table 4). Acceptable values of traits were based on ranges observed in processing tomato germplasm (Merk et al., 2012). The acceptable range for canopy width in processing tomatoes is between 75 to 110 cm. In our trial, 65% of selections had an acceptable canopy size, while 25% had canopy size that was too small, and 10% had canopy sizes that were too large (Table 4). Lower values of hue, an angular measurement, represent the visible property of color. Values of L*, a coordinate that indicates the darkness (0) to lightness (100) of color, are associated with increased redness of tomatoes. Ten percent of our selections had improved L* values relative to the recurrent parent, and 100% of selections had an acceptable range of L* (Table 4). Additionally, 10% had improved hue measurements relative to the recurrent parent, and all selections had an acceptable range of hue (Table 4). Low estimates of the physiological color disorder, yellow shoulder (%YSD), are also associated with improved tomato color (Table 4). Forty-five percent of selections exceeded the acceptable cutoff for %YSD (Table 4).
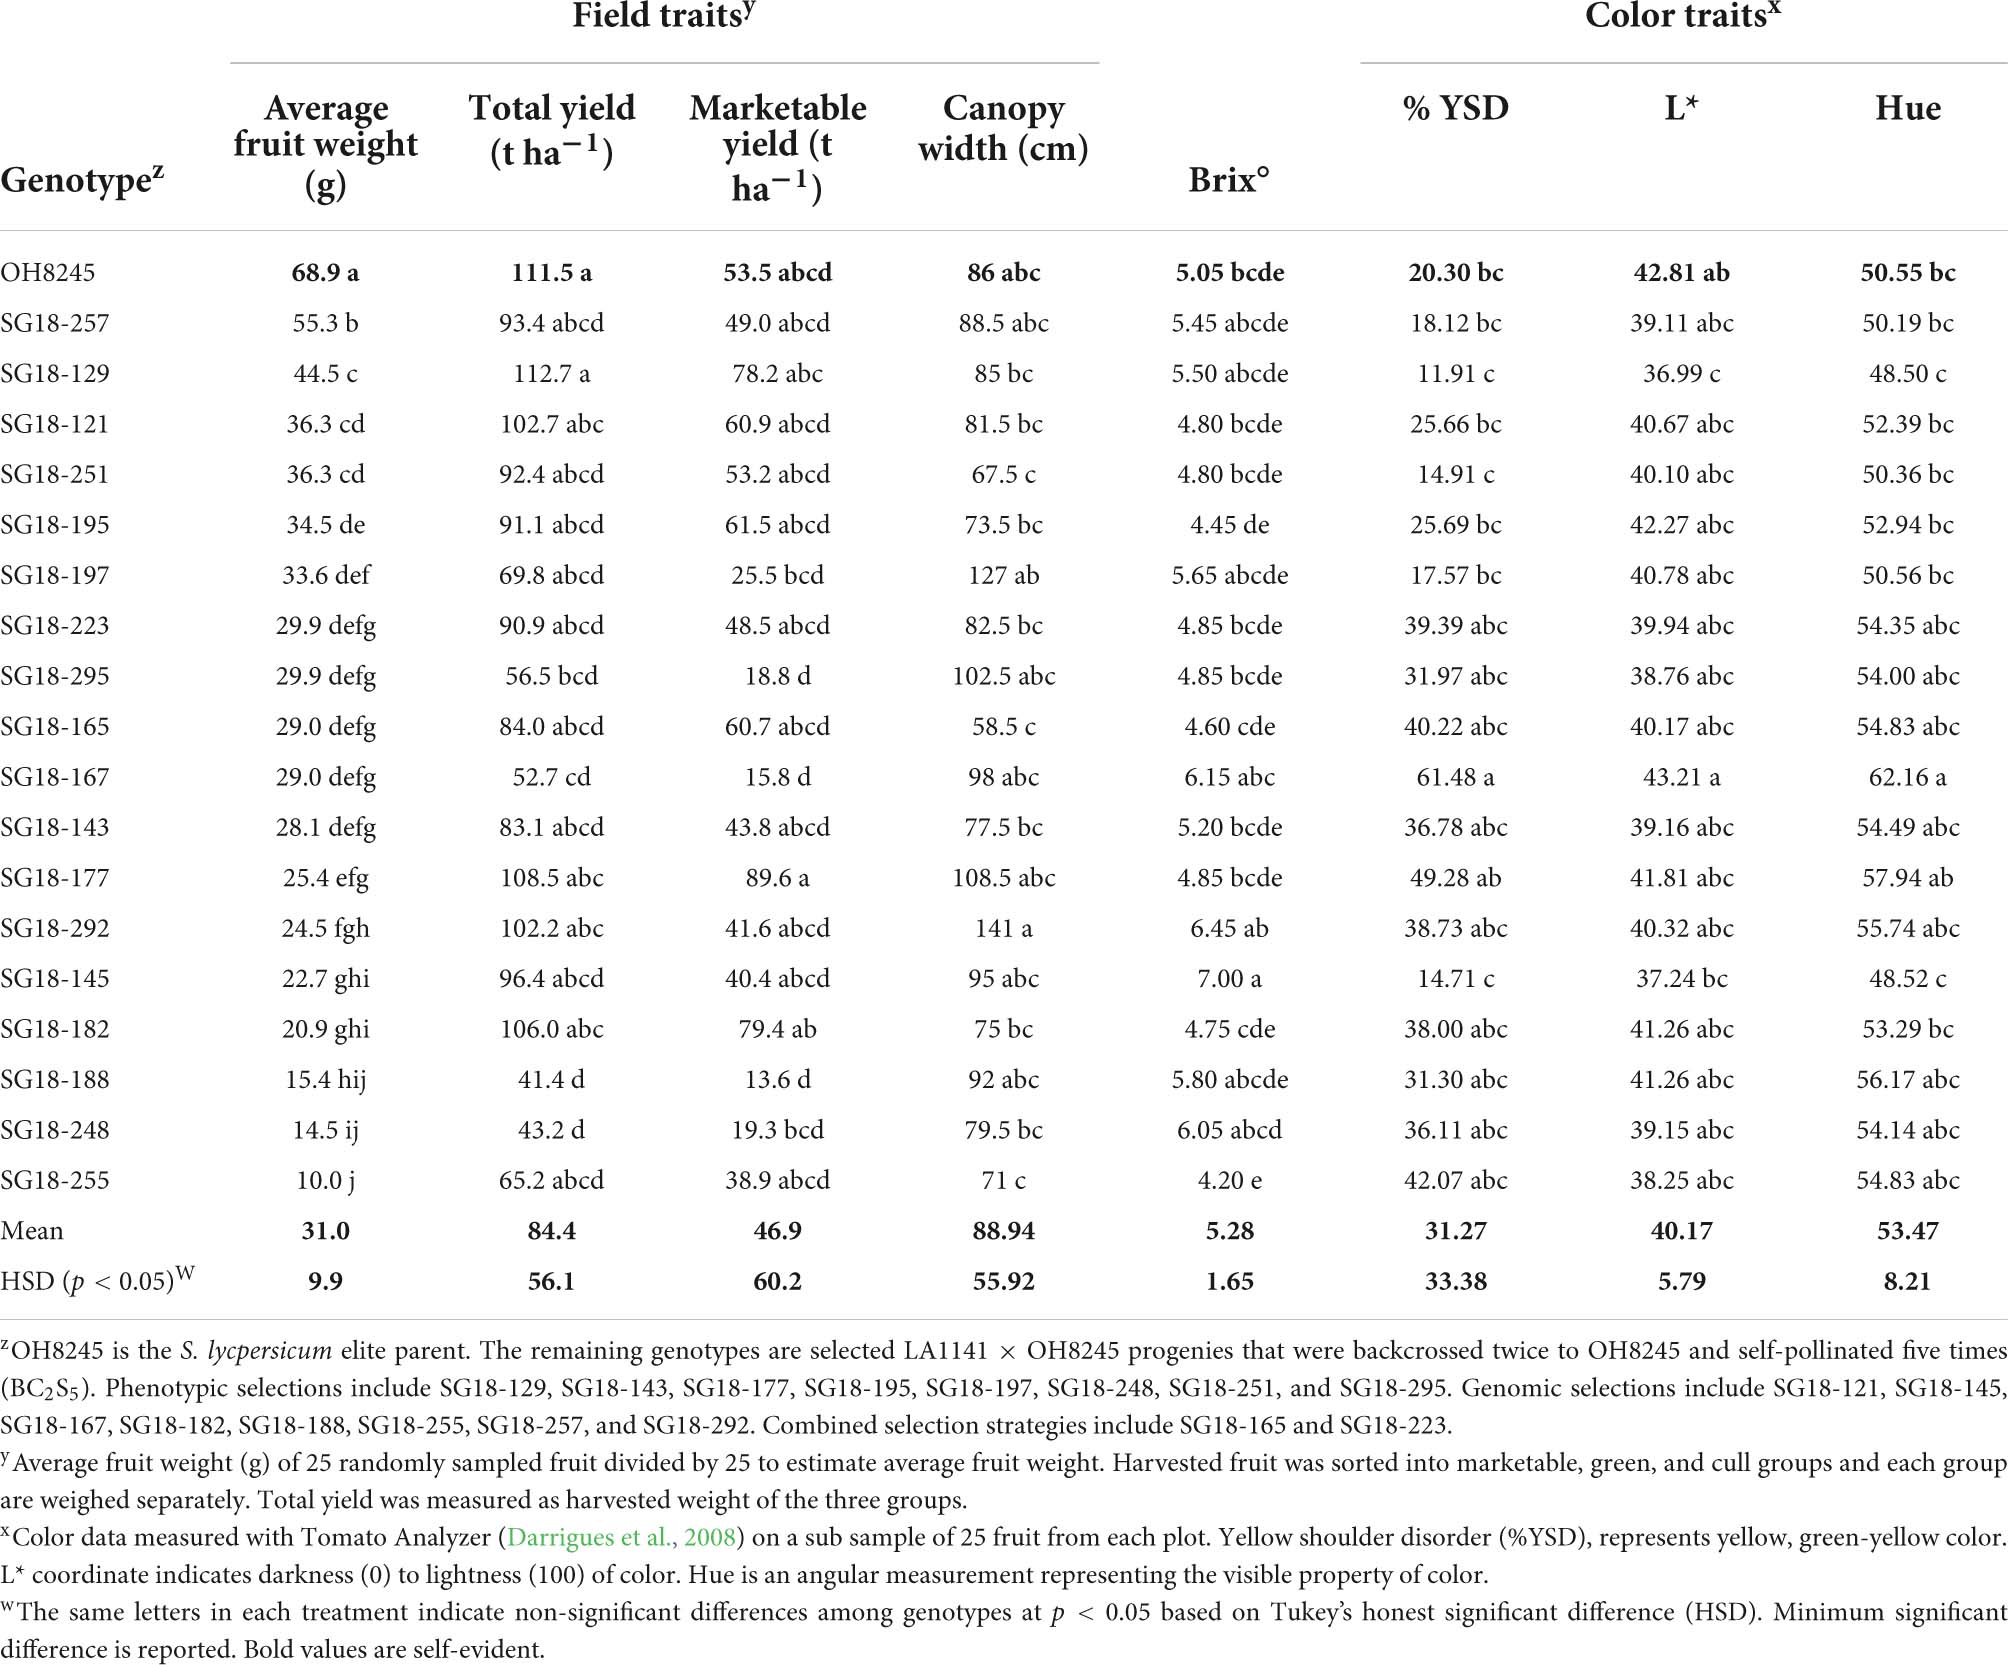
Table 4. Evaluation of the LA1141 × OH8245 BC2S5 selected progenies for horticultural traits compared to the OH8245 recurrent parent.
All selections had acceptable Brix° values relative to the OH8245 recurrent parent (Table 4). One selection had a higher Brix° than OH8245. However, this selection ranked 14th out of 20 in fruit size (Table 4). A BC2S5 selection chosen based on phenotype, SG18-129, and a BC2S5 selection chosen with genomic selection, SG18-145, had improved tomato color relative to OH8245. SG18-129 and SG18-145 also had acceptable canopy sizes (Table 4). Additionally, BC2S5 selection SG18-129 had numerically higher yield and numerically higher Brix° than OH8245. However, those differences in yield were not significant (Table 4).
Solanum galapagense accession LA1141 and S. lycopersium OH8245 have different physiological responses to water deficit stress. Both morphological and physiological responses can contribute to water deficit tolerance (Koch et al., 2019; Pardo and VanBuren, 2021). Accession LA1141 demonstrates the ability to withstand deficit irrigation for as much as 144 h before wilting is observed. The physiological basis of this tolerance requires further investigation, but a mechanism mediated by stomatal conductance (gsw) is plausible. Similarities of gsw at saturation and genetic variation in advanced selections are promising indicators that it is possible to select for gsw while maintaining plant growth and yield. Previous studies have shown that VPD and gsw are suitable proxies for osmotic adjustment and yield maintenance in plants grown under water deficit stress (Bazzer and Purcell, 2020). Accession LA1141 and advanced selections have lower VPD, higher gsw, and lower canopy temperature after 72 h of water deficit compared to OH8245 and randomly advanced lines, suggesting genetic variation for osmotic adjustments under water deficit stress is present in the population. The putative osmotic adjustment mechanism appears to be independent of leaf anatomy as advanced lines are 87.5% recurrent parent genome and most of the tolerant selections possess the recurrent parent leaf morphological phenotype. For example, the phenotypic selection SG18-197 is shown (Figure 1) and leaf morphology is characteristic of the OH8245 recurrent parent.
Tomato plants often exhibit isohydric (saver) and anisohydic (spender) responses to water deficit stress (Sade et al., 2012). A typical isohydric response involves a decline in gsw before any adverse effects of water shortage arise in the canopy (Sade et al., 2012). In contrast, ansiohydric response involves a decline in leaf water potential and stomatal conductance proportional to soil moisture (Sade et al., 2012). Physiological data suggest that LA1141 behaves more like an isohydric plant because of its ability to maintain low canopy temperature, higher gsw, and lower VPD after 72 h of water deficit. In contrast, OH8245 appears to behave like an ansiohydric plant, a response that is associated with higher yields and biomass under moderate stress. This response of OH8245 is consistent with its previously described physiology compared to water deficit tolerant Mediterranean tomato germplasm (Galmés et al., 2011). In situations of water deficit that result in a plant reaching a permanent wilting point, anisohydric behavior may endanger plant survival (Sade et al., 2012). However, plant recovery after deficit irrigation was not evaluated in these studies.
Image-based estimations of canopy temperature in plants subjected to water deficit can serve as a proxy to plant physiological response. Interest in using canopy temperature as an indicator of plant stress has an extensive history (Jackson et al., 1981; Jones et al., 2002; Gerhards et al., 2016; Perera et al., 2020). Canopy temperature is directly proportional to stomatal conductance in many crops that are subjected to water deficit conditions (Jackson et al., 1988; Ramírez et al., 2016; Fukuda et al., 2018). Canopy temperature can be measured radiometrically using infrared thermometry and by extracting temperature from digital images (Blum et al., 1982; Babar et al., 2006; Gräf et al., 2021). Increased efficiencies achieved using infrared thermometry (Blum et al., 1982) or thermal images (thermography) (Ru et al., 2020; Vieira and Ferrarezi, 2021) enable high throughput data collection to characterize the physiological and genetic consequences of water-deficit stress in large populations or germplasm screens. Genetic variation for canopy temperature has been identified and used for plant improvement in both grain (Lopes et al., 2012) and vegetable crops (Prashar et al., 2013). For example, genetic variation for canopy temperature in runner beans and wheat is linked to maintaining stomatal conductance in water-limited environments (Fischer et al., 1998; Jones, 1999).
Genetic studies suggest tolerance to water deficit stress is a polygenic trait controlled by several small-effect QTLs (Sacco et al., 2013). Hundreds of genes can be activated or repressed in response to water deficit stress (Bray, 2004), making it hard to pinpoint which gene contributes to tolerance. An improved understanding of both the physiological traits and the genetic basis of plant response to water deficit may result in genetic gains in breeding programs by determining the proportion of genetic variation present in populations, estimating the heritability of traits associated with response to water deficit, and modeling environmental effects on traits of interest (Mir et al., 2012).
Generally, when plants experience water deficit stress, their stomata close as a strategy to conserve water. As stomatal conductance declines in response to this closure, leaf temperature can increase rapidly due to loss of evaporative cooling, and an increase in convective heat exchange (Jackson et al., 1988; Lambers et al., 2008). The physical phenomenon of stomatal closure in response to water deficit is inversely proportional to VPD, and the closure also leads to decreased transpiration and carbon assimilation (Lambers et al., 2008). Measuring plant canopy temperature under water deficit may, therefore, provide an efficient phenotyping alternative to physiological measurements of both stomatal conductance (Zhao et al., 2021) and VPD (Grossiord et al., 2020).
Assessment of canopy temperature provided an efficient measure of response to water deficit stress. Plants under water deficit stress generally have reduced gsw, limited transpiration, and increased canopy temperature. Therefore, canopy temperature was used to proxy these traits. Additionally, canopy temperature was used to phenotype and select tolerant BC2S3 families and recovered progenies that maintain higher gsw and lower VPD under deficit irrigation. This suggested that indirect selection was possible with canopy temperature and turgor evaluations. The image analysis workflow was scalable to large populations and efficient for accurate phenotyping in the greenhouse. Water deficit stress evaluations of plants with images partitioned a higher proportion of the total variance into genetics, improved the objectivity of evaluations, and saved time.
Thermal image and IRT estimated canopy temperature are both effective phenotyping strategies, but IRT measures canopy temperature using single-point leaf measurements. These single-point measurements may not capture the entire gradient of temperature across the canopy (Figure 3). Temperature gradients across the canopy are likely why point measurements partition more variance into environmental factors and error relative to genetic factors (Table 1). Thermal image analysis also detected a greater range of differences in susceptible genotypes than the IRT. Additionally, the image-based analysis identified a canopy temperature’s QTL on the distal arm of chromosome 1 in our composite interval mapping study that was detected across seasonal environments but not detected with IRT (Table 2 and Figure 4). Canopy temperature measured by image-based methods may bring greater discrimination and sensitivity for selection and genetic analysis. Importantly, the thermal imaging workflow detected stress before the appearance of wilt symptoms (Supplementary Figure 4). Although thermal imaging was an effective method for trait evaluation in our studies, plant turgor ratings had the highest estimates of variance partitioned into genetic effects (Table 1). High-throughput phenotyping is promoted to reduce time, costs, and resources to screen populations in breeding programs (Cabrera-Bosquet et al., 2012; Fahlgren et al., 2015; Araus et al., 2018). However, visual evaluation of plant response to water deficit using a visual turgor index (Waterland et al., 2010) appears to be an effective method for evaluating germplasm.
Composite interval mapping helped discover chromosomal regions associated with low canopy temperature and higher turgor under water deficit stress (Figure 4). We found evidence for four QTLs, three of which were reproducible across environments and within the combined analysis. As expected, tolerance derived from LA1141 appears to be mediated by many loci and no large-effect QTLs were found. One interpretation of these results is that water deficit tolerance as measured by turgor and canopy temperature is genetically complex, with many QTL falling below the detection threshold. Genomic selection models offered a solution to the genetic complexity of water deficit stress tolerance because of their capacity to handle traits with many small-effect QTL (Crossa et al., 2017). The number of selections that possessed introgression from LA1141 that were associated with putative QTL and were discovered in the mapping study ranged from 15 to 40%, suggesting that we can select for putative QTL and make progress using an introgression strategy, even if the effects of allele substitutions and proportion of phenotypic variance explained are relatively low.
Phenotypic selection based on high throughput thermal image analysis via proximal sensing and genomic selection provides methods to improve response to deficit irrigation in progenies derived from the LA1141 × OH8245 families. Selection strategies based on canopy temperature and turgor also indirectly improved plant physiological response under water deficit measured by gsw and VPD. Overall, prediction accuracy suggested that genomic selection alone may be an effective strategy for evaluating germplasm for tolerance to deficit irrigation as measured by low canopy temperature and high turgor. Additionally, using genomic selection in the future may save time spent phenotyping in additional generations during germplasm screens. Gain under selection was achieved for canopy temperature and turgor ratings. Selection models that incorporate low canopy temperature and visual plant ratings associated with high turgor have also indirectly selected lines with higher gsw and lower VPD under deficit irrigation. Again, this suggests that our phenotyping methodology can be used to proxy plant physiological response and will potentially save time during future germplasm screens. In summary, phenotypic, genomic, and combined selection strategies have identified advanced lines with improved performance when grown under water deficit stress relative to randomly advanced lines. In our evaluations, improved performance was indicated by lower canopy temperature, higher turgor ratings, higher gsw, and lower VPD. These results provided a measure and confirmation of direct and indirect genetic gain toward water-deficit stress tolerance in our parent material, inbred backcross families, and selected progenies.
Water-deficit stress tolerance may also be selected for in-breeding populations using knowledge of marker-trait associations. Quantifying canopy temperature responses in large populations rapidly with objective and repeatable methods may improve QTL discovery. The genetic complexity of water deficit tolerance and the number of loci that may potentially be involved suggests that alternative strategies that estimate genome-wide effects to predict progeny performance have merit. Genomic selection (GS) (Heffner et al., 2010; Lorenz et al., 2011) changes the focus of analysis from identifying significant associations for QTL to estimating the effect of each marker across the genome. The sum of individual effects provides a genomic estimated breeding value for each family in the population. Our results confirm that GS strategies can be coupled with quantitative phenotyping to develop appropriate selection methods for traits associated with improved physiological status under water deficit. If adequate selection accuracies for complex traits can be achieved, GS has the potential to expedite genetic gain (Heffner et al., 2010; Cabrera-Bosquet et al., 2012). Selection indices developed in this study provide a framework to improve water deficit tolerance using both GS and phenotypic strategies.
Acceptable yield, canopy width, and quality parameters were recovered in selections that were chosen based on phenotypic, genomic, and combined strategies. These results demonstrate that we can create selection indices to improve water-deficit tolerance in a recurrent parent background. Additionally, future crossing and evaluation are warranted. The fruit size of selections was small compared to the recurrent parent. Still, some selections yield well and have a canopy size that falls within the acceptable range for commercial processing tomatoes. The failure to recover acceptable fruit size is not surprising in an advanced BC2 population that used a small-fruited wild accession as the tolerant donor parent. Further crossing and selection will be needed to combine water-deficit stress tolerance and recurrent parent fruit size. However, traits associated with water deficit stress tolerance were successfully introgressed, and at the same time, important agronomic and quality traits associated with commercial processing tomatoes were also recovered.
This work was initiated for the simultaneous introgression and discovery of tolerance to water deficit exhibited by the crop wild relative S. galapagense accession LA1141. A thermal image analysis workflow was developed for the population screens, provided an efficient measure of canopy temperature, and was a suitable proxy for physiological traits like gsw and VPD. Analysis of canopy temperature using thermal images at 48 h of water deficit was able to predict turgor ratings, stomatal conductance, and vapor pressure deficit at 72 h water deficit stress. These results suggested that additional efficiencies based on time can be achieved for population evaluations. We were able to identify putative QTL derived from LA1141 associated with low canopy temperature and the ability to maintain high turgor in plants under water deficit. However, no large-effect QTLs were identified. Genomic and phenotypic selection indices offered a feasible strategy to recover tolerance in advanced lines despite the complexity of the trait. Additionally, applying both phenotype-based and genomic selection resulted in the recovery of the putative QTL at a higher-than-expected frequency. Although we successfully selected tomato lines tolerant to water deficit stress, we were unable to recover the fruit size for the direct commercial use of these selections. Finally, the germplasm created in these studies provides a resource for studying traits from LA1141, and we can use the advanced BC2S5 selections for future tomato improvement.
The datasets presented in this study can be found in online repositories. The names of the repository/repositories and accession number(s) can be found in the article/Supplementary material.
SF and DF: conceptualization and experimental design. SF, JC, and JM: phenotyping. SF: high throughput pipeline development and analysis and writing. SF, KM, and DF: data analysis. SF, JC, and DF: population development. JM, KM, and DF: contribution to writing. All authors contributed to the article and approved the submitted version.
Salaries and research support were provided by state and federal funds appropriated to The Ohio State University, Ohio Agricultural Research and Development Center (OARDC), Hatch project OHO01405, and grant funds from USDA Specialty Crops Research Initiative Award number 2016-51181-25404.
The authors declare that the research was conducted in the absence of any commercial or financial relationships that could be construed as a potential conflict of interest.
All claims expressed in this article are solely those of the authors and do not necessarily represent those of their affiliated organizations, or those of the publisher, the editors and the reviewers. Any product that may be evaluated in this article, or claim that may be made by its manufacturer, is not guaranteed or endorsed by the publisher.
We thank the farm crews from the Ohio Agricultural Research and Development Center (OARDC) Wooster for their assistance with the management of the research. We thank Marcela Carvalho Andrade, Regis de Castro Carvalho, and Wilson Roberto Maluf from The Federal University of Lavras, 37200-000 Lavras, Brazil for assistance with developing the LA1141 IBC population. Additionally, we thank Jessica Cooperstone, Christine Sprunger, and Chieri Kubota, for their constructive comments and insight, which greatly helped to improve the manuscript. Additionally, we also acknowledge Glenn Tattersall, from the department of Biological Sciences at Brock University, for the development of open-source thermal image tools that were used to create our analysis pipeline.
The Supplementary Material for this article can be found online at: https://www.frontiersin.org/articles/10.3389/fpls.2022.947538/full#supplementary-material
Araus, J. L., Kefauver, S. C., Zaman-Allah, M., Olsen, M. S., and Cairns, J. E. (2018). Translating high-throughput phenotyping into genetic gain. Trends Plant Sci. 23, 451–466. doi: 10.1016/j.tplants.2018.02.001
Babar, M. A., Reynolds, M. P., Van Ginkel, M., Klatt, A. R., Raun, W. R., and Stone, M. L. (2006). Spectral reflectance to estimate genetic variation for in-season biomass, leaf chlorophyll, and canopy temperature in wheat. Crop Sci. 46, 1046–1057. doi: 10.2135/cropsci2005.0211
Bates, D., Maechler, M., Bolker, B. M., and Walker, S. (2015). Fitting linear mixed-effects models using lme4. J. Stat. Softw. 67, 1–48. doi: 10.18637/jss.v067.i01
Bazzer, S. K., and Purcell, L. C. (2020). Identification of quantitative trait loci associated with canopy temperature in soybean. Sci. Rep. 10, 17604. doi: 10.1038/s41598-020-74614-8.
Berry, S. Z., Gould, W. A., and Wiese, K. L. (1991). ‘Ohio 8245’ processing tomato. HortScience 26:1093. doi: 10.21273/HORTSCI.26.8.1093
Blum, A., Mayer, J., and Gozlan, G. (1982). Infrared thermal sensing of plant canopies as a. Field Crops Res. 5, 137–146. doi: 10.1016/0378-4290(82)90014-4
Bojacá, C. R., Gil, R., and Cooman, A. (2009). Use of geostatistical and crop growth modelling to assess the variability of greenhouse tomato yield caused by spatial temperature variations. Comput. Electronics Agric. 65, 219–227. doi: 10.1016/j.compag.2008.10.001
Bray, E. A. (2004). Genes commonly regulated by water-deficit stress in Arabidopsis thaliana. J. Exp. Bot. 55, 2331–2341. doi: 10.1093/jxb/erh270
Broman, K. W., Wu, H., Sen, Ś, and Churchill, G. A. (2003). R/qtl: QTL mapping in experimental crosses. Bioinformatics 19, 889–890. doi: 10.1093/bioinformatics/btg112
Brozynska, M., Furtado, A., and Henry, R. J. (2016). Genomics of crop wild relatives: expanding the gene pool for crop improvement. Plant Biotechnol. J. 14, 1070–1085. doi: 10.1111/pbi.12454
Cabrera-Bosquet, L., Crossa, J., von Zitzewitz, J., Serret, M. D., and Luis Araus, J. (2012). High-throughput Phenotyping and genomic selection: the frontiers of crop breeding converge. J. Integr. Plant Biol. 54, 312–320. doi: 10.1111/j.1744-7909.2012.01116.x
Castro, M. (1968). Tomato Genetics Resource Center. Tomato Genetics Resource Center. Available online at: https://tgrc.ucdavis.edu/Data/Acc/dataframe.aspx?start=AccSearch.aspx&navstart=nav.html (accessed October, 2021).
Churchill, G. A., and Doerge, R. W. (1994). Empirical threshold values for quantitative trait mapping. Genetics 138, 963–971. doi: 10.1093/genetics/138.3.963
Crossa, J., Pérez-Rodríguez, P., Cuevas, J., Montesinos-López, O., Jarquín, D., and de los Campos, G. (2017). Genomic selection in plant breeding: methods, models, and perspectives. Trends Plant Sci. 22, 961–975. doi: 10.1016/j.tplants.2017.08.011
Dariva, F. D., Copati, M. G. F., Pessoa, H. P., Alves, F. M., Dias, F. D. O., and Picoli, E. (2020). Evaluation of anatomical and physiological traits of Solanum pennellii Cor. associated with plant yield in tomato plants under water-limited conditions. Sci. Rep. 10:16052. doi: 10.1038/s41598-020-73004-4
Darrigues, A., Hall, J., Van Der Knaap, E., Francis, D. M., Dujmovic, N., and Gray, S. (2008). Tomato analyzer-color test: a new tool for efficient digital phenotyping. J. Am. Soc. Hortic. Sci. 133, 579–586. doi: 10.21273/JASHS.133.4.579
Darwin, S. C., Knapp, S., and Peralta, I. E. (2003). Taxonomy of tomatoes in the galápagos islands: native and introduced species of solarium section lycopersicon (solanaceae). Syst. Biodiversity 1, 29–53. doi: 10.1017/S1477200003001026
De Mendiburu, F. (2017). Package ‘Agricolae’: Statistical Procedures for Agricultural Research, R Package Version 1.2–4.
Endelman, J. B. (2011). Ridge regression and other kernels for genomic selection with R Package rrBLUP. Plant Genome 4, 250–255. doi: 10.3835/plantgenome2011.08.0024
Fahlgren, N., Gehan, M. A., and Baxter, I. (2015). Lights, camera, action: high-throughput plant phenotyping is ready for a close-up. Curr. Opinion Plant Biol. 24, 93–99. doi: 10.1016/j.pbi.2015.02.006
Falconer, D. S., and Mackay, T. F. C. (1996). Introduction to Quantitative Genetics (4th). Hoboken, NJ: Prentice Hall.
Federer, W. T., and Raghavarao, D. (1975). On augmented designs. Biometrics 31, 29–35. doi: 10.2307/2529707
Fenstemaker, S., Sim, L., Cooperstone, J., and Francis, D. (2022). Solanum galapagense-derived purple tomato fruit color is conferred by novel alleles of the Anthocyanin fruit and atroviolacium loci. Plant Direct 6:e394 doi: 10.1002/pld3.394
Fischer, R. A., Rees, D., Sayre, K. D., Lu, Z. M., Condon, A. G., and Larque Saavedra, A. (1998). Wheat yield progress associated with higher stomatal conductance and photosynthetic rate, and cooler canopies. Crop Sci. 38, 1467–1475. doi: 10.2135/cropsci1998.0011183X003800060011x
Foolad, M. R. (2007). “Current status of breeding tomatoes for salt and drought tolerance,” in Advances in Molecular Breeding Toward Drought and Salt Tolerant Crops, Eds M. A. Jenks, P. M. Hasegawa and S. M. Jain. Berlin: Springer
Fukuda, A., Kondo, K., Ikka, T., Takai, T., Tanabata, T., and Yamamoto, T. (2018). A novel QTL associated with rice canopy temperature difference affects stomatal conductance and leaf photosynthesis. Breed. Sci. 68, 305–315. doi: 10.1270/jsbbs.17129
Galmés, J., Conesa, M. A., Ochogavía, J. M., Perdomo, J. A., Francis, D. M., Ribas-Carbó, M., et al. (2011). Physiological and morphological adaptations in relation to water use efficiency in mediterranean accessions of Solanum lycopersicum. Plant Cell Environ. 34, 245–260. doi: 10.1111/j.1365-3040.2010.02239.x
Gerhards, M., Rock, G., Schlerf, M., and Udelhoven, T. (2016). Water stress detection in potato plants using leaf temperature, emissivity, and reflectance. Int. J. Appl. Earth Obs. Geoinf. 53, 27–39. doi: 10.1016/j.jag.2016.08.004
Glasbey, C. A. (1993). An analysis of histogram-based thresholding algorithms. Graph. Models Image Process. 55, 532–537. doi: 10.1006/cgip.1993.1040
Gräf, M., Immitzer, M., Hietz, P., and Stangl, R. (2021). Water-stressed plants do not cool: leaf surface temperature of living wall plants under drought stress. Sustainability 13:3910. doi: 10.3390/su13073910
Grossiord, C., Buckley, T. N., Cernusak, L. A., Novick, K. A., Poulter, B., Siegwolf, R. T. W., et al. (2020). Plant responses to rising vapor pressure deficit. New Phytol. 226, 1550–1566. doi: 10.1111/nph.16485
Haley, C. S., and Knott, S. A. (1992). A simple regression method for mapping quantitative trait loci in line crosses using flanking markers. Heredity 69, 315–324. doi: 10.1038/hdy.1992.131
Hamlin, J. A. P., Hibbins, M. S., and Moyle, L. C. (2020). Assessing biological factors affecting postspeciation introgression. Evol. Lett. 4, 137–154. doi: 10.1002/evl3.159
Harvey, P. (2020). ExifTool by Phil Harvey: Read, Write and Edit Meta Information. Available online at: https://exiftool.org/ (accessed June 2020).
Heffner, E. L., Lorenz, A. J., Jannink, J. L., and Sorrells, M. E. (2010). Plant breeding with genomic selection: gain per unit time and cost. Crop Sci. 50, 1681–1690. doi: 10.2135/cropsci2009.11.0662
Horwitz, J. W. (1999). Water at the ice point: a useful quasi-blackbody infrared calibration source. Appl. Optics 38:4053. doi: 10.1364/AO.38.004053
Hosmani, P. S., Flores-Gonzalez, M., Geest, H., Maumus, F., Bakker, L. V., Schijlen, E., et al. (2019). An improved de novo assembly and annotation of the tomato reference genome using single-molecule sequencing, Hi-C proximity ligation and optical maps. BioRxiv [Preprint] doi: 10.1101/767764
Inoue, Y., Kimball, B. A., Jackson, R. D., Pinter, P. J., and Reginato, R. J. (1990). Remote estimation of leaf transpiration rate and stomatal resistance based on infrared thermometry. Agric. For. Meteorol. 51, 21–33. doi: 10.1016/0168-1923(90)90039-9
Jackson, R. D., Idso, S. B., Reginato, R. J., and Pinter, P. J. (1981). Canopy temperature as a crop water stress indicator. Water Resour. Res. 17, 1133–1138. doi: 10.1029/WR017i004p01133
Jackson, R. D., Kustas, W. P., and Choudhury, B. J. (1988). A reexamination of the crop water stress index. Irrig. Sci. 9, 309–317. doi: 10.1007/BF00296705
Jones, H. G. (1999). Use of thermography for quantitative studies of spatial and temporal variation of stomatal conductance over leaf surfaces. Plant Cell Environ. 22, 1043–1055. doi: 10.1046/j.1365-3040.1999.00468.x
Jones, H. G., Stoll, M., Santos, T., Sousa, C. D., Chaves, M. M., and Grant, O. M. (2002). Use of infrared thermography for monitoring stomatal closure in the field: application to grapevine. J. Exp. Bot. 53, 2249–2260. doi: 10.1093/jxb/erf083
Kabelka, E., Franchino, B., and Francis, D. M. (2002). Two loci from Lycopersicon hirsutum LA407 confer resistance to strains of Clavibacter michiganensis subsp. michiganensis. Phytopathology 92, 504–510. doi: 10.1094/PHYTO.2002.92.5.504
Kitaya, Y., Niu, G., Kozai, T., and Ohashi, M. (1998). Photosynthetic photon flux, photoperiod, and CO2 concentration affect growth and morphology of lettuce plug transplants. HortScience 33, 988–991. doi: 10.21273/HORTSCI.33.6.988
Koch, G., Rolland, G., Dauzat, M., Bédiée, A., Baldazzi, V., Bertin, N., et al. (2019). Leaf production and expansion: a generalized response to drought stresses from cells to whole leaf biomass—a case study in the tomato compound leaf. Plants 8:409. doi: 10.3390/plants8100409
Kosambi, D. D. (1943). The estimation of map distances from recombination values. Ann. Eugenics 12, 172–175. doi: 10.1111/j.1469-1809.1943.tb02321.x
Kustas, W. P., Alfieri, J. G., Anderson, M. C., Colaizzi, P. D., Prueger, J. H., Evett, S. R., et al. (2012). Evaluating the two-source energy balance model using local thermal and surface flux observations in a strongly advective irrigated agricultural area. Adv. Water Resour. 50, 120–133. doi: 10.1016/j.advwatres.2012.07.005
Lambers, H., Chapin, F. S., and Pons, T. L. (2008). Plant Physiological Ecology. Berlin: Springer. doi: 10.1007/978-0-387-78341-3
Liabeuf, D., Sim, S. C., and Francis, D. M. (2018). Comparison of marker-based genomic estimated breeding values and phenotypic evaluation for selection of bacterial spot resistance in tomato. Phytopathology 108, 392–401. doi: 10.1094/PHYTO-12-16-0431-R
Lopes, M. S., Reynolds, M. P., Jalal-Kamali, M. R., Moussa, M., Feltaous, Y., Tahir, I. S. A., et al. (2012). The yield correlations of selectable physiological traits in a population of advanced spring wheat lines grown in warm and drought environments. Field Crops Res. 128, 129–136. doi: 10.1016/j.fcr.2011.12.017
Lorenz, A. J., Chao, S., Asoro, F. G., Heffner, E. L., Hayashi, T., Iwata, H., et al. (2011). “Genomic selection in plant breeding. knowledge and prospects,” in Advances in Agronomy, Sparks, D. L (Ed.) 1st Edn, (Amsterdam: Elsevier). doi: 10.1016/B978-0-12-385531-2.00002-5
Merk, H. L., Yarnes, S. C., Van Deynze, A., Tong, N., Menda, N., Mueller, L. A., et al. (2012). Trait diversity and potential for selection indices based on variation among regionally adapted processing tomato Germplasm. J. Am. Soc. Hortic. Sci. 137, 427–437. doi: 10.21273/JASHS.137.6.427
Mir, R. R., Zaman-Allah, M., Sreenivasulu, N., Trethowan, R., and Varshney, R. K. (2012). Integrated genomics, physiology and breeding approaches for improving drought tolerance in crops. Theoretical Appl. Genet. 125, 625–645. doi: 10.1007/s00122-012-1904-9
Pailles, Y., Awlia, M., Julkowska, M., Passone, L., Zemmouri, K., Negrão, S., et al. (2020). Diverse traits contribute to salinity tolerance of wild tomato seedlings from the galapagos islands. Plant Physiol. 182, 534–546. doi: 10.1104/pp.19.00700
Pardo, J., and VanBuren, R. (2021). Evolutionary innovations driving abiotic stress tolerance in C4 grasses and cereals. Plant Cell 33, 3391–3401. doi: 10.1093/plcell/koab205
Perera, R. S., Cullen, B. R., and Eckard, R. J. (2020). Using leaf temperature to improve simulation of heat and drought stresses in a biophysical model. Plants 9:8. doi: 10.3390/plants9010008
Philips, B., Egel, D., Maynard, E., Ingwell, L., and Meyers, S. (2021). Midwest Vegetable Production Guide. Available online at: https://mdc.itap.purdue.edu/item.asp?Item_Number=ID-56 (accessed October 2021).
Prashar, A., Yildiz, J., McNicol, J. W., Bryan, G. J., and Jones, H. G. (2013). Infra-red Thermography for high throughput field phenotyping in Solanum tuberosum. PLoS One 8:e65816. doi: 10.1371/journal.pone.0065816
Prodanov, D., and Verstreken, K. (2012). “Automated segmentation and morphometry of cell and tissue structures. selected algorithms in imageJ,” in Molecular Imaging, Schaller, B. (Ed.) (London: IntechOpen). doi: 10.5772/36729
R Core Team (2020). R: a Language and Environment for Statistical Computing. Vienna: R Foundation for Statistical Computing.
Ramírez, D. A., Yactayo, W., Rens, L. R., Rolando, J. L., Palacios, S., De Mendiburu, F., et al. (2016). Defining biological thresholds associated to plant water status for monitoring water restriction effects: Stomatal conductance and photosynthesis recovery as key indicators in potato. Agric. Water Manag. 177, 369–378. doi: 10.1016/j.agwat.2016.08.028
Rick, C. M. (1956). Genetic and systematic studies on accessions of lycospersicon from the galapagos Islands. Am. J. Bot. 43, 687–696. doi: 10.1002/j.1537-2197.1956.tb14433.x
Rick, C. M. (1973). “Potential genetic resources in tomato species: clues from observations in native habitats,” in Genes, Enzymes, and Populations, ed. S. Adrian (Berlin: Springer), 255–269. doi: 10.1007/978-1-4684-2880-3_17
Rick, C. M. (1978). “Potential improvement of tomatoes by controlled introgression of genes from wild species,” in Proceedings of the Conference on Broadening the Genetic Base of Crops, (Nertherlands).
Robbins, M. D., Darrigues, A., Sim, S. C., Masud, M. A. T., and Francis, D. M. (2009). Characterization of hypersensitive resistance to bacterial spot race T3 (xanthomonas perforans) from tomato accession pi 128216. Phytopathology 99, 1037–1044. doi: 10.1094/PHYTO-99-9-1037
Ru, C., Hu, X., Wang, W., Ran, H., Song, T., and Guo, Y. (2020). Evaluation of the crop water stress index as an indicator for the diagnosis of grapevine water deficiency in greenhouses. Horticulturae 6:86. doi: 10.3390/horticulturae6040086
Rush, D. W., and Epstein, E. (1976). Genotypic responses to salinity. Plant Physiol. 57, 162–166. doi: 10.1104/pp.57.2.162
Sacco, A., Greco, B., Matteo, A., Di Stefano, R., and De Barone, A. (2013). Evaluation of tomato genetic resources for response to water deficit. Am. J. Plant Sci. 4, 131–145. doi: 10.4236/ajps.2013.412A3016
Sade, N., Gebremedhin, A., and Moshelion, M. (2012). Risk-taking plants: anisohydric behavior as a stress-resistance trait. Plant Signal. Behav. 7, 767–770. doi: 10.4161/psb.20505
Saeed, A., and Fatima, N. (2021). “Wild germplasm: shaping future tomato breeding,” in Wild Germplasm for Genetic Improvement in Crop Plants, eds M. T. Azhar and S. H. Wani (Amsterdam: Elsevier). doi: 10.1016/B978-0-12-822137-2.00011-4
Schindelin, J., Arganda-Carreras, I., Frise, E., Kaynig, V., Longair, M., and Pietzsch, T. (2012). Fiji: an open-source platform for biological-image analysis. Nat. Methods 9, 676–682. doi: 10.1038/nmeth.2019
Shannon, L. M., Yandell, B. S., and Broman, K. (2013). Users Guide for New BCsFt Tools for R / qtl. Available online at: http://cran.fhcrc.org/web/packages/qtl/vignettes/bcsft.pdf (accessed December 2020).
Sharma, H., Shukla, M. K., Bosland, P. W., and Steiner, R. (2017). Soil moisture sensor calibration, actual evapotranspiration, and crop coefficients for drip irrigated greenhouse chile peppers. Agric. Water Manag. 179, 81–91. doi: 10.1016/j.agwat.2016.07.001
Smith, D. T., Potgieter, A. B., and Chapman, S. C. (2021). Scaling up high-throughput phenotyping for abiotic stress selection in the field. Theoretical Appl. Genet. 134, 1845–1866. doi: 10.1007/s00122-021-03864-5
Snijdgers, T. A. B., and Bosker, R. J. (2012). Multilevel Analysis : an Introduction to Basic and Advanced Multilevel Modeling (2nd). Thousand Oaks, CA: Sage Publications.
Swarup, S., Cargill, E. J., Crosby, K., Flagel, L., Kniskern, J., and Glenn, K. C. (2021). Genetic diversity is indispensable for plant breeding to improve crops. Crop Sci. 61, 839–852. doi: 10.1002/csc2.20377
Tattersall, G. J. (2019). ThermImageJ: Thermal Image Functions and Macros for ImageJ. Available online at: https://doi.org/10.5281/zenodo.2652896 (accessed October 2021).
Tattersall, G. J. (2021). Thermimage: Thermal Image Analysis. Available online at: https://doi.org/10.5281/zenodo.1069704 (accessed October 2021).
Vieira, G. H. S., and Ferrarezi, R. S. (2021). Use of thermal imaging to assess water status in citrus plants in greenhouses. Horticulturae 7:249. doi: 10.3390/horticulturae7080249
Waterland, N. L., Campbell, C. A., Finer, J. J., and Jones, M. L. (2010). Abscisic acid application enhances drought stress tolerance in bedding plants. HortScience 45, 409–413. doi: 10.21273/HORTSCI.45.3.409
World Bank Group (2021). World Bank Climate Change Knowledge Portal. Available online at: https://climateknowledgeportal.worldbank.org/ (accessed October 2021).
Zeng, Z. B. (1994). Precision mapping of quantitative trait loci. Genetics 136, 1457–1468. doi: 10.1093/genetics/136.4.1457
Zhao, L., Wang, L., Li, J., Bai, G., Shi, Y., and Ge, Y. (2021). “Toward accurate estimating of crop leaf stomatal conductance combining thermal IR imaging, weather variables, and machine learning,” in Autonomous Air and Ground Sensing Systems for Agricultural Optimization and Phenotyping VI, eds J. A. Thomasson and A. F. Torres-Rua (Bellingham: SPIE). doi: 10.1117/12.2587577
Keywords: thermal images, genomic selection (GS), proximal sensing, high-throughput phenotyping, inbred backcross method, canopy temperature (CT)
Citation: Fenstemaker S, Cho J, McCoy JE, Mercer KL and Francis DM (2022) Selection strategies to introgress water deficit tolerance derived from Solanum galapagense accession LA1141 into cultivated tomato. Front. Plant Sci. 13:947538. doi: 10.3389/fpls.2022.947538
Received: 18 May 2022; Accepted: 27 June 2022;
Published: 28 July 2022.
Edited by:
Francesco Di Gioia, The Pennsylvania State University (PSU), United StatesCopyright © 2022 Fenstemaker, Cho, McCoy, Mercer and Francis. This is an open-access article distributed under the terms of the Creative Commons Attribution License (CC BY). The use, distribution or reproduction in other forums is permitted, provided the original author(s) and the copyright owner(s) are credited and that the original publication in this journal is cited, in accordance with accepted academic practice. No use, distribution or reproduction is permitted which does not comply with these terms.
*Correspondence: David M. Francis, RnJhbmNpcy43N0Bvc3UuZWR1
Disclaimer: All claims expressed in this article are solely those of the authors and do not necessarily represent those of their affiliated organizations, or those of the publisher, the editors and the reviewers. Any product that may be evaluated in this article or claim that may be made by its manufacturer is not guaranteed or endorsed by the publisher.
Research integrity at Frontiers
Learn more about the work of our research integrity team to safeguard the quality of each article we publish.