
94% of researchers rate our articles as excellent or good
Learn more about the work of our research integrity team to safeguard the quality of each article we publish.
Find out more
ORIGINAL RESEARCH article
Front. Plant Sci. , 28 July 2022
Sec. Crop and Product Physiology
Volume 13 - 2022 | https://doi.org/10.3389/fpls.2022.946115
Many studies have demonstrated that anthocyanin synthesis in apple peel is induced by light, but the color of bagged apple peel continues to change under dark conditions after light induction has not been characterized. Here, transcriptional and metabolic changes associated with changes in apple peel coloration in the dark after different light induction treatments were studied. Apple pericarp can achieve a normal color under complete darkness followed by light induction. Metabolomics analysis indicated that the expression levels of cyanidin-3-O-galactoside and cyanidin-3-O-glucoside were high, which might be associated with the red color development of apple peel. Transcriptome analysis revealed high expression levels of MdUFGTs, MdMYBs, and MdNACs, which might play a key role in light-induced anthocyanin accumulation under dark conditions. 13 key genes related to dark coloring after light induction was screened. The results of this study provide new insights into the mechanism of anthocyanin synthesis under dark conditions.
Apples (Malus domestica Borkh.) are deciduous fruit trees in the Rosaceae family that are popular among consumers worldwide for their rich nutrient profiles, which include sugars, acids, vitamins, flavonoids, pectins, and proteins (Hecke et al., 2006; Zhang et al., 2010). Furthermore, apples provide several health benefits to the cardiovascular system (Winter et al., 2018) and liver (Zhou Y. et al., 2020) and possess cancer-fighting compounds (Wang and Stoner, 2008; Sampaio et al., 2021). Apples are widely cultivated in temperate regions and have become a major source of income for many farmers.
The color of apples is an important indicator of their quality and commercial value, especially for red apple varieties (Deng et al., 2018). The red color of apples is determined by the level of anthocyanins. Anthocyanin synthesis and its regulation have thus been the focus of much research (Espley et al., 2007; An et al., 2012; Li et al., 2021).
Light is one of the main factors affecting the synthesis of anthocyanins. In Arabidopsis and many other plants, anthocyanins can only be synthesized under light, and they do not accumulate under weak light or dark conditions (Maier and Hoecker, 2015). Strong light promotes the expression of structural genes and transcription factors, whereas weak light or dark environments inhibit the expression of genes involved in anthocyanin synthesis (Jeong et al., 2004). The expression of MdMYB1 and MdMYB10 is up-regulated under strong light, and this induces the expression of downstream genes and promotes the synthesis of anthocyanins in apple (Gu et al., 2019). MdTCP46 forms a protein complex with MdMYB1 under strong light conditions and promotes anthocyanin synthesis by enhancing the ability of MdMYB1 to activate the expression of downstream genes (An et al., 2020). In apple, decreases in anthocyanin synthesis under dark conditions are related to the interaction between MdCOP1 and MdMYB1, and ubiquitination degrades MdMYB1. Under light conditions, MdCOP1 is transported out of the nucleus, and the degradation of MdMYB1 ceases, which stabilizes the function of MdMYB1 and results in the synthesis of anthocyanins (Li et al., 2012; Kang et al., 2021). Previous studies have shown that the anthocyanins of apple peel do not accumulate in dark environments.
In this study, we found that apple peel could synthesize anthocyanins under dark conditions following light induction, which is in contrast to the conventional mechanism of color formation described in previous studies. We identified the key metabolites and genes involved in the light-induced color formation of apple peel under dark conditions through metabolomics and transcriptomic analyses and explored the possible regulatory mechanism. The novel phenotypes documented in this study provide new insights into the mechanism of anthocyanin synthesis.
Ten-year-old ‘Fuji’ apple trees (M. domestica Borkh.) on M9 rootstocks were used in this study. All trees were planted at a 1.5 × 4.0 m spacing in an orchard in Tai’an, Shandong, China (36.12°N, 117.01°E). They were approximately 4.0 m tall with a central leader, and their crop load was adjusted to 1 fruit/20 cm. The trees were maintained using conventional agricultural practices, including soil, fertilizer and water management, and disease and pest control measures. Approximately 45 days after full bloom, the fruits were bagged with double-layer paper bags (brown outside and red inside). At approximately 170 days after full bloom, fruits were removed from the trees. A total of 240 fruits were subjected to the control treatment, and the rest were placed under weak light conditions in several treatments.
Approximately 700 fruits were divided into three groups and exposed to natural light above four layers of wet gauze in an open space, three groups of apples were placed on gauze at 6:00 a.m. on the 1st, 2nd, and 3rd day respectively, which was the treatment of light induced for 3 (G3), 2 (G2), and 1 (G1) natural days. Every day light intensity were measured with a digital Lux meter (LX10108) after putting the apples, the values were 3,710.0, 3,813.3, and 3,376.7, respectively. Fruits of light induced treatment and the control group (CK) were placed in plastic turnover box before 6:00 a.m. on the 4th day, then put the turnover boxes in the cold storage without opening the compressor for dark treatment. Samples were taken at 0 (D0), 1 (D1), 3 (D3), 5 (D5), and 7 days (D7) of the dark treatment. There were five replicates of each treatment and eight fruits per replicate.
At each sampling event, the changes in peel color were determined, and the color difference of the peel was determined; the fruit peels (1 mm thick) were then removed from individual fruits using a peeler and quickly frozen in liquid nitrogen. The frozen samples were mixed in liquid nitrogen, ground into powder using a grinding machine (IKA Company, Germany), and stored at −80°C for further analysis.
The peel color, including the color difference and pigments, was analyzed at five stages under the three light induction treatments.
The color difference of the peel was measured using a colorimeter (CR-410, Konica Minolta, Japan). The indexes included L*, a*, b*, C, and h° [C2 = (a2 + b2)/2], h°= tan-1(b/a) (a* > 0, b* > 0) or h°= tan-1(b/a) + 180 (a* < 0, b* > 0) (Wu et al., 2014).
Approximately 1.0 g of peel powder was placed in 5 ml of precooled 80% acetone solution at 4°C in the dark for 24 h; the crude extract was centrifuged at 7,500 g for 20 min at 4°C, and the supernatant was collected. Acetone (80%) was used as the control; treatment and control samples were assayed using a spectrophotometer (UV-2450, Shimadzu, Japan) at 665 nm, 649 nm, and 470 nm. The content of chlorophyll and carotenoids was calculated using the following formula:
Pigment content (mg⋅g–1) = pigment concentration (mg⋅l–1) × extract volume (l) × dilution ratio/sample weight
Anthocyanins were extracted and analyzed following a previously described method (Zhang et al., 2010). Approximately 0.5 g of crushed peel was placed in 2 ml of precooled 0.1% hydrochloric acid methanol and subjected to ultrasonic extraction for 30 min. The homogenate was centrifuged at 12,000 g for 10 min. After discarding the supernatant, the residue was extracted with 1 ml of extracting solution. After centrifugation, the supernatant was mixed and injected into the reaction bottle through a 0.45-μm filter, and the filtrate was the anthocyanin extract. The content of anthocyanins was determined using an Agilent 1,200 liquid chromatograph equipped with a diode array detector (Agilent Technology, Palo Alto, CA, United States); anthocyanins were separated on an Inertsil ODS-3 column (5.0 μm, 4.6 mm × 250 mm). Mobile phase A was a 1.6% formic acid aqueous solution, and mobile phase B was a 1.6% formic acid methanol solution. Gradient elution conditions were as follows: 85% A (0 min), 80% A (5.0 min), 72% A (10.0 min), 40% A (20.0 min), 0% A (35.0 min), and 85% A (50.0 min). The equilibrium time (10 min) was performed with a flow rate of 1.0 ml⋅min–1 and a column temperature of 40°C. Simultaneous monitoring was performed at 530 nm for cyanidin-3-O-galactoside.
Metabonomics analysis was performed in five treatment groups: control (CK), 1 day of natural light induction (G1), 3 days of natural light induction (G3), dark treatment for 3 days after natural light induction for 3 days (D3), and dark treatment for 7 days after natural light induction for 3 days (D7). Extraction and determination of metabolites were performed at Wuhan Metware Biotechnology Co., Ltd1. A total of 0.1 g of peel powder was extracted with 1 ml of 70% methanol solution at 4°C for 24 h. The homogenate was centrifuged at 10,000 g for 10 min at 4°C. The supernatant was filtered through a 0.22-μm Millipore filter, and the filtrate was the sample subjected to testing. Metabolites were detected using ultra-performance liquid chromatography (UPLC) (Shim-pack UFLC SHIMADZU CBM30A) and tandem mass spectrometry (MS/MS) (Applied Biosystems 6500 QTRAP). The column temperature was 40°C, the flow rate was 0.4 ml⋅min–1, and the injection volume was 2 μl. Mobile phase A was 0.04% acetic acid aqueous solution, and mobile phase B was acetonitrile containing 0.04% acetic acid. The elution gradient was carried out per the conditions listed in Supplementary Table 1. The voltage of the mass spectrometer was 5,500 V, the temperature of the electrospray ion source was 500°C, and the curtain gas was 25 psi. Qualitative analysis of substances was carried out according to the secondary spectrum information in the MEDB (metaware database). The relative content of metabolites was calculated according to the corrected mass spectrum peak area (Fraga et al., 2010). The differentially accumulated metabolites (DAMs) between different comparison groups were identified using the following criteria: |log2 (fold change)| ≥ 2 and p-value < 0.05.
The samples collected for transcriptome analysis were the same as those used for the metabolomics analysis. The total RNA of apple peel was extracted using a polysaccharide polyphenol plant total RNA extraction kit (RNAprep Pure), and the library was constructed after RNA detection. Sequencing was carried out using the Illumina HiSeq platform; after quality control of the library, 150 bp paired-end reads were generated. The apple reference genome2 was used as the reference sequence for alignment analysis, which was conducted using HISAT2 (Kim et al., 2015). The genes were counted using Feature Counts software, and the level of gene expression was measured by FPKM (Fragments Per Kilobase of transcript per Million mapped reads). The differentially expressed genes (DEGs) between different comparison groups were analyzed using DESeq2 software (Yang et al., 2014). The Benjamin–Hochberg method was used to correct P-values, and the false discovery rate (FDR) was obtained. DEGs were screened using the following criteria: |log2 (fold change)| ≥ 2 or FDR < 0.05. KEGG analysis was conducted on the genes identified using BLAST software, and enriched KEGG pathways were those with P < 0.05 after correction.
qRT-PCR was used to verify the DEGs. Specific quantitative primers were designed using Primer 6.0 software (Supplementary Table 2). The quantitative analysis was performed using Tip Green qPCR SuperMix, and the reaction system (20 μl) contained the upstream and downstream fluorescent quantitative primers (1 μl), Tip Green qPCR SuperMix (10 μl), cDNA (1 μl), and ddH2O (1 μl). Gene expression was detected using real-time quantitative PCR (iCycler iQ5), and the reaction procedure is shown in Supplementary Table 3. Expression levels were determined using the 2–△△CT method, and MdACIIN was the internal reference gene.
SPSS 19.0 (IBM Corporation, United States) was used to determine significant differences between groups and conduct one-way ANOVA and Duncan multiple range tests (p < 0.05). GraphPad Prism software was used to make figures.
The light-induced color formation of apple peel under dark conditions is shown in Figure 1. Control and G1 peels were predominantly green at the start of the dark treatment, and yellowing occurred only in the later stages. G2 peels were light pink at D1, and red pigment deposition began to appear at D3, which was followed by a gradual deepening of the red color on the fruit surface and a uniform pink color on the peel at D7. D3 peels had a faded green color at the start of the dark treatment, and red pigment deposition increased gradually during dark treatment. A bright red stripe appeared on the peel at D5, and a bright and deep red surface similar to commercial fruits was present at D7.
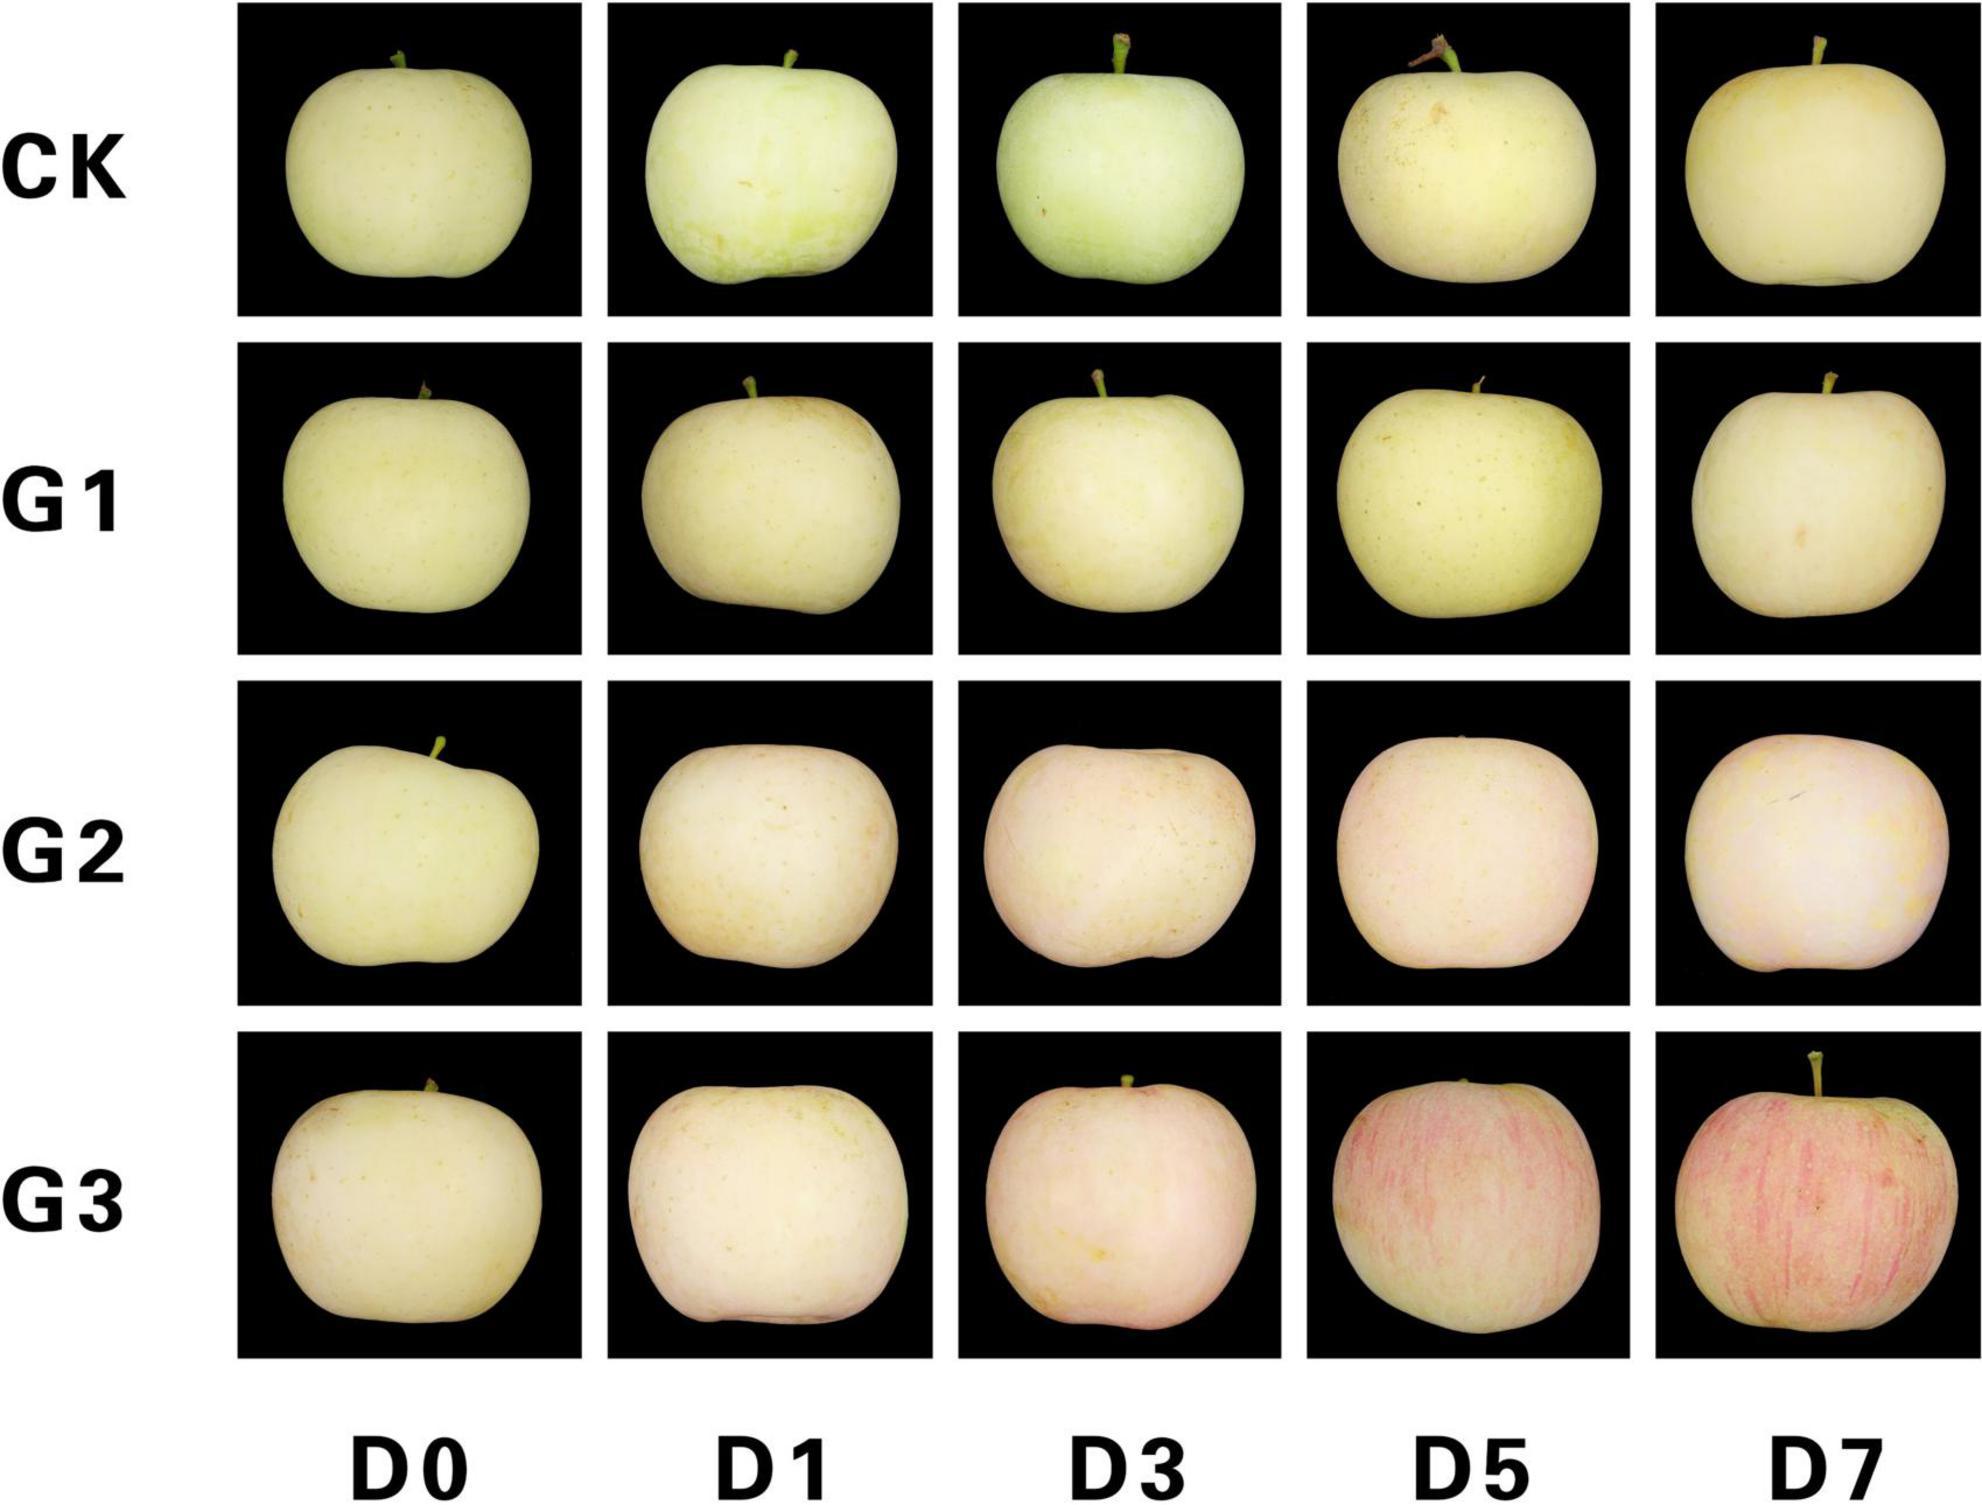
Figure 1. Light-induced color formation of bagged apples under dark conditions. CK, No bag removal; G1, 1 day of natural light induction; G2, 2 days of natural light induction; G3, 3 days of natural light induction; D0, 0 day of dark treatment; D1, 1 day of dark treatment; D3, 3 days of dark treatment; D5, 5 days of dark treatment; and D7, 7 days of dark treatment.
Changes in the color difference of apple peel during the color formation process under dark conditions are shown in Figure 2A. The brightness L*, color intensity C, and comprehensive color h° were inversely proportional to the light induction time within each dark treatment stage, and there were significant differences among most light induction treatments. During the dark treatment, L* and h°changed little, and C increased slightly. a* significantly increased as the light induction time extended within each dark treatment stage.
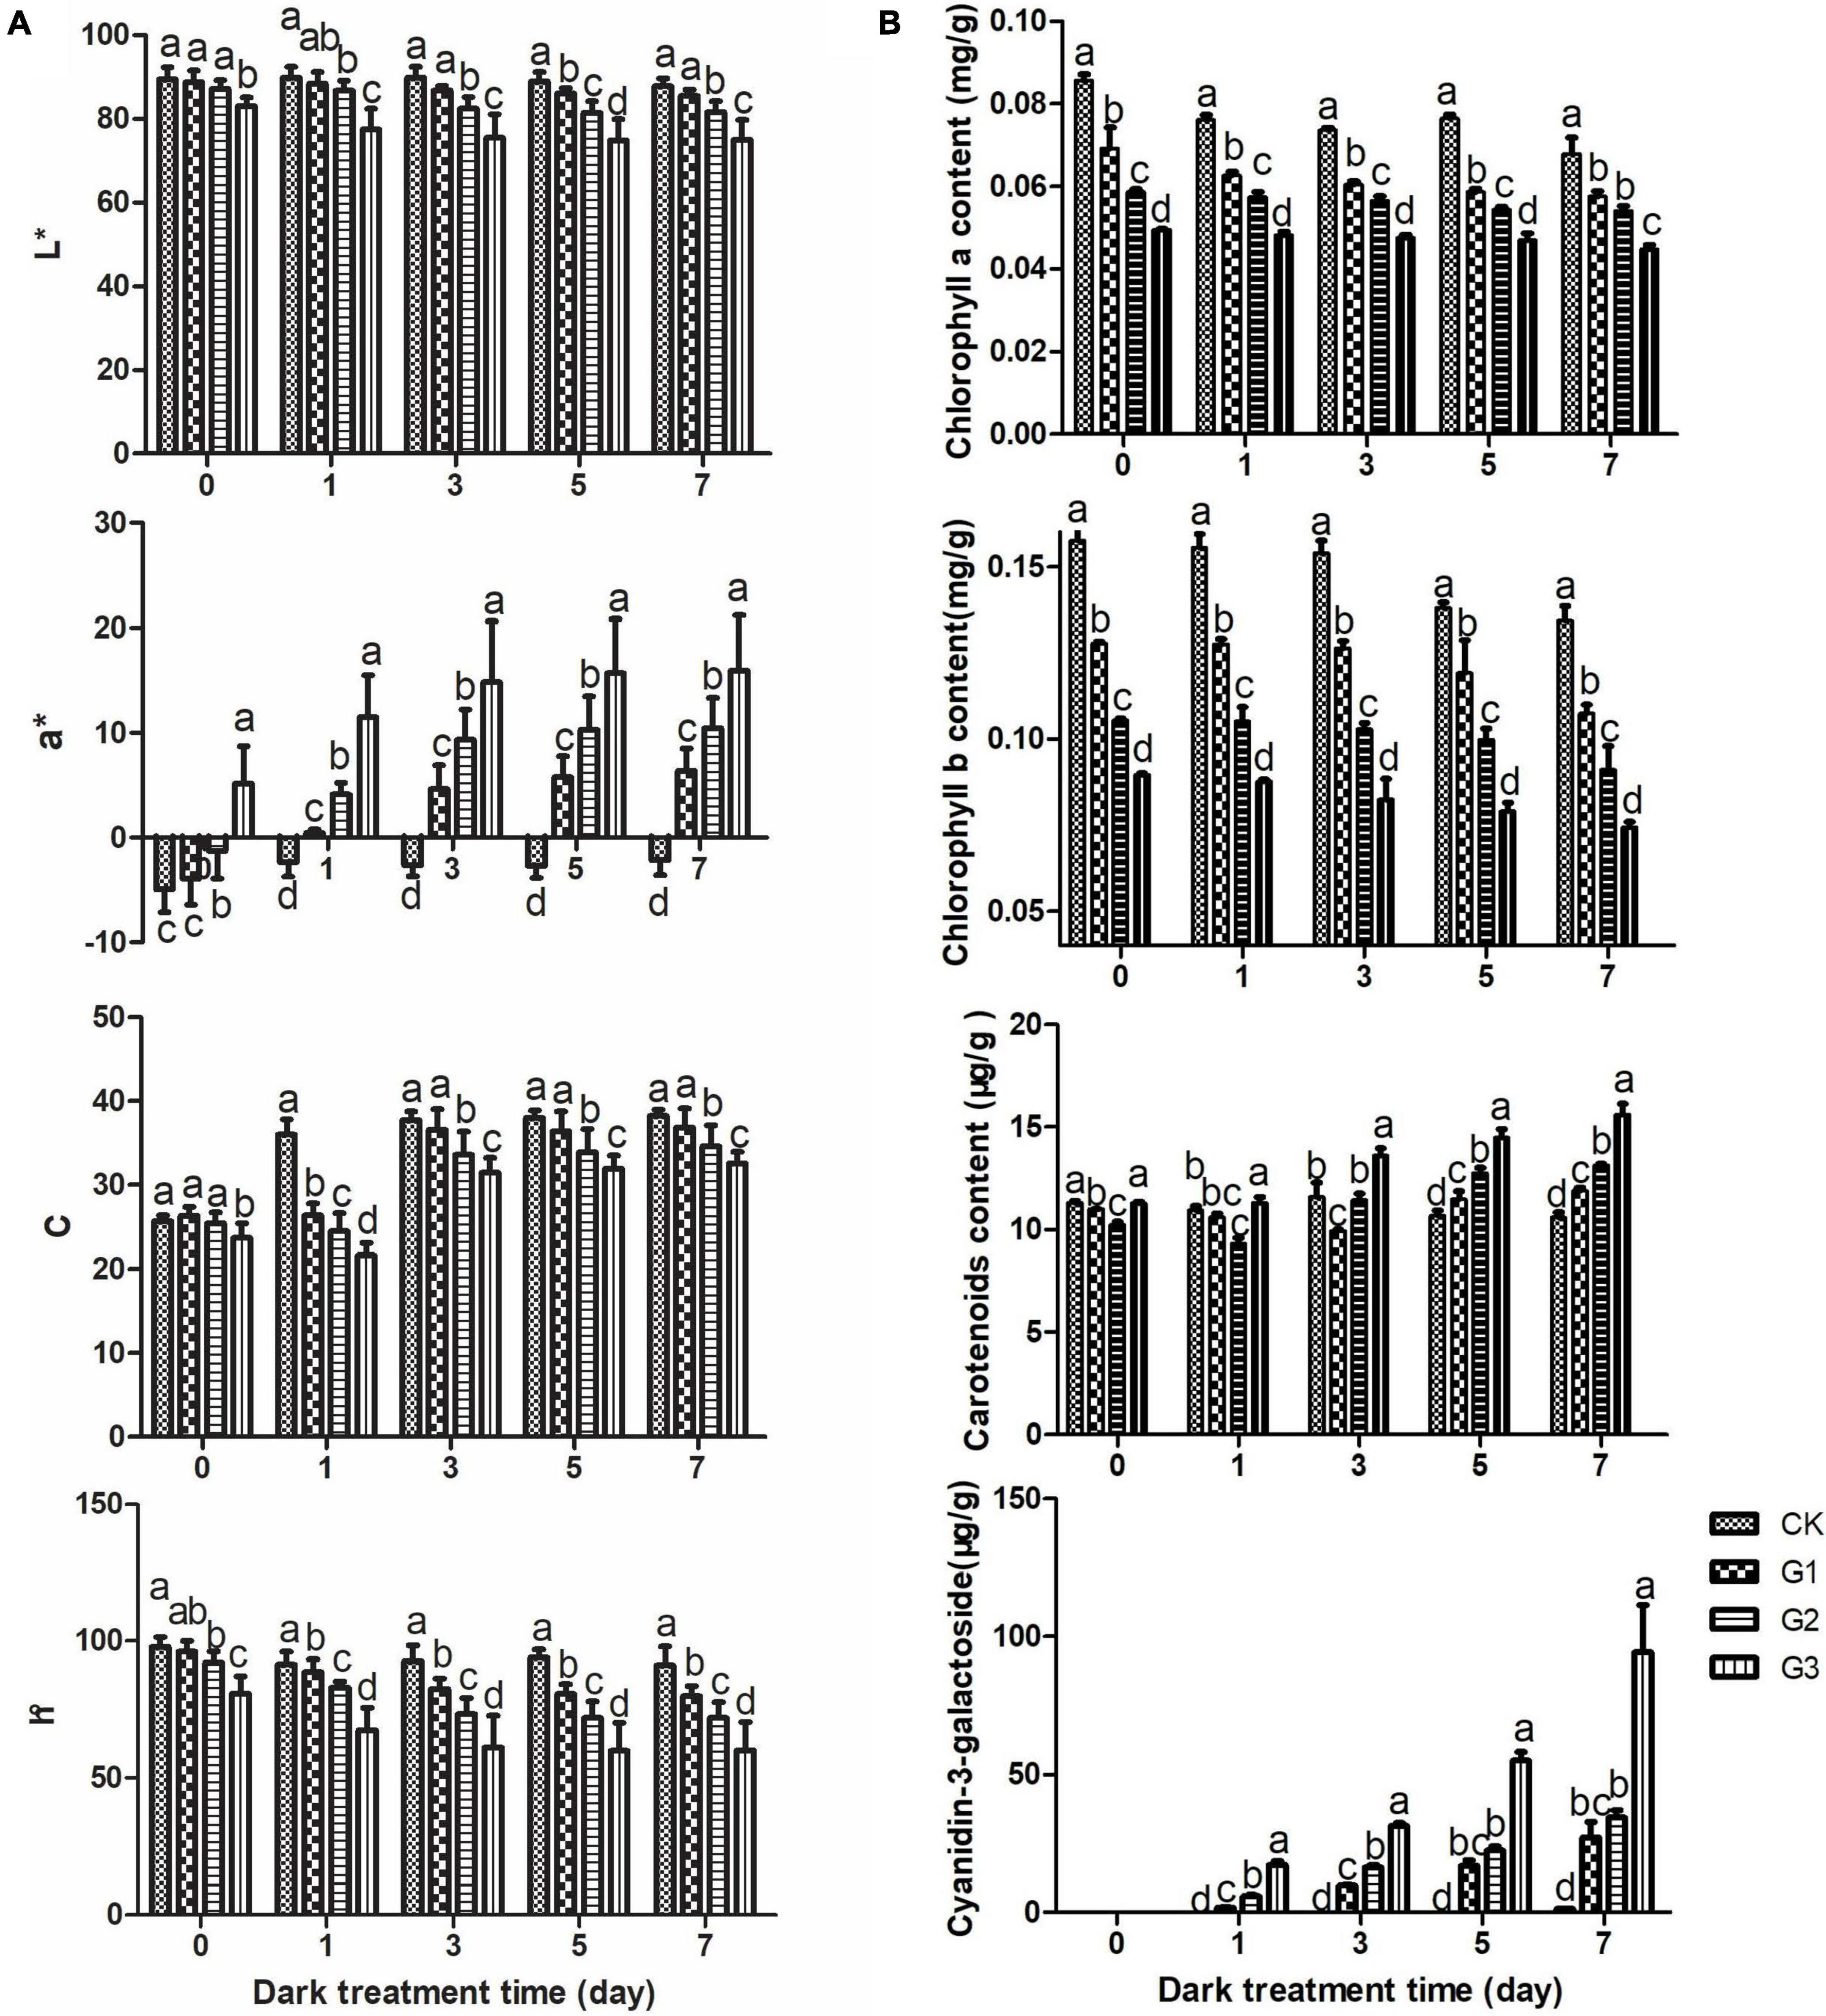
Figure 2. Changes in apple peel color during dark treatment. Changes in apple peel color difference values (A) and the pigment content (B) during dark treatment. L* indicates brightness. Positive a* values indicate the darkness of the red coloration and are shown in red. Negative a* values indicate the darkness of the green coloration and are shown in green. C indicates the strength of the color, and h indicates the comprehensive chroma.
The changes in pigments are shown in Figure 2B. The content of chlorophyll a and chlorophyll b decreased continuously throughout the dark treatment. The chlorophyll content decreased as the light induction time increased within each dark treatment stage, and significant differences in the chlorophyll content were observed among most treatments. The carotenoid content in the treatment group increased gradually with the dark treatment time; however, little change was observed among dark treatment stages. In the late stages of dark treatment (5 d, 7 d), the carotenoid content increased as the light induction time extended; it was highest in G3, followed by G2, G1, and CK, and significant differences were observed among treatments. The content of cyanidin-3-O-galactoside, the main red component of apple peel, increased as the dark treatment time extended and the light induction time increased. Cyanidin-3-O-galactoside was not detected in all light-induced treatments, including the 0-day dark treatment and all controls (with the exception of the 7-day dark treatment), because its content was low.
Principal component analysis revealed significant separation of CK, G1, G3, D3, and D7 along the first principal component and second principal component, each of which explained 26.68 and 15.63% of the variation, respectively, indicating that there were significant changes in the metabolites among the control, light induction, and dark-colored samples (Figure 3A). A correlation heat map showed that the correlation coefficients of the three biological replicates in the group and their biological repeatability were high (Figure 3B). A total of 620 metabolites were detected from five groups of samples, including 23 major categories such as anthocyanins, proanthocyanidins, amino acids and derivatives, sugars, nucleotides and derivatives, flavonoids, flavonoids, and lipids (Supplementary Table 4).
Differentially accumulated metabolites (DAMs) in the four comparison groups CK_vs_G3, CK_vs_D7, G3_vs_D3, and G3_vs_D7 were analyzed (Figure 4), and there were 60, 107, 59, and 87 DAMs in each of these groups, respectively; 19 metabolites were common among these groups (Figure 4E). Among these 19 metabolites, there were 2 anthocyanins, 6 flavonoids, 6 flavonols, 2 flavanones, and 3 other substances. KEGG pathway enrichment analysis revealed that the DAMs in the four groups were significantly enriched in flavonoid biosynthesis pathway and anthocyanin biosynthesis pathway. The enrichment of the flavonoid biosynthesis pathway and anthocyanin biosynthesis pathway was extremely significant, with the exception of the CK_vs_G3 group (Figures 4A–D). This indicates that the DAMs in the flavonoids biosynthesis pathway are the key metabolites involved in the light-induced color formation of apple peel under dark conditions.
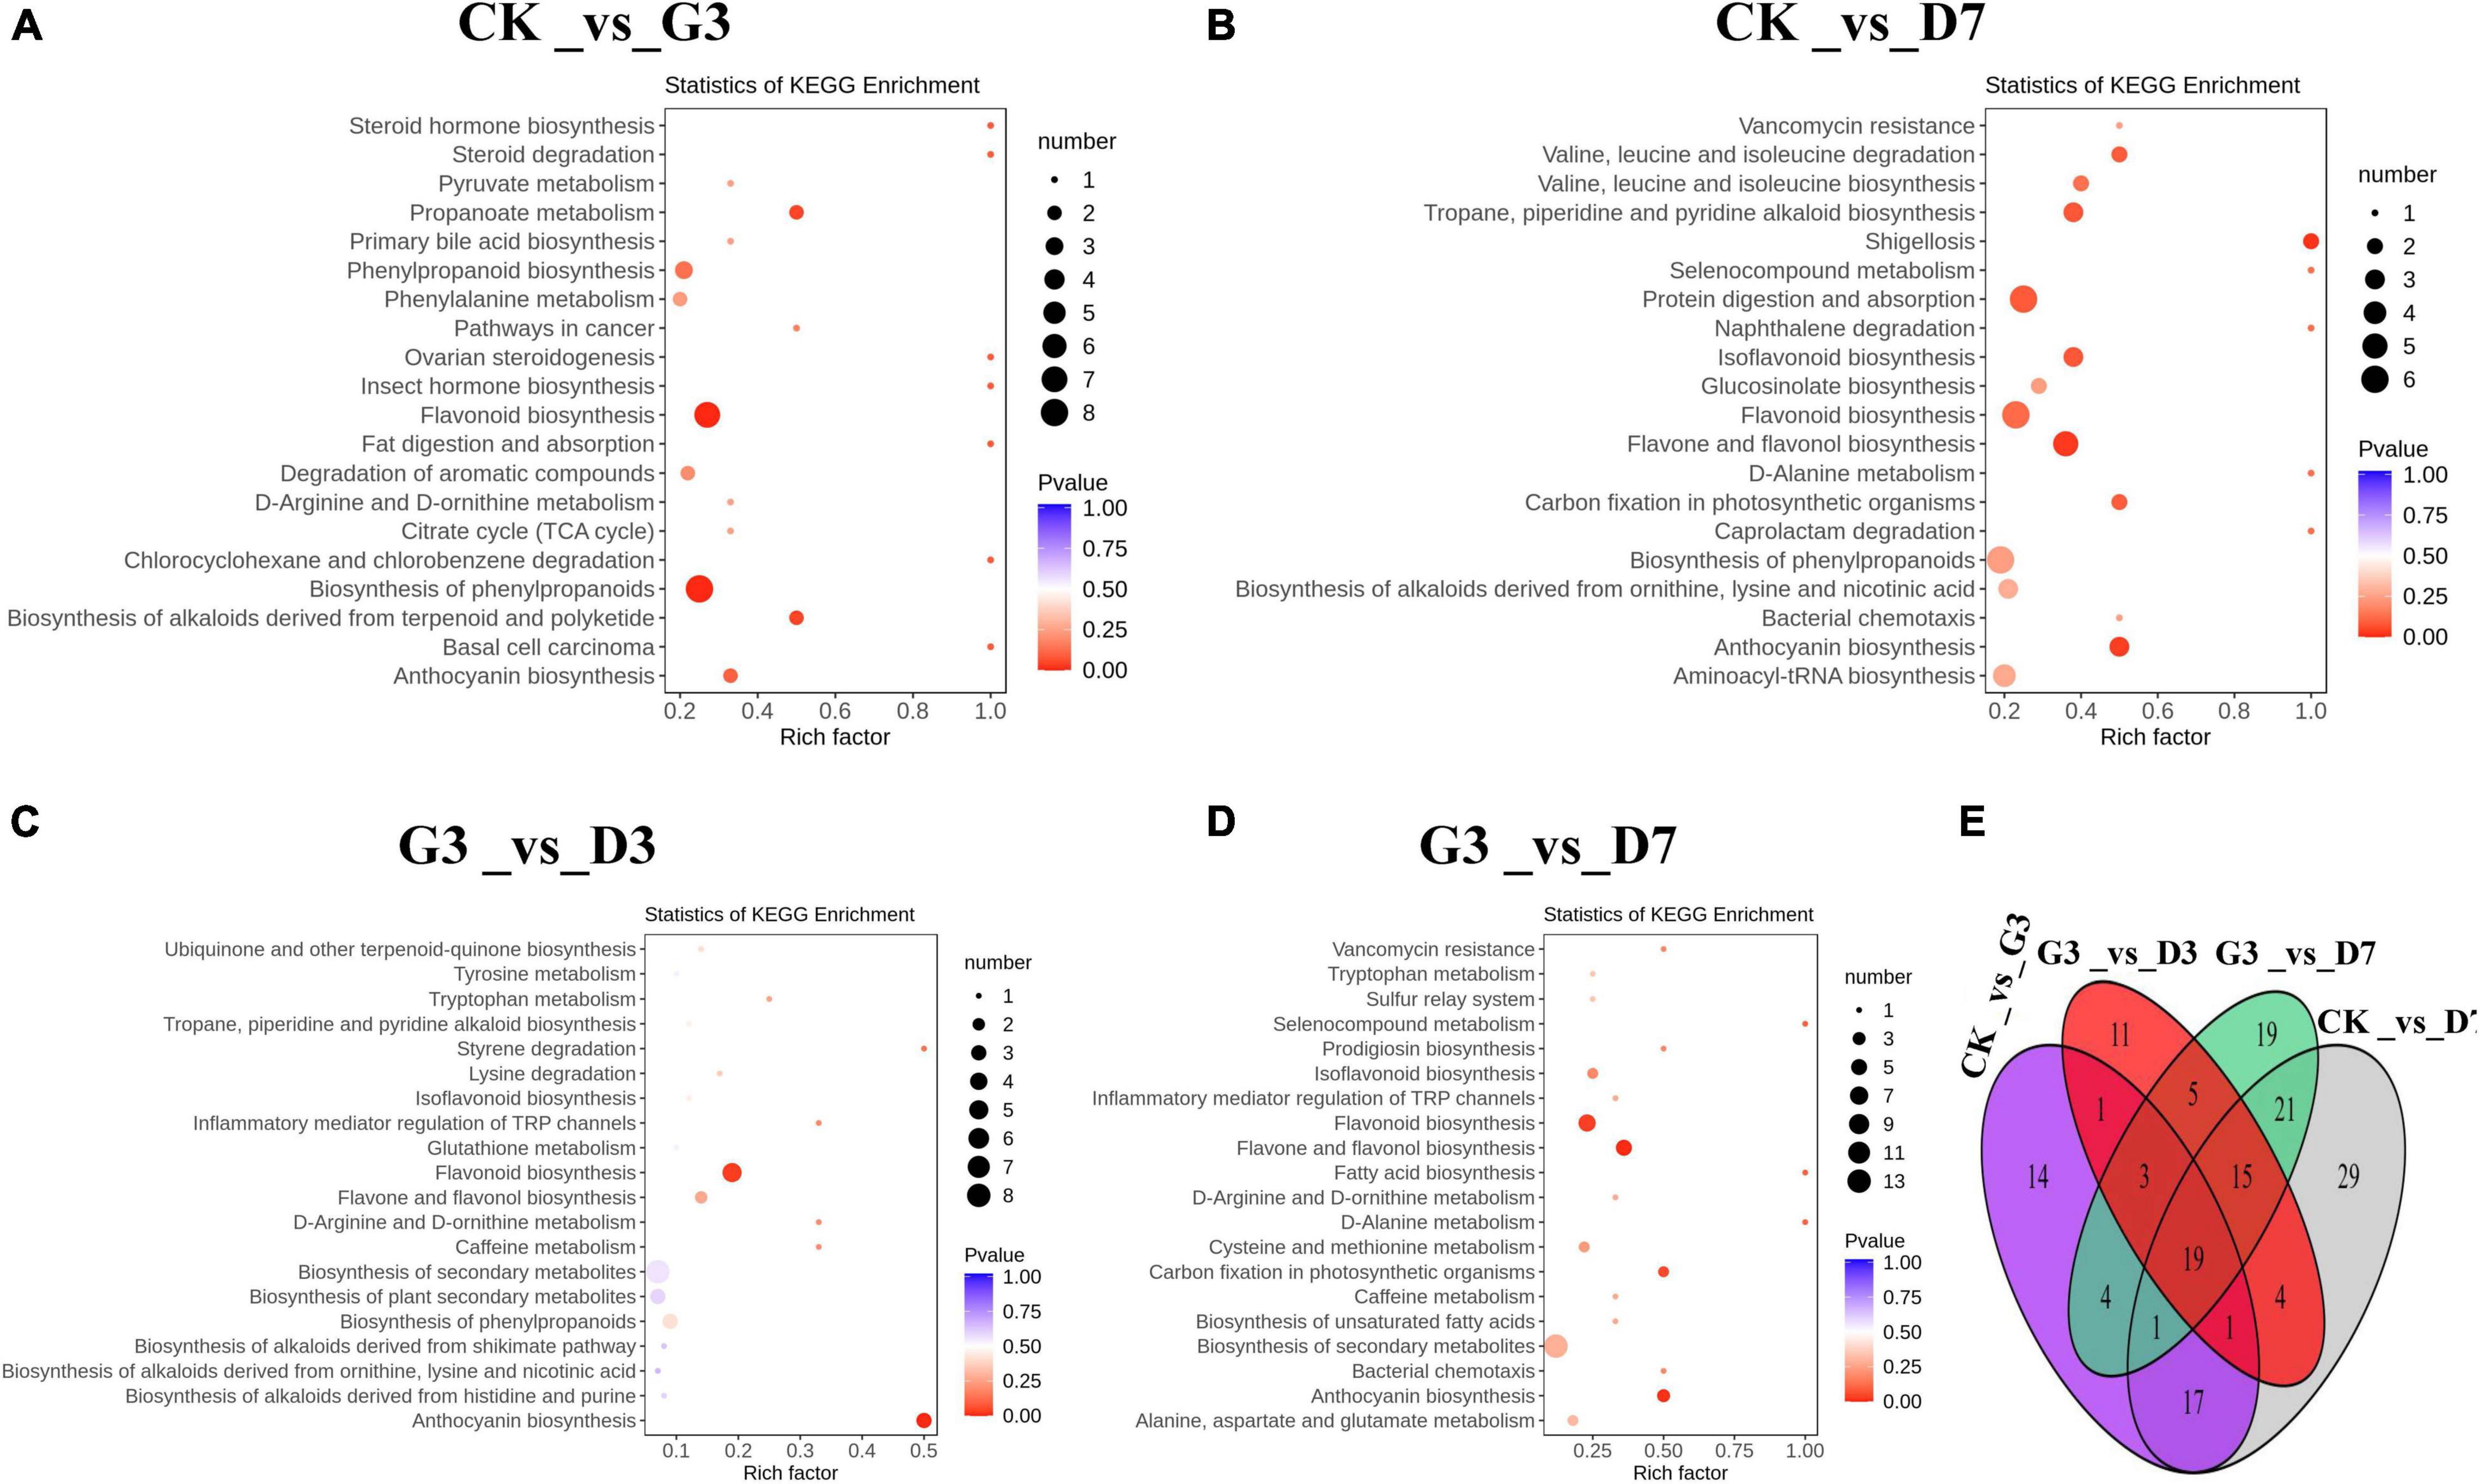
Figure 4. Identification and functional characterization of the differentially accumulated metabolites (DAMs) in the different treatments. KEGG enrichment analysis of the DAMs in (A) CK_vs_G3, (B) CK_vs_D7, (C) G3_vs_D3, and (D) G3_vs_D7. (E) Venn figure showing the shared and specific metabolites among the four groups.
A total of 121 flavonoid metabolites were detected in the five groups of samples, including 10 anthocyanins, 5 proanthocyanidins, 62 flavonoids, 30 flavonols, and 14 flavonoids. The changes in the content of each substance among the different treatments were shown in Figure 5. Ten anthocyanins were closely related to the development of the red coloration of apple peel (Supplementary Table 5). The content of cyanidin 3-O-galactoside and cyanidin 3-O-glucoside changed substantially throughout the experimental period. These substances were not expressed in the control and G1 but were abundant in G3. They were expressed in large quantities in the dark stage, and their expression peaked at D7. These expression changes were consistent with phenotypic changes; thus, cyanidin 3-O-galactoside and cyanidin 3-O-glucoside are the key metabolites associated with the light-induced coloration of apple peel under dark conditions.
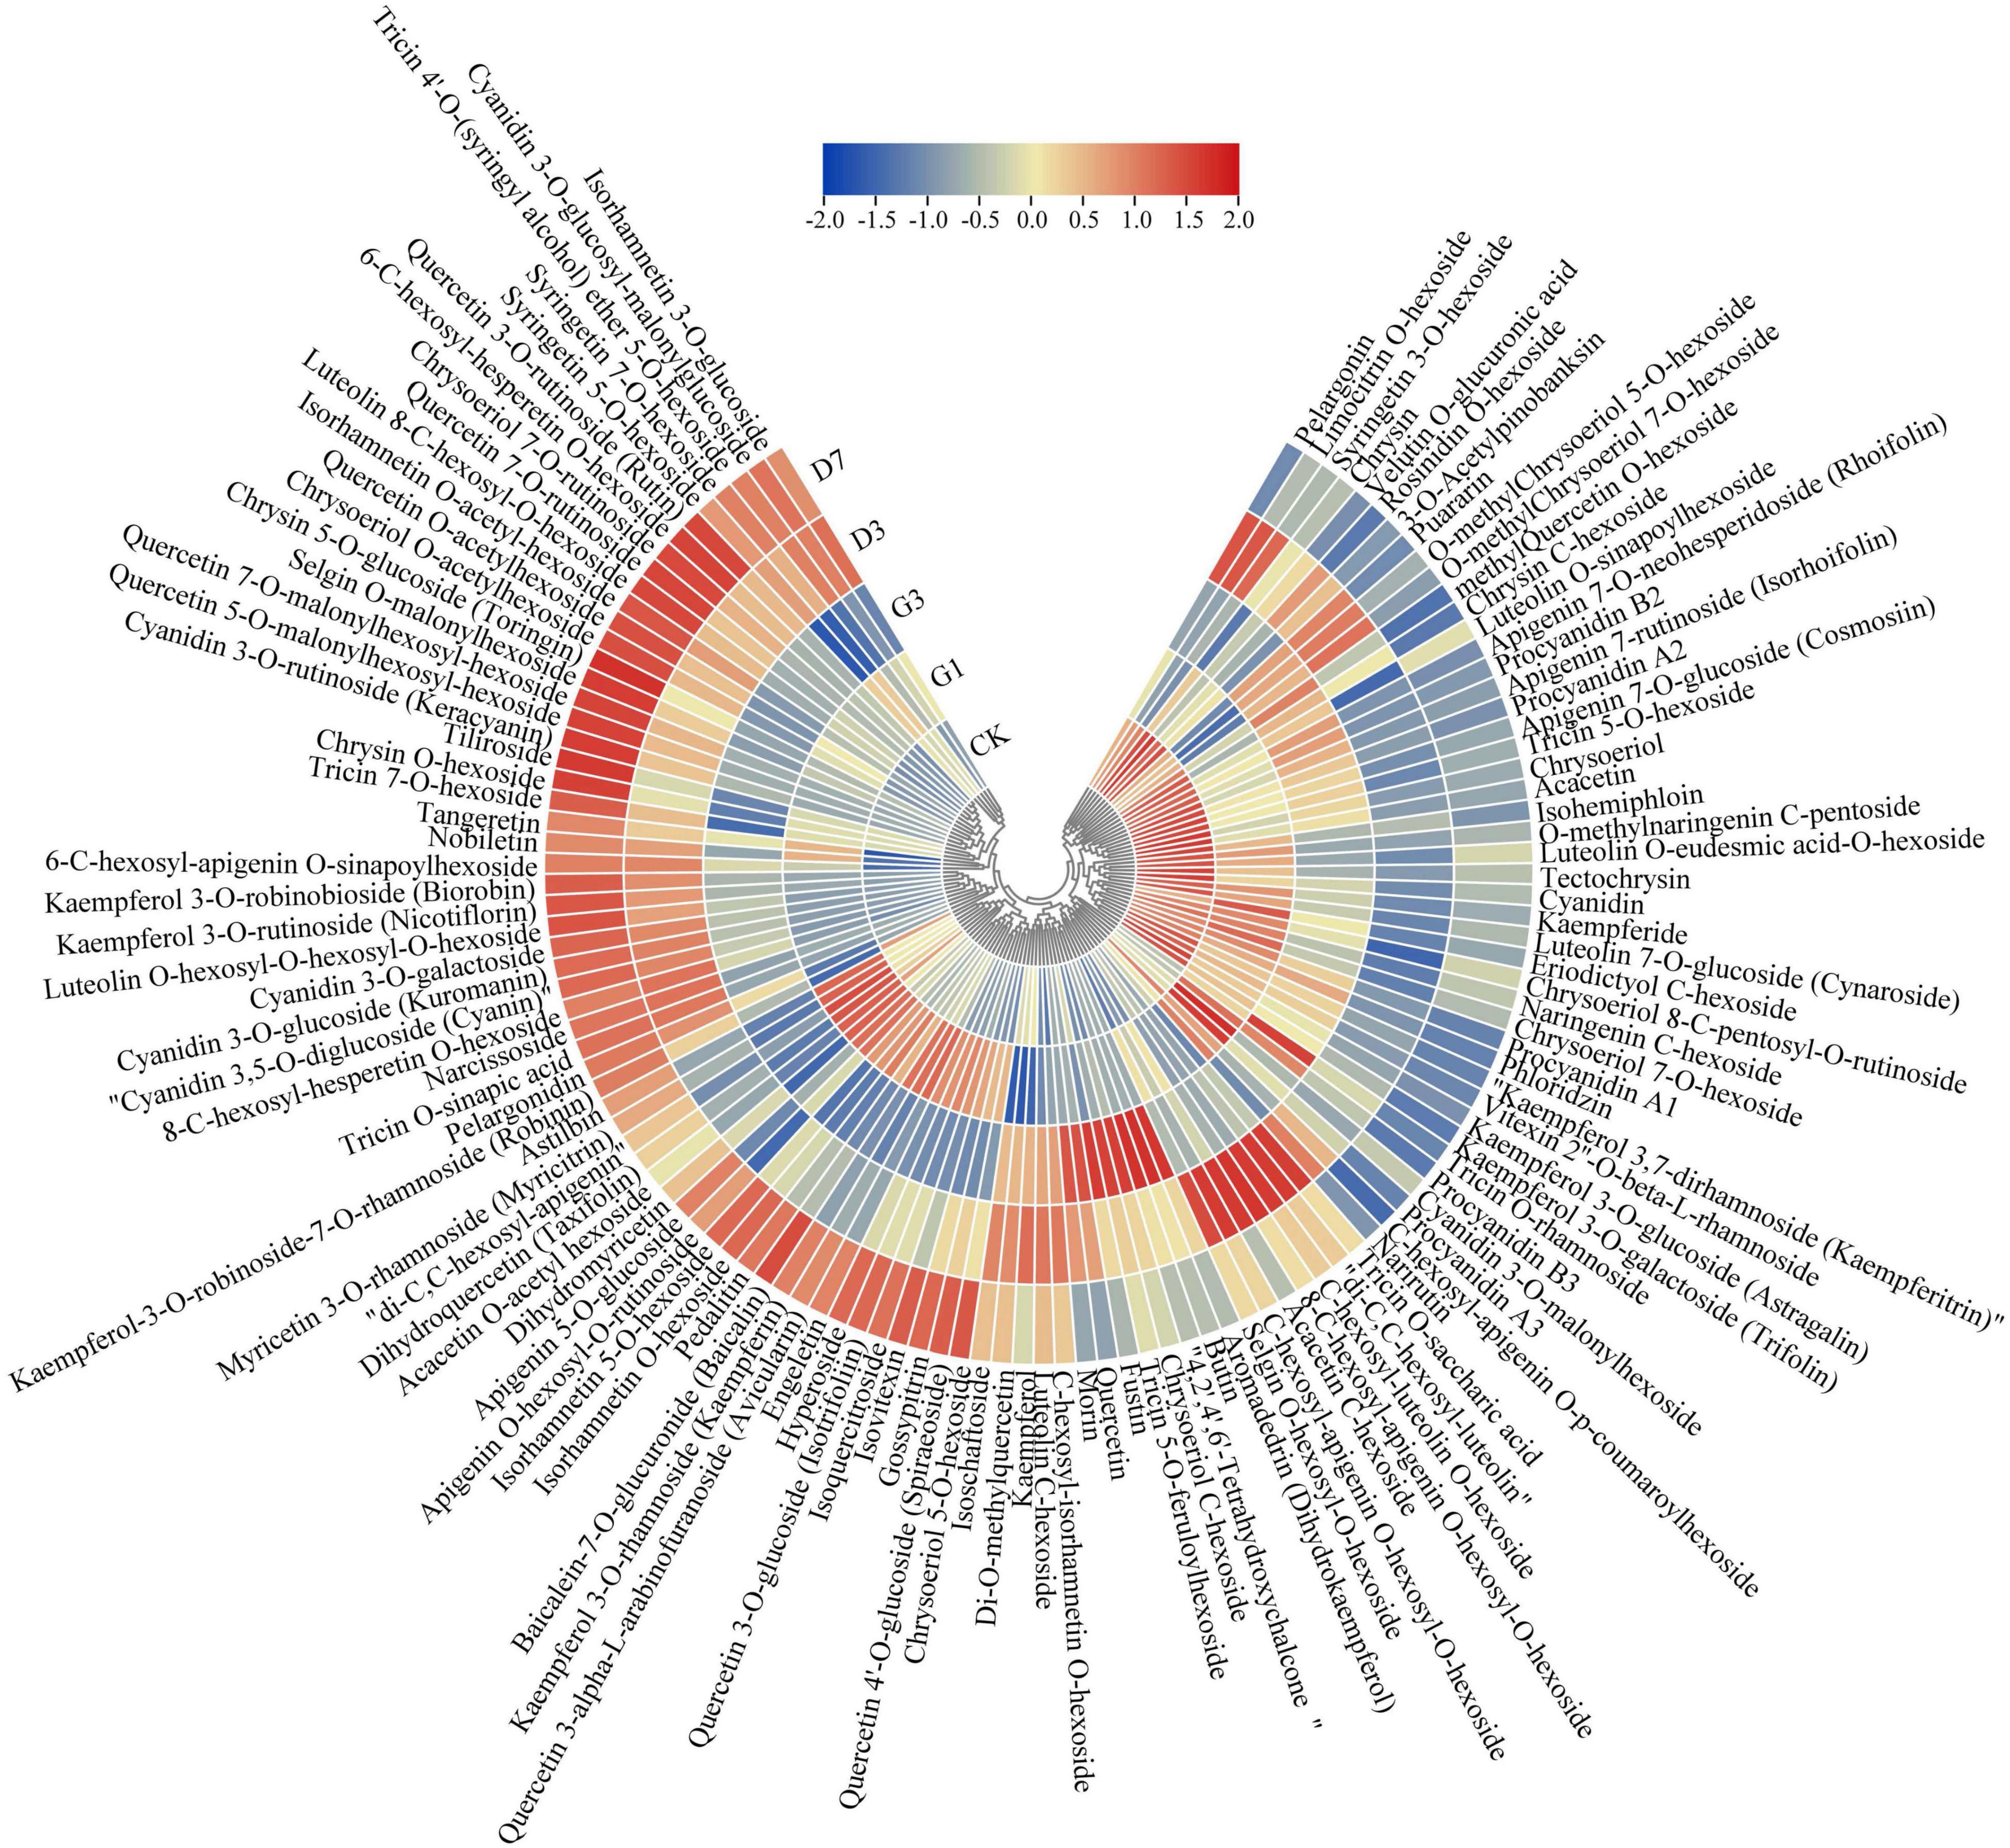
Figure 5. Expression of flavonoid metabolites in the different treatments. Gene expression data were normalized and plotted using Tbtools V1.075 software.
The changes in the gene expression profiles of CK, G1, G3, D3, and D7 were analyzed. Three biological replications were conducted for each group. A total of 135.14 GB of clean data were obtained from the 15 peel samples; the base error rate was approximately 0.4%, and the ratios of Q20 and Q30 were 96.60 and 90.86%, respectively. This indicated that the quality of the transcriptome data of each sample was high, which suggests that our transcriptome data were accurate and reliable (Supplementary Table 6). The proportion of reads that were mapped to multiple locations in the genome was 12.49–14.23%, and the proportion of reads with map quality no less than 30 was greater than 62%, indicating that a high proportion of reads from each sample were compared against the reference genome (Supplementary Table 7). Correlation thermography showed that the square of the Pearson correlation coefficient (r2) of the three biological replicates in the group was greater than 0.9, indicating high reproducibility of the samples (Figure 6A). Principal component analysis revealed clustering of samples within groups and separation of samples in different groups, which indicated high repeatability of samples within groups and large differences among samples in different groups; the separation among the light treatment, dark treatment, and control was especially pronounced (Figure 6B). These findings were consistent with the metabonomics data, indicating that the accumulation of different metabolites in apple peel under dark conditions was regulated by the expression of different genes.
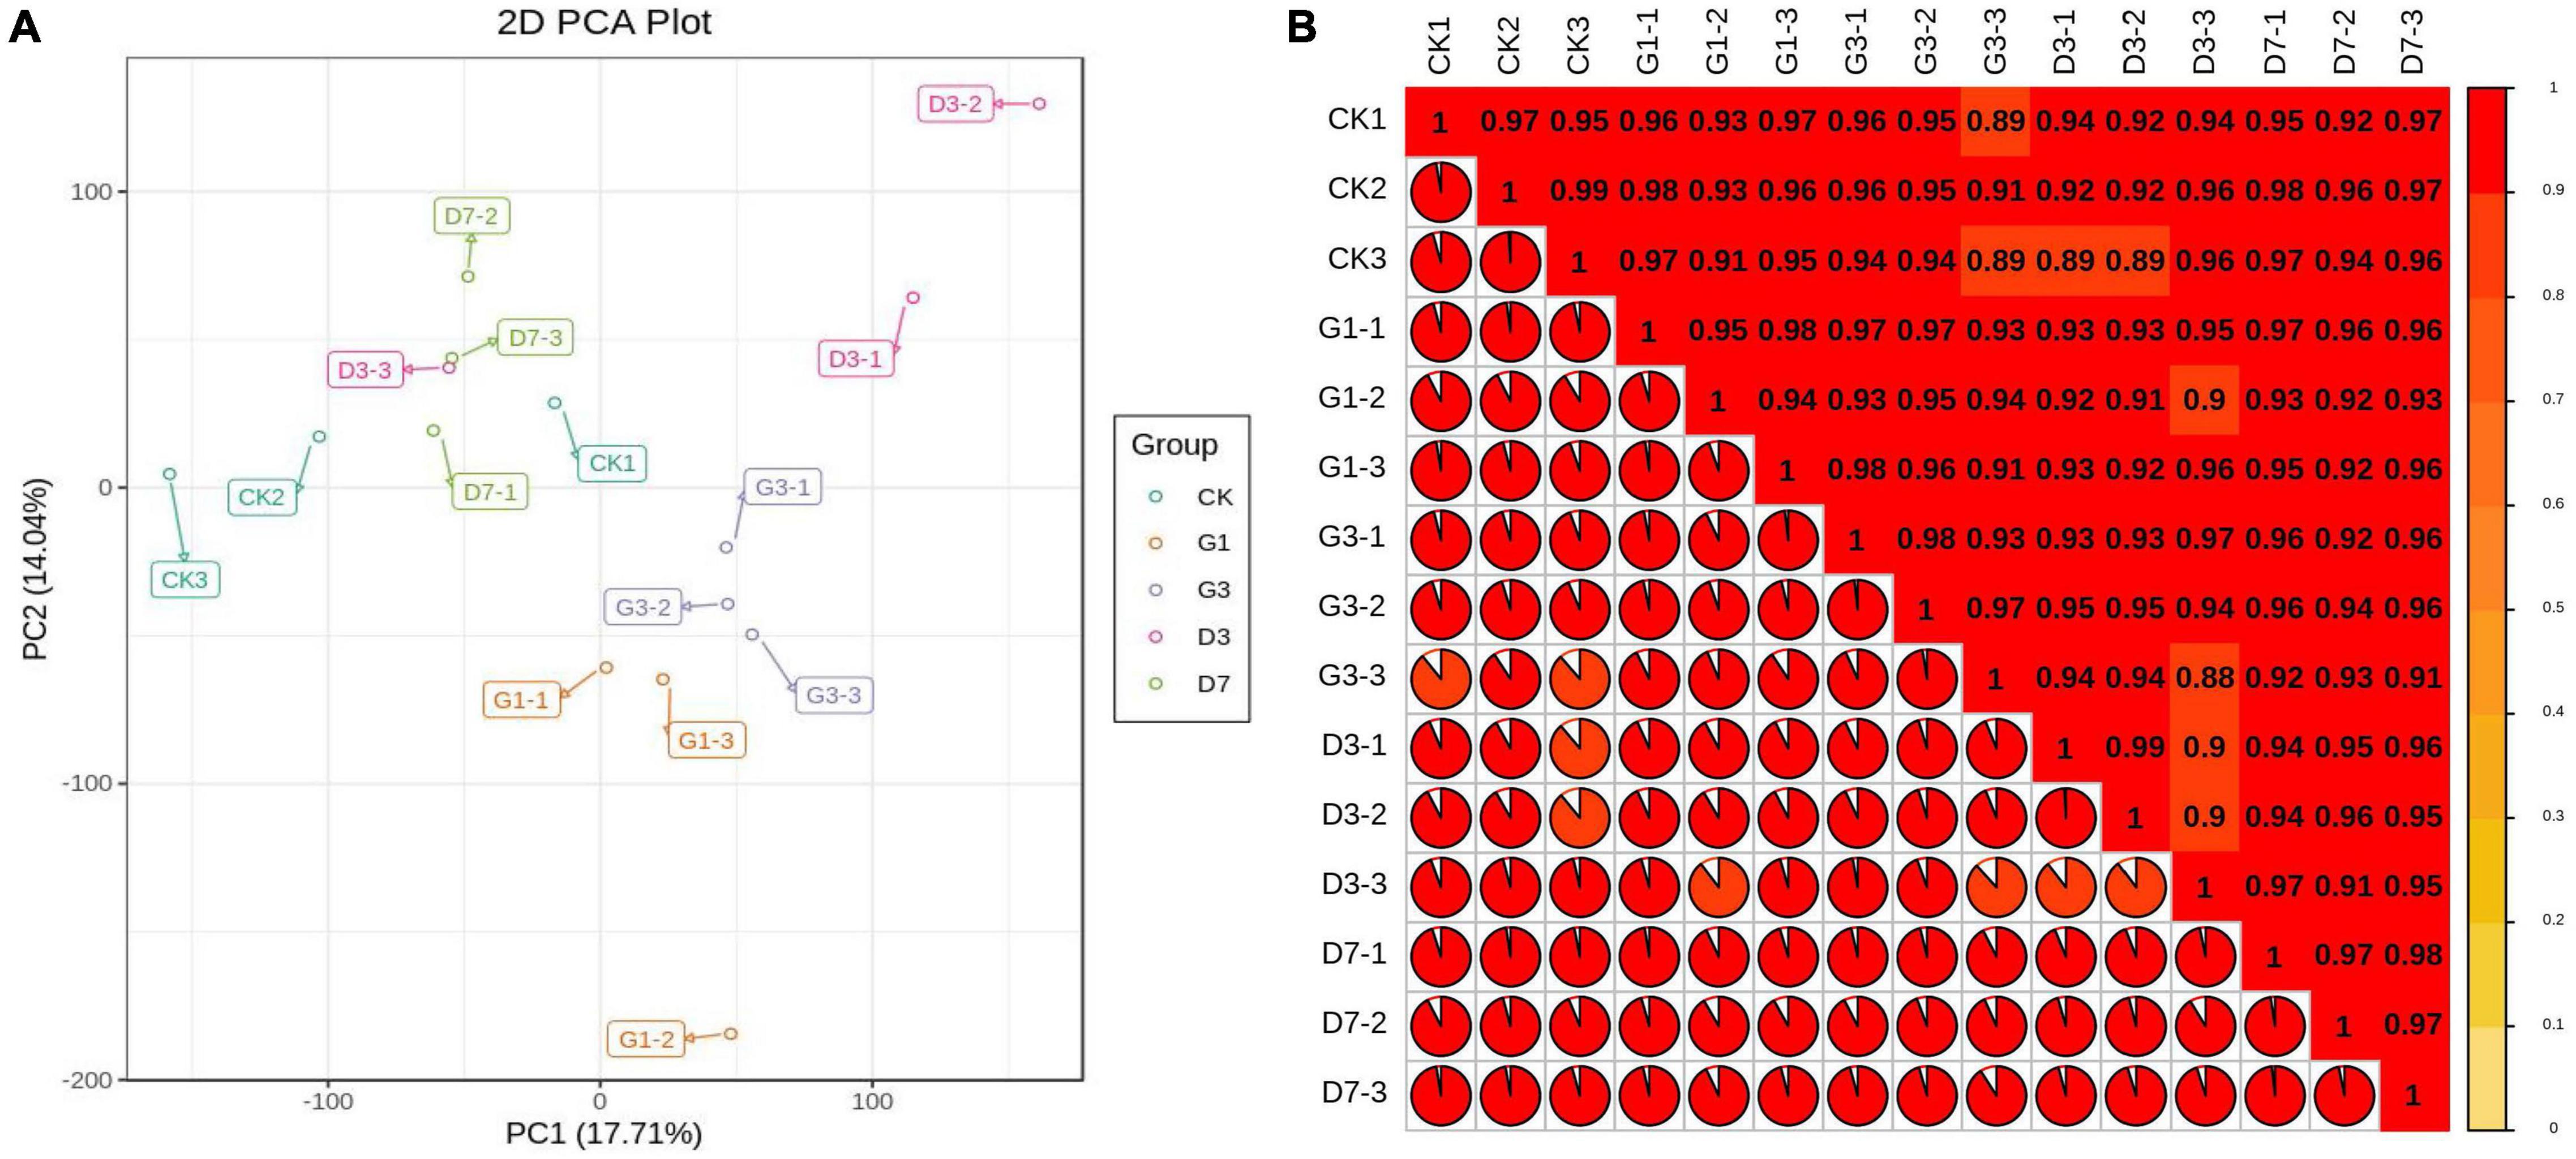
Figure 6. Correlation analysis between RNA-Seq replicate samples (A) and analysis of the principal components (B) of apple peel under different treatments.
Analysis of the DEGs in the four comparison groups CK_vs_G3, CK_vs_D7, G3_vs_D3, and G3_vs_D7 was conducted. A total of 2,467 DEGs were detected in the CK_vs_G3 group, including 1,781 up-regulated genes and 686 down-regulated genes. This was followed by G3_vs_D7 with 2,202 DEGs (728 up-regulated genes and 1,474 down-regulated genes). This indicated that various metabolic pathways were active in apple peel in the light induction stage; thus, there were significant differences in the DEGs between the light induction and control groups and between the light induction and dark groups (Figure 7A). A Venn diagram revealed 74 common DEGs among the four comparison groups. Among these DEGs, 34 were enriched in flavonoid metabolism pathway. A total of 27 of these were enriched in glycosylation transfer, and 16 were transcription factors such as MYB, bHLH, and NAC; 24 genes had other functions and no annotation could be recovered (Figure 7B). Analysis of KEGG pathway enrichment revealed that the DEGs were mainly enriched in metabolic pathway and secondary metabolite biosynthesis pathway, as well as the chlorophyll, carotenoid, and flavonoid metabolic pathway related to peel color, especially the anthocyanin biosynthesis pathway, and genes involved in this pathway were significantly expressed only in the groups subjected to dark treatment (Figures 7C–F). Anthocyanin synthesis is thus key to light-induced color formation under dark conditions.
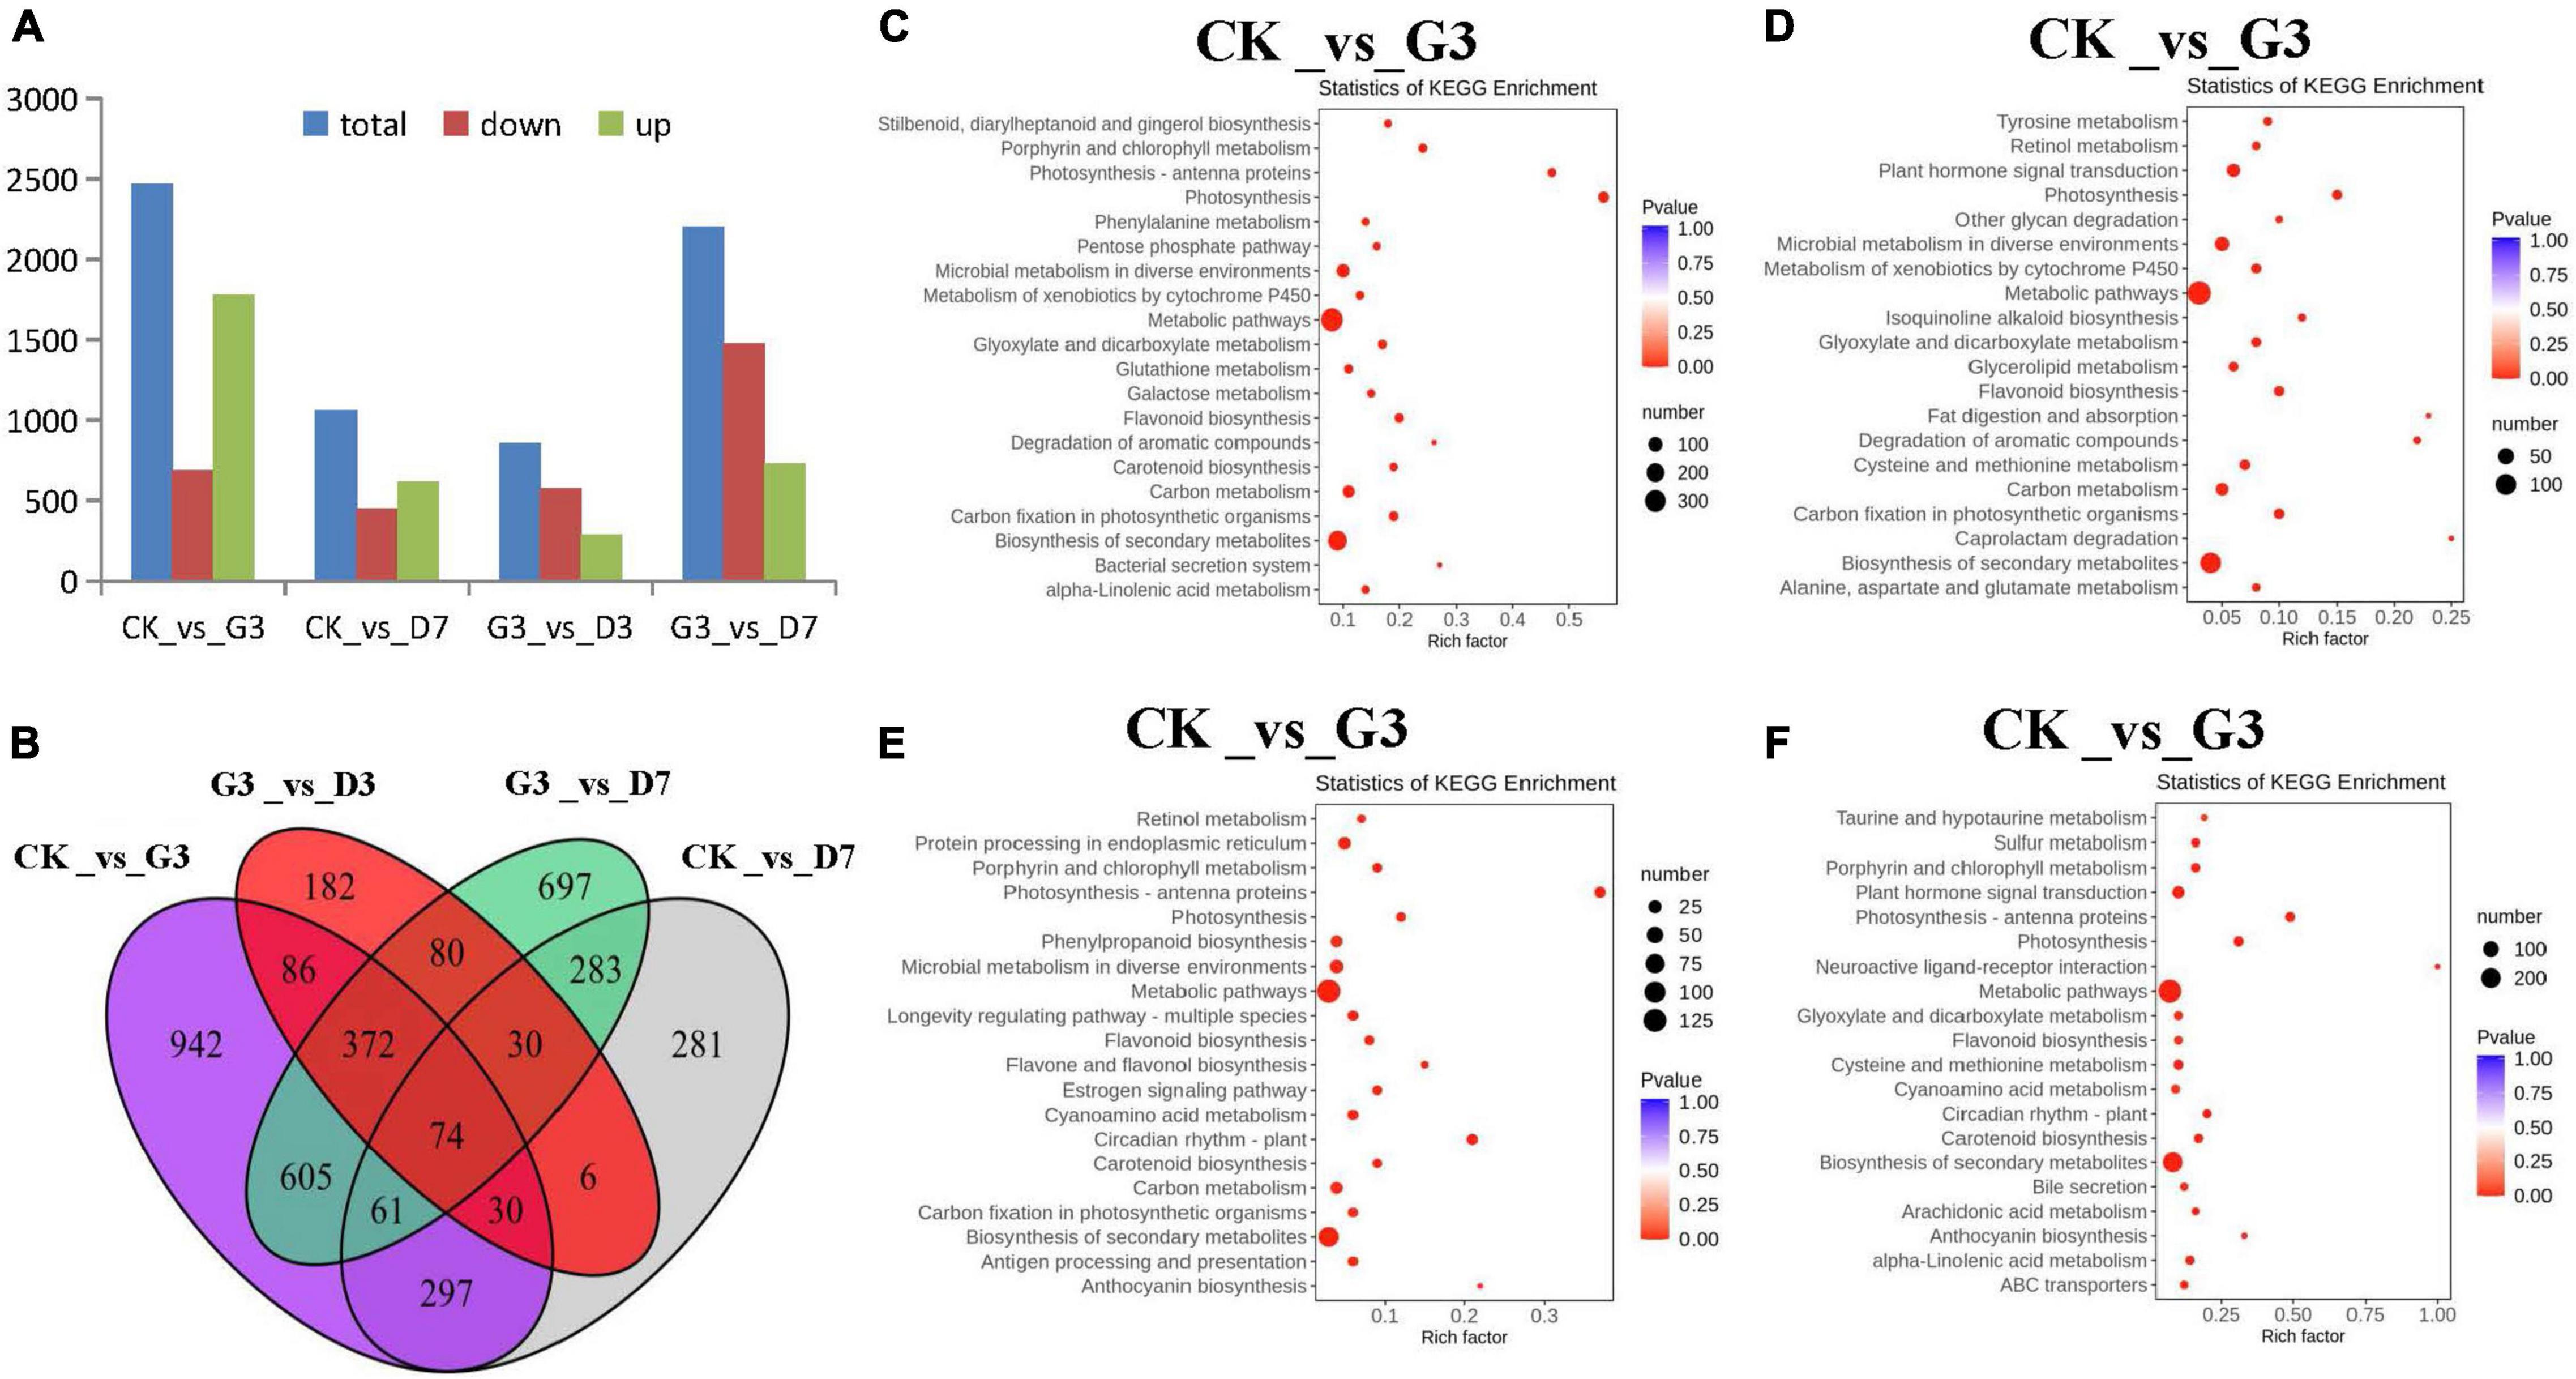
Figure 7. Identification and characterization of differentially accumulated metabolites (DAMs) in the peel of different treatments. (A) DEG statistics among the four comparison groups in the different treatments. (B) Venn diagram showing the shared and specific DEGs among the four comparison groups of the different treatments. KEGG enrichment analysis of the DEGs in the (C) CK_vs_G3, (D) CK_vs_D7, (E) G3_vs_D3, and (F) G3_vs_D7 groups.
A total of 31 structural genes annotated to eight enzymes in the anthocyanin biosynthesis pathway were identified among the DEGs (Figure 8A). The expression patterns of the photosensitive genes MdPALs and MdANSs are inconsistent with the phenotypic changes observed under dark conditions. However, some MdUFGT genes were highly expressed under dark conditions, including LOC103439229, LOC103455827, LOC103443393, LOC103443444, LOC103410839, LOC103411018, LOC103438383, LOC103441424, LOC103409768, LOC103433538, LOC103411040, and LOC103421716.
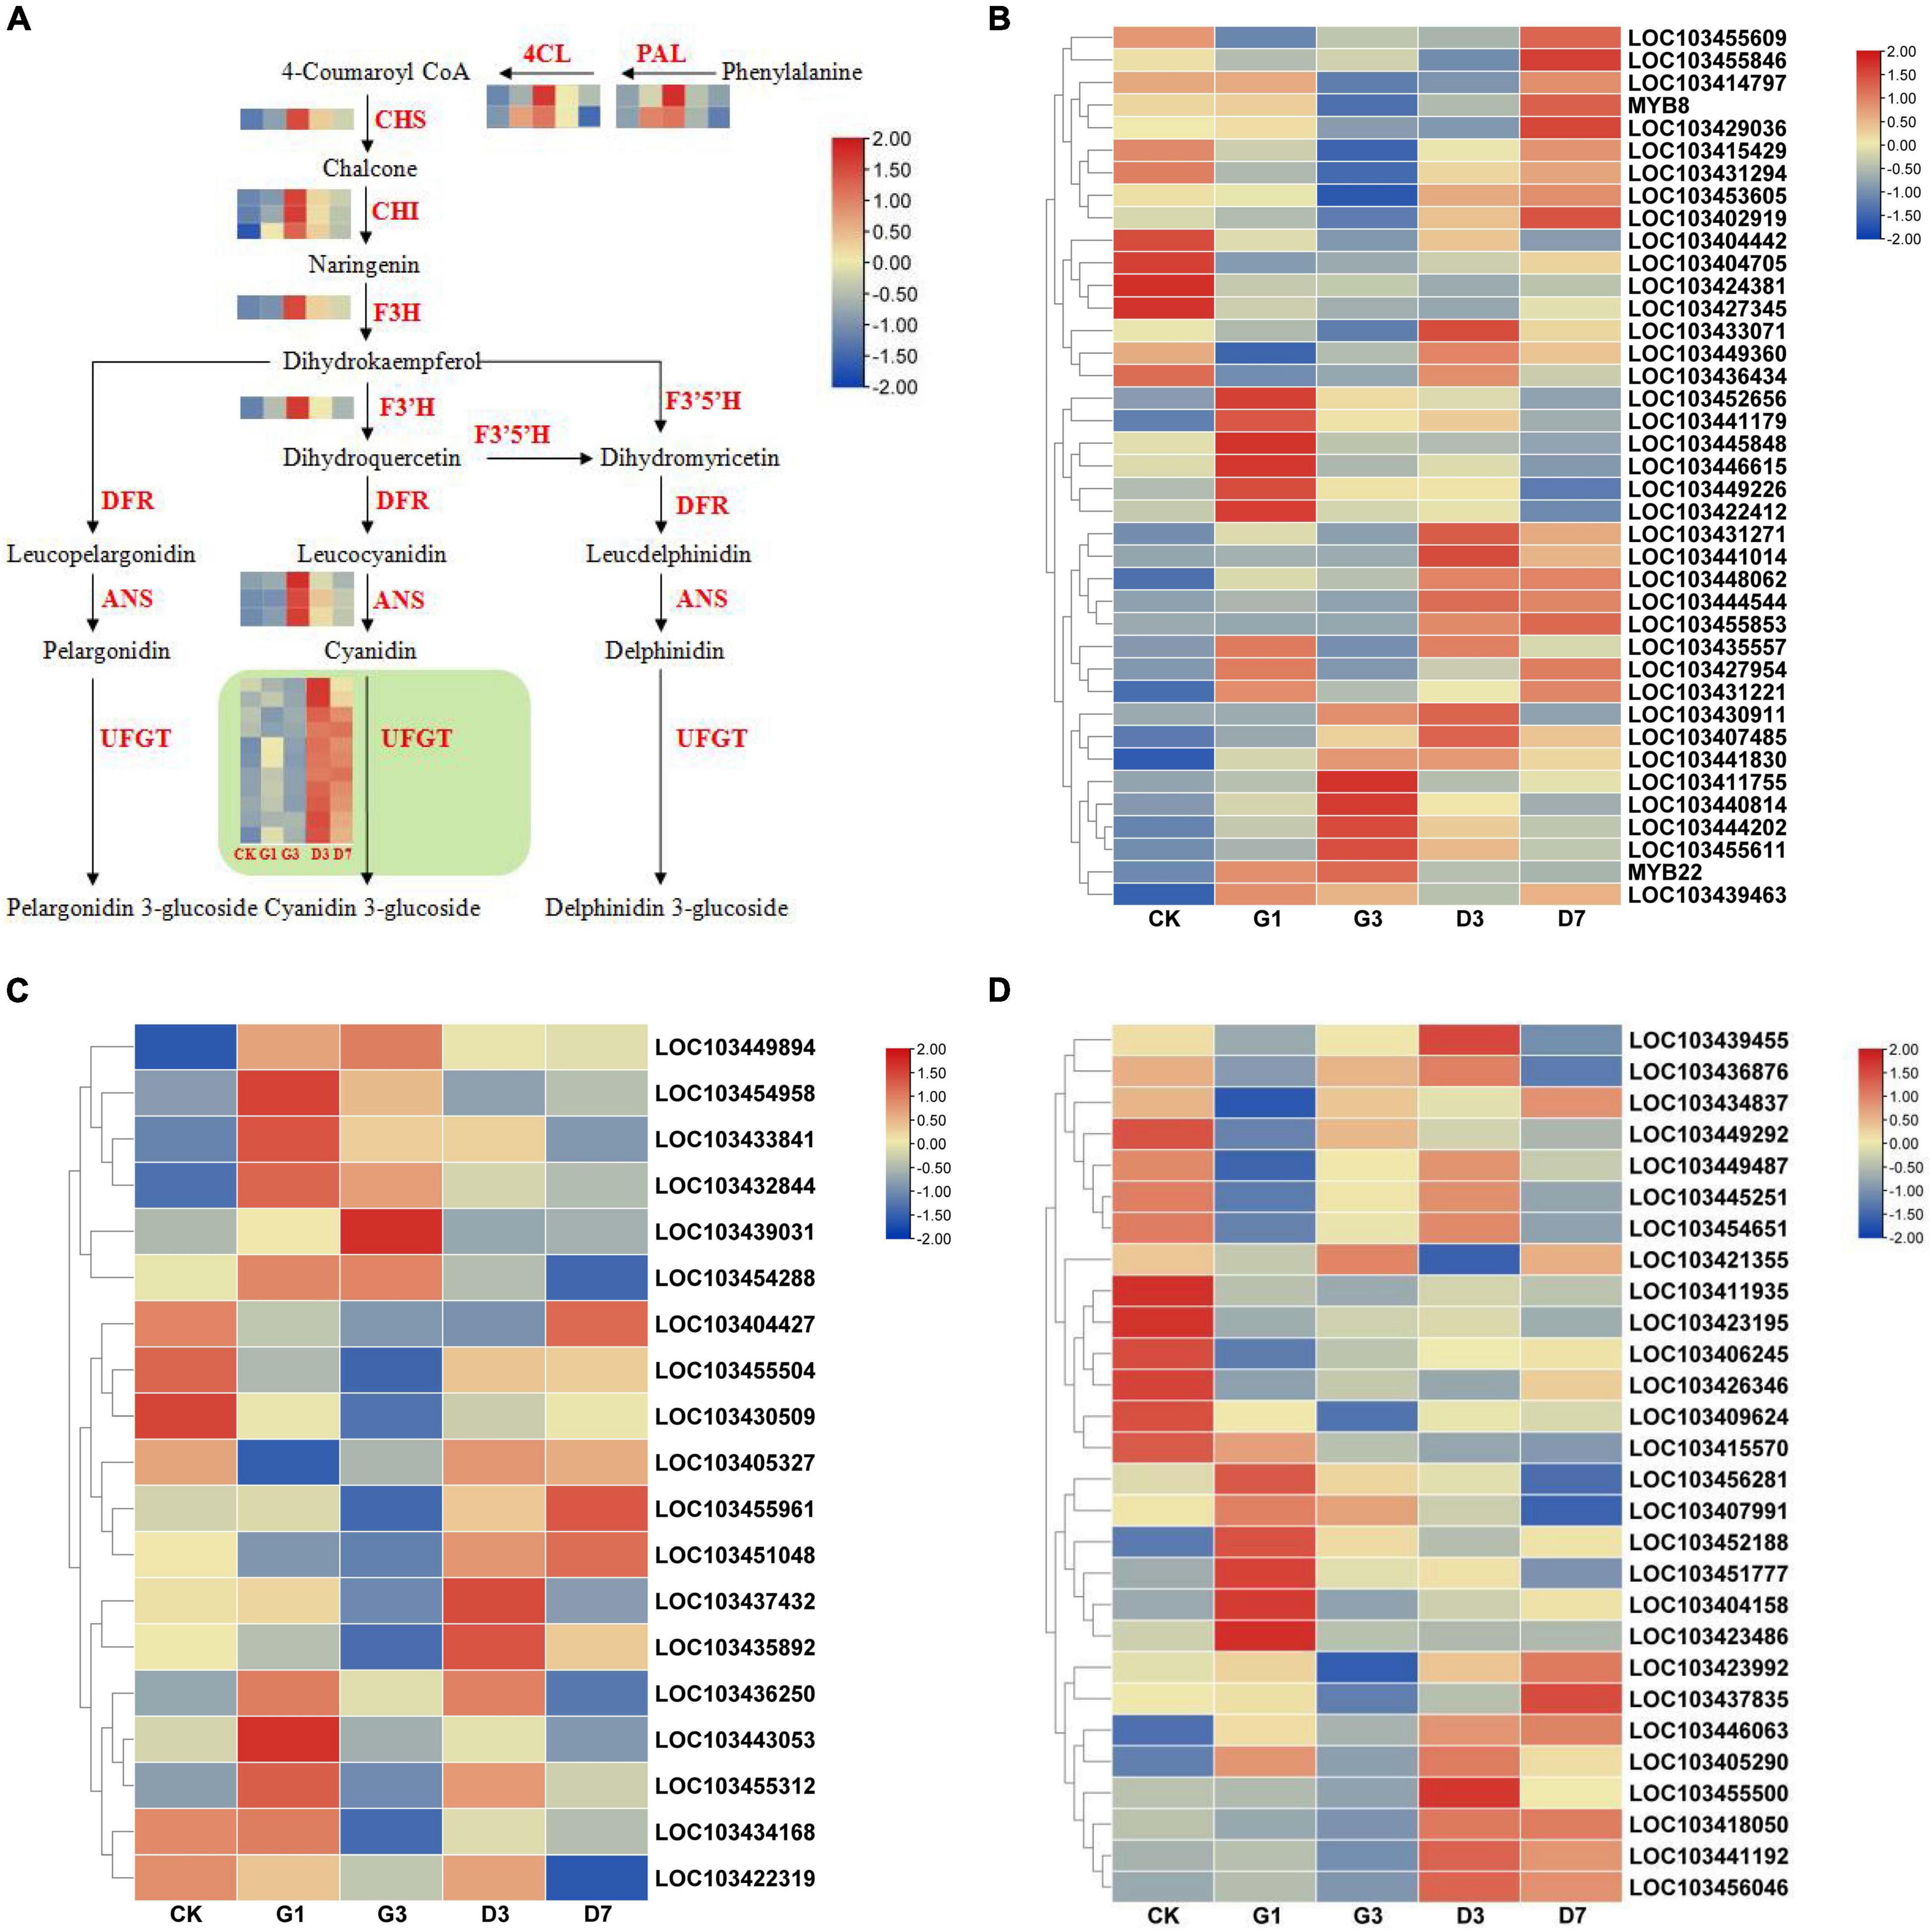
Figure 8. Expression analysis of the structural genes in anthocyanin synthesis pathways and transcription factors in the peel of different treatments. (A) Expression analysis of structural genes in the anthocyanin synthesis pathways in the peel under different treatments. Expression analysis of MYB (B), bHLH (C), and NAC (D) transcription factors.
Transcription factors involved in anthocyanin biosynthesis mainly include MYB, bHLH, NAC, and other gene families. Ten candidate genes from the MdMYB family showing expression patterns consistent with phenotypic changes were identified, including LOC103431271, LOC103441014, LOC103448062, LOC103444544, LOC103455853, LOC103435557, LOC103415429, LOC103431294, LOC103453605, and LOC103402919 (Figure 8B). Three candidate genes were identified from the MdbHLH family: LOC103455961, LOC103451048, and LOC103435892 (Figure 8C). Four candidate genes were identified from the MdNAC family: LOC103455500, LOC103418050, LOC103441192, and LOC103456046 (Figure 8D).
The selected candidate genes were verified by qRT-PCR, and the expression patterns of five MdUFGTs were consistent with phenotypic changes observed in experiments: LOC103443444, LOC103410839, LOC103411018, LOC103441424, and LOC103421716 (Figure 9). Five candidate MdMYB genes, LOC103431271, LOC103441014, LOC103448062, LOC103444544, and LOC10345585, were also identified (Figure 9). Three candidate MdNAC genes, LOC103455500, LOC103441192, and LOC103456046, were identified (Figure 9). MdbHLH genes were not selected as candidate genes because of their small difference multiples (Figure 9). Therefore, the above candidate genes including MdUFGTs, MdMYBs and MdNACs may be the key to the apple’s reddening which need further research.
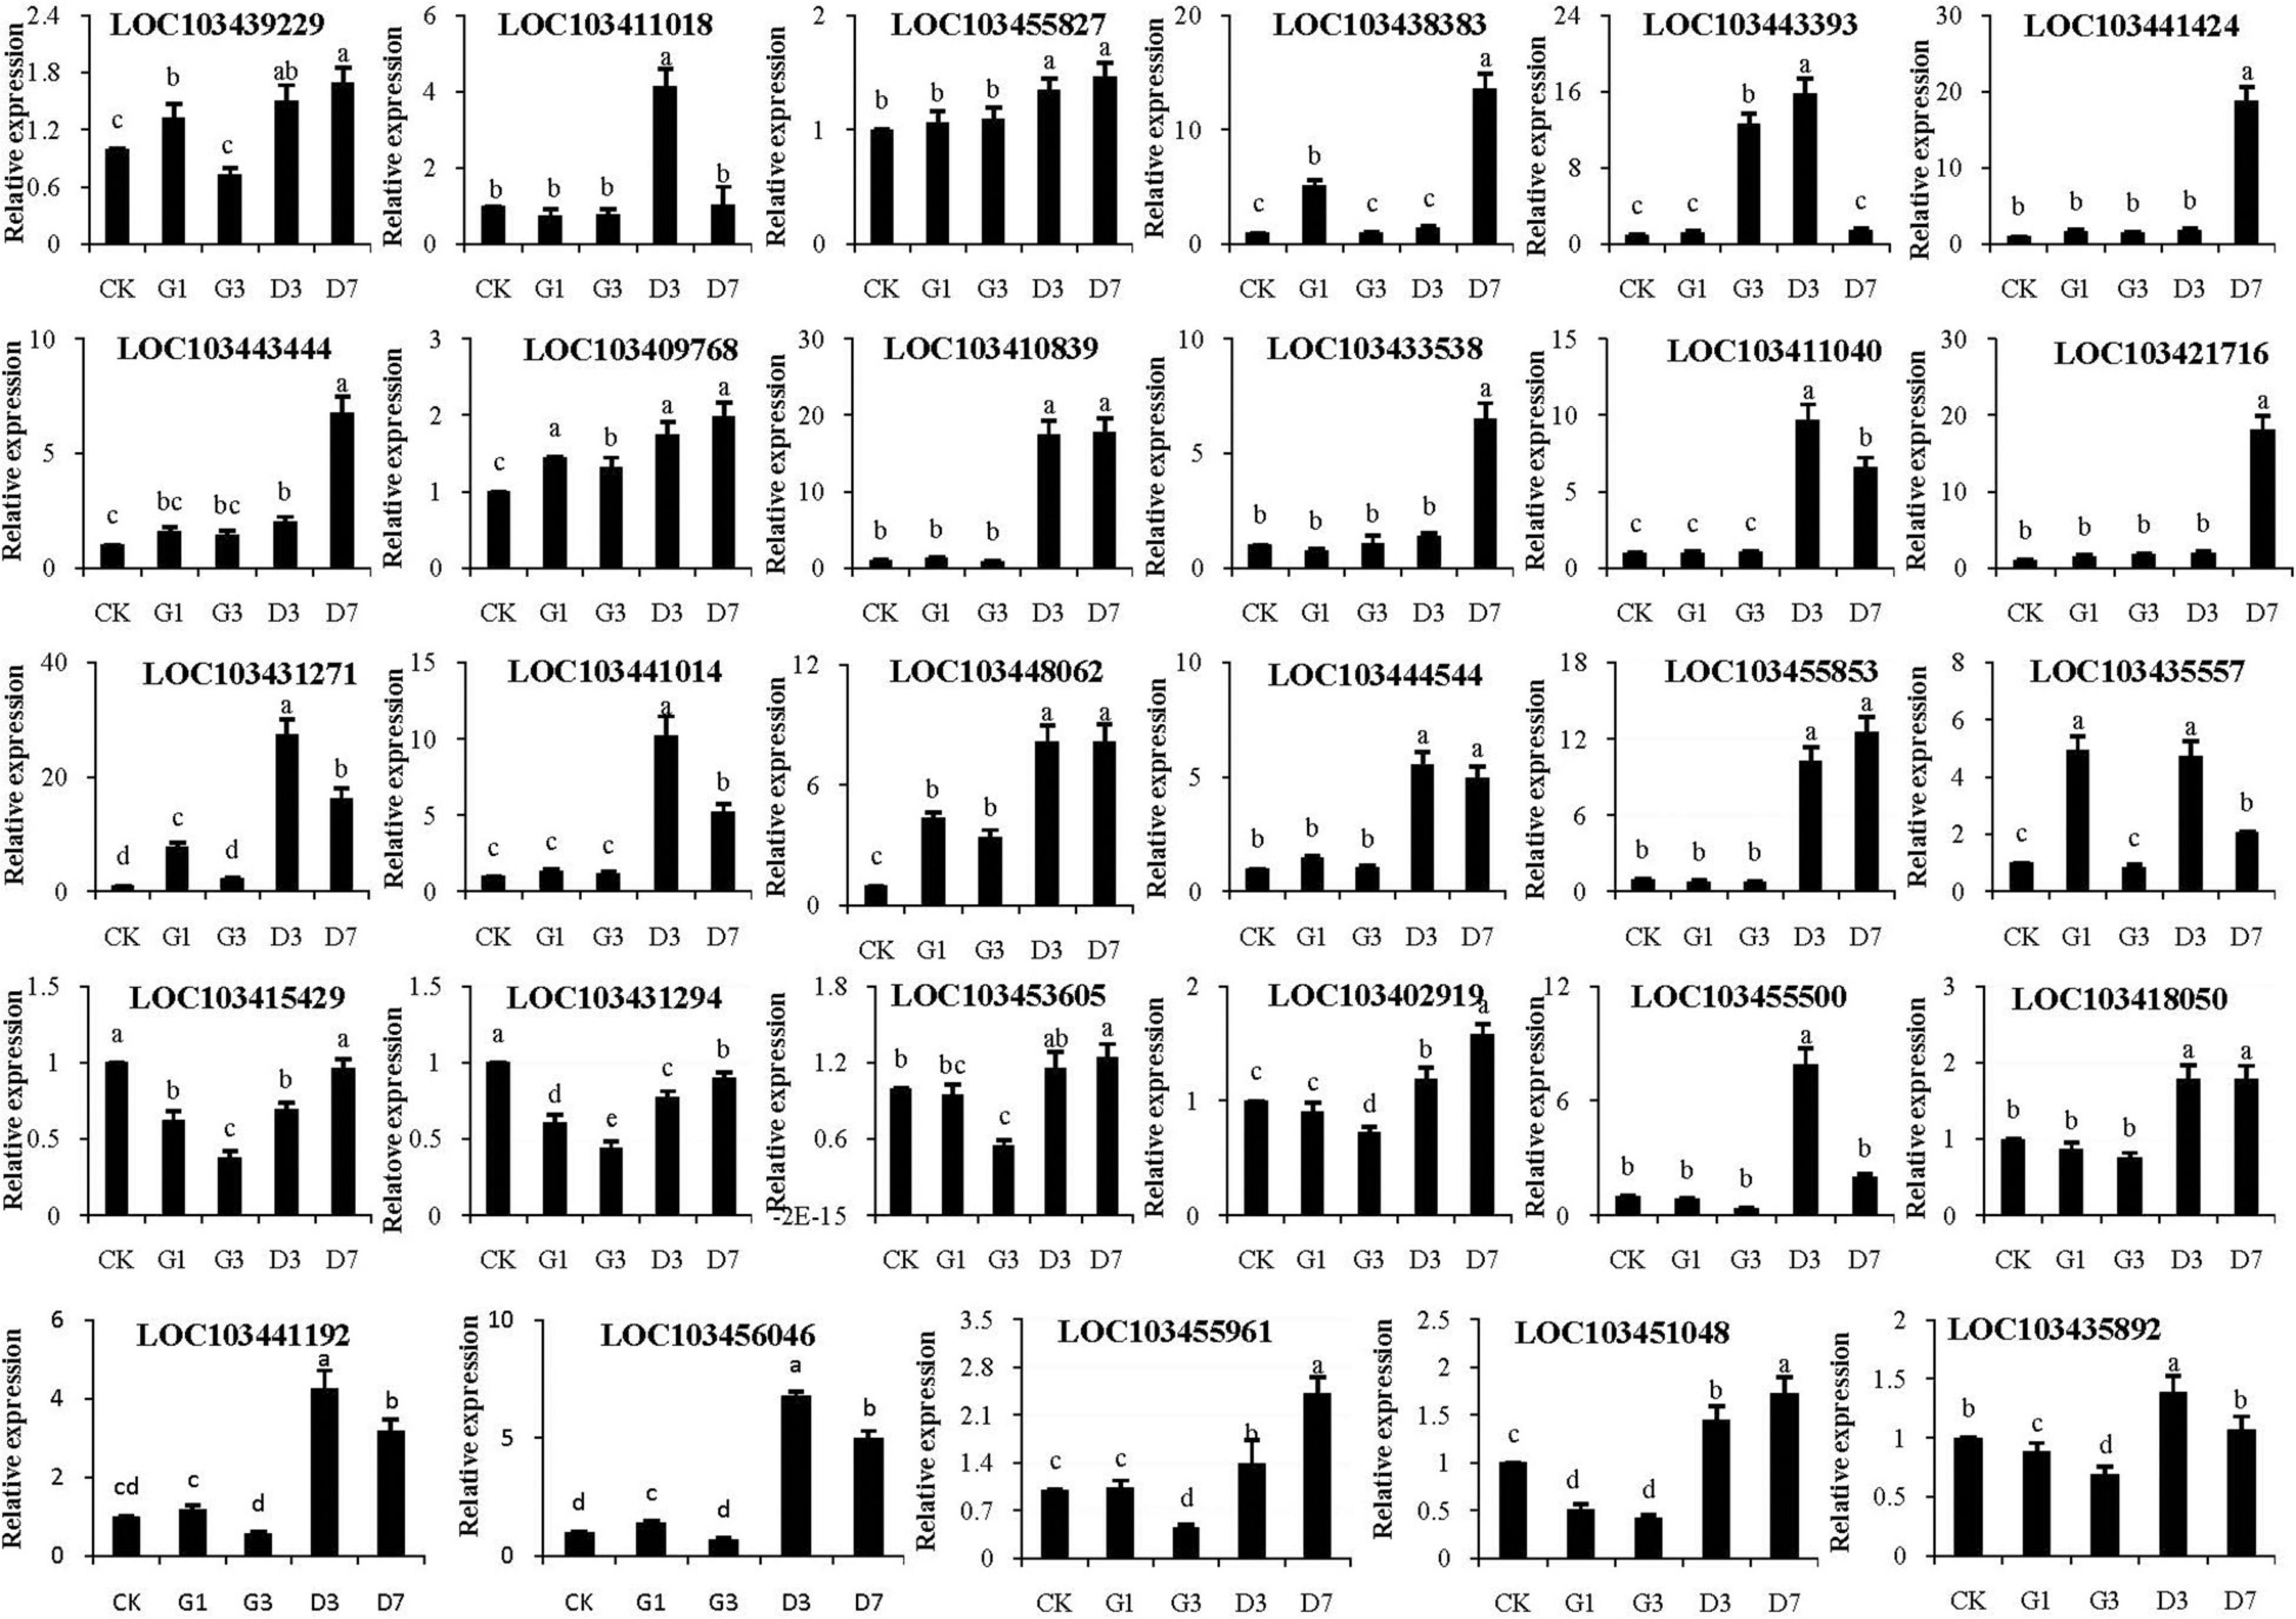
Figure 9. Verification of the expression of MdUFGT and transcription factor (MdMYB, MdNAC, and MdbHLH) genes in the peel in different treatments by qRT-PCR.
Light is an essential condition for anthocyanidin synthesis in many fruits (Maier and Hoecker, 2015). Light promotes anthocyanin accumulation by up-regulating the expression of structural genes and transcription factors involved in the anthocyanin synthesis pathway. However, the expression of these genes is significantly reduced under weak light or dark conditions, which leads to decreases in the anthocyanin content (Mol et al., 1996; Jeong et al., 2004). Previous studies have shown that anthocyanins do not accumulate or degrade in dark environments; whether color formation can occur in fruits under dark conditions following light induction has not been reported to date. We found that color formation can occur in apple peel following light induction. After light induction, anthocyanin synthesis occurred in apple peel in the dark, and color formation did not occur in apple peel without light induction (Figure 1). Fruit color is determined by chlorophyll, carotenoids, and flavonoid pigments (including anthocyanins, flavonoids, and flavonols) according to studies of apple, avocado, and lychee (Wang et al., 2002; Cox et al., 2004; Chi et al., 2021). In this experiment, the pattern of color formation of apple peel under a dark environment was similar to that observed under natural conditions. As the chlorophyll content decreased and the anthocyanin content increased in the peel, the green color of the peel faded, and the red color developed. The content of carotenoids increased, which was not consistent with expectation, possibly because the length of the dark treatment was not sufficiently long for a decline in the content of carotenoids to be detected; however, additional work is needed to verify this possibility. Analysis of color variation in the peel showed that the bright chromaticity L* and comprehensive chromaticity h° decreased, and the red/green chromaticity a* increased rapidly during the color formation process; these findings are consistent with the results of previous studies of apple (Meng et al., 2016).
The metabolic network underlying color development has been examined using metabolomics in various studies (Jian et al., 2019; Zhang et al., 2020; Zhou D. et al., 2020). In our study, 620 metabolites belonging to 23 categories were detected, including anthocyanins, proanthocyanidins, amino acids and derivatives, phenolamides, carbohydrates, flavones, flavonols, flavanones, and organic acids and derivatives. Many studies have shown that the substances associated with the development of peel color are mainly flavonoids, including flavones, flavonols, flavanones, isoflavones, and anthocyanins (Ubi et al., 2006). A total of 171 flavonoids, including 13 anthocyanins, 116 flavonoids, and 42 phenylpropanoids, were detected in the jujube varieties ‘Junzao’ and ‘Tailihong’ (Shi et al., 2020). A total of 158 flavonoids, including 13 anthocyanins, 140 flavonoids, and 5 proanthocyanidins, were detected in the jujube variety ‘Dongzao’ (Zhang et al., 2020). In our study, 121 flavonoids, including 10 anthocyanins, 5 proanthocyanidins, and 106 flavonoids, were detected. Further analysis revealed that the DAMs between the control and the different light induction and dark treatments were significantly enriched in flavonoid biosynthesis pathway and anthocyanin biosynthesis pathway. This indicates that the flavonoid biosynthesis pathway and anthocyanin biosynthesis pathway are key metabolic pathways involved in color formation in dark environments. There were 10 anthocyanins closely related to the development of the red color of apple peel, and cyanidin-3-O-galactoside and cyanidin-3-O-glucoside were the main metabolites correlated with the observed phenotypic changes. Cyanidin-3-O-galactoside accounted for 84.71% of the total pigment after 7 days of dark treatment. These findings are consistent with the results of previous studies (Treutter, 2001).
RNA-Seq is commonly used to identify DEGs and enriched metabolic pathways from large datasets, and this technique has been used in studies of pear, peach, and strawberry (Lin et al., 2018; Cao et al., 2019; Yuan et al., 2021). The expression analysis conducted in this study revealed a large number of DEGs between the light induction treatment and the control and between the light induction treatment stage and the dark treatment stage. KEGG pathway analysis revealed that the DEGs genes were enriched in metabolic pathway, biosynthesis of secondary metabolites, chlorophyll metabolism, carotenoid biosynthesis, anthocyanin biosynthesis, and other pathways, and these DEGs, especially those involved in anthocyanin biosynthesis, were significantly expressed exclusively in the dark treatment stage. This indicated that anthocyanin synthesis was the key to color formation under dark conditions.
Many studies have shown that there is a positive correlation between anthocyanin accumulation in the pericarp and one or more structural genes in the anthocyanin synthesis pathway (Takos et al., 2006; Wei et al., 2011; Zhang et al., 2020). In our study, the expression of 12 MdUFGT genes was low in the control and light induction stages and higher in the dark treatment stage, which was consistent with observed phenotypic changes, and the expression of other structural genes was not consistent with phenotypic changes. Therefore, MdUFGT is considered a key structural gene involved in the color formation of apple peel in dark environments after light induction. Transcription factors are the second largest group of regulatory proteins involved in anthocyanin synthesis, and they regulate anthocyanin synthesis by activating or inhibiting the activity of the upstream promoters of structural genes (Kobayashi et al., 2001; An et al., 2015; Jiang et al., 2021). Five MYB transcription factors and three NAC transcription factors were identified by phenotypic screening and qRT-PCR. High expression of MdMYBs, MdNACs, and MdUFGTs is important for anthocyanin accumulation under dark conditions. Light-induced color formation of apple peel under dark conditions is controlled by the MdMYB and MdNAC transcription factors, which act on the promoters of MdUFGTs to regulate anthocyanin synthesis. This mechanism requires verification by yeast single-hybrid assays, electrophoretic mobility shift assays, and transient transformation tests.
Under dark conditions, anthocyanins could be synthesized in apple peel following light induction, and this was associated with a decrease in bright chromaticity L*, comprehensive chromaticity h°, and chlorophyll content and an increase in red/green chromaticity a* and the anthocyanin content. Metabolic analysis indicated that cyanidin-3-O-galactoside and cyanidin-3-O-glucoside were key metabolites. Transcriptome analysis revealed that MdUFGTs, MdMYBs, and MdNACs were the key transcription factors involved in this color formation process. Further study of the roles of the 13 candidate genes identified by qRT-PCR could provide new insight into the light-induced color formation of apple peel under dark conditions.
The original contributions presented in the study are publicly available. This data can be found here: NCBI GSE118455 and MetaboLights MTBLS4989.
XX, XZ, and JW designed the experiment. XX, RC, and XH performed the experiment and analyzed the data. XX and ST wrote the manuscript. All authors have read and approved the final version of the manuscript.
This work was supported by the National Key Research and Development Program of China (2019YFD1001403) and the China Agriculture Research System of MOF and MARA (CARS-27).
The authors declare that the research was conducted in the absence of any commercial or financial relationships that could be construed as a potential conflict of interest.
All claims expressed in this article are solely those of the authors and do not necessarily represent those of their affiliated organizations, or those of the publisher, the editors and the reviewers. Any product that may be evaluated in this article, or claim that may be made by its manufacturer, is not guaranteed or endorsed by the publisher.
The Supplementary Material for this article can be found online at: https://www.frontiersin.org/articles/10.3389/fpls.2022.946115/full#supplementary-material
An, J., Liu, Y., Zhang, X., Bi, S., Wang, X., You, C., et al. (2020). Dynamic regulation of different light intensity-modulated anthocyanin biosynthesis by BT2-TCP46-MYB1 in apple. J. Exp. Bot. 71, 3094–3109. doi: 10.1093/jxb/eraa056
An, X., Tian, Y., Chen, K., Liu, X., Liu, D., Xie, X., et al. (2015). MdMYB9 and MdMYB11 are involved in the regulation of the JA-induced biosynthesis of anthocyanin and proanthocyanidin in apples. Plant Cell Physiol. 56, 650–662. doi: 10.1093/pcp/pcu205
An, X., Tian, Y., Chen, K., Wang, X., and Hao, Y. (2012). The apple WD40 protein MdTTG1 interacts with bHLH but not MYB proteins to regulate anthocyanin accumulation. J. Plant Physiol. 69, 710–717. doi: 10.1016/j.jplph.2012.01.015
Cao, Y., Xie, L., Ma, Y., Ren, C., Xing, M., Fu, Z., et al. (2019). PpMYB15 and PpMYBF1 transcription factors are involved in regulating flavonol biosynthesis in peach fruit. J. Agric. Food Chem. 67, 644–652. doi: 10.1021/acs.jafc.8b04810
Chi, X., Wang, X., Liu, X., Jiang, Z., Sylwia, K., Song, L., et al. (2021). The variation of color-associated factors of ‘Fuji’ apple with different color patterns after bag removal. Mol. Plant Breed. 19, 1649–1656. doi: 10.13271/j.mpb.019.001649
Cox, K., McGhie, T., White, A., and Woolf, A. (2004). Skin colour and pigment changes during ripening of ‘Hass’ avocado fruit. Postharvest. Biol. Technol. 31, 287–294. doi: 10.1016/j.postharvbio.2003.09.008
Deng, X., Shu, H., Hao, Y., Xu, Q., Han, M., Zhang, S., et al. (2018). Review on the centennial development of pomology in China. J. Agric. 8, 34–34.
Espley, R., Hellens, R., Putterill, J., Stevenson, D., Kutty-Amma, S., and Allan, A. (2007). Red colouration in apple fruit is due to the activity of the MYB transcription factor, MdMYB10. Plant J. 49, 414–427. doi: 10.1111/j.1365-313X.2006.02964.x
Fraga, C., Clowers, B., Moore, R., and Zink, E. (2010). Signature-discovery approach for sample matching of a nerve-agent precursor using liquid chromatography-mass spectrometry, XCMS, and chemometrics. Anal. Chem. 82, 4165–4173. doi: 10.1021/ac1003568
Gu, K., Wang, C., Hu, D., and Hao, Y. (2019). How do anthocyanins paintour horticultural products? Sci. Hortic. 249, 257–262. doi: 10.1016/j.scienta.2019.01.034
Hecke, K., Herbinger, K., Veberic, R., Trobec, M., Toplak, H., Stampar, F., et al. (2006). Sugar-, acid- and phenol contents in apple cultivars from organic and integrated fruit cultivation. Eur. J. Clin. Nutr. 60, 1136–1140. doi: 10.1038/sj.ejcn.1602430
Jeong, S., Goto-Yamamoto, N., Kobayashi, S., and Esaka, M. (2004). Effects of plant hormones and shading on the accumulation of anthocyanins and the expression of anthocyanin biosynthetic genes in grape berry skins. Plant Sci. 167, 247–252. doi: 10.1016/j.plantsci.2004.03.021
Jian, W., Cao, H., Yuan, S., Liu, Y., Lu, J., and Lu, W. (2019). SlMYB75, an MYB-type transcription factor, promotes anthocyanin accumulation and enhances volatile aroma production in tomato fruits. Hortic. Res. 6:22. doi: 10.1038/s41438-018-0098-y
Jiang, S., Sun, Q., Zhang, T., Liu, W., Wang, N., and Chen, X. (2021). MdMYB114 regulates anthocyanin biosynthesis and functions downstream of MdbZIP4-like in apple fruit. J. Plant Physiol. 257:153353. doi: 10.1016/j.jplph.2020.153353
Kang, H., Zhang, T., Fu, L., Yao, Y., You, C., Wang, X., et al. (2021). The apple MdCOP1-interacting protein 1 negatively regulates hypocotyl elongation and anthocyanin biosynthesis. BMC Plant Biol. 21:15. doi: 10.1186/s12870-020-02789-3
Kim, D., Langmead, B., and Salzberg, S. (2015). HISAT: a fast spliced aligner with low memory requirements. Nat Methods 12, 357–360. doi: 10.1038/nmeth.3317
Kobayashi, S., Ishimaru, M., Ding, C., Yakushiji, H., and Goto, N. (2001). Comparison of UDP-glucose: flavonoid 3-O-glucosyltransferase (UFGT) gene sequences between white grapes (Vitis vinifera) and their sports with red skin. Plant Sci. 160, 543–550. doi: 10.1016/s0168-9452(00)00425-8
Li, W., Ning, G., Zuo, C., Chu, M., Yang, S., Ma, Z., et al. (2021). MYB_SH[AL]QKY[RF] transcription factors MdLUX and MdPCL-like promote anthocyanin accumulation through DNA hypomethylation and MdF3H activation in apple. Tree Physiol. 41, 836–848. doi: 10.1093/treephys/tpaa156
Li, Y., Mao, K., Zhao, C., Zhao, X., Zhang, H., Shu, H., et al. (2012). MdCOP1 ubiquitin E3 ligases interact with MdMYB1 to regulate light-induced anthocyanin biosynthesis and red fruit coloration in apple. Plant Physiol. 160, 1011–1022. doi: 10.1104/pp.112.199703
Lin, Y., Jiang, L., Chen, Q., Li, Y., Zhang, Y., Luo, Y., et al. (2018). Comparative transcriptome profiling analysis of red-and white-fleshed strawberry (Fragaria×ananassa) provides new insight into the regulation of the anthocyanin pathway. Plant Cell Physiol. 59, 1844–1859. doi: 10.1093/pcp/pcy098
Maier, A., and Hoecker, U. (2015). COP1/SPA ubiquitin ligase compl exesrepress anthocyanin accumulation under low light and high light conditions. Plant Signal Behav. 10:e970440. doi: 10.4161/15592316.2014.970440
Meng, R., Zhang, J., An, L., Zhang, B., Yang, Y., Jiang, X., et al. (2016). Expression profiling of several gene families involved in anthocyanin biosynthesis in apple (Malus domestica Borkh.) skin during fruit development. J. Plant Growth. Regul. 35, 449–464. doi: 10.1007/s00344-015-9552-3
Mol, J., Jenkins, G., Schafer, E., Weiss, D., and Walbot, V. (1996). Signal perception, transduction, and gene expression involved in anthocyanin biosynthesis. Crit. Rev. Plant Sci. 15, 525–557. doi: 10.1080/07352689609382369
Sampaio, S., Petropoulos, S., Dias, M., Pereira, C., Calhelha, R., Fernandes, A., et al. (2021). Phenolic composition and cell-based biological activities of ten coloured potato peels (Solanum tuberosum L.). Food Chem. 363:130360. doi: 10.1016/j.foodchem.2021.130360
Shi, Q., Du, J., Zhu, D., Li, X., and Li, X. (2020). Metabolomic and transcriptomic analyses of anthocyanin biosynthesis mechanisms in the color mutant ziziphus jujuba cv. Tailihong. J. Agric. Food Chem. 68, 15186–15198. doi: 10.1021/acs.jafc.0c05334
Takos, A., Jaffé, F., Jacob, S., Robinson, S., and Walker, A. (2006). Light-induced expression of a MYB gene regulates anthocyanin biosynthesis in red apples. Plant Physiol. 142, 1216–1232. doi: 10.1104/pp.106.088104
Treutter, D. (2001). Biosynthesis of phenolic compounds and its regulation in apple. Plant Growth Regul. 34, 71–89. doi: 10.1023/A:1013378702940
Ubi, B., Honda, C., Bessho, H., Kondo, S., Wada, M., Kobayashi, S., et al. (2006). Expression analysis of anthocyanin biosynthetic genes in apple skin: effect of UV-B and temperature. Plant. Sci. 170, 571–578. doi: 10.1016/j.plantsci.2005.10.009
Wang, H., Huang, X., and Huang, H. (2002). A study on the causative factors retarding pigmentation in the fruit of ‘Feizixiao’, Litchi. Acta Hortic. Sin. 29, 408–412.
Wang, L., and Stoner, G. (2008). Anthocyanins and their role in cancer prevention. Cancer Lett. 269, 281–290. doi: 10.1016/j.canlet.2008.05.020
Wei, Y., Hu, F., Hu, G., Li, X., Huang, X., and Wang, H. (2011). Differential expression of anthocyanin biosynthetic genes in relation to anthocyanin accumulation in the pericarp of litchi chinensis sonn. PLoS One 6:e19455. doi: 10.1371/journal.pone.0019455
Winter, A., Ross, E., Wilkins, H., Stankiewicz, T., Wallace, T., Miller, K., et al. (2018). Ananthocyanin-enriched extract from strawberries delays disease onset and extends survival in the hSOD1G93A mouse model of amyotrophic lateral sclerosis. Nutr. Neurosci. 21, 414–426. doi: 10.1080/1028415X.2017.1297023
Wu, B., Cao, Y., Guan, L., Xin, H., Li, J., and Li, S. (2014). Genome-wide transcriptional profiles of the berry skin of two red grape cultivars (Vitis vinifera) in which anthocyanin synthesis is sunlight-dependent or -independent. PloS One 9:e105959. doi: 10.1371/journal.pone.0105959
Yang, L., Smyth, G., and Shi, W. (2014). Feature counts: an efficient general purpose program for assigning sequence reads to genomic features. Bioinformatics. 30, 923–930. doi: 10.1093/bioinformatics/btt656
Yuan, L., Niu, H., Yun, Y., Tian, J., Lao, F., Liao, X., et al. (2021). Analysis of coloration characteristics of Tunisian soft-seed pomegranate arils based on transcriptome and metabolome. Food Chem. 370:131270. doi: 10.1016/j.foodchem.2021.131270
Zhang, Q., Wang, L., Liu, Z., Zhao, Z., Zhao, J., Wang, Z., et al. (2020). Transcriptome and metabolome profiling unveil the mechanisms of Ziziphus jujuba Mill. peel coloration. Food Chem. 312:125903. doi: 10.1016/j.foodchem.2019.125903
Zhang, Y., Li, P., and Cheng, L. (2010). Developmental changes of carbohydrates, organic acids, amino acids, and phenolic compounds in ‘Honeycrisp’ apple flesh. Food Chem. 123, 1013–1018. doi: 10.1016/j.foodchem.2010.05.053
Zhou, D., Liu, Q., Peng, J., Tu, S., Pan, L., and Tu, K. (2020). Metabolic analysis of phenolic profiles reveals the enhancements of anthocyanins and procyanidins in postharvest peach as affected by hot air and ultraviolet C. Postharvest. Biol. Technol. 167:111227. doi: 10.1016/j.postharvbio.2020.111227
Keywords: apple, light induction, dark coloration, metabolome, transcriptome
Citation: Xue X, Tian S, Chen R, Han X, Wang J and Zhao X (2022) Clarifying the mechanisms of the light-induced color formation of apple peel under dark conditions through metabolomics and transcriptomic analyses. Front. Plant Sci. 13:946115. doi: 10.3389/fpls.2022.946115
Received: 17 May 2022; Accepted: 29 June 2022;
Published: 28 July 2022.
Edited by:
Isabel Lara, Universitat de Lleida, SpainReviewed by:
Jianlong Liu, Qingdao Agricultural University, ChinaCopyright © 2022 Xue, Tian, Chen, Han, Wang and Zhao. This is an open-access article distributed under the terms of the Creative Commons Attribution License (CC BY). The use, distribution or reproduction in other forums is permitted, provided the original author(s) and the copyright owner(s) are credited and that the original publication in this journal is cited, in accordance with accepted academic practice. No use, distribution or reproduction is permitted which does not comply with these terms.
*Correspondence: Jinzheng Wang, d2p6OTkyMDAxQDE2My5jb20=; Xianyan Zhao, emhhb3hpYW55YW5AcWx1LmVkdS5jbg==
†These authors have contributed equally to this work
Disclaimer: All claims expressed in this article are solely those of the authors and do not necessarily represent those of their affiliated organizations, or those of the publisher, the editors and the reviewers. Any product that may be evaluated in this article or claim that may be made by its manufacturer is not guaranteed or endorsed by the publisher.
Research integrity at Frontiers

Learn more about the work of our research integrity team to safeguard the quality of each article we publish.