 Shangyu Ma
 Junyou Hou1
- 1Key Laboratory of Wheat Biology and Genetic Improvement on Southern Yellow and Huai River Valley, Ministry of Agriculture and Rural Affairs, College of Agronomy, Anhui Agricultural University, Hefei, China
- 2Jiangsu Collaborative Innovation Center for Modern Crop Production, Nanjing, China
- 3Agricultural Park Management Center, Anhui Agricultural University, Hefei, China
Soil waterlogging is among the major factors limiting the grain yield of winter wheat crops in many parts of the world, including the middle and lower reaches of the Yangtze River China. In a field study, we investigated the relationship between leaf physiology and grain development under a varying duration of post-flowering waterlogging. A winter wheat cultivar Ningmai 13 was exposed to soil waterlogging for 0 (W0), 3 (W3), 6 (W6), and 9 d (W9) at anthesis. Increasing waterlogging duration significantly reduced flag leaf SPAD (soil plant analysis development) values and net photosynthetic rate (Pn). There was a linear reduction in flag leaf Pn and SPAD as plant growth progressed under all treatments; however, the speed of damage was greater in the waterlogged leaves. For example, compared with their respective control (W0), flag leaves of W9 treatment have experienced 46% more reduction in Pn at 21 d after anthesis (DAA) than at 7 DAA. Increasing waterlogging duration also induced oxidative damage in flag leaves, measured as malondialdehyde (MDA) contents. The capacity to overcome this oxidative damage was limited by the poor performance of antioxidant enzymes in wheat leaves. Inhibited leaf Pn and capacity to sustain assimilate synthesis under waterlogged environments reduced grain development. Compared with W0, W6 and W9 plants experienced a 20 and 22% reduction in thousand grain weight (TGW) in response to W6 and W9, respectively at 7 DAA and 11 and 19%, respectively at 28 DAA. Sustained waterlogging also significantly reduced grain number per spike and final grain yield. Averaged across two years of study, W9 plants produced 28% lesser final grain yield than W0 plants. Our study suggested that wheat crops are highly sensitive to soil waterlogging during reproductive and grain filling phases due to their poor capacity to recover from oxidative injury to photosynthesis. Management strategies such as planting time, fertilization and genotype selection should be considered for the areas experiencing frequent waterlogging problems.
Introduction
Agricultural production is currently facing remarkable challenges in feeding a rapidly growing world population under diminishing natural resources (Godfray et al., 2011). This issue is further exacerbated by the global climate changes causing erratic rainfalls, prolonged drought, and intense heat waves during cropping seasons (Watanabe et al., 2018). For example, intermittent rains and subsequent soil waterlogging can affect approximately 10–15 million ha of global wheat-producing land, representing 15–20% of the cultivated area annually (Zhang et al., 2015). Wheat production in the middle and lower reaches of the Yangtze River, China accounts for approximately 26.3% of the total national planted area (National Bureau of Statistics of China, 2019). Wheat crop in this region is planted in saturated paddy fields, which results in a significant risk of intermittent soil waterlogging combined with rainfall without any seasonal distribution (Wu et al., 2018). Excessive precipitation can cause up to an 18.4% reduction in winter wheat yield in this region (Liu et al., 2022). Under the rapidly changing climatic extremes in recent years, the frequency of rainfall intensity and the possibility of soil waterlogging have significantly increased (Shao et al., 2013). For instance, waterlogging frequency in the spring season ranged between 7.5 and 33% across the meteorological station in this area (Wu et al., 2019).
The dominant monsoon climate in this region, especially from March to May, often carries abundant precipitation with an erratic spatial and temporal distribution (Ding et al., 2017). Consequently, varying degrees of waterlogging are jointly determined by local climate, terrain, soil properties, and underground water table level (Chen et al., 2018). This excessive precipitation usually coincides with sensitive growth phases of wheat crops, e.g., reproductive and grain filling phases. Considering the importance of the grain-filling period for final grain weight and yield formation (Fuentealba-Sandoval et al., 2020), waterlogging during this phase can significantly limit wheat productivity (Jiang et al., 2008). Understanding the physiological processes regulating grain development under soil waterlogging could assist in devising management strategies and protecting them from potential damage.
The negative effects of waterlogging on plants are initiated by soil oxygen deficiencies (Shaw et al., 2013). Under oxygen-deficient environments, plant roots switch from aerobic to anaerobic respiration, limiting energy production (Xuewen et al., 2014; Zhou et al., 2020). Inhibited root functioning, in turn, can impact leaf physiology, i.e., stomatal conductance (Sairam et al., 2008), carbon assimilation (Malik et al., 2001), and overall plant growth. Wheat leaves are the primary photosynthetic organ, with the flag leaf alone contributing to approximately 41–43% of total plant assimilation (Ross et al., 1984). Inhibited oxygen supplied under waterlogged soils can significantly damage chlorophyll and photosynthetic rate (Najeeb et al., 2015a,b). The most evident characteristic of wheat leaf senescence is the gradual decomposition of chlorophyll, which is manifested as the loss of green, yellow, and dry leaves (Lv et al., 2020). Significant damage to chloroplast structure and carbon assimilation process in wheat has been recorded under short-term (5 d) waterlogging (Zheng et al., 2009).
Comparing the performance of wheat genotypes in response to soil waterlogging (21 d) during different developmental phases, i.e., jointing, flowering, and grain filling, Araki et al. (2012) suggested that wheat crops are susceptible to post-flowering waterlogging. They also proposed that post-flowering waterlogging can arrest grain development by accelerating leaf senescence. This accelerated leaf senescence could be associated with unregulated reactive oxygen species (ROS) generation in oxygen-deficient cells of waterlogged plants, damaging lipid membranes and chloroplast structure (Blokhina et al., 2001). Zheng et al. suggested that soil waterlogging induces lipid membrane peroxidation, inhibiting light reaction systems and ATP generation in wheat leaves (Zheng et al., 2009). Some stressed plants can minimize this damage by modifying their antioxidant enzyme activities and detoxifying ROS (Sarwar et al., 2017). For instance, Spanic et al. (2020) recorded a significant change in the activities of antioxidant enzymes such as ascorbate peroxidase (APX), guaiacol peroxidase (GPOD), polyphenol oxidase (PPO), and catalase (CAT) in the flag leaves of waterlogged wheat.
Sustained carbohydrate and nutrient supplies are essential for wheat grains during the critical phases of grain development (Ullah and Chenu, 2019). Soil waterlogging can impact these supplies by impairing leaf physiological functioning. In this study, a winter wheat variety, ‘Ningmai 13’, is exposed to different durations post-flowering waterlogging to understand the relationship between leaf physiology and grain development. The information will be used for developing management techniques for improving wheat performance under waterlogged environments.
Materials and Methods
Growing Conditions
Field experiments were conducted at the experimental station of Anhui Agricultural University (117.01′ E, 30.57′ N) in Lujiang County, Hefei City, Anhui Province, during 2015–16 and 2016–17. The region has a subtropical humid monsoon climate with an average annual precipitation, sunshine duration, and frost-free period of 1188.1 mm, 2209.6 h, and 238 d, respectively. The monthly precipitation during growing seasons is shown in Figure 1.
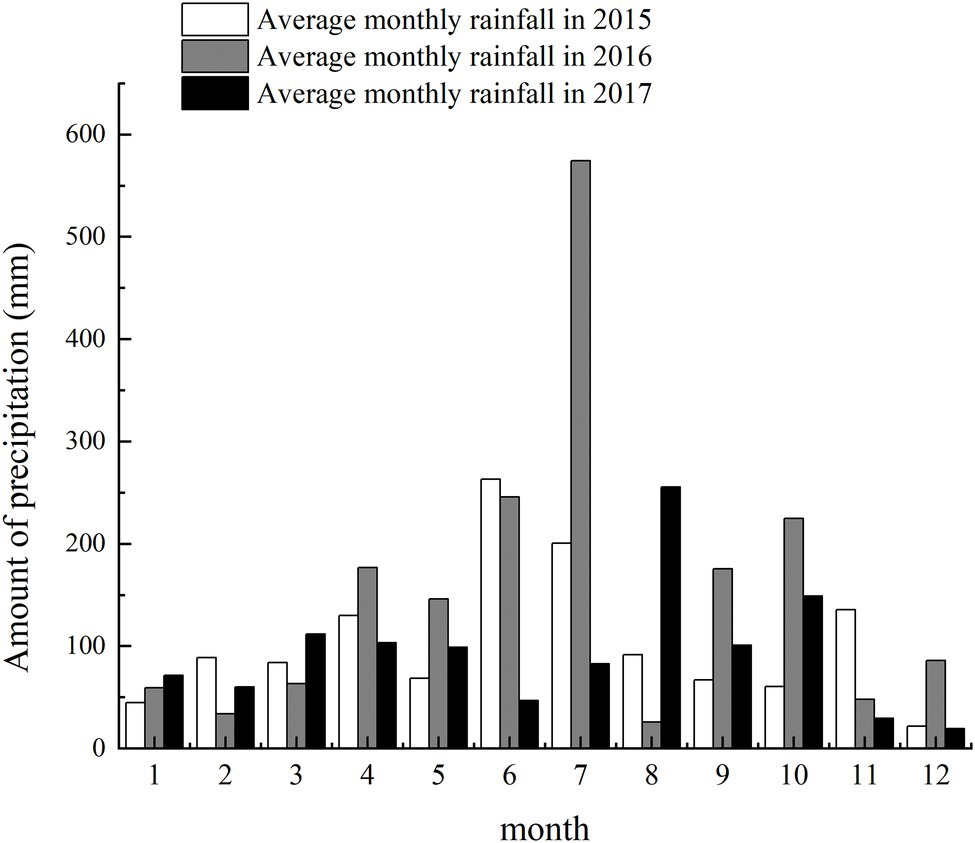
Figure 1. Precipitation of the test field in two planting seasons.
Experimental Design
Each experimental plot (2.4 m × 5.0 m) consisted of 13 rows with 20 cm spacing to achieve a target population of 300 plants per square meter. The treatments were replicated thrice in randomized complete block designs. The plot edges were insulated from each other with a plastic frame made of polyvinyl chloride. The plastic frame was buried 40 cm deep and extended 20 cm on the ground. The treatment plots were artificially waterlogged when 50% of the plants in the field passed flowering [Zadoks decimal growth stage (Zadoks et al., 1974), Z65]. The water layer was kept 2 cm above the ground for 0, 3, 6, and 9 d, which were recorded as W0, W3, W6, and W9, respectively. At the end of each waterlogging period, water was discharged from the plots, and crops were irrigated normally until maturity.
Crop Management
A major winter wheat cultivar in the middle and lower reaches of the Yangtze River China ‘Ningmai 13’ was used as a test cultivar. The seeds were sown on 8 November 2015 and 11 November 2016.
All plots were supplied with 225 kg N ha−1, 75 kg P2O5 ha−1, and 150 kg K2O ha−1. All P and K fertilizers and 70% of N fertilizers were applied before sowing, and the remaining N fertilizer was top-dressed at jointing. Wheat plants were harvested on 24 May 2016 and 27 May 2017.
Measurements
SPAD Value and Pn of Flag Leaves
Leaf physiological data were recorded from all the plots at 7, 14, and 21 DAA. For this purpose, five tillers per replicate were tagged at flowering, and the same flag leaves were used for measuring SPAD and Pn.
The SPAD value was measured non-destructively using SPAD 502 Meter (Soil Plant Analysis Development, Minolta, Japan). For each measurement, five SPAD readings were obtained and averaged.
The Pn values were measured using a portable photosynthesis system (LI-6400, LI-Cor, United States) at a CO2 concentration of about 385 mol, and the reading of the light source was 1,200 mol·m−2·s−1. All measurements were made between 9:00 and 11:00 on days with full sunlight (Mu et al., 2010).
Malondialdehyde Content and Cat and Sod Activities
For the destructive measurement, 15 tillers per replicate were tagged at flowering. Flag leaf samples were collected from the tagged tiller (5 tillers each time) at 7, 14, and 21 d after flowering. The sampled leaves were pooled and stored in liquid nitrogen until analysis. Catalase (CAT) and superoxide dismutase (SOD) activities and MDA content were determined according to Pang et al. (2002) and Spanic et al. (2020).
Grain Weight and Yield
For grain yield measurements, emerging flowering spikes were tagged on the same day. Twenty tagged spikes from each experimental plot were sampled at 7-day intervals from the beginning of anthesis to maturity. The grain filling rate was estimated from the accumulation of dry grain weight. At each sampling date, grains were separated from the glumes and dried at 70°C until a constant weight was reached. The total number of grains was determined, and their dry weight was recorded.
The number of spikes and grains per spike were investigated at the mature stage, and each plot was separately threshed, weighed, and converted into the yield when the water content was 13%.
Statistical Analysis
Data were subjected to ANOVA (SSPS for Windows, version 22.0). The ANOVA used a level of significance of α = 0.05 to identify significant differences among treatments. Multiple comparisons were made using the least significant difference test with α = 0.05 to determine significant differences among treatments. The Origin9.1 (Origin Lab, Northampton, MA, United States) was used to show differences in SPAD values, Pn values, MDA content, SOD and CAT activities and TGW.
Results
SPAD Values of Flag Leaves Under Different Waterlogging Durations
Increasing waterlogging duration from 3 to 9 d significantly reduced leaf SPAD values at 14 and 21 DAA, although there was no significant impact of waterlogging duration on these traits at 7 DAA (Figure 2). Further, SPAD values for each treatment were significantly reduced as the plant growth progressed with each subsequent measurement (i.e., 7, 14, and 21 DAA). For example, compared with their respective controls (W0), W3, W6, and W9 plants had 4.9, 6.6, and 9.2% (averaged across tested years) lower leaf SPAD, respectively, at 7 DAA, but these reductions were 12.8, 22.3, and 38.2%, respectively, at 21 DAA.
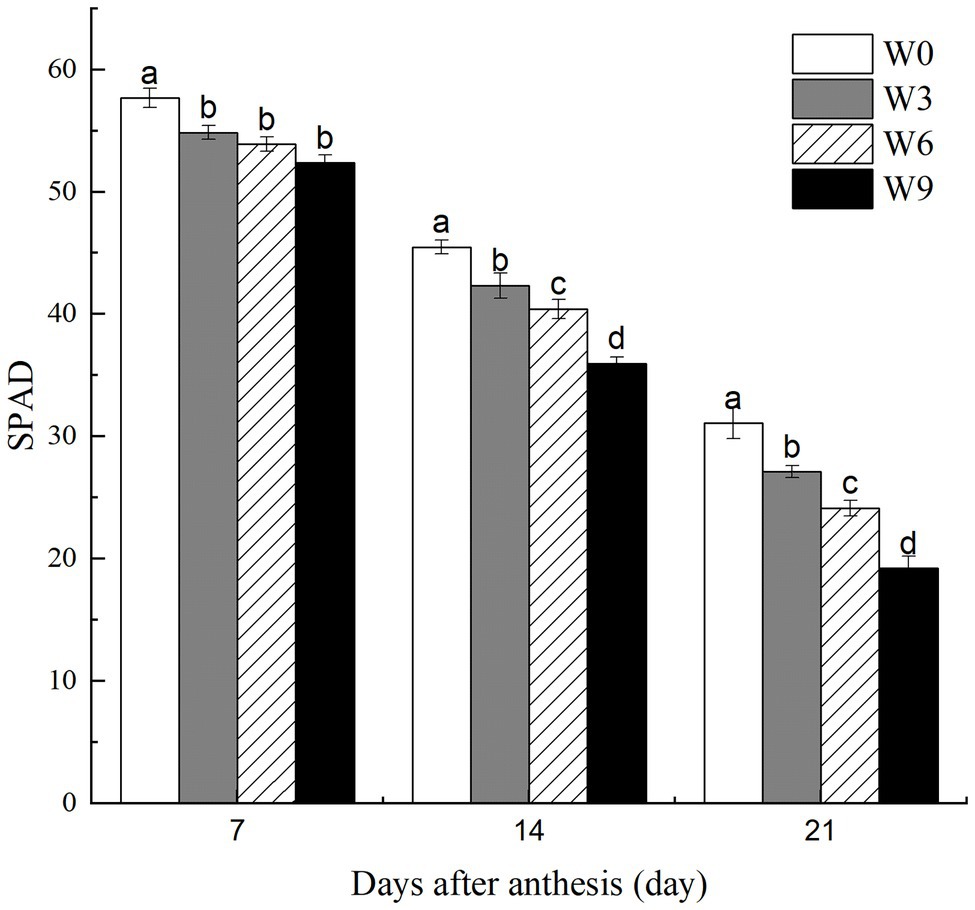
Figure 2. SPAD values of wheat flag leaves under varying waterlogging treatments. Data were collected at 7, 14, and 21 days after anthesis. W0 = control, W3 = 3 days of waterlogging, W6 = 6 days of waterlogging, W9 = 9 days of waterlogging. Vertical bars represent the mean of each treatment (six replicates across two years) ± SE (standard errors). Means carrying the same letter are not significantly different at the 5% level.
Pn of Flag Leaves Under Different Waterlogging Durations
Short-term waterlogging (W3) had no significant effect on the net photosynthetic rate (Pn) of flag leaves at 7 DAA, but it significantly reduced leaf Pn at 14 and 21 DAA (Figure 3). W6 and W9 significantly reduced Pn during all the tested developmental stages. Averaged across two years, W6 and W9 reduced leaf Pn by 14.3 and 18.7%, respectively at 7 DAA, and 17.2 and 23.2%, respectively at 14 DAA, and 19.5 and 27.4%, respectively at 21 DAA. Furthermore, all plants had a maximum Pn at 14 DAA and then reduced at 21 DAA.
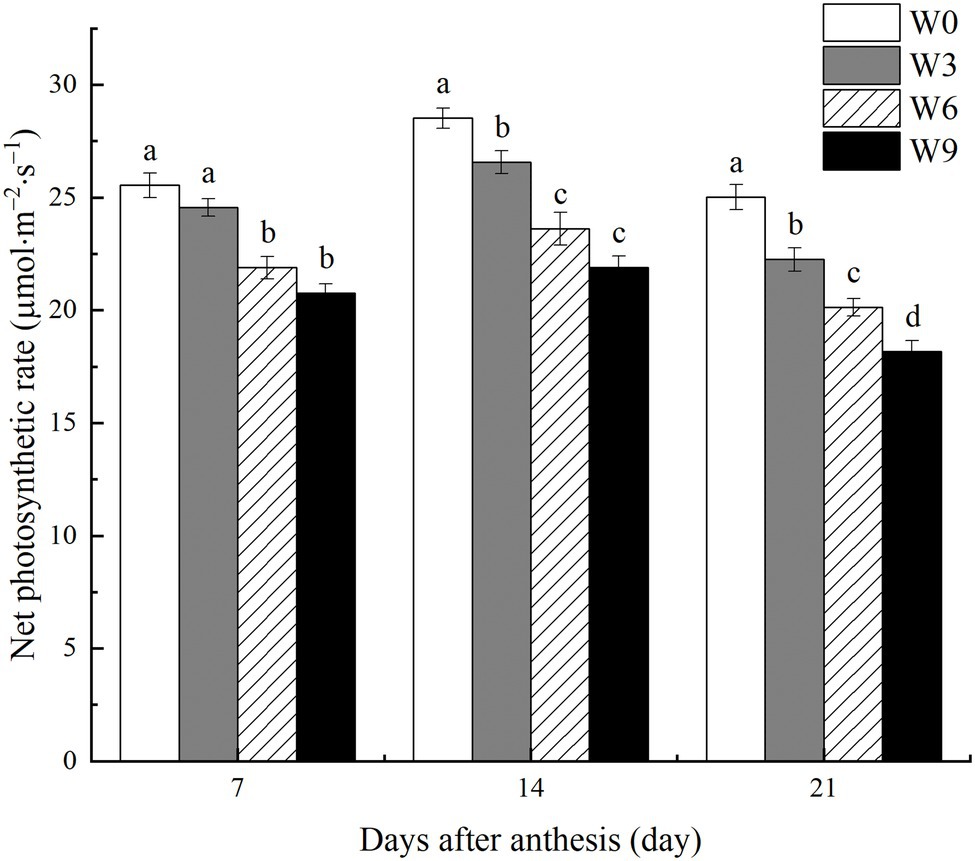
Figure 3. Net photosynthetic rate of flag leaves under varying waterlogging durations. Data were collected at 7, 14, and 21 days after anthesis. W0 = control, W3 = 3 days of waterlogging, W6 = 6 days of waterlogging, W9 = 9 days of waterlogging. Vertical bars represent the mean of each treatment (six replicates across two years) ± SE (standard errors). Means carrying the same letter are not significantly different at the 5% level.
SOD Activity in Flag Leaves Under Different Waterlogging Durations
Increasing waterlogging duration significantly reduced SOD activity in flag leaves of wheat during all the tested developmental stages (Figure 4). Also, SOD activity under each treatment level gradually decreased with the wheat growth. Compared with their respective control (W0) and averaged across the tested years, W3, W6 and W9 had 4.6, 29.8 and 35.7% lower SOD activity, respectively, at 7 DAA, 10.2, 22.5 and 28.5%, respectively, at 14 DAA and 10.4, 18.9 and 30.1%, respectively at 21 DAA (Figure 4).
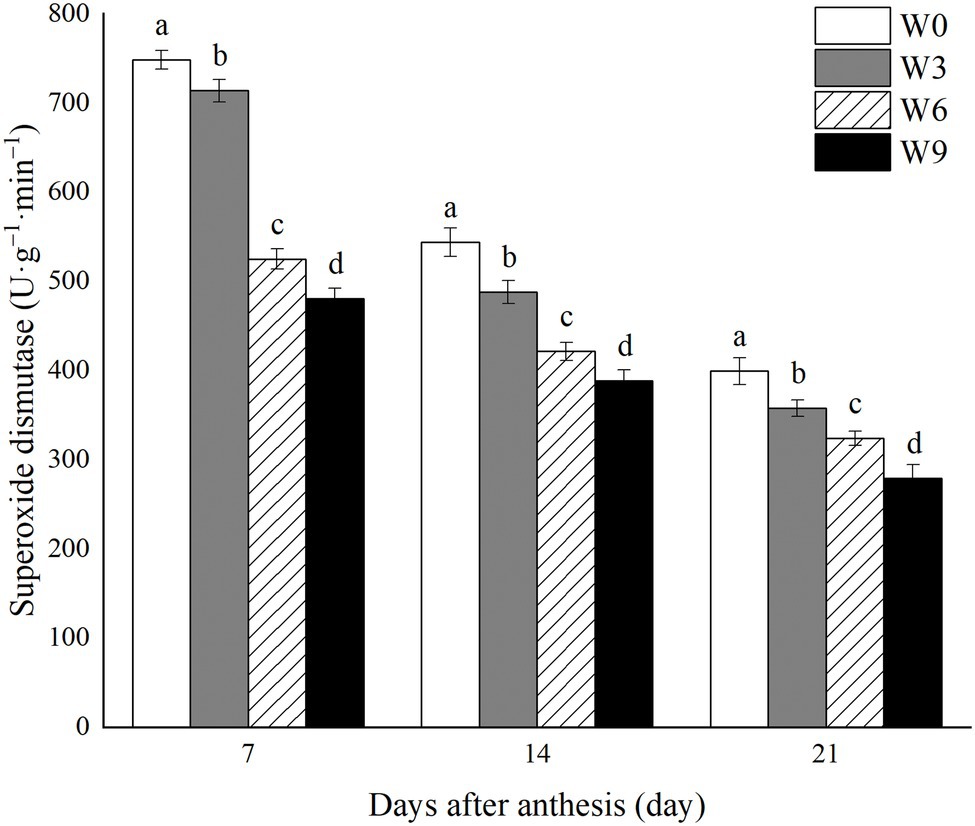
Figure 4. SOD activity in wheat flag leaves under varying waterlogging durations. Data were collected at 7, 14, and 21 days after anthesis. W0 = control, W3 = 3 days of waterlogging, W6 = 6 days of waterlogging, W9 = 9 days of waterlogging. Vertical bars represent the mean of each treatment (six replicates across two years) ± SE (standard errors). Means carrying the same letter are not significantly different at the 5% level.
CAT Activity in Flag Leaves Under Different Waterlogging Durations
During the two tested growing seasons, increasing waterlogging duration significantly reduced CAT activity in flag leaves during all developmental phases (Figure 5). CAT activity in flag leaves decreased as plant growth progressed, with a further intensification of the impact of W3 on CAT, although W6 and W9 impact did not change much. Compared with their respective control (W0) and averaged across the tested years, W3, W6, and W9 reduced CAT activity in flag leaves by 4.8, 16.4, and 26.4%, respectively at 7 DAA, by 7.6, 14.3, and 21.3% respectively, at 14 DAA, and by 12.0, 22.1, and 32.7%, respectively at 21 DAA.
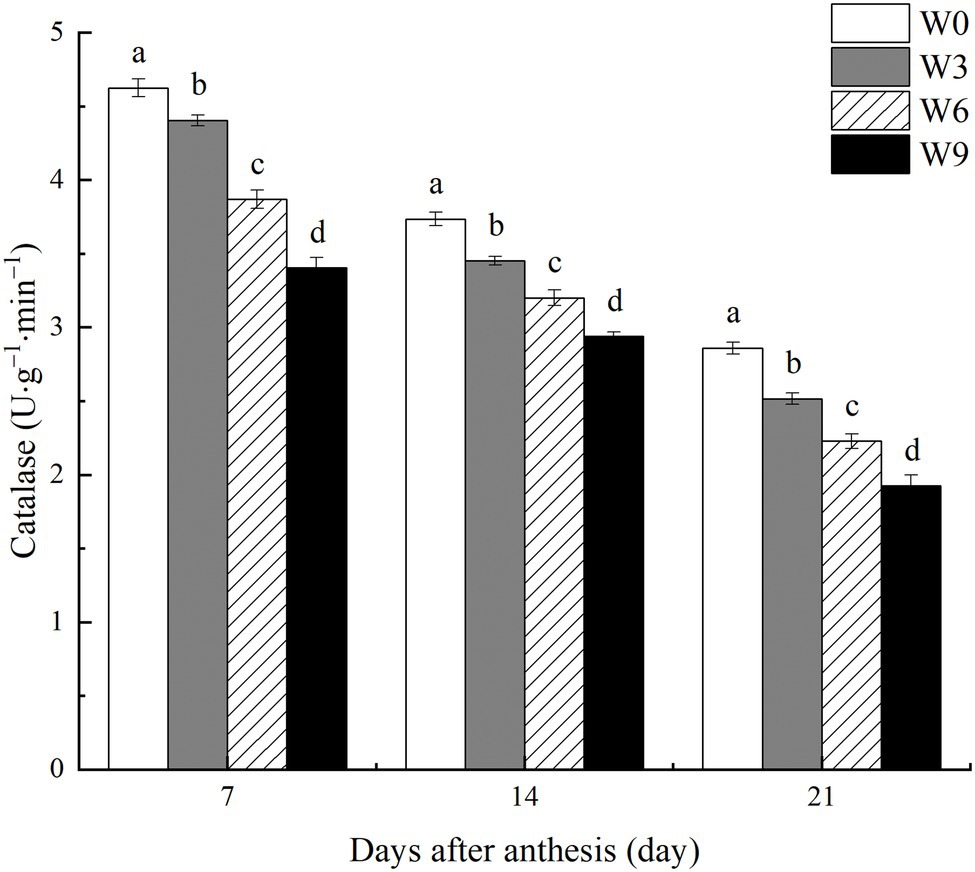
Figure 5. CAT activity in wheat flag leaves under varying waterlogging durations. Data were collected at 7, 14, and 21 days after anthesis. W0 = control, W3 = 3 days of waterlogging, W6 = 6 days of waterlogging, W9 = 9 days of waterlogging. Vertical bars represent the mean of each treatment (six replicates across two years) ± SE (standard errors). Means carrying the same letter are not significantly different at the 5% level.
MDA Content in Flag Leaves Under Different Waterlogging Durations
Damage to flag leaf lipid membrane calculated in terms of MDA contents increased as the plant growth progressed with each subsequent measurement (Figure 6). Increasing waterlogging duration significantly increased MDA contents, with an accelerated increase under W6 and W9 at 21 DAA. For example, compared with W0 and averaged across two years, W6 and W9 increased MDA contents by 19.95 and 28.40%, respectively, at 7 DAA, but this increase was intensified to 25.9, and 30.2%, respectively, at 21 DAA.
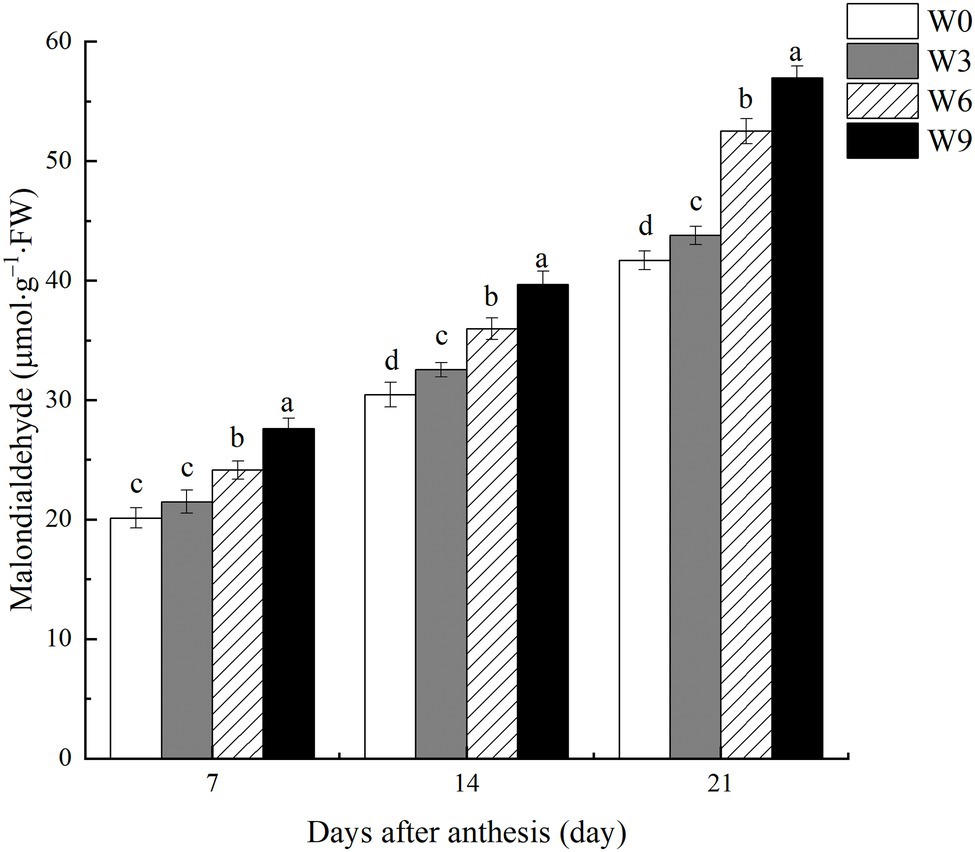
Figure 6. MDA contents in wheat flag leaves under varying waterlogging durations. Data were collected at 7, 14, and 21 days after anthesis. W0 = control, W3 = 3 days of waterlogging, W6 = 6 days of waterlogging, W9 = 9 days of waterlogging. Vertical bars represent the mean of each treatment (six replicates across two years) ± SE (standard errors). Means carrying the same letter are not significantly different at the 5% level.
TGW Under Different Waterlogging Durations
During all the tested developmental stages, W3 had no significant effect on TGW, but W6 and W9 significantly reduced TGW during all developmental phases. This waterlogging-induced reduction in TGW was intensified as plant growth progressed. W6 and W9 had no significant effect during earlier and middle stages of grain development (i.e., 7, 14, and 21 DAA); however, the TGW of W9 was significantly lower than that of W6 at 28 DAA (Figure 7). Compared with W0 and averaged across two years, W3, W6, and W9 reduced TGW by 5.61, 12.83, and 12.72%, respectively, at 21 DAA and 2.25, 10.83, and 17.54%, respectively at 28 DAA.
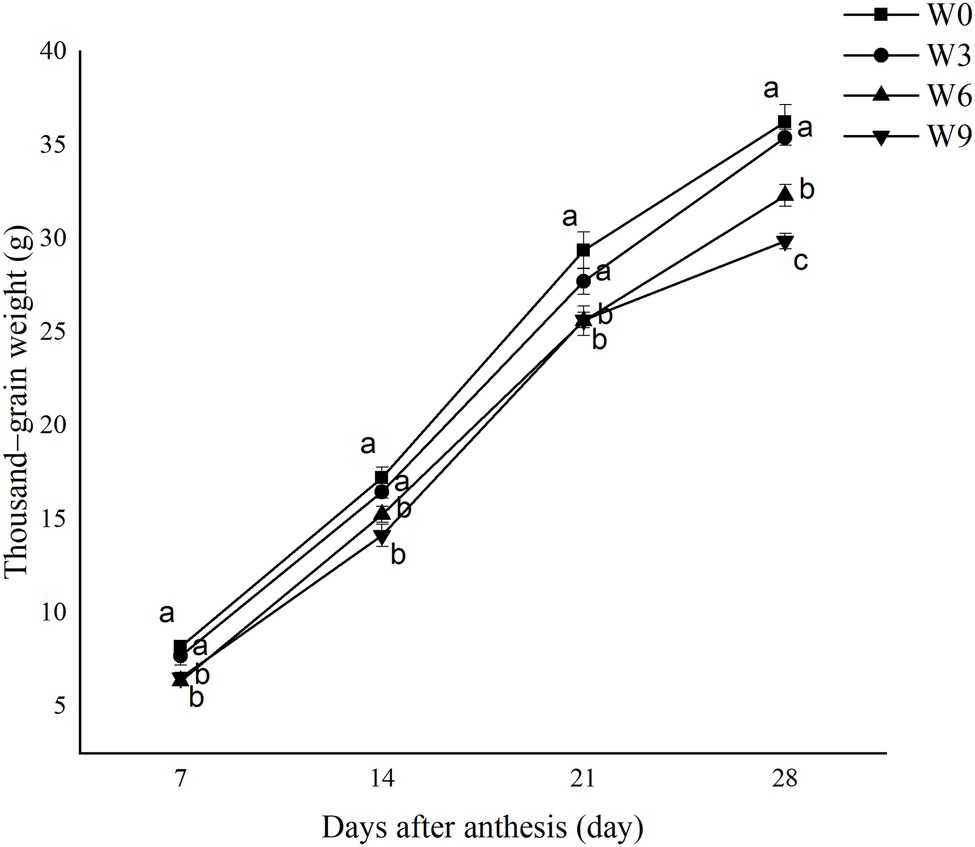
Figure 7. Thousand-grain weight under different waterlogging durations. Data were collected at 7, 14, 21, and 28 days after anthesis. W0 = control, W3 = 3 days of waterlogging, W6 = 6 days of waterlogging, W9 = 9 days of waterlogging. The values are the mean of each treatment (six replicates across two years) ± SE (standard errors). Means carrying the same letter are not significantly different at the 5% level.
Principal Component Analysis
To find the relationships between the analyzed parameters, a principal component analysis (PCA) was performed. PCA analysis allows for the determination of variables that exert the greatest impact on the appearance of individual components. The presented PCA facilitates the interpretation of the impact of Pn value, MDA content, and antioxidant enzyme activities on TGW. Two main components derived from the calculations were selected; they allowed for the explanation of 93.8% of the total variance of analyzed variables. The first main component contains 81.6% of the information about the tested samples represented by variables, while the second main component contains 12.2% of the information (Figure 8).
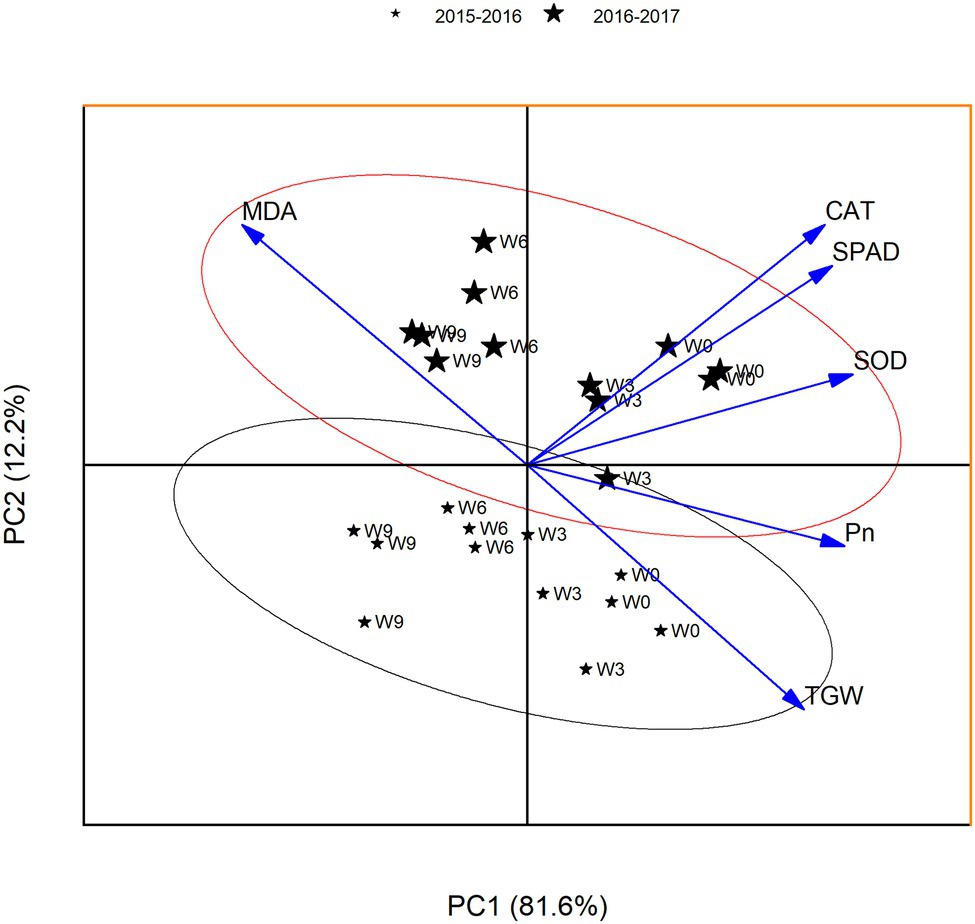
Figure 8. PCA for the yield-related traits at 21 DAA. W0 = control, W3 = 3 days of waterlogging, W6 = 6 days of waterlogging, W9 = 9 days of waterlogging.
Coefficients of PC1 (eigenvectors) leaf Pn, SPAD, and antioxidant enzymes were positive, while MDA was negative. Significantly higher values of eigenvectors for SPAD and MDA indicate superior leaf SPAD and lower MDA contents are a good indicator of plant performance under waterlogging. This separated the plants on the basis of waterlogging treatment in the same direction. W0 plants were grouped together (the top right hand side of the axis), indicating a strong association of TGW with Pn and other leaf physiological traits. With the increasing waterlogging duration, the plants were grouped to the left hand side of the axis, indicating higher MDA level could reduce grain size. The eigenvectors values of PCA indicated that PC2 was an index of the subtle differences in Pn and MDA contents, and thus could explain the variable grouping of plants based on the waterlogging duration.
Yield and Yield Components Under Different Waterlogging Durations
Waterlogging treatments had no significant effect on the total number of spikes in this study, but other grain yield components such as kernel numbers, TGW, and total grain yield all were significantly affected by W6 and W9 treatment (Table 1). W3 had no significant effect on spikes, kernel numbers, TGW, and the total grain yield. W9 plants experienced a significant reduction in TGW and total grain yield compared with W6 plants. Averaged across two years, compared with W0, kernel numbers, TGW, and grain yield of W6 and W9 were reduced by 8.0 and 9.9%, 11.0 and 17.9%, 18.8 and 28.8%, respectively.
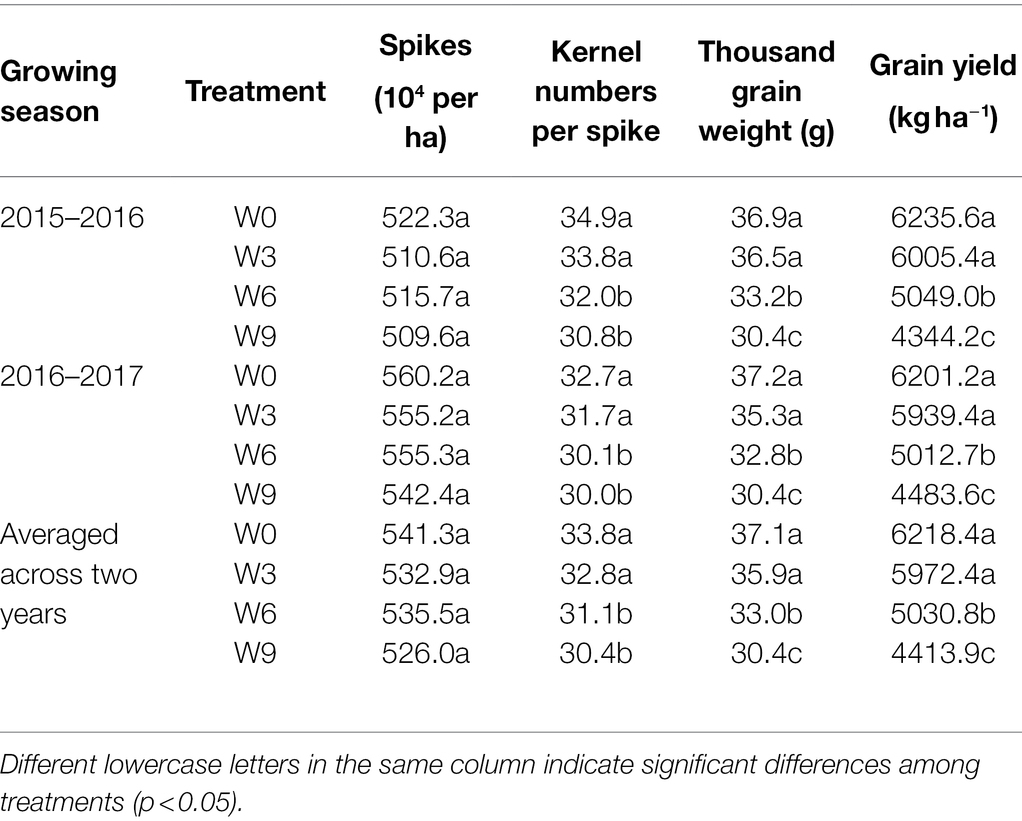
Table 1. Wheat yield and its components under different waterlogging treatments at crop maturity.
Discussion
Inhibited Assimilates Supply Reduces Grain Development
In this study, increasing waterlogging duration significantly reduced leaf greenness (SPAD value), and the damage accelerated as the plant progressed. Flag leaf SPAD value is considered a good indicator of plant health (Mielke et al., 2010). Earlier studies suggested that sustained waterlogging reduced leaf SPAD limiting N uptake (Wu et al., 2014). Inhibited oxygen supplies in the waterlogged soils can also arrest chlorophyll synthesis and accelerate senescence (Zheng et al., 2009). In this study, premature leaf senescence, particularly under long-term waterlogging (W6 and W9), could have affected the length of the functional grain filling period and, thus, finally, grain yield.
Leaf chlorophyll is a site for photosynthesis and assimilates production. In plants, the assimilation process is strongly associated with leaf age, leaf chlorophyll content, and the activity of enzymes (Thomas and Ougham, 2014; Liu et al., 2015; Bhusal et al., 2020). Developing grains require continuous assimilate supply which is either met through current (photosynthesis) or stem stored assimilates in wheat (Ullah and Chenu, 2019). This assimilates supply during mid to late grain filling phases of grain development in wheat is crucial for sustaining grain size (Hou et al., 2020). In the current study, waterlogging inhibited photosynthesis, curtailing a balance between assimilate supplies and deposition in grain. This damage was intensified with plant growth and increasing waterlogging duration, i.e., W9 plants had 27.4% lower Pn than W0 at 21 DAA. This inhibited assimilates supplies, directly affected the grain-filling process, and reduced grain size (TGW).
Oxidative Stress and Lipid Membrane Damage
In this study, increasing waterlogging duration significantly damaged the lipid membrane of flag leaf tissues in wheat. Excessive ROS and oxidative damage are commonly observed phenomena in stressed plants. These ROS can harm cellular membrane permeability and thus inhibit plant growth, development, and final yield (Jing et al., 2020). Under waterlogged or hypoxic conditions, ROS generation is associated with changes in the redox status of plant species (Ricard et al., 1994). No immediate effect of short-term waterlogging (W3) on MDA contents indicates that wheat plants could temporarily sustain energy production through glycolysis and ethanol fermentation. However, the damage was further exacerbated as plant growth progressed (Figure 6), suggesting that wheat plants were unable to recover from post-waterlogging oxidative stress. Plants may overcome this oxidative damage by activating their antioxidant enzyme system (El Sabagh et al., 2019; Yu et al., 2020). In this study, a significant reduction in antioxidant enzymes, i.e., SOD and CAT, in response to soil waterlogging suggested limited capacity of the tested wheat genotype to detoxify unregulated ROS.
Unregulated cellular ROS can increase the peroxide level (Yusuf et al., 2008), damaging organelles, such as chloroplasts, mitochondria, plasma membrane, exosomes, and nucleoli. ROS can induce the production of MDA in biofilm-damaged cells, and the content of MDA can directly reflect the aging of the organism when damaged by water streaming (Sandalio et al., 2013). In this study, accelerated chlorophyll loss in wheat flag leaves could result from oxidative damage to the chloroplast lipid membrane (Dat et al., 2003).
Yield Loss Caused by Restricted Grain Development
In this study, waterlogging significantly reduced grain yield components, including TGW and grain number per spike. This yield loss was strongly associated with waterlogging duration, i.e., grain yield loss increased from 3.7 to 28.8% by increasing waterlogging duration from 3 to 9 d. Significant grain yield loss, i.e., up to 40%, has been recorded in wheat crops in response to sustained waterlogging (Ding et al., 2020). Soil waterlogging can significantly accelerate ethylene biosynthesis in plant tissues (Najeeb et al., 2015a), a hormone responsible for grain loss in wheat (Hays et al., 2007). Final grain size in wheat depends on multiple factors such as grain filling duration, assimilate synthesis and transport, and starch deposition in grains (Jenner et al., 1991). In this study, waterlogging accelerated leaf senescence and inhibited photosynthesis, reducing assimilates supplies to the developing wheat grains. Despite a significant reduction in flag leaf Pn in response to W3 during later developmental phases, final TGW was not significantly affected by the short-term waterlogging. This indicated that continuous carbohydrates supply from current sources (photosynthesis) during the early phases of grain development is critical for sustaining grain growth in wheat. However, developing grains may become more dependent on assimilates supplies from the stored carbohydrate during later phases of development (Pheloung and Siddique, 1991). Girousse et al. (2021) suggested that damage to developing grain during the cellular division phase (0–7 DAA) is irreversible.
Conclusion
In this study, grain yield loss increased from 3.7 to 28.8% by increasing waterlogging duration from 3 to 9 d. This grain yield loss was due to oxidative stress and lipid membrane damage in flag leaves, which accelerated leaf senescence and inhibited photosynthesis, reducing assimilates supplies to the developing wheat grains. This study found that short-term waterlogging (W3) reduced current sources (photosynthesis) during later phases of grain development only (14 and 21 d after anthesis), resulting in no significant reduction in TGW. However, the impact of W6 and W9 significant on Pn during the first week of waterlogging and thus these treatments reduced TGW. Our study suggested that sustain carbohydrates supplies are critical for developing wheat grains during early phases development. Crop management techniques should be adjusted to sustain assimilates supplies during this critical period, particularly under stressed environments.
Data Availability Statement
The original contributions presented in the study are included in the article/supplementary material, further inquiries can be directed to the corresponding author.
Author Contributions
SM and ZH contributed to conception and design of the study. JH organized the database. SM, JH, and YW performed the statistical analysis. SM wrote the first draft of the manuscript. All authors contributed to the article and approved the submitted version.
Funding
This research was supported by the National Natural Science Foundation of China (31801287), the grants from the National Key Research and Development Program of China (2016YFD0300405 and 2017YFD0301305), and the Project of China Scholarship Council (201908775002).
Conflict of Interest
The authors declare that the research was conducted in the absence of any commercial or financial relationships that could be construed as a potential conflict of interest.
Publisher’s Note
All claims expressed in this article are solely those of the authors and do not necessarily represent those of their affiliated organizations, or those of the publisher, the editors and the reviewers. Any product that may be evaluated in this article, or claim that may be made by its manufacturer, is not guaranteed or endorsed by the publisher.
References
Araki, H., Hamada, A., Hossain, M. A., and Takahashi, T. (2012). Waterlogging at jointing and/or after anthesis in wheat induces early leaf senescence and impairs grain filling. F. Crop. Res. 137, 27–36. doi: 10.1016/j.fcr.2012.09.006
Bhusal, N., Kim, H. S., Han, S. G., and Yoon, T. M. (2020). Photosynthetic traits and plant–water relations of two apple cultivars grown as bi-leader trees under long-term waterlogging conditions. Environ. Exp. Bot. 176:104111. doi: 10.1016/j.envexpbot.2020.104111
Blokhina, O. B., Chirkova, T. V., and Fagerstedt, K. V. (2001). Anoxic stress leads to hydrogen peroxide formation in plant cells. J. Exp. Bot. 52, 1179–1190. doi: 10.1093/jxb/52.359.1179
Chen, Y. Y., Huang, J. F., Song, X. D., Wu, H. Y., Sheng, S. X., Liu, Z. X., et al. (2018). Waterlogging risk assessment for winter wheat using multi-source data in the middle and lower reaches of yangtze river. Int. J. Agric. Biol. Eng. 11, 198–205. doi: 10.25165/j.ijabe.20181105.3246
Dat, J. F., Pellinen, R., Beeckman, T., Van De Cotte, B., Langebartels, C., Kangasjärvi, J., et al. (2003). Changes in hydrogen peroxide homeostasis trigger an active cell death process in tobacco. Plant J. 33, 621–632. doi: 10.1046/j.1365-313X.2003.01655.x
Ding, J., Liang, P., Wu, P., Zhu, M., Li, C., Zhu, X., et al. (2020). Effects of waterlogging on grain yield and associated traits of historic wheat cultivars in the middle and lower reaches of the Yangtze River. China. F. Crop. Res. 246:107695. doi: 10.1016/j.fcr.2019.107695
Ding, J., Su, S., Zhang, Y., Li, C., Zhu, X., and Guo, W. (2017). Seedling growth and recovery in response to waterlogging of wheat cultivars grown in the Yangtze River basin of China from three different decades. J. Agric. Sci. 9:128. doi: 10.5539/jas.v9n4p128
El Sabagh, A., Hossain, A., Barutçular, C., Islam, M. S., Awan, S. I., Galal, A., et al. (2019). Wheat (Triticum aestivum l.) production under drought and heat stress – adverse effects, mechanisms and mitigation: A review. Appl. Ecol. Environ. Res. 17, 8307–8332. doi: 10.15666/aeer/1704_83078332
Fuentealba-Sandoval, C., Pedreros, A., Fischer, S., and López, M. D. (2020). Influence of different water deficit levels during grain filling on yield and total polyphenols content in spring wheat cultivars. Chil. J. Agric. Res. 80, 433–443. doi: 10.4067/S0718-58392020000300433
Girousse, C., Inchboard, L., Deswarte, J. C., and Chenu, K. (2021). How does post-flowering heat impact grain growth and its determining processes in wheat? J. Exp. Bot. 72, 6596–6610. doi: 10.1093/jxb/erab282
Godfray, H. C. J., Pretty, J., Thomas, S. M., Warham, E. J., and Beddington, J. R. (2011). Linking policy on climate and food. Science 331, 1013–1014. doi: 10.1126/science.1202899
Hays, D. B., Do, J. H., Mason, R. E., Morgan, G., and Finlayson, S. A. (2007). Heat stress induced ethylene production in developing wheat grains induces kernel abortion and increased maturation in a susceptible cultivar. Plant Sci. 172, 1113–1123. doi: 10.1016/j.plantsci.2007.03.004
Hou, H., Zhang, X., Wang, J., Yin, J., Fang, Y., Yu, X., et al. (2020). Plastic-soil mulching increases the photosynthetic rate by relieving nutrient limitations in the soil and flag leaves of spring wheat in a semiarid area. J. Soils Sediments 20, 3158–3170. doi: 10.1007/s11368-020-02659-3
Jenner, C., Ugalde, T., and Aspinall, D. (1991). The physiology of starch and protein deposition in the endosperm of wheat. Funct. Plant Biol. 18:211. doi: 10.1071/pp9910211
Jiang, D., Fan, X., Dai, T., and Cao, W. (2008). Nitrogen fertiliser rate and post-anthesis waterlogging effects on carbohydrate and nitrogen dynamics in wheat. Plant Soil 304, 301–314. doi: 10.1007/s11104-008-9556-x
Jing, M., Han, G., Wan, J., Zhang, S., Yang, J., Zong, W. S., et al. (2020). Catalase and superoxide dismutase response and the underlying molecular mechanism for naphthalene. Sci. Total Environ. 736:139567. doi: 10.1016/j.scitotenv.2020.139567
Liu, W., Sun, W., Huang, J., Wen, H., and Huang, R. (2022). Excessive rainfall is the key meteorological limiting factor for winter wheat yield in the middle and lower reaches of the Yangtze River. Agronomy. 12:50. doi: 10.3390/agronomy12010050
Liu, X., Zhang, X., Chen, S., Sun, H., and Shao, L. (2015). Subsoil compaction and irrigation regimes affect the root-shoot relation and grain yield of winter wheat. Agric. Water Manag. 154, 59–67. doi: 10.1016/j.agwat.2015.03.004
Lv, X., Zhang, Y., Zhang, Y., Fan, S., and Kong, L. (2020). Source-sink modifications affect leaf senescence and grain mass in wheat as revealed by proteomic analysis. BMC Plant Biol. 20, 257–217. doi: 10.1186/s12870-020-02447-8
Malik, A. I., Colmer, T. D., Lambers, H., and Schortemeyer, M. (2001). Wheat in response to different depths of waterlogging. Aust. J. Plant Physiol. 28, 1121–1131. doi: 10.1071/PP01089
Mielke, M. S., Schaffer, B., and Li, C. (2010). Use of a SPAD meter to estimate chlorophyll content in Eugenia uniflora L. leaves as affected by contrasting light environments and soil flooding. Photosynthetica 48, 332–338. doi: 10.1007/s11099-010-0043-2
Mu, H., Jiang, D., Wollenweber, B., Dai, T., Jing, Q., and Cao, W. (2010). Long-term low radiation decreases leaf photosynthesis, photochemical efficiency and grain yield in winter wheat. J. Agron. Crop Sci. 196, 38–47. doi: 10.1111/j.1439-037X.2009.00394.x
Najeeb, U., Atwell, B. J., Bange, M. P., and Tan, D. (2015a). Aminoethoxyvinylglycine (AVG) ameliorates waterlogging-induced damage in cotton by inhibiting ethylene synthesis and sustaining photosynthetic capacity. Plant Growth Regul. 76, 83–98. doi: 10.1007/s10725-015-0037-y
Najeeb, U., Bange, M. P., Tan, D. K. Y., and Atwell, B. J. (2015b). Consequences of waterlogging in cotton and opportunities for mitigation of yield losses. AoB Plants 7, 1–17. doi: 10.1093/aobpla/plv080
National Bureau of Statistics of China (2019). Agriculture, National Data. Beijing, China: National Bureau of Statistics of China. Available at: http://www.stats.gov.cn/tjsj/ndsj/2019/indexeh.htm (Accessed March 10, 2022).
Pang, X., Wang, D., Peng, A., Zhang, F., Xing, X., and Li, C. (2002). Effect of La3+ on activities of antioxidant enzymes in wheat seedlings under mercury stress. J. Rare Earths 20, 218–222. doi: 10.3321/j.issn:1000-4343.2002.02.013
Pheloung, P., and Siddique, K. (1991). Contribution of stem dry matter to grain yield in wheat cultivars. Funct. Plant Biol. 18:53. doi: 10.1071/pp9910053
Ricard, B., Couée, I., Raymond, P., Saglio, P. H., and Pradet, A. (1994). Plant metabolism under hypoxia and anoxia. Plant Physiol. Biochem. 32, 1–10.
Ross, R. G., McRae, K. B., and Newbery, R. J. (1984). Growth of apple trees affected by replant disease after lifting, site fumigation, and replanting. Can. J. Plant Pathol. 6, 257–258. doi: 10.1080/07060668409501564
Sairam, R. K., Kumutha, D., Ezhilmathi, K., Deshmukh, P. S., and Srivastava, G. C. (2008). Physiology and biochemistry of waterlogging tolerance in plants. Biol. Plant. 52, 401–412. doi: 10.1007/s10535-008-0084-6
Sandalio, L. M., Rodríguez-Serrano, M., Romero-Puertas, M. C., and del Río Luis, A. (2013). Role of peroxisomes as a source of reactive oxygen species (ROS) signaling molecules. Subcell. Biochem. 69, 231–255. doi: 10.1007/978-94-007-6889-5_13
Sarwar, M., Saleem, M. F., Najeeb, U., Shakeel, A., Ali, S., and Bilal, M. F. (2017). Hydrogen peroxide reduces heat-induced yield losses in cotton (Gossypium hirsutum L.) by protecting cellular membrane damage. J. Agron. Crop Sci. 203, 429–441. doi: 10.1111/jac.12203
Shao, G. C., Lan, J. J., Yu, S. E., Liu, N., Guo, R. Q., and She, D. L. (2013). Photosynthesis and growth of winter wheat in response to waterlogging at different growth stages. Photosynthetica 51, 429–437. doi: 10.1007/s11099-013-0039-9
Shaw, R. E., Meyer, W. S., McNeill, A., and Tyerman, S. D. (2013). Waterlogging in Australian agricultural landscapes: A review of plant responses and crop models. Crop Pasture Sci. 64, 549–562. doi: 10.1071/CP13080
Spanic, V., Zdunic, Z., and Viljevac Vuletic, M. (2020). Comparative changes in the physiological traits in the flag leaf of two senescing varieties of wheat (Triticum aestivum L.). Acta Physiol. Plant. 42, 1–10. doi: 10.1007/s11738-020-03096-y
Thomas, H., and Ougham, H. (2014). The stay-green trait. J. Exp. Bot. 65, 3889–3900. doi: 10.1093/jxb/eru037
Ullah, N., and Chenu, K. (2019). “Impact of post-flowering heat stress on stay green and grain development in wheat,” in Proceedings of the Australian Agronomy Conference, Wagga Wagga, 1–4.
Watanabe, T., Cullmann, J., Pathak, C. S., Turunen, M., Emami, K., Ghinassi, G., et al. (2018). Management of Climatic Extremes with focus on floods and droughts in agriculture. Irrig. Drain. 67, 29–42. doi: 10.1002/ird.2204
Wu, S., Cao, S., Wang, Z., Qu, X., Li, S., and Zhao, W. (2019). Spatiotemporal variations in agricultural flooding in middle and lower reaches of Yangtze River from 1970 to 2018. Sustainability 11, 1–20. doi: 10.3390/su11236613
Wu, J. D., Li, J. C., Wei, F. Z., Wang, C. Y., Zhang, Y., and Sun, G. (2014). Effects of nitrogen spraying on the post-anthesis stage of winter wheat under waterlogging stress. Acta Physiol. Plant. 36, 207–216. doi: 10.1007/s11738-013-1401-z
Wu, X., Tang, Y., Li, C., McHugh, A. D., Li, Z., and Wu, C. (2018). Individual and combined effects of soil waterlogging and compaction on physiological characteristics of wheat in southwestern China. F. Crop. Res. 215, 163–172. doi: 10.1016/j.fcr.2017.10.016
Xuewen, X., Huihui, W., Xiaohua, Q., Qiang, X., and Xuehao, C. (2014). Waterlogging-induced increase in fermentation and related gene expression in the root of cucumber (Cucumis sativus L.). Sci. Hortic. (Amsterdam). 179, 388–395. doi: 10.1016/j.scienta.2014.10.001
Yu, J., Cang, J., Lu, Q., Fan, B., Xu, Q., Li, W., et al. (2020). ABA enhanced cold tolerance of wheat ‘dn1’ via increasing ROS scavenging system. Plant Signal. Behav. 15, 1–11. doi: 10.1080/15592324.2020.1780403
Yusuf, M., Hasan, S. A., Ali, B., Hayat, S., Fariduddin, Q., and Ahmad, A. (2008). Effect of salicylic acid on salinity-induced changes in Brassica juncea. J. Integr. Plant Biol. 50, 1096–1102. doi: 10.1111/j.1744-7909.2008.00697.x
Zadoks, J. C., Chang, T. T., and Konzak, C. F. (1974). A decimal code for the growth stages of cereals. Weed Res. 14, 415–421. doi: 10.1111/j.1365-3180.1974.tb01084.x
Zhang, W., Pan, S., Cao, L., Cai, X., Zhang, K., Xu, Y., et al. (2015). Changes in extreme climate events in eastern China during 1960-2013: A case study of the Huaihe River basin. Quat. Int. 380-381, 22–34. doi: 10.1016/j.quaint.2014.12.038
Zheng, C., Dong, J., Liu, F., Dai, T., Jing, Q., and Cao, W. (2009). Effects of salt and waterlogging stresses and their combination on leaf photosynthesis, chloroplast ATP synthesis, and antioxidant capacity in wheat. Plant Sci. An Int. J. Exp. Plant Biol. 176, 575–582. doi: 10.1016/j.plantsci.2009.01.015
Keywords: winter wheat, waterlogging, net photosynthetic rate, grain development, yield
Citation: Ma S, Hou J, Wang Y, Wang M, Zhang W, Fan Y and Huang Z (2022) Post-flowering Soil Waterlogging Curtails Grain Yield Formation by Restricting Assimilates Supplies to Developing Grains. Front. Plant Sci. 13:944308. doi: 10.3389/fpls.2022.944308
Edited by:
Waqar Ahmad, The University of Queensland, AustraliaReviewed by:
Sahib Alam, University of Agriculture, Peshawar, PakistanMuhammad Sabir, University of Agriculture, Faisalabad, Pakistan
Copyright © 2022 Ma, Hou, Wang, Wang, Zhang, Fan and Huang. This is an open-access article distributed under the terms of the Creative Commons Attribution License (CC BY). The use, distribution or reproduction in other forums is permitted, provided the original author(s) and the copyright owner(s) are credited and that the original publication in this journal is cited, in accordance with accepted academic practice. No use, distribution or reproduction is permitted which does not comply with these terms.
*Correspondence: Zhenglai Huang, eGRueXlqc0AxNjMuY29t