
94% of researchers rate our articles as excellent or good
Learn more about the work of our research integrity team to safeguard the quality of each article we publish.
Find out more
ORIGINAL RESEARCH article
Front. Plant Sci. , 09 September 2022
Sec. Plant Bioinformatics
Volume 13 - 2022 | https://doi.org/10.3389/fpls.2022.921310
 Ruijie Huang1,2Huimin Du1,2Yuting Wen1,2Chunyan Zhang1,2Mengran Zhang1,2Hao Lu1,2Chenchen Wu1,2*
 Baoyu Zhao1,2*
Astragalus variabilis is a locoweed of northwest China that can seriously impede livestock development. However, it also plays various ecological roles, such as wind protection and sand fixation. Here, we used an optimized MaxEnt model to predict the distribution of suitable habitat of A. variabilis under current (1970–2000) conditions and future (2021–2080) climate change scenarios based on recent occurrence records. The most important environmental variables (suitability ranges in parentheses) affecting the distribution of A. variabilis were average maximum temperature of February (–2.12–5.34°C), followed by total precipitation of June (2.06–37.33 mm), and topsoil organic carbon (0.36–0.69%). The habitat suitability of A. variabilis was significantly correlated with the frequency of livestock poisoning (p < 0.05). Under current climate conditions, the suitable environment of A. variabilis was distributed in central and western Inner Mongolia, Ningxia, central and northwestern Gansu, central and northwestern Qinghai, and the four basins around the Tianshan Mountains in Xinjiang. Under future climate conditions, the suitable habitat of A. variabilis shifted to higher latitudes and altitudes. No previous studies have used niche models to predict the suitable environment of this species nor analyzed the relationship between the habitat suitability of poisonous plants and the frequency of animal poisoning. Our findings provide new insights that will aid the prevention of livestock animal poisoning and the control of poisonous plants, promote the development of the livestock husbandry industry, and provide basic information that will facilitate the maintenance of the ecological balance of grassland ecosystems.
According to the 5th Global Climate Change Assessment Report of the United Nations Intergovernmental Panel on Climate Change (IPCC), the world’s average surface temperature has increased by 0.85°C over the past 130 years and is continuing to increase (Stocker, 2013). The effects of warming on the distribution of moisture and the soil microclimate are thought to be particularly important in shaping the range shifts of plants, as their distributions are largely determined by abiotic factors such as precipitation, temperature, soil, and elevation (O’Connor et al., 2020). The effects of climate warming on the distribution of plants have thus been a major focus of research in recent years (Bellard et al., 2012). Studies of how climate change might affect the distribution of plants can aid agricultural production and biodiversity conservation and promote the sustainability of ecosystems.
Locoweeds (e.g., Astragalus, Oxytropis, and Swainsona) are poisonous plants that have caused major economic losses to livestock industries in China, Australia, North America, and South America (Lu et al., 2014; Cook et al., 2016; Welch et al., 2018). Astragalus variabilis Bunge ex Maxim (Figure 1), a cold-resistant and drought-tolerant locoweed plant, is one of the main threats to the development of the livestock industry in northwest China (Dong et al., 2003). The main toxic component of A. variabilis is swainsonine, which can cause neurologic symptoms, reproductive dysfunction, and eventually death in poisoned animals (Wang et al., 2015). Despite its deleterious effects (Zhou et al., 2013), A. variabilis is nutritious and can be used as fodder after being detoxified, which could alleviate forage shortages in arid areas (Zhao et al., 2006; Tao et al., 2020). A. variabilis can also grow in arid and barren desert steppe, where it can prevent sand fixation, slow soil erosion, and improve soil chemical properties (Zhao et al., 2006; Wang Q. H. et al., 2021). Thus, the development of strategies for managing A. variabilis that balance the needs of ecological systems and farmers is needed, and predictions of the potential distribution of A. variabilis can provide important information that aids the development of such management strategies.
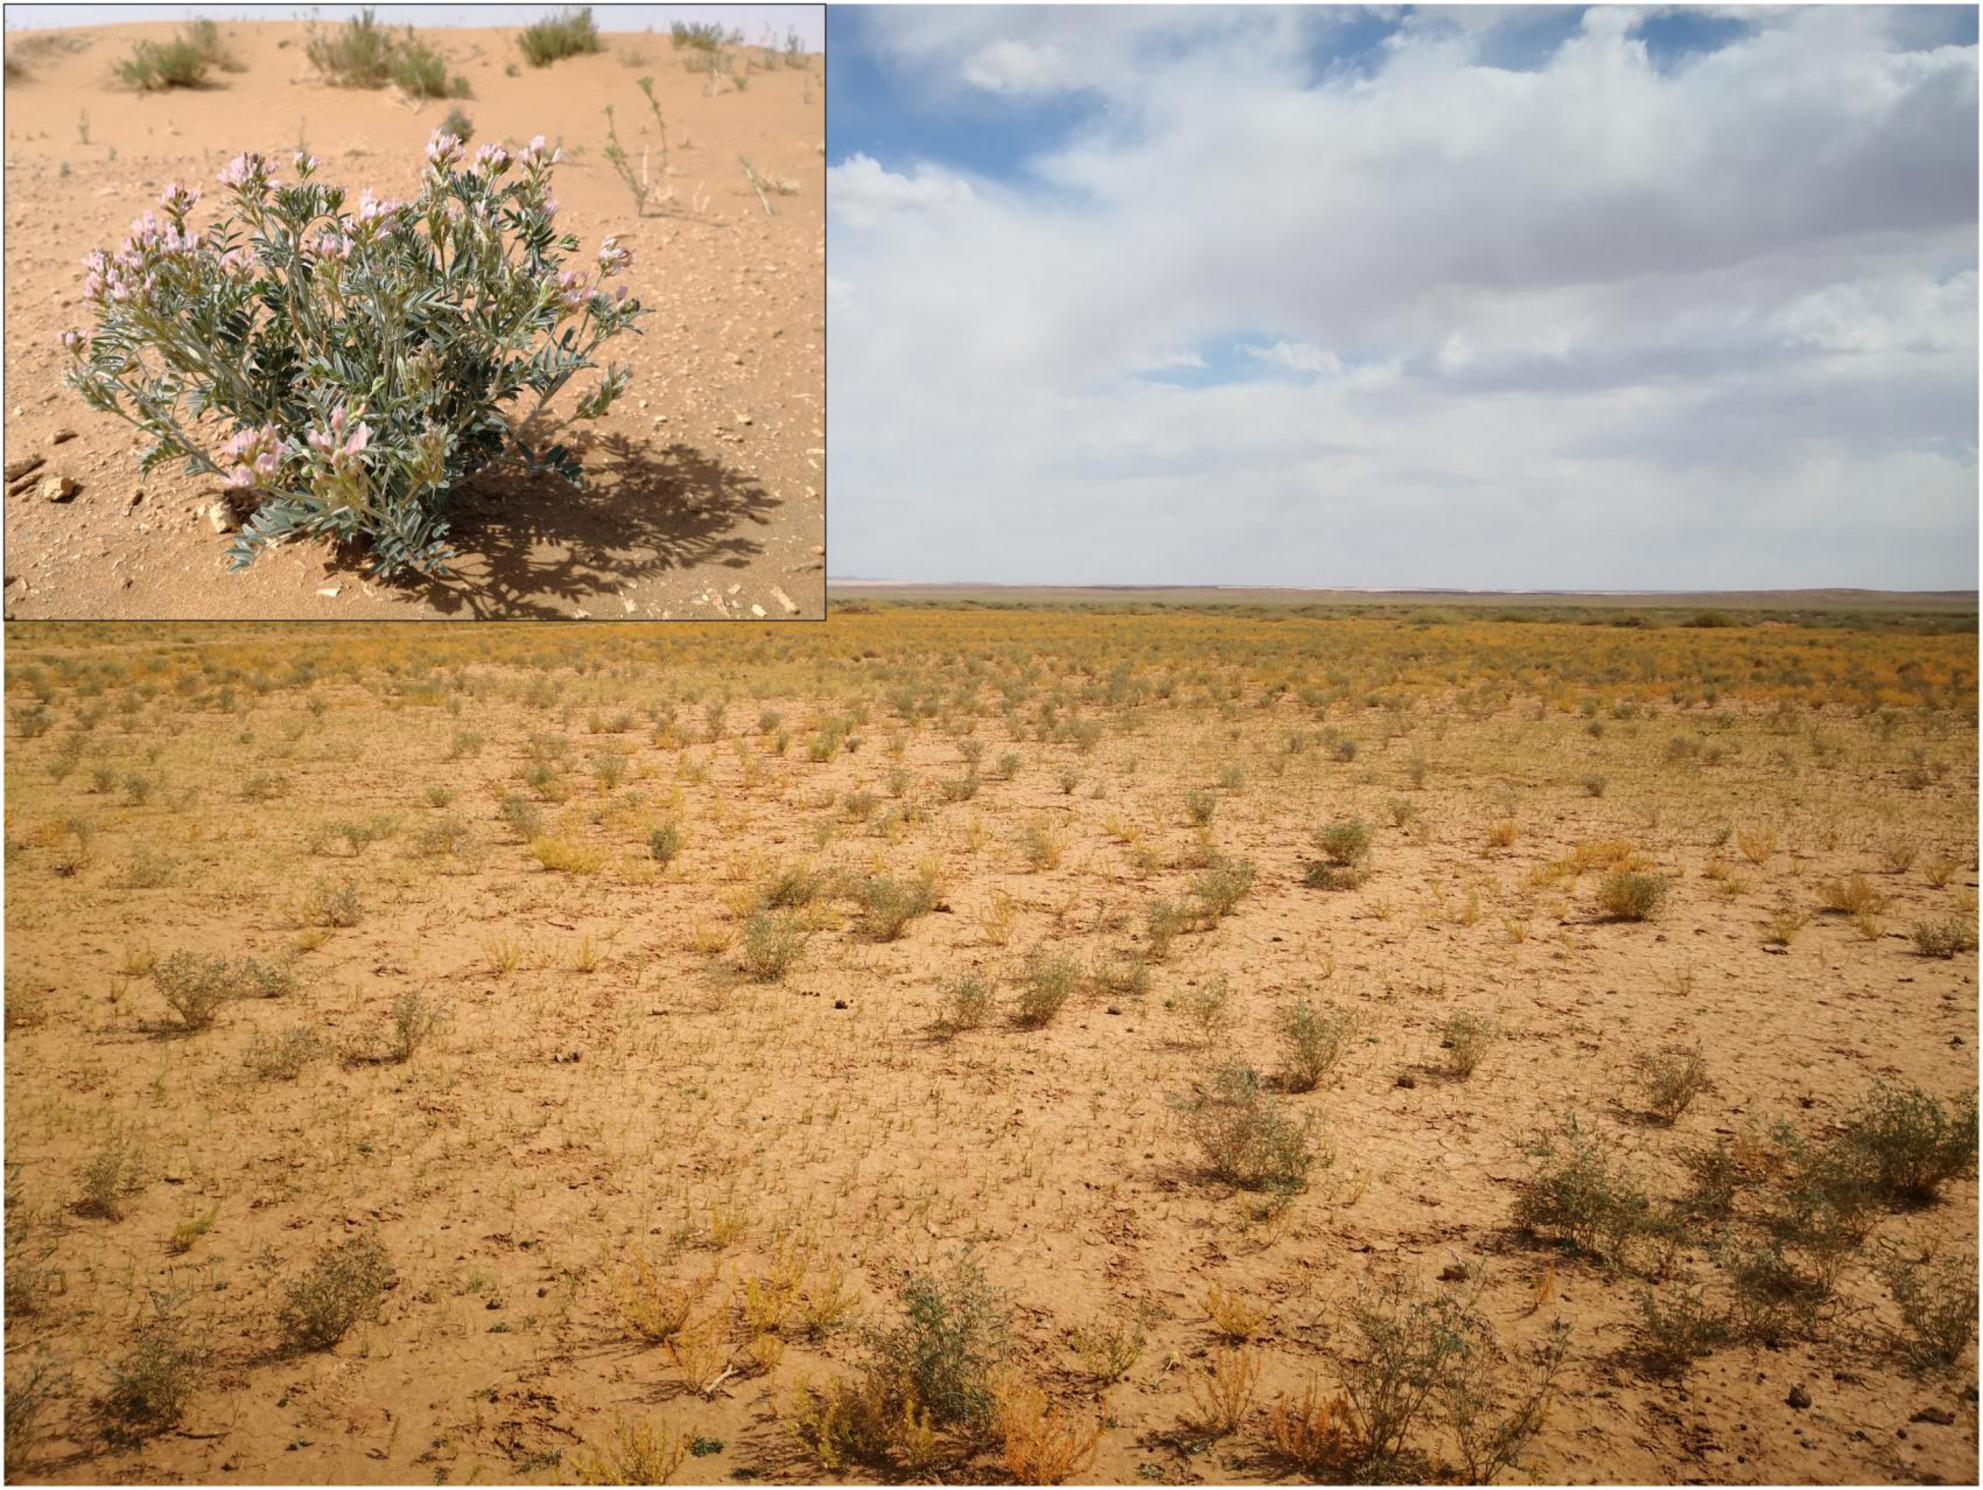
Figure 1. Astragalus variabilis (inset) and its habitat in Alxa, Inner Mongolia.
Species distribution models (SDMs) can be used to predict suitable environments for species by integrating species occurrence data with relevant environmental variables (Guisan and Zimmermann, 2000). Maximum Entropy (MaxEnt) models have become a popular tool for predicting the potential distributions of species because they have been shown to have greater predictive power and accuracy compared with other SDMs (Phillips et al., 2006; Panda and Behera, 2019). MaxEnt models are also capable of handling complex interactions between response and predictor variables, and model outputs remain robust to small sample sizes (Wisz et al., 2008; Elith et al., 2011). Moreover, MaxEnt models are simple to use for researchers in various fields and only require species occurrence data and environmental layers. The information provided by these models has been widely used in the fields of ecology, evolutionary biology, conservation biology, and biosafety (Elith et al., 2011; Luo et al., 2017).
Most previous studies on locoweed plants have focused on examining their deleterious effects, toxic components, poisoning mechanisms, and endophytic fungi (Lu et al., 2012; Yao et al., 2013). However, few studies have examined the ecology of locoweed plants, and no studies to date have attempted to predict the distribution of suitable habitats of locoweeds under different climate scenarios. Here, niche models were used for the first time to predict the distribution of suitable habitat of locoweed plants and analyze the relationship between habitat suitability and the frequency of livestock poisoning. The results of our study will aid future efforts to minimize the deleterious effects of poisonous plants and prevent their spread, promote the development of the livestock husbandry industry in northwest China, and provide basic information that will facilitate the maintenance of the ecological balance of grassland ecosystems.
The design of this study is summarized in a flow chart in Figure 2. We used the following software, packages, and tools: spThin package (Aiello-Lammens et al., 2015) and ENMeval 2.0 package (Kass et al., 2021) in R 4.2.1, ENMTools (Warren et al., 2010), MaxEnt 3.4.4 (including the jackknife test function) (Phillips et al., 2006), SDMTools 2.0 (Brown et al., 2017), ArcGIS 10.7 (including its various toolkits), and SPSS 20.0.
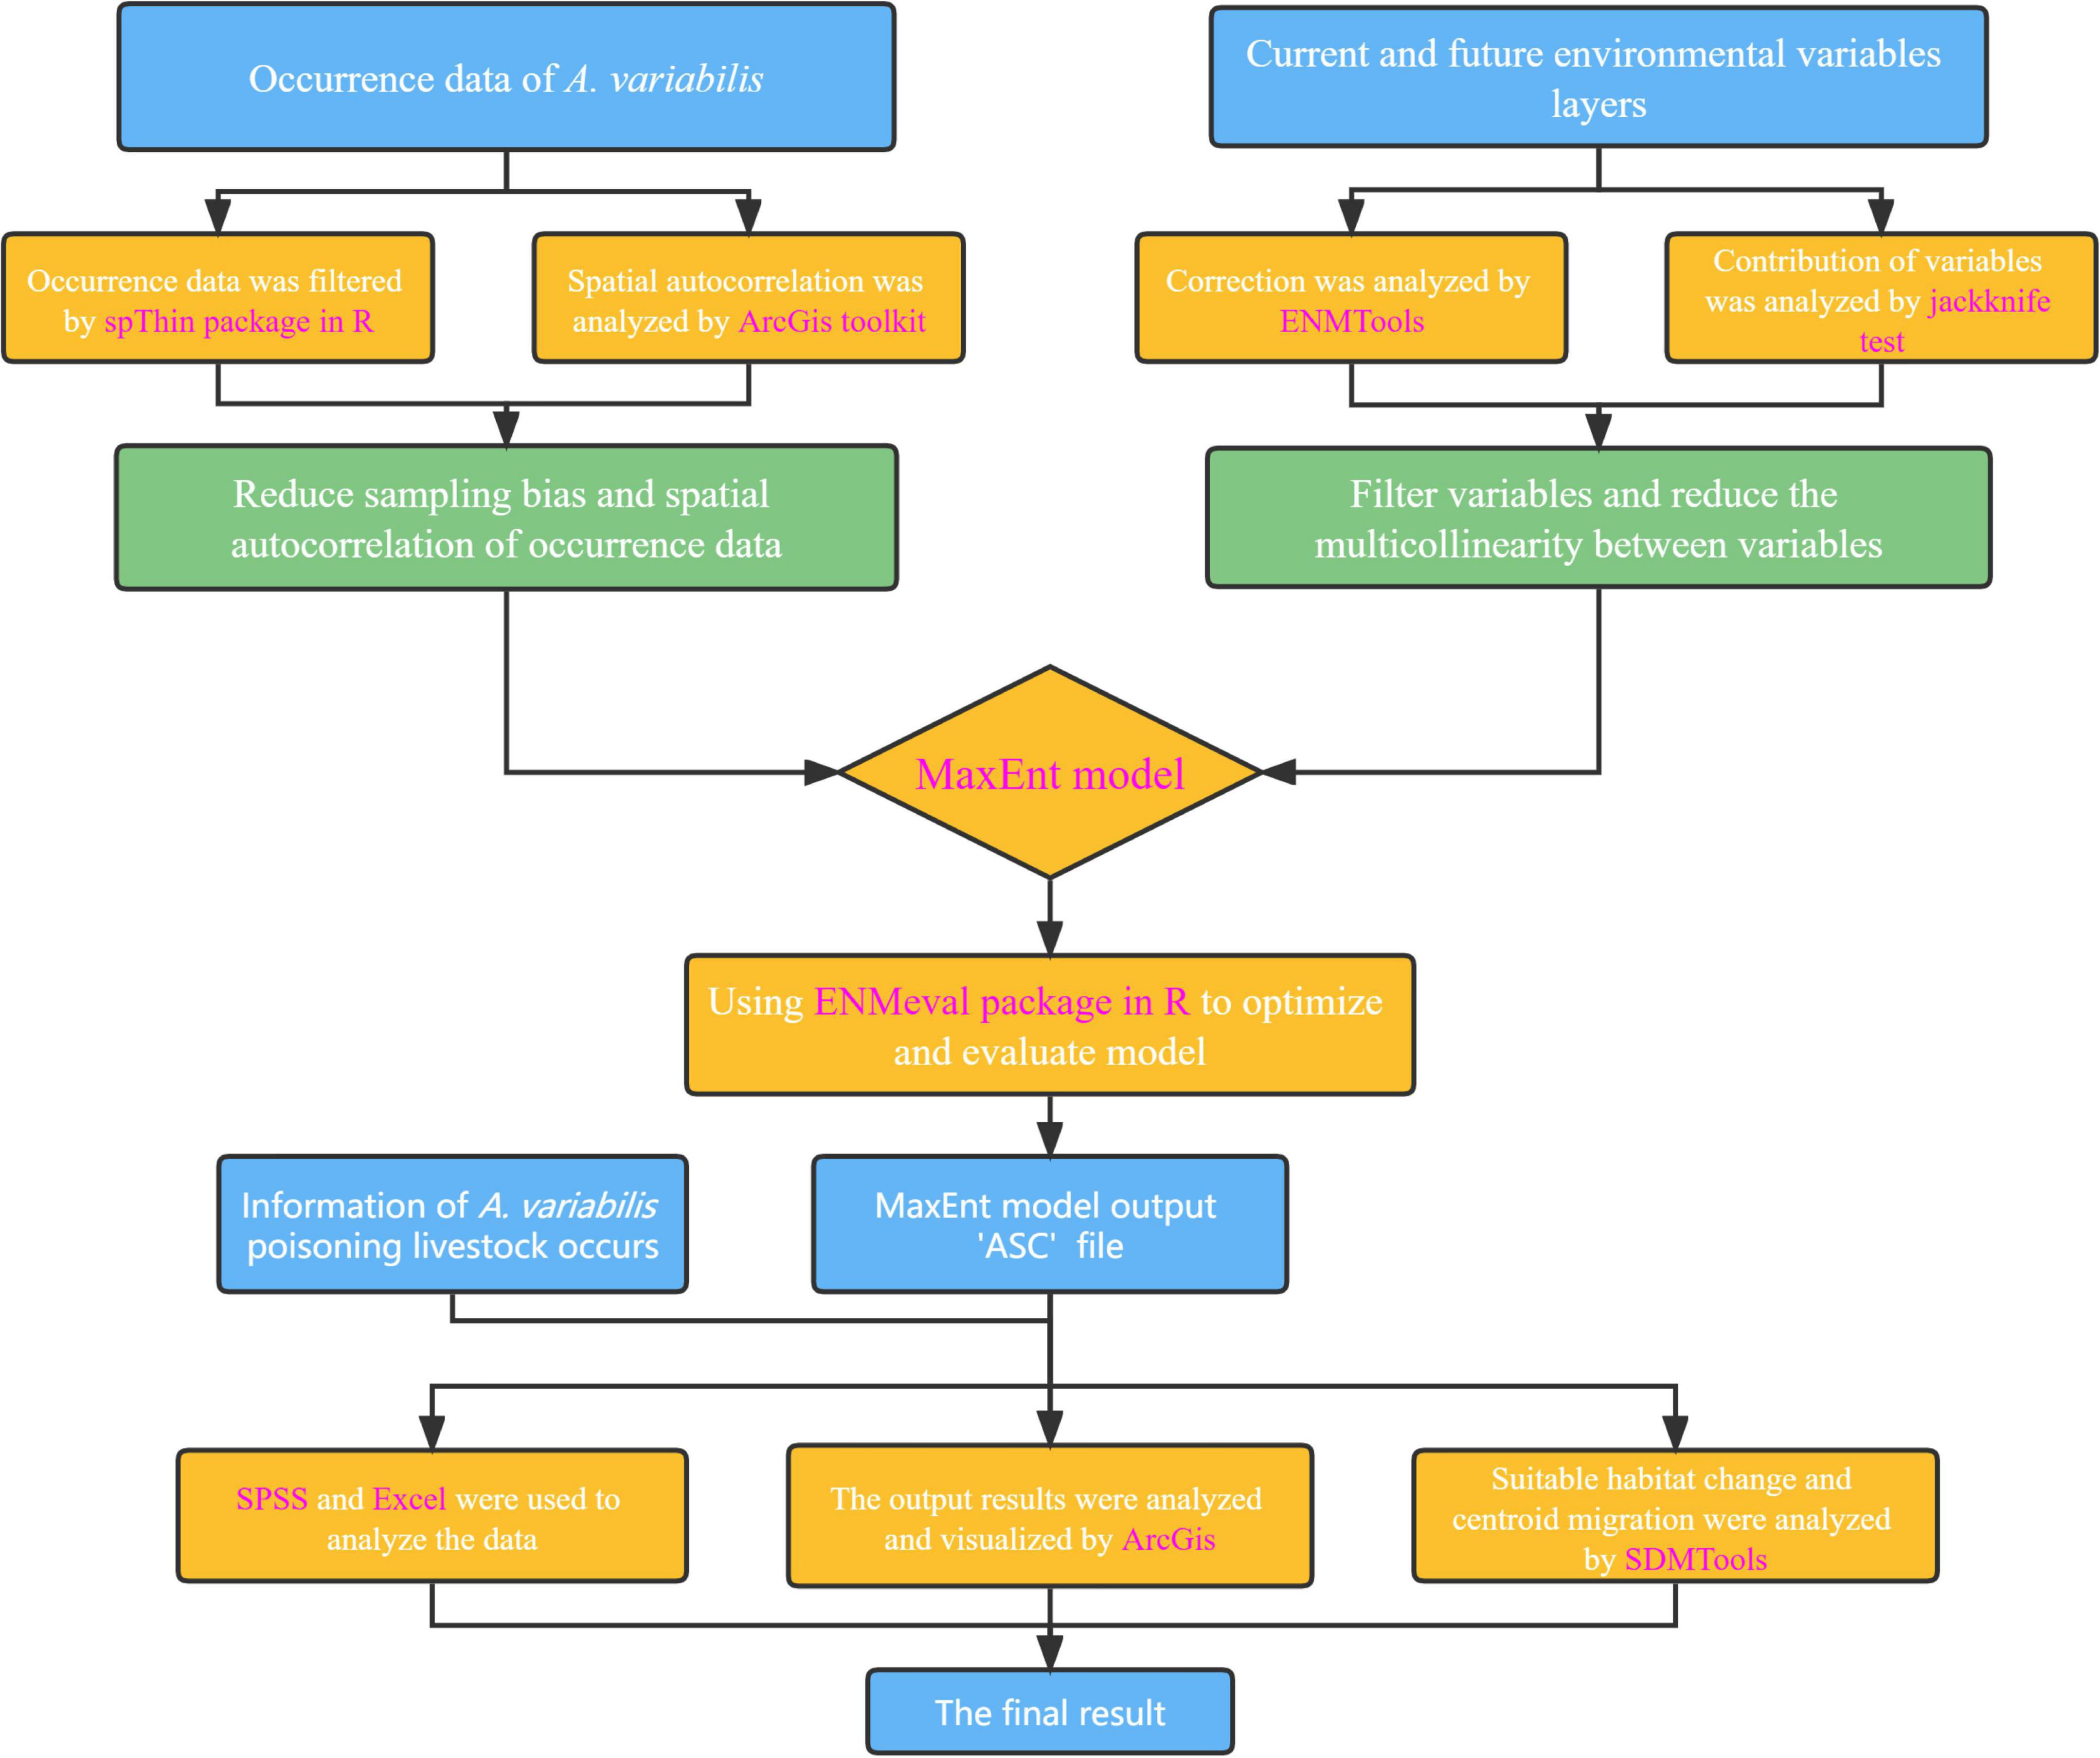
Figure 2. Flow chart of the design of this study. The software, packages, and tools used are indicated in purple font.
Astragalus L. (Fabales: Fabaceae: Galegeae) is mainly distributed in arid and semi-arid regions of the northern hemisphere and temperate South America (Podlech, 1986; Ranjbar and Karamian, 2003). China is one of the major centers of Astragalus diversity and has more than 400 species belonging to 59 sections (Huang et al., 2018). A. variabilis belongs to the subgenus Cercidothrix Bunge, A. Sect. Craccina (Stev.) Bunge, and it is mainly distributed in Inner Mongolia, Ningxia, Gansu, and Qinghai (Editorial Committee of Chinese Flora, C.A.O.S., 2006). A. variabilis is known to be resistant to cold, drought, and barren soils (Dong et al., 2003).
We conducted a preliminary study in which we determined the area of the potential distribution of A. variabilis in a restricted area: 30.04°–49.35°N, 73.45°–118.86°E. The study area covers most pastoral areas in China, including central and western Inner Mongolia, Ningxia, Gansu, Qinghai, Xinjiang, central and northern Tibet, and northern Sichuan. Most of this preliminary study region comprises arid and semi-arid regions that receive low amounts of precipitation in an uneven fashion (annual precipitation ranges from 200 to 400 mm) and experience rapid changes in temperature and precipitation (Lv et al., 2009).
We obtained records of A. variabilis occurrence from fieldwork conducted between 2014 and 2021; the coordinates of all localities were taken using a GPS (GARMIN GPSMAP 621sc; accuracy ± 3 m). Records were also obtained from searches conducted on two online databases: the Chinese Virtual Herbarium1 and the Global Biodiversity Information Facility.2 To ensure the accuracy of occurrence points, we only used records with precise coordinates after 2000. All records were carefully inspected, and records with erroneous data and duplicate records were removed. See Supplementary Table 1 for details of all records. One assumption of MaxEnt models is that all areas have been systematically or randomly sampled (Phillips et al., 2009). However, samples are often spatially autocorrelated due to sampling bias, and this can result in the overfitting of MaxEnt models and affect the model’s predictive ability (Warren et al., 2014; Kong et al., 2019). Spatial filtering of occurrence points has been shown to be effective for reducing spatial autocorrelation and sampling bias (Kong et al., 2019). Thus, we used the spThin package in R to spatially filter the occurrence points (Aiello-Lammens et al., 2015) at distances of 5, 10, and 20 km. We used AcrGIS to conduct spatial autocorrelation analysis on the unfiltered data as well as the data that were spatially filtered at 5, 10, and 20 km (Jiang et al., 2022). These data were added to the MaxEnt model, and the degree of overfitting was evaluated using a 10% training omission rate (OR10) (Radosavljevic and Anderson, 2014). The distance of OR10 to 0.1 is positively correlated with the overfitting degree of the model (Muscarella et al., 2014; Radosavljevic and Anderson, 2014). Finally, the optimal spatial filtering distance was selected.
Because few ecological studies of A. variabilis have been conducted, we used the environmental variables most commonly used in previous studies that have predicted the distribution of suitable habitat for various plant species (Fois et al., 2018; Shi et al., 2022; Zhang L. et al., 2022). Given that we were interested in comparing current and future suitable habitats, environmental variables with both current and future data available were used. We initially used 19 bioclimatic, 36 climatic variables, 1 topographical variable, and 4 soil variables that might affect the distribution of A. variabilis (Supplementary Table 2). Bioclimatic, climatic, and topographical layers were downloaded from WorldClim 2.13 (Fick and Hijmans, 2017), and soil variable layers were downloaded from the Harmonized World Soil Database version 1.2 (HWSD v1.2)4 (Wieder et al., 2014). The spatial resolutions of the environmental variable layers from WorldClim were 10 arc min, 5 arc min, 2.5 arc min, and 30 arc s. We used the 2.5 arc-min spatial resolution layers for analyses. There were no observable differences in the results when data at a resolution of 30 arc s and 2.5 arc min were used, which is consistent with the results of a previous study (Guisan et al., 2007). The processing of the data is also much more rapid when 2.5 arc-min data are used compared with 30 arc-s data. Data at a resolution of 2.5 arc min have been used in several previous studies that have estimated the potential distributions of species (Wan et al., 2021; Xu et al., 2021; Jiang et al., 2022).
Future climate data were derived from four shared socioeconomic pathways (SSP126, SSP245, SSP370, and SSP585) under the BCC-CSM2-MR model from the Coupled Model Inter-comparison Project 6 (CMIP6) published by the IPCC on the WorldClim website (Fick and Hijmans, 2017; Riahi et al., 2017). Previous studies have shown that the BCC-CSM2-MR model is robust for modeling climate change in China (Yang et al., 2016; Shi et al., 2020). SSP126, SSP245, SSP370, and SSP585 represent future climate scenarios with low to high carbon emissions (Table 1; Riahi et al., 2017). Future climate prediction was carried out in three periods: 2021–2040 (2030s), 2041–2060 (2050s), and 2061–2080 (2070s). We included the same elevation and soil layers in both the current and future climate models given that elevation and soil can be expected to remain unchanged over these short time frames.
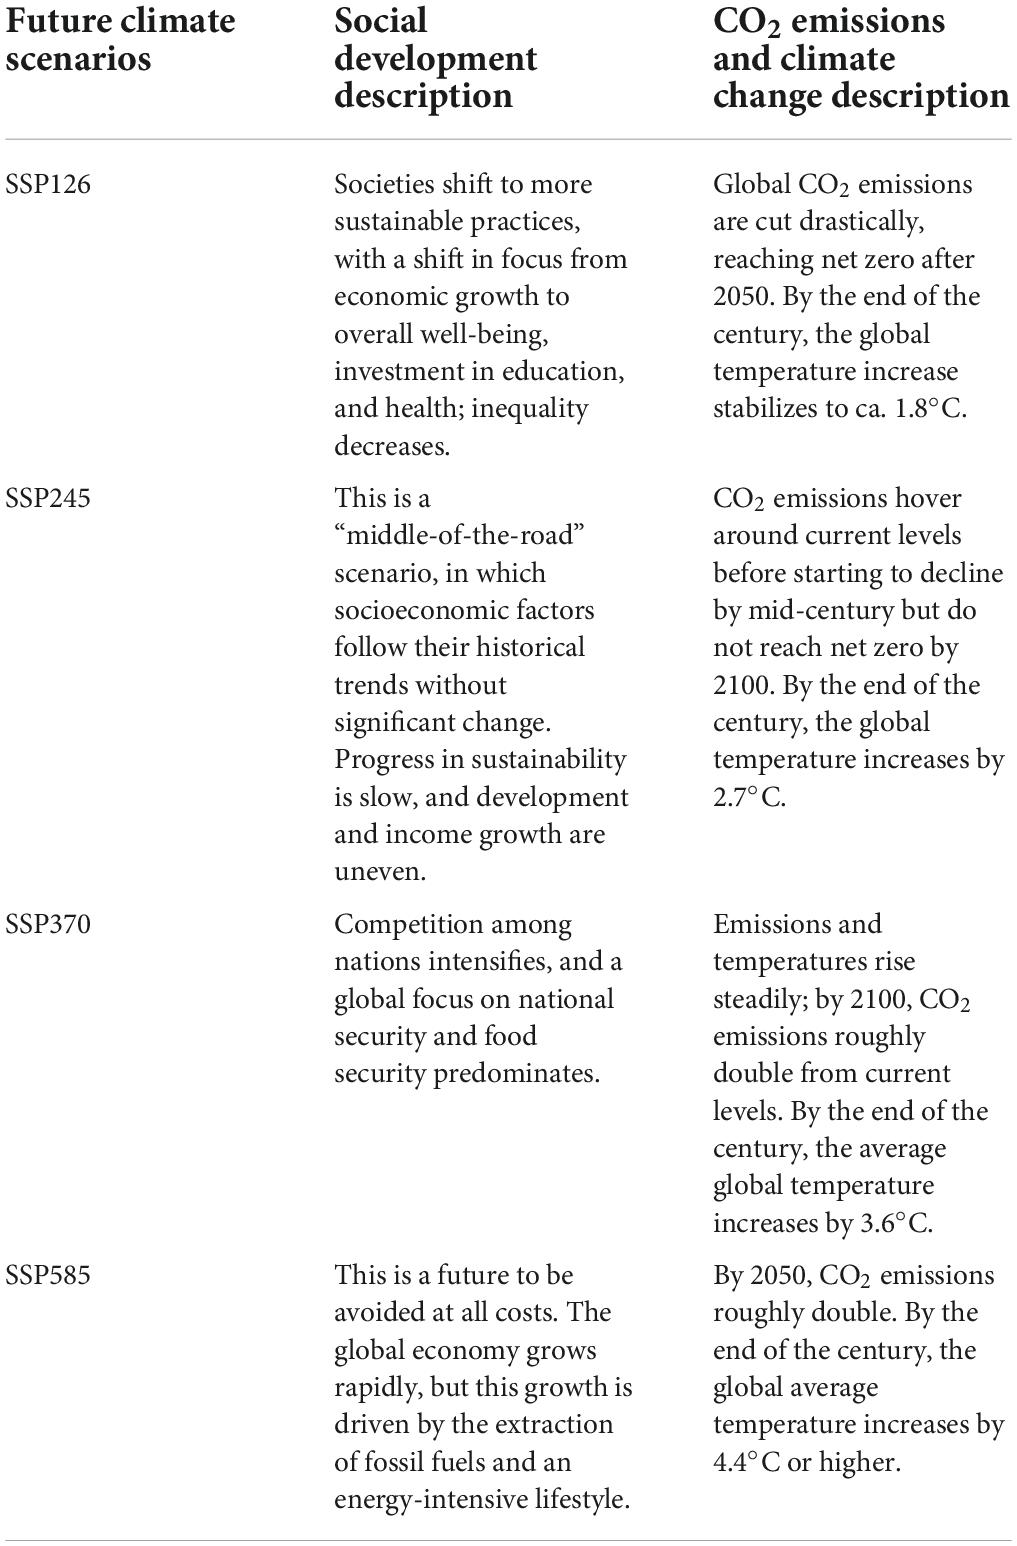
Table 1. Description of four shared socioeconomic pathways.
Because multicollinearity among environmental variables can affect model outputs and result in an over-fitted model, Pearson’s correlation analysis was used to examine correlations among the environmental variables in ENMTools (Sillero, 2011; Li et al., 2022). If the absolute value of the correlation coefficient between two environmental variables was greater than 0.7, the one with a lower percent contribution (according to a jackknife test) was removed (Zeng et al., 2016; Farrell et al., 2019).
Feature class (FC) combinations and regularization multiplier (RM) settings are important parameters affecting the predictions of MaxEnt models (Phillips and Dudik, 2008), and default settings are typically not optimal (Muscarella et al., 2014). We thus used the ENMeval package in R to optimize and evaluate models, which supports more evaluation metrics in its version 2.0 (Kass et al., 2021). Eight RMs (0.5–4 with an interval of 0.5) and six different FC combinations (L, LQ, H, LQH, LQHP, LQHPT, where L = linear, Q = quadratic, H = hinge, P = product, and T = threshold) were used to create 48 (8 RM × 6 FC) candidate models. We used random k-fold cross-validation to verify models (Boria and Blois, 2018; Kass et al., 2021). A recent study suggests that the value of k in k-fold cross-validation should be the natural logarithm of the sample number (Jung, 2018). Here, our sample number was approximately 200; thus, k = 5. The optimal model had a low OR10 relative to the default, and the lowest Akaike information criterion (AICc) (Liu et al., 2017; Galante et al., 2018).
Metrics such as the area under the receiver operating curve (AUC), continuous Boyce index (CBI), OR10, and true skill statistic (TSS) were used to evaluate the performance of the model. AUC is a threshold-independent metric that is often used to evaluate the performance of MaxEnt models. The performance of the model was evaluated using the following criteria: fair (0.7 < AUC < 0.8), good (0.8 < AUC < 0.9), and excellent (0.9 < AUC < 1) (Jimenez-Valverde, 2012; Shi et al., 2021). The CBI is also often used to evaluate the transferability and performance of presence–absence models; it is a reliable measure of presence-only-based predictions (Hirzel et al., 2006). CBI ranges from –1 to 1, and values closer to 1 indicate models with higher consistency with the distribution of presence data (Boyce et al., 2002). TSS ranges from –1 to 1, and TSS values closer to 1 indicate higher prediction accuracy of the model (Allouche et al., 2006). When TSS is greater than 0.75, model performance is very good (Landis and Koch, 1977; Franco et al., 2022).
MaxEnt 3.4.4 (Phillips et al., 2006) was used to model the potential distribution of A. variabilis. We used optimized FC and RM parameters. The settings selected were as follows: “Create response curves,” “Do jackknife to measure variable importance,” “Random seed,” “Write plot data,” “Write background predictions,” “randomly sample 10,000 background points as pseudo-absences,” “Replicated run type crossvalidate,” “Replicates 5,” and “Output format logistic.” The rest of the settings were default. The MaxEnt model eventually outputs an “ASC” file in logistic output format for each grid.
We used ArcGIS to reclassify and visualize the ASC files. The maximum training sensitivity plus specificity threshold (MTSPS) was used to classify the model output results (logistic output) into unsuitable and suitable for A. variabilis, which is considered simple and effective (Aidoo et al., 2022). MTSPS has been shown to be robust for selecting thresholds when model outputs are based on presence-only data (Liu et al., 2013). It is less affected by the occurrence:background point ratio and species prevalence, which reduces omission errors for low-prevalence species and misclassification errors for high-prevalence species (Liu et al., 2016). The habitat suitability of A. variabilis was reclassified into four categories according to the output logistic value: unsuitable (0–MTSPS), low suitability (MTSPS–0.4), moderate suitability (0.4–0.6), and high suitability (0.6–1.0) (Zhang et al., 2018; Mahatara et al., 2021).
We compiled a data set of A. variabilis poisoning livestock incidents by conducting a (1) literature review, (2) searching various news outlets, and (3) conducting field studies from 2000 to 2022 (Supplementary Table 3). Livestock poisoning has occurred in the study area for many years, and we recorded the frequency of poisoning incidents by tallying the number of years in which poisoning incidents have been reported. For example, records of animal poisoning were documented in Alxa Left Banner of Inner Mongolia in 2003, 2004, and 2005; thus, a value of 3 was recorded in our data set for Alxa Left Banner. For localities with accurate location descriptions, we used the Baidu coordinate system5 to obtain latitude and longitude data, and the logistic output of the location was extracted using the coordinates. For records with imprecise locality descriptions (county level and above), we used the average logistic values over the entire area over which the poisoning incident occurred. Habitat suitability for each poisoning incident was inferred according to logistic output values. Finally, SPSS 20.0 was used to analyze the correlation between habitat suitability and the frequency of poisoning incidents.
We used ArcGIS and Microsoft Excel to conduct spatial data analyses. The SDM toolbox was used to compare differences in the area of suitable habitat of A. variabilis under current and future climate conditions (Brown et al., 2017). The model output results were divided into binary maps using the MTSPS threshold (logistic output values greater than MTSPS were assigned a value of 1, and values less than 1 were assigned a value of 0). Changes were quantified by subtracting the current binary map from the binary maps of each of the four future periods. Grid values ranging from 0 to 1 indicate expansions in the range of suitable habitat; values ranging from 1 to 0 indicate contractions in the range of suitable habitat; and a value of 1 indicates no change in the area of suitable habitat. A value of 0 indicates that the habitat is not suitable (i.e., no occupancy). Similarly, the centroid of the area of suitable habitat in each period was calculated using the SDM toolbox, and the changes in the area of suitable habitat can be visualized by comparing the centroids among periods (Cong et al., 2020).
A total of 273 occurrence records of A. variabilis were obtained through our field investigation, and 9 occurrence records that met our quality requirements were obtained from databases (CVH: 9; GBIF: 0). The results of the spatial autocorrelation analysis and OR10 values of the unfiltered data and data spatially filtered at three different distances are shown in Table 2. Unfiltered data were spatially autocorrelated, as the distribution of these data significantly differed from a random distribution (p < 0.01, z > 2.58). There were no significant differences in the distributions of the data spatially filtered at three different distances and random distributions (p > 0.10, –1.65 < z < 1.65). Spatial filtering reduces spatial autocorrelation and sampling bias. We used the data that were spatially filtered at a distance of 10 km because the OR10 was lowest for these data. A total of 189 occurrence records were used for modeling.
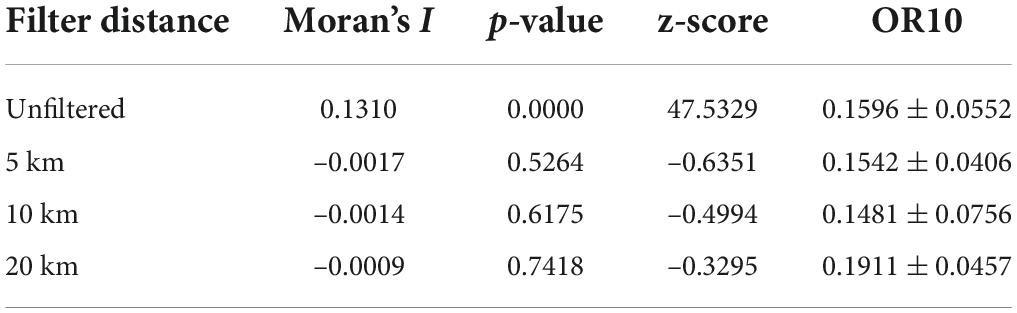
Table 2. Spatial autocorrelation and OR10 of occurrence records that were spatially filtered at different distances.
After reducing the multicollinearity among environmental variables, a total of 10 environmental variables (elev, bio7, bio15, bio19, prec6, tmax2, t_oc, t_teb, t_ph, and t_tex) were retained for modeling. Correlations among the environmental variables used in the final model were all less than 0.7 (Supplementary Figure 1).
The MaxEnt model uses all feature types by default when there are more than 80 training samples, and the regularization constant is 1 (FC = LQHPT, RM = 1) (Phillips et al., 2006; Phillips and Dudik, 2008). Optimization using the ENMeval package revealed that the AICc value of the model was lowest (delta AICc = 0) when FC = H and RM = 0.5. The avg.AUC, avg.CBI, and avg.TSS were higher and the avg.OR10 was lower for the optimized model compared with the default model (Table 3). These findings indicate that FC = H and RM = 0.5 reduced the overfitting and complexity of the MaxEnt model and enhanced the transferability of the model. In addition, AUC > 0.9, TSS > 0.75, and CBI was close to 1 for the optimized model. This indicates that the performance and transferability of the model were high. We also added the occurrence points removed by spatially filtering that were not used for modeling into the current suitable habitat simulation map to evaluate their overlap with the predicted suitable area (Supplementary Figure 2). A total of 92 of the 93 occurrence records (98.92%) were located in suitable habitat, and one occurrence record was located in unsuitable habitat but was close to an area with suitable habitat. Thus, this model was sufficiently robust for modeling the potential distribution of A. variabilis.

Table 3. Comparison of metrics before and after model optimization.
The contribution rates of 10 environmental variables are shown in Table 4. The variables with the highest contribution rates to the model were tmax2, bio7, and prec6, which had a cumulative contribution rate of 64.1%. The results of jackknife tests of variable importance are shown in Figure 3. The environmental variable with the highest training gain when used in isolation was tmax2, followed by t_oc and prec6; thus, tmax2, t_oc, and prec6 were the most informative variables. The environmental variable that decreased the gain the most when it was omitted was also tmax2; tmax2 thus provided the most information that was not provided by the other variables. In sum, the key environmental factors affecting the distribution of A. variabilis were tmax2, prec6, and t_oc.
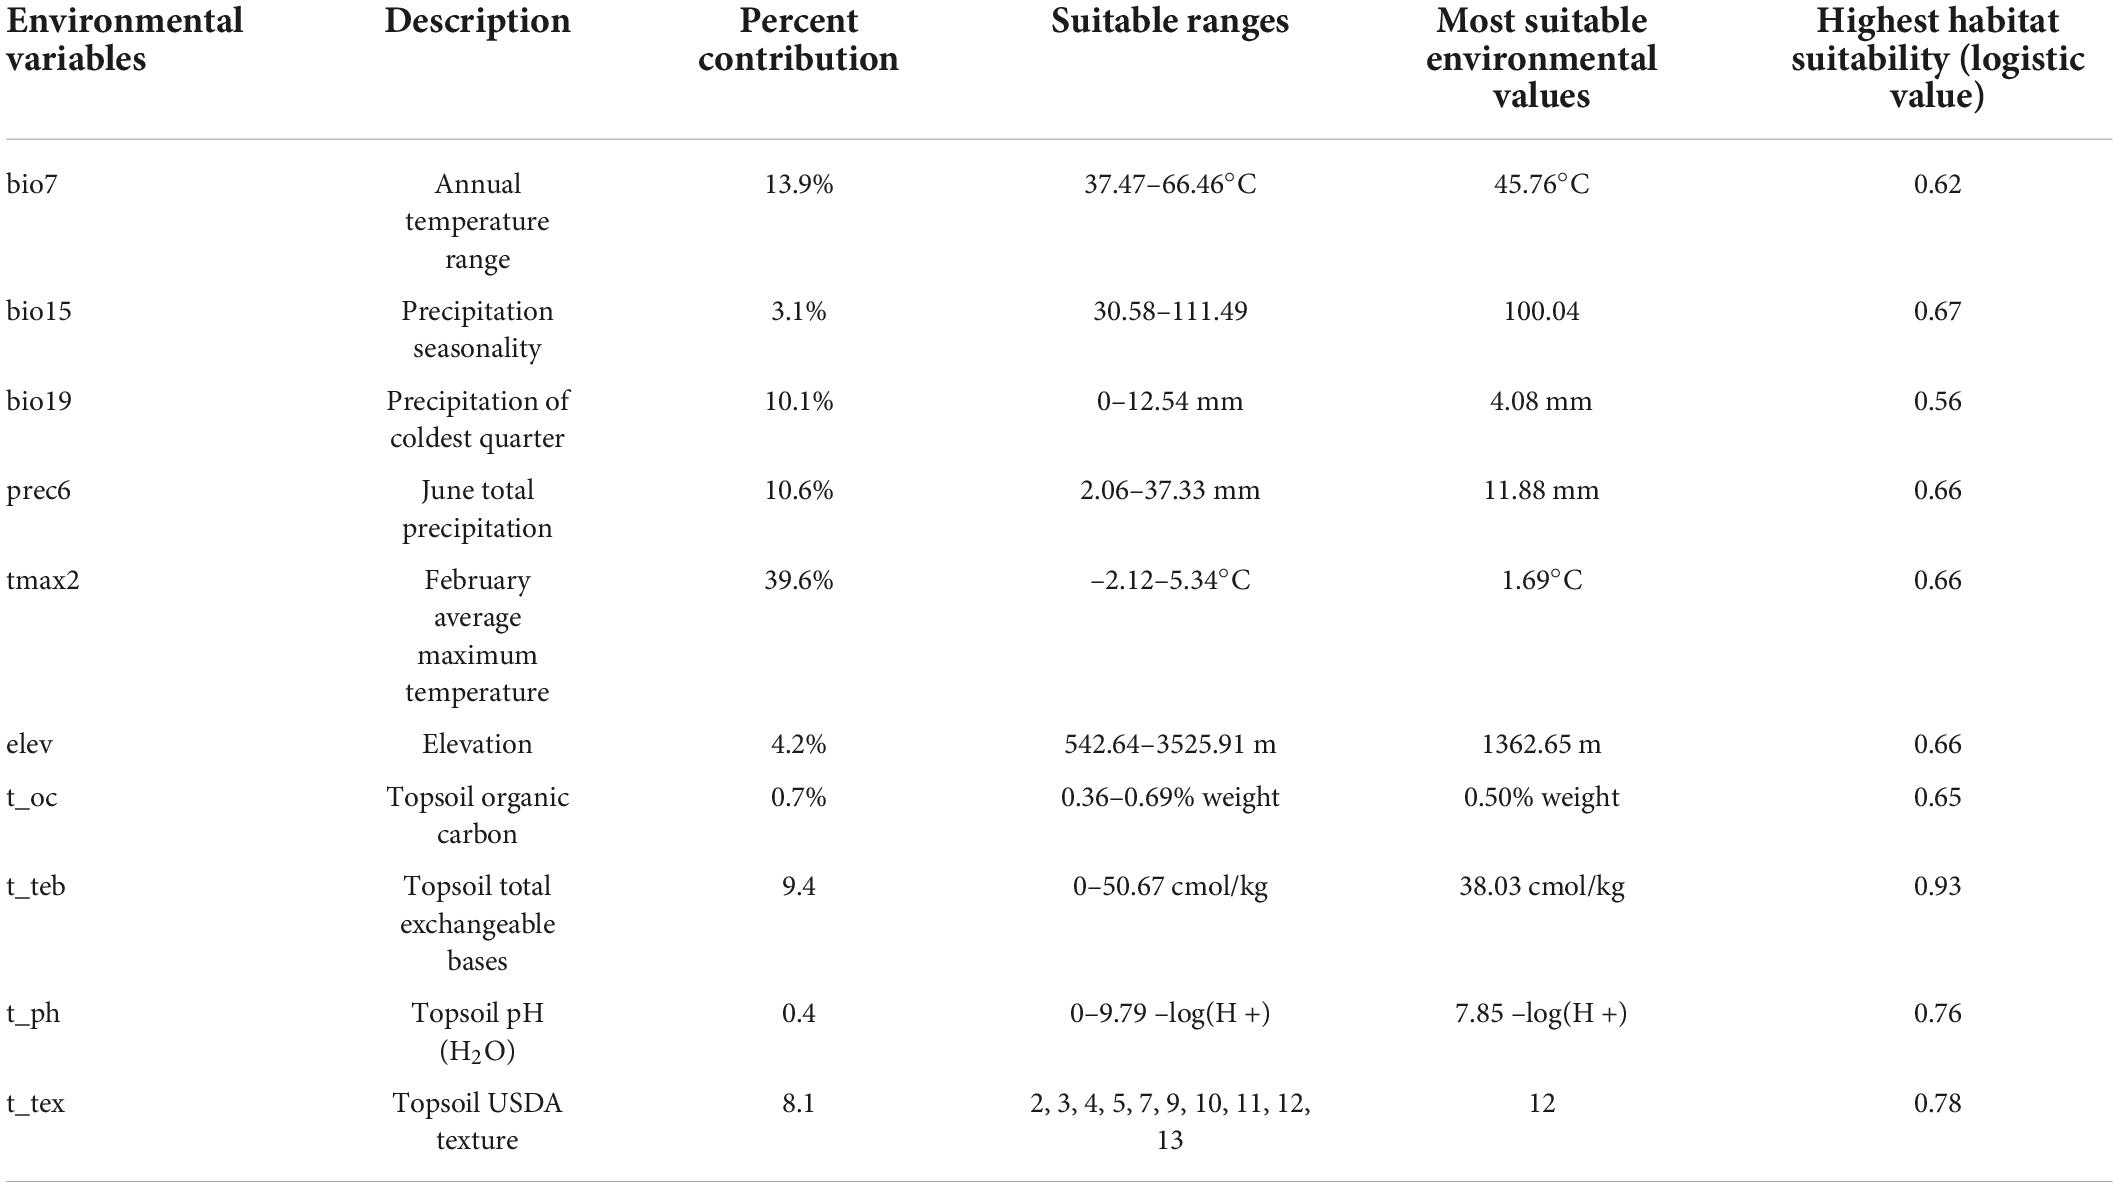
Table 4. Details of environmental variables used for modeling.

Figure 3. The relative importance of environmental variables in determining the potential distribution of A. variabilis according to jackknife tests.
The environmental variable response curves indicate the degree to which each environmental variable affects the model output result (logistic output) and thus the habitat suitability of A. variabilis (Figure 4). The logistic value ranges from 0 to 1, and values closer to 1 indicate higher habitat suitability. Values of the environmental variables are considered suitable for A. variabilis when the logistic output exceeds the MTSPS. The suitable ranges, most suitable values of environmental variables, and highest habitat suitability values are shown in Table 4. With the exception of t_ph and t_tex, the response curves of all variables were unimodal or nearly unimodal; however, the response curve for t_ph was approximately bimodal (two higher peaks at ph = 7.85 and 8.54). The suitable topsoil USDA textures (t_tex) included silty clay (code 2), clay (code 3), silty clay loam (code 4), clay loam (code 5), silt loam (code 7), loam (code 9), sandy clay loam (code 10), sandy loam (code 11), loamy sand (code 12), and sand (code 13). Habitat suitability was highest when the soil type was loamy sand, followed by sand, silty clay, and clay loam.
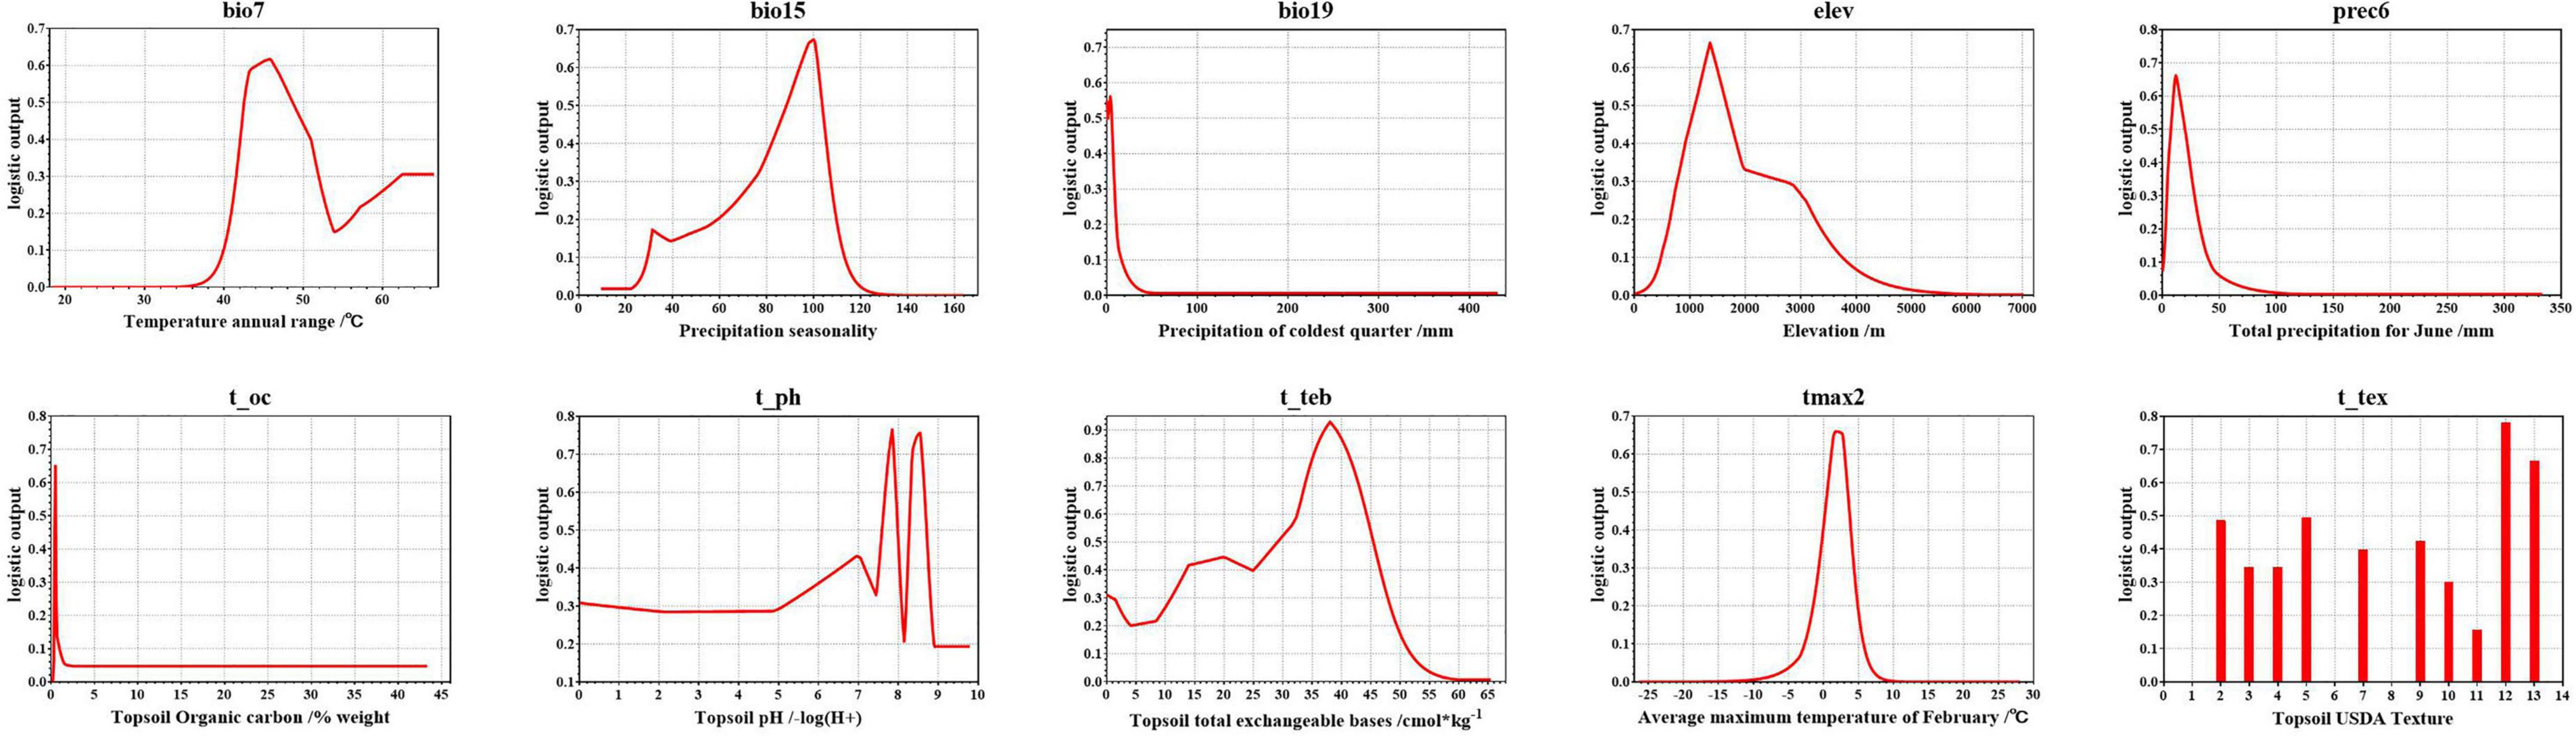
Figure 4. Logistic output of the final model of A. variabilis vs. the environmental variables used in the model.
The suitable habitat of A. variabilis under current climate conditions is shown in Figure 5. The area of suitable habitat was approximately 1.04 × 10⁶ km2, which is 12.72% of the study area. The area of low, moderate, and high suitability habitats was 6.31 × 10⁵, 2.88 × 10⁵, and 1.26 × 10⁵ km2, which comprises approximately 7.70, 3.49, and 1.52% of the study area, respectively. Suitable habitats were mainly observed in Central and Western Inner Mongolia, including Alxa League, Bayannaoer, and Ordos; the center and edge of the Tarim Basin, around the Tianshan Mountains, the southeastern part of Junggar Basin, Turpan Basin, Hami Basin, and the northern part of Barkun Grassland in Xinjiang; Central and Northwest Gansu including Jiuquan City, Zhangye City, Jinchang City, Wuwei City, Baiyin City, and Zhongwei City; Central and Northwest Qinghai (Haixi Mongolian Autonomous Prefecture); and Ningxia Province. Suitable habitats were also observed in Shaanxi, Shanxi, Hebei, Sichuan, and Xizang Provinces.
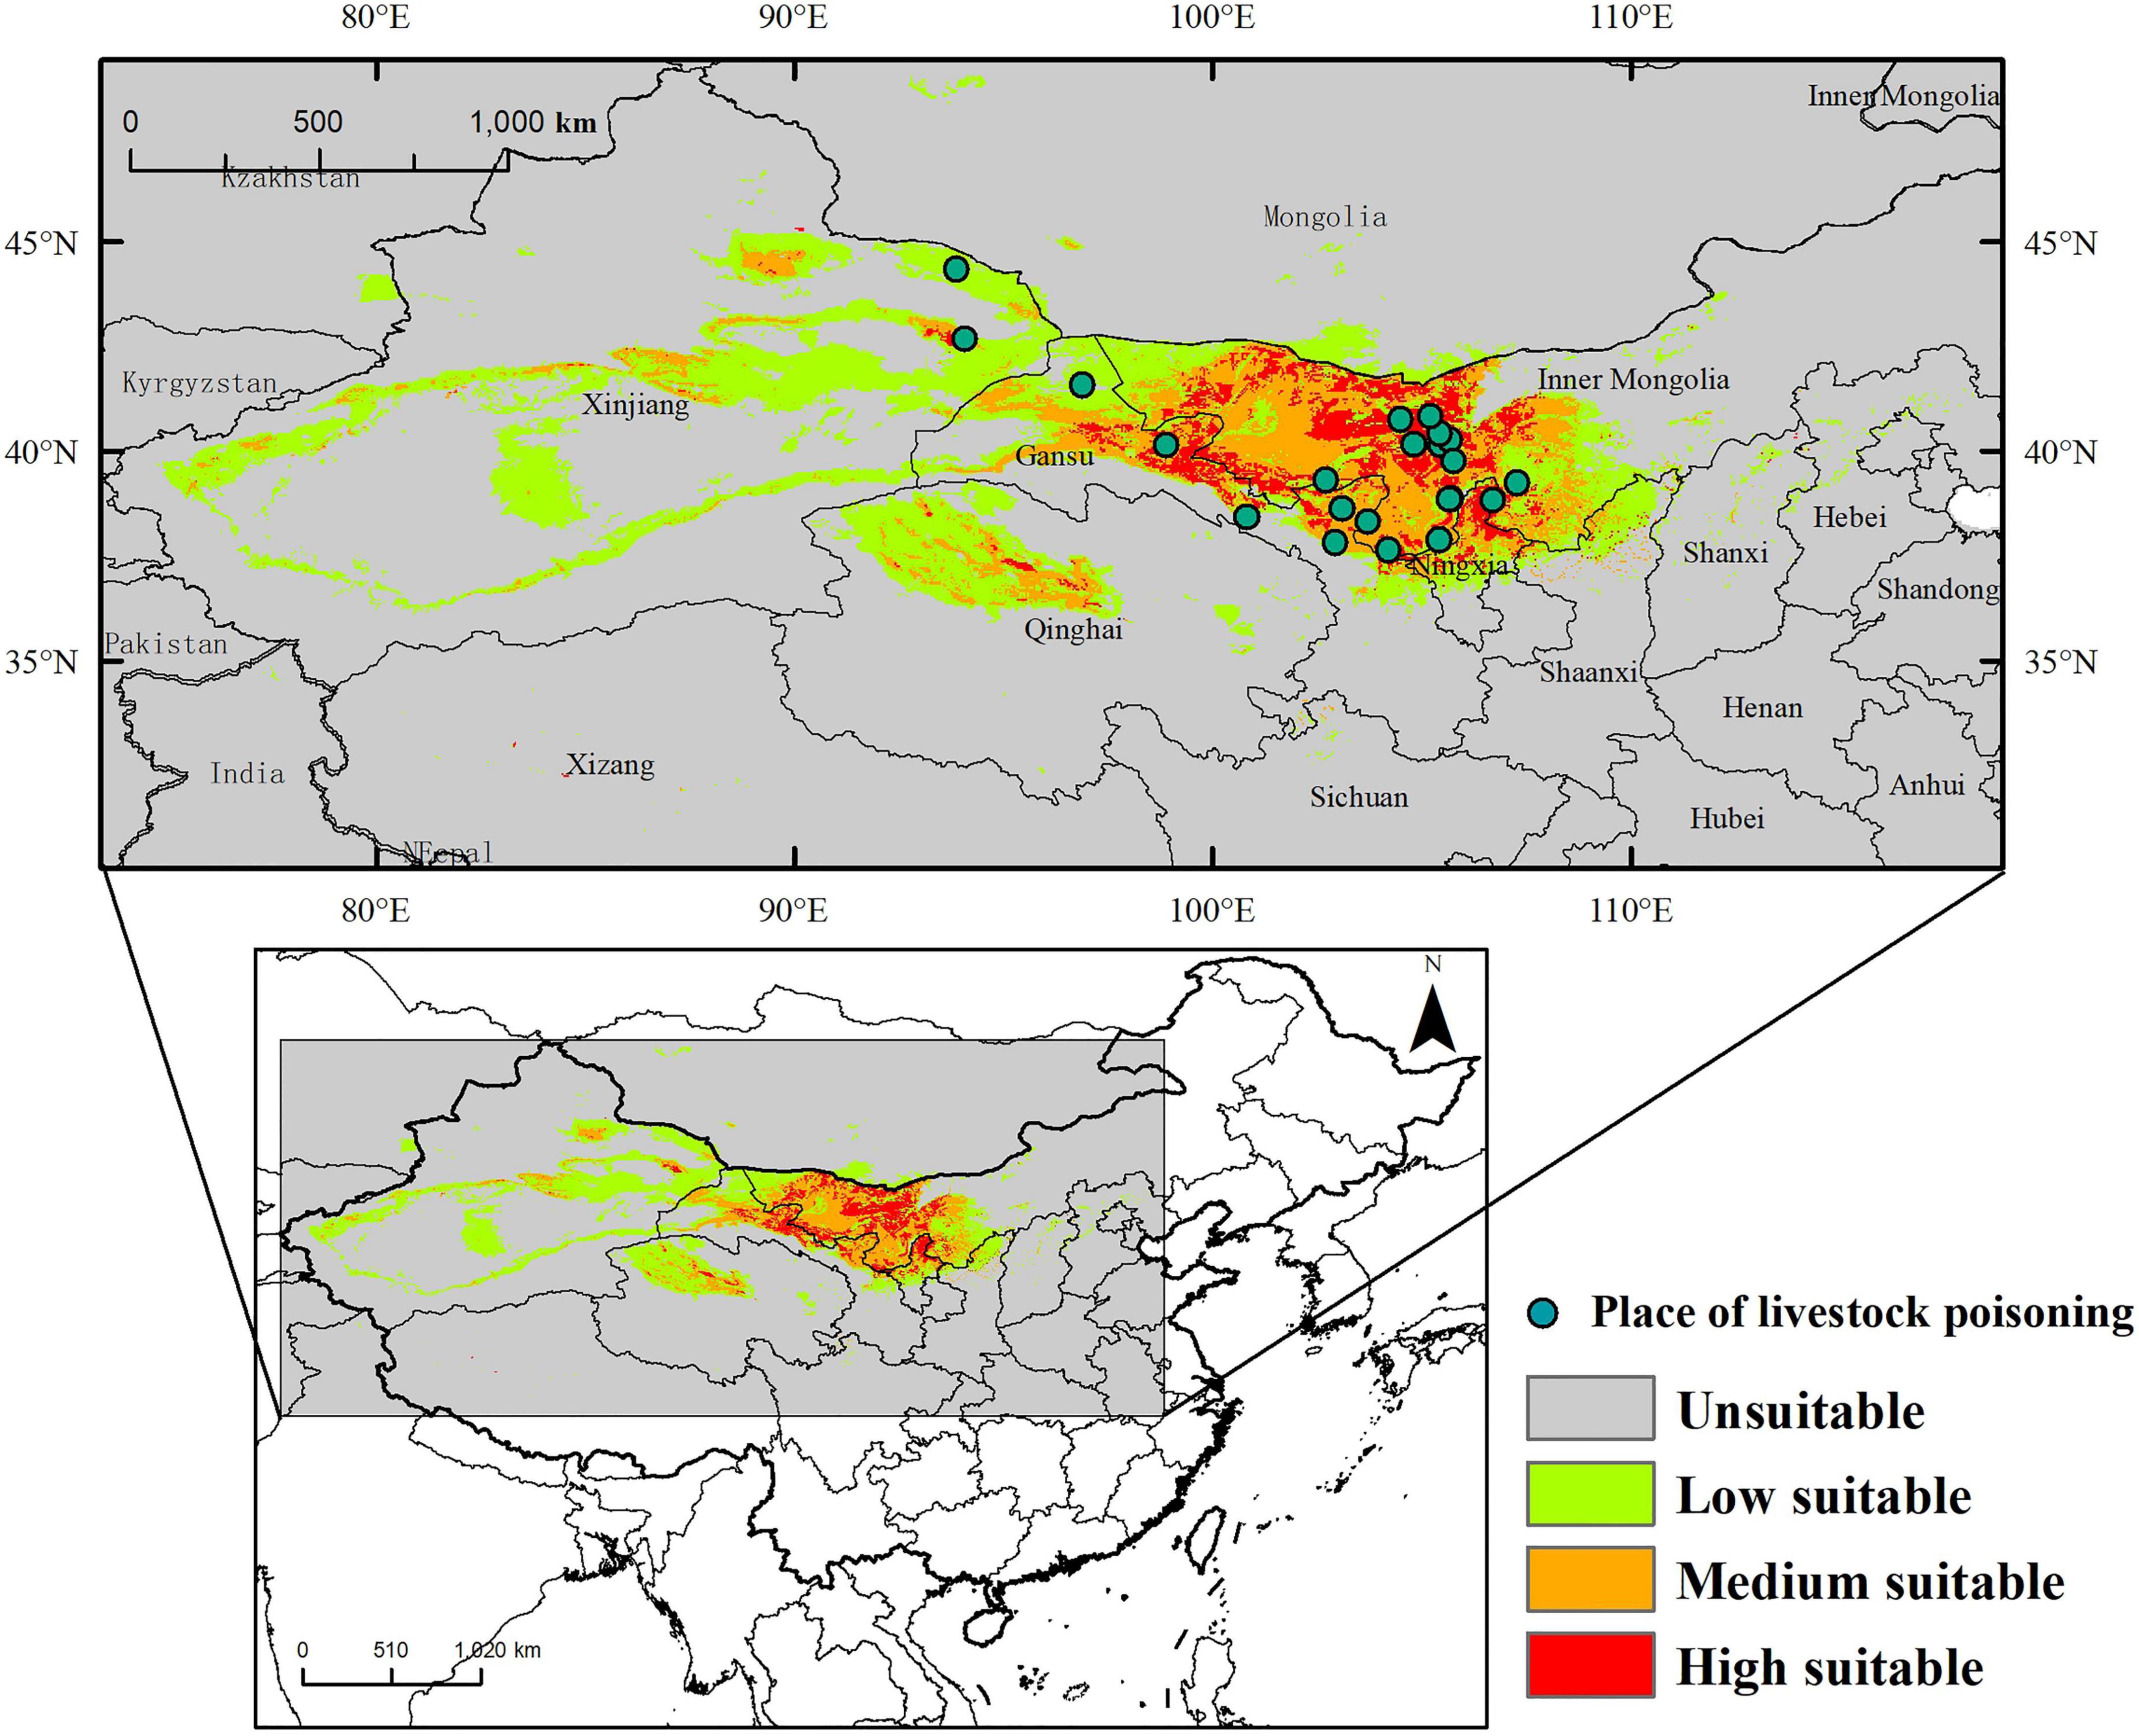
Figure 5. Distribution of the suitable habitat of A. variabilis in China under current climate conditions and the locations of livestock poisoning incidents.
We determined the frequency of livestock poisoning incidents caused by A. variabilis in areas varying in habitat suitability across the study period (Table 5 and Supplementary Table 4). The locations of livestock poisoning incidents are marked in Figure 5. Pearson correlation analysis showed that the frequency of poisoning was significantly positively correlated with habitat suitability (logistic output) (Pearson correlation coefficient = 0.96, p < 0.05).
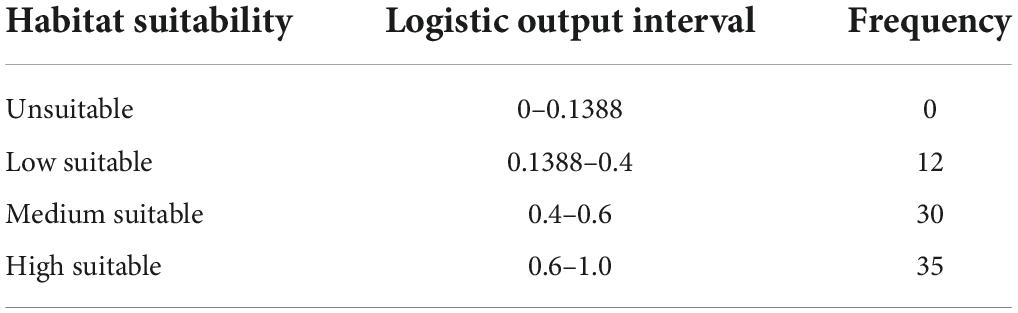
Table 5. Frequency of livestock poisoning incidents caused by A. variabilis by the degree of habitat suitability.
The distribution of the suitable habitat of A. variabilis under different future climate scenarios is shown in Figure 6. To compare the distribution of suitable habitat in the future with the current distribution of suitable habitat, we analyzed changes in the geographical distribution of suitable habitats, including the expansion and contraction of suitable habitats (Figure 7) and the movement of the centroid of suitable habitats over the study period (Figure 8). The area of suitable habitat was predicted to be reduced to varying degrees in the south, including the Tarim Basin, Turpan Basin, and Hami Basin in Xinjiang; Wuwei City and Baiyin City in Gansu; and southern Haixi Mongolian Autonomous Prefecture in Qinghai; central Ningxia; and northern Shaanxi. The area of suitable habitat was predicted to expand to varying degrees in the north, including the Ili River Valley and the Junggar Basin in Xinjiang; northern Bayannaoer, northern Baotou, and northern Ulanqab in Inner Mongolia; and Harwusu Lake and South Gobi Province in Mongolia. Under SSP126 and SSP245, the centroid of suitable habitat first migrated to the northeast and then returned to the southwest; under SSP370, the centroid migrated to the northeast; and under SSP585, the centroid first migrated northeast and then to the northwest. We also characterized changes in the proportion of habitats varying in suitability in the study area and the average elevation in areas with suitable habitat (Figure 9). Under SSP126, the area of suitable habitat first increased and then decreased; under SSP245, SSP370, and SSP585, the area of suitable habitat decreased. The average elevation of suitable habitat generally increased under the different climate scenarios. The relative proportions of habitats varying in suitability are shown in Supplementary Figure 3.
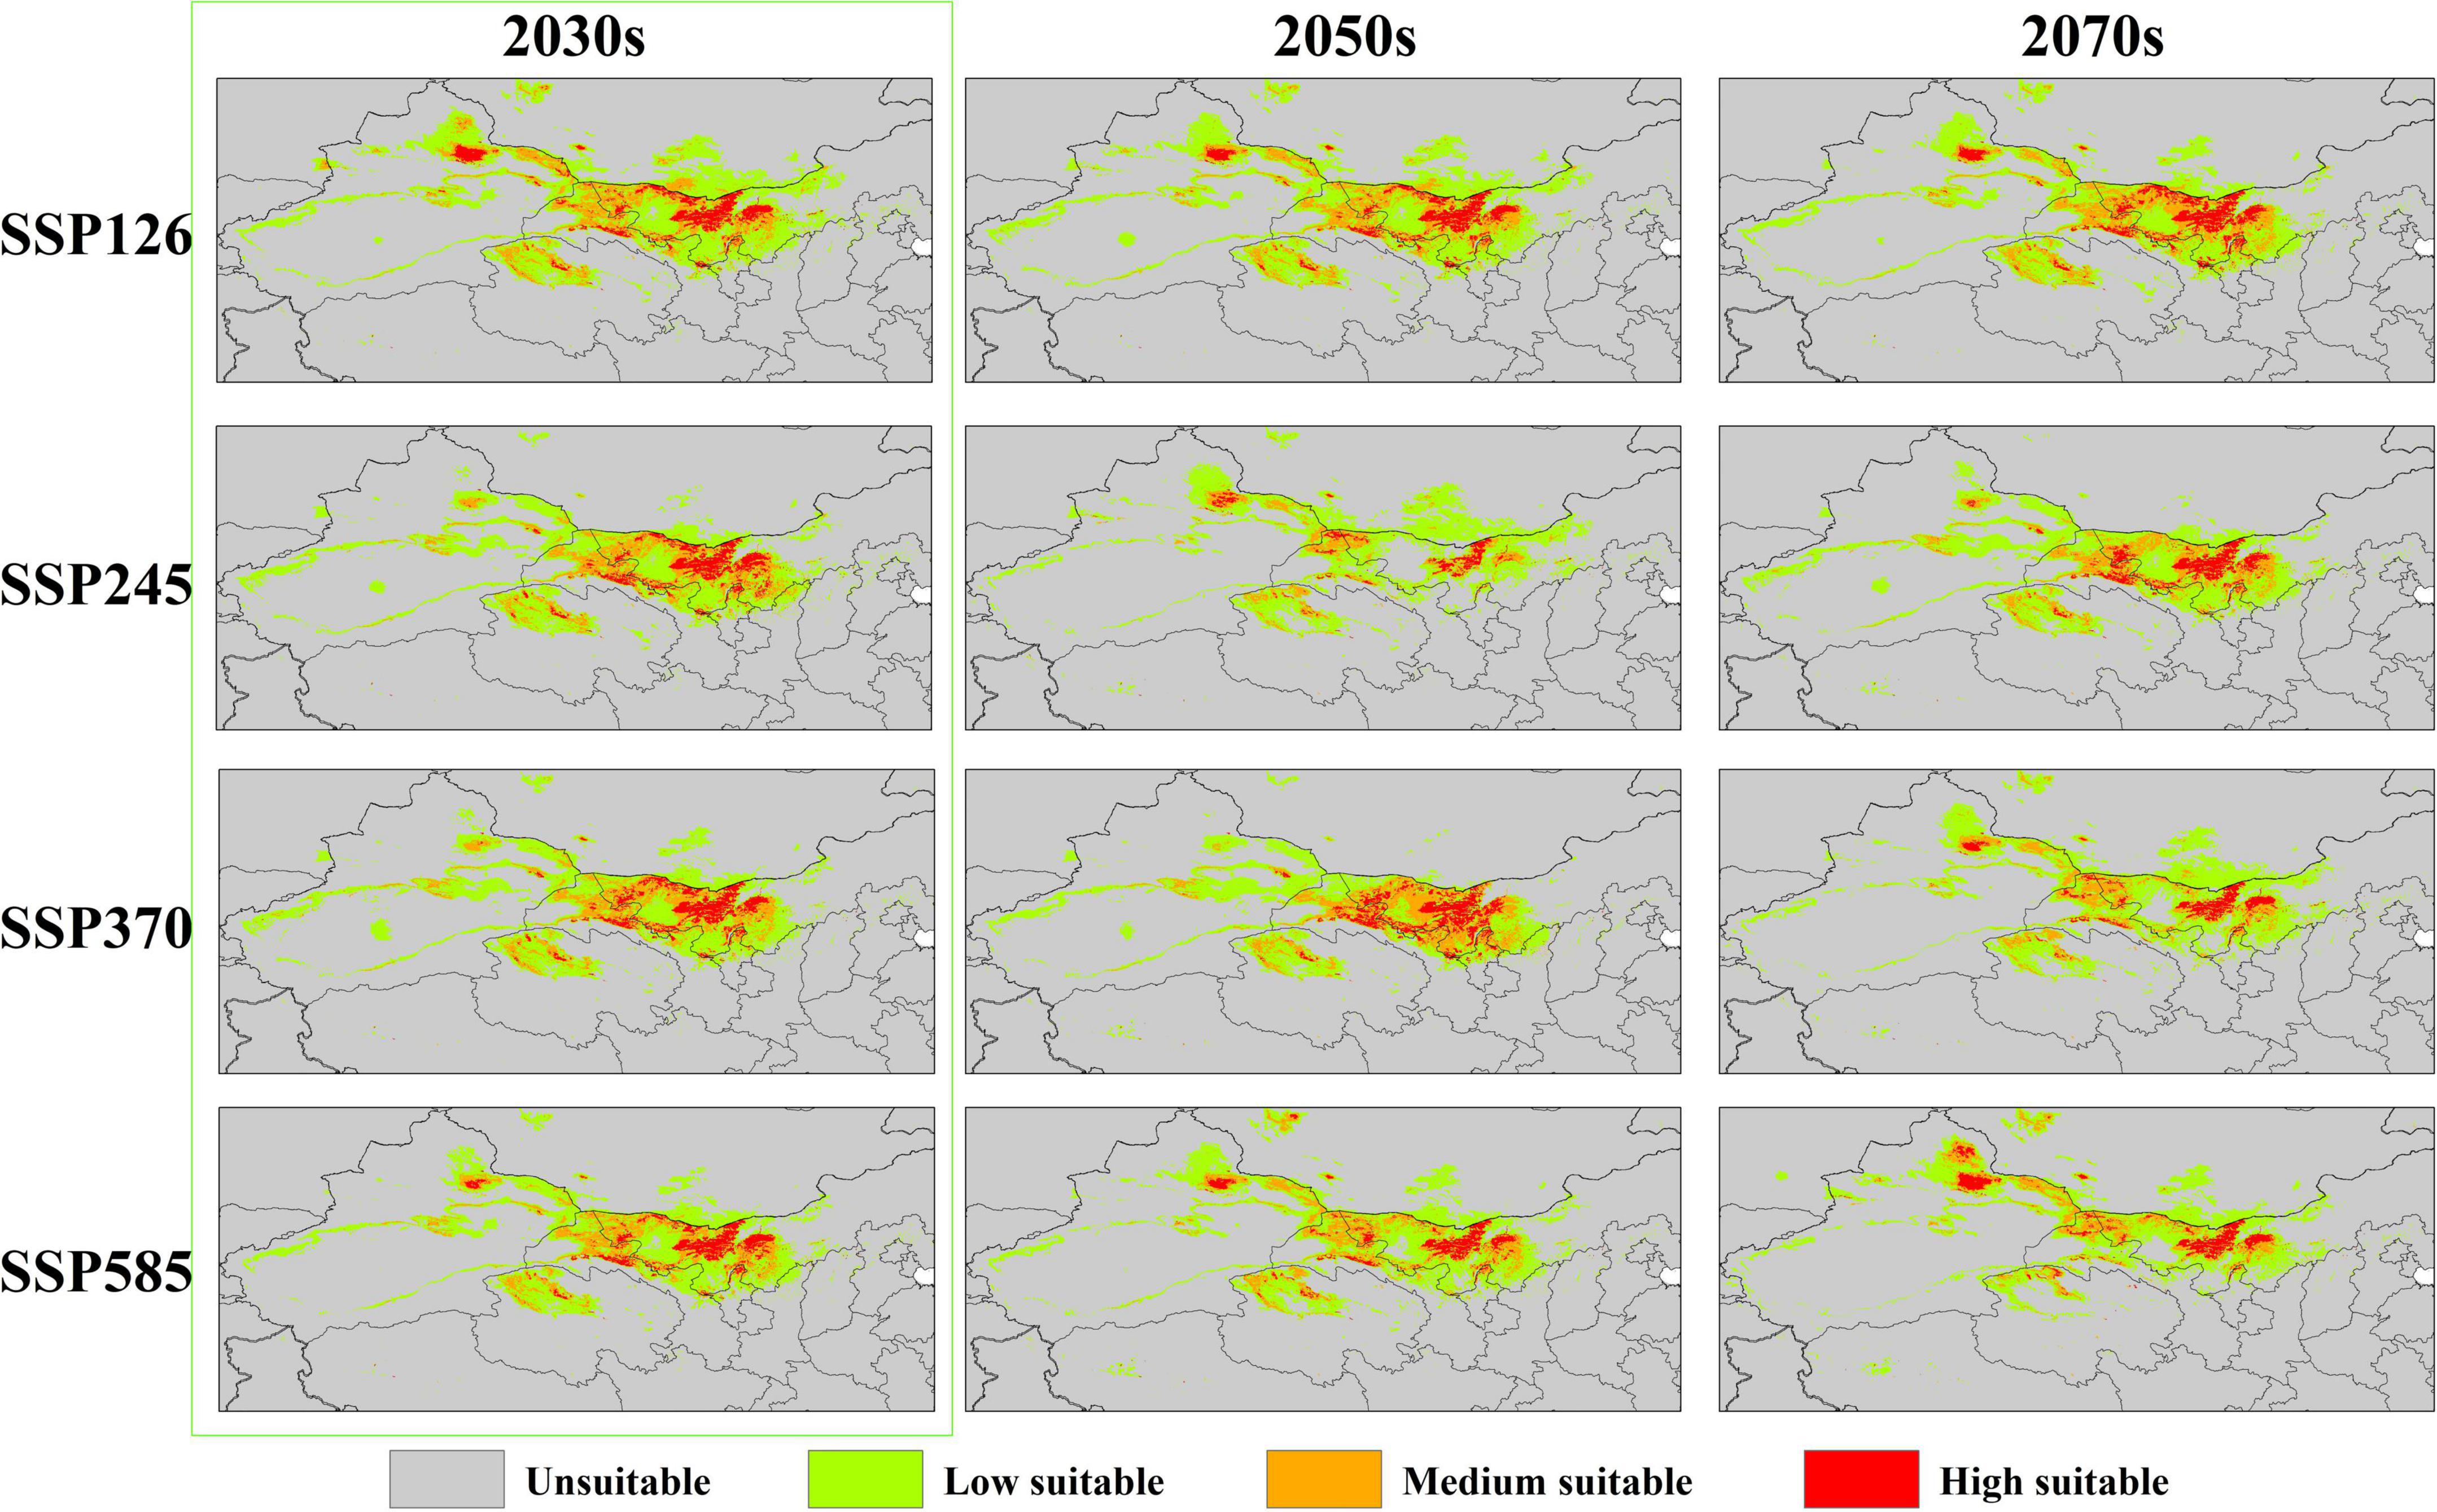
Figure 6. The suitable habitat of A. variabilis in China under current climate conditions.
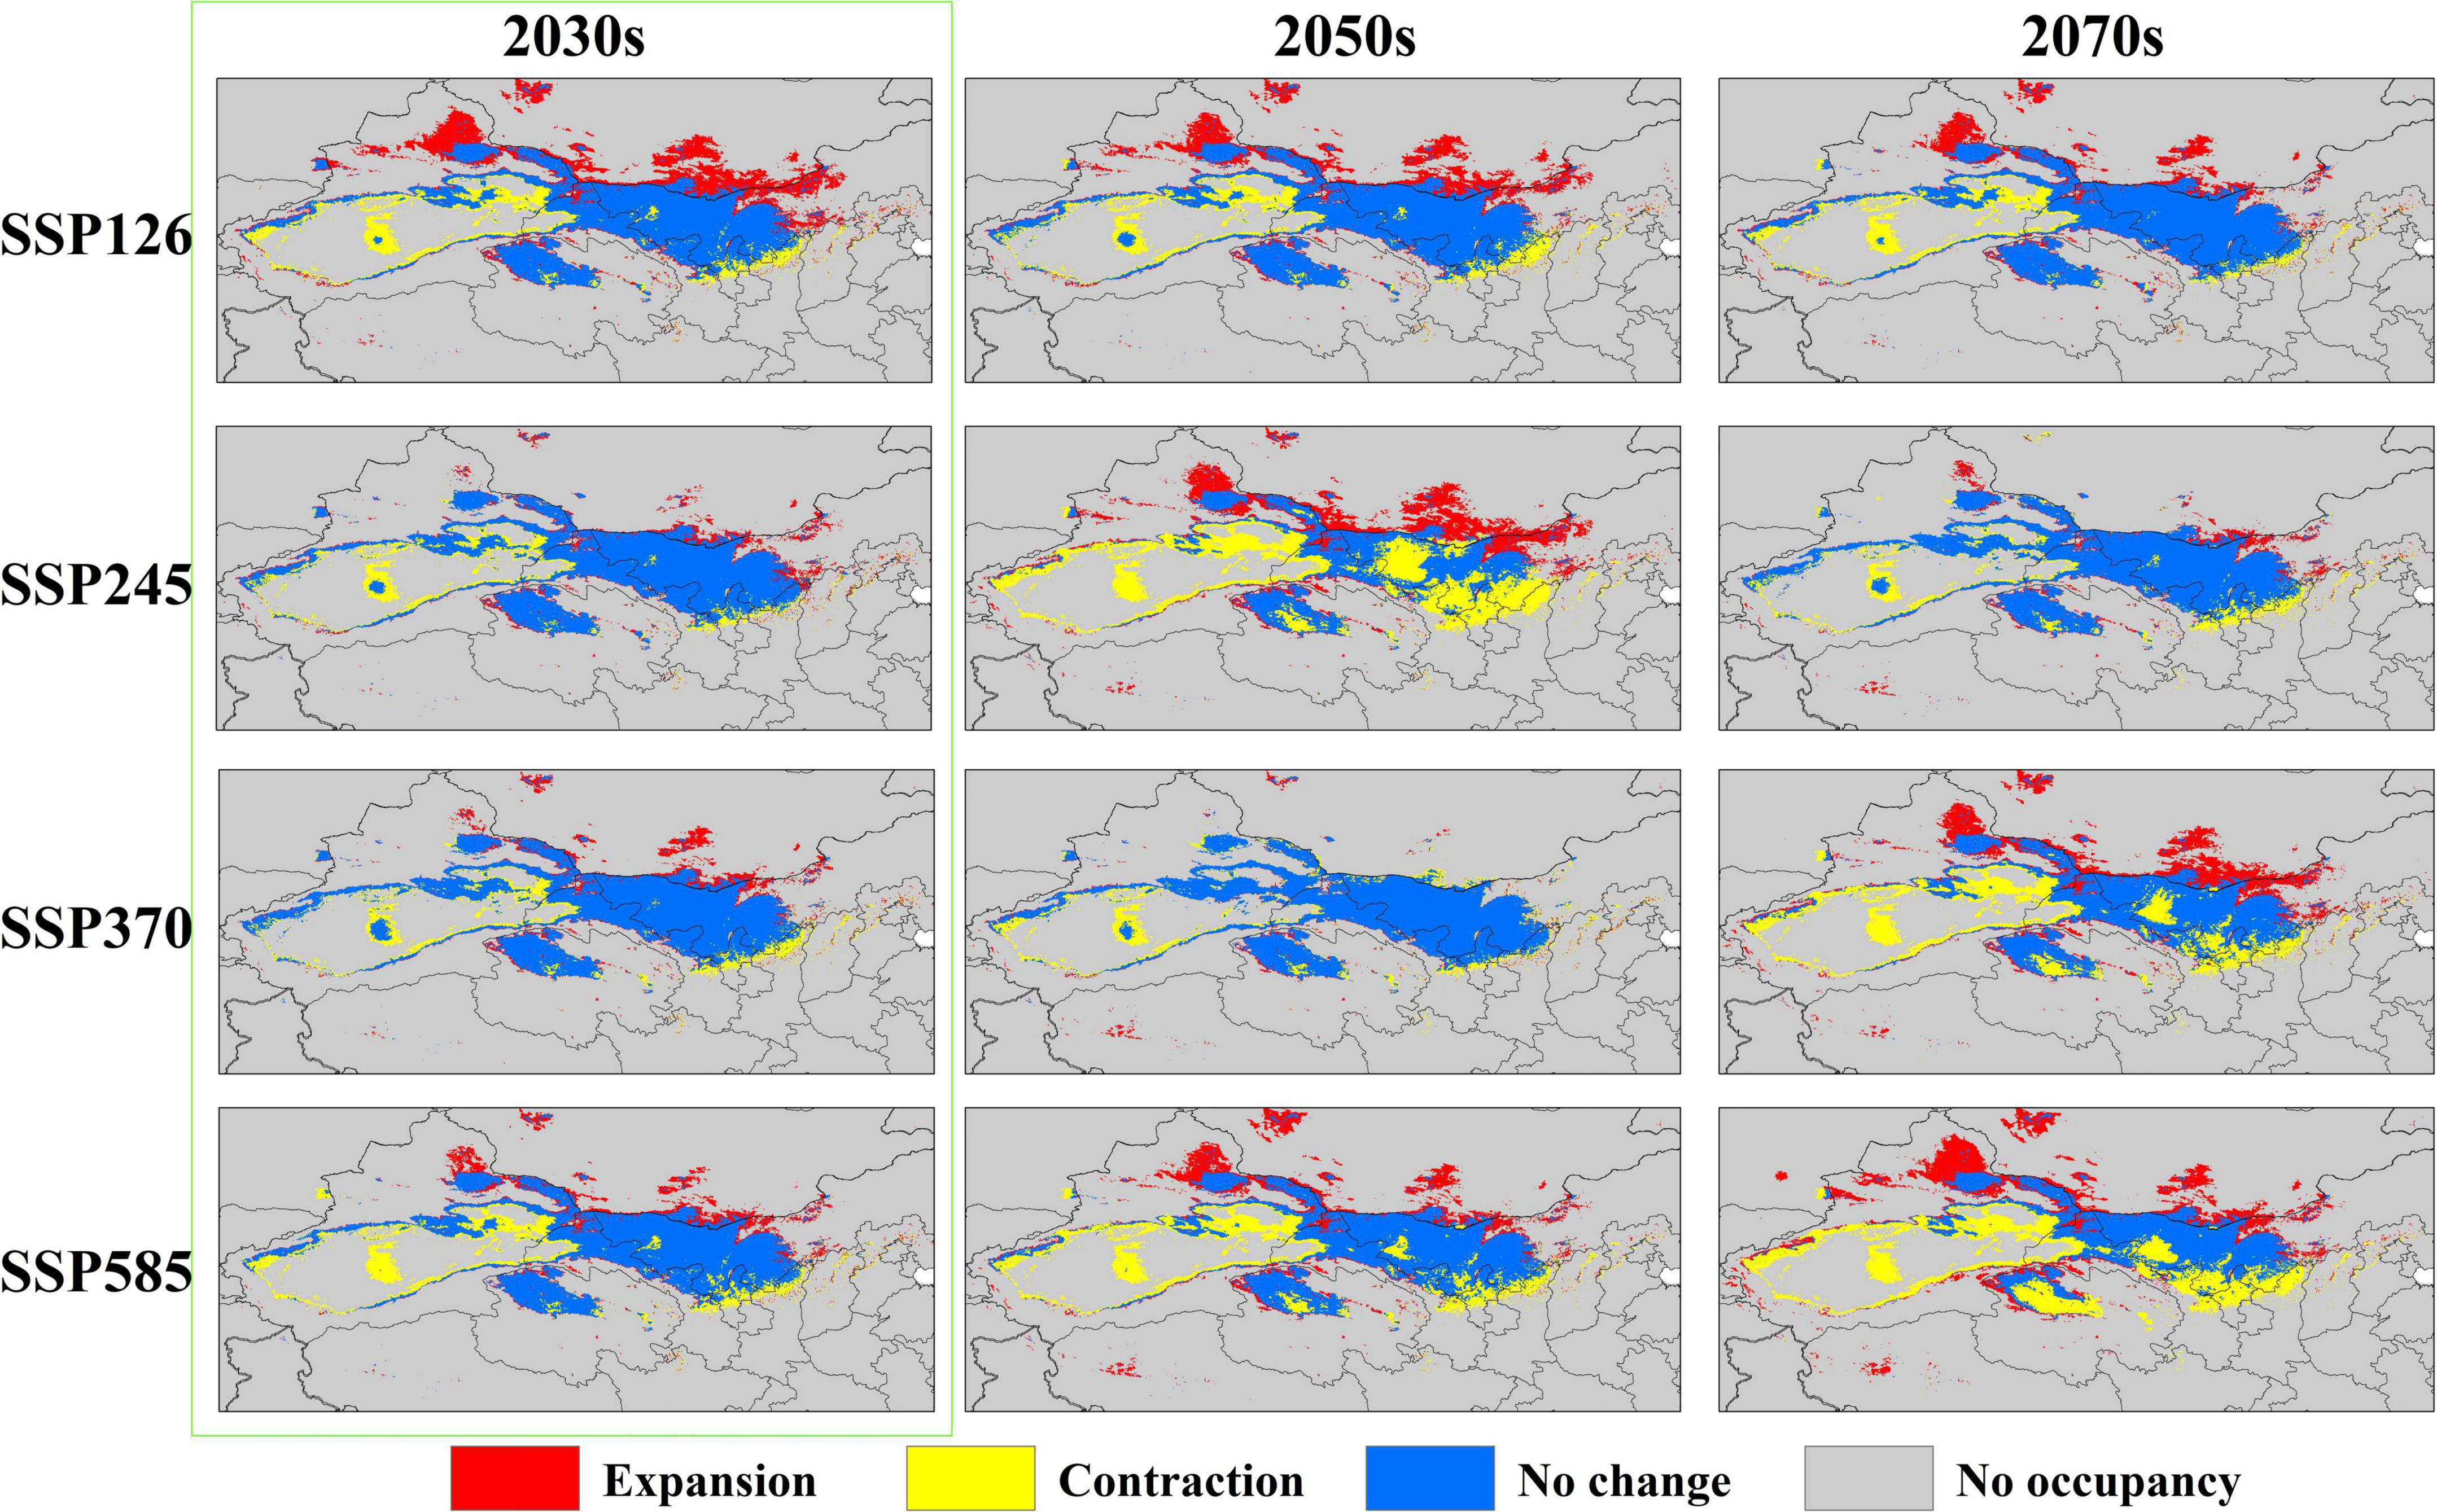
Figure 7. Changes in the area of suitable habitat of A. variabilis in China under different future climate conditions relative to that under current climate conditions.
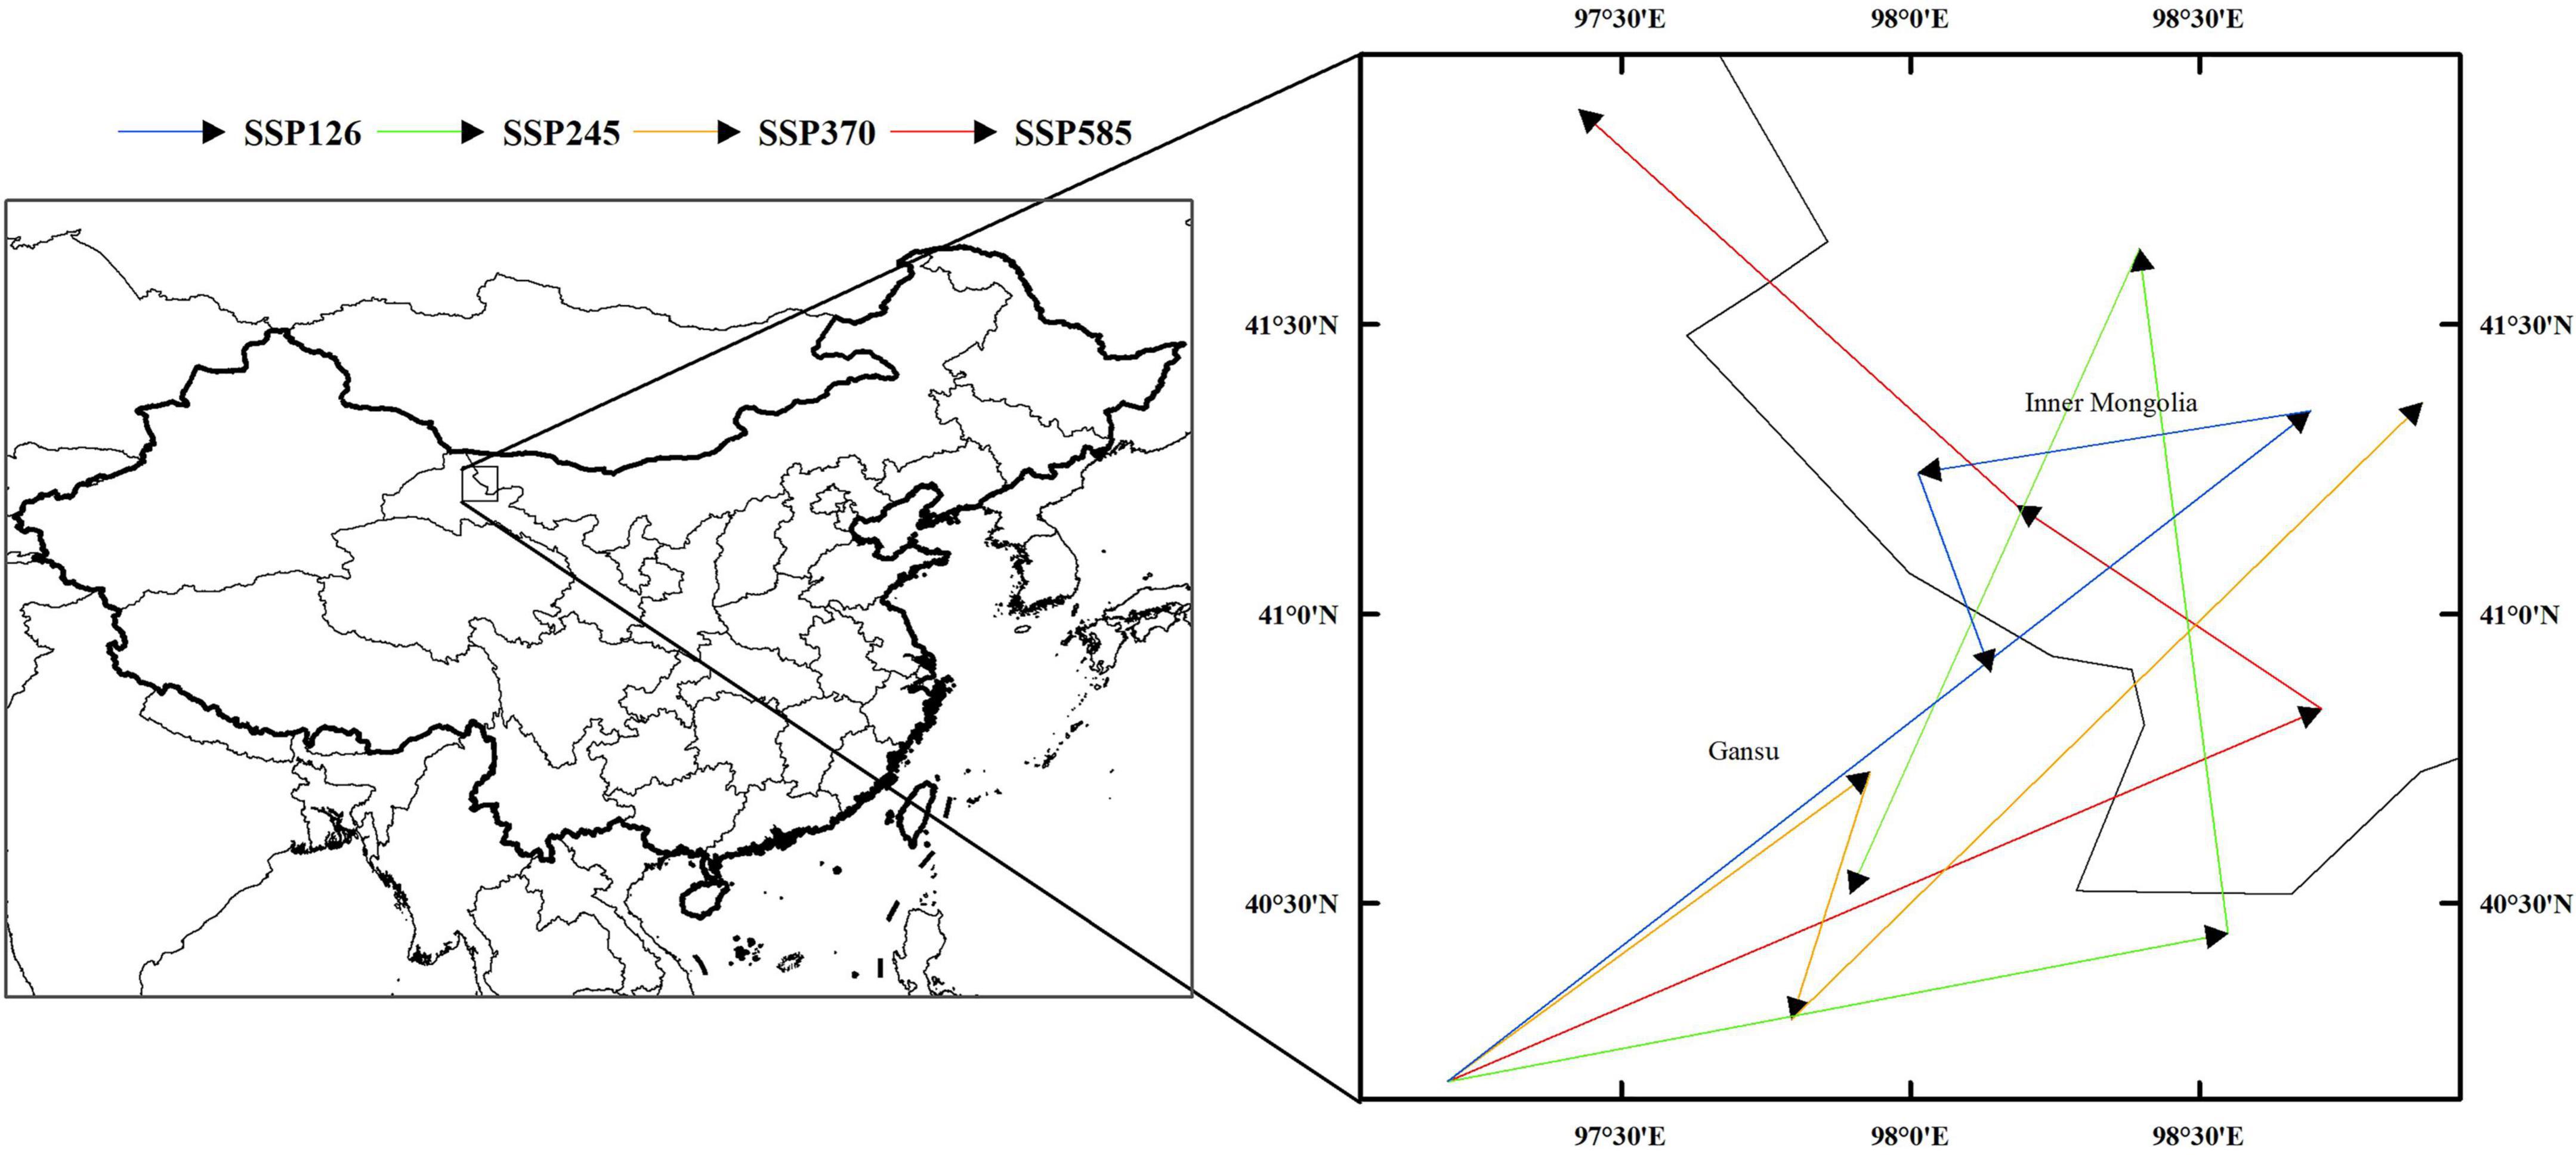
Figure 8. Migration of the centroid of suitable habitat of A. variabilis in China.
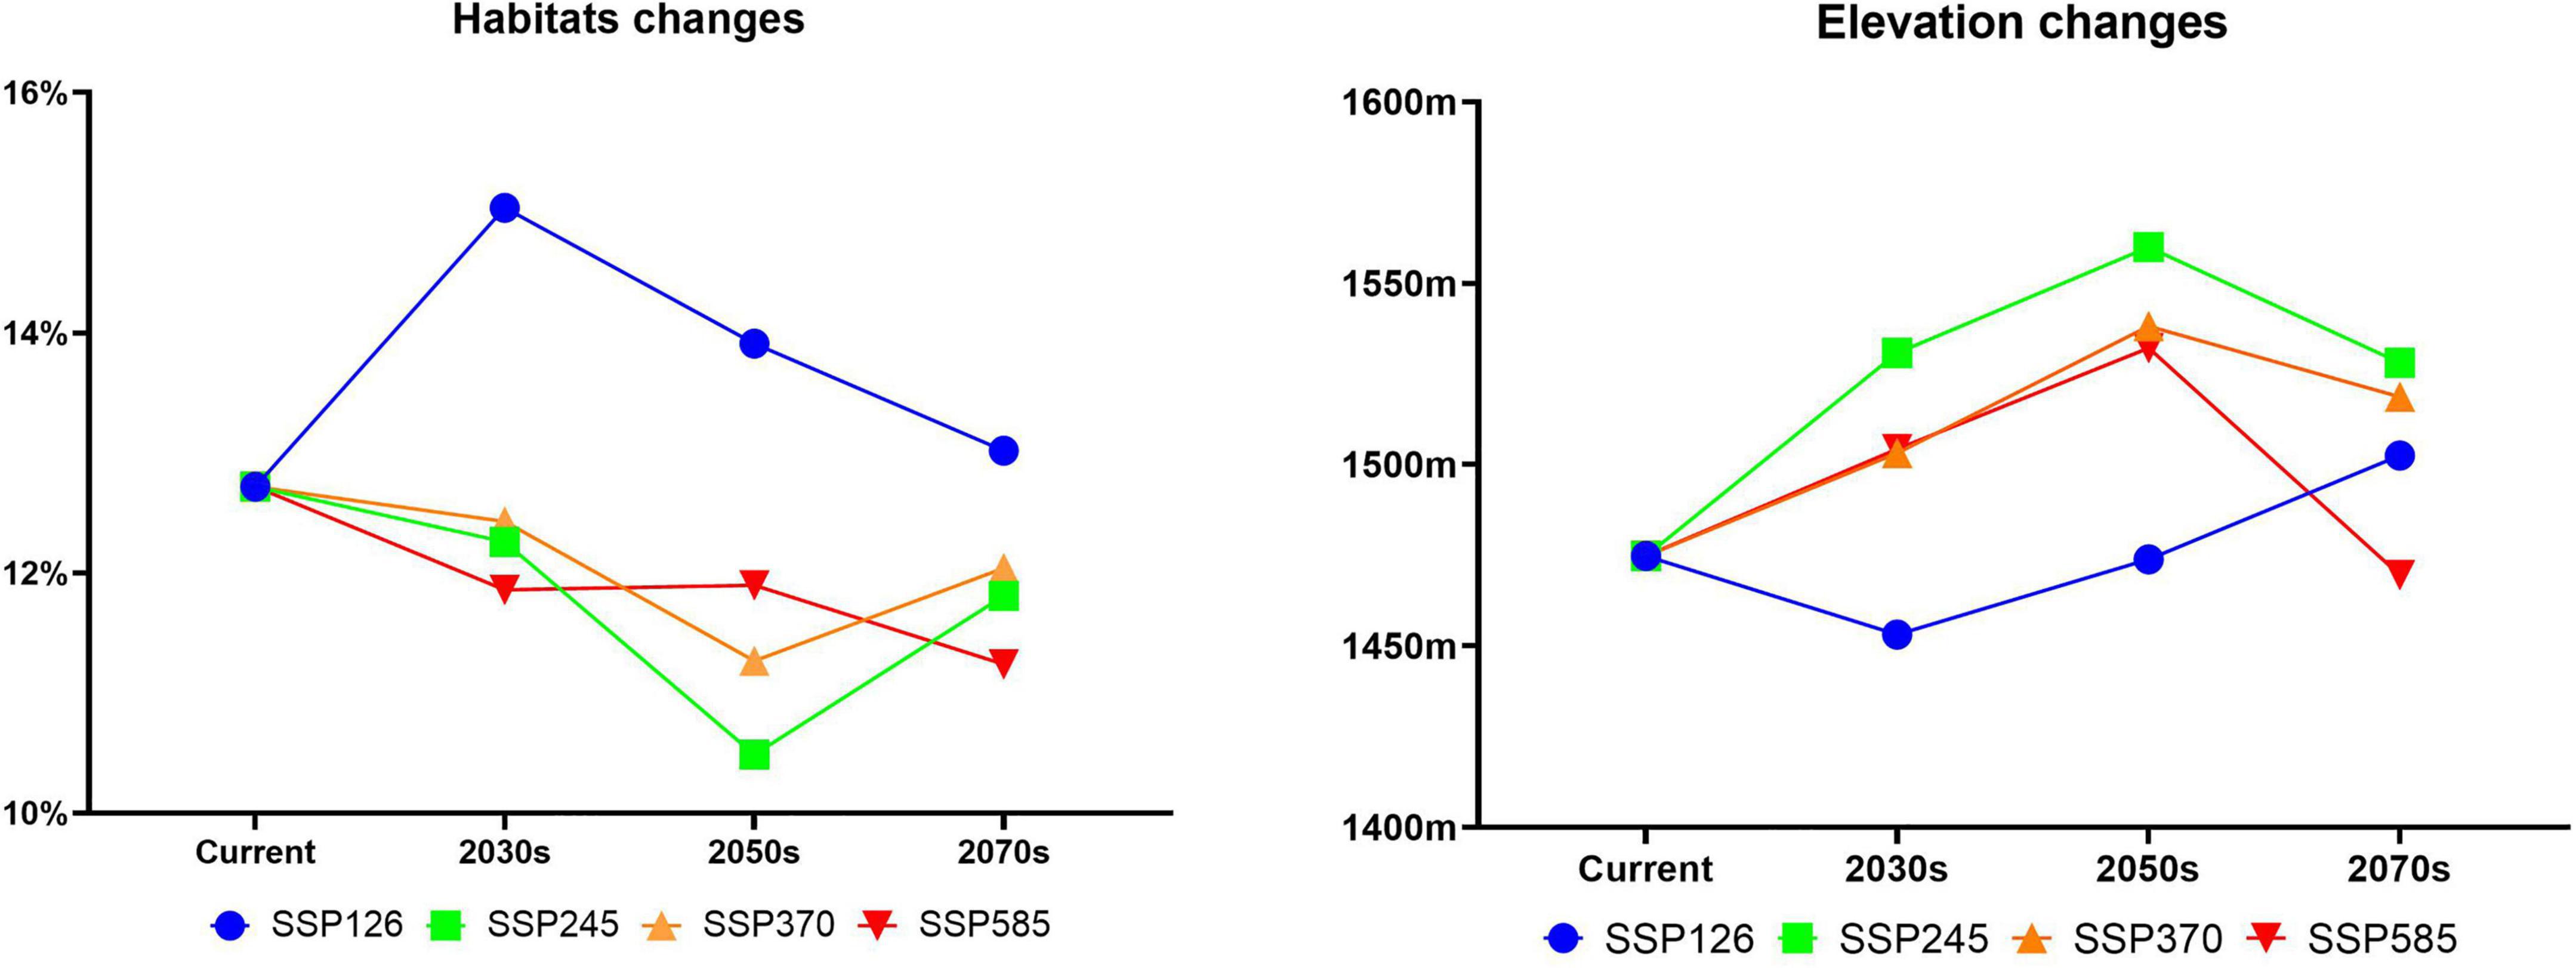
Figure 9. Changes in the relative proportions and average elevation of suitable habitat of A. variabilis in China.
Astragalus variabilis is one of the main locoweeds that induces significant losses to the animal husbandry industry in northwest China. In this study, we used optimized MaxEnt models to (1) predict the distribution of suitable habitat of A. variabilis under current and future climate conditions; (2) analyze the key environmental variables affecting the distribution of A. variabilis; and (3) analyze the correlation between the occurrence of animal poisoning and habitat suitability for A. variabilis. The findings of this study provide valuable information that will aid the management of A. variabilis.
In studies aimed at predicting the area of suitable habitat of species, only models with good performance have high confidence. The main methods currently used for evaluating the robustness of MaxEnt models include threshold-independent measurement, threshold-dependent measurement, model transfer performance, and visual evaluation (Kong et al., 2019). The use of multiple evaluation metrics as opposed to a single evaluation metric is becoming increasingly common for evaluating the performance of SDMs (Lei et al., 2015). We used AUC, TSS, CBI, visual evaluation, and other metrics to comprehensively evaluate the robustness of our model, and all of these metrics indicated that our model was reliable.
Environmental factors affect plant growth and development and also restrict the distribution of plant species (Thuiller, 2007). Previous studies have shown that A. variabilis is highly adaptable to arid environments with low temperatures and barren soils (Dong et al., 2003; Yao et al., 2013; Wang Q. H. et al., 2021). In this study, the response curves indicated that A. variabilis is well adapted to environments with low precipitation (bio19, prec6), cold (tmax2), and nutrient-poor soils (t_oc, t_teb). According to the Flora of China, A. variabilis grows on dry riverbeds or Gobi sandy soils in desert areas ranging from 900 to 3,100 m in elevation (Editorial Committee of Chinese Flora, C.A.O.S., 2006). This is generally consistent with our suitable ranges for altitude and soil type. The overall response curve of t_ph was above the MTSPS threshold, which might stem from the fact that the contribution rate of t_ph to the model was low; consequently, the response curve may not consistent with actual observations. However, this also indicated that A. variabilis is tolerant of soil acidity and alkalinity. In addition, the response curves of bio7 and bio15 revealed that A. variabilis is highly tolerant of high annual mean temperature differences and precipitation seasonality. No studies to date have evaluated the effects of soil pH, annual mean temperature difference, and precipitation seasonality on A. variabilis; thus, additional studies are needed to confirm these possibilities.
Suitable habitat of A. variabilis under current climate conditions was mainly distributed in central and western Inner Mongolia, Ningxia, central and northwestern Gansu, central and northwestern Qinghai, and the four basins around the Tianshan Mountains in Xinjiang. These findings are consistent with the known geographical distribution of A. variabilis (Zhou et al., 2013; Guo et al., 2021). Global climate change (including changes in temperature and precipitation patterns) has induced major changes in the growth, morphological characteristics, distribution, and area of global vegetation (Rosenzweig et al., 2008). Several studies have examined the impact of climate change on species distributions. More than half of Europe’s 1,350 plant species are expected to be vulnerable or threatened by the 2080s due to climate change (Thuiller et al., 2005). In recent decades, a northward expansion of various plant species has been observed in Europe, including an increase in the abundance of thermophilic plant species compared with 30 years ago and a marked decrease in hardy plant species, which most likely stems from warmer temperatures (Woldearegay, 2020). In Vermont, United States, the limits of the northern hardwood–boreal forest ecotone moved 91–115 m upslope between 1962 and 2005 (Beckage et al., 2008). In Canada, the suitable habitats for four tree species are predicted to shift significantly to higher latitudes and altitudes (Flower et al., 2013). Leymus racemosus is distributed in the Junggar Basin, Xinjiang, China. The area of suitable habitat of this species is expected to decrease in the future, and its distribution is expected to move northwest and to higher altitudes (Zhang R. et al., 2022). A decrease in suitable habitat in China over the next 80 years and a northward shift in the area of suitable habitat have also been predicted for Astragali radix, a plant distributed in arid and semi-arid areas of China and with similar growth characteristics to A. variabilis (Peng and Guo, 2017). Our results show that the suitable habitat of A. variabilis will move to high latitudes and high altitudes under various future climate scenarios. This is consistent with previous research suggesting that the distributions of most species will shift to higher latitudes and elevations as global warming intensifies (Lenoir et al., 2008). Temperature is the most important environmental factor affecting the distribution of A. variabilis (Figure 3 and Table 4). Under future global warming, the distribution of A. variabilis is predicted to migrate to high latitudes and high altitudes because the temperatures in these regions are lower compared with regions at low latitude and low alitutude. The area of suitable habitat of A. variabilis is predicted to decrease under all scenarios with the exception of SSP126. This might stem from variation in the magnitude of climate change under different SSP scenarios. Carbon emissions are lowest under SSP126 among all scenarios, and the magnitude of change in precipitation patterns was relatively insignificant. The increase in temperature and precipitation in northwest China due to climate change (Wang C. H. et al., 2021) likely explains the decrease in suitable habitat, as A. variabilis prefers dry environments and cooler temperatures. The reduction in the area of suitable habitat for A. variabilis could be a benefit to the livestock industry, as this would result in fewer livestock poisoning incidents. However, this would only provide a benefit if other suitable forages could replace A. variabilis in areas where it is expected to disappear. Indeed, an absence of ecologically equivalent species to replace A. variabilis in such areas might exacerbate the desertification of desert steppe.
Locoweed is one of the main poisonous weeds impeding the development of the animal husbandry industry, especially in developing countries, as livestock poisoning incidents have been frequently reported in recent years (Cook et al., 2017; Martinez et al., 2019; Reis et al., 2019). This might stem at least in part from the lack of investment by local governments in the control of poisonous weeds. The US livestock industry lost hundreds of millions of dollars to livestock poisoning caused by poisonous weeds in the 1980s (Panter et al., 2007). Subsequently, the United States government invested heavily in campaigns aimed at the control of poisonous weeds and established the Institute of Poisonous Plants, which specializes in the study of poisonous weed species in natural grasslands, assessment of toxic disasters, and research on technology for the diagnosis and control of poisoning diseases (Welch et al., 2012; Fu et al., 2019). As a consequence of these efforts, there are now few reports of livestock poisoning incidents in the United States. For countries with less capital for investment, controlling high-risk areas could be a cost-effective approach. Historical records and field investigations are the only tools available in China for the identification of priority areas for focused control efforts. MaxEnt models have been widely used in recent years for rare species requiring protection (Cao et al., 2020), the control of pests and diseases (Wakie et al., 2020), and the control of invasive species (Herrando-Moraira et al., 2020). These models, which can be developed using freely available software, require only occurrence records and environmental data to make predictions. This software is relatively user-friendly. Recently, the habitat suitability output of the MaxEnt model was confirmed to be related to the alkaloid content in medicinal plants, and this information can be used to enhance the quality of medicinal plants (Li et al., 2020). We hoped to use the MaxEnt model to prevent livestock poisoning incidents caused by A. variabilis. This hypothesis predicts a correlation between animal poisoning and habitat suitability. The results of the correlation analysis supported this hypothesis, as the frequency of livestock poisoning incidents was higher in areas with higher habitat suitability.
Many studies have investigated approaches to prevent the poisoning of livestock by A. variabilis. For example, physical and chemical approaches can be used to eliminate A. variabilis; however, these control methods can have deleterious effects on the environment (Yao et al., 2013). Biological methods that involve facilitating the colonization of other plants to replace A. variabilis have also been explored; however, this approach is difficult to implement, and it can often take a long time before positive effects are observed (Ralphs et al., 2007). The administration of preventive medicine for livestock in high-risk areas is a simple and effective strategy (Zhao et al., 2010). We used the next 20 years (2030s) as an example for discussing the prevention and control of livestock poisoning. Changes in the area of suitable habitat of A. variabilis were observed in the 2030s under all four SSP scenarios, as indicated by the green marked boxes in Figures 6, 7. The least favorable scenario was SSP124; under this scenario, suitable habitats expanded greatly in the Jungar Basin in Xinjiang and Bayannaoer, Baotou, and Ulanqab in Inner Mongolia. Highly suitable habitats were widely distributed in the Jungar Basin of Xinjiang and Alxa Left Banner and Bayannaoer City in Inner Mongolia. More preventive measures will need to be implemented in the pastoral areas of the Jungar Basin in Xinjiang and Bayannaoer City in Inner Mongolia in the 2030s. The prevention and control of livestock poisoning has always been a major focus in the Alxa Zuoqi area of Inner Mongolia. We propose that a locoweed detoxification site be established in the Alxa Zuoqi area because this area has long had abundant Astragalus resources, and pasture is often lacking due to drought. A. variabilis can be harvested for detoxification and used as feed, whereas other drought-tolerant plants can be artificially planted to improve the grassland environment.
MaxEnt models can predict the suitable distribution of species under future climate change scenarios; it is thus an important tool for simulating the distribution of suitable habitats of species (Zhao et al., 2021). Although MaxEnt models have high accuracy, this does not mean that the predicted suitable area is always completely consistent with the actual distribution of species (Gebrewahid et al., 2020). The distribution of poisonous weeds is not only affected by climate, topography, and soil factors but also by other factors such as reproduction and pollination type, interactions between species, social development, and human activities. With our current technology, some of these factors are difficult to quantify; others cannot be forecasted and thus incorporated into models. In addition, predictions of future events are always vulnerable to some degree of uncertainty, and the error in predictions is related to how far in the future predictions are made. Changes in suitable habitat merit increased attention in habitat modeling studies. Despite their many assumptions and uncertainties, SDMs are a key tool for predicting the area of suitable habitat of species under future conditions (Wiens et al., 2009).
In future studies, a greater number of environmental factors lacking future data, such as the normalized vegetation index (NDVI), solar radiation, wind speed, and water vapor pressure, can be used to build models to predict the current distribution of suitable habitat and evaluate the consistency between the predicted and actual distribution of species. How the distributions of other locoweed species in natural grasslands might be altered under future climate change remains unclear. The similarity in the ecological niches of these locoweed plants also requires clarification.
Our optimized MaxEnt model made robust predictions of the suitable habitat of A. variabilis. The average maximum temperature of February (tmax 2), precipitation of June (prec 6), and topsoil organic carbon (t_oc) were the most important environmental variables affecting the area of suitable habitat, which is consistent with its cold resistance, drought tolerance, and tolerance for barren soils. The area of suitable habitat of A. variabilis was predicted to decrease under all scenarios with the exception of SSP126. Under the four SSP climate scenarios, the suitable habitat of A. variabilis is predicted to shift to higher latitudes and altitudes. Our findings have implications for the prevention and control of poisonous plants as well as the maintenance of the ecological balance of grassland ecosystems.
The original contributions presented in this study are included in the article/Supplementary material, further inquiries can be directed to the corresponding author/s.
BZ contributed to the study conception and design, agreement to be accountable for all aspects of the work related to the accuracy and integrity of any part of the work, and approval of the final version. RH substantially contributed to the study conception and design, data acquisition, analysis, and interpretation, and drafting and revision of the manuscript for intellectual content. HD, YW, CZ, and MZ contributed to data acquisition and analysis. HL contributed to revising the manuscript. CW contributed to agreement to be accountable for all aspects of the work related to the accuracy or integrity of any part of the work. All authors contributed to the article and approved the submitted version.
This work was supported by the grants from the National Natural Science Foundation (No. 32072928).
The authors declare that the research was conducted in the absence of any commercial or financial relationships that could be construed as a potential conflict of interest.
All claims expressed in this article are solely those of the authors and do not necessarily represent those of their affiliated organizations, or those of the publisher, the editors and the reviewers. Any product that may be evaluated in this article, or claim that may be made by its manufacturer, is not guaranteed or endorsed by the publisher.
The Supplementary Material for this article can be found online at: https://www.frontiersin.org/articles/10.3389/fpls.2022.921310/full#supplementary-material
Aidoo, O. F., Souza, P. G. C., da Silva, R. S., Santana, P. A. Jr., Picanco, M. C., Kyerematen, R., et al. (2022). Climate-induced range shifts of invasive species (Diaphorina citri Kuwayama). Pest Manag. Sci. 78, 2534–2549. doi: 10.1002/ps.6886
Aiello-Lammens, M. E., Boria, R. A., Radosavljevic, A., Vilela, B., and Anderson, R. P. (2015). spThin: An R package for spatial thinning of species occurrence records for use in ecological niche models. Ecography 38, 541–545. doi: 10.1111/ecog.01132
Allouche, O., Tsoar, A., and Kadmon, R. (2006). Assessing the accuracy of species distribution models: Prevalence, kappa and the true skill statistic (TSS). J. Appl. Ecol. 43, 1223–1232. doi: 10.1111/j.1365-2664.2006.01214.x
Beckage, B., Osborne, B., Gavin, D. G., Pucko, C., Siccama, T., and Perkins, T. (2008). A rapid upward shift of a forest ecotone during 40 years of warming in the Green Mountains of Vermont. Proc. Natl. Acad. Sci. U.S.A. 105, 4197–4202. doi: 10.1073/pnas.0708921105
Bellard, C., Bertelsmeier, C., Leadley, P., Thuiller, W., and Courchamp, F. (2012). Impacts of climate change on the future of biodiversity. Ecol. Lett. 15, 365–377. doi: 10.1111/j.1461-0248.2011.01736.x
Boria, R. A., and Blois, J. L. (2018). The effect of large sample sizes on ecological niche models: Analysis using a North American rodent, Peromyscus maniculatus. Ecol. Model. 386, 83–88. doi: 10.1016/j.ecolmodel.2018.08.013
Boyce, M. S., Vernier, P. R., Nielsen, S. E., and Schmiegelow, F. K. A. (2002). Evaluating resource selection functions. Ecol. Model. 157, 281–300. doi: 10.1016/S0304-3800(02)00200-4
Brown, J. L., Bennett, J. R., and French, C. M. (2017). SDMtoolbox 2.0: The next generation Python-based GIS toolkit for landscape genetic, biogeographic and species distribution model analyses. Peerj 5:e4095. doi: 10.7717/peerj.4095
Cao, B., Bai, C. K., Xue, Y., Yang, J. J., Gao, P. F., Liang, H., et al. (2020). Wetlands rise and fall: Six endangered wetland species showed different patterns of habitat shift under future climate change. Sci. Total Environ. 731:138518. doi: 10.1016/j.scitotenv.2020.138518
Cong, M., Xu, Y., Tang, L., Yang, W., and Jian, M. (2020). Predicting the dynamic distribution of Sphagnum bogs in China under climate change since the last interglacial period. PLoS One 15:e0230969. doi: 10.1371/journal.pone.0230969
Cook, D., Gardner, D. R., Lee, S. T., Pfister, J. A., Stonecipher, C. A., and Welsh, S. L. (2016). A swainsonine survey of North American Astragalus and Oxytropis taxa implicated as locoweeds. Toxicon 118, 104–111. doi: 10.1016/j.toxicon.2016.04.033
Cook, D., Gardner, D. R., Welch, K. D., and Allen, J. G. (2017). A survey of swainsonine content in Swainsona species. Rangel. J. 39, 213–218. doi: 10.1071/Rj16088
Dong, Q., Zhao, B. Y., Tong, D. W., Ge, P. B., Hasibatu, Da, N. T., et al. (2003). Poisonous weeds investigation on natural grassland in Alashan prefecture. Pratacultural Sci. 6, 50–53. doi: 10.3969/j.issn.1001-0629.2003.06.015
Editorial Committee of Chinese Flora, C.A.O.S. (2006). Flora of China Vol.42 Division 1 Leguminosae. Beijing: Science Press.
Elith, J., Phillips, S. J., Hastie, T., Dudik, M., Chee, Y. E., and Yates, C. J. (2011). A statistical explanation of MaxEnt for ecologists. Divers. Distrib. 17, 43–57. doi: 10.1111/j.1472-4642.2010.00725.x
Farrell, A., Wang, G. M., Rush, S. A., Martin, J. A., Belant, J. L., Butler, A. B., et al. (2019). Machine learning of large-scale spatial distributions of wild turkeys with high-dimensional environmental data. Ecol. Evol. 9, 5938–5949. doi: 10.1002/ece3.5177
Fick, S. E., and Hijmans, R. J. (2017). WorldClim 2: New 1-km spatial resolution climate surfaces for global land areas. Int. J. Climatol. 37, 4302–4315. doi: 10.1002/joc.5086
Flower, A., Murdock, T. Q., Taylor, S. W., and Zwiers, F. W. (2013). Using an ensemble of downscaled climate model projections to assess impacts of climate change on the potential distribution of spruce and Douglas-fir forests in British Columbia. Environ. Sci. Policy 26, 63–74. doi: 10.1016/j.envsci.2012.07.024
Fois, M., Cuena-Lombrana, A., Fenu, G., and Bacchetta, G. (2018). Using species distribution models at local scale to guide the search of poorly known species: Review, methodological issues and future directions. Ecol. Model. 385, 124–132. doi: 10.1016/j.ecolmodel.2018.07.018
Franco, A. C. S., Lorini, M. L., Minsky, E. M. C., Figueiredo, M. S. L., and Santos, L. N. (2022). Far beyond the Amazon: Global distribution, environmental suitability, and invasive potential of the two most introduced peacock bass. Biol. Invasions 24, 2851–2872. doi: 10.1007/s10530-022-02814-6
Fu, J., Guo, Y., Huang, W., Guo, R., Lu, H., Wu, C., et al. (2019). The distribution of locoweed in natural grassland in the United State and the current status and prospects of research on animal poisoning. Acta Agrestia Sin. 27, 519–530. doi: 10.11733/j.issn.1007-0435.2019.03.000
Galante, P. J., Alade, B., Muscarella, R., Jansa, S. A., Goodman, S. M., and Anderson, R. P. (2018). The challenge of modeling niches and distributions for data-poor species: A comprehensive approach to model complexity. Ecography 41, 726–736. doi: 10.1111/ecog.02909
Gebrewahid, Y., Abrehe, S., Meresa, E., Eyasu, G., Abay, K., Gebreab, G., et al. (2020). Current and future predicting potential areas of Oxytenanthera abyssinica (A. Richard) using MaxEnt model under climate change in Northern Ethiopia. Ecol. Process. 9:6. doi: 10.1186/s13717-019-0210-8
Guisan, A., and Zimmermann, N. E. (2000). Predictive habitat distribution models in ecology. Ecol. Model. 135, 147–186. doi: 10.1016/S0304-3800(00)00354-9
Guisan, A., Graham, C. H., Elith, J., Huettmann, F., and Distri, N. S. (2007). Sensitivity of predictive species distribution models to change in grain size. Divers. Distrib. 13, 332–340. doi: 10.1111/j.1472-4642.2007.00342.x
Guo, R., Guo, Y. Z., Wang, S., Yang, C., Su, Y. X., Wu, C. C., et al. (2021). Adcances in research on poisonous plants and grazing livestock poisoning diseases of Natural Grassland in China. Acta Veterinaria et Zootechnica Sinica 52, 1171–1185. doi: 10.11843/j.issn.0366-6964.2021.05.004
Herrando-Moraira, S., Vitales, D., Nualart, N., Gomez-Bellver, C., Ibanez, N., Masso, S., et al. (2020). Global distribution patterns and niche modelling of the invasive Kalanchoe x houghtonii (Crassulaceae). Sci. Rep. 10:3143. doi: 10.1038/s41598-020-60079-2
Hirzel, A. H., Le Lay, G., Helfer, V., Randin, C., and Guisan, A. (2006). Evaluating the ability of habitat suitability models to predict species presences. Ecol. Model. 199, 142–152. doi: 10.1016/j.ecolmodel.2006.05.017
Huang, S., Yang, H., Su, C., and Chang, Z. (2018). The leaf micro-morphological features of Astragalus Sect. Trachycersis Bunge from China. Acta Botanica Boreali-Occidentalia Sinica 38, 1646–1658.
Jiang, R. P., Zou, M., Qin, Y., Tan, G. D., Huang, S. P., Quan, H. G., et al. (2022). Modeling of the potential geographical distribution of three Fritillaria species under climate change. Front. Plant Sci. 12:749838. doi: 10.3389/fpls.2021.749838
Jimenez-Valverde, A. (2012). Insights into the area under the receiver operating characteristic curve (AUC) as a discrimination measure in species distribution modelling. Glob. Ecol. Biogeogr. 21, 498–507. doi: 10.1111/j.1466-8238.2011.00683.x
Jung, Y. (2018). Multiple predicting K-fold cross-validation for model selection. J. Nonparametr. Stat. 30, 197–215. doi: 10.1080/10485252.2017.1404598
Kass, J. M., Muscarella, R., Galante, P. J., Bohl, C. L., Pinilla-Buitrago, G. E., Boria, R. A., et al. (2021). ENMeval 2.0: Redesigned for customizable and reproducible modelling of species’ niches and distributions. Methods Ecol. Evol. 12, 1602–1608. doi: 10.1111/2041-210x.13628
Kong, W. Y., Li, X. H., and Zou, H. F. (2019). Optimizing MaxEnt model in the prediction of species distribution. Chin. J. Appl. Ecol. 30, 2116–2128. doi: 10.13287/j.1001-9332.201906.029
Landis, J. R., and Koch, G. G. (1977). The measurement of observer agreement for categorical data. Biometrics 33, 159–174.
Lei, J., Xu, H., Wu, J., Guan, Q., Ding, H., and Cui, P. (2015). Advance in predicting the suitable habitat of species under future climate change. Sichuan J. Zool. 35, 794–800. doi: 10.11984/j.issn.1000-7083.20140487
Lenoir, J., Gegout, J. C., Marquet, P. A., de Ruffray, P., and Brisse, H. (2008). A significant upward shift in plant species optimum elevation during the 20th century. Science 320, 1768–1771. doi: 10.1126/science.1156831
Li, D., Li, Z., Liu, Z., Yang, Y., Khoso, A. G., Wang, L., et al. (2022). Climate change simulations revealed potentially drastic shifts in insect community structure and crop yields in China’s farmland. J. Pest Sci. 1–15. doi: 10.1007/s10340-022-01479-3
Li, J. J., Fan, G., and He, Y. (2020). Predicting the current and future distribution of three Coptis herbs in China under climate change conditions, using the MaxEnt model and chemical analysis. Sci. Total Environ. 698:134141. doi: 10.1016/j.scitotenv.2019.134141
Liu, C. R., Newell, G., and White, M. (2016). On the selection of thresholds for predicting species occurrence with presence-only data. Ecol. Evol. 6, 337–348. doi: 10.1002/ece3.1878
Liu, C. R., White, M., and Newell, G. (2013). Selecting thresholds for the prediction of species occurrence with presence-only data. J. Biogeogr. 40, 778–789. doi: 10.1111/jbi.12058
Liu, X., Liu, H. Y., Gong, H. B., Lin, Z. S., and Lv, S. C. (2017). Appling the one-class classification method of maxent to detect an invasive plant Spartina alterniflora with time-series analysis. Remote Sens. 9:1120. doi: 10.3390/rs9111120
Lu, H., Cao, D. D., Ma, F., Wang, S. S., Yang, X. W., Wang, W. L., et al. (2014). Characterisation of locoweeds and their effect on livestock production in the western rangelands of China: A review. Rangel. J. 36, 121–131. doi: 10.1071/Rj13105
Lu, H., Chen, J. P., Lu, W., Ma, Y., Zhao, B. Y., and Wang, J. Y. (2012). Isolation and identification of swainsonine-producing fungi found in locoweeds and their rhizosphere soil. Afr. J. Microbiol. Res. 6, 4959–4969. doi: 10.5897/Ajmr11.1572
Luo, M., Wang, H., and Lyu, Z. (2017). Evaluating the performance of species distribution models Biomod2 and MaxEnt using the giant panda distribution data. Chin. J. Appl. Ecol. 28, 4001–4006. doi: 10.13287/j.1001-9332.201712.011
Lv, Y., Wang, R. H., and Cai, Z. Y. (2009). Climate change and its influence on arid and semi-arid area of China. J. Arid Land Resour. Environ. 23, 65–71.
Mahatara, D., Acharya, A. K., Dhakal, B. P., Sharma, D. K., Ulak, S., and Paudel, P. (2021). Maxent modelling for habitat suitability of vulnerable tree Dalbergia latifolia in Nepal. Silva Fennica 55:10441.
Martinez, A., Lauroua, C., Borrelli, L. B., Gardner, D. R., and Robles, C. A. (2019). Spontaneous outbreak of Astragalus pehuenches (Fabaceae) poisoning in cattle in Argentina. Toxicon 157, 84–86. doi: 10.1016/j.toxicon.2018.11.303
Muscarella, R., Galante, P. J., Soley-Guardia, M., Boria, R. A., Kass, J. M., Uriarte, M., et al. (2014). ENMeval: An R package for conducting spatially independent evaluations and estimating optimal model complexity for MAXENT ecological niche models. Methods Ecol. Evol. 5, 1198–1205. doi: 10.1111/2041-210x.12261
O’Connor, B., Bojinski, S., Roosli, C., and Schaepman, M. E. (2020). Monitoring global changes in biodiversity and climate essential as ecological crisis intensifies. Ecol. Inform. 55:101033. doi: 10.1016/j.ecoinf.2019.101033
Panda, R. M., and Behera, M. D. (2019). Assessing harmony in distribution patterns of plant invasions: A case study of two invasive alien species in India. Biodivers. Conserv. 28, 2245–2258. doi: 10.1007/s10531-018-1640-9
Panter, K. E., Gardner, D., Lee, S., Pfister, J., Ralphs, M., Stegelmeier, B., et al. (2007). Important poisonous plants of the United States. Vet. Toxicol. 66, 825–866. doi: 10.1016/B978-012370467-2/50163-2
Peng, L., and Guo, Y. (2017). Geographical distribution of Astragali radix and prediction of its suitable area in China. J. Sichuan Agric. Univ. 35, 60–68. doi: 10.16036/j.issn.1000-2650.2017.01.009
Phillips, S. J., and Dudik, M. (2008). Modeling of species distributions with Maxent: New extensions and a comprehensive evaluation. Ecography 31, 161–175. doi: 10.1111/j.0906-7590.2008.5203.x
Phillips, S. J., Anderson, R. P., and Schapire, R. E. (2006). Maximum entropy modeling of species geographic distributions. Ecol. Model. 190, 231–259. doi: 10.1016/j.ecolmodel.2005.03.026
Phillips, S. J., Dudik, M., Elith, J., Graham, C. H., Lehmann, A., Leathwick, J., et al. (2009). Sample selection bias and presence-only distribution models: Implications for background and pseudo-absence data. Ecol. Appl. 19, 181–197. doi: 10.1890/07-2153.1
Podlech, D. (1986). Taxonomic and phytogeographical problems in Astragalus of the Old World and South-West Asia. Proc. R. Soc. Edinburgh, Sec B Biol. Sci. 89, 37–43.
Radosavljevic, A., and Anderson, R. P. (2014). Making better MAXENT models of species distributions: Complexity, overfitting and evaluation. J. Biogeogr. 41, 629–643. doi: 10.1111/jbi.12227
Ralphs, M. H., Monaco, T. A., Valdez, J. R., and Graham, D. (2007). Seeding cool-season grasses to suppress white locoweed (Oxytropis sericea) reestablishment and increase forage production. Weed Technol. 21, 661–669. doi: 10.1614/WT-06-162.1
Ranjbar, M., and Karamian, R. (2003). Some remarks on the genus Astragalus sect. Incani in Iran. Bot. J. Linn. Soc. 143, 443–447. doi: 10.1111/j.1095-8339.2003.00215.x
Reis, M. O., Cruz, R. A. S., Oliveira, L. G. S., Bassuino, D. M., Schwertz, C. I., Bianchi, M. V., et al. (2019). Hydrallantois in cows naturally poisoned by Sida carpinifolia in Brazil. J. Vet. Diagn. Invest. 31, 581–584. doi: 10.1177/1040638719850610
Riahi, K., van Vuuren, D. P., Kriegler, E., Edmonds, J., O’Neill, B. C., Fujimori, S., et al. (2017). The shared socioeconomic pathways and their energy, land use, and greenhouse gas emissions implications: An overview. Glob. Environ. Change Hum. Policy Dimens. 42, 153–168. doi: 10.1016/j.gloenvcha.2016.05.009
Rosenzweig, C., Karoly, D., Vicarelli, M., Neofotis, P., Wu, Q. G., Casassa, G., et al. (2008). Attributing physical and biological impacts to anthropogenic climate change. Nature 453, 353–U320. doi: 10.1038/nature06937
Shi, N., Naudiyal, N., Wang, J. N., Gaire, N. P., Wu, Y., Wei, Y. Q., et al. (2022). Assessing the Impact of climate change on potential distribution of Meconopsis punicea and its influence on ecosystem services supply in the southeastern margin of qinghai-tibet plateau. Front. Plant Sci. 12:830119. doi: 10.3389/fpls.2021.830119
Shi, X. D., Yin, Q., Sang, Z. Y., Zhu, Z. L., Jia, Z. K., and Ma, L. Y. (2021). Prediction of potentially suitable areas for the introduction of Magnolia wufengensis under climate change. Ecol. Indic. 127:107762. doi: 10.1016/j.ecolind.2021.107762
Shi, X. L., Chen, X. L., Dai, Y. W., and Hu, G. Q. (2020). Climate sensitivity and feedbacks of BCC-CSM to idealized CO(2)forcing from CMIP5 to CMIP6. J. Meteorol. Res. 34, 865–878. doi: 10.1007/s13351-020-9204-9
Sillero, N. (2011). What does ecological modelling model? A proposed classification of ecological niche models based on their underlying methods. Ecol. Model. 222, 1343–1346. doi: 10.1016/j.ecolmodel.2011.01.018
Stocker, T. F. (2013). Climate change. The closing door of climate targets. Science 339, 280–282. doi: 10.1126/science.1232468
Tao, Y., Niu, D., Li, F., Zuo, S., Sun, Q., and Xu, C. (2020). Effects of Ensiling Oxytropis glabra with whole-plant corn at different proportions on fermentation quality, Alkaloid Swainsonine Content, and Lactic Acid Bacteria Populations. Animals (Basel) 10:1733. doi: 10.3390/ani10101733
Thuiller, W. (2007). Biodiversity - Climate change and the ecologist. Nature 448, 550–552. doi: 10.1038/448550a
Thuiller, W., Lavorel, S., Araujo, M. B., Sykes, M. T., and Prentice, I. C. (2005). Climate change threats to plant diversity in Europe. Proc. Natl. Acad. Sci. U.S. A. 102, 8245–8250. doi: 10.1073/pnas.0409902102
Wakie, T. T., Neven, L. G., Yee, W. L., and Lu, Z. Z. (2020). The establishment risk of Lycorma delicatula (Hemiptera: Fulgoridae) in the United States and Globally. J. Econ. Entomol. 113, 306–314. doi: 10.1093/jee/toz259
Wan, J. N., Mbari, N. J., Wang, S. W., Liu, B., Mwangi, B. N., Rasoarahona, J. R. E., et al. (2021). Modeling impacts of climate change on the potential distribution of six endemic baobab species in Madagascar. Plant Diver. 43, 117–124. doi: 10.1016/j.pld.2020.07.001
Wang, C. H., Zhang, S. N., Zhang, F. M., Li, K. C., and Yang, K. (2021). On the increase of precipitation in the Northwestern China Under the Global Warming. Adv. Earth Sci. 36, 980–989.
Wang, Q. H., Chen, C., Pang, Z., Li, C., Wang, D. J., Ma, Q. C., et al. (2021). The role of the locoweed (Astragalus variabilis Bunge) in improving the soil properties of desert grasslands. Rangel. J. 43, 47–54. doi: 10.1071/Rj20028
Wang, S. S., Lu, H., Zhou, H. C., Da, N. T., Wang, W. L., and Zhao, B. Y. (2015). Pathological research on spontaneous Astrugalus variabilis intoxication of goats. Chin. J. Vet. Sci. 35, 292–296. doi: 10.16303/j.cnki.1005-4545.2015.02.023
Warren, D. L., Glor, R. E., and Turelli, M. (2010). ENMTools: A toolbox for comparative studies of environmental niche models. Ecography 33, 607–611. doi: 10.1111/j.1600-0587.2009.06142.x
Warren, D. L., Wright, A. N., Seifert, S. N., and Shaffer, H. B. (2014). Incorporating model complexity and spatial sampling bias into ecological niche models of climate change risks faced by 90 California vertebrate species of concern.. Divers. Distrib. 20, 334–343. doi: 10.1111/ddi.12160
Welch, K. D., Lee, S. T., Cook, D., Gardner, D. R., and Pfister, J. A. (2018). Chemical analysis of plants that poison livestock: Successes, challenges, and opportunities. J. Agric. Food Chem. 66, 3308–3314. doi: 10.1021/acs.jafc.8b00337
Welch, K. D., Panter, K. E., Gardner, D. R., and Stegelmeier, B. L. (2012). The good and the bad of poisonous plants: An introduction to the USDA-ARS poisonous plant research laboratory. J. Med. Toxicol. 8, 153–159. doi: 10.1007/s13181-012-0215-5
Wieder, W., Boehnert, J., Bonan, G., and Langseth, M. (2014). Regridded harmonized world soil database v1. 2. Oak Ridge: ORNL DAAC.
Wiens, J. A., Stralberg, D., Jongsomjit, D., Howell, C. A., and Snyder, M. A. (2009). Niches, models, and climate change: Assessing the assumptions and uncertainties. Proc. Natl. Acad. Sci. U.S.A. 106, 19729–19736. doi: 10.1073/pnas.0901639106
Wisz, M. S., Hijmans, R. J., Li, J., Peterson, A. T., Graham, C. H., Guisan, A., et al. (2008). Effects of sample size on the performance of species distribution models. Divers. Distrib. 14, 763–773. doi: 10.1111/j.1472-4642.2008.00482.x
Woldearegay, M. (2020). Climate change impacts on the distribution and phenology of plants: A review. Trop. Plant Res. 7, 196–204. doi: 10.22271/tpr.2020.v7.i1.025
Xu, W., Du, Q., Yan, S., Cao, Y., Liu, X., Guan, D. X., et al. (2021). Geographical distribution of As-hyperaccumulator Pteris vittata in China: Environmental factors and climate changes. Sci. Total Environ. 803:149864. doi: 10.1016/j.scitotenv.2021.149864
Yang, H., Jiang, Z. H., and Li, L. (2016). Biases and improvements in three dynamical downscaling climate simulations over China. Clim. Dyn. 47, 3235–3251. doi: 10.1007/s00382-016-3023-9
Yao, J., Feng, H., Yuan, Y., Wei, Y., and Huang, X. (2013). Research progress on grassland poisonous weed Astragalus variabilis. Chin. J. Grassl. 35, 110–115
Zeng, Y. W., Wei, L. B., and Yeo, D. C. J. (2016). Novel methods to select environmental variables in MaxEnt: A case study using invasive crayfish. Ecol. Model. 341, 5–13. doi: 10.1016/j.ecolmodel.2016.09.019
Zhang, K. L., Yao, L. J., Meng, J. S., and Tao, J. (2018). Maxent modeling for predicting the potential geographical distribution of two peony species under climate change. Sci. Total Environ. 634, 1326–1334. doi: 10.1016/j.scitotenv.2018.04.112
Zhang, L., Zhang, Y., Ma, S., Zhang, D., and He, L. (2022). Distribution pattern and driving mechanisms of the sand plant Leymus racemosus in the Junggar Basin. Arid Zone Res. 39, 863–871.
Zhang, R., Zhang, M., Yan, Y., Chen, Y., Jiang, L., Wei, X., et al. (2022). Promoting the development of Astragalus mongholicus Bunge Industry in Guyang County (China) Based on MaxEnt and remote sensing. Front. Plant Sci. 13:908114. doi: 10.3389/fpls.2022.908114
Zhao, B. Y., Wang, J. J., Tan, C. J., Fan, Z. F., and Wang, Y. C. (2006). Isolation and identification of poisonous constituent swainsonine from Astragalus variabilis Bunge. Chin. J. Grassl. 28, 66–71.
Zhao, B., Dong, Q., Shi, Z., Mo, C., and Wang, K. (2010). The comparative research of preventing locoweed poisoning between fengcaoling detoxication slow release pill and Locoweed toxin vaccine. J. Northwest Univ. 40, 1020–1025.
Zhao, Y. C., Zhao, M. Y., Zhang, L., Wang, C. Y., and Xu, Y. L. (2021). Predicting possible distribution of tea (Camellia sinensis L.) under climate change scenarios using MaxEnt model in China. Agricu. Basel 11:1122. doi: 10.3390/agriculture11111122
Keywords: locoweed, MaxEnt, climate change, habitat suitability, livestock poisoning control and prevention
Citation: Huang R, Du H, Wen Y, Zhang C, Zhang M, Lu H, Wu C and Zhao B (2022) Predicting the distribution of suitable habitat of the poisonous weed Astragalus variabilis in China under current and future climate conditions. Front. Plant Sci. 13:921310. doi: 10.3389/fpls.2022.921310
Received: 15 April 2022; Accepted: 23 August 2022;
Published: 09 September 2022.
Edited by:
Martina Stromvik, McGill University, CanadaReviewed by:
Jaime Bosch, Complutense University of Madrid, SpainCopyright © 2022 Huang, Du, Wen, Zhang, Zhang, Lu, Wu and Zhao. This is an open-access article distributed under the terms of the Creative Commons Attribution License (CC BY). The use, distribution or reproduction in other forums is permitted, provided the original author(s) and the copyright owner(s) are credited and that the original publication in this journal is cited, in accordance with accepted academic practice. No use, distribution or reproduction is permitted which does not comply with these terms.
*Correspondence: Chenchen Wu, MjAxMjExMDA1MEBud2FmdS5lZHUuY24=; Baoyu Zhao, emhhb2Jhb3l1MTIwMDVAbndhZnUuZWR1LmNu
Disclaimer: All claims expressed in this article are solely those of the authors and do not necessarily represent those of their affiliated organizations, or those of the publisher, the editors and the reviewers. Any product that may be evaluated in this article or claim that may be made by its manufacturer is not guaranteed or endorsed by the publisher.
Research integrity at Frontiers
Learn more about the work of our research integrity team to safeguard the quality of each article we publish.