
94% of researchers rate our articles as excellent or good
Learn more about the work of our research integrity team to safeguard the quality of each article we publish.
Find out more
ORIGINAL RESEARCH article
Front. Plant Sci., 24 June 2022
Sec. Crop and Product Physiology
Volume 13 - 2022 | https://doi.org/10.3389/fpls.2022.921130
This article is part of the Research TopicThe Role of Nitrate in Plant Response to Biotic and Abiotic StressView all 8 articles
 Changchun Guo1,2Xiaojuan Yuan1,2Fengjun Yan1,2Kaihong Xiang1,2Yunxia Wu1,2Qiao Zhang1,2Zhonglin Wang1,2Limei He1,2Ping Fan1,2Zhiyuan Yang1,2Zongkui Chen1,2Yongjian Sun1,2*
 Jun Ma1,2*
Chalkiness, which is highly affected by nitrogen (N) management during grain filling, is critical in determining rice appearance quality and consumer acceptability. We investigated the effects of N application rates 75 (N1), 150 (N2), and 225 (N3) kg ha−1 on the source-sink carbohydrate accumulation and grain filling characteristics of two indica hybrid rice cultivars with different chalkiness levels in 2019 and 2020. We further explored the relationship between grain filling and formation of chalkiness in superior and inferior grains. In this study, carbohydrates in the functional leaves and grains of the two varieties, and grain filling parameters, could explain 66.2%, 68.0%, 88.7%, and 91.6% of the total variation of total chalky grain rate and whole chalkiness degree, respectively. They were primarily concentrated in the inferior grains. As the N fertilizer application rate increased, the chalky grain rate and chalkiness degree of both the superior and inferior grains decreased significantly. This interfered with the increase in total chalky grain rate and chalkiness. Moreover, the carbohydrate content in the functional leaves increased significantly in N2 and N3 compared with that in N1. The transfer of soluble sugar from the leaves to the grains decreased the soluble sugar and increased total starch contents, accelerated the development of grain length and width, increased grain water content, and effectively alleviated the contradiction between source and sink. These changes promoted the carbohydrate partition in superior and inferior grains, improved their average filling rate in the middle and later stages, optimized the uniformity of inferior grain fillings, and finally led to the overall reduction in rice chalkiness.
As one of the major food staples, rice provides the essential carbohydrate demand for nearly 65% of the population globally (Cantrell and Reeves, 2002; Rao et al., 2014). However, frequent regional or seasonal climate change, rapid population increase, and improvement in living standards have posed significant challenges to the production of high-quality rice (Zhou et al., 2015; Deng et al., 2018; Chen et al., 2021). Therefore, improving rice quality is urgently required.
Rice quality parameters mainly include processing, appearance, cooking, eating, and nutritional quality (Li et al., 2016; Zhu et al., 2017). Among them, appearance is widely considered as one of the critical factors affecting the acceptance of rice by consumers. Chalkiness is the primary index to evaluate the appearance quality of rice. It is not easy to overcome this challenge in rice production (Peng et al., 2014; Yu et al., 2017). Deficient amyloplast and protein development in the endosperm and increased interspaces between the loosely packed starch granules lead to an increase in chalkiness and an overall decline in rice quality (Lisle et al., 2000; Singh et al., 2003; Ishimaru et al., 2009). Its location on or within the endosperm can be categorized into white-belly, white-core, white-back, etc. (Tashiro and Wardlaw, 1991; Ishimaru et al., 2009). At present, evidence suggests that cultivation factors, such as nitrogen (N) application and high temperature, have a significant effect on chalkiness formation (Zhou et al., 2015; Shi et al., 2017; Wada et al., 2019; Chang et al., 2021; Yang et al., 2021; Sun et al., 2022).
N fertilizer is an essential agronomic measure that affects rice growth, yield, and quality (Gu et al., 2015, 2017). An appropriate amount of N fertilizer produces a series of changes in the external morphology and internal physiological characteristics of rice. They include enhancing root activity, leaf color, net photosynthetic rate, nutrient absorption and transport, and the accumulation and redistribution of dry matter weight, which finally results in a marked increase in grain yield (Sun et al., 2012; Zhao and Fitzgerald, 2013; Wei et al., 2017). However, the key role of N fertilizer in rice production is reflected not only in yield but also in rice quality. Rice quality is determined by the starch and protein storage ratio produced by carbon (C) and N metabolism during grain filling. A previous study reported that N application significantly increased the protein content of rice but decreased amylose content (Zhou et al., 2020). The changes in these substances are related to the supply of external cultivation conditions. Previous studies have shown that N application improves the sucrose produced by leaf photosynthesis or starch degradation. These are transported to the storage organ (grain) through the phloem, affecting the speed of grain filling, leading to the increase or decrease in rice chalkiness (Wei et al., 2018; Huang et al., 2019). To date, several studies have investigated the mechanism of rice chalkiness formation from the perspectives of endosperm cell development and nutrient transport, relationship between source and sink supply, and molecular genetic mechanism, and they preliminarily proved that the processes of endosperm cell development, leaf photosynthetic product and grain nutrient input have a significant impact on the development of rice chalkiness (Raju and Srinivas, 1991; Zheng et al., 2012; Xi et al., 2014). In addition, research on the mechanism of chalkiness formation mostly focuses on the activities of key enzymes of carbon metabolism and the accumulation of starch, while studies on grain N metabolism and its product, protein, are relatively lacking. Rice chalkiness is a result of combined action of grain carbon and N metabolism. N metabolism provides the key enzymes for carbon metabolism, while carbon metabolites provide the carbon skeleton and energy necessary for N metabolism. This provides direction to reveal the response of rice chalkiness to N fertilizer. However, in Southwest China, the physiological mechanism underlying decrease in rice chalkiness due to the N fertilizer rate is not fully elucidated.
Therefore, our field experiments were performed using three N fertilizer gradients and two hybrid indica rice varieties with different chalkiness characteristics. The objectives of this study were to: (a) investigate the effects of N application rate on the accumulation of carbohydrates in the functional leaves and caryopsis, grain filling and chalkiness on different chalky rice varieties and (b) assess the relationship between grain filling parameters and the formation of superior and inferior grains chalkiness. We aimed to explore the mechanism of chalkiness formation under different N application rates and provide practical strategies for high-quality rice production.
The field experiment was carried out at Sichuan Agricultural University (103°47′ E, 30°43′ N, and 536.0 m altitude), Sichuan Province, China, from April to October 2019 and 2020. The study site is located in the Chengdu Plain and has a subtropical humid climate, with average annual rainfall of 798.3–1541.0 mm, average annual temperature of 15.7°C–17.7°C, and average annual sunshine of 685.5–1002.9 h. The soil texture is sandy loam, with a robust water-holding capacity and is suitable for rice cultivation. Meteorological data during the basal nutrient content and grouting of farming layer soil are shown in Table 1 and Figure 1. The study material included indica three-line hybrid rice cultivars, Chuannongyou 508 (C1) with high chalkiness and Shuangyou 573 (C2) with low chalkiness. These cultivars were bred by the Rice Research Institute of Sichuan Agricultural University. To ensure that all varieties received the same temperature and light conditions after heading, during the 2 years, the sowing dates of the two varieties were the same, C1 was manually seeded on April 19 and C2 on April 26.
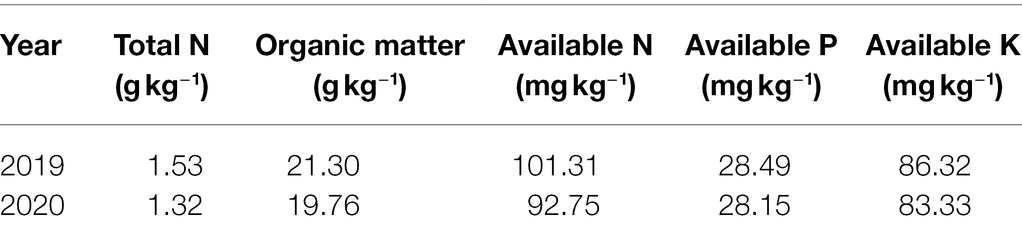
Table 1. Physicochemical characteristics of soil conditions in rice plow layer (0–20 cm) from Wenjiang experimental field in 2019 and 2020.
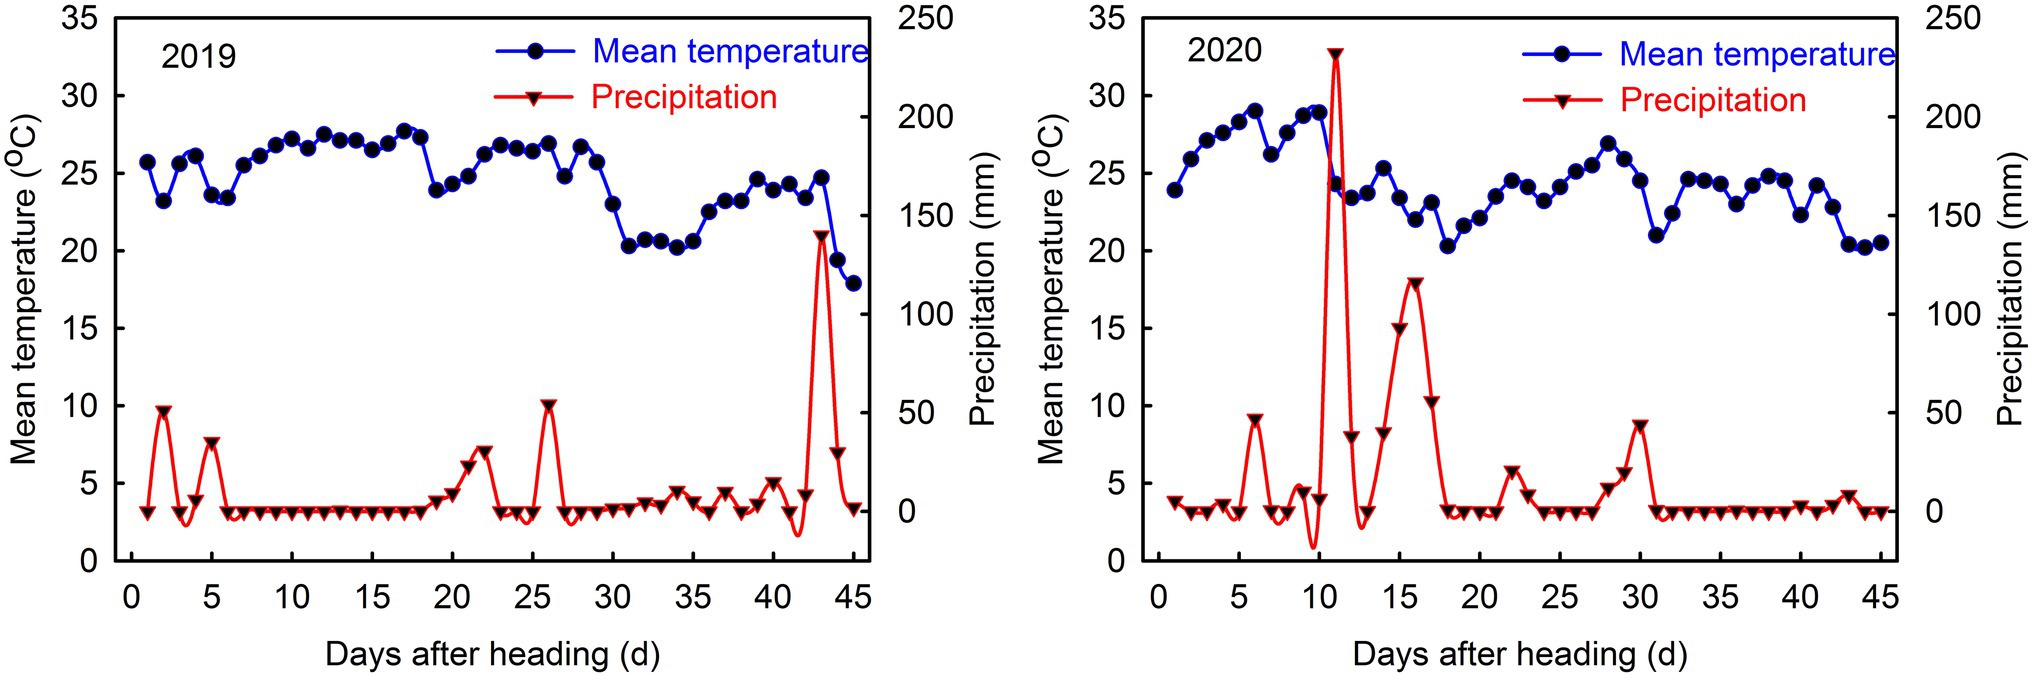
Figure 1. Mean temperature and precipitation during rice grain-filling from Wenjiang experimental field in 2019 and 2020.
The experiment adopted a two-factor split-plot design, with N fertilizer as the main plot and indica hybrid rice cultivars as the split-plot. There were six treatments, repeated thrice, totaling 18 plots. The plot area was 15 m2 (5 m × 3 m), sowing with row and plant spacing of 25 cm and 20 cm, with 300 holes (12 rows and 25 holes per row) in each plot. Four to six seeds were sown in each hole. After emergence, two seedlings were fixed per hole.
The application gradients of N fertilizer (urea) were 75 (N1), 150 (N2), and 225 (N3) kg ha−1, respectively. N was applied three times in the whole growth period, 40% on basal (7 days after sowing), 30% on tillering (25 days after sowing), and 30% on panicle initiation stage (70 days after sowing). Phosphate (P2O5 75 ka ha−1) was applied only as a basal application. Potassium (K2O 150 kg ha−1) was applied in the same amount at the basal and panicle initiation stages. A 30 cm ridge was built between the plots and covered with plastic film to prevent mutual leakage of water and fertilizer between plots. The plots were regularly weeded and treated with insecticides.
Four hundred single panicles with the same heading size and flowering time were selected for each plot and marked with red tags at the heading stage. Fifteen single panicles with functional leaves (top three leaves) were collected from each plot at 6, 12, 18, 24, 30, 36, and 42 days after anthesis (DAA). The grains from the first, second, and third grain positions from the bottom to top in the primary and secondary branches of the panicles were picked. The functional leaves and collected grains were placed in a ventilated oven (XMTD-8222, Shanghai Hongjing Test Equipment Factory, China) at 105°C for 30 min and then dried at 80°C to a constant weight. After grain shelling (JLGJ 4.5, Taizhou Cereal and Oil Instrument Co., Ltd., Zhejiang, China), the leaves and grains (caryopsis) were crushed and sieved separately as reserve.
The contents of soluble sugar, sucrose, and starch in leaves and grains were determined using the method described by DuBois et al. (1956) and Zhang (1977) with slight modifications. The sugar test liquid extraction was done as follows: 0.1 g sample was extracted with 5.0 ml of 80% ethanol at 80°C for 30 min. After repeated extraction and centrifugation (6,000 ×g for 5 min) three times, the supernatant was combined. Then, 50 mg activated carbon was added to the supernatant and decolorized at 80°C for 30 min. The decolorization solution (testing solution) was collected, and the volume was adjusted to 25 ml with 80% ethanol to analyze soluble sugar, sucrose, and starch content. A detailed method of measuring fructose and glucose contents is provided in Supplementary Figures 1 and 2.
The soluble sugar content was analyzed by taking 1.0 ml of the testing solution and adding to 2.0 ml of distilled water and 5 ml of chromogenic agent (1 g of anthrone dissolved in 1000 ml of dilute sulfuric acid) and keeping it in a water bath at 100°C for 10 min. After cooling, the absorbance was measured at 620 nm.
The sucrose content was analyzed by taking 0.5 ml of testing solution and mixing it with 100 μl 2 M NaOH. The solution was kept in a boiling water bath for 10 min to remove the reducing sugar. After that, 3.5 ml of 30% HCl and 1 ml of 0.1% resorcinol were added to the sample and kept in a water bath at 80°C for 10 min. The absorbance was then measured at 480 nm.
The starch content was determined by using the precipitate after extraction of the sugar, mixing it with 2.0 ml water, and gelatinizing it at 100°C for 15 min. After cooling, 2 ml of 9.2 M perchloric acid and 2 ml distilled water were added to the sample. Extracted for 15 min, and centrifuged at 6,000 g for 5 min. The supernatant was collected. Exactly 2 ml of 4.6 M perchloric acid and 4 ml distilled water were added to the residual precipitation, and the previous extraction and centrifugation steps were repeated. The supernatant was combined, and the volume was adjusted to 25 ml with distilled water. Precisely 0.5 ml of anthrone reagent and 5 ml of concentrated sulfuric acid were added to 1 ml of extracting solution and kept at 90°C for 5 min. The absorbance was measured at 620 nm.
In each plot, from the flowering to maturity stage of rice, 12 rice panicles with relatively consistent flowering time and size were marked with red tags and were cut with scissors every 4 days. Superior and inferior grains were obtained during each sampling. The unfertilized empty grains in each sample were removed. After manually removing the rice husk of the remaining grains, the fresh weight was obtained (M1). The length and width of the superior and inferior grains were measured with a vernier caliper and dried to constant weight, and weighed (M2). Superior and inferior grains were categorized according to the following methods: on the three primary branches at the top of the panicle, except the second grain, the other grains were superior grains; and on the secondary branches of the three primary branches at the bottom of the panicle, except for the grain at the top of the secondary branch, the other grains were inferior grains. The calculation formula of grain water content and its corresponding figure are shown in Supplementary Figure 3.
Richards’ equation was used to fit the grain filling process with reference to the methods of Sun et al. (2018) and Yang et al. (2003):
where W is the weight of a kernel (mg); A is the final weight of a kernel; t is the time days after anthesis (d); and B, k, and N are equation parameters. R2 is the fitting degree of the equation. The equation of grain filling rate G (mg·kernel−1·d−1) was obtained by taking the derivative of equation (1):
According to the above equation parameters, we performed the following calculations:
a. R0 (initial growth potential of grain)
b. Tmax (days required for grains to reach the maximum filling rate)
c. Wmax (weight of a kernel at maximum filling rate)
d. GRmean (average grain filling rate during the whole filling stages)
e. The whole grain filling period was divided into early (0–T1), middle (T1–T2), and late (T2–T99) three stages, respectively.
f. W1, W2, and W99 correspond to the weight of brown rice at T1, T2, and T99 respectively, so the mean filling rate in the early (MGRe), middle (MGRm) and late (MGRl) stage of grain filling was calculated as follows:
g. The contribution rate (RGC) of the accumulation of grain filling materials at each stage to the final grain weight (A) is calculated via the following equations:
One hundred and fifty labeled panicles were sampled at harvest from each plot, manually divided into superior and inferior grains, screened, and the impurity was removed. Superior and inferior grains were stored under-ventilated conditions for 2 months for further use. After that, they were shelled (JLGJ 4.5, Taizhou Cereal and Oil Instrument Co., Ltd., Zhejiang, China) and milled (JNM-III, China Grain Reserve Chengdu Research Institute Co., Ltd., Chengdu, China). The method described by Sun et al. (2022) and Yoshioka et al. (2007) was used to measure the chalky grain rate and chalkiness of superior and inferior grains with some modifications. Exactly 1,000 whole milled rice were counted from each sample and placed on the scanner to create a digital image. The process was repeated three times. The chalky grain rate and chalkiness degree were obtained through the image analysis software (JMWT-12, Dongfujiuheng Instrument Technology Co., Ltd., Beijing, China). The total chalky grain rate is equal to the sum of the chalky grain rate of superior and inferior grains, and the total chalkiness degree is equal to the sum of the chalkiness degree of superior and inferior grains.
ANOVA was performed with Statistix 17.0 (SPSS Inc., Chicago, IL), using the least significant difference test at a probability level of 0.05 (n = 3). The figures were plotted using SigmaPlot 12.0 (Systat Software Inc., San Jose, CA). Principal component analysis was completed with origin 2021 (OriginLab Corp., Northampton, MA).
N application rates significantly affected the formation and distribution of chalkiness characteristics. Chalky grain rate and chalkiness degree of high and low chalkiness varieties were mostly concentrated in the inferior grains (Figure 2). In addition, the chalky grain rate and chalkiness degree of superior and inferior grains decreased significantly with increasing N application. After averaging the data for 2 years, compared with N1 treatment, the chalky grain rate and chalkiness degree of superior grains of C1 and C2 decreased by 13.8%–20.0%, 16.2%–25.7%, 17.8%–31.3%, and 25.1%–44.0%, respectively, at N2 and N3 levels, whereas the chalky grain rate and chalkiness degree of inferior grains decreased by 8.0%–23.4%, 19.1%–24.0%, 11.9%–19.8%, and 28.7%–35.7% (Figures 2A–D). This eventually led to the overall decline of chalky grain rate and chalkiness degree (Figures 2E–F).
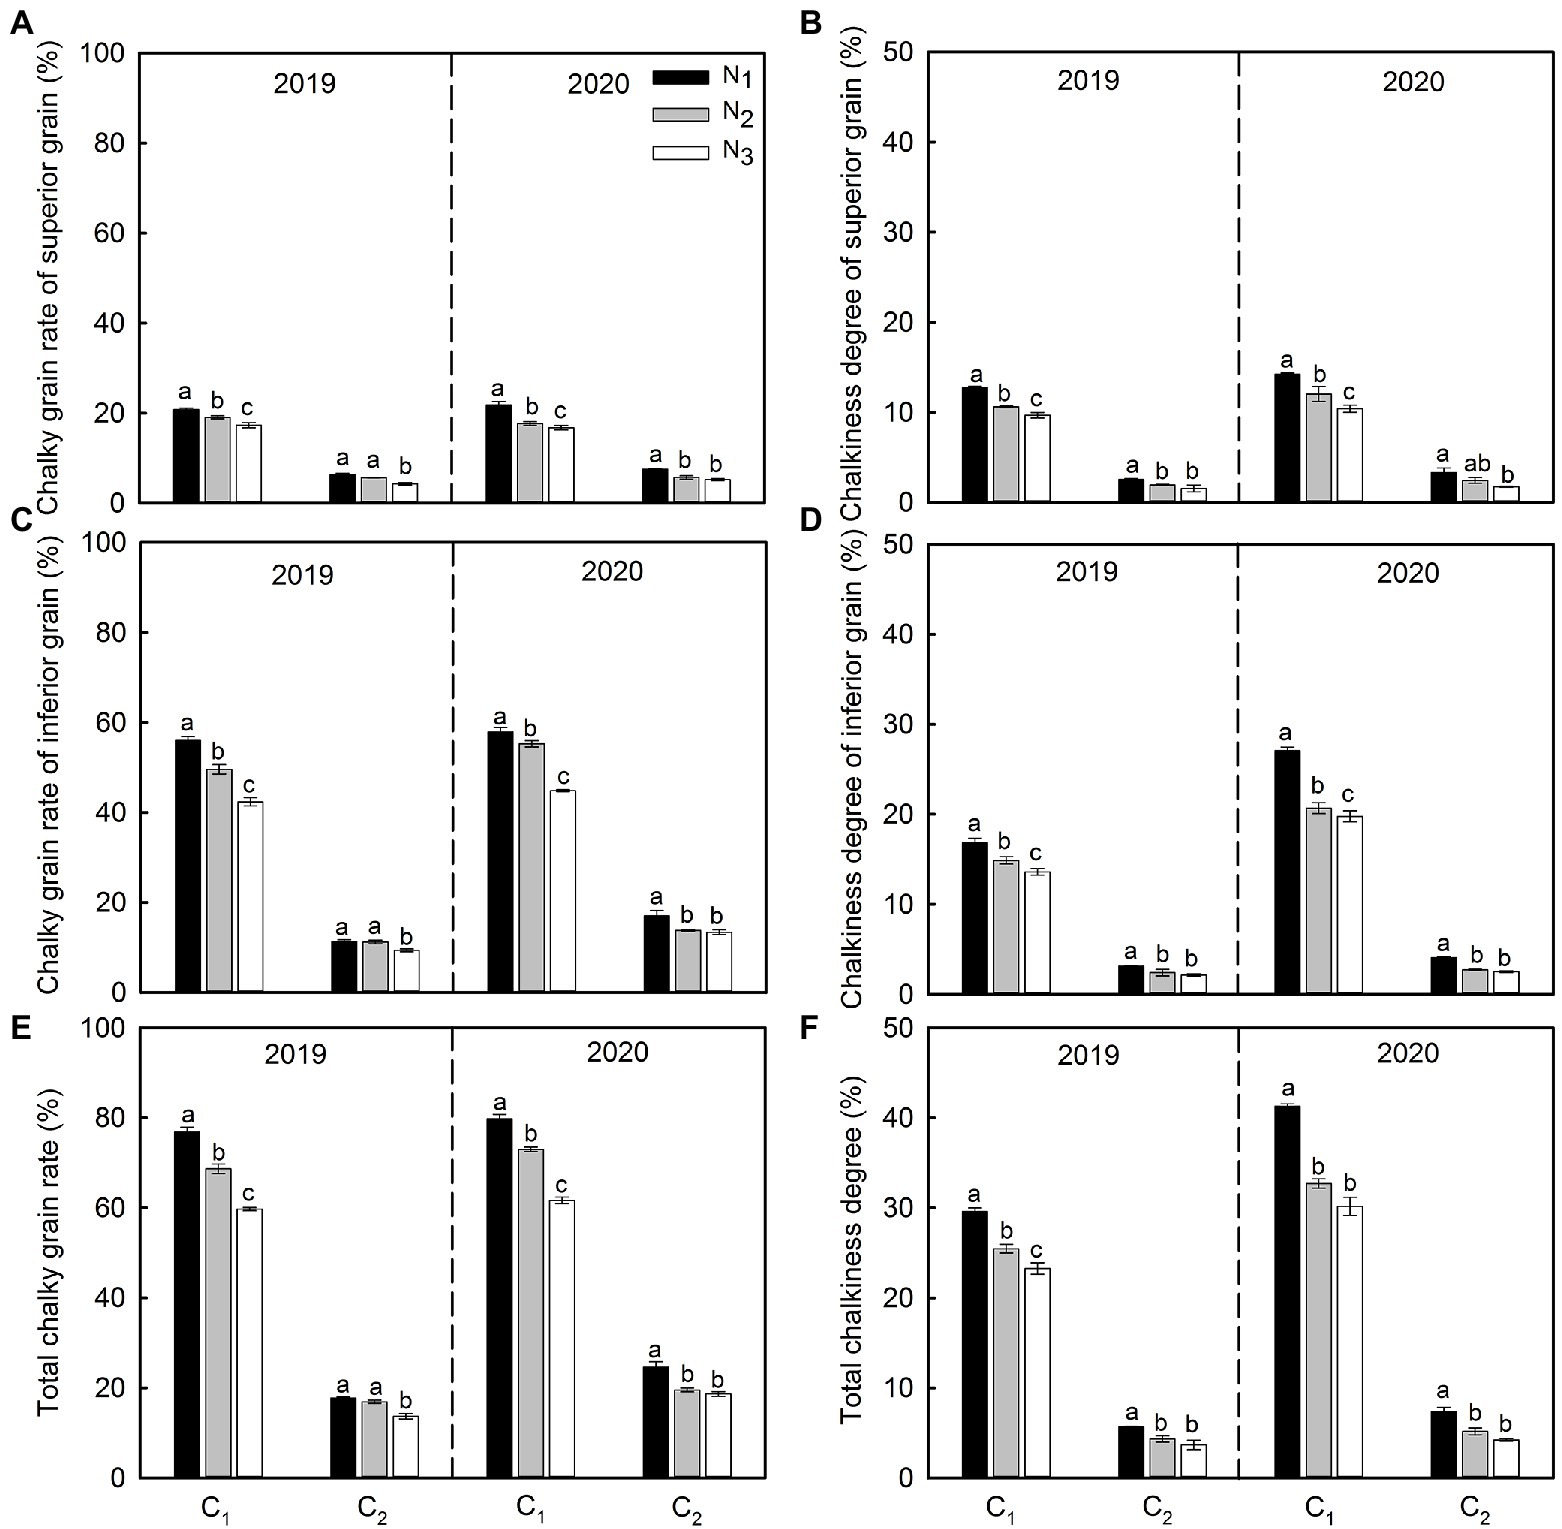
Figure 2. Changes of chalky grain rate (A,C) and chalkiness degree (B,D) of superior and inferior grains and changes of total chalky grain rate (E) and chalkiness degree (F) under different N application rates. Vertical bars represent ±SE of the mean (n = 3). Different lowercase letters indicate the statistical difference between treatments at the 0.05 level according to the LSD test. C1: Chuannongyou 508; C2: Shuangyou 573; N1: 75 kg ha−1; N2: 150 kg ha−1; N3: 225 kg ha−1.
There was a significant difference in the carbohydrate content of the functional leaves under three N application levels (Figure 3). With increasing N application, the contents of soluble sugar, sucrose, and starch content in functional leaves increased significantly (Figures 3A–L), and the carbohydrate synthesis ability of the C2 functional leaves was significantly better than that of C1. In addition, the soluble sugar in the functional leaves of high and low chalkiness varieties reached the peak at 12 DAA under N1 and N2 treatment, and extended to 18 DAA under N3 treatment (Figures 3A–D). Sucrose of C1 accumulated most at 18 DAA, while C2 accumulated at 24 DAA (except C2N1) (Figures 3E–H). Except for starch content, the other sugar contents rose initially and then declined during growth and finally tended to be flat. Under various N application rates, the time periods of rapid accumulation of soluble sugar and sucrose was 6–24 DAA (Figures 3A–H). There were some differences between the cultivars. Moreover, the starch content of the two cultivars decreased gradually as the functional leaves grew (Figures 3I–L).
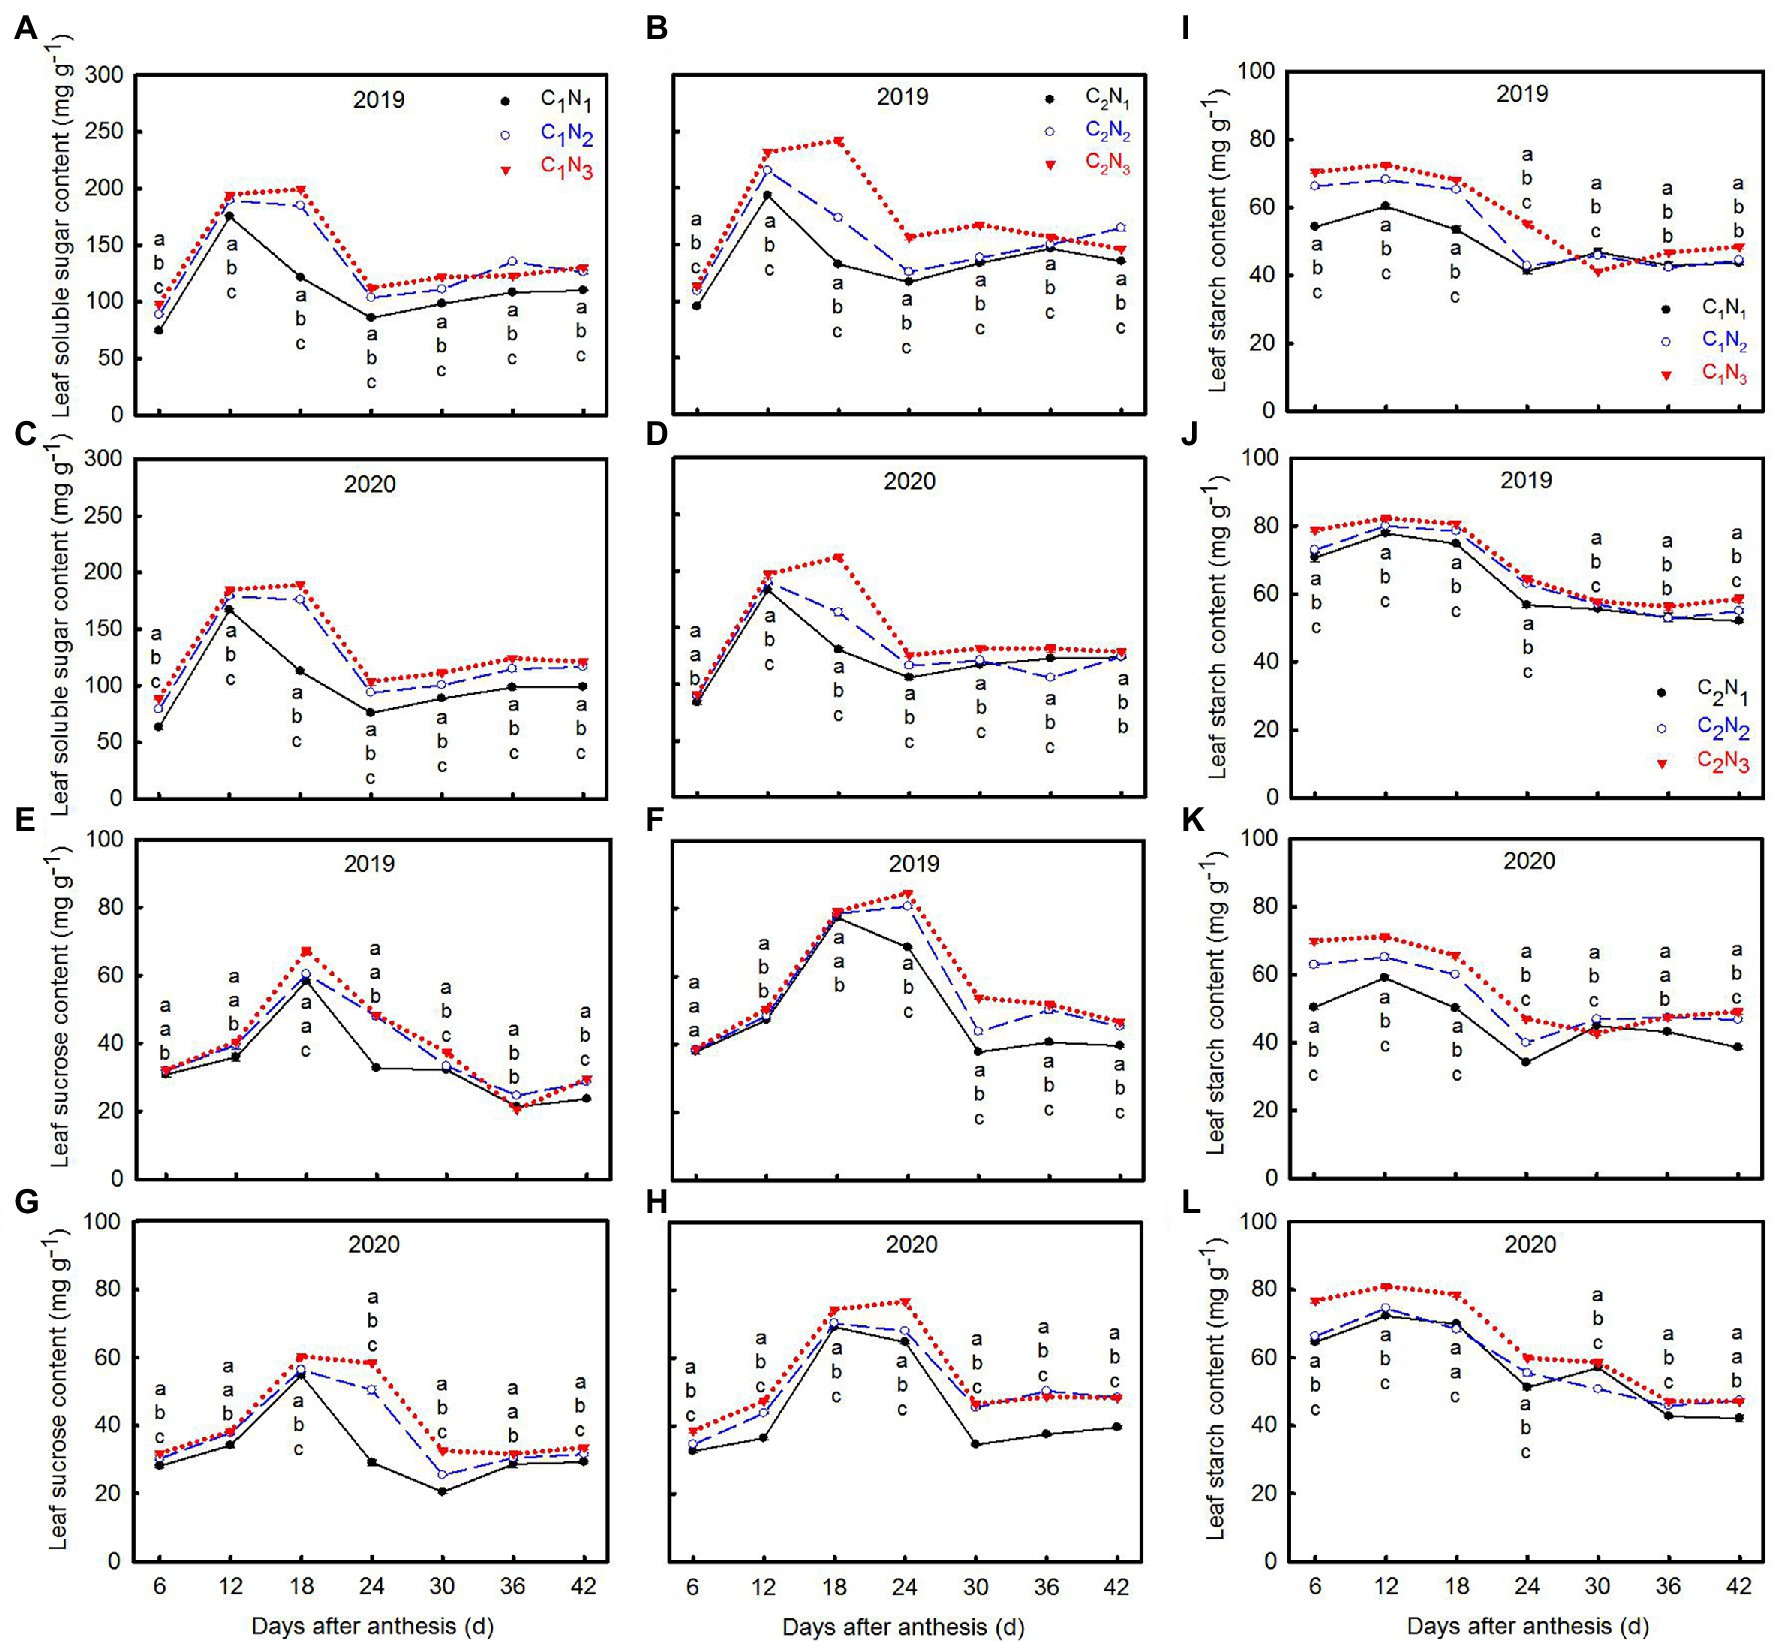
Figure 3. Changes of soluble sugar (A–D), sucrose (E–H), and starch (I–L) contents in top three leaves at 6, 12, 18, 24, 30, 36, and 42 days after anthesis under different N application rates. Data are mean ± SE (n = 3). Different lowercase letters from top to bottom indicate statistical difference between treatments at the 0.05 level according to the LSD test. C1: Chuannongyou 508; C2: Shuangyou 573; N1: 75 kg ha−1; N2: 150 kg ha−1; N3: 225 kg ha−1.
The amount of N fertilizer significantly affected carbohydrate accumulation of grain (Figure 4). With the increase in N application, the soluble sugar and sucrose content in grains decreased significantly, while the starch content increased (Figures 4A–L). At the same time, the carbohydrate synthesis and accumulation capacity in C2 grains were more substantial than that in C1 grains. It is worth noting that soluble sugar gradually decreased with increasing post-anthesis time (6–30 DAA) and then stabilized (Figures 4A–D). The descending order was N1, N2, and N3. In addition, except for C1N1, sucrose reached a peak at 12 DAA and then decreased slowly (Figures 4E–H). In terms of starch content, with increasing post-anthesis time, starch accumulation gradually increased till it was stable (Figures 4I–L). At 6–12 DAA, starch accumulation in C2 was more rapid than that in C1.
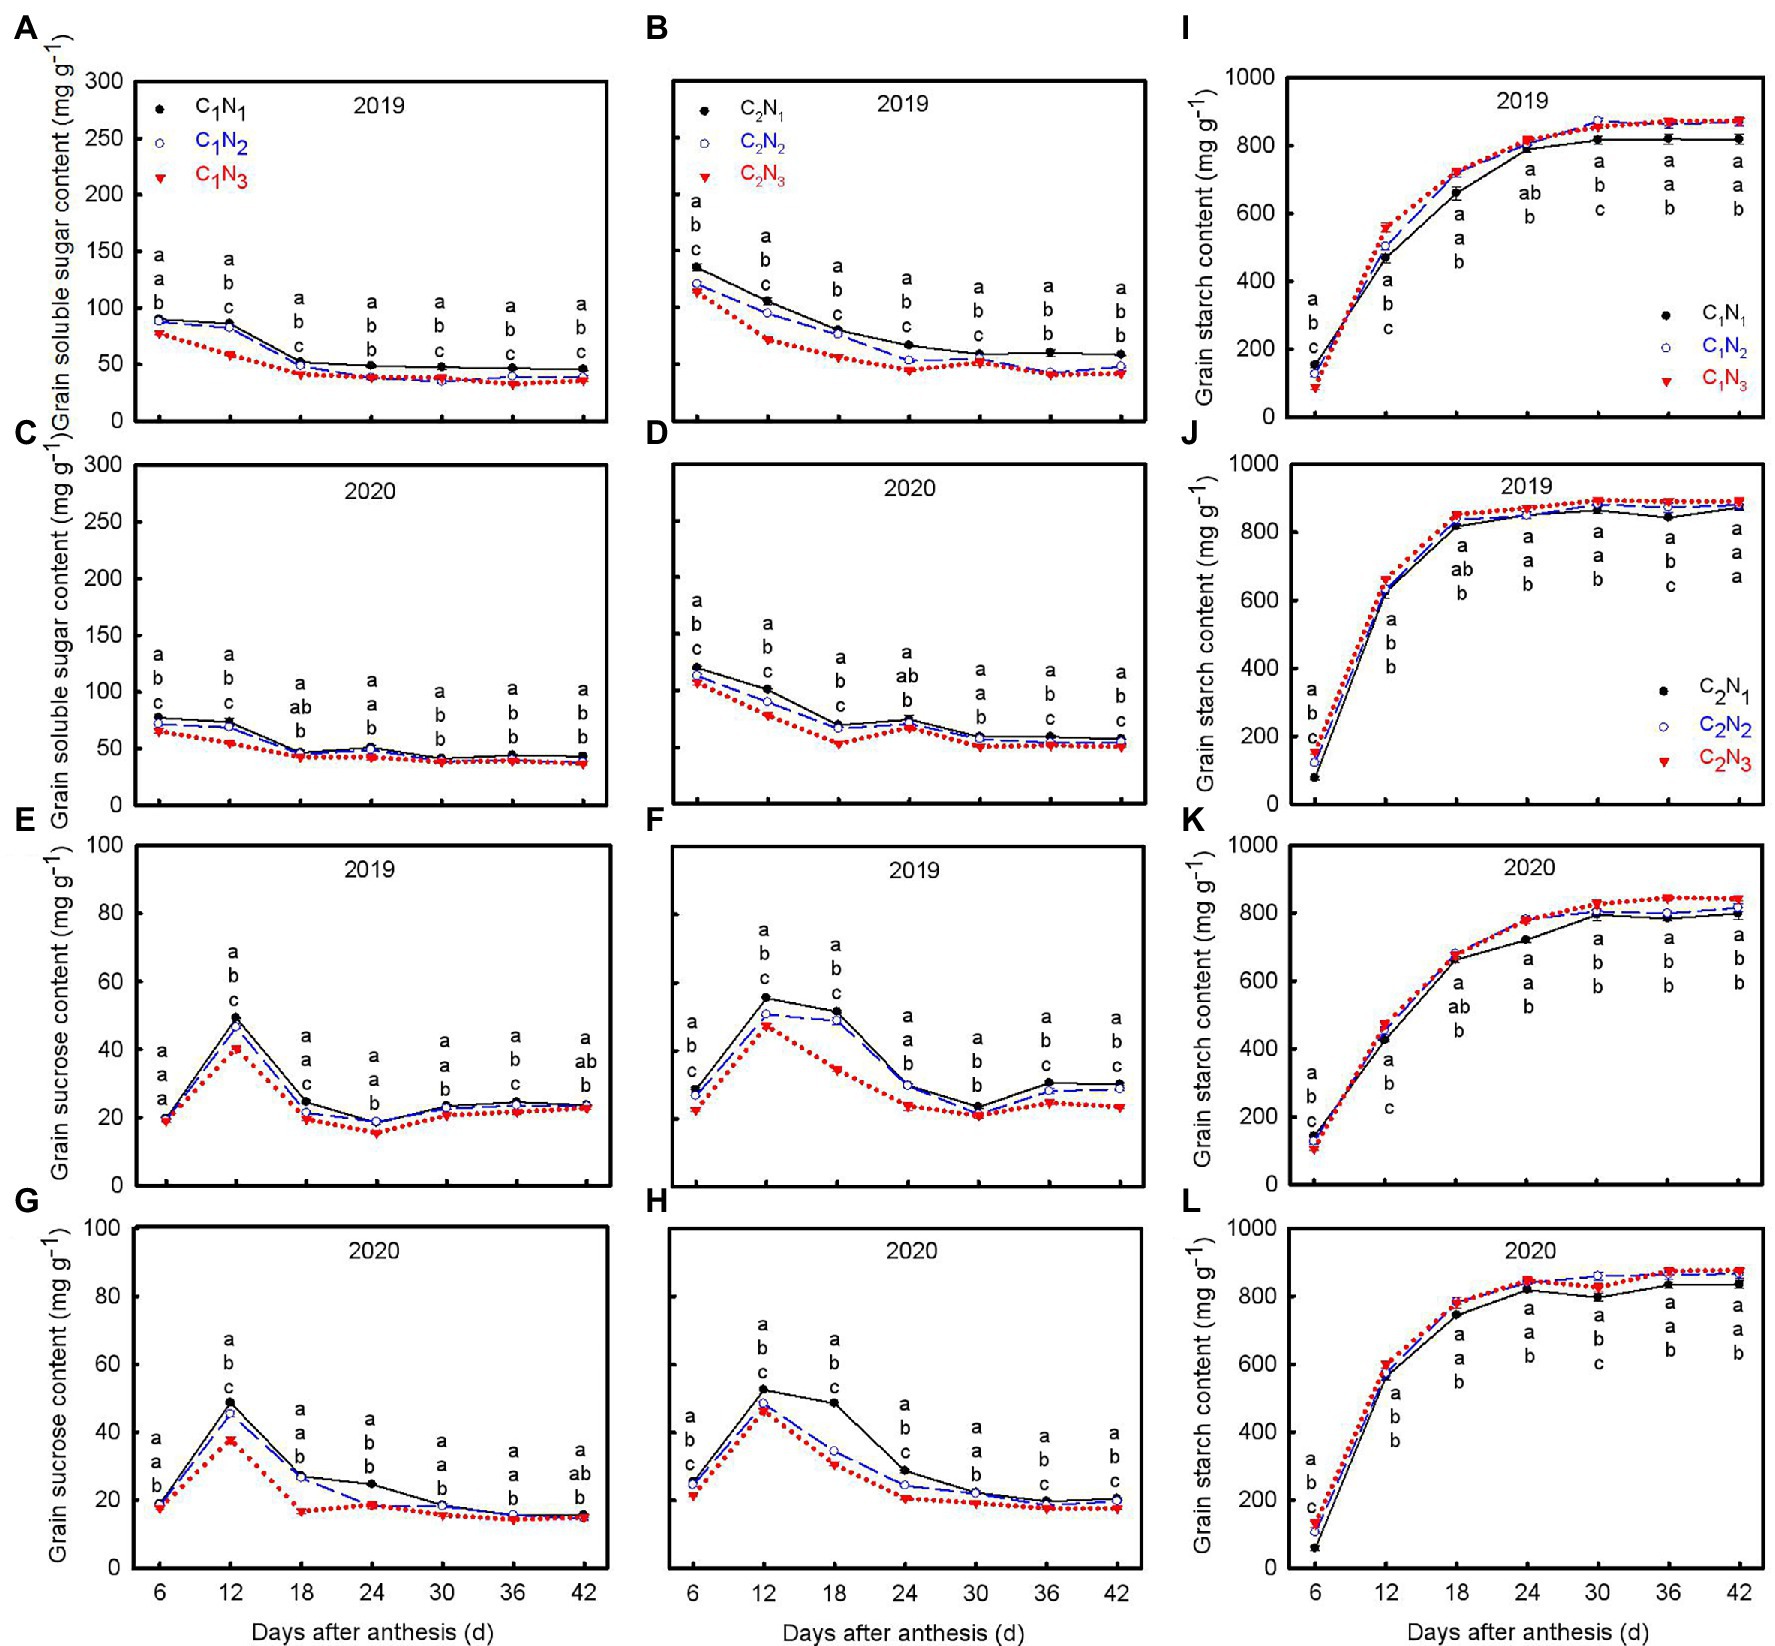
Figure 4. Changes of soluble sugar (A–D), sucrose (E–H), and starch (I–L) contents in grains at 6, 12, 18, 24, 30, 36, and 42 days after anthesis under different N application rates. Data are mean ± SE (n = 3). Different lowercase letters from top to bottom indicate statistical difference between treatments at the 0.05 level according to the LSD test. C1: Chuannongyou 508; C2: Shuangyou 573; N1: 75 kg ha−1; N2: 150 kg ha−1; N3: 225 kg ha−1.
Size is a key factor affecting the grain’s ability to accept carbohydrates (Figure 5). In the mature stage, the length and width of high and low chalkiness varieties’ superior and inferior grains decreased in the following order, N2, N3, and N1 under each N treatment. The ovary of superior grains elongated lengthwise to its full length at 6–8 DAA at the N1 level, while at N2 and N3 levels, it extended to its full size at 8–12 DAA. The ovary development of inferior grains was completed 24–28 DAA. Under all N treatments, C2 superior and inferior grains developed faster than C1 (Figures 5A–D). After that, the development in width becomes evident. The full width of superior and inferior grains was reached at 20–24 and 28–32 DAA (Figures 5E–H), respectively.
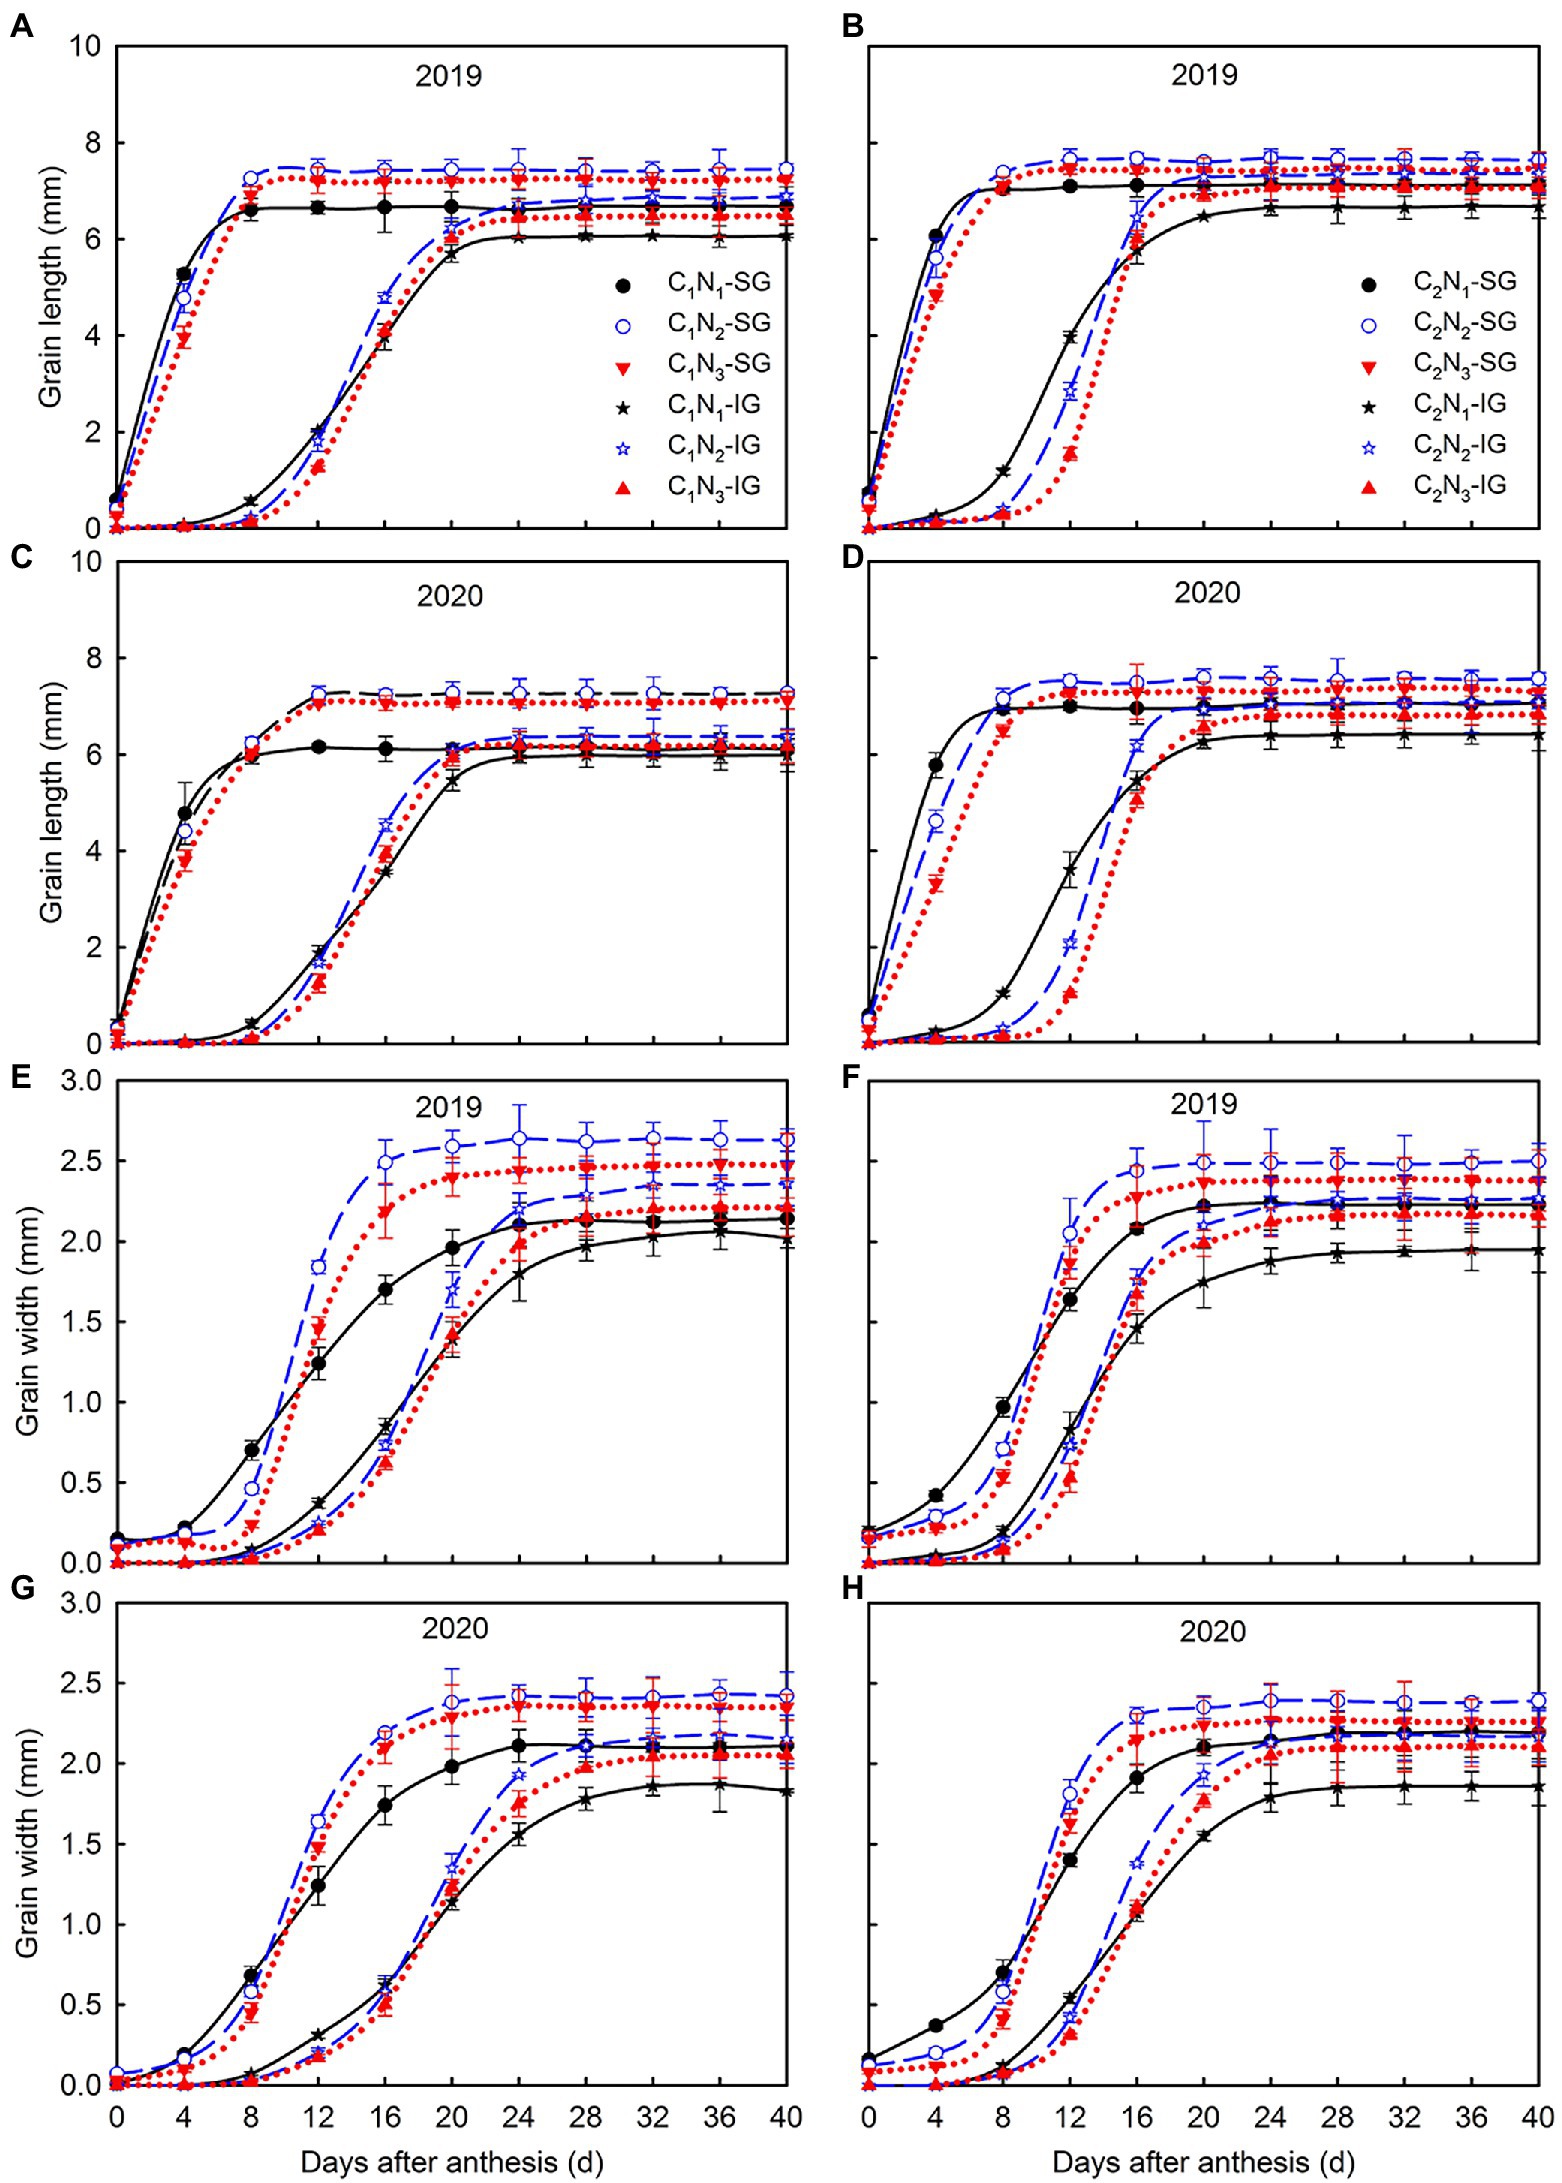
Figure 5. Changes of length (A–D) and width (E–H) of superior and inferior grains under different N application rates. Data are mean ± SE (n = 3). SG: superior grain; IG: inferior grain; C1: Chuannongyou 508; C2: Shuangyou 573; N1: 75 kg ha−1; N2: 150 kg ha−1; N3: 225 kg ha−1.
The dynamic changes in weight gain of the superior and inferior grains after anthesis of high and low chalkiness varieties under different N application rates conformed to the Richards equation, with the coefficients of determination above 0.99 (Table 2; Figure 6). The A value of the superior and inferior grains first increased and then decreased, and R0 decreased as N rates increased. Meanwhile, GRmax and GRmean of the superior and inferior grains of the two varieties improved in N2 and N3 compared with N1 (Table 2; Figures 6E–H). Additionally, the Tmax and Wmax of the superior grains and inferior grains (except C2 in 2019) increased with increasing N fertilizer application. This result indicates that increasing N fertilizer application can promote grain filling rate and shorten the time required to attain the maximum filling rate (Table 2; Figures 6A–D). Meanwhile, despite the short grain filling period, MGRm and RGCm of the superior and inferior grains in this stage remained the highest (Table 3). With the increase in N application, days in the early stages of grain filling and RGCe increased, while days in the middle and late stage of grain filling, RGCm and RGCL decreased. Moreover, compared to the N1 treatment, the average grain filling rate of superior and inferior grains at each stage was increased under N2 and N3 treatments. Compared with C1, C2 superior and inferior grains had shorter grain filling times, higher average grain filling rate and contribution rate.
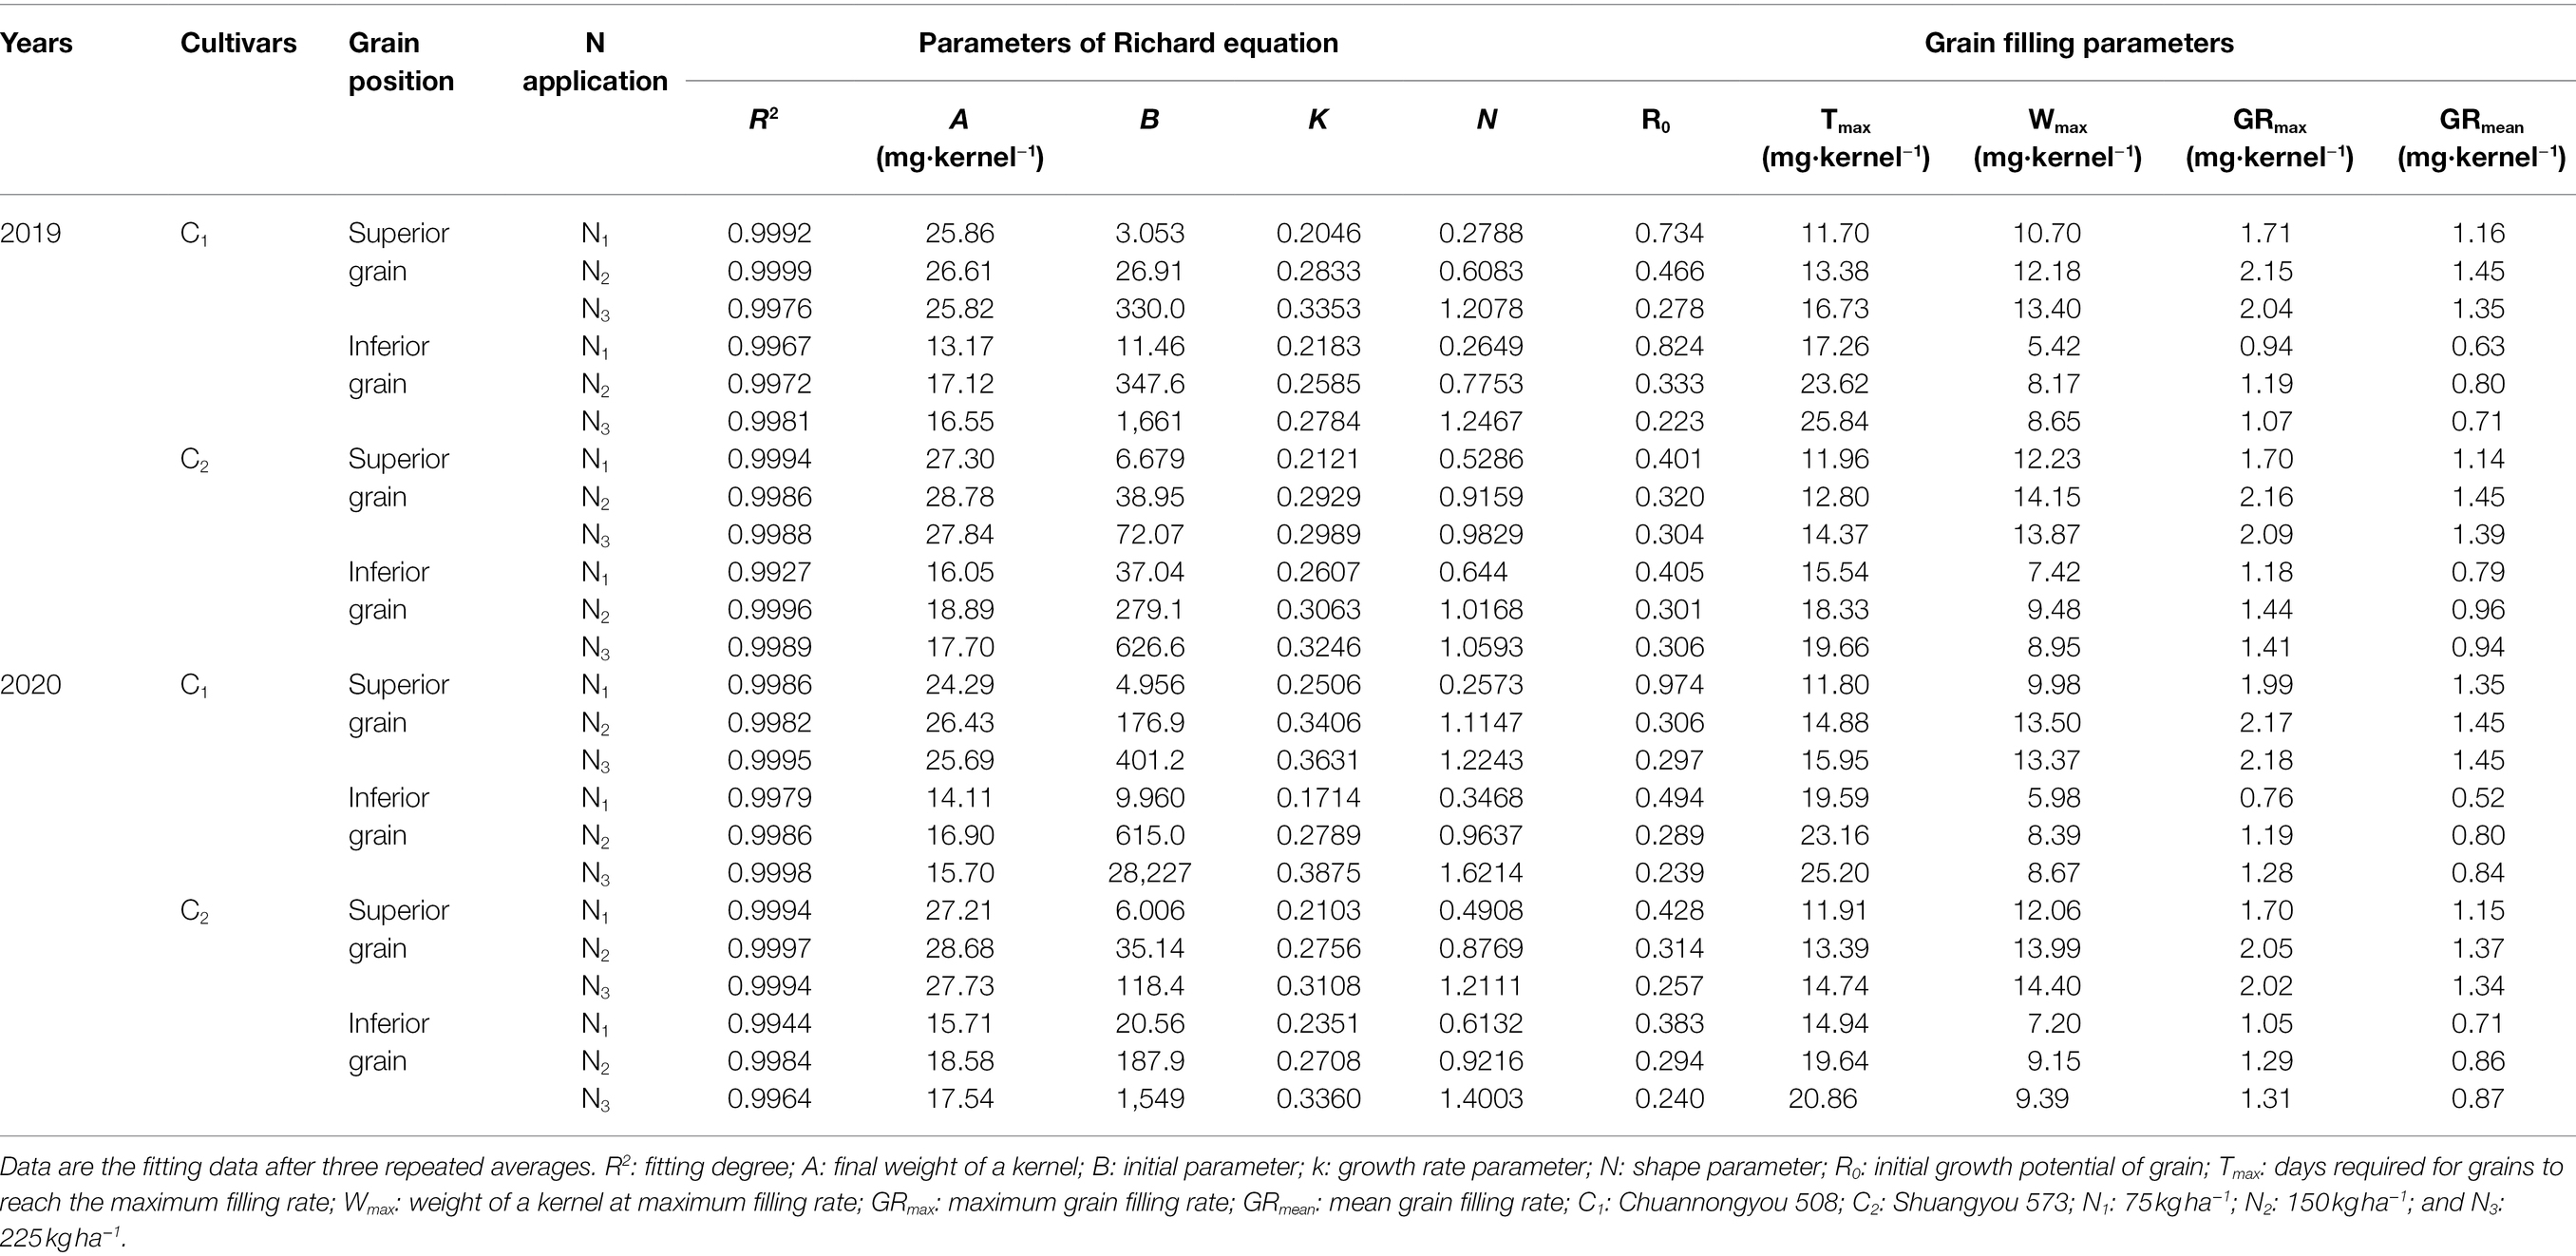
Table 2. Effects of nitrogen application rate on parameters of Richard equation and grain filling parameters.
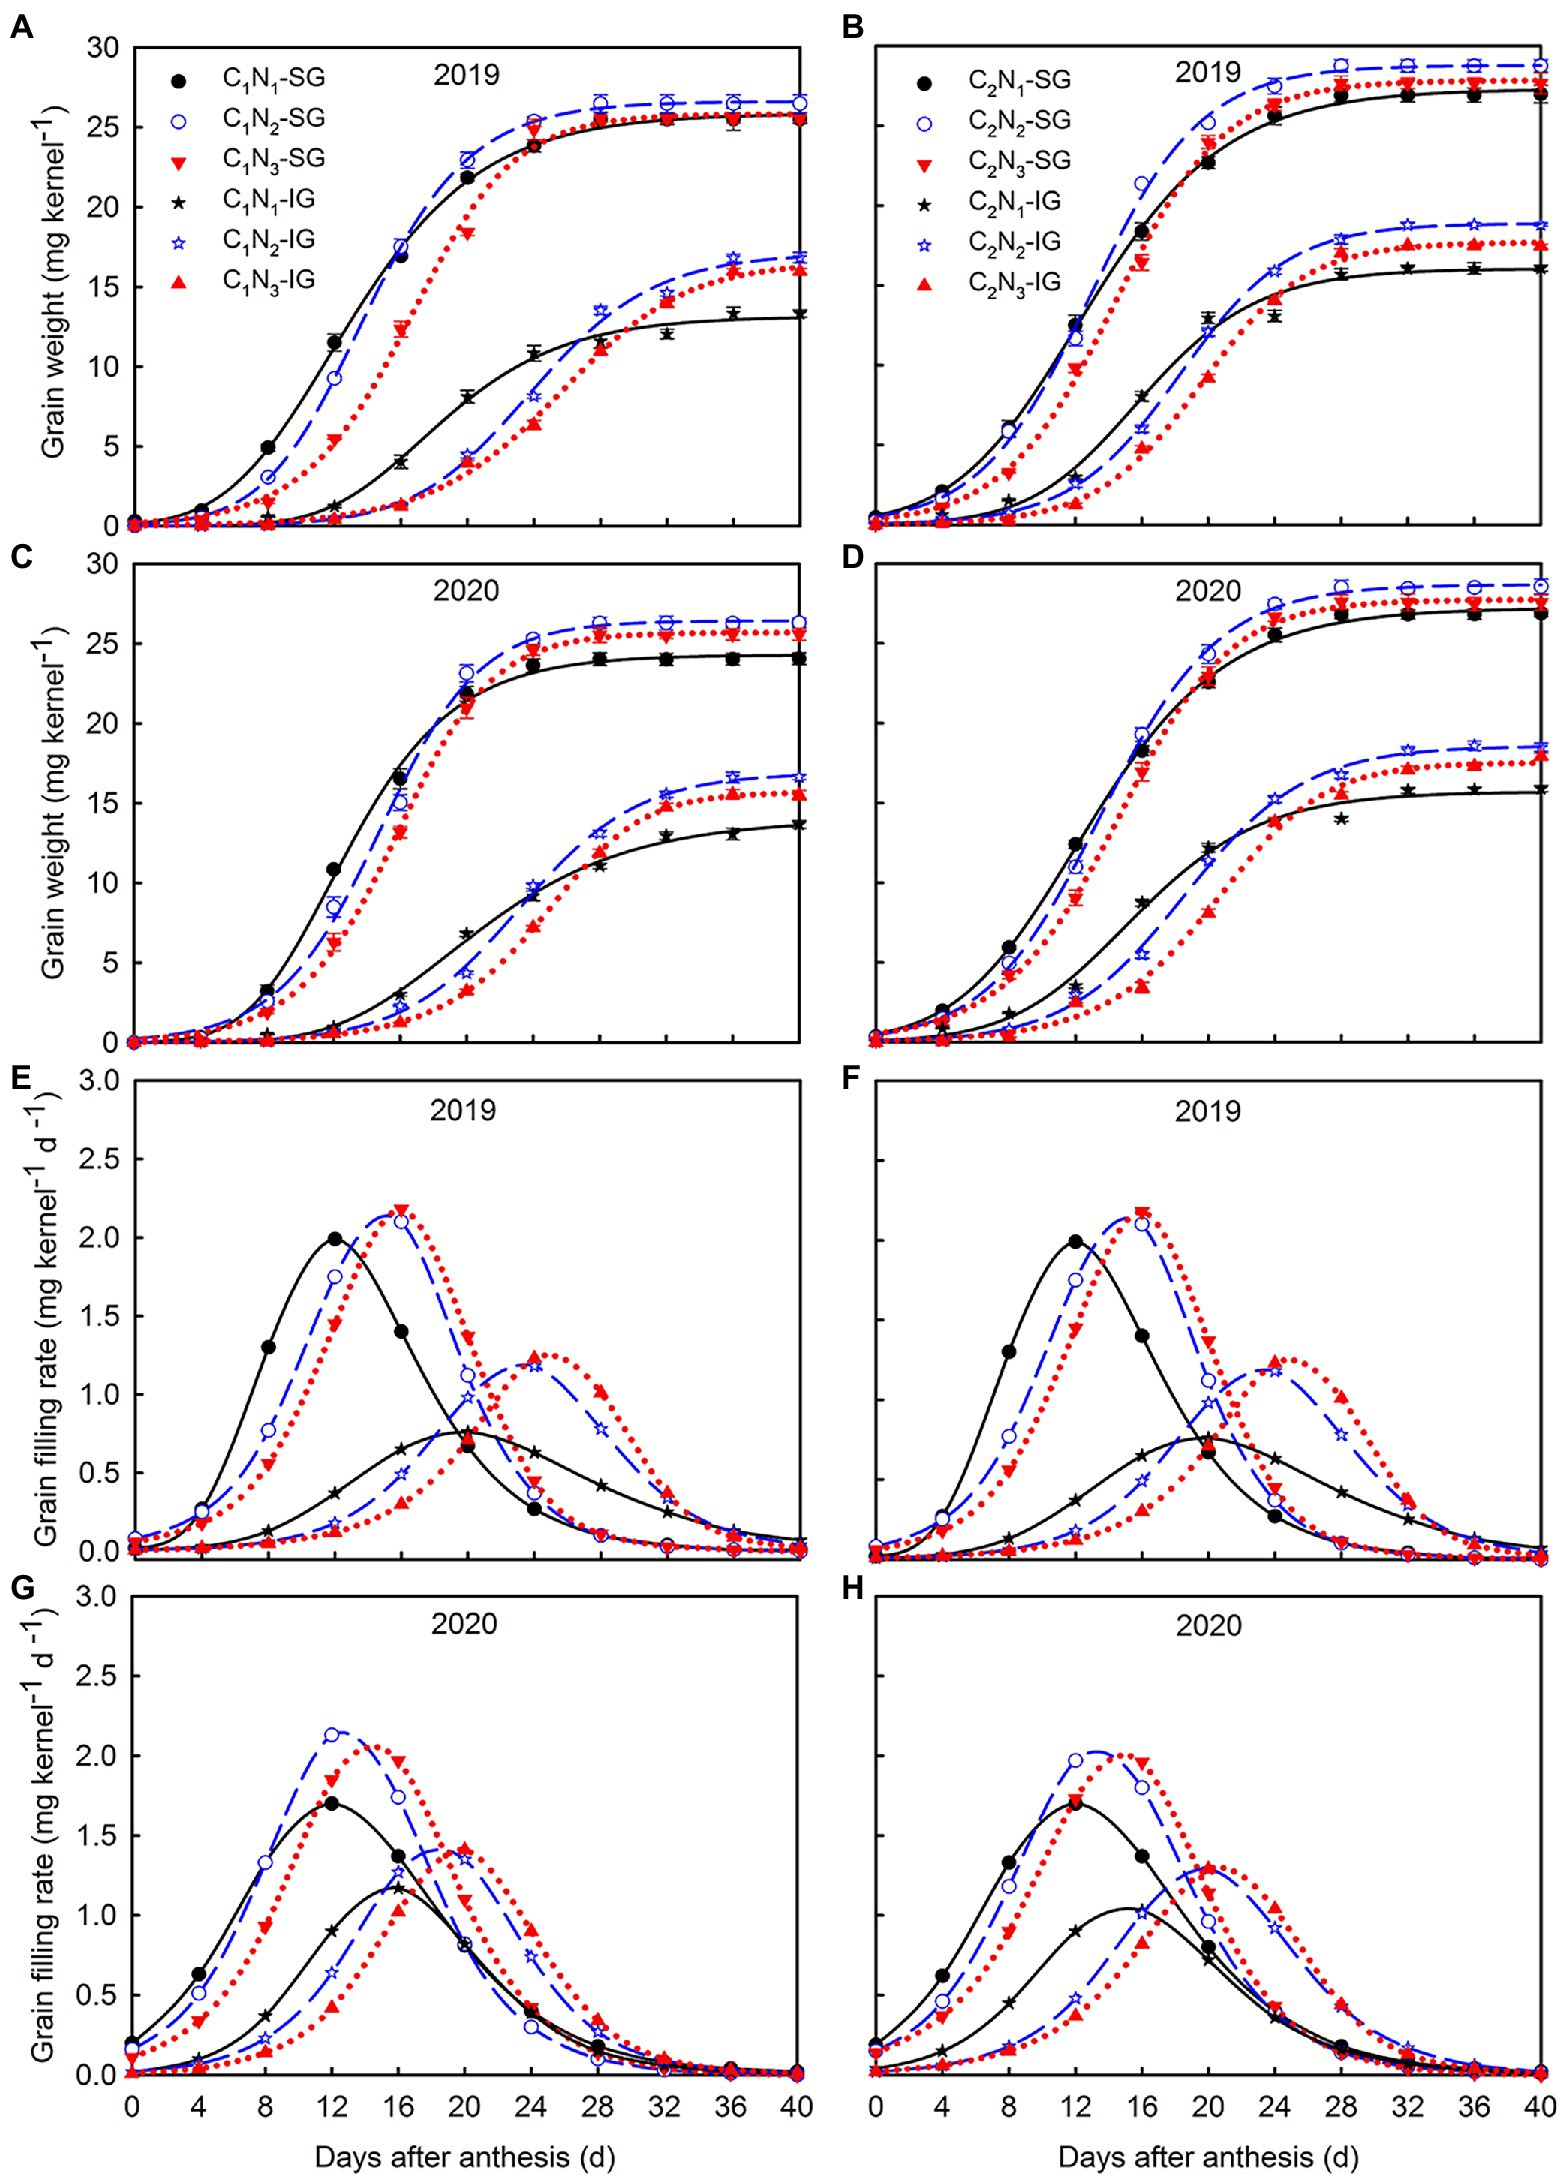
Figure 6. Changes of weight grain (A–D) and filling rate (E–H) of superior and inferior grains under different N application rates. Data are mean ± SE (n = 3). SG: superior grain; IG: inferior grain; C1: Chuannongyou 508; C2: Shuangyou 573; N1: 75 kg ha−1; N2: 150 kg ha−1; N3: 225 kg ha−1.
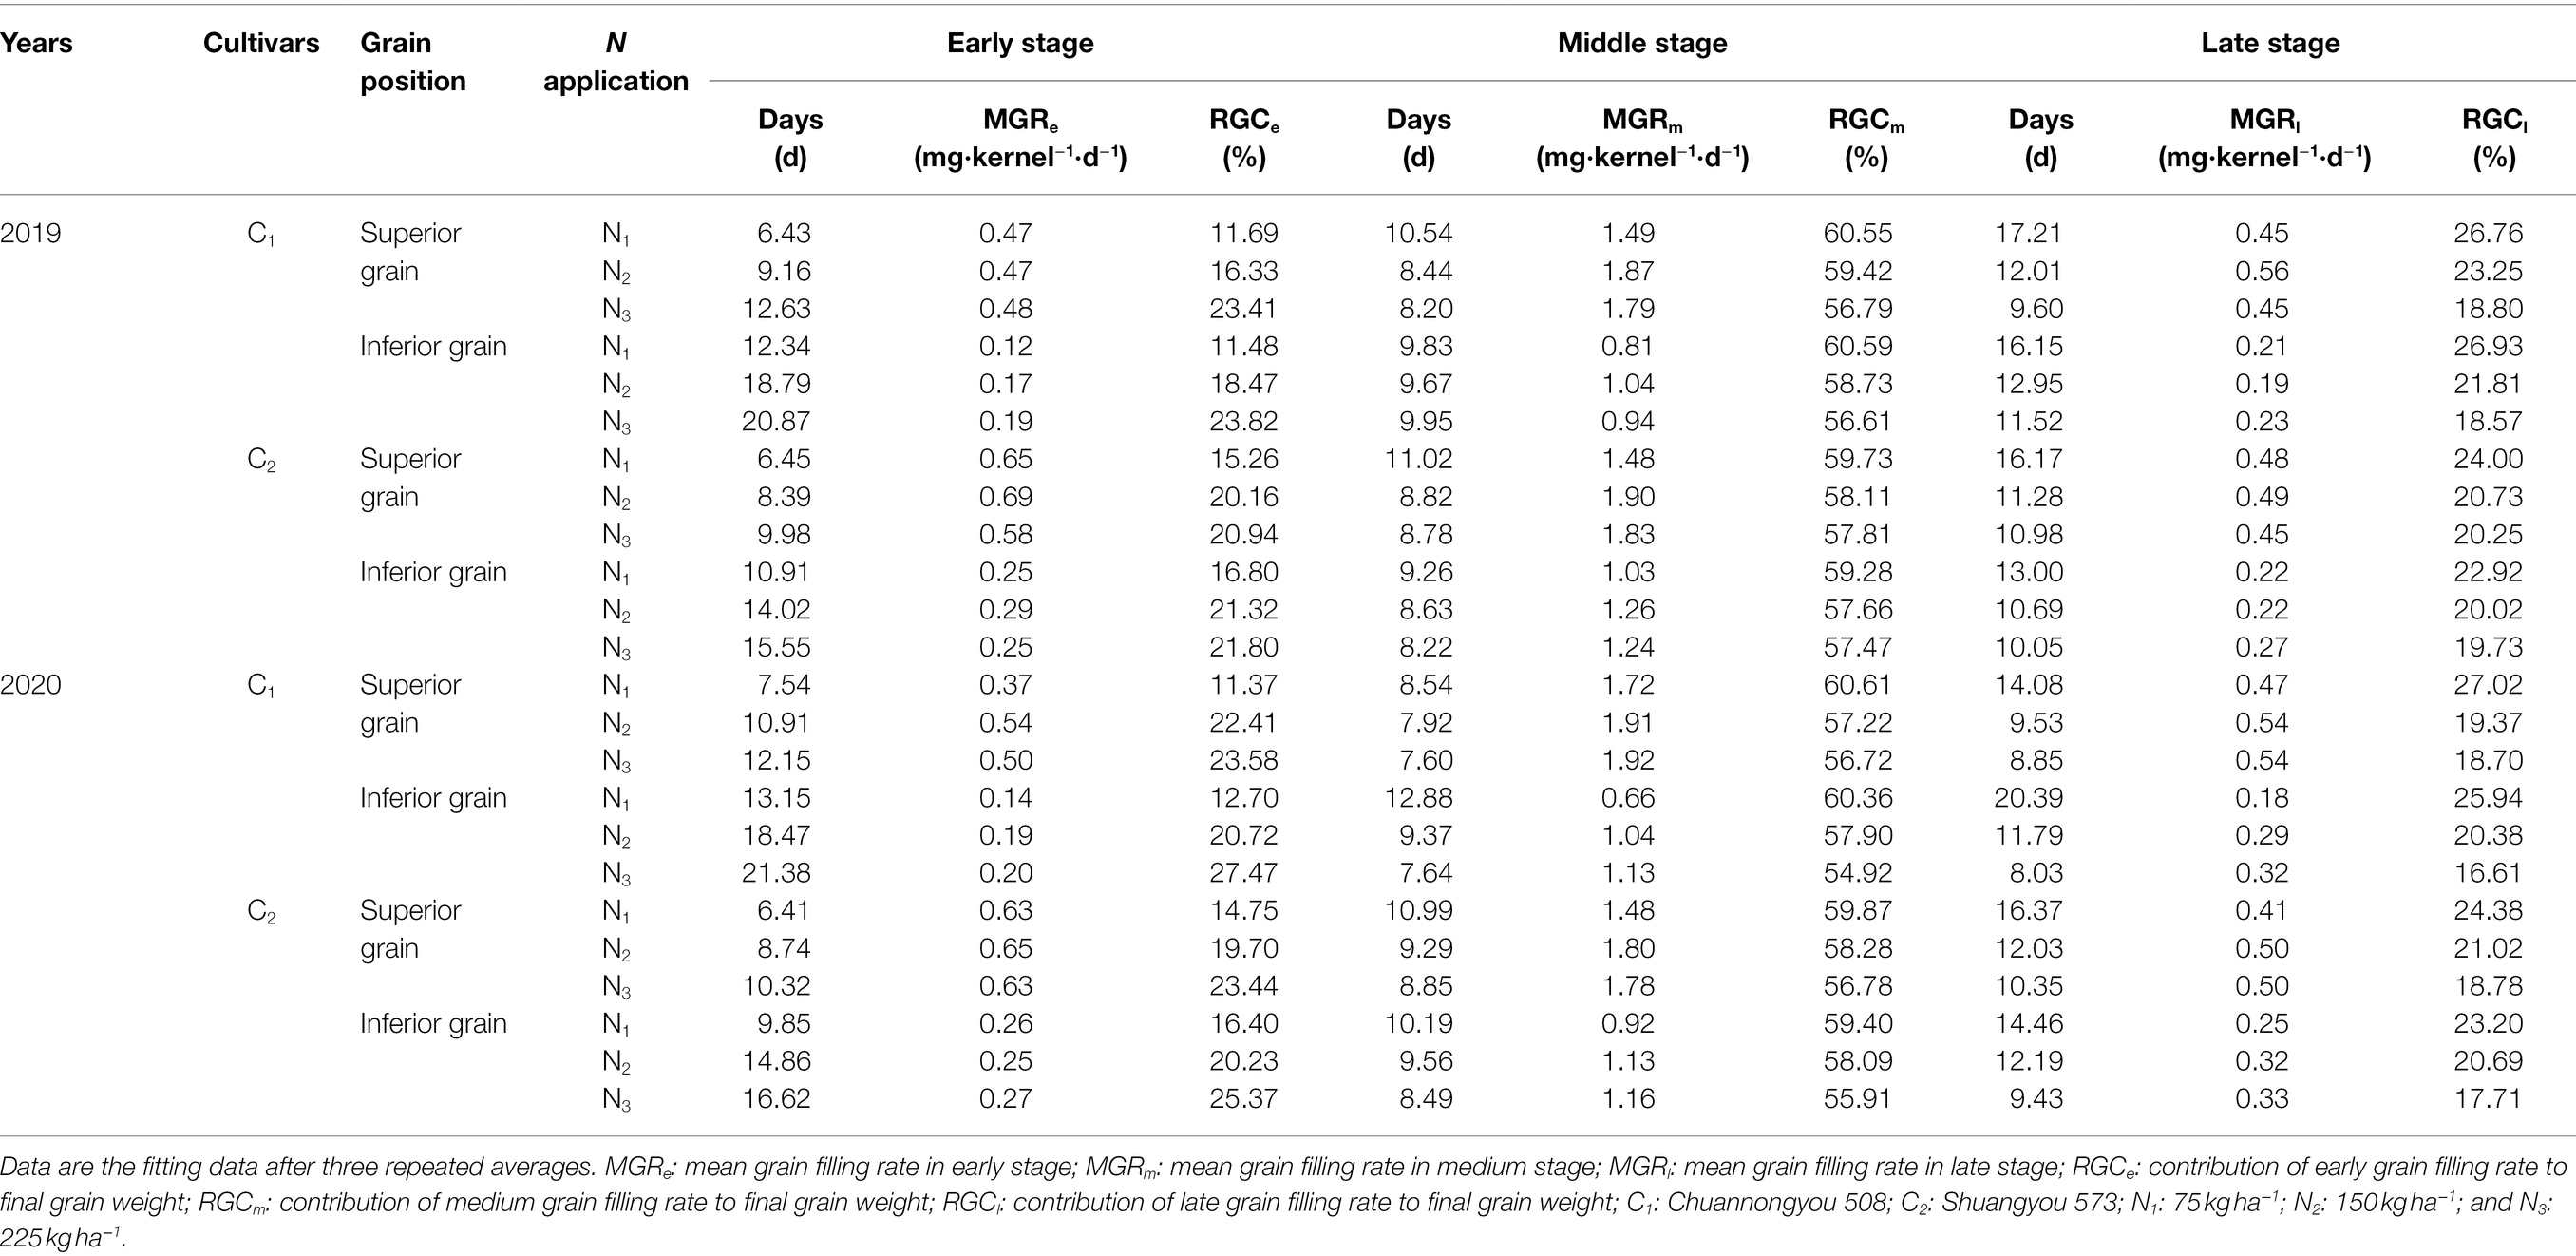
Table 3. Effects of nitrogen application rate on grain filling characteristics in early, middle, and late stages.
Under different N application rates, the principal components 1 and 2 of C1 explained 67.9%, 64.8%, and 66.2% of the total variation in superior grain chalky grain rate and chalkiness degree, inferior grain chalky grain rate and chalkiness degree, and total chalky grain rate and chalkiness degree, respectively (Figures 7A,B,I), while principal components 1 and 2 of C2 explained 68.1%, 67.3%, and 68.0% of the total variation, respectively (Figures 7C,D,J). The relationship between these variables suggested that chalkiness formation was negatively correlated with soluble sugar and sucrose contents in functional leaves and sucrose content in grains. Concerning the grain filling parameters, principal components 1 and 2 of C1 accounted for 90.2%, 87.1%, and 88.7% of the total variance, respectively (Figures 7E,F,K), while principal components 1 and 2 of C2 accounted for 91.5%, 88.5%, and 91.6% of the total variance, respectively (Figures 7G,H,L). The load scores of the principal component analysis indicated that the formation of superior and inferior grains chalky grain rate and chalkiness degree were closely related to grain filling. This eventually led to a positive correlation between total chalky grain rate and chalkiness with days in the middle and later stages of grain filling, R0, RGCm and RGCl, while a negative association with A, Wmax, MGRe, MGRm, MGRl, GRmax, and GRmean. In contrast, the dynamic accumulation of carbohydrates in functional leaves and grains of C2 and grain filling parameters explain chalkiness formation more fully than C1.
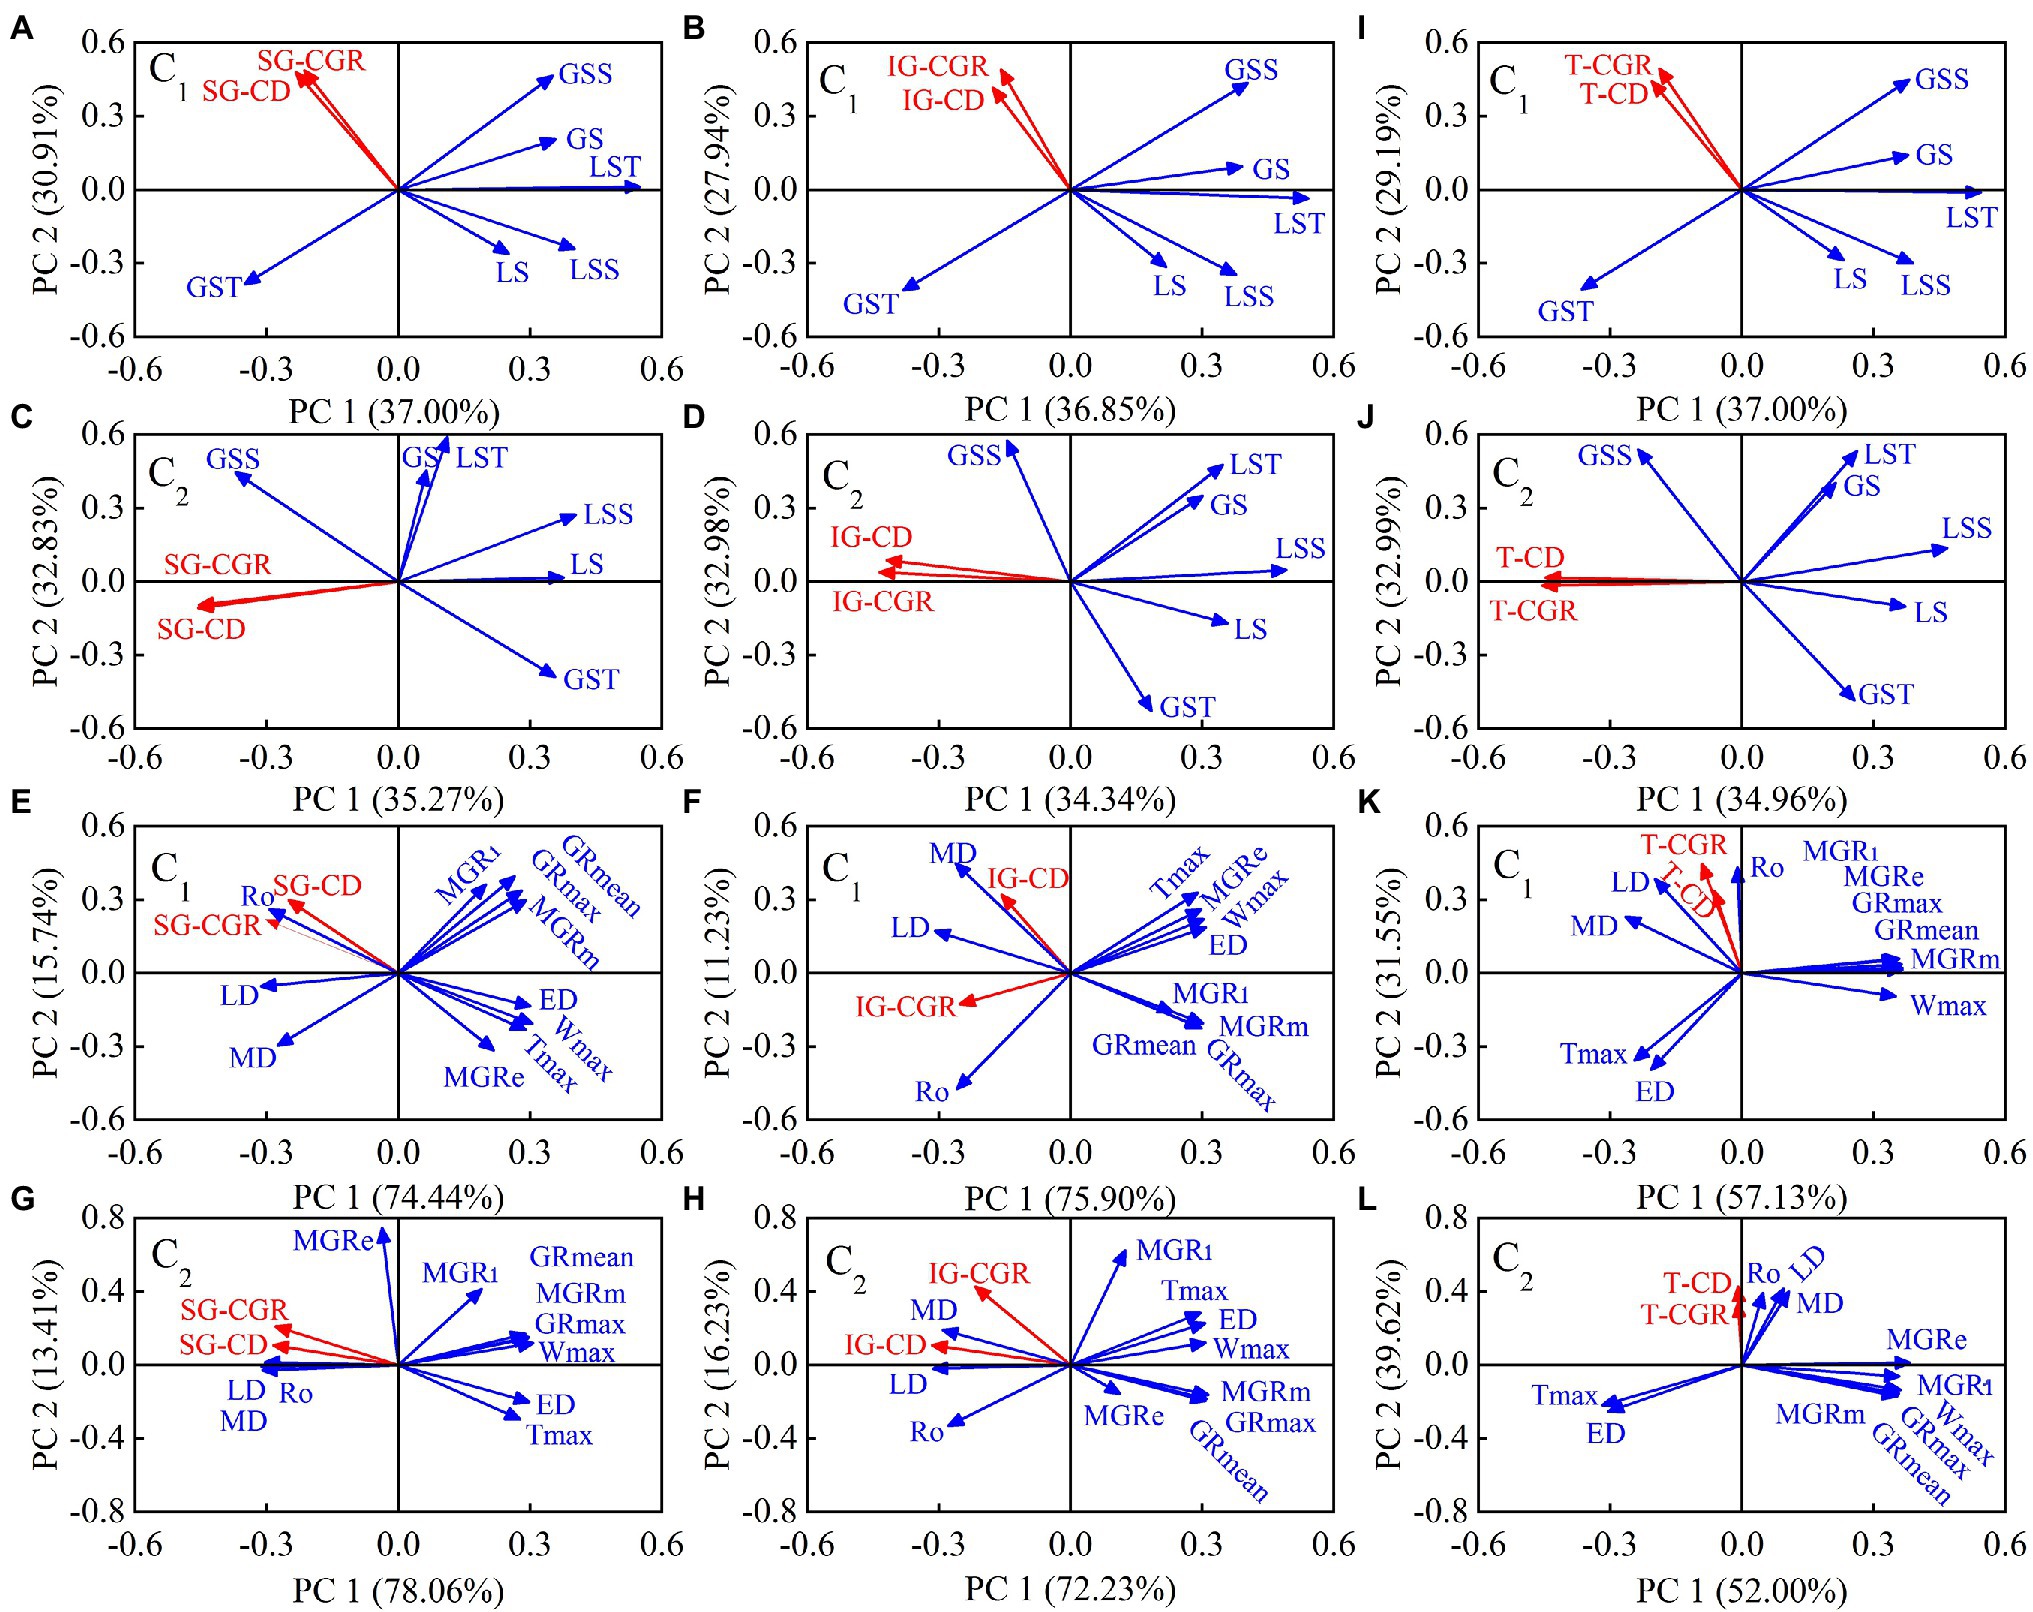
Figure 7. Principal component analysis of chalky grain rate and chalkiness degree of superior and inferior grains (A–H), as well as the total chalky grain rate and chalkiness degree (I–L) with carbohydrate or grain filling parameters under different N application rates, and the vectors represent the loading scores of variables for PC1 and PC2. PC1: principal component 1; PC2: principal component 2; C1: Chuannongyou 508; C2: Shuangyou 573; SG-CGR: superior grain chalky grain rate; SG-CD: superior grain chalkiness degree; IG-CGR: inferior grain chalky grain rate; IG-CD: inferior grain chalkiness degree; T-CGR: total chalky grain rate; T-CD: total chalkiness degree; GSS: grain soluble sugar; GS: grain sucrose; GST: grain starch; LSS: leaf soluble sugar; LS: leaf sucrose; LST: leaf starch; R0: initial growth potential of grain; Tmax: days required for grains to reach the maximum filling rate; Wmax: weight of a kernel at maximum filling rate; GRmax: maximum grain filling rate; GRmean: mean grain filling rate; MGRe: Mean grain filling rate in early stage; MGRm: Mean grain filling rate in medium stage; MGRl: Mean grain filling rate in late stage; ED: days of early stage grain filling; MD: days of middle stage grain filling; LD: days of late stage grain filling.
Rice chalkiness formation is a complex process controlled by the genotype and affected by cultivation environments (Phan et al., 2013; Zhao et al., 2020). It is common to address the mechanism of chalkiness formation from the perspective of genes. For example, Wang et al. (2008) showed that G1F1 could encode cell wall sucrose transporter and regulate the distribution of carbon in the early stage of grain filling. Its absence will lead to the formation of chalkiness. Similarly, Satoh et al. (2008) pointed out that in the PHO1 deletion mutant, the grain shrinks, the internal total starch content is significantly reduced, and the starch granules are small and oval, resulting in the white-core phenotype of the endosperm. However, the internal response mechanism and regulatory pathways due to cultivation practices, especially rice chalkiness to N fertilizer dosage and operation research mode, are still vague. In this study, the appropriate application of N fertilizer significantly decreased chalky grain rate and chalkiness degree of the superior grains and inferior grains and then interfered with increasing total chalky grain rate and chalkiness degree (Figures 2A–F), consistent with the conclusions of previous studies (Zhou et al., 2015). However, excessive N application would increase the chalkiness traits (Wei et al., 2018a). In addition, this study found that the chalkiness characteristics of rice mainly were concentrated in the inferior grains (Figures 2C,D).
In rice source-sink theory, source refers to functional leaves and leaf sheaths. Sink mainly means grains. The assimilates produced in the functional leaves through photosynthesis are the key to ensuring grain filling and rice quality formation (Ariovich and Cresswell, 1983). The potential mechanism of how these assimilates influence chalkiness formation from source to sink needs to be further explored. Previous studies have demonstrated that high N utilization can promote the transfer of assimilates from functional leaves to grains (Ariovich and Cresswell, 1983). In harsh environments, such as high temperature and drought stress, N supply can regulate the photosynthesis of functional leaves and the accumulation of starch in grains to reduce chalkiness formation (Zhang et al., 2008; Tang et al., 2019). This study showed that the contents of soluble sugar, sucrose, fructose, glucose, and starch in the functional leaves increased significantly as N rates increased (Figures 3G–L; Supplementary Figures 1A–H). Except for starch, they increased first and then decreased as days after anthesis. Among them, soluble sugar and sucrose were the most relevant to the chalkiness characteristics of rice (Figures 7A–D,I,J). This indicates that increasing N fertilizer promoted the synthesis of carbohydrates in functional leaves, especially the accumulation of soluble sugar and sucrose, which were transported to grains through stems and sheaths, accelerated grain filling and material distribution, and was conducive to the reduction of rice chalkiness.
Grain filling is a significant carbon metabolism process dominated by sucrose decomposition and starch synthesis. Currently, research on chalkiness formation mainly focuses on the activity of critical enzymes of carbon metabolism, gene expression, and the accumulation of assimilates (Fitzgerald et al., 2009; Ito et al., 2009; Lin et al., 2016, 2017; Tao et al., 2022). Soluble sugar, starch, protein, and other forms of assimilates (e.g., sucrose) and their relationship in grains significantly impact rice chalkiness (Chen et al., 2021). An appropriate amount of N fertilizer is conducive to the normal development of starch granules (Zhou et al., 2020). Storage proteins fill the spaces between the starch granules, decrease the gap between them, and make the arrangement of starch granules denser, thus reducing chalkiness (Wada et al., 2019). Some studies also believed that a higher level of soluble sugar in grains could enhance the compactness of protein subunits of protein bodies, supporting the accumulation of storage protein and then reducing the tightness degree of rice (Yu et al., 2016). In this study, with increasing N application, the ability of grain to synthesize starch increased, and promoted the transformation of soluble sugar to starch, resulting in a lower content of soluble sugar and a higher level of starch in the later stage of grain filling (30–42 DAA). This may reduce the polymerization ability between starch, protein, and lipid to improve the composite strength of starch granules and reduce the chalkiness of rice. These results differ marginally from the results reported by Wada et al. (2019) and Yu et al. (2016).
N regulation significantly affects the development and grain filling of superior and inferior grains to determine the formation of rice chalkiness. Rice grain filling is a process of dynamic synthesis and accumulation. The length, width, water content, and filling parameters of grains are closely related to chalkiness formation (Gong et al., 2017; Sun et al., 2022). The length and width of the grain reflect the ability of rice grains to accept carbohydrates. In our study, the length and width of the superior and inferior grain accelerated and increased under N2 and N3 conditions compared with N1(Figures 5A–H), which was conducive to improving the ability of grains to accept carbohydrates and effectively alleviate the contradiction between source and sink, thereby reducing the occurrence of chalkiness (Figures 2A–F). Further, under the condition of N1, the filling rate of grains decreases, resulting in the rapid reduction of water content, premature water loss and precocity of grain, affecting the synthesis and accumulation of starch and then making its chalkiness relatively higher.
Indeed, grain filling parameters (e.g., R0, Tmax, Wmax, GRmax, and GRmean) and grain filling differences at each stage are crucial for a macro study of chalkiness development (Bridgemohan and Bridgemohan, 2014; Dou et al., 2017). Previous comparative studies between varieties found that chalkiness and grain filling dynamic parameters generally showed an upward parabolic relationship (Zhang et al., 2021). It is possible to reduce the chalkiness by optimizing the grain filling process with appropriate cultivation control measures. In the present study, with increasing N application, R0 of superior and inferior grain decreased, while GRmax and GRmean increased to shorten the Tmax required to reach Wmax. The principal component analysis also showed that total chalky grain rate and chalkiness degree were negatively correlated with GRmax and GRmean, indicating that increasing N fertilizer optimized grain filling in the whole filling stage and then reduced total chalky grain rate and chalkiness degree. This may be related to optimizing leaf carbohydrate accumulation ability and essential carbon and nitrogen metabolism (e.g., ADP-Glucose pyrophosphorylase) (Xi et al., 2020). Theoretically, the grains obtained more carbohydrates in the early grain filling stage. The physiological and metabolic pathways became very active, which may significantly impact chalkiness formation (Cai et al., 2006). However, this study showed that the whole grain filling stage would affect chalkiness formation. In particular, increased N accelerated the grain filling of inferior grain in the middle and later stages, conducive to chalkiness reduction.
Moreover, the chalkiness decreased when the superior and inferior grains were filled simultaneously and increased when the superior and inferior grains were grouted asynchronous (Shimoyanagi et al., 2021; Sun et al., 2022). In this study, Chalky grain rate and chalkiness degree in the two cultivars were mainly distributed in the inferior grains and decreased as N rates increased, further decreasing total chalky grain rate and chalkiness degree. Increasing N fertilizer promotes the synthesis and distribution of carbohydrates in the functional leaves, and the superior grain obtained carbohydrates preferentially. After rapid grain filling, the carbohydrates were quickly distributed to the inferior grain to enhance their grouting and maturity, reducing their chalkiness. On the contrary, the superior grain was supplied with carbohydrates slowly, and the inferior grain filling was inhibited, increasing chalkiness (Bridgemohan and Bridgemohan, 2014; Deng et al., 2018; Sun et al., 2022). Hence, grain position, grain size, grain filling speed, insufficient synthesis, or uneven distribution of carbohydrates are related to the formation of rice chalkiness.
The present study revealed little difference in grain filling intensity of the superior grain in both C1 and C2. The vigorous and weak grain filling of the inferior grain may be an important reason for determining high and low chalkiness in rice. Furthermore, the dynamic accumulation of carbohydrate and grain filling characteristics in the functional leaves and grains under various N fertilizer treatments was closely associated with rice chalkiness formation. Moderate N application (i) improved the accumulation of carbohydrates in the functional leaves, especially the transport of soluble sugar to the grains, (ii) maintained the transformation of soluble sugar to starch in grains, (iii) accelerated the development of length and width of the superior and inferior grains, (iv) enhanced and optimized the grain filling of the superior and inferior grains, thereby contributing to the decreased total chalky grain rate and chalkiness degree. A practical N application could be a simple and easy way to achieve rice low chalkiness.
The original contributions presented in the study are included in the article/Supplementary Material, further inquiries can be directed to the corresponding authors.
CG contributed to mapping and writing—original draft. XY, FY, and KX performed the experiments and collected the data. YW and QZ contributed to the methodology. ZW, LH, and PF contributed to the formal analysis. ZY, ZC, and YS revised the manuscript. JM administered the project and provided funding acquisition. All authors contributed to the article and approved the submitted version.
This work was supported by the Research Program Foundation of Key Laboratory of Sichuan Province, China, the Sichuan Provincial Science and Technology support projects (2020YJ0411 and 2021YJ0281), and the Rice Breeding Project Foundation of Sichuan Provincial Science and Technology Department (2021YFYZ0005).
The authors declare that the research was conducted in the absence of any commercial or financial relationships that could be construed as a potential conflict of interest.
All claims expressed in this article are solely those of the authors and do not necessarily represent those of their affiliated organizations, or those of the publisher, the editors and the reviewers. Any product that may be evaluated in this article, or claim that may be made by its manufacturer, is not guaranteed or endorsed by the publisher.
The Supplementary Material for this article can be found online at: https://www.frontiersin.org/articles/10.3389/fpls.2022.921130/full#supplementary-material
Ariovich, D., and Cresswell, C. F. (1983). The effect of nitrogen and phosphorus on starch accumulation and net photosynthesis in two variants of Panicum maximum Jacq. Plant Cell Environ. 6, 657–664. doi: 10.1111/j.1365-3040.1983.tb01181.x
Bridgemohan, P., and Bridgemohan, R. S. (2014). Crop nutrition studies on grain filling and chalkiness in rice. J. Plant Breed. Crop Sci. 6, 144–152. doi: 10.5897/JPBCS2014.0474
Cai, Y. X., Wang, W., Zhu, Z. W., Zhang, Z. J., Lang, Y. Z., and Zhu, Q. S. (2006). Effects of water stress during grain-filling period on rice grain yield and its quality under different nitrogen levels. J. Appl. Ecol. 17, 1201–1206. doi: 10.1360/yc-006-1280
Cantrell, R. P., and Reeves, T. G. (2002). The cereal of the world's poor takes center stage. Science 296:53. doi: 10.1126/science.1070721
Chang, F. Y., Hatakeyma, Y., Nonami, H., Erra-Balsells, R., Araki, T., Nakano, H., et al. (2021). Metabolic coordination of rice seed development to nighttime warming: in-situ determination of cellular redox states using picolitre pressure-probe electrospray-ionization mass spectrometry. Environ. Exp. Bot. 188:104515. doi: 10.1016/j.envexpbot.2021.104515
Chen, Z. K., Li, P., Du, Y. F., Jiang, Y., Cai, M. L., and Cao, C. G. (2021). Dry cultivation and cultivar affect starch synthesis and traits to define rice grain quality in various panicle parts. Carbohydr. Polym. 269:118336. doi: 10.1016/j.carbpol.2021.118336
Deng, F., Wang, L., Pu, S. L., Mei, X. F., Li, S. X., Li, Q. P., et al. (2018). Shading stress increases chalkiness by postponing caryopsis development and disturbing starch characteristics of rice grains. Agric. For. Meteorol. 263, 49–58. doi: 10.1016/j.agrformet.2018.08.006
Dou, Z., Tang, S., Li, G. H., Liu, Z. H., Ding, C. Q., Chen, L., et al. (2017). Application of nitrogen fertilizer at heading stage improves rice quality under elevated temperature during grain-filling stage. Crop. Sci. 57, 2183–2192. doi: 10.2135/cropsci2016.05.0350
DuBois, M., Gilles, K. A., Hamilton, J. K., Rebers, P. A., and Smith, F. (1956). Colorimetric method for determination of sugars and related substances. Anal. Chem. 28, 350–356. doi: 10.1021/ac60111a017
Fitzgerald, M. A., McCouch, S. R., and Hall, R. D. (2009). Not just a grain of rice: the quest for quality. Trends Plant Sci. 14, 133–139. doi: 10.1016/j.tplants.2008.12.004
Gong, J. Y., Miao, J. S., Zhao, Y., Zhao, Q., Feng, Q., Zhan, Q. L., et al. (2017). Dissecting the genetic basis of grain shape and chalkiness traits in hybrid rice using multiple collaborative populations. Mol. Plant 10, 1353–1356. doi: 10.1016/j.molp.2017.07.014
Gu, J. F., Chen, J., Chen, L., Wang, Z. Q., Zhang, H., and Yang, J. C. (2015). Grain quality changes and responses to nitrogen fertilizer of japonica rice cultivars released in the Yangtze River basin from the 1950s to 2000s. Crop J. 3, 285–297. doi: 10.1016/j.cj.2015.03.007
Gu, J. F., Chen, Y., Zhang, H., Li, Z. K., Zhou, Q., Yu, C., et al. (2017). Canopy light and nitrogen distributions are related to grain yield and nitrogen use efficiency in rice. Field Crop Res 206, 74–85. doi: 10.1016/j.fcr.2017.02.021
Huang, L. Y., Yang, D. S., Li, X. X., Peng, S. B., and Wang, F. (2019). Coordination of high grain yield and high nitrogen use efficiency through large sink size and high post-heading source capacity in rice. Field Crop Res 233, 49–58. doi: 10.1016/j.fcr.2019.01.005
Ishimaru, T., Horigane, A. K., Ida, M., Iwasawa, N., and Yoshida, M. (2009). Formation of grain chalkiness and changes in water distribution in developing rice caryopses grown under high-temperature stress. J. Cereal Sci. 50, 166–174. doi: 10.1016/j.jcs.2009.04.011
Ito, S., Hara, T., Kawanami, Y., Watanabe, T., Thiraporn, K., Ohtake, N., et al. (2009). Carbon and nitrogen transport during grain filling in rice under high-temperature conditions. J. Agron. Crop Sci. 195, 368–376. doi: 10.1111/j.1439-037X.2009.00376.x
Li, H. Y., Prakash, S., Nicholson, T. M., Fitzgerald, M. A., and Gilbert, R. G. (2016). The importance of amylose and amylopectin fine structure for textural properties of cooked rice grains. Food Chem. 196, 702–711. doi: 10.1016/j.foodchem.2015.09.112
Lin, Z. M., Zhang, X. C., Wang, Z. X., Jiang, Y. T., Liu, Z. H., Alexander, D., et al. (2017). Metabolomic analysis of pathways related to rice grain chalkiness by a notched-belly mutant with high occurrence of white-belly grains. BMC Plant Biol. 17, 1–15. doi: 10.1186/s12870-017-0985-7
Lin, Z. M., Zheng, D. Y., Zhang, X. C., Wang, Z. X., Lei, J. C., Liu, Z. H., et al. (2016). Chalky part differs in chemical composition from translucent part of japonica rice grains as revealed by a notched-belly mutant with white-belly. J. Sci. Food Agr. 96, 3937–3943. doi: 10.1002/jsfa.7793
Lisle, A. J., Martin, M., and Fitzgerald, M. A. (2000). Chalky and translucent rice grains differ in starch composition and structure and cooking properties. Cereal Chem. 77, 627–632. doi: 10.1094/CCHEM.2000.77.5.627
Peng, B., Wang, L. Q., Fan, C. C., Jiang, G. H., Luo, L. J., Li, Y. B., et al. (2014). Comparative mapping of chalkiness components in rice using five populations across two environments. BMC Genet. 15, 1–14. doi: 10.1186/1471-2156-15-49
Phan, T. T. T., Ishibashi, Y., Miyazaki, M., Tran, H. T., Okamura, K., Tanaka, S., et al. (2013). High temperature-induced repression of the rice sucrose transporter (OsSUT1) and starch synthesis-related genes in sink and source organs at milky ripening stage causes chalky grains. J. Agron. Crop Sci. 199, 178–188. doi: 10.1111/jac.12006
Raju, G. N., and Srinivas, T. (1991). Effect of physical, physiological, and chemical factors on the expression of chalkiness in rice. Cereal Chem. 68, 210–211.
Rao, Y., Li, Y., and Qian, Q. (2014). Recent progress on molecular breeding of rice in China. Plant Cell Rep. 33, 551–564. doi: 10.1007/s00299-013-1551-x
Satoh, H., Shibahara, K., Tokunaga, T., Nishi, A., Tasaki, M., Hwang, S. K., et al. (2008). Mutation of the plastidial α-glucan phosphorylase gene in rice affects the synthesis and structure of starch in the endosperm. Plant Cell 20, 1833–1849. doi: 10.1105/tpc.107.054007
Shi, W. J., Yin, X. Y., Struik, P. C., Solis, C., Xie, F. M., Schmidt, R. C., et al. (2017). High day- and night-time temperatures affect grain growth dynamics in contrasting rice genotypes. J. Exp. Bot. 68, 5233–5245. doi: 10.1093/jxb/erx344
Shimoyanagi, R., Abo, M., and Shiotsu, F. (2021). Higher temperatures during grain filling affect grain chalkiness and rice nutrient contents. Agronomy 11:1360. doi: 10.3390/agronomy11071360
Singh, N., Sodhi, N. S., Kaur, M., and Saxena, S. K. (2003). Physico-chemical, morphological, thermal, cooking and textural properties of chalky and translucent rice kernels. Food Chem. 82, 433–439. doi: 10.1016/S0308-8146(03)00007-4
Sun, Y. J., Ma, J., Sun, Y. Y., Xu, H., Yang, Z. Y., Liu, S. J., et al. (2012). The effects of different water and nitrogen managements on yield and nitrogen use efficiency in hybrid rice of China. Field Crop. Res. 127, 85–98. doi: 10.1016/j.fcr.2011.11.015
Sun, Y. J., Wu, Y. X., Sun, Y. Y., Luo, Y. H., Guo, C. C., Li, B., et al. (2022). Effects of water and nitrogen on grain filling characteristics, canopy microclimate with chalkiness of directly seeded rice. Agriculture 12, 122. doi: 10.3390/agriculture12010122
Sun, Y. J., Yan, F. J., Sun, Y. Y., Xu, H., Guo, X., Yang, Z. Y., et al. (2018). Effects of different water regimes and nitrogen application strategies on grain filling characteristics and grain yield in hybrid rice. Arch. Agron. Soil Sci. 64, 1152–1171. doi: 10.1080/03650340.2017.1414946
Tang, S., Zhang, H. X., Liu, W. Z., Dou, Z., Zhou, Q. Y., Chen, W. Z., et al. (2019). Nitrogen fertilizer at heading stage effectively compensates for the deterioration of rice quality by affecting the starch-related properties under elevated temperatures. Food Chem. 277, 455–462. doi: 10.1016/j.foodchem.2018.10.137
Tao, Y., Din, A. M. U., An, L., Chen, H., Li, G. H., Ding, Y. F., et al. (2022). Metabolic disturbance induced by the embryo contributes to the formation of chalky endosperm of a notched-belly rice mutant. Front. Plant Sci. 12:760597. doi: 10.3389/fpls.2021.760597
Tashiro, T., and Wardlaw, I. F. (1991). The effect of high temperature on kernel dimensions and the type and occurrence of kernel damage in rice. Aust. J. Agr. Res. 42, 485–496. doi: 10.1071/AR9910485
Wada, H., Hatakeyama, Y., Onda, Y., Nonami, H., Nakashima, T., Erra-Balsells, R., et al. (2019). Multiple strategies for heat adaptation to prevent chalkiness in the rice endosperm. J. Exp. Bot. 70, 1299–1311. doi: 10.1093/jxb/ery427
Wang, W. W., Meng, B., Ge, X. M., Song, S. H., Yang, Y., Yu, X. M., et al. (2008). Proteomic profiling of rice embryos from a hybrid rice cultivar and its parental lines. J. Proteomics 8, 4808–4821. doi: 10.1002/pmic.200701164
Wei, H. H., Meng, T. Y., Li, X. Y., Dai, Q. G., Zhang, H. C., and Yin, X. Y. (2018). Sink-source relationship during rice grain filling is associated with grain nitrogen concentration. Field Crop. Res. 215, 23–38. doi: 10.1016/j.fcr.2017.09.029
Wei, H. H., Meng, T. Y., Li, C., Xu, K., Huo, Z. Y., Wei, H. Y., et al. (2017). Comparisons of grain yield and nutrient accumulation and translocation in high-yielding japonica/indica hybrids, indica hybrids, and japonica conventional varieties. Field Crop. Res. 204, 101–109. doi: 10.1016/j.fcr.2017.01.001
Wei, H. Y., Zhu, Y., Qiu, S., Han, C., Hu, L., Xu, D., et al. (2018a). Combined effect of shading time and nitrogen level on grain filling and grain quality in japonica super rice. J. Integr. Agric. 17, 2405–2417. doi: 10.1016/S2095-3119(18)62025-8
Xi, M., Lin, Z. M., Zhang, X. C., Liu, Z. H., Li, G. H., Wang, Q. S., et al. (2014). Endosperm structure of white-belly and white-core rice grains shown by scanning electron microscopy. Plant Prod. Sci. 17, 285–290. doi: 10.1626/pps.17.285
Xi, M., Wu, W. G., Xu, Y. Z., Zhou, Y. J., Chen, G., Ji, Y. L., et al. (2020). iTRAQ-based quantitative proteomic analysis reveals the metabolic pathways of grain chalkiness in response to nitrogen topdressing in rice. Plant Physiol. Biochem. 154, 622–635. doi: 10.1016/j.plaphy.2020.06.012
Yang, W. F., Liang, J. Y., Hao, Q. W., Luan, X., Tan, Q. Y., Lin, S. W., et al. (2021). Fine mapping of two grain chalkiness QTLs sensitive to high temperature in rice. Rice 14, 1–10. doi: 10.1186/s12284-021-00476-x
Yang, J. C., Zhang, J. H., Wang, Z. Q., Liu, L. J., and Zhu, Q. S. (2003). Postanthesis water deficits enhance grain filling in two-line hybrid rice. Crop. Sci. 43, 2099–2108. doi: 10.2135/cropsci2003.2099
Yoshioka, Y., Iwata, H., Tabata, M., Ninomiya, S., and Ohsawa, R. (2007). Chalkiness in rice: potential for evaluation with image analysis. Crop. Sci. 47, 2113–2120. doi: 10.2135/cropsci2006.10.0631sc
Yu, L., Liu, Y. H., Lu, L. N., Zhang, Q. L., Chen, Y. Z., Zhou, L. P., et al. (2017). Ascorbic acid deficiency leads to increased grain chalkiness in transgenic rice for suppressed of L-GalLDH. J. Plant Physiol. 211, 13–26. doi: 10.1016/j.jplph.2016.11.017
Yu, X. M., Yuan, F. J., Fu, X. J., and Zhu, D. H. (2016). Profiling and relationship of water-soluble sugar and protein compositions in soybean seeds. Food Chem. 196, 776–782. doi: 10.1016/j.foodchem.2015.09.092
Zhang, Y. J. (1977). Determination of glucose, fructose, sucrose and starch in fruit and vegetable with anthrone colorimetric method. Chin. J. Anal. Chem. 5, 167–171.
Zhang, J., Xie, Z. W., Zhu, M. M., Kong, Y., and Xiong, F. (2008). Effects of nitrogen applied at different stages on photosynthetic traits of flag leaf and rice quality. Jiangsu J. Agric. Sci 24, 656–661. doi: 10.3901/JME.2008.09.177
Zhang, J., Zhang, Y. Y., Song, N. Y., Chen, Q. L., Sun, H. Z., Ting, P., et al. (2021). Response of grain-filling rate and grain quality of mid-season indica rice to nitrogen application. J. Integr. Agric. 20, 1465–1473. doi: 10.1016/S2095-3119(20)63311-1
Zhao, X. Q., and Fitzgerald, M. (2013). Climate change: implications for the yield of edible rice. PLoS One 8:e66218. doi: 10.1371/journal.pone.0066218
Zhao, Q., Ye, Y., Han, Z. Y., Zhou, L. J., Guan, X. Y., Pan, G., et al. (2020). SSIIIa-RNAi suppression associated changes in rice grain quality and starch biosynthesis metabolism in response to high temperature. Plant Sci. 294:110443. doi: 10.1016/j.plantsci.2020.110443
Zheng, L., Zhang, W., Liu, S., Chen, L., Liu, X., Chen, X., et al. (2012). Genetic relationship between grain chalkiness, protein content, and paste viscosity properties in a backcross inbred population of rice. J. Cereal Sci. 56, 153–160. doi: 10.1016/j.jcs.2012.05.003
Zhou, L. J., Liang, S. S., Ponce, K., Marundon, S., Ye, G. Y., and Zhao, X. Q. (2015). Factors affecting head rice yield and chalkiness in indica rice. Field Crop Res 172, 1–10. doi: 10.1016/j.fcr.2014.12.004
Zhou, T. Y., Zhou, Q., Li, E. P., Yuan, L. M., Wang, W. L., Zhang, H., et al. (2020). Effects of nitrogen fertilizer on structure and physicochemical properties of ‘super’ rice starch. Carbohydr. Polym. 239:116237. doi: 10.1016/j.carbpol.2020.116237
Keywords: nitrogen, carbohydrate, dynamic accumulation, grain-filling, chalkiness
Citation: Guo C, Yuan X, Yan F, Xiang K, Wu Y, Zhang Q, Wang Z, He L, Fan P, Yang Z, Chen Z, Sun Y and Ma J (2022) Nitrogen Application Rate Affects the Accumulation of Carbohydrates in Functional Leaves and Grains to Improve Grain Filling and Reduce the Occurrence of Chalkiness. Front. Plant Sci. 13:921130. doi: 10.3389/fpls.2022.921130
Edited by:
Min Huang, Hunan Agricultural University, ChinaReviewed by:
Yanhua Zeng, Jiangxi Agricultural University, ChinaCopyright © 2022 Guo, Yuan, Yan, Xiang, Wu, Zhang, Wang, He, Fan, Yang, Chen, Sun and Ma. This is an open-access article distributed under the terms of the Creative Commons Attribution License (CC BY). The use, distribution or reproduction in other forums is permitted, provided the original author(s) and the copyright owner(s) are credited and that the original publication in this journal is cited, in accordance with accepted academic practice. No use, distribution or reproduction is permitted which does not comply with these terms.
*Correspondence: Yongjian Sun, eW9uZ2ppYW5zMTk4MEAxNjMuY29t; Jun Ma, bWFqdW5wMjAwMkAxNjMuY29t
Disclaimer: All claims expressed in this article are solely those of the authors and do not necessarily represent those of their affiliated organizations, or those of the publisher, the editors and the reviewers. Any product that may be evaluated in this article or claim that may be made by its manufacturer is not guaranteed or endorsed by the publisher.
Research integrity at Frontiers
Learn more about the work of our research integrity team to safeguard the quality of each article we publish.