 Hyo In Yoon
 Jaewoo Kim1
 Jung Eek Son
94% of researchers rate our articles as excellent or good
Learn more about the work of our research integrity team to safeguard the quality of each article we publish.
Find out more
ORIGINAL RESEARCH article
Front. Plant Sci. , 09 June 2022
Sec. Technical Advances in Plant Science
Volume 13 - 2022 | https://doi.org/10.3389/fpls.2022.918170
This article is part of the Research Topic Advanced Technologies for Energy Saving, Plant Quality Control and Mechanization Development in Plant Factory View all 14 articles
Ultraviolet-B (UV-B, 280–315 nm) radiation has been known as an elicitor to enhance bioactive compound contents in plants. However, unpredictable yield is an obstacle to the application of UV-B radiation to controlled environments such as plant factories. A typical three-dimensional (3D) plant structure causes uneven UV-B exposure with leaf position and age-dependent sensitivity to UV-B radiation. The purpose of this study was to develop a model for predicting phenolic accumulation in kale (Brassica oleracea L. var. acephala) according to UV-B radiation interception and growth stage. The plants grown under a plant factory module were exposed to UV-B radiation from UV-B light-emitting diodes with a peak at 310 nm for 6 or 12 h at 23, 30, and 38 days after transplanting. The spatial distribution of UV-B radiation interception in the plants was quantified using ray-tracing simulation with a 3D-scanned plant model. Total phenolic content (TPC), total flavonoid content (TFC), total anthocyanin content (TAC), UV-B absorbing pigment content (UAPC), and the antioxidant capacity were significantly higher in UV-B-exposed leaves. Daily UV-B energy absorbed by leaves and developmental age was used to develop stepwise multiple linear regression models for the TPC, TFC, TAC, and UAPC at each growth stage. The newly developed models accurately predicted the TPC, TFC, TAC, and UAPC in individual leaves with R2 > 0.78 and normalized root mean squared errors of approximately 30% in test data, across the three growth stages. The UV-B energy yields for TPC, TFC, and TAC were the highest in the intermediate leaves, while those for UAPC were the highest in young leaves at the last stage. To the best of our knowledge, this study proposed the first statistical models for estimating UV-B-induced phenolic contents in plant structure. These results provided the fundamental data and models required for the optimization process. This approach can save the experimental time and cost required to optimize the control of UV-B radiation.
Brassica species are vegetables containing high levels of nutrients and health-promoting phytochemicals (Francisco et al., 2017). Kale (B. oleracea var. acephala) is a functional food that benefits human health, supported by much scientific evidence, and is a rich source of bioactive compounds such as polyphenols and carotenoids with antioxidant capacity (AOC; Šamec et al., 2019). The biosynthesis of such bioactive compounds is improved through biotic and abiotic elicitation (Thakur et al., 2019). Ultraviolet (UV) radiation, especially Ultraviolet-B (UV-B; 280–315 nm), has been reported as an effective elicitor (Loconsole and Santamaria, 2021). Contrary to the long-held opinion that UV-B radiation is predominantly harmful to plants, recent studies have highlighted that a low fluence rate of UV-B radiation triggers distinct changes in the secondary metabolism, resulting in bioactive compound accumulation such as phenolics and flavonoids (Schreiner et al., 2012). The accumulation of phenolics in epidermal tissues acts as a sunscreen, and their innate antioxidant potential protects underlying sensitive tissues from UV-B-induced damage (Takshak and Agrawal, 2019). However, the localized accumulation may complicate the distribution of phenolics depending on developmental age and uneven UV-B exposure with leaf position (Csepregi et al., 2017; Yoon et al., 2021a).
Ultraviolet-B-induced metabolic changes are multifaceted in terms of optical, morphological, and physiological factors; therefore, the use of UV-B radiation requires more precise manipulation to enhance the phenolic content (Schreiner et al., 2012). The actual dose perceived by the plant tissue depends not only on UV-B intensity from the light source but also on various optical factors and the morphological structure of the plant (Schreiner et al., 2012). Even under natural light, the attenuation of UV radiation in the plant canopy is affected by the spatial distribution and angle of the leaves, which are difficult to mathematically describe (Aphalo et al., 2012). Even without plants, lighting conditions with various optical factors, such as lighting distance, physical light distribution, and spectral power distribution of light sources, affect the spatial light distribution simulated in a growth chamber (Hitz et al., 2019). In addition, the simulated light absorbed by leaves depends on planting density and lighting arrangement as well as the three-dimensional (3D) structure of the plant in a controlled environment (Kim et al., 2020).
The developmental stage of plants is a strong determinant of the stress response and susceptibility to various environmental stresses (Rankenberg et al., 2021). In some cases, physiologically young leaves showed higher sensitivity to UV-B radiation, resulting in higher amounts of phenolics, higher AOC, or a higher expression of phenylpropanoid pathway genes (Majer and Hideg, 2012; Rizi et al., 2021). Furthermore, phenolic changes were more affected by the developmental stage than by UV-B levels in pak choi plants (Heinze et al., 2018). However, young leaves, typically located near the top of the plant, are exposed to targeted lighting conditions, while older leaves rely on light penetration in the 3D structure of plants. The effect of the developmental stage cannot be separated from the positional light-exposure effect. For experimental purposes, positional UV-exposure effects can be avoided by selecting plants with a 2D structure (Majer and Hideg, 2012; Csepregi et al., 2017). The UV dose absorbed by the leaves in the 3D structure has been attempted to be quantified through simulation with a 3D-scanned plant model, and the UV exposure and developmental effects could be separately analyzed (Yoon et al., 2021a,b).
For the application of UV-B radiation to phenolic production, a common strategy is to find a combination of UV-B-related factors, such as UV-B dose (fluence rate and duration), timing (plant developmental stage at which UV-B exposure is initiated), or wavelength/type of UV-B (Schreiner et al., 2009; Sun et al., 2010; Rechner et al., 2016; Dou et al., 2019). Traditional UV-B lamps are prone to causing photosynthetic damage to plants due to their broadband wavelength range, including shorter wavelengths close to UV-C (100–280 nm) and excessive and difficult-to-control energy (Mosadegh et al., 2019; Yoon et al., 2020). Recently, the performance of light-emitting diodes (LEDs) has advanced enough to provide light of the desired wavelength and intensity for plants (Kneissl et al., 2019; Loi et al., 2020; Paradiso and Proietti, 2021). Narrowband UV-B LEDs have also been applied at low doses to enhance health-promoting compound accumulation without damaging plants (Wiesner-Reinhold et al., 2021). Since the application of UV-B radiation incurs additional energy costs, either UV-B energy efficiency or maximum phenolic production should be pursued in controlled environmental agriculture. Prediction of UV-B-induced phenolic content will allow us to find the optimal UV-B conditions for maximizing phenolic production.
Statistical modeling has widely been used because it is simple but powerful for predicting and quantifying the relationship between variables (Kim et al., 2016). The plant developmental stage affects plant structures as well as their sensitivity to UV-B radiation (Yoon et al., 2021b). Thus, the phenolic production could be quantified with the modeling based on developmental age and UV-B radiation on the plant structure. This study focused on preharvest UV-B exposure as an elicitor for the biosynthesis of phenolics in non-acclimated plants to rule out possible UV-B acclimation effects (Liao et al., 2020). This study aimed to analyze UV-B-induced phenolic accumulation with preharvest UV-B exposure based on UV-B radiation interception and developmental stage of plants, and ultimately aimed to develop statistical models and investigate the UV-B energy yield for the phenolic accumulation. For this purpose, the contents of phenolics, flavonoids, anthocyanin, UV-absorbing pigments, and chlorophylls were evaluated in individual leaves with UV-B radiation interception simulated with 3D-scanned plant models according to growth stage.
Kale (B. oleracea L. var. acephala) seeds were sown on sponge cubes in water culture under fluorescent lamps at a photosynthetic photon flux density (PPFD) of 150 μmol m–2 s–1 over the waveband 400–700 nm for a 16-h light period (Yoon et al., 2021a,b). After true leaves appeared, seedlings were supplied with a nutrient solution for Brassica modified from a previous study (Choi et al., 2005): N 137.8, P 30.9, K 140.9, Ca 104.6, Mg 54.8, Fe 2.76, Cu 0.02, Zn 0.05, Mn 0.68, B 0.50, and Mo 0.01 mg L–1, at an electrical conductivity (EC) of 0.6 dS m–1. After the fourth true leaf appeared, the seedlings of uniform size were transplanted into plant factory modules with a deep flow technique system. The modules were maintained at an air temperature of 19–22°C, relative humidity of 65–75%, a CO2 concentration of 500 μmol mol–1, an EC of 1.18–1.22 dS m–1, and a pH of 6.8–7.0. The plants were irradiated with red, blue, and white LEDs at a PPFD of 255 μmol m–2 s–1 (at 7 cm from the center of the ground) for a 16-h light period. In kale plants grown in plant factories (Yoon et al., 2019) or fields (Hagen et al., 2009) under normal conditions, the concentration of bioactive compounds was not significantly different depending on the harvest time. Therefore, the harvest time was determined as 4 weeks when the total fresh mass reached around 100 g, which is sufficient for sale (Supplementary Figure 1). The four plants per treatment were harvested separately at 23, 30, and 38 days after transplanting (DAT).
For UV treatment, UV-B LEDs with a spectral peak at approximately 310 nm were used, and the irradiance at 7 cm above the center of the bottom was 3.0 W m–2. The spectrum and intensity of photosynthetically active radiation (PAR) and UV-B LEDs were measured using a spectroradiometer (Blue-Wave spectrometer, StellarNet Inc., Tampa, FL, United States) in the range of 250–900 nm (Figure 1A). The plants at 23, 30, and 38 DAT were irradiated with UV-B LEDs for 6 or 12 h (UV6h or UV12h) and then harvested after recovery for 4 h. The UV6h and UV12h treatments corresponded to 15.6 and 31.3 kJ m–2 day–1 biologically effective UV-B radiation (UV-BBE), respectively, calculated using a biological spectral weighting function for plants (Flint and Caldwell, 2003). The arrangements of PAR and UV-B LEDs are shown in Figure 1B.
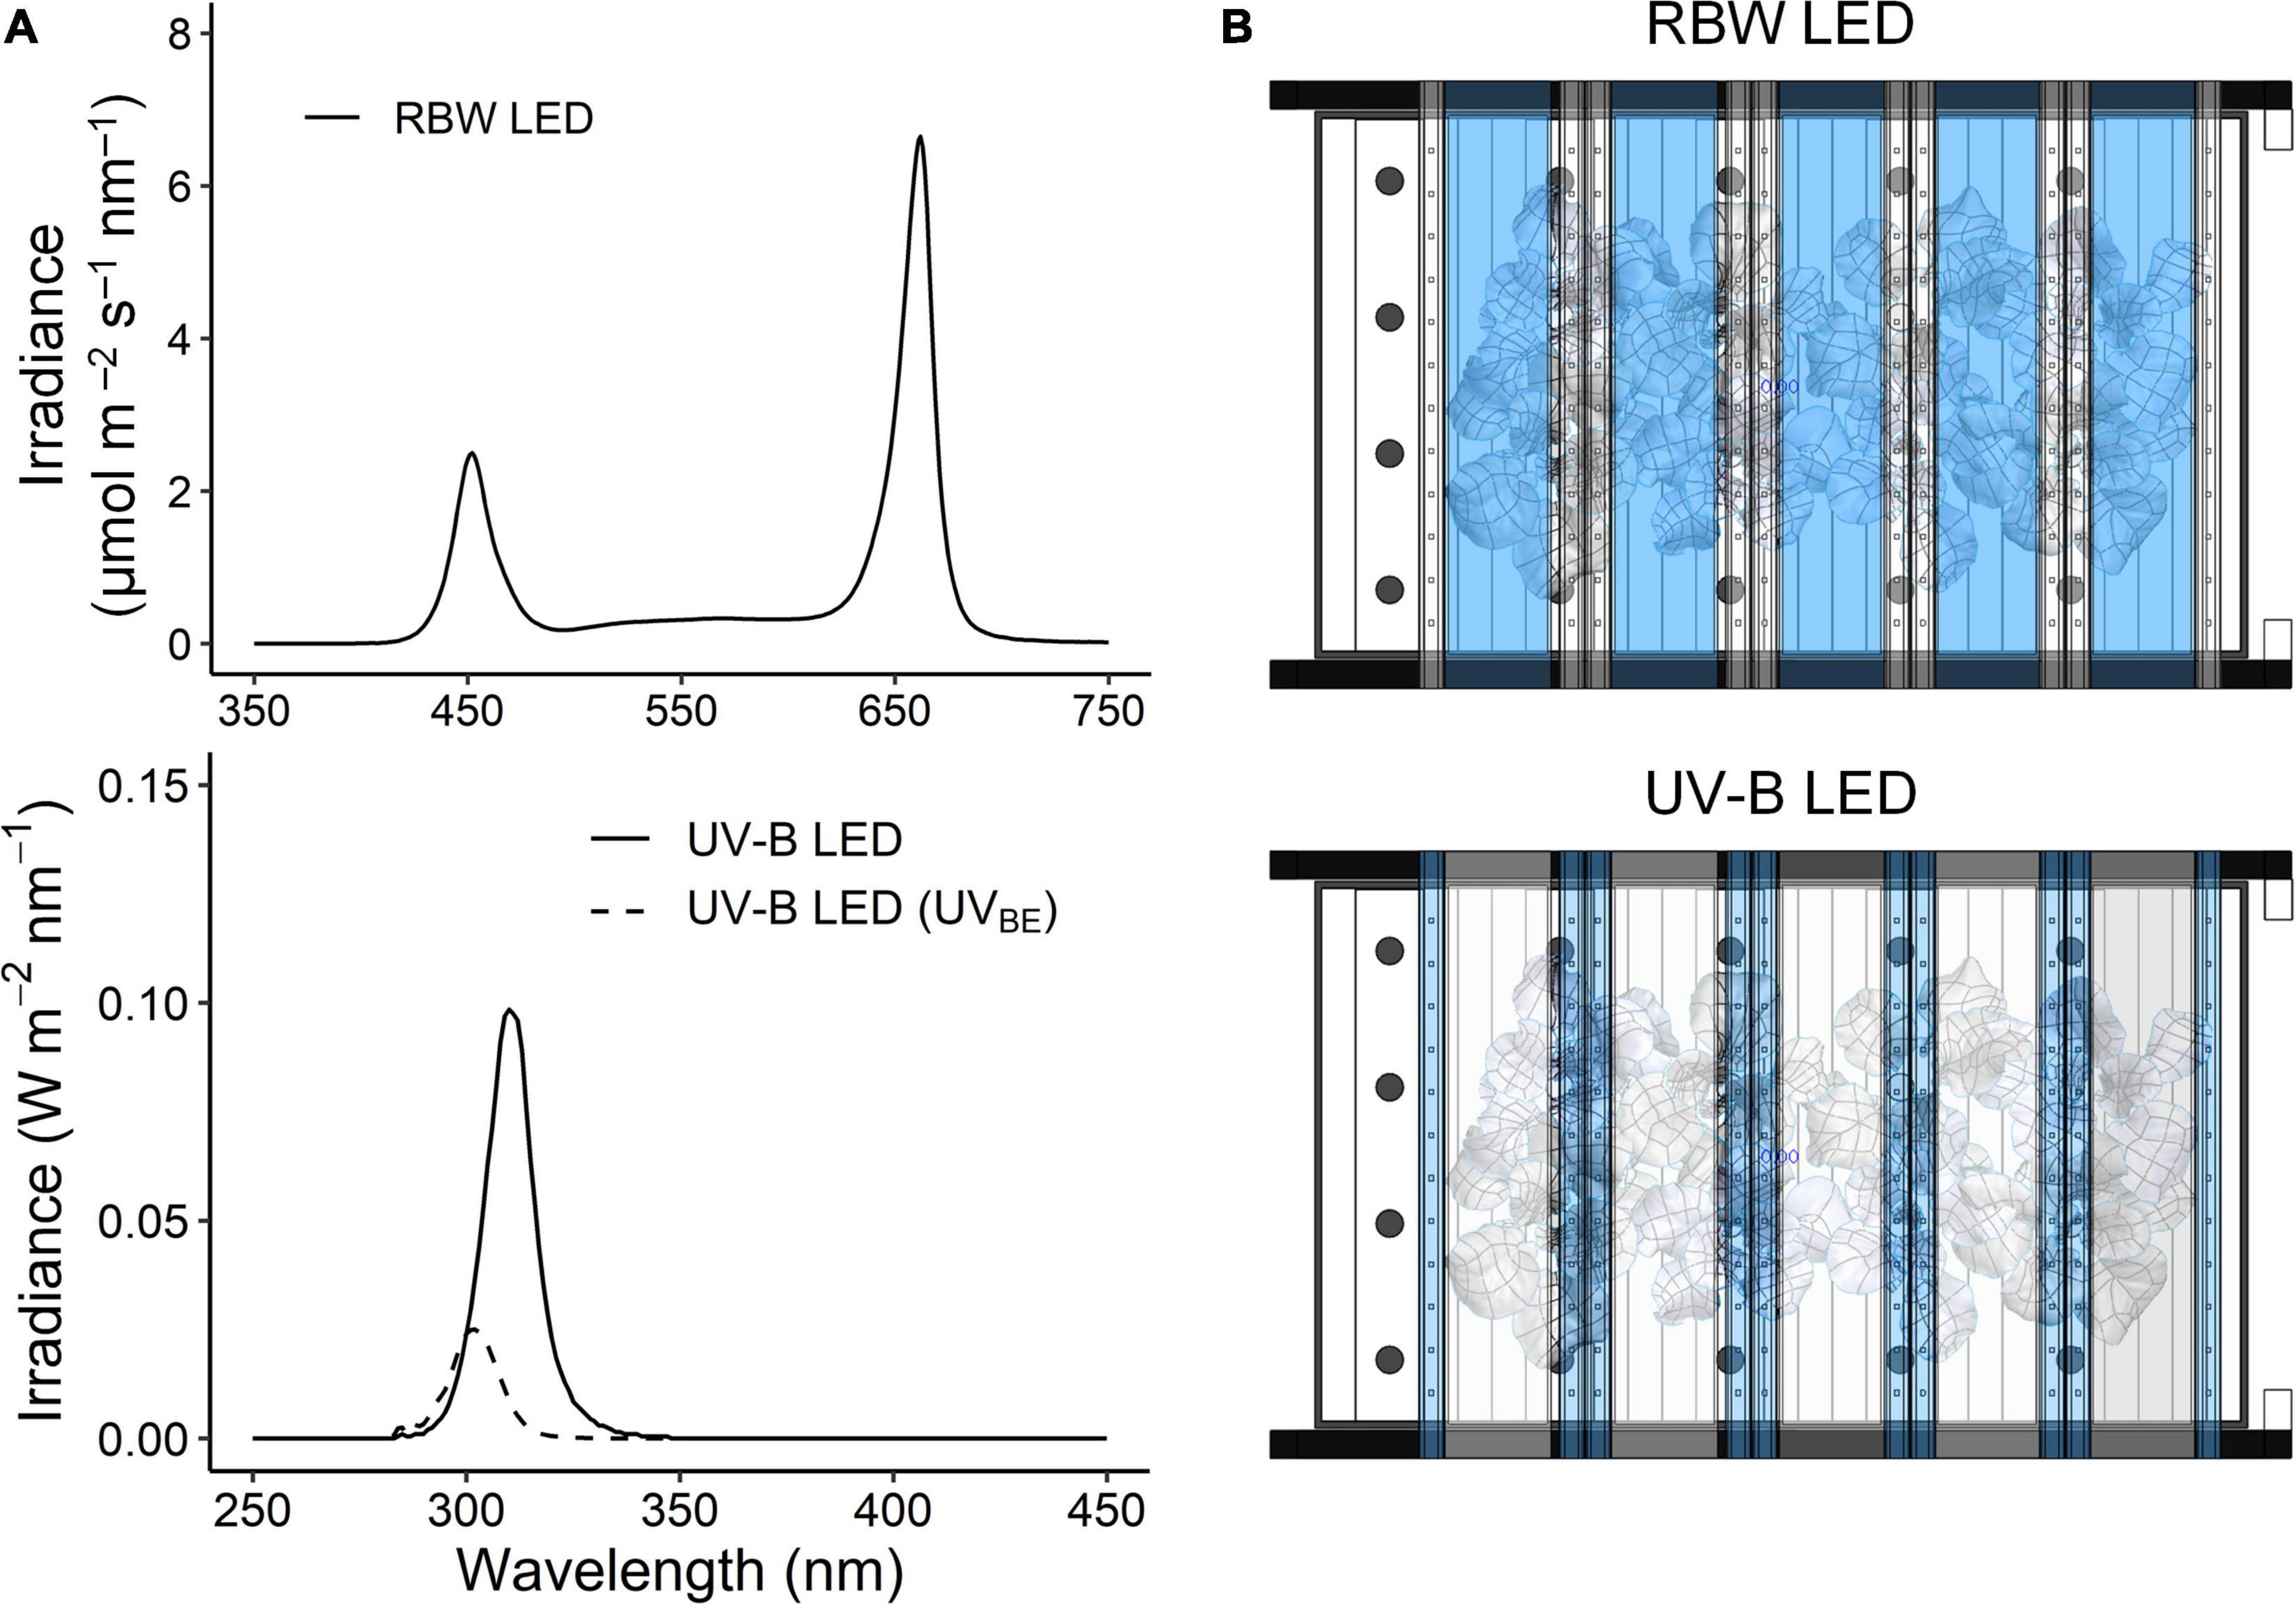
Figure 1. Spectra (A) and arrangement (B) of red, blue, and white light-emitting diodes (RBW LED) and UV-B LED used in the plant factory. The irradiance of UV-B LEDs with a spectral peak at about 310 nm was 3.0 W m– 2 at 280–400 nm. UV-BBE indicates biologically effective UV-B calculated using a biological spectral weighting function for plants (Flint and Caldwell, 2003), and thereby its spectral peak was at about 302 nm. The RBW LEDs irradiated at a photosynthetic photon flux density of 255 μmol m– 2 s– 1.
Ultraviolet radiation interception analysis with a 3D-scanned plant model and ray-tracing simulation was performed as previously described (Kim et al., 2020; Yoon et al., 2021a; Figure 2). In brief, plant models were directly obtained using a high-resolution portable 3D scanner (Go! SCAN50TM, Creaform Inc., Lévis, QC, Canada) and its software (Vxelement, Creaform Inc.). Four plants per treatment were 3D-scanned after the UV treatment at 23, 30, and 38 DAT. After repair for holes and noise, the 3D mesh data were segmented into leaf mesh data and reconstructed into individual surface models using reverse engineering software (Geomagic Design X, 3D Systems, Rock Hill, SC, United States). The virtual plant factory modules based on the dimensions measured were constructed using 3D computer-aided design software (Solidworks, Dassault Systèmes, Vélizy-Villacoublay, France). The 3D model arrangement and simulation parameters, including the optical properties of materials and plants, and the setting of light sources and detectors, are described in Figure 2. All 3D models were placed in the same position and orientation as the actual materials and plants. The ray-tracing simulation was performed using ray-tracing software (Optisworks, Optis Inc., La Farlède, France). The daily UV-B radiation interception on individual leaves was calculated from the simulation results with UV-exposure durations.
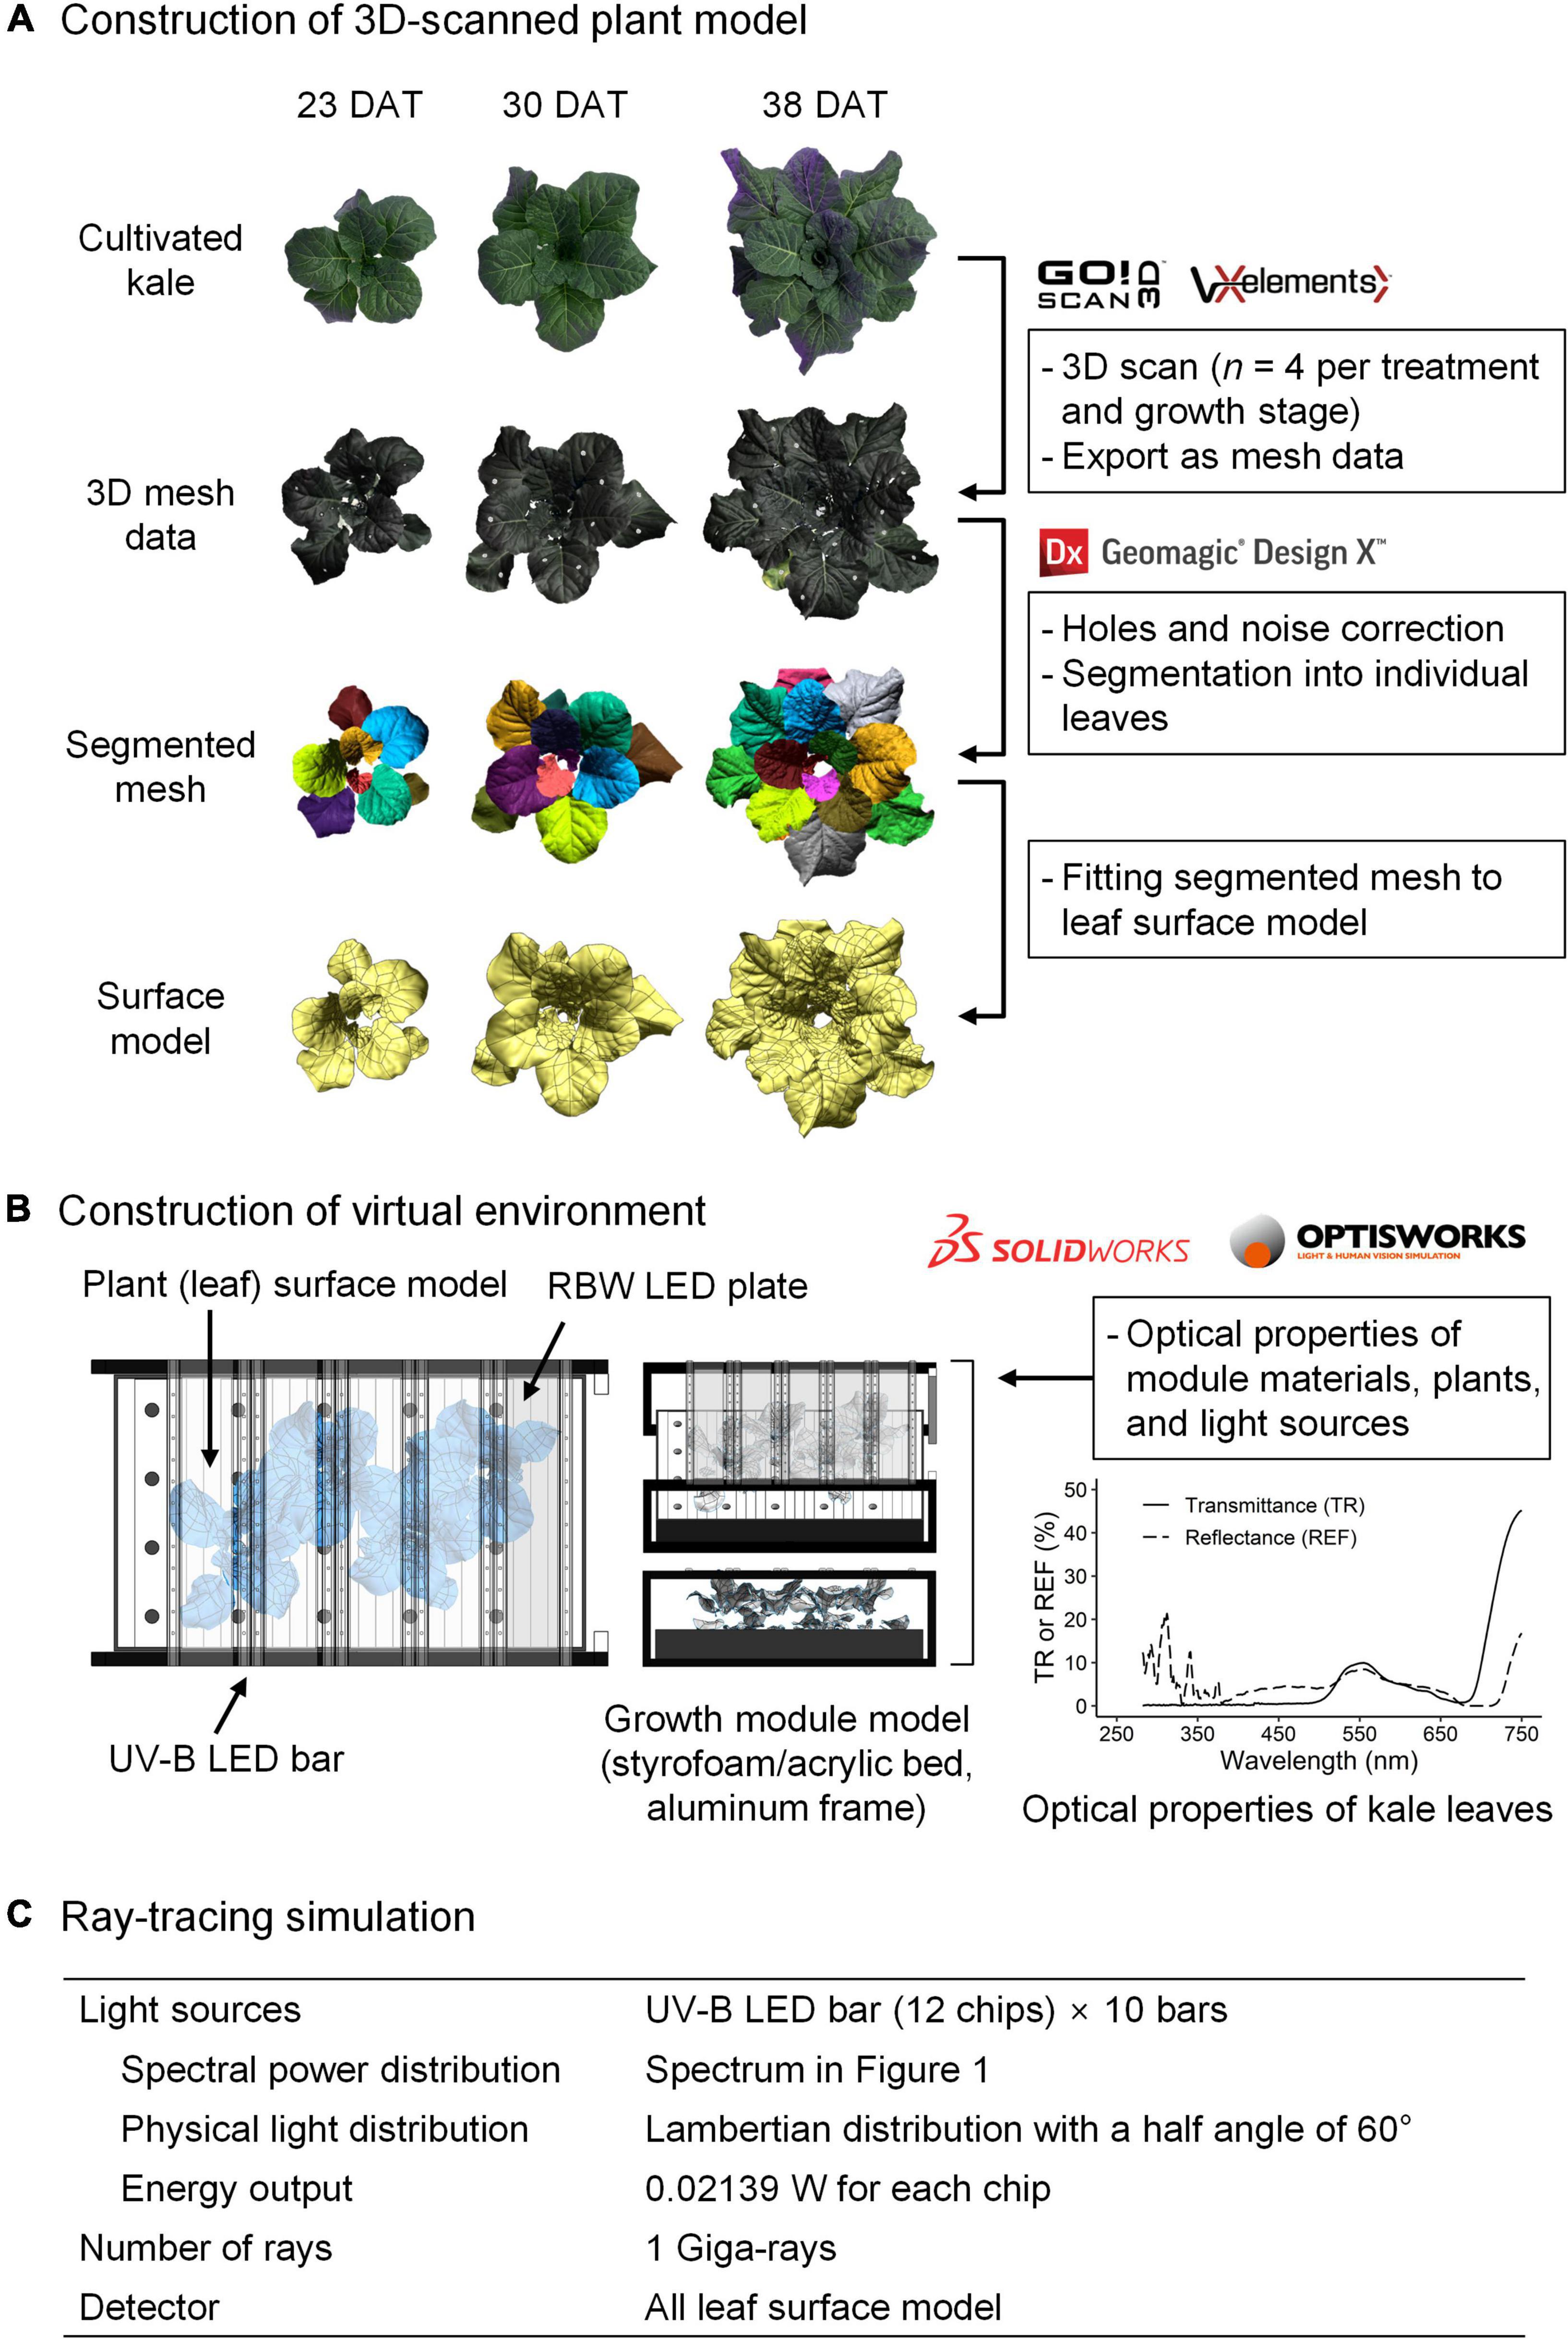
Figure 2. Schematic diagram of 3D scanning to optical simulation for radiation interception analyzed in kale plants. After the construction of a 3D-scanned plant model (A), the virtual environment for simulation (B) consisted of a 3D model of the growth module, light sources, and plants with actual dimensions and arrangement. A ray-tracing simulation (C) was conducted with these parameters. TR, transmittance; REF, reflectance.
Growth parameters, including total fresh mass, total leaf area, and root dry mass, were measured as shown in Supplementary Figure 1. Fresh masses of individual leaves were measured separately at harvest with four plants per treatment (Supplementary Figure 2). After photographing all leaves, the areas of individual leaves were calculated with an image analysis software (ImageJ 1.53, National Institutes of Health, Bethesda, MD, United States). Leaf order was determined as an absolute order of emergence (the first true leaf was set as 1) and was numbered from the oldest leaf at the bottom to the youngest at the top of the plant. Leaf groups at each growth stage were determined based on the relative growth rate of individual leaves, which are shown in Supplementary Figure 3 and Supplementary Table 1 (Behn et al., 2011; Pontarin et al., 2020). Leaf groups 1, 2, and 3 corresponded to leaf orders 1–3, 4–7, and 8–11, respectively, at 23 DAT, leaf orders 3–6, 7–9, and 10–14, respectively, at 30 DAT, and leaf orders 4–8, 9–12, and 13–18, respectively, at 38 DAT.
The whole leaves were sampled separately at harvest and frozen at –80°C. After lyophilization with a freeze dryer (FD8512, Ilshin Biobase Co., Yangju, South Korea) at –80°C under a vacuum of 0.007 mm Hg for 120 h, the leaf dry mass was determined. The lyophilized sample was pulverized in liquid nitrogen using a cryogenic grinder (SPEX 6875D Freezer/Mill, SPEX SamplePrep, Metuchen, NJ, United States), and then stored in the dark at 4°C until needed for analysis. The freeze-milled samples used for the analysis corresponded to leaf orders 5–9, 5–13, and 5–17 at 23, 30, and 38 DAT, respectively.
For determining Total phenolic content (TPC) and total flavonoid content (TFC), aliquots of the powdered sample (50 mg) were mixed with 1 ml of 80% (v/v) methanol, incubated in the dark at 4°C for 18 h, and then centrifuged at 11,000 × g at 4°C for 10 min. TPC was determined according to the Folin–Ciocalteu colorimetric method (Ainsworth and Gillespie, 2007). The supernatant of 100 μl was collected in a 2-ml tube and mixed with 200 μl of 10% (v/v) Folin–Ciocalteu solution (Junsei Chemical Co., Ltd., Tokyo, Japan), and 400 μl of distilled water. After vortex mixing, 800 μl of 700 mM Na2CO3 was added. The mixture was shaken for 10 s and incubated in a water bath at 45°C for 15 min. The absorbance was read at 765 nm using a spectrophotometer (Photolavis, WTW, Weilheim, Germany), and the TPC was expressed as milligrams of gallic acid (Sigma–Aldrich Chemical Corp., St. Louis, MO, United States) equivalent per gram of dry mass (mg GAE g–1 DM). TFC was determined according to the aluminum chloride colorimetric method (Dewanto et al., 2002). The supernatant of 100 μl was collected in a 2-ml tube, and mixed with 500 μl of distilled water and 30 μl of 5% (w/v) NaNO2. After 6 min, 60 μl of 10% (w/v) AlCl3 was added. After 5 min, 200 μl of 1 M NaOH and 110 μl of distilled water were added, and all reactants were thoroughly mixed. After incubating for 5 min, the absorbance was read at 510 nm, and the TFC was expressed as milligrams of catechin acid (Supelco, Bellefonte, PA, United States) equivalent per gram of dry mass (mg CE g–1 DM).
For determining total anthocyanin content (TAC) and UV-B absorbing pigment content (UAPC), the aliquots of the powdered sample (20 mg) were mixed with 1 ml of 1% acidified methanol, incubated in the dark at 4°C for 48 h, and then centrifuged at 11,000 × g at 4°C for 15 min. The supernatant of the extract was diluted two-fold, and the absorbance was read at 530 and 657 nm (A530 and A657, respectively). TAC was determined with the corrected absorbance as A530, 0.25A657 (Sytar et al., 2018) and expressed as milligrams of cyanidin 3-glucoside (Sigma–Aldrich Chemical Corp.) equivalent per gram of dry mass (mg C3GE g–1 DM). The supernatant of the extract was diluted 20-fold, and the absorbance was read at 285 and 330 nm (Si et al., 2015; Khudyakova et al., 2019). UAPC was determined as the average of two absorbances and expressed as an absorbance per gram of dry mass (OD g–1 DM).
Antioxidant capacity can be determined depending on the choice of the assay, and analyzing phenol-rich samples by a single assay is recommended to be avoided (Csepregi et al., 2016). Thus, both the 2, 2’-azino-bis (3-ethylbenzothiazoline-6-sulfonic acid)-diammonium salt (ABTS) assay and the 2, 2-diphenyl-1-picrylhydrazyl (DPPH) assay were performed. The powdered sample of 50 mg was mixed with 1 ml of 80% (v/v) methanol, and the mixture was incubated in the dark at 4°C for 42 h and then centrifuged at 11,000 × g at 4°C for 10 min. The ABTS radical scavenging activity was determined as described by Re et al. (1999). Briefly, the ABTS radical cation (ABTS+) reagent was produced by reacting 7 mM ABTS solution (Sigma–Aldrich Chemical Corp.) with 2.45 mM K2S2O8 (1:1, v/v), and stored in the dark at 4°C for 18 h before use. The ABTS+ solution was diluted with 80% methanol to obtain appropriate absorbance. The supernatant of 50 μl was added to 1.8 ml of diluted ABTS+ solution. After 6 min of incubation in the dark at room temperature, the absorbance was read at 734 nm. The DPPH radical scavenging activity was determined as described by Brand-Williams et al. (1995). DPPH was purchased from Alfa Aesar (Ward Hill, MA, United States), and the DPPH solution was freshly made in methanol before use. The supernatant of 100 μl was added to 1.8 ml of 0.12 mM DPPH methanol solution. After incubation in the dark at room temperature for 30 min, the absorbance was read at 517 nm. A calibration curve for ABTS and DPPH assays was constructed using L-ascorbic acid (Samchun Pure Chemical Co., Ltd., Pyeongtaek, South Korea). The AOCABTS and AOCDPPH were expressed as milligrams of ascorbic acid equivalent per gram of dry mass (mg AAE g–1 DM).
For determining photosynthetic pigment, the aliquots of the powdered sample (50 mg) were mixed with 1 ml of 80% (v/v) acetone, incubated in the dark at room temperature for 24 h, and then centrifuged at 11,000 × g for 10 min. Chlorophyll a, Chlorophyll b, and carotenoid contents were calculated based on absorbance at 663, 647, and 470 nm according to the method of Lichtenthaler and Buschmann (2001) and expressed as milligrams of chlorophyll or carotenoid per gram of dry mass (mg g–1 DM).
Total phenolic content, TFC, TAC, UAPC, and AOC per leaf were calculated by multiplying their concentrations (mg eq. g–1 DM) by the leaf dry mass (g DM). Stepwise multiple linear regressions were used to develop statistical models for predicting phenolic accumulation. The model was obtained by stepwise regression using the backward elimination method based on a second-order multi-polynomial (quadratic) model, including the single effect of leaf order and UV radiation interception and the interaction effect:
where M is the phenolic content per leaf (mg eq. per leaf), L is leaf order numbered as an absolute order of leaf emergence, U is the daily UV radiation interception per leaf (kJ day–1 per leaf), and β0–β5 are the regression coefficients obtained by the regression analysis at each growth stage. The UV-B energy yield for phenolic accumulation per leaf was determined as the change in the phenolic content per absorbed UV-B energy and calculated as the slope of the multiple regression surface against UV interception as follows:
where Y is UV-B energy yield for phenolic accumulation per leaf (mg eq. kJ–1 day) at each L and U.
For all data, the homogeneity of variance was evaluated using Levene’s test, and the normality was evaluated using the Shapiro–Wilk test. The mean values were compared using one-way or two-way ANOVA and Tukey’s honestly significant difference (HSD) test to assess the effects of the UV-B treatment (control, UV6h, and UV12h), leaf group 1–3, or growth stage (23, 30, and 28 DAT). For data that failed the normality test, the Kruskal–Wallis and Dunn’s tests were used, and for data that failed the homogeneity of variance, the Welch’s ANOVA and Games-Howell tests were used.
For model development, nine plants per growth stage were used for the data set, which corresponded to a total of 250 data points, including 66, 74, and 110 data points at 23, 30, and 38 DAT, respectively, after removing outliers with the interquartile range. For accuracy of the multiple regression model, a data set (not used to develop the model) including nine plants and 76 data points was used for validation. The coefficient of determination (R2), root mean squared error (RMSE), and normalized RMSE were selected. All visualization and statistical analyses were performed using R software (R 4.0.2, R Foundation, Vienna, Austria).
Ultraviolet-B radiation interception with a 3D-scanned plant model was simulated along with the actual plant structure at each growth stage (Figure 3A). The UV radiation interception (UVRint) was significantly higher in the order of leaf groups 3, 2, and 1 (Figure 3B). Across all stages, the UVRint was significantly lower by 51.7% in leaf group 1 and significantly higher by 31.4% in group 3 than in group 2. At 23, 30, and 38 DAT, the mean UVRint was 1.20, 1.28, and 1.05 W m–2, respectively. The daily UVRint per leaf did not significantly differ between the leaf groups 2 and 3 and was affected by individual leaf area (Figure 3C). Across all data, the daily UVRint per plant was significantly higher with growth stage (1.7 ± 0.5, 2.2 ± 0.3, and 2.6 ± 0.4 kJ day–1 per plant at 23, 30, and 38 DAT, respectively).
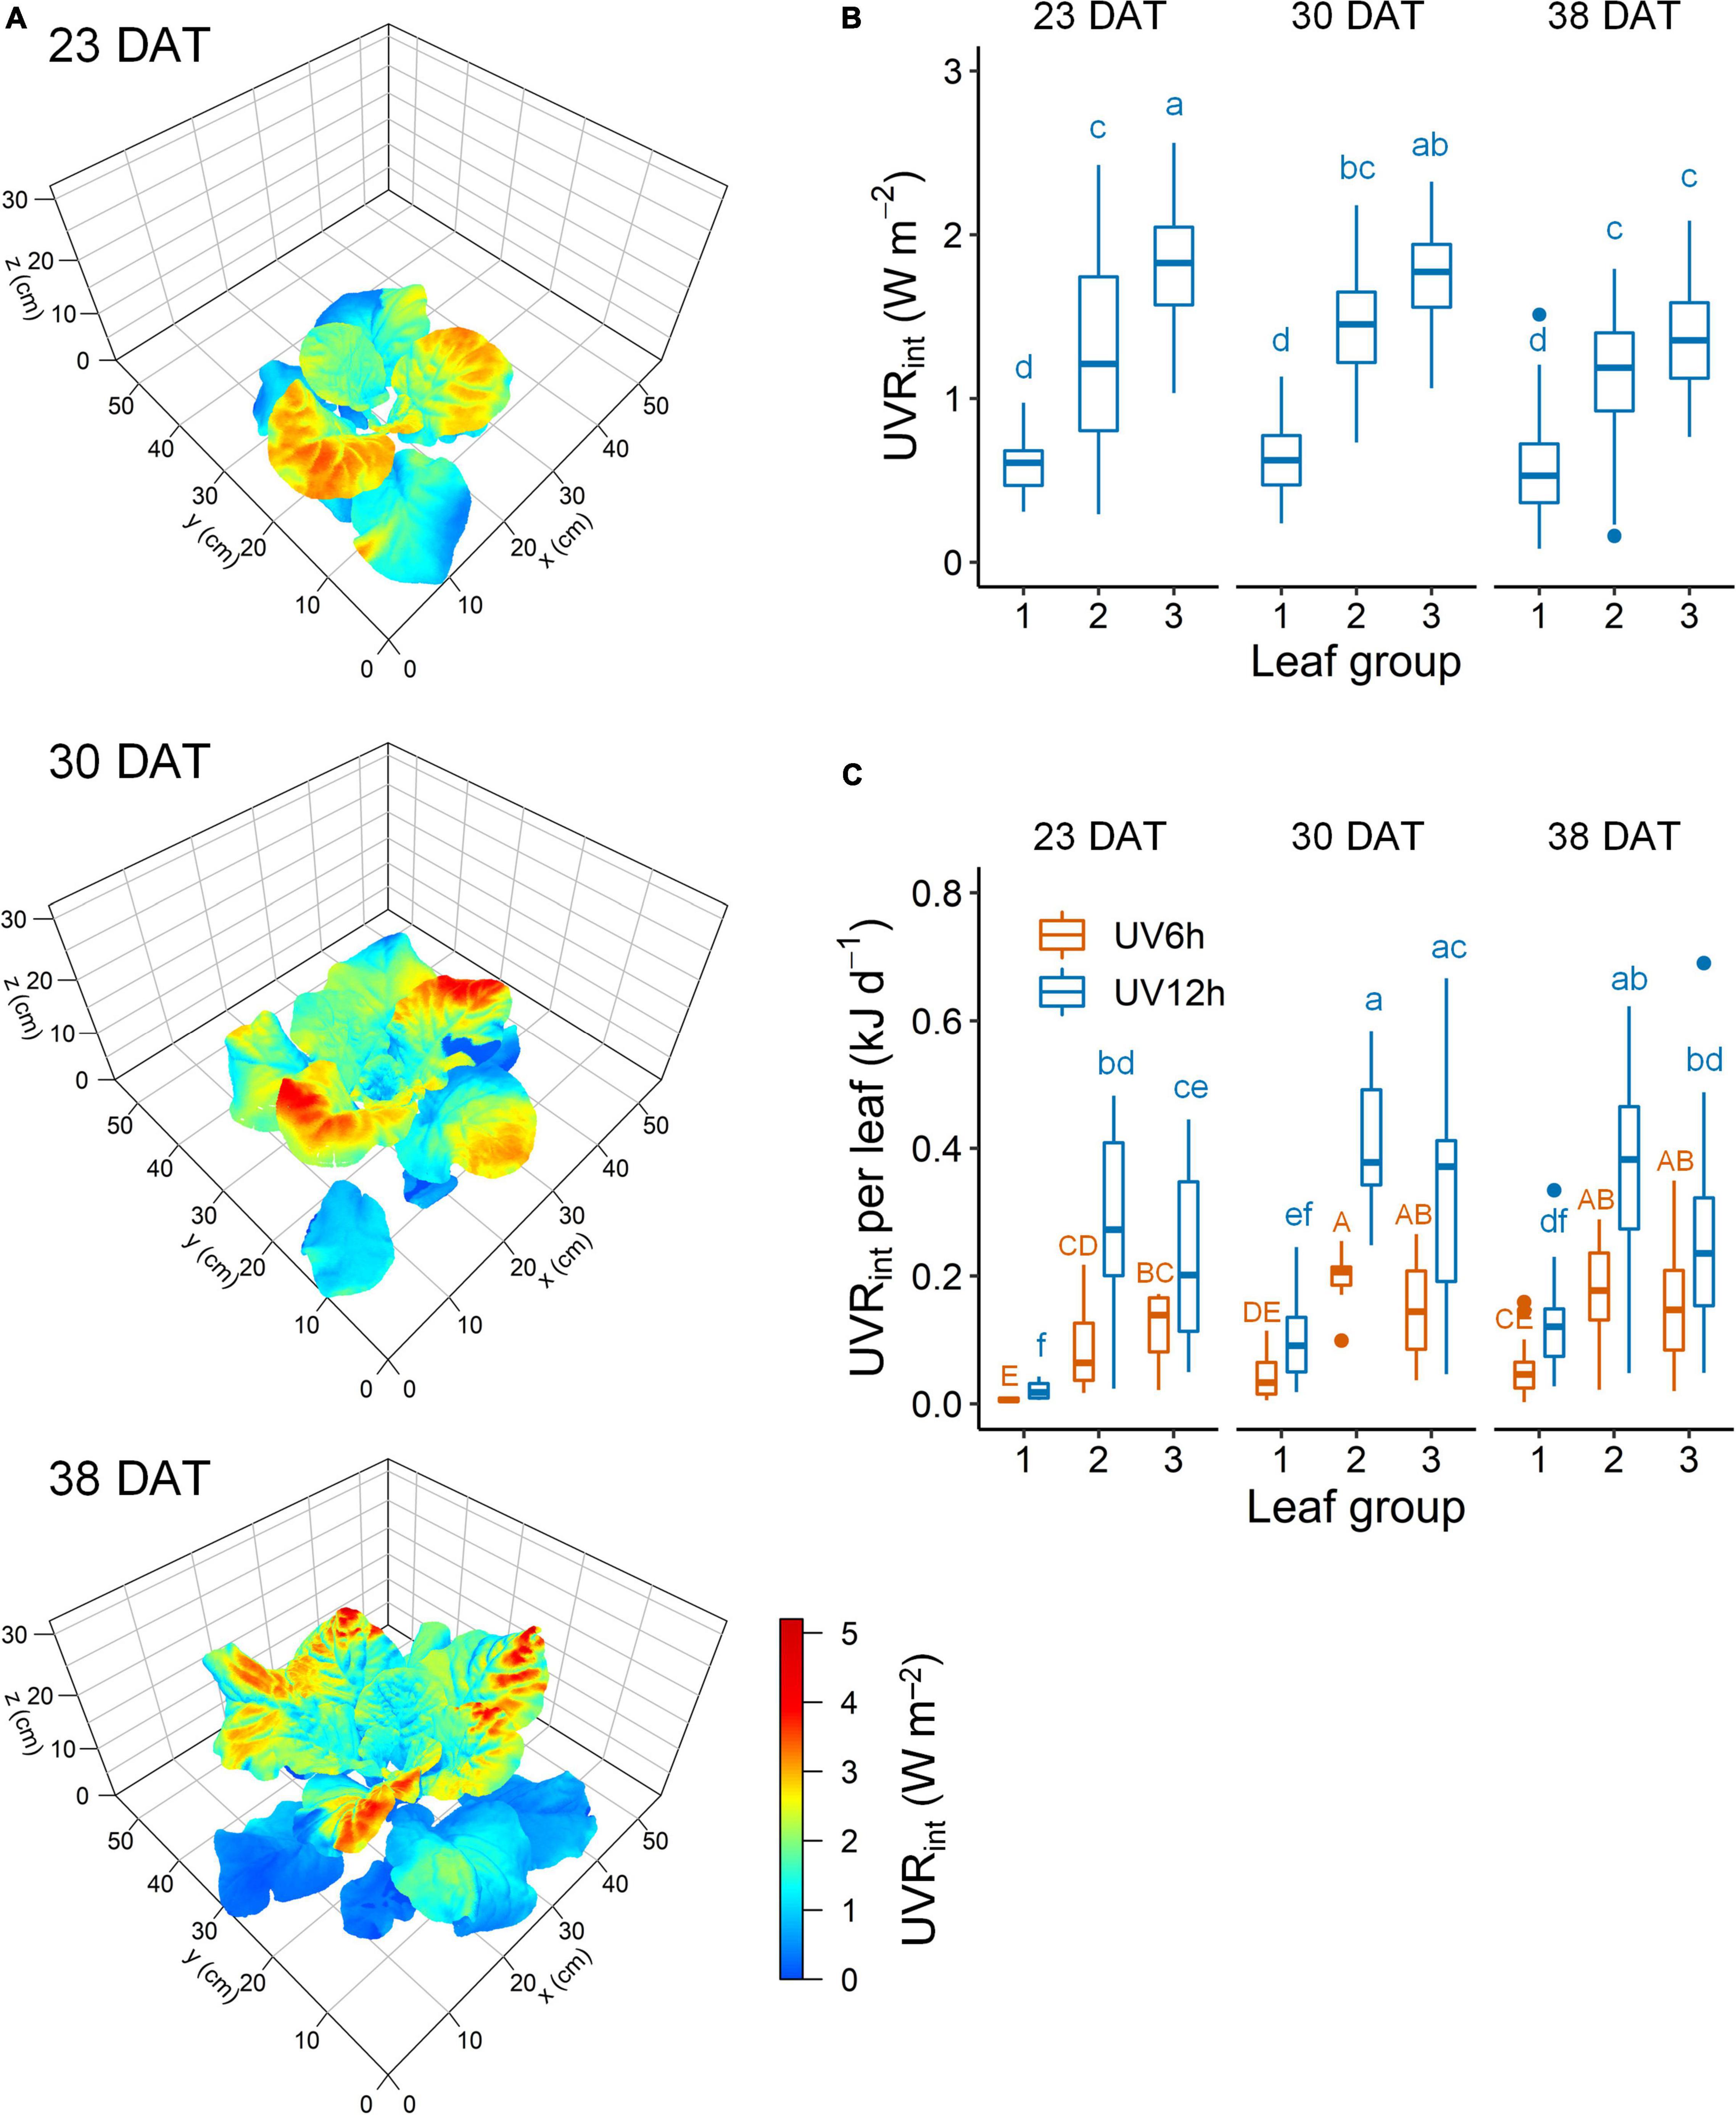
Figure 3. Representative simulated UV-B radiation interception (UVRint) on 3D-scanned models (A), mean UVRint (B), and daily UVRint per leaf (C) of kale plants according to UV-B radiation and leaf group at 23, 30, and 38 days after transplanting (DAT). Leaf groups were determined according to the order of leaf emergence and their relative growth state (Supplementary Figure 3 and Supplementary Table 1). Different letters indicate significant differences at P < 0.05 for UVRint value (n = 26–47) and daily UVRint per leaf (n = 11–25) with growth stage and leaf group by two-way ANOVA and Tukey’s HSD test.
Total phenolic content, TFC, TAC, and UAPC were significantly affected by UV-B radiation, growth stage, and leaf groups (Figure 4). Across all data, the contents of all the compounds were significantly higher in the UV12h treatment than in the control. TPC and TFC were significantly higher in the order of 30, 38, and 23 DAT. They were the highest in leaf groups 2 and 3 at 30 DAT, respectively, in UV12h treatment (13.2 and 31.6% higher, respectively, than in the control).
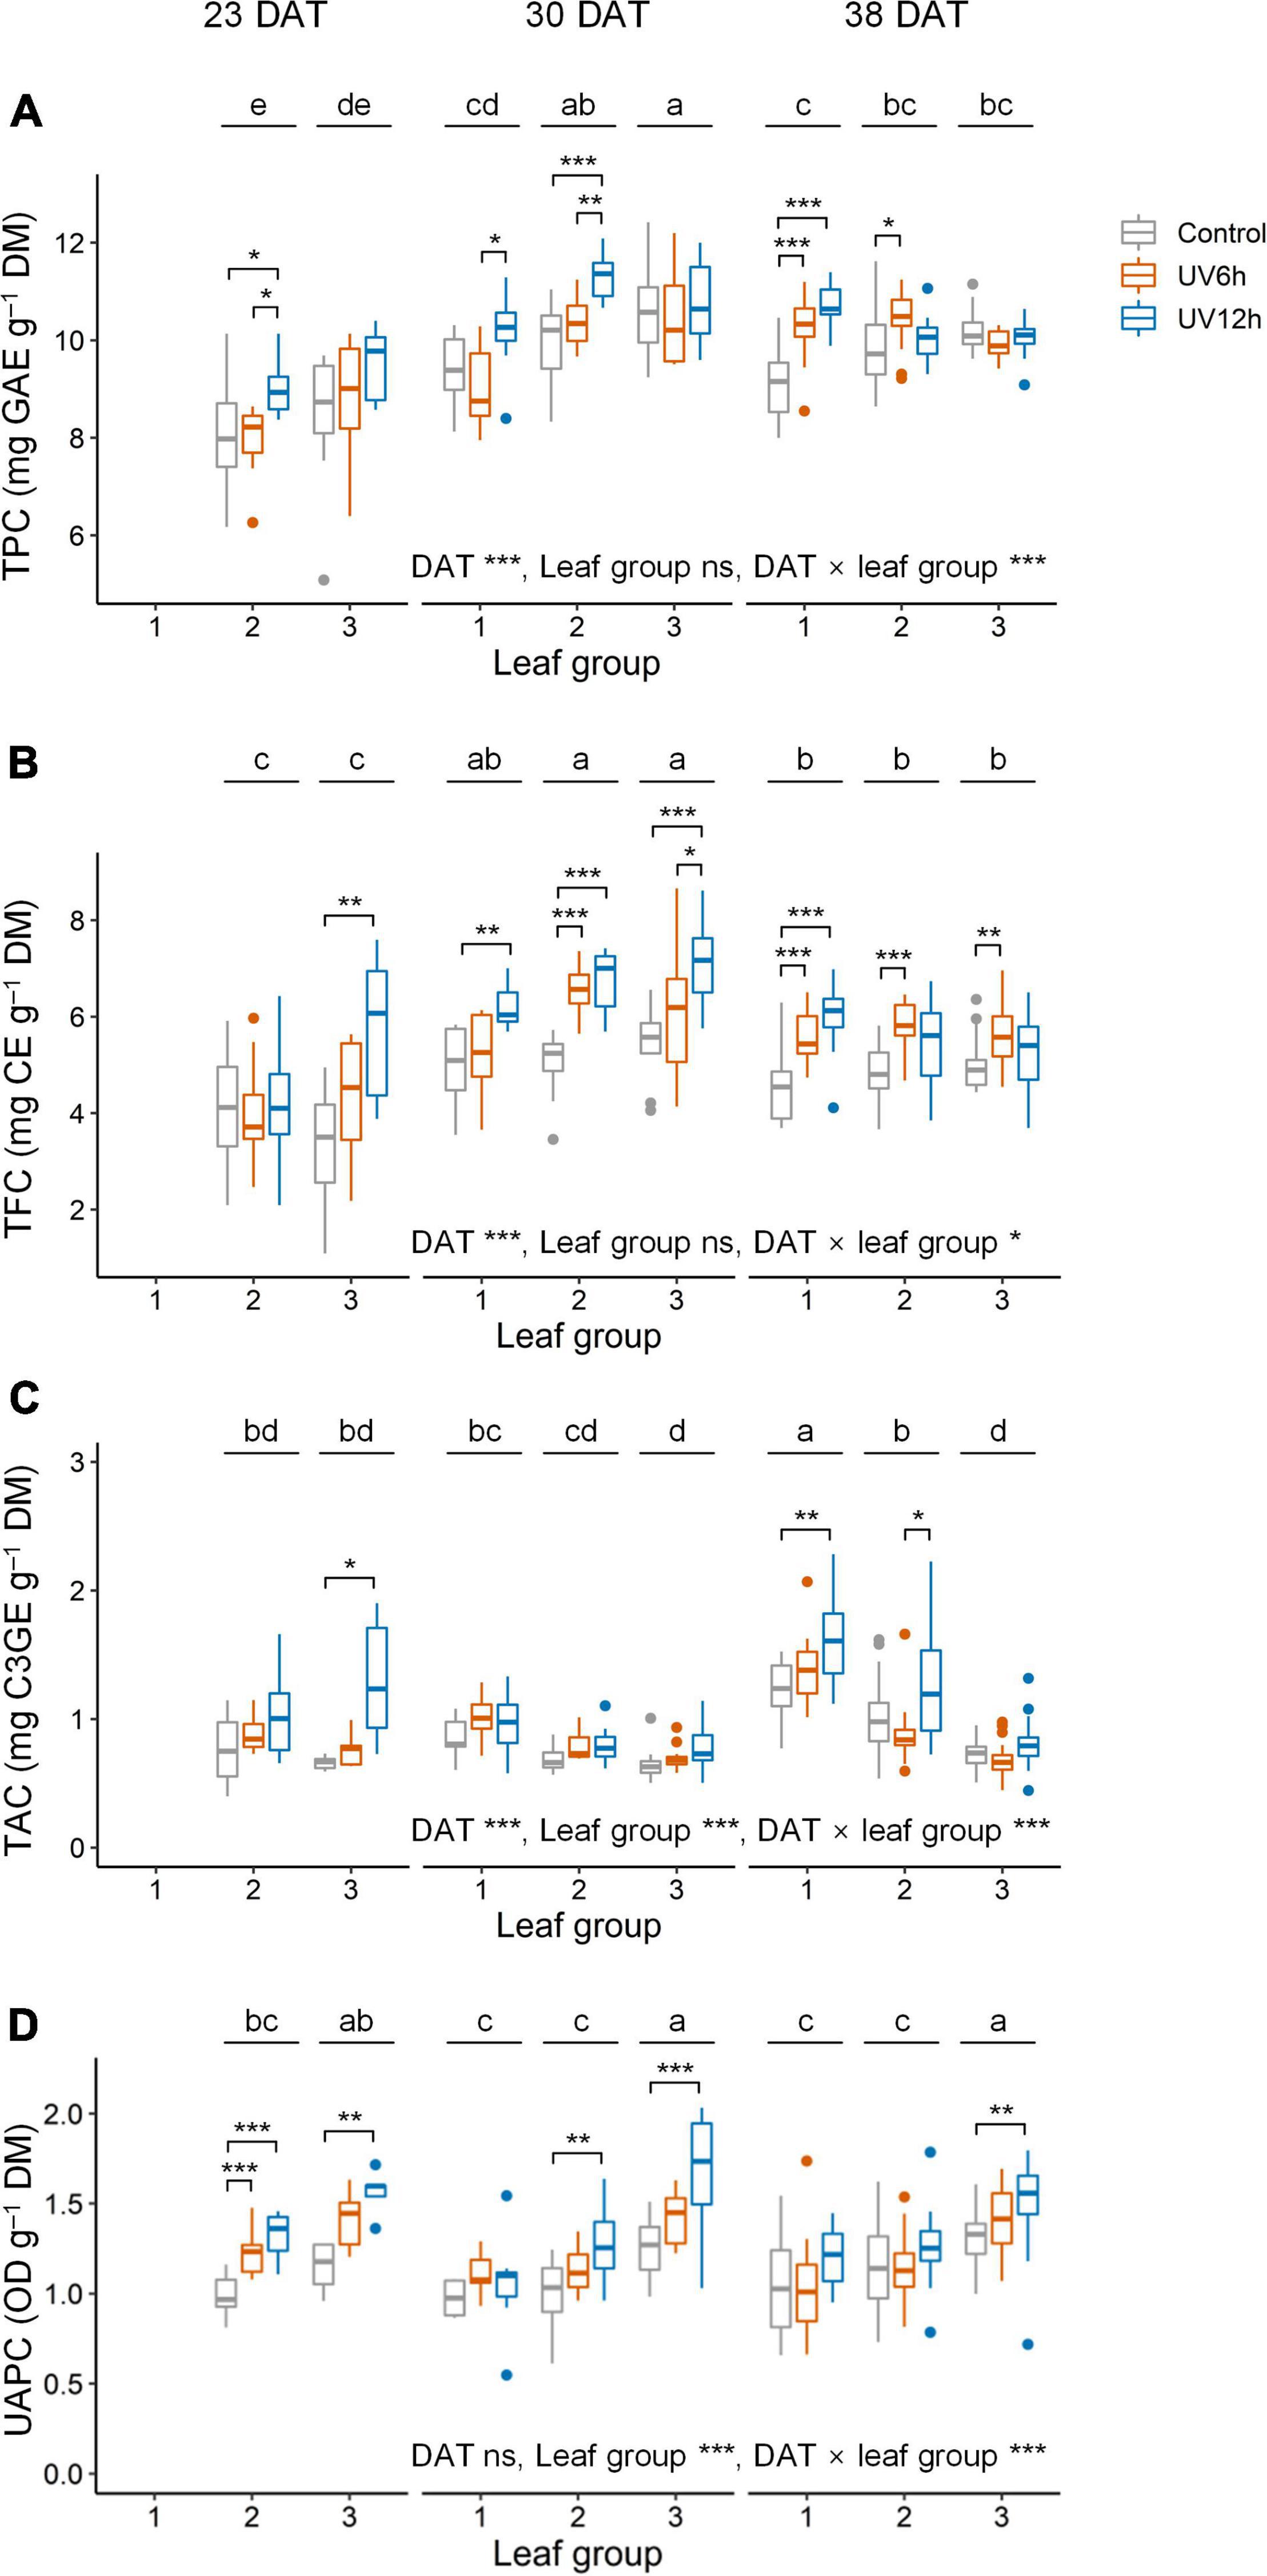
Figure 4. Total phenolic content (TPC, A), total flavonoid content (TFC, B), total anthocyanin content (TAC, C), and UV-absorbing pigment content (UAPC, D) in individual leaves of kale plants according to UV-B radiation and leaf group at 23, 30, and 38 days after transplanting (DAT). Leaf groups were determined according to the order of leaf emergence and their relative growth state (Supplementary Figure 3 and Supplementary Table 1). Asterisks indicate significant differences between UV-B treatments at each growth stage and leaf group by one-way ANOVA and post-hoc test, *P < 0.05; **P < 0.01; ***P < 0.001; n = 7–22. Different letters indicate significant differences among growth stage and leaf group at P < 0.05 by two-way ANOVA and post-hoc test (n = 22–59) referring to the “Materials and Methods” section.
Antioxidant capacity using ABTS and the AOCDPPH were significantly higher in the UV12 treatment and leaf group 3 than in the others (Figure 5). The AOCABTS and AOCDPPH were positively correlated with the UAPC, and their Pearson’s correlation coefficients were 0.69 and 0.62, respectively, at P < 0.001 (data not shown). In contrast, the UAPC, AOCABTS, and AOCDPPH were significantly higher in the order of leaf groups 3, 2, and 1, and the TAC was significantly higher in the reverse order. The UAPC was the highest in leaf group 3 at 30 DAT in the UV12h treatment (34.2% higher than in the control).
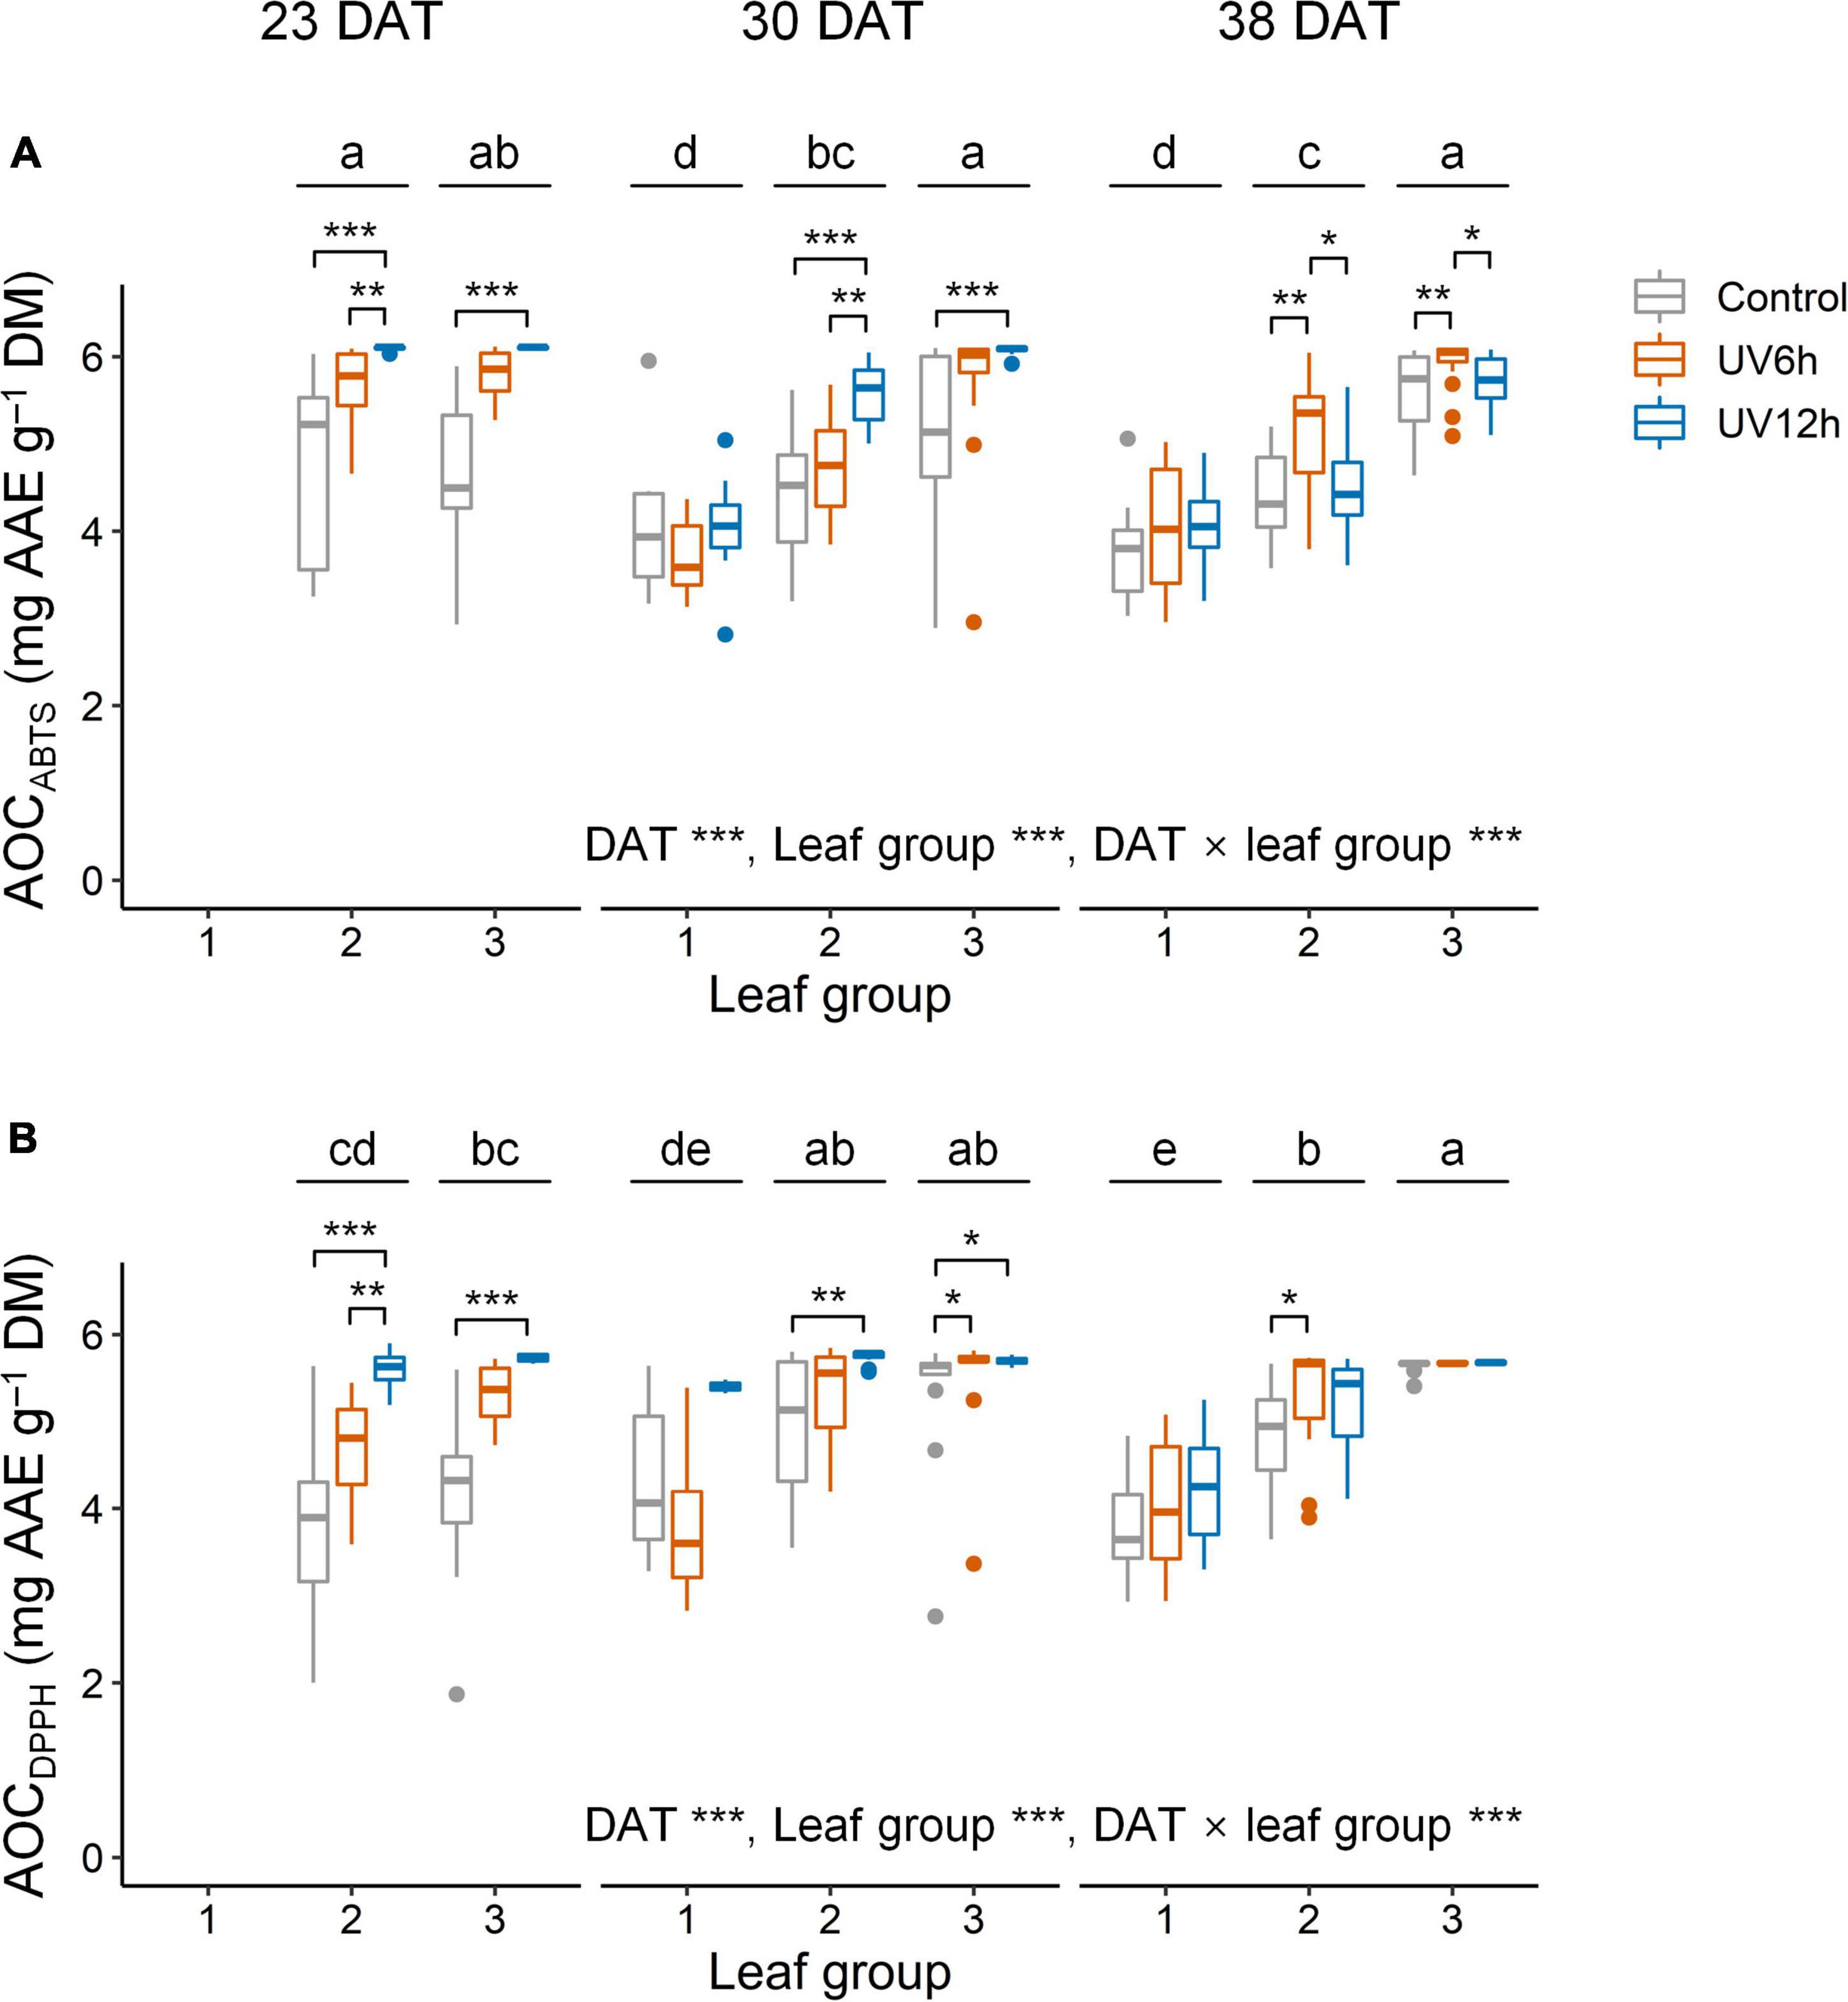
Figure 5. Antioxidant capacity using ABTS (AOCABTS, A) and DPPH assays (AOCDPPH, B) in individual leaves of kale plants according to UV-B radiation and leaf group at 23, 30, and 38 days after transplanting (DAT). Leaf groups were determined according to the order of leaf emergence and their relative growth state (Supplementary Figure 3 and Supplementary Table 1). Asterisks indicate significant differences between UV-B treatments at each growth stage and leaf group by one-way ANOVA and post-hoc test, *P < 0.05; **P < 0.01; ***P < 0.001; n = 7–22. Different letters indicate significant differences among growth stage and leaf group at P < 0.05 by two-way ANOVA and post-hoc test (n = 22–59) referring to the “Materials and Methods” section.
The TPC, TFC, TAC, and UAPC in individual leaves were increased with daily UVRint per leaf, and the slopes were dependent on growth stage and leaf group (Figure 6). The slopes, i.e., the increase rates of TPC and TFC with daily UVRint per leaf in individual leaves, were highest in leaf group 2 at 38 DAT, followed by 30 DAT. Those of TPC and TFC in individual groups were increased as growth progressed. In contrast, the increase rates of TAC and UAPC were the highest in leaf group 3 at 23–30 DAT, and those were lower in leaf group 3 than in the others at 38 DAT.
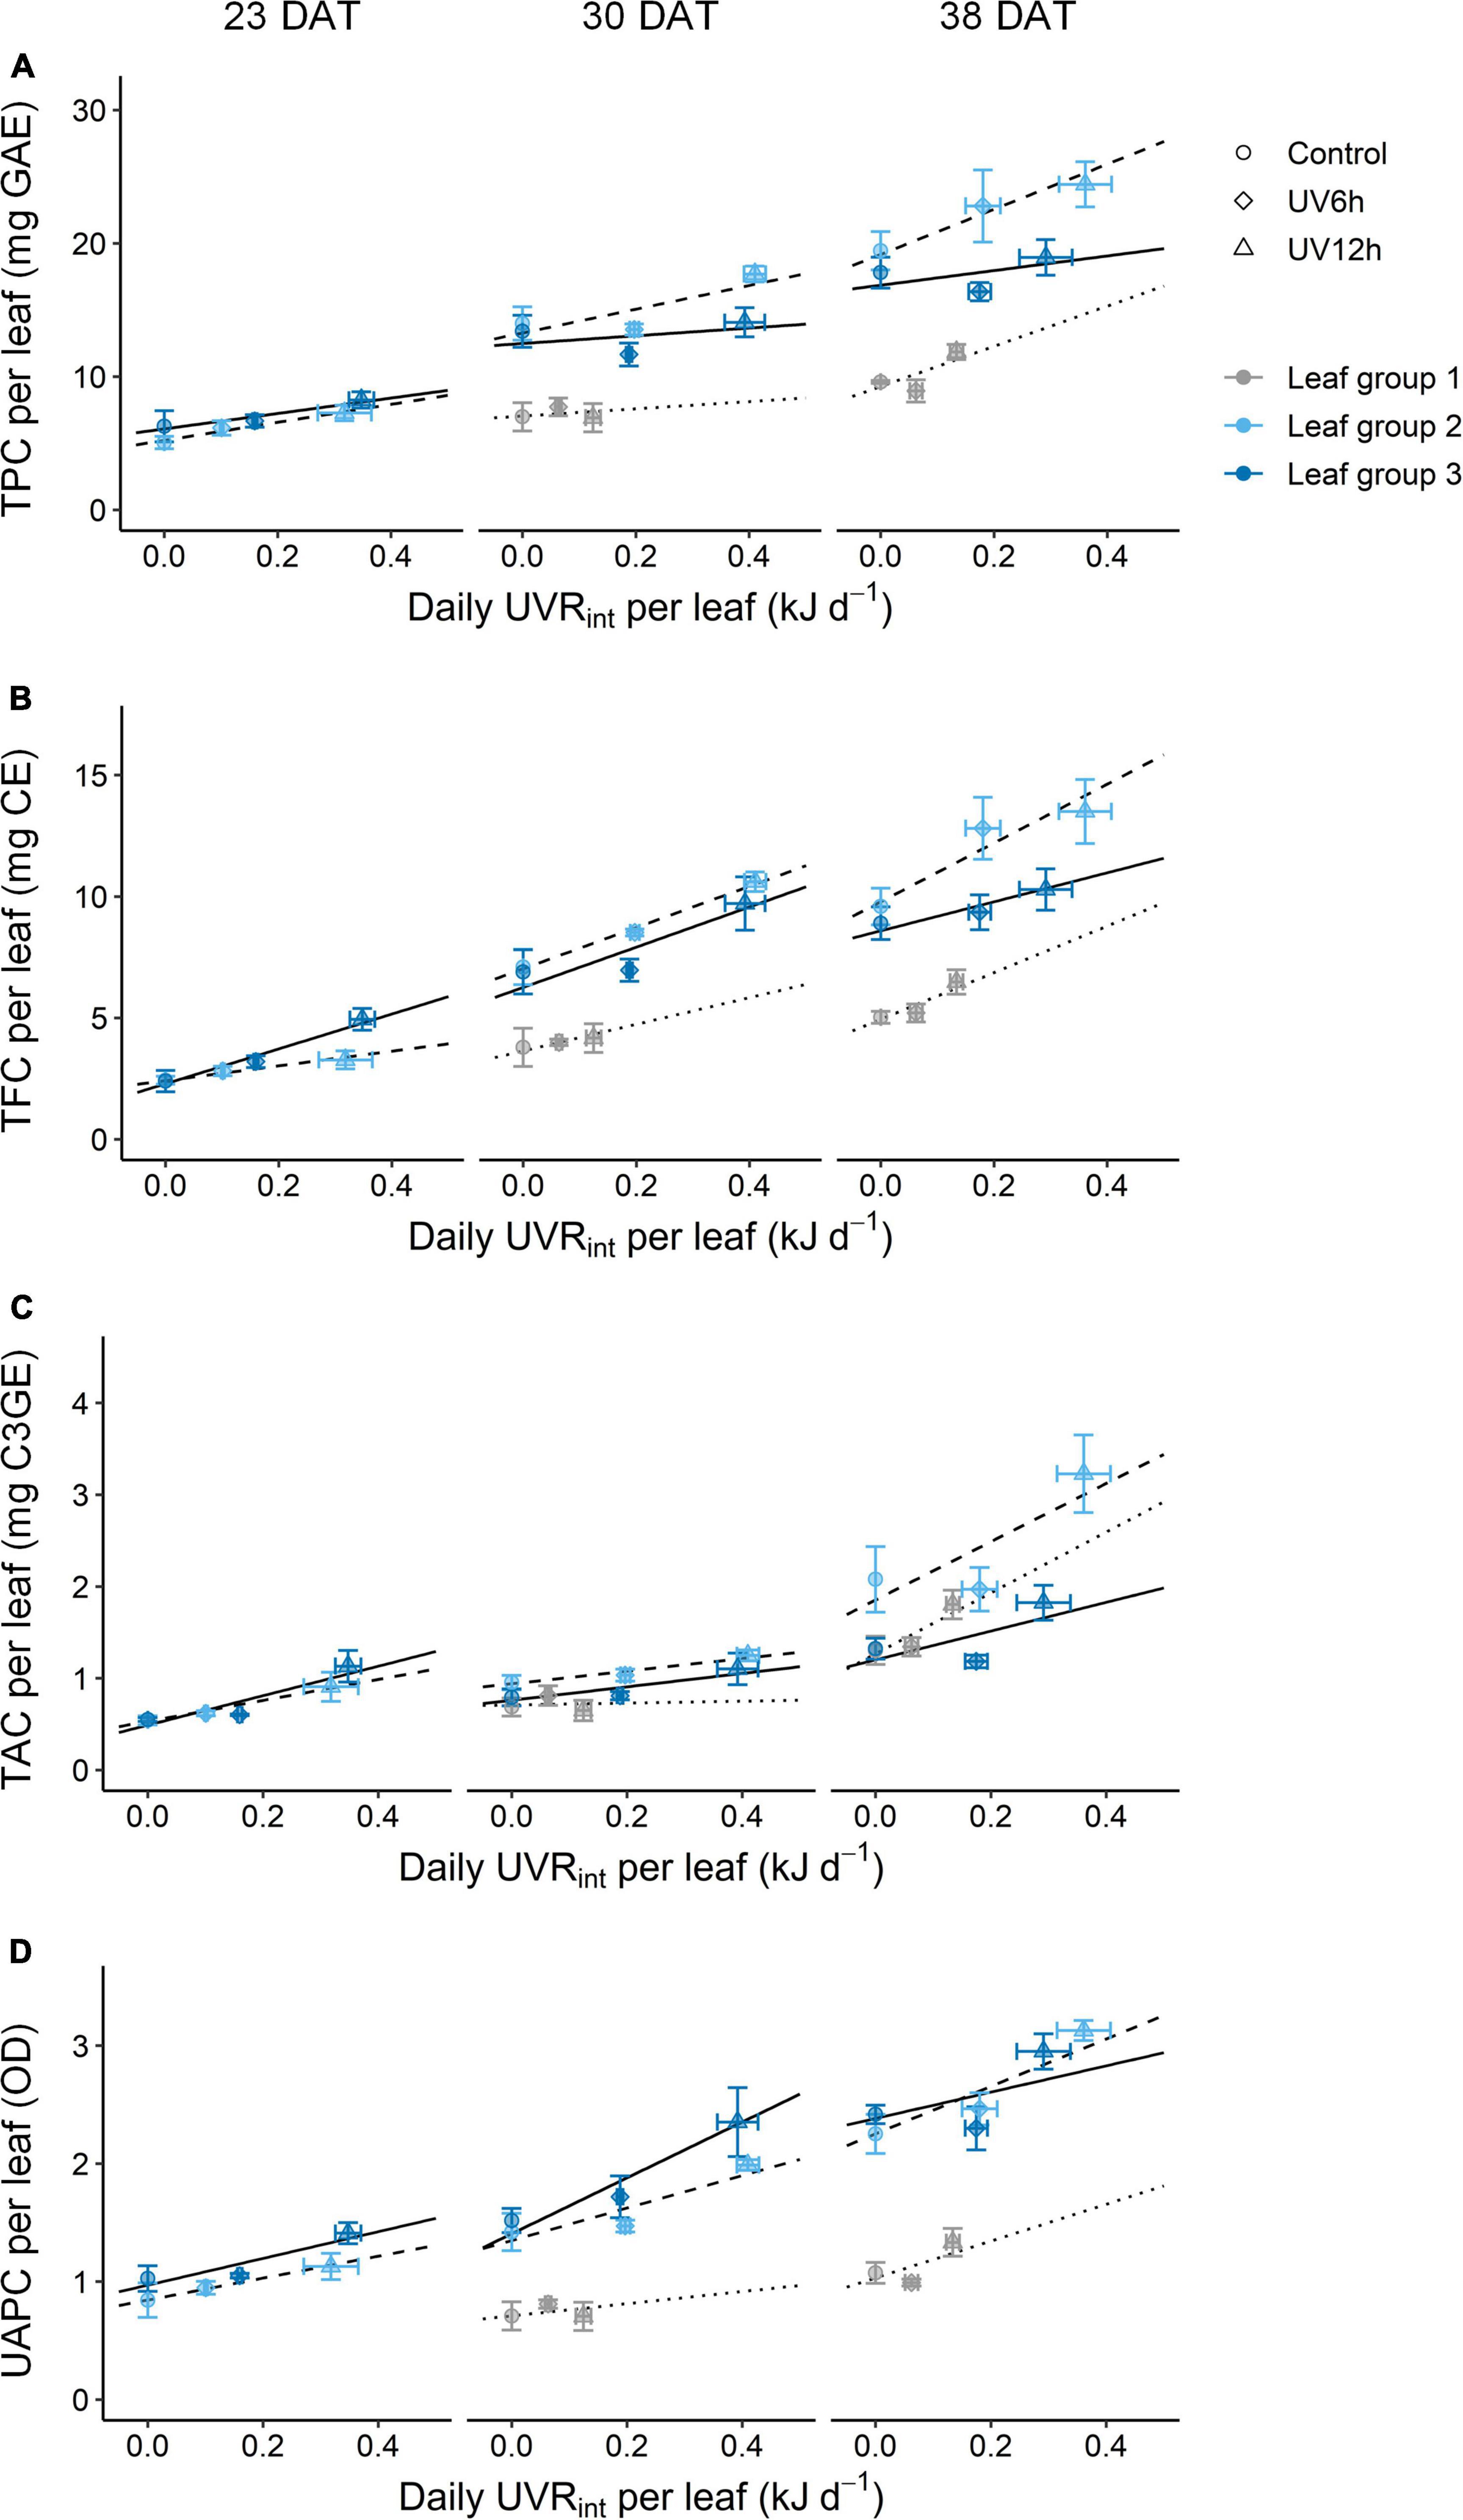
Figure 6. Relationships between phenolic content and the daily UV-B radiation interception (UVRint) per leaf of kales according to leaf group at 23, 30, and 38 days after transplanting (DAT); total phenolic content (TPC, A), total flavonoid content (TFC, B), total anthocyanin content (TAC, C), and UV-absorbing pigment content (UAPC, D) in individual leaves. Leaf groups were determined according to the order of leaf emergence and their relative growth state (Supplementary Figure 3 and Supplementary Table 1). The vertical and horizontal bars indicate SE (n = 4). The lines show linear fits of the leaf group 3, 2, and 1 data sets (solid, dashed, and dotted lines).
Multiple regression models for the phenolic contents per leaf were developed based on daily UVRint per leaf and leaf order according to growth stage, and all models were significant at P < 0.001 (Figure 7 and Table 1). The models for the TPC, TFC, and UAPC in individual leaves at each growth stage showed a high explanatory power, with R2 = 0.62–0.79. However, the models for the TAC per leaf showed a low explanatory power, with R2 < 0.51. All estimated coefficients were significant for the regression models. From the models, the spatial and intraindividual distributions of TPC and TFC on the 3D-scanned plant model were estimated (Figure 8). The R2 values for the four models were higher in the data set integrated from the models across the whole growth stage than in the models at each growth stage (Table 1 and Supplementary Figure 5).
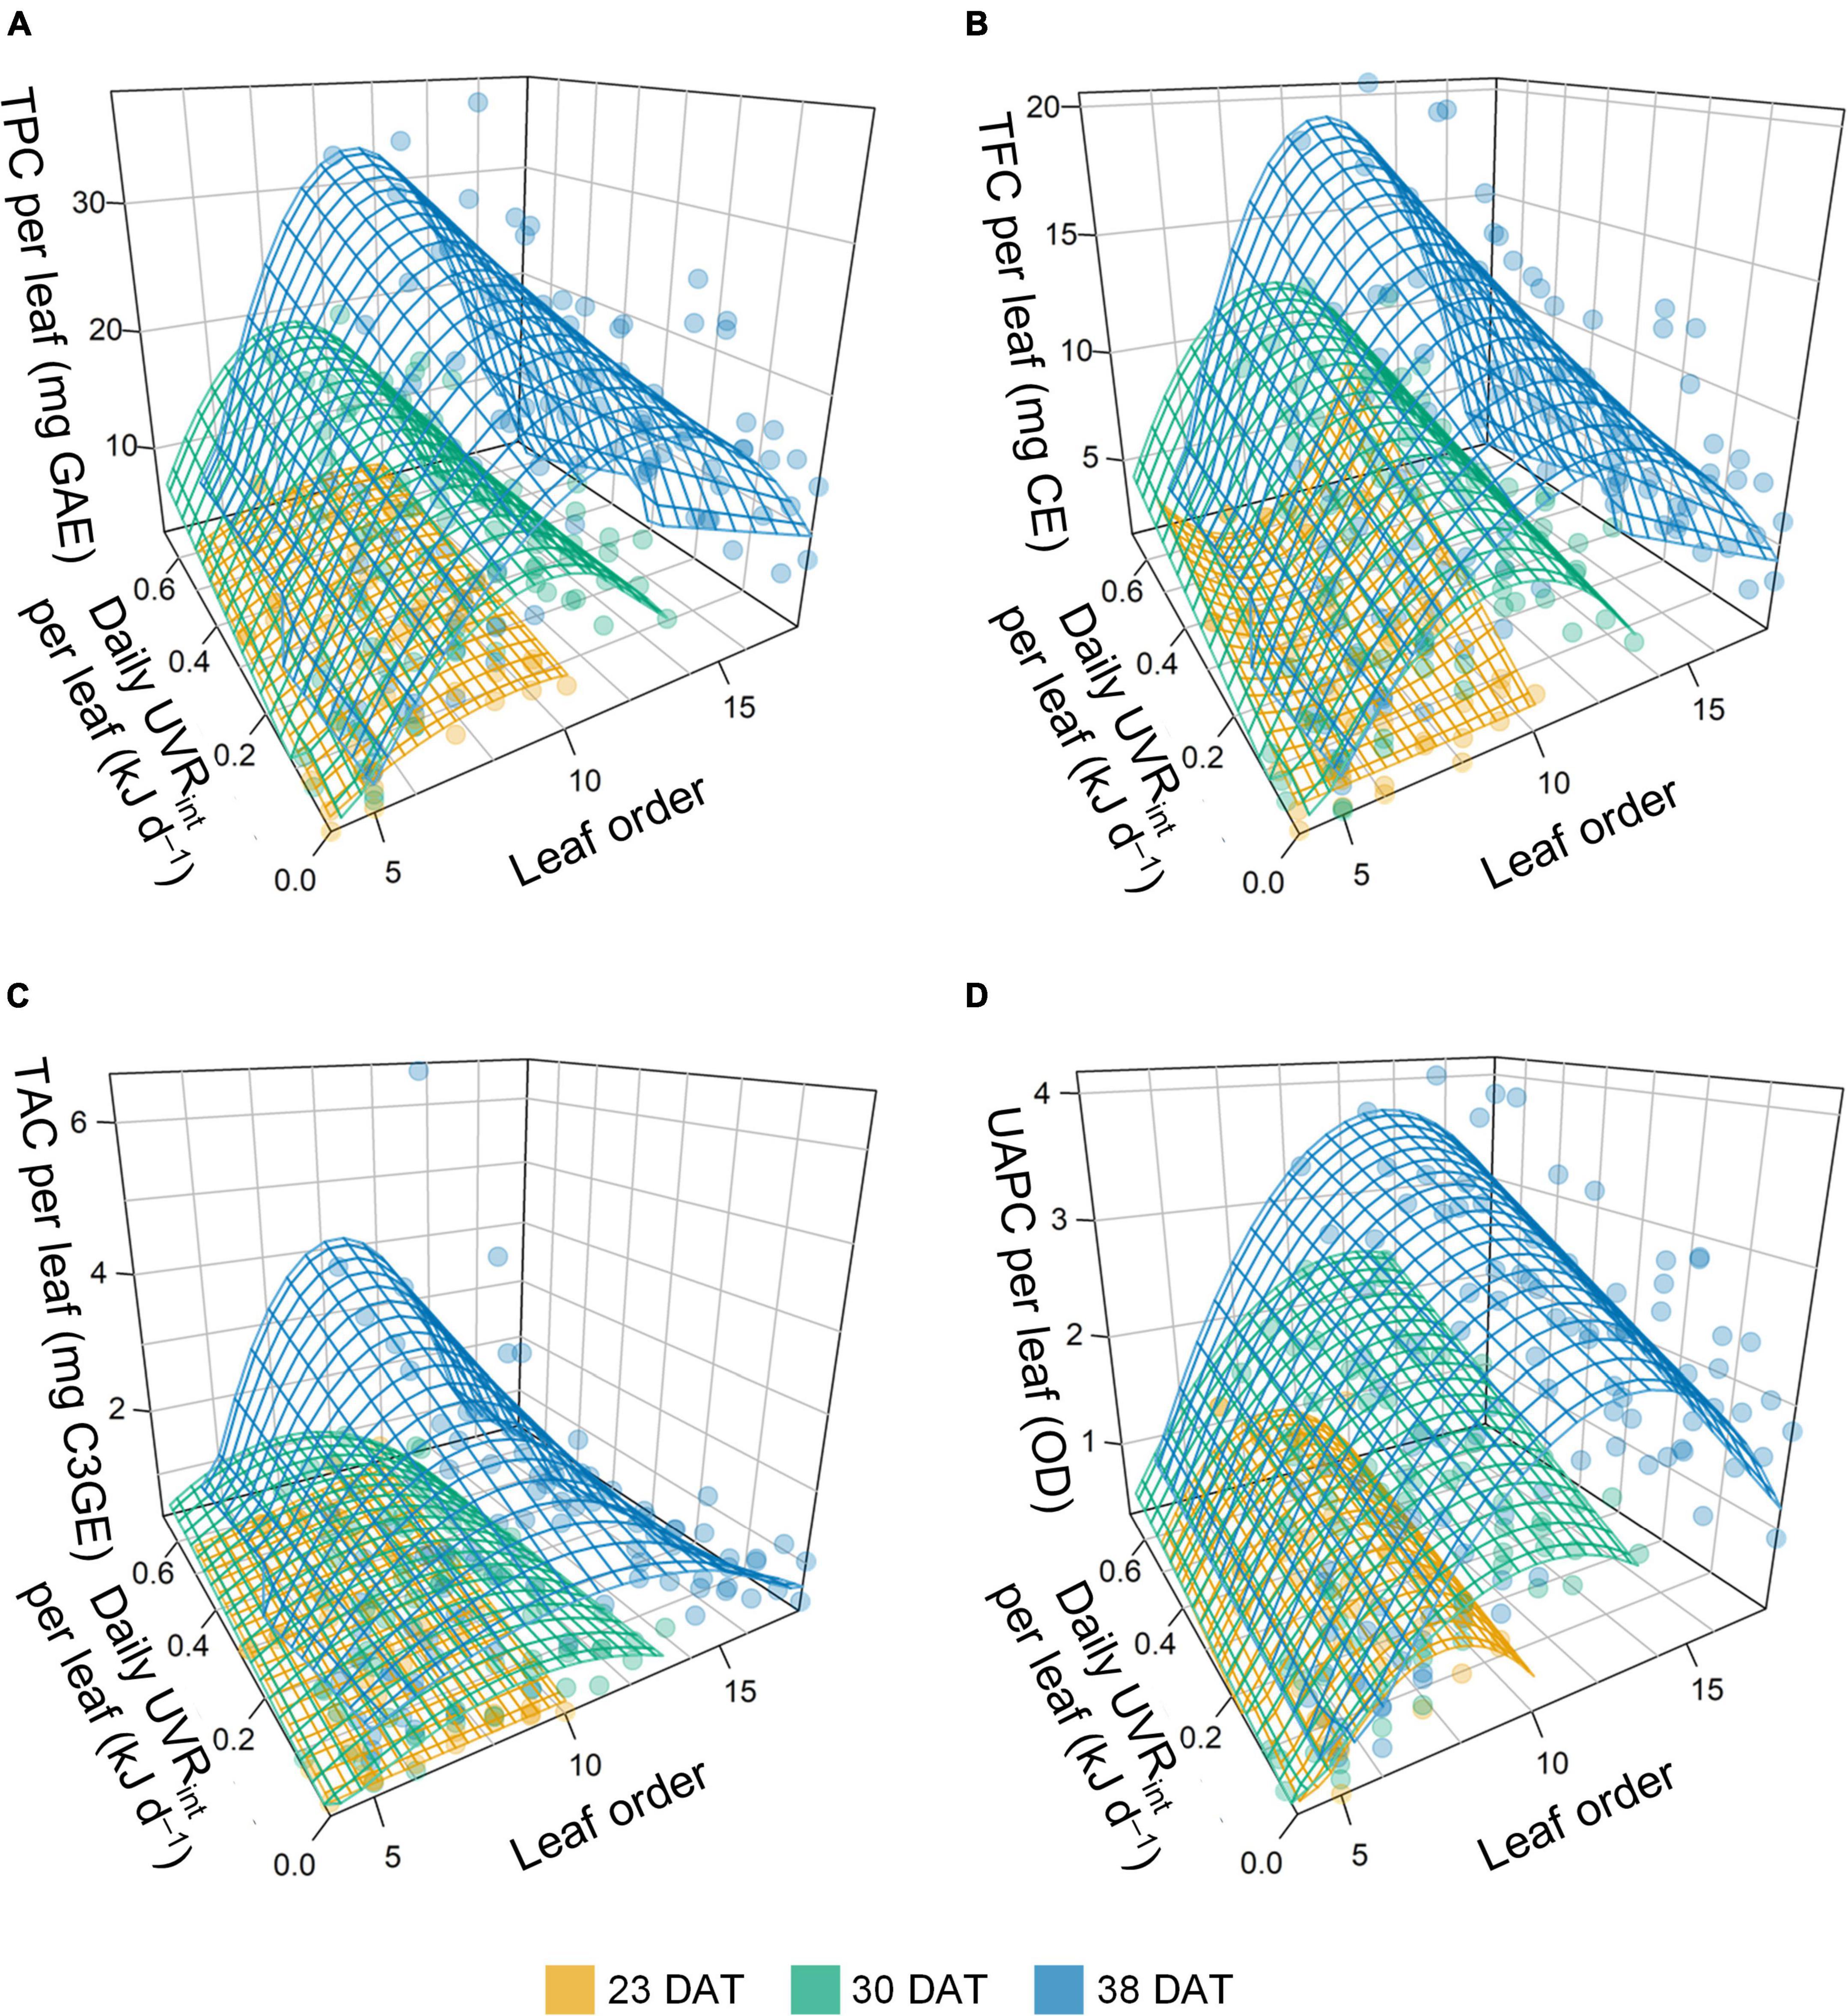
Figure 7. Stepwise multiple linear regression model for phenolic content per leaf of kale plants with daily UV-B radiation interception (UVRint) per leaf and leaf order at 23, 30, and 38 days after transplanting (DAT): TPC, total phenolic content (A); TFC, total flavonoid content (B); TAC, total anthocyanin content (C); and UAPC, UV-absorbing pigment content (D). The surfaces were obtained by stepwise multiple regression models referring to Eq. 1 and Table 1.
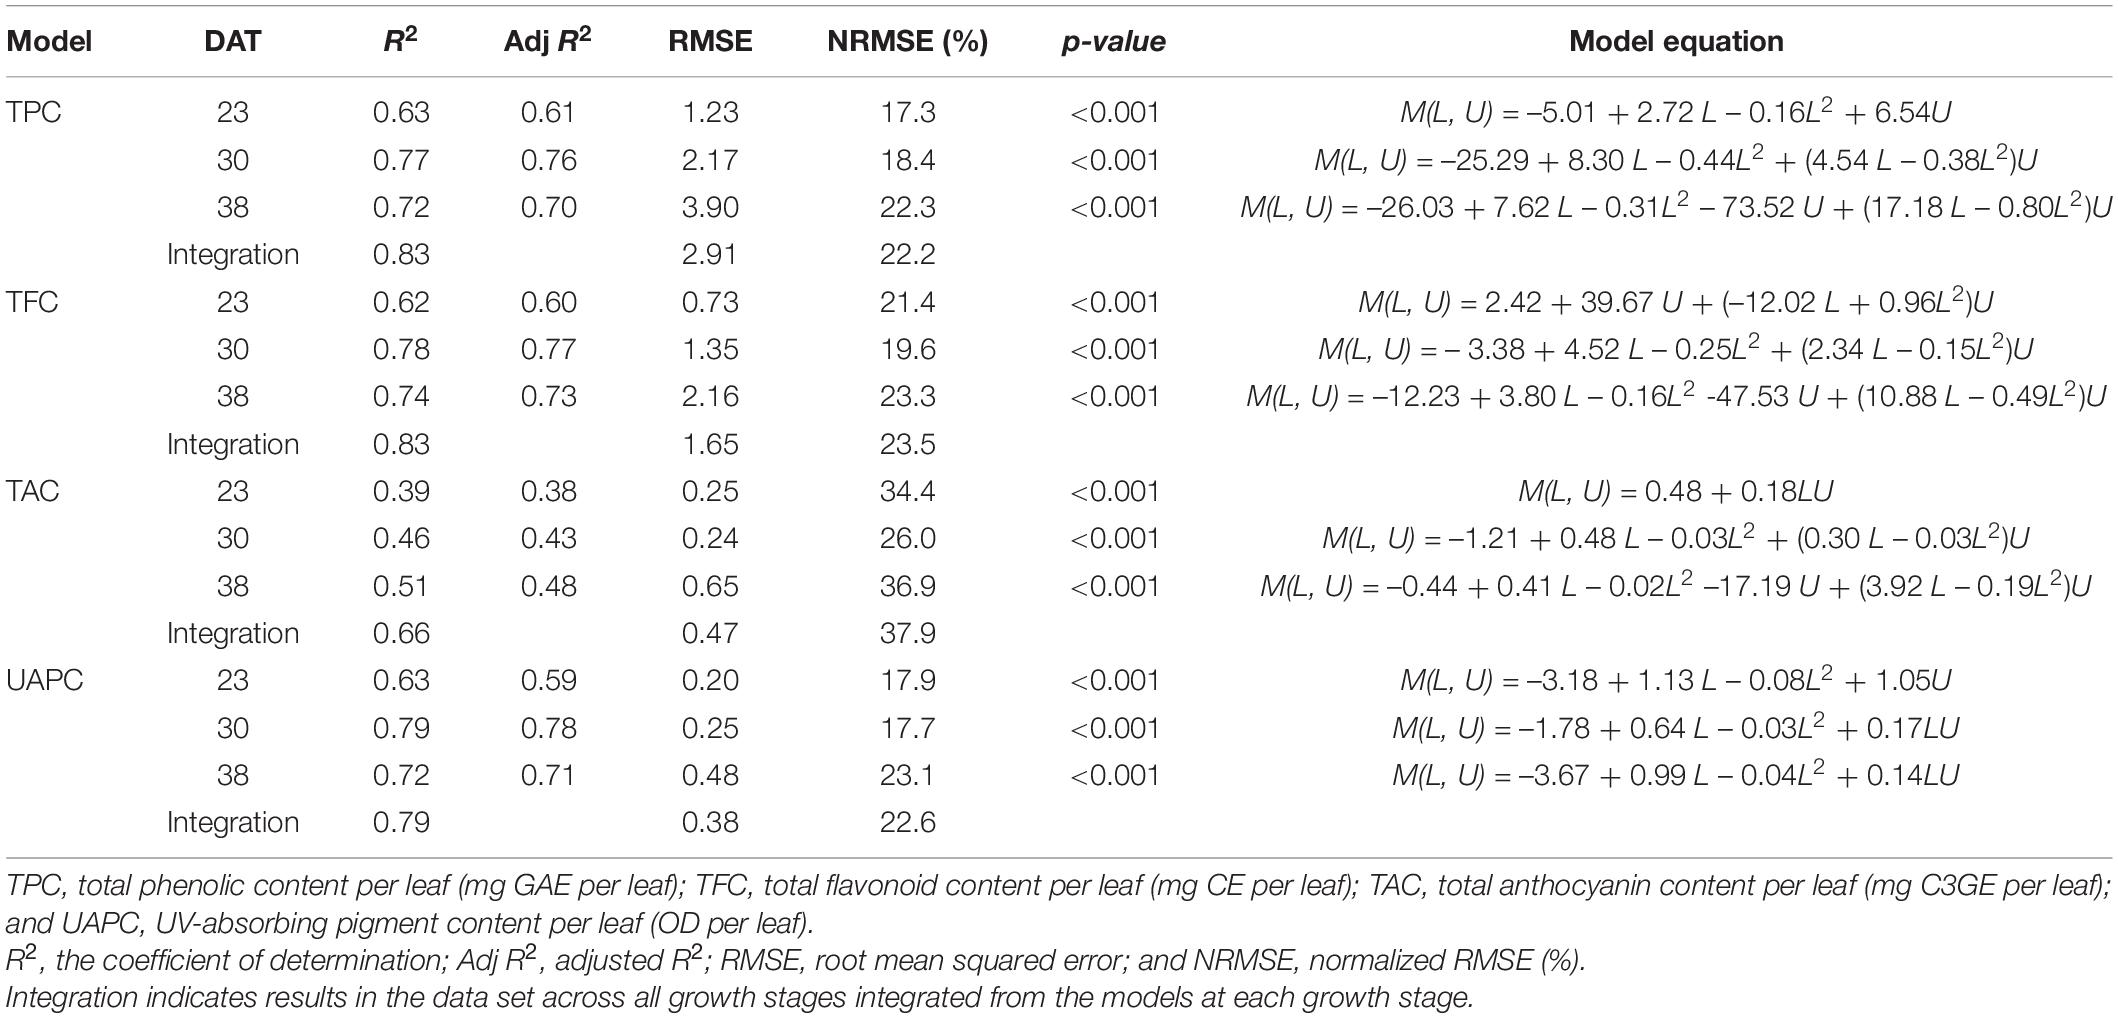
Table 1. Stepwise multiple linear regression results and models to predict phenolic content per leaf of kale plants at 23, 30, and 38 days after transplanting (DAT) based on leaf order (L) and daily UV-B radiation interception per leaf (U) referring to Eq. 1.
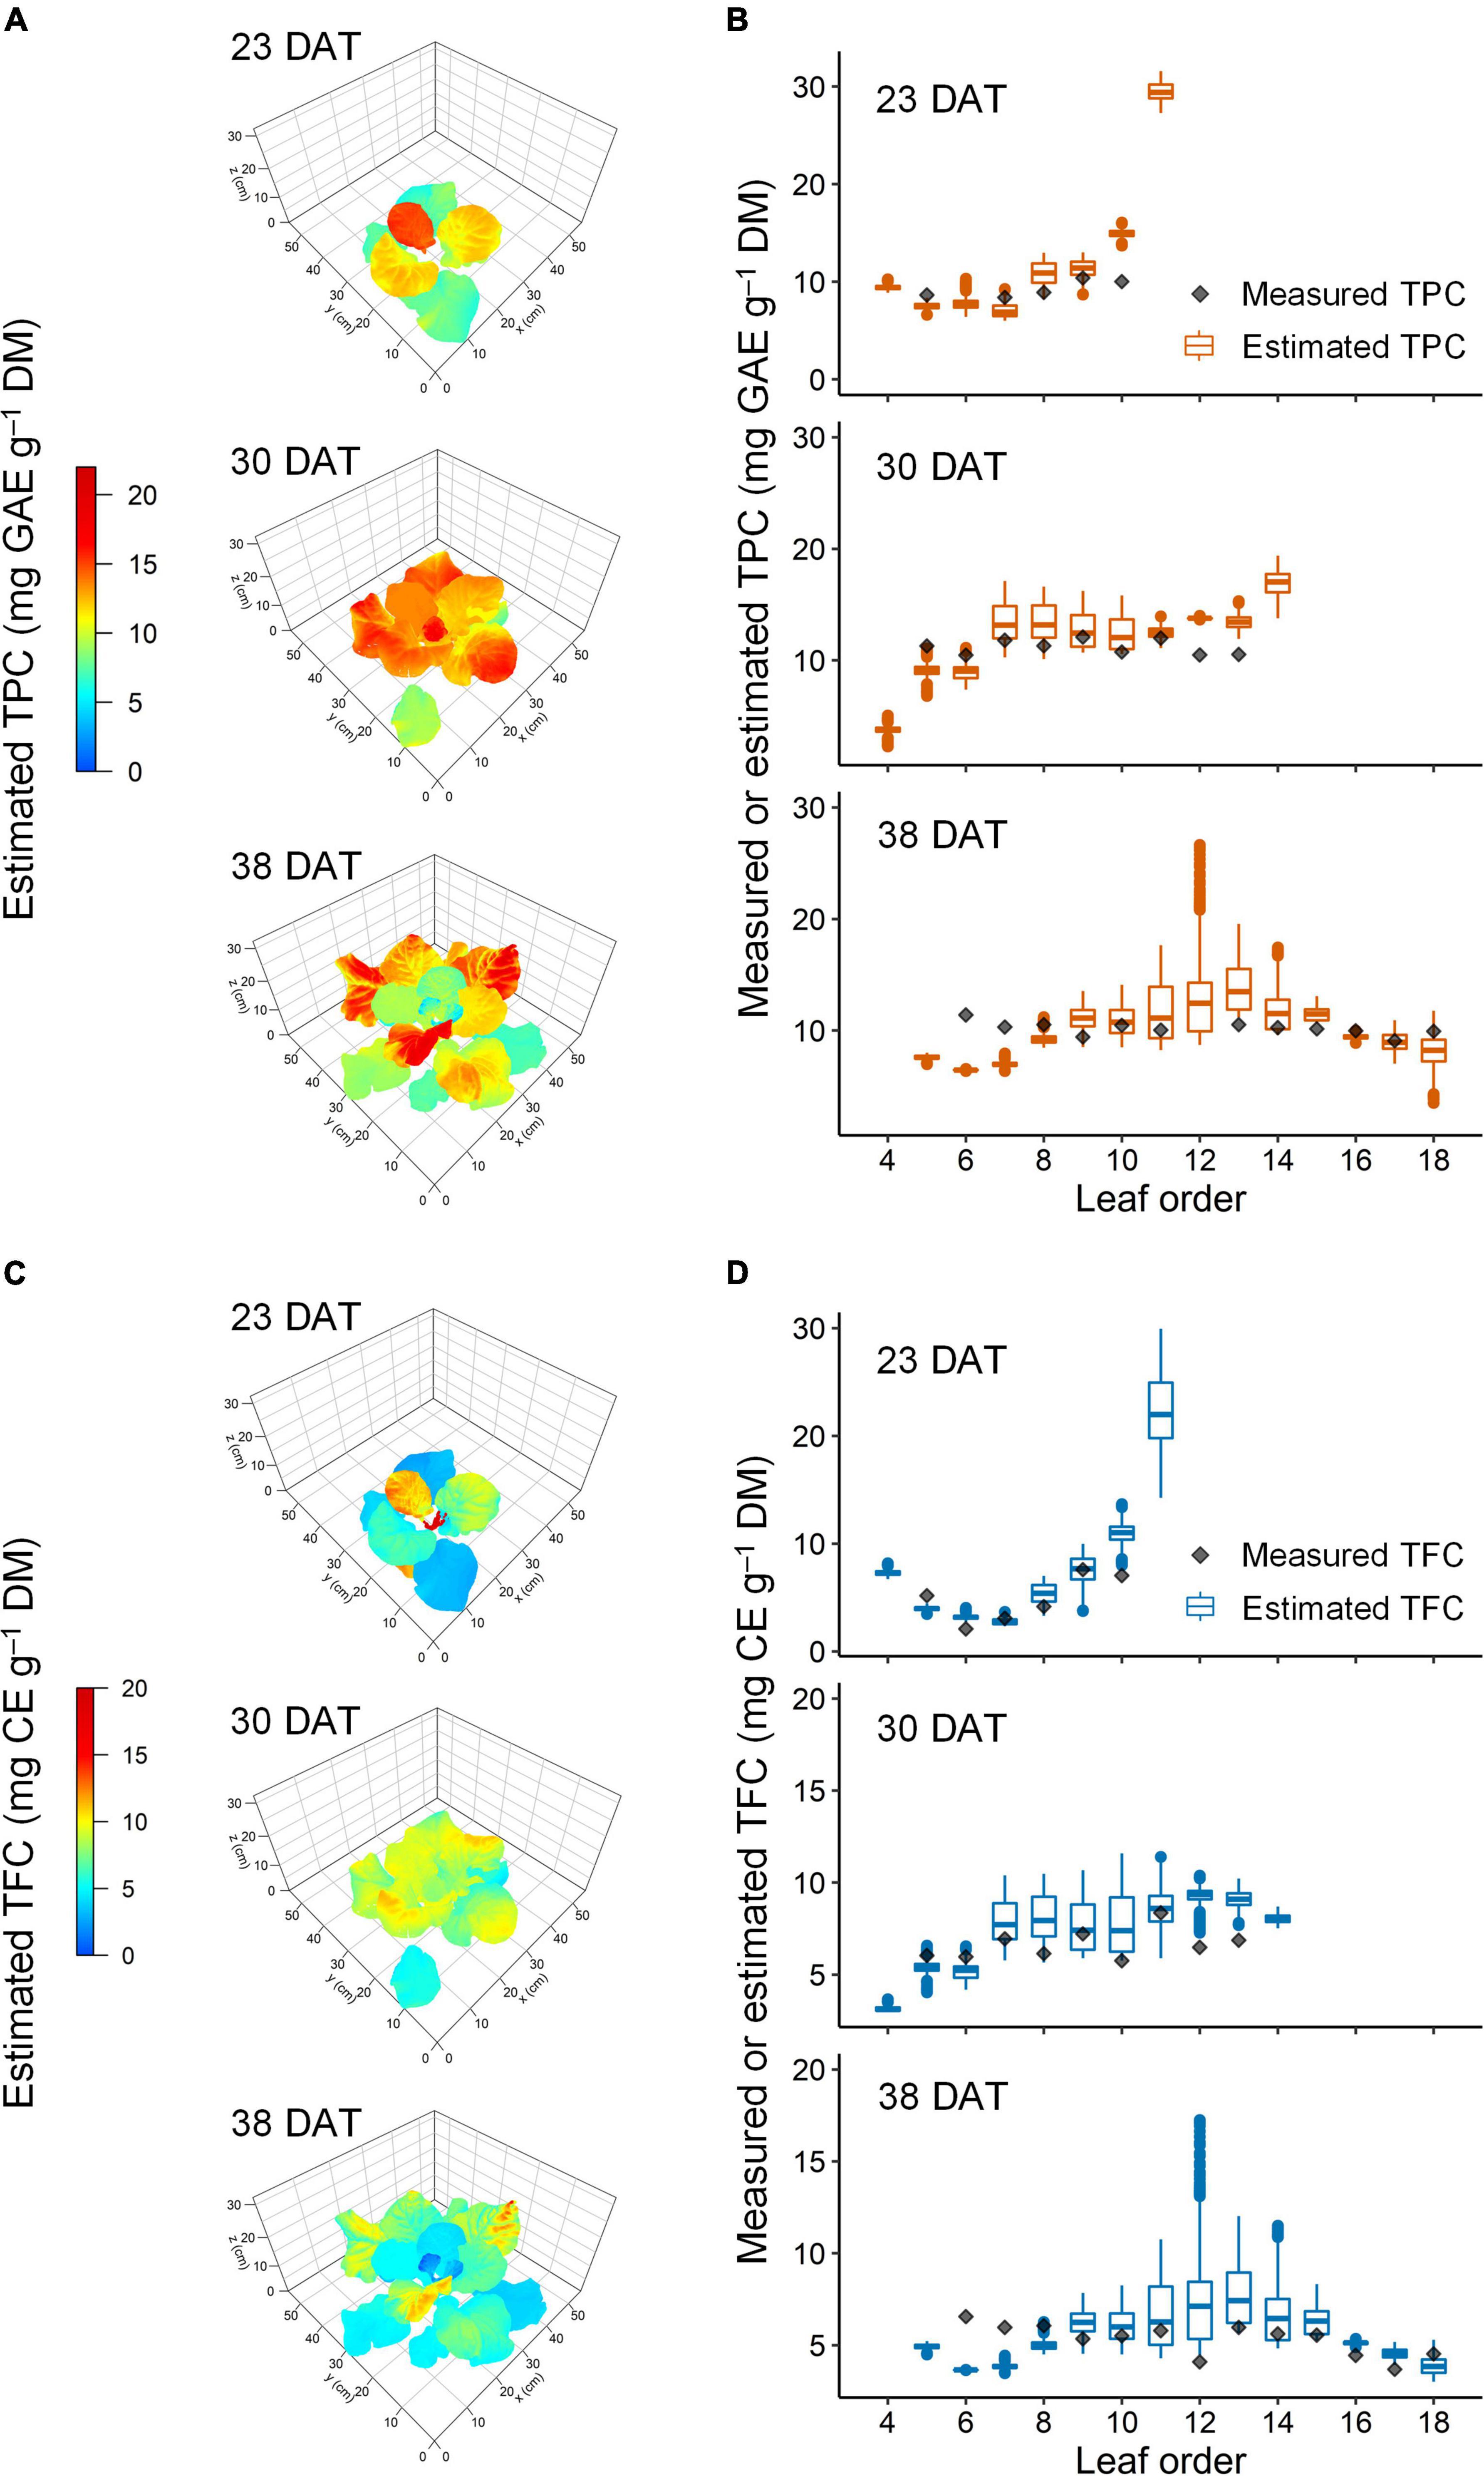
Figure 8. Representative estimated distribution of total phenolic content (TPC, A,B) and total flavonoid content (TFC, C,D) in the leaves of kale plants under 12-h UV-B exposure at 23, 30, and 38 days after transplanting (DAT). The multiple regression models refer to in Figure 4 and Table 1, and the 3D-scanned plant model refers to in Figure 3.
The accuracies of the models for TPC, TFC, TAC, and UAPC per leaf were validated using test data sets (Figure 9). All models performed well for the whole growth stage, with R2 = 0.78–0.79. The TPC, TFC, and UAPC models showed high performance with R2 > 0.7, except for those at 23 DAT. The TAC model showed high performance with R2 > 0.6 at all growth stages. The TPC model for the whole growth stage showed approximately 22.8% relative error, meaning that the model could predict the TPC per leaf with 77.2% accuracy during 23–38 DAT. Likewise, the models could predict TFC, TAC, and UAPC per leaf with 73.2, 75.0, and 64.9% accuracy, respectively, during 23–38 DAT.
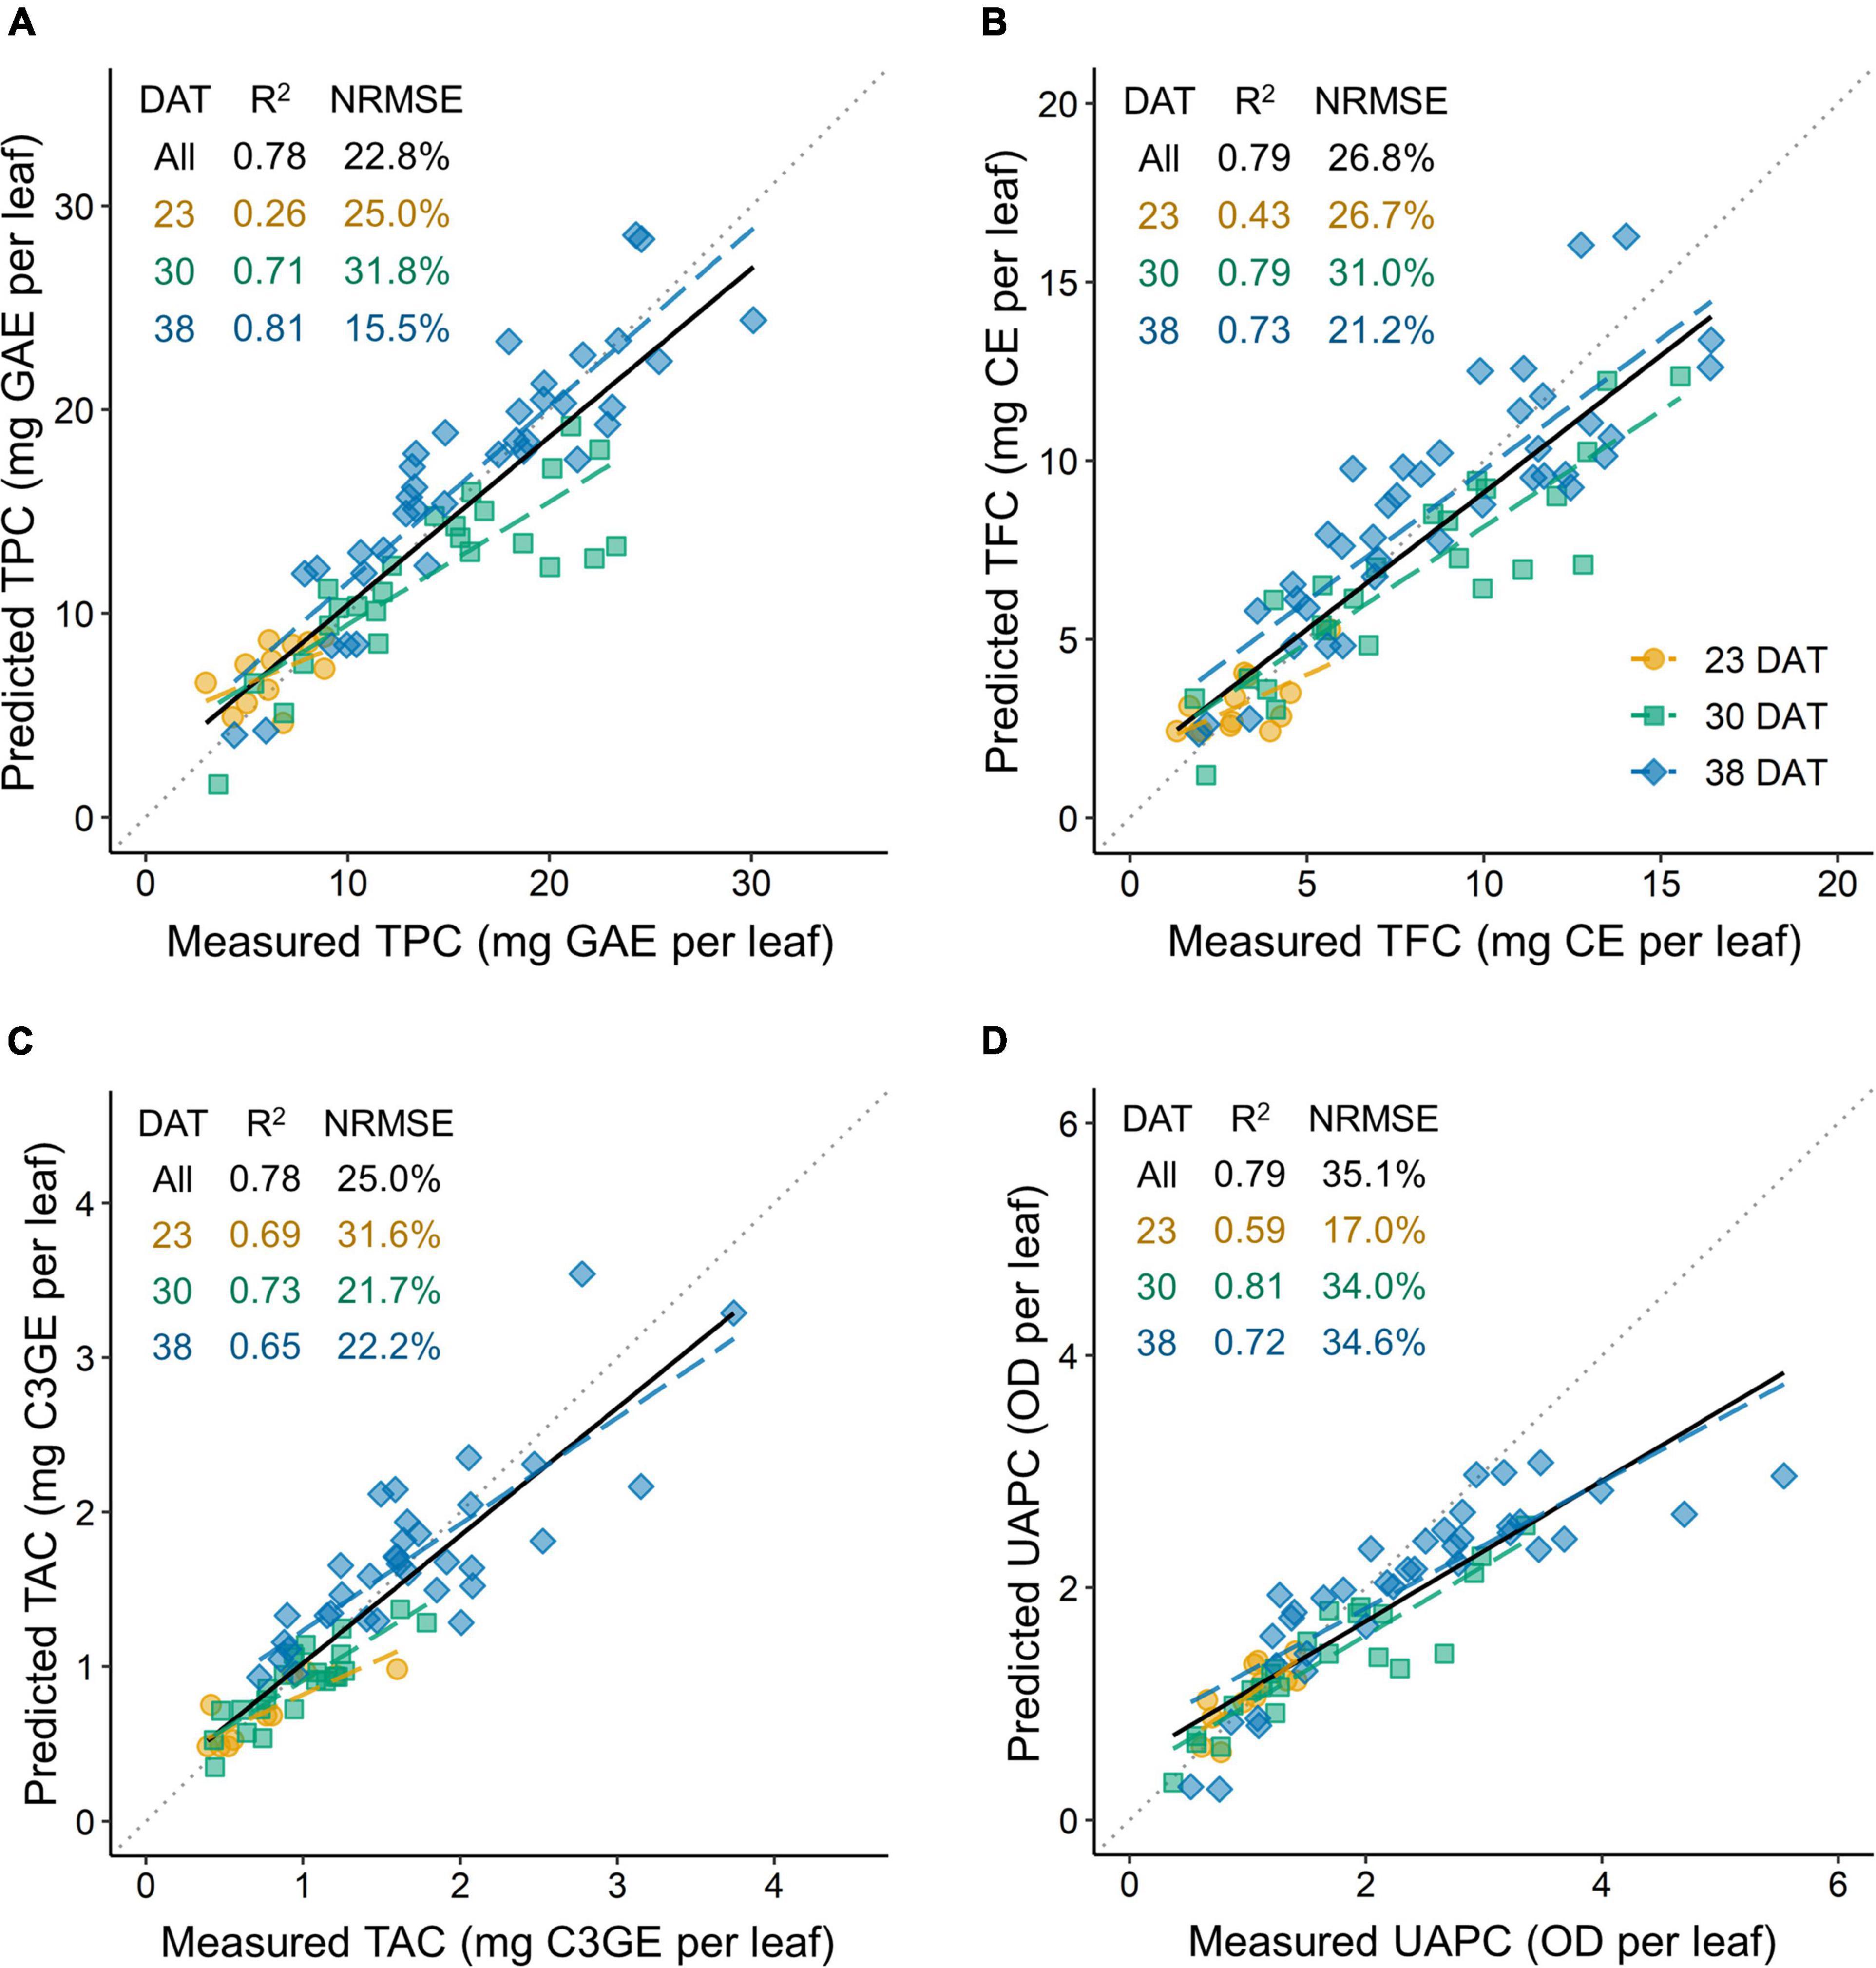
Figure 9. Model accuracy for predicting phenolic content per leaf of kale plants using a test data set: TPC, total phenolic content per leaf (A); TFC, total flavonoid content per leaf (B); TAC, total anthocyanin content per leaf (C); and UAPC, UV-absorbing pigment content per leaf (D). The coefficient of determination (R2) and the normalized root mean squared error (NRMSE) are presented inside each panel. The multiple regression models at 23, 30, and 38 days after transplanting (DAT) are shown in Figure 4 and Table 1. All in DAT indicate the results in the data set across all growth stages integrated from the models at each growth stage.
The UV-B energy yields for the TPC, TFC, TAC, and UAPC based on absorbed UV energy were significantly different depending on the growth stage and leaf group (Table 2).
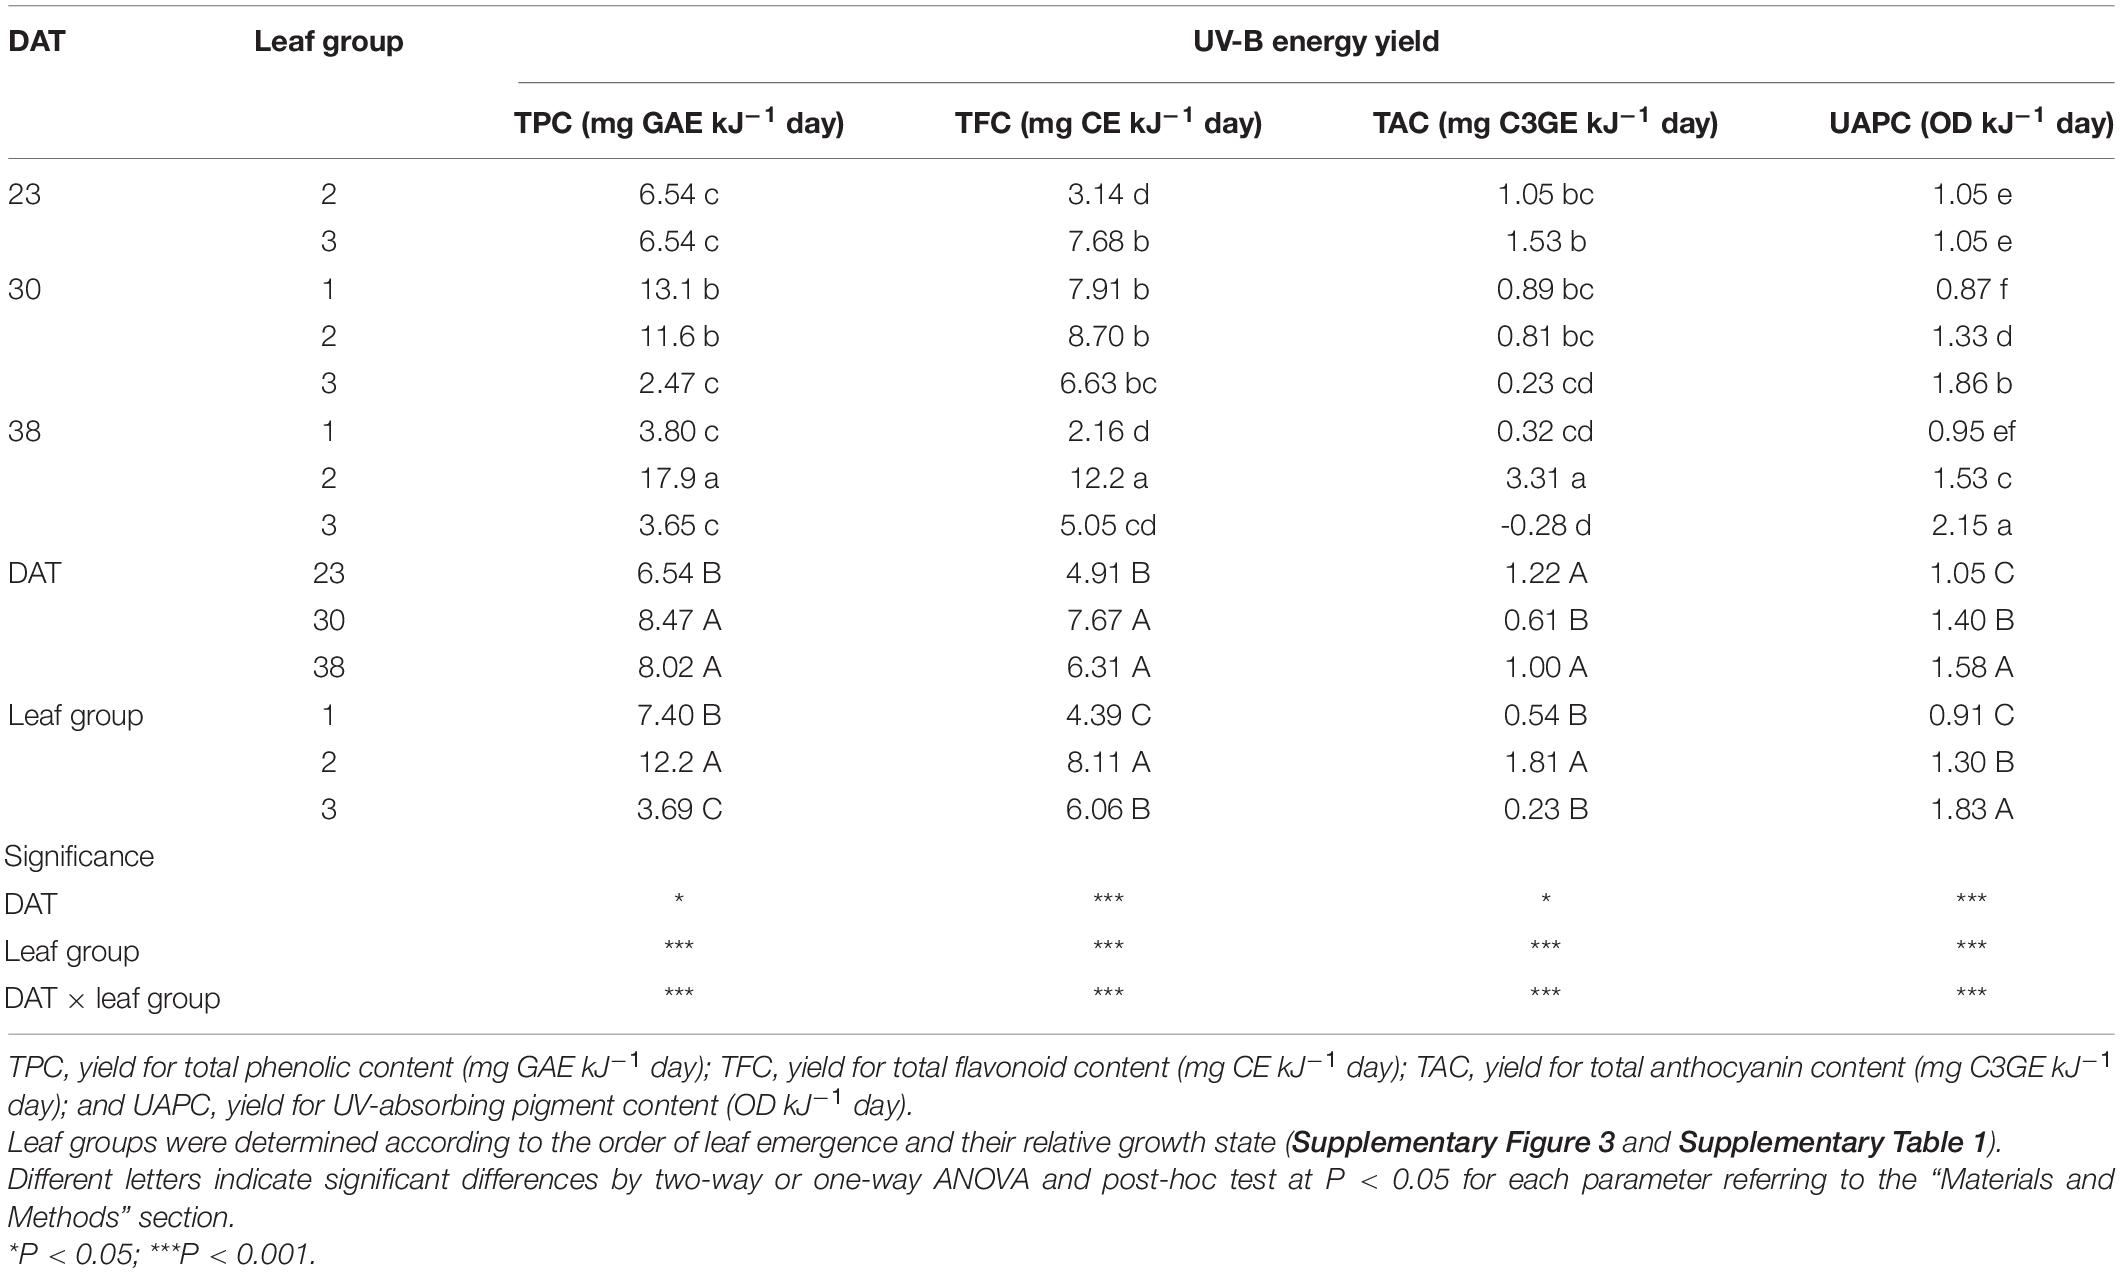
Table 2. UV-B energy yields for phenolic content per leaf of kale plants with leaf group at 23, 30, and 38 days after transplanting (DAT) referring to Eq. 2 and Table 1.
The UV-B energy yields for the TPC and TFC significantly increased as growth progressed and were higher in leaf group 2 than in the others. As growth progressed, the UV-B energy yields for TPC and TFC decreased in leaf group 3 but increased in leaf group 2. Those for TPC and TFC were the highest in leaf group 2 at 38 DAT. The UV-B yield for the UAPC in both leaf groups 2 and 3 increased significantly as growth progressed and was the highest in leaf group 3 at 38 DAT. The UV-B energy yields for TAC were the highest in leaf group 2 at 38 DAT.
Variables affecting the perception of UV-B radiation by plants, such as dose (fluence rate and duration), timing during a day or growth stages, light sources (solar, broadband, or narrowband UV lamp), and setup (greenhouse or chamber), make it hard to define the intensity or dose thresholds of UV-B radiation (Meyer et al., 2021). This confusion without coherence hampers understanding of plant physiology as well as commercial use of bioactive compound production. High doses of UV-B (high fluence rate, long duration, or shorter wavelength) cause metabolic disorders, such as chlorophyll degradation and the generation of reactive oxygen species (ROS), supporting the long-held opinion that UV-B radiation is harmful to plants (Jordan, 2002). Recent studies have highlighted the regulatory properties of moderate UV-B radiation (low and ecologically relevant level or longer wavelength) as a eustressor and numerous acclimation strategies, including changes in secondary metabolism (Hideg et al., 2013; Neugart and Schreiner, 2018). In general, plants perceive UV-B radiation by the specific receptor UV RESISTANCE LOCUS 8 (UVR8), leading to signal transduction of UVR8-COP1 (CONSTITUTIVE PHOTOMORPHOGENESIS1) with ELONGATED HYPOCOTYL5 (HY5) and HY5 HOMOLOG (HYH) transcription factors (Liang et al., 2019). O’Hara et al. (2019) reported that the expression of a gene encoding the transcription factor ARABIDOPSIS NAC DOMAIN PROTEIN 13 (ANAC13) was induced over a range of UV-B wavelengths at low doses, with a maximum response at 310 nm. Rácz and Hideg (2021) reported that the antioxidant enzyme activities under narrowband 311 nm UV-B radiation evoked opposite responses from broadband UV radiation. The contents of chlorophyll a and chlorophyll b, total chlorophyll, and carotenoid were significantly lower at 23 DAT and were significantly higher in UV6h radiation but lower in UV12h radiation than in the control (Supplementary Figure 4). These suggestions may support the results in this study that the contents of bioactive compounds increased in kale plants exposed to UV-B radiation generated by the narrowband 310 nm UV-B LED for 6 h despite the high fluence rate without distinct damage to growth or chlorophyll content (Figures 4, 5 and Supplementary Figures 1, 4).
Ultraviolet-B radiation has been reported to be effective in increasing phenolic contents and AOC. In this study, the TPC, TFC, TAC, UAPC, and AOC per DM and per leaf were significantly higher with longer UV-B exposure (Figures 4–6). As a response to UV-B radiation, the enhanced biosynthesis of phenylpropanoids has been well documented in Brassica species, including kale (Castillejo et al., 2021; Neugart and Bumke-Vogt, 2021). Under UV-B exposure, phenolics and flavonoids accumulate in epidermal tissues and act as direct UV screens, i.e., the main components of UAP (Neugart and Schreiner, 2018). The innate antioxidant potential of the compounds increases ROS scavenging activity and protects sensitive tissues from the high UV-B energy (Hideg et al., 2013). Dou et al. (2019) reported that AOC was positively correlated with UV-B dose, resulting from linear increases in the TPC and TFC in basil.
Plant and leaf developmental stages determine the UV-B-induced accumulation of bioactive compounds, but the relationships are not straightforward. In this study, leaf groups 1, 2, and 3 correspond to relatively old, intermediate, and young leaves at each growth stage, respectively, as determined by the order of leaf emergence and the relative growth state (Supplementary Figure 3). The increase rates of phenolic accumulation with UV-B radiation were highest in young leaves at 23 DAT, but those were not always higher in younger leaves than the other leaves at 30 and 38 DAT (Figure 6). Rizi et al. (2021) reported that UV-B-exposed young leaves of Salvia verticillata showed higher phenylpropanoid production than old leaves as higher gene expression of the key enzymes in their synthesis. However, young leaves are typically located near the top of the plant and are more exposed to UV-B radiation than the other leaves. At the plant canopy levels, higher canopy porosity was positively correlated with the contents of flavonoids such as kaempferol and quercetin in red wine grapes (Martínez-Lüscher et al., 2019). With simulated UVRint in individual leaves, the increase rates of TPC and TFC were the highest in intermediate leaves at 30–38 DAT (Figure 6), which is consistent with the previous study (Yoon et al., 2021b). Therefore, at least locally accumulated UV-B-induced phenolics are determined by structural factors such as leaf position, area, and curvature as well as by developmental age.
The plant structure varies depending on its phyllotaxis and changes as the plant grows, but the plants are exposed to UV-B sources in a one-size-fits-all manner. The UV-B energy absorbed and its physiological interaction with individual leaves inevitably lead to a heterogeneous response in the plant. In this study, UV radiation interception was simulated well along with structural properties, including leaf height, angle, and surface curvature, using ray-tracing simulation and a 3D-scanned plant model (Figure 3). Previous studies on a light interception in plant structures have focused on the spatial distribution of PAR interception and photosynthesis using simulations (Sarlikioti et al., 2011; Shin et al., 2021). In controlled environments, the PAR interception was determined by the physical structures and arrangements of plants and artificial lighting (Kim et al., 2020; Saito et al., 2020). As growth progressed, plant height increased, but the UVRint value of leaf group 3 decreased (Figure 3B). Reduced overlap of radiation at the position close to the UV-B LEDs with a narrow radiation area and the mutual shading by neighboring plants decreased the UVRint despite growth progress (Yoon et al., 2021b).
In general, major environmental factors are controlled to optimize crop photosynthesis and growth in controlled environments (Carotti et al., 2021). Secondary metabolite production has been attempted to be maximized beyond biomass controlling environmental factors, including temperature, relative humidity, photoperiod, and light spectrum (Shim et al., 2018; Johnson et al., 2019; Appolloni et al., 2021). Unlike other environmental factors, supplementation with UV-B radiation near harvest could be more effective without growth loss or additional energy input (dos S. Nascimento et al., 2020; Yoon et al., 2020). Since UV-B exposure is a potent abiotic elicitor for the biosynthesis of secondary metabolites, its energy inputs should be optimized (Thakur et al., 2019; Toscano et al., 2019). Optimization of various elicitors has mostly been reported in the studies of in vitro plant tissue culture (Ghorbani et al., 2015; Farjaminezhad and Garoosi, 2021).
This study developed statistical models to assess how UV-B radiation as an elicitor enhances the phenolic accumulation in kale plants. For this purpose, the daily absorbed UV-B energy and the phenolic contents were analyzed as each value per leaf (Figures 3C, 6). The developed models suitably explained the TPC, TFC, and UAPC as functions of UV-B radiation interception and leaf order according to growth stage (Table 1 and Figures 7, 8). These models showed high accuracies for predicting the TPC, TFC, TAC, and UAPC (Figure 9). The relatively low R2 of the models at 23 DAT might be due to the small number of measured samples, which was less than half of the total (Figures 9C,D and Supplementary Figure 2).
Statistical modeling is an effective tool for quantifying the relationship between dependent and independent variables by the statistical significance of their correlations (Kim et al., 2016). Kim et al. (2018) developed a statistical model for glucosinolate content in Chinese cabbage using a second-order multi-polynomial equation with growth duration and temperature as independent variables. In this study, the model structure was determined according to the linear pattern of phenolic accumulation with UV-B dose as shown in the results from previous studies (Dou et al., 2019; Yoon et al., 2021a) or quadratic pattern with leaf group as shown in Figure 6 and the results from a previous study (Yoon et al., 2021b). However, the developed models were limited to kale plants between 23 and 38 DAT in the UVRint range below 2.5 W m–2 (Figure 3). Within the 3D plant structure, UV-B radiation further enhanced the intraindividual heterogeneity of phenolic contents (Yoon et al., 2021a). Using UV-B radiation interception on a 3D-scanned plant model, the developed models could extend the prediction of a phenolic accumulation from the intraindividual distribution level to the spatial distribution level (Figure 7). This approach to the distribution of metabolites in the 3D plant structure could provide the groundwork for plant metabolism and plant–environment interaction studies (Floros et al., 2017).
The main goal of controlled environment agriculture is to maximize plant productivity and minimize practical production costs, including energy costs (Kozai, 2018). The utilization efficiency of lighting systems on plant structures could be calculated using ray-tracing simulations and 3D-scanned plant models (Kim et al., 2020; Saito et al., 2020). The simulation results along with the photosynthesis model could be used to find out the optimal lighting system with the maximal light use efficiency for photosynthesis (Kim et al., 2020). In this study, the UV-B energy yield for phenolic content was calculated (Table 2). The annual production of bioactive compounds was simply estimated based on plant density (plant m–2) and cultivation cycle per year according to harvest time (Yoon et al., 2019). From the data in this study, the optimal harvest time for the annual production of TFC was calculated as 30 DAT. Although the plant size and UV-B yield were high at 38 DAT, the annual production was high at 30 DAT because the shorter cultivation period increased the number of cultivations per year. We used kale as the representative plant because the phyllotaxis of the kale is a spiral pattern, which is a common pattern, and is widely cultivated around the world. This model approach could be extended to various plants and structures. Further steps in the modeling procedure for agriculture and food systems were model simulation and model-based analysis (Kim et al., 2016). These steps allow us to investigate numerous scenarios and predict the system responses with cost and input in an effective way (Kreutz and Timmer, 2009). Therefore, the developed model in this study could be used to predict the phenolic accumulation with effective UV-B energy input through model-based simulation in various environments.
This is the first study on the prediction of phenolic content with UV-B radiation interception and developmental age. Stepwise multiple linear regression models for the TPC, TFC, TAC, and UAPC were developed and validated with high accuracy. Preharvest UV-B radiation was also identified as a suitable strategy for the commercial production of secondary metabolites in controlled environments. Ultimately, the model-based prediction will be used to find out the optimal conditions for the industrial production of secondary metabolites, saving production time and cost.
The original contributions presented in the study are included in the article/Supplementary Material, further inquiries can be directed to the corresponding author.
HY, M-MO, and JS designed the study and prepared the manuscript. HY and JK carried out the data collection. HY performed the model construction, simulation, statistical analysis, and visualization. All authors contributed to the article and approved the submitted version.
This study was supported by the Korea Institute of Planning and Evaluation for Technology in Food, Agriculture and Forestry (IPET) and Korea Smart Farm R&D Foundation (KosFarm) through the Smart Farm Innovation Technology Development Program, funded by the Ministry of Agriculture, Food and Rural Affairs (MAFRA), Korea government (MSIT), and Rural Development Administration (RDA; 421001-03).
The authors declare that the research was conducted in the absence of any commercial or financial relationships that could be construed as a potential conflict of interest.
All claims expressed in this article are solely those of the authors and do not necessarily represent those of their affiliated organizations, or those of the publisher, the editors and the reviewers. Any product that may be evaluated in this article, or claim that may be made by its manufacturer, is not guaranteed or endorsed by the publisher.
We thank Jewook Choi and Hyun Young Kim for their assistance with sample collection. We also thank Hee Jae Lee for helping with writing and proofreading.
The Supplementary Material for this article can be found online at: https://www.frontiersin.org/articles/10.3389/fpls.2022.918170/full#supplementary-material
Supplementary Figure 1 | Total fresh mass, leaf area, and root dry mass of kale plants.
Supplementary Figure 2 | Leaf fresh mass and leaf area of kale plants.
Supplementary Figure 3 | Leaf relative growth rate and expansion rate of leaf populations.
Supplementary Figure 4 | Chlorophyll and carotenoid contents in individual leaves of kale plants.
Supplementary Figure 5 | Comparison between measured and estimated phenolic contents per leaf of kale plants in the data set.
Supplementary Table 1 | Relative growth rate and expansion rate of leaf groups, and the assigned leaf order in kale plants at 23, 30, and 38 DAT.
Ainsworth, E. A., and Gillespie, K. M. (2007). Estimation of total phenolic content and other oxidation substrates in plant tissues using Folin-Ciocalteu reagent. Nat. Protoc. 2, 875–877. doi: 10.1038/nprot.2007.102
Aphalo, P. J., Albert, A., Björn, L. O., McLeod, A. R., Robson, T. M., and Rosenqvist, E. (2012). Beyond the visible : A Handbook of Best Practice in Plant UV Photobiology, eds P. J. Aphalo, A. Albert, L. O. Björn, A. R. McLeod, T. M. Robson, and E. Rosenqvist (Helsinki: University of Helsinki), doi: 10.31885/9789521083631
Appolloni, E., Pennisi, G., Zauli, I., Carotti, L., Paucek, I., Quaini, S., et al. (2021). Beyond vegetables: effects of indoor LED light on specialized metabolite biosynthesis in medicinal and aromatic plants, edible flowers, and microgreens. J. Sci. Food Agric. 30, 472–487. doi: 10.1002/jsfa.11513
Behn, H., Schurr, U., Ulbrich, A., and Noga, G. (2011). Development-dependent UV-B responses in red oak leaf lettuce (Lactuca sativa L.): physiological mechanisms and significance for hardening. Eur. J. Hortic. Sci. 76, 33–40.
Brand-Williams, W., Cuvelier, M. E., and Berset, C. (1995). Use of a free radical method to evaluate antioxidant activity. LWT Food Sci. Technol. 28, 25–30. doi: 10.1016/S0023-6438(95)80008-5
Carotti, L., Graamans, L., Puksic, F., Butturini, M., Meinen, E., Heuvelink, E., et al. (2021). Plant factories are heating up: hunting for the best combination of light intensity, air temperature and root-zone temperature in lettuce production. Front. Plant Sci. 11:592171. doi: 10.3389/fpls.2020.592171
Castillejo, N., Martínez-Zamora, L., and Artés-Hernández, F. (2021). Periodical UV-B radiation hormesis in biosynthesis of kale sprouts nutraceuticals. Plant Physiol. Biochem. 165, 274–285. doi: 10.1016/j.plaphy.2021.05.022
Choi, K. Y., Seo, T. C., and Suh, H.-D. (2005). Development of nutrient solution for hydroponics of cruciferae leaf vegetables based on nutrient-water absorption rate and the cation ratio. Prot. Hortic. Plant Fact. 14, 288–296.
Csepregi, K., Coffey, A., Cunningham, N., Prinsen, E., Hideg, É, and Jansen, M. A. K. (2017). Developmental age and UV-B exposure co-determine antioxidant capacity and flavonol accumulation in Arabidopsis leaves. Environ. Exp. Bot. 140, 19–25. doi: 10.1016/j.envexpbot.2017.05.009
Csepregi, K., Neugart, S., Schreiner, M., and Hideg, É (2016). Comparative evaluation of total antioxidant capacities of plant polyphenols. Molecules 21:208. doi: 10.3390/molecules21020208
Dewanto, V., Xianzhong, W., Adom, K. K., and Liu, R. H. (2002). Thermal processing enhances the nutritional value of tomatoes by increasing total antioxidant activity. J. Agric. Food Chem. 50, 3010–3014. doi: 10.1021/jf0115589
dos S. Nascimento, L. B., Brunetti, C., Agati, G., Lo Iacono, C., Detti, C., et al. (2020). Short-term pre-harvest UV-B supplement enhances the polyphenol content and antioxidant capacity of Ocimum basilicum leaves during storage. Plants 9:797. doi: 10.3390/plants9060797
Dou, H., Niu, G., and Gu, M. (2019). Pre-harvest UV-B radiation and photosynthetic photon flux density interactively affect plant photosynthesis, growth, and secondary metabolites accumulation in basil (Ocimum basilicum) plants. Agronomy 9:434. doi: 10.3390/agronomy9080434
Farjaminezhad, R., and Garoosi, G. (2021). Improvement and prediction of secondary metabolites production under yeast extract elicitation of Azadirachta indica cell suspension culture using response surface methodology. AMB Express 11:43. doi: 10.1186/s13568-021-01203-x
Flint, S. D., and Caldwell, M. M. (2003). A biological spectral weighting function for ozone depletion research with higher plants. Physiol. Plant. 117, 137–144. doi: 10.1034/j.1399-3054.2003.1170117.x
Floros, D. J., Petras, D., Kapono, C. A., Melnik, A. V., Ling, T. J., Knight, R., et al. (2017). Mass spectrometry based molecular 3D-cartography of plant metabolites. Front. Plant Sci. 8:429. doi: 10.3389/fpls.2017.00429
Francisco, M., Tortosa, M., Martínez-Ballesta, M., del, C., Velasco, P., García-Viguera, C., et al. (2017). Nutritional and phytochemical value of Brassica crops from the agri-food perspective. Ann. Appl. Biol. 170, 273–285. doi: 10.1111/aab.12318
Ghorbani, M., Ghorbani, A., Omidi, M., and Hashemi, S. M. (2015). Response surface modelling of noradrenaline production in hairy root culture of purslane (Portulaca oleracea L.). Turkish J. Agric. Food Sci. Technol. 3:349. doi: 10.24925/turjaf.v3i6.349-443.320
Hagen, S. F., Borge, G. I. A., Solhaug, K. A., and Bengtsson, G. B. (2009). Effect of cold storage and harvest date on bioactive compounds in curly kale (Brassica oleracea L. var. acephala). Postharvest Biol. Technol. 51, 36–42. doi: 10.1016/j.postharvbio.2008.04.001
Heinze, M., Hanschen, F. S., Wiesner-Reinhold, M., Baldermann, S., Gräfe, J., Schreiner, M., et al. (2018). Effects of developmental stages and reduced UVB and low UV conditions on plant secondary metabolite profiles in pak choi (Brassica rapa subsp. chinensis). J. Agric. Food Chem. 66, 1678–1692. doi: 10.1021/acs.jafc.7b03996
Hideg, É, Jansen, M. A. K., and Strid, Å (2013). UV-B exposure, ROS, and stress: inseparable companions or loosely linked associates? Trends Plant Sci. 18, 107–115. doi: 10.1016/j.tplants.2012.09.003
Hitz, T., Henke, M., Graeff-Hönninger, S., and Munz, S. (2019). Three-dimensional simulation of light spectrum and intensity within an LED growth chamber. Comput. Electron. Agric. 156, 540–548. doi: 10.1016/j.compag.2018.11.043
Johnson, A. J., Meyerson, E., de la Parra, J., Savas, T. L., Miikkulainen, R., and Harper, C. B. (2019). Flavor-cyber-agriculture: optimization of plant metabolites in an open-source control environment through surrogate modeling. PLoS One 14:e0213918. doi: 10.1371/journal.pone.0213918
Jordan, B. R. (2002). Review: Molecular response of plant cells to UV-B stress. Funct. Plant Biol. 29, 909. doi: 10.1071/FP02062
Khudyakova, A. Y., Kreslavski, V. D., Shmarev, A. N., Lyubimov, V. Y., Shirshikova, G. N., Pashkovskiy, P. P., et al. (2019). Impact of UV-B radiation on the photosystem II activity, pro-/antioxidant balance and expression of light-activated genes in Arabidopsis thaliana hy4 mutants grown under light of different spectral composition. J. Photochem. Photobiol. B Biol. 194, 14–20. doi: 10.1016/j.jphotobiol.2019.02.003
Kim, D.-G., Cho, B.-K., and Lee, W.-H. (2016). A novel approach in analyzing agriculture and food systems: review of modeling and its applications. Korean J. Agric. Sci. 43, 163–175. doi: 10.7744/kjoas.20160019
Kim, D.-G., Shim, J.-Y., Ko, M.-J., Chung, S.-O., Chowdhury, M., and Lee, W.-H. (2018). Statistical modeling for estimating glucosinolate content in Chinese cabbage by growth conditions. J. Sci. Food Agric. 98, 3580–3587. doi: 10.1002/jsfa.8874
Kim, J., Kang, W. H., and Son, J. E. (2020). Interpretation and evaluation of electrical lighting in plant factories with ray-tracing simulation and 3D plant modeling. Agronomy 10:1545. doi: 10.3390/agronomy10101545
Kneissl, M., Seong, T.-Y., Han, J., and Amano, H. (2019). The emergence and prospects of deep-ultraviolet light-emitting diode technologies. Nat. Photonics 13, 233–244. doi: 10.1038/s41566-019-0359-9
Kozai, T. (2018). Smart Plant Factory, ed. T. Kozai Singapore (Cham: Springer). doi: 10.1007/978-981-13-1065-2
Kreutz, C., and Timmer, J. (2009). Systems biology: experimental design. FEBS J. 276, 923–942. doi: 10.1111/j.1742-4658.2008.06843.x
Liang, T., Yang, Y., and Liu, H. (2019). Signal transduction mediated by the plant UV-B photoreceptor UVR8. New Phytol. 221, 1247–1252. doi: 10.1111/nph.15469
Liao, X., Liu, W., Yang, H., and Jenkins, G. I. (2020). A dynamic model of UVR8 photoreceptor signalling in UV-B-acclimated Arabidopsis. New Phytol. 227, 857–866. doi: 10.1111/nph.16581
Lichtenthaler, H. K., and Buschmann, C. (2001). Chlorophylls and carotenoids: Measurement and characterization by UV-VIS spectroscopy. Curr. Protoc. Food Anal. Chem. 1, F4.3.1–F4.3.8. doi: 10.1002/0471142913.faf0403s01
Loconsole, D., and Santamaria, P. (2021). UV lighting in horticulture: A sustainable tool for improving production quality and food safety. Horticulturae 7:9. doi: 10.3390/horticulturae7010009
Loi, M., Villani, A., Paciolla, F., Mulè, G., and Paciolla, C. (2020). Challenges and opportunities of light-emitting diode (LED) as key to modulate antioxidant compounds in plants. A review. Antioxidants 10:42. doi: 10.3390/antiox10010042
Majer, P., and Hideg, É (2012). Developmental stage is an important factor that determines the antioxidant responses of young and old grapevine leaves under UV irradiation in a green-house. Plant Physiol. Biochem 50, 15–23. doi: 10.1016/j.plaphy.2011.09.018
Martínez-Lüscher, J., Brillante, L., and Kurtural, S. K. (2019). Flavonol profile is a reliable indicator to assess canopy architecture and the exposure of red wine grapes to solar radiation. Front. Plant Sci. 10:10. doi: 10.3389/fpls.2019.00010
Meyer, P., Van de Poel, B., and De Coninck, B. (2021). UV-B light and its application potential to reduce disease and pest incidence in crops. Hortic. Res. 8:194. doi: 10.1038/s41438-021-00629-5
Mosadegh, H., Trivellini, A., Lucchesini, M., Ferrante, A., Maggini, R., Vernieri, P., et al. (2019). UV-B physiological changes under conditions of distress and eustress in sweet basil. Plants 8:396. doi: 10.3390/plants8100396
Neugart, S., and Bumke-Vogt, C. (2021). Flavonoid glycosides in Brassica species respond to UV-B depending on exposure time and adaptation time. Molecules 26:494. doi: 10.3390/molecules26020494
Neugart, S., and Schreiner, M. (2018). UVB and UVA as eustressors in horticultural and agricultural crops. Sci. Hortic. 234, 370–381. doi: 10.1016/j.scienta.2018.02.021
O’Hara, A., Headland, L. R., Díaz-Ramos, L. A., Morales, L. O., Strid, Å, and Jenkins, G. I. (2019). Regulation of Arabidopsis gene expression by low fluence rate UV-B independently of UVR8 and stress signaling. Photochem. Photobiol. Sci. 18, 1675–1684. doi: 10.1039/C9PP00151D
Paradiso, R., and Proietti, S. (2021). Light-quality manipulation to control plant growth and photomorphogenesis in greenhouse horticulture: The state of the art and the opportunities of modern LED systems. J. Plant Growth Regul. 41, 742–780. doi: 10.1007/s00344-021-10337-y
Pontarin, N., Molinié, R., Mathiron, D., Tchoumtchoua, J., Bassard, S., Gagneul, D., et al. (2020). Age-dependent metabolic profiles unravel the metabolic relationships within and between flax leaves (Linum usitatissimum). Metabolites 10:218. doi: 10.3390/metabo10060218
Rácz, A., and Hideg, É (2021). Narrow-band 311 nm ultraviolet-B radiation evokes different antioxidant responses from broad-band ultraviolet. Plants 10:1570. doi: 10.3390/plants10081570
Rankenberg, T., Geldhof, B., van Veen, H., Holsteens, K., Van de Poel, B., and Sasidharan, R. (2021). Age-dependent abiotic stress resilience in plants. Trends Plant Sci. 26, 692–705. doi: 10.1016/j.tplants.2020.12.016
Re, R., Pellegrini, N., Proteggente, A., Pannala, A., Yang, M., and Rice-Evans, C. (1999). Antioxidant activity applying an improved ABTS radical cation decolorization assay. Free Radic. Biol. Med. 26, 1231–1237. doi: 10.1016/S0891-5849(98)00315-3
Rechner, O., Neugart, S., Schreiner, M., Wu, S., and Poehling, H.-M. (2016). Different narrow-band light ranges alter plant secondary metabolism and plant defense response to aphids. J. Chem. Ecol. 42, 989–1003. doi: 10.1007/s10886-016-0755-2
Rizi, M. R., Azizi, A., Sayyari, M., Mirzaie-Asl, A., and Conti, L. (2021). Increased phenylpropanoids production in UV-B irradiated Salvia verticillata as a consequence of altered genes expression in young leaves. Plant Physiol. Biochem. 167, 174–184. doi: 10.1016/j.plaphy.2021.07.037
Saito, K., Ishigami, Y., and Goto, E. (2020). Evaluation of the light environment of a plant factory with artificial light by using an optical simulation. Agronomy 10:1663. doi: 10.3390/agronomy10111663
Šamec, D., Urlić, B., and Salopek-Sondi, B. (2019). Kale (Brassica oleracea var. acephala) as a superfood: review of the scientific evidence behind the statement. Crit. Rev. Food Sci. Nutr. 59, 2411–2422. doi: 10.1080/10408398.2018.1454400
Sarlikioti, V., de Visser, P. H. B., and Marcelis, L. F. M. (2011). Exploring the spatial distribution of light interception and photosynthesis of canopies by means of a functional–structural plant model. Ann. Bot. 107, 875–883. doi: 10.1093/aob/mcr006
Schreiner, M., Krumbein, A., Mewis, I., Ulrichs, C., and Huyskens-Keil, S. (2009). Short-term and moderate UV-B radiation effects on secondary plant metabolism in different organs of nasturtium (Tropaeolum majus L.). Innov. Food Sci. Emerg. Technol. 10, 93–96. doi: 10.1016/j.ifset.2008.10.001
Schreiner, M., Mewis, I., Huyskens-Keil, S., Jansen, M. A. K., Zrenner, R., Winkler, J. B., et al. (2012). UV-B-induced secondary plant metabolites - Potential benefits for plant and human health. CRC Crit. Rev. Plant Sci. 31, 229–240. doi: 10.1080/07352689.2012.664979
Shim, J.-Y., Kim, H.-Y., Kim, D.-G., Lee, Y.-S., Chung, S.-O., and Lee, W.-H. (2018). Optimizing growth conditions for glucosinolate production in Chinese cabbage. Hortic. Environ. Biotechnol. 59, 649–657. doi: 10.1007/s13580-018-0084-1
Shin, J., Hwang, I., Kim, D., Moon, T., Kim, J., Kang, W. H., et al. (2021). Evaluation of the light profile and carbon assimilation of tomato plants in greenhouses with respect to film diffuseness and regional solar radiation using ray-tracing simulation. Agric. For. Meteorol. 296:108219. doi: 10.1016/j.agrformet.2020.108219
Si, C., Yao, X. Q., He, X. L., Chu, J. Z., Ma, C. H., and Shi, X. F. (2015). Effects of enhanced UV-B radiation on biochemical traits in postharvest flowers of medicinal chrysanthemum. Photochem. Photobiol. 91, 845–850. doi: 10.1111/php.12450
Sun, M., Gu, X., Fu, H., Zhang, L., Chen, R., Cui, L., et al. (2010). Change of secondary metabolites in leaves of Ginkgo biloba L. in response to UV-B induction. Innov. Food Sci. Emerg. Technol. 11, 672–676. doi: 10.1016/j.ifset.2010.08.006
Sytar, O., Bośko, P., Živèák, M., Brestic, M., and Smetanska, I. (2018). Bioactive phytochemicals and antioxidant properties of the grains and sprouts of colored wheat genotypes. Molecules 23:2282. doi: 10.3390/molecules23092282
Takshak, S., and Agrawal, S. B. (2019). Defense potential of secondary metabolites in medicinal plants under UV-B stress. J. Photochem. Photobiol. B Biol. 193, 51–88. doi: 10.1016/j.jphotobiol.2019.02.002
Thakur, M., Bhattacharya, S., Khosla, P. K., and Puri, S. (2019). Improving production of plant secondary metabolites through biotic and abiotic elicitation. J. Appl. Res. Med. Aromat. Plants 12, 1–12. doi: 10.1016/j.jarmap.2018.11.004
Toscano, S., Trivellini, A., Cocetta, G., Bulgari, R., Francini, A., Romano, D., et al. (2019). Effect of preharvest abiotic stresses on the accumulation of bioactive compounds in horticultural produce. Front. Plant Sci. 10:1212. doi: 10.3389/fpls.2019.01212
Wiesner-Reinhold, M., Dutra Gomes, J. V., Herz, C., Tran, H. T. T., Baldermann, S., Neugart, S., et al. (2021). Subsequent treatment of leafy vegetables with low doses of UVB-radiation does not provoke cytotoxicity, genotoxicity, or oxidative stress in a human liver cell model. Food Biosci. 43:101327. doi: 10.1016/j.fbio.2021.101327
Yoon, H. I., Kim, D., and Son, J. E. (2020). Spatial and temporal bioactive compound contents and chlorophyll fluorescence of kale (Brassica oleracea L.) under UV-B exposure near harvest time in controlled environments. Photochem. Photobiol. 96, 845–852. doi: 10.1111/php.13237
Yoon, H. I., Kim, H. Y., Kim, J., and Son, J. E. (2021b). Quantitative analysis of UV-B radiation interception and bioactive compound contents in kale by leaf position according to growth progress. Front. Plant Sci. 12:667456. doi: 10.3389/fpls.2021.667456
Yoon, H. I., Kim, H. Y., Kim, J., Oh, M., and Son, J. E. (2021a). Quantitative analysis of UV-B radiation interception in 3D plant structures and intraindividual distribution of phenolic contents. Int. J. Mol. Sci. 22:2701. doi: 10.3390/ijms22052701
Keywords: antioxidants, flavonoids, growth stage, light interception, plant factory
Citation: Yoon HI, Kim J, Oh M-M and Son JE (2022) Prediction of Phenolic Contents Based on Ultraviolet-B Radiation in Three-Dimensional Structure of Kale Leaves. Front. Plant Sci. 13:918170. doi: 10.3389/fpls.2022.918170
Received: 12 April 2022; Accepted: 20 May 2022;
Published: 09 June 2022.
Edited by:
Luigi Lucini, Catholic University of the Sacred Heart, ItalyReviewed by:
Houcheng Liu, South China Agricultural University, ChinaCopyright © 2022 Yoon, Kim, Oh and Son. This is an open-access article distributed under the terms of the Creative Commons Attribution License (CC BY). The use, distribution or reproduction in other forums is permitted, provided the original author(s) and the copyright owner(s) are credited and that the original publication in this journal is cited, in accordance with accepted academic practice. No use, distribution or reproduction is permitted which does not comply with these terms.
*Correspondence: Jung Eek Son, c2plZW52QHNudS5hYy5rcg==
Disclaimer: All claims expressed in this article are solely those of the authors and do not necessarily represent those of their affiliated organizations, or those of the publisher, the editors and the reviewers. Any product that may be evaluated in this article or claim that may be made by its manufacturer is not guaranteed or endorsed by the publisher.
Research integrity at Frontiers
Learn more about the work of our research integrity team to safeguard the quality of each article we publish.