 Ying Cui
 Suhong Liu1,2*
- 1Faculty of Geographical Science, Beijing Normal University, Beijing, China
- 2Beijing Key Laboratory of Environmental Remote Sensing and Digital Cities, Beijing Normal University, Beijing, China
- 3Land Satellite Remote Sensing Application Center, Ministry of Natural Resources of the People’s Republic of China, Beijing, China
Accurate yield estimation at the regional scale has always been a persistent challenge in the agricultural sector. With the vigorous emergence of remote sensing land surface observations in recent decades, data assimilation methodology has become an effective means to promote the accuracy and efficiency of yield estimation by integrating regional data and point-scale crop models. This paper focuses on the black soil area of Northeast China, a national strategic grain production base, applying the AquaCrop crop growth model to simulate the fractional vegetation cover (FVC) and maize yield from 2000 to 2020 and then forming a reliable FVC optimization dataset based on an ensemble Kalman filter (EnKF) assimilation algorithm with remote sensing products. Using the random forest model, the regression relationship between FVC and yield was established from the long-term time series data, which is crucial to achieve better yield estimation through the optimized FVC. The major findings include the following: (1) The R2 of the assimilated FVC and maize yield can reach 0.557. (2) When compared with the local statistical yield, our method reduced the mean absolute error (MAE) from 1.164 ton/ha (based on GLASS FVC products) to 1.004 ton/ha (based on the calibrated AquaCrop model) and then to 0.888 ton/ha (the result after assimilation). The above results show that we have proposed a yield estimation method to provide accurate yield estimations by combining data assimilation and machine learning. This study provided deep insights into understanding the variations in FVC and revealed the spatially explicit yield prediction ability from the time series land surface parameters, which has significant potential for optimizing water and soil resource management.
Introduction
Agricultural production is the foundation of human survival. Accurate prediction of crop yield enables farmers to estimate profits and adjust crop-planting patterns. Governments also benefit from yield prediction information, which helps to promote the development and reform of food security, sustainable utilization of water and soil resources, agricultural trade and many other aspects (Feng et al., 2021).
The northeastern Chinese black soil area is a major black soil zone of the world and a strategic guarantee base for national food security by producing crops such as maize and soybean (Lin et al., 2019). The special soil properties and natural geographical conditions make its rain-fed agricultural production mode different from other main grain-producing areas. Atmospheric precipitation has become one of the main influencing factors of crop yield (Cui et al., 2021). According to these characteristics of this area, there is an urgent need to carry out detailed research on crop yield estimation, especially on maize with large planting scale and appreciable economic benefits (Qian et al., 2018).
Crop growth models are an important tool to quantitatively describe the growth and yield formation process of specific crops under specific environments based on point scales (Van et al., 1989; Monteith, 1996; Steduto et al., 2009), and it is difficult to characterize the spatial low of crop growth due to the limitation of scale. The current research trend is to run models on a regional scale and then establish the response system of crop growth to soil and meteorological environment changes to provide macro decision-making for precision agriculture. Different from photosynthetic effective radiation driving mechanism of WOFOST model and the other crop model (Todorovic et al., 2009), AquaCrop model is driven by water factors and simulates crop yield based on water use efficiency (Raes et al., 2009) and is widely used in arid and rain-fed areas with great research prospects in water-efficient utilization (Eshete et al., 2020). This model evolved from the crop water response equation in the irrigation and drainage Document No. 33 of the Food and Agriculture Organization of the United Nations (FAO) (Passioura, 1996). Several studies have applied AquaCrop model to simulate and evaluate typical crops growth in different regions and got great results. Iqbal et al. (2014) demonstrated that the yield of winter wheat in North China Plain simulated by AquaCrop model performed unsatisfied under strong water stress, and the accuracy is significantly improved after parameter calibration. Sandhu and Irmak (2019) found the AquaCrop simulated yield and evapotranspiration quite well in Midwestern America, but encountered substantial difficulties in simulating biomass and soil-water. The AquaCrop model driven by water has advantages for crop research in Northeast China, but relevant research has lacked.
Simulation and observation are two basic strategies of geoscience research (Li, 2016). Since almost all surface variables have high spatiotemporal heterogeneity, there is bound to be deviation and uncertainty in any parameterization process. From the perspective of simulation, although the crop model has sorted out the material cycle and other growth processes very clearly on the micro level, complex error transmission will accumulate, and the uncertainty reflected will be amplified in the simulation results when it is extended to the macro scale. From the perspective of observations, field measurements have high accuracy but low spatial representation. Obtaining abundant observations will be very laborious when studying a large-scale area with high heterogeneity. Although remote sensing observations already provide sufficient surface data, a sophisticated inversion algorithm is needed to gain effective information indirectly. The inversion and sensor accuracy greatly limit the reliability of remote sensing data. Therefore, integrating multisource observations and decreasing the uncertainty of the simulation is key to ameliorating the limitations of model application.
Data assimilation (DA) is an important integrating methodology that automatically adjusts the process model forward direction continuously by relying on observations and then generates the minimum-deviation state variable set with spatiotemporal consistency, which is usually used for modeling and dynamic prediction of complex systems (Li and Bai, 2010; Qin et al., 2018). With the rapid development of remote sensing technology, a large amount of earth observation data has emerged as crucial support for regional precision agriculture research. By reanalyzing the prior crop growth model with multi-temporal observation data, the reliability of the simulation results is improved, which is of great significance to agricultural dynamic monitoring, yield prediction, and regional resource management.
Looking at the relevant studies integrating crop model and remote sensing data in recent years (Table 1), the most common crop models are WOFOST, CERES and AquaCrop. The main crop types are winter wheat and other food crops. Optical remote sensing data is generally used for remote sensing observation data, and a few literatures show that InSAR has a good effect on retrieving soil water content (Wigneron et al., 2017). The assimilation variable generally selects LAI (leaf area index) for various crop models, while there are different options for AquaCrop model. In terms of assimilation algorithm, both cost function algorithm and filtering algorithm have more applications and innovations. The research objectives mostly focus on improving the accuracy of yield estimation. Most of the available studies using short-term data, mostly less than three growing seasons and may neglect the inter-annual variability in environmental conditions.
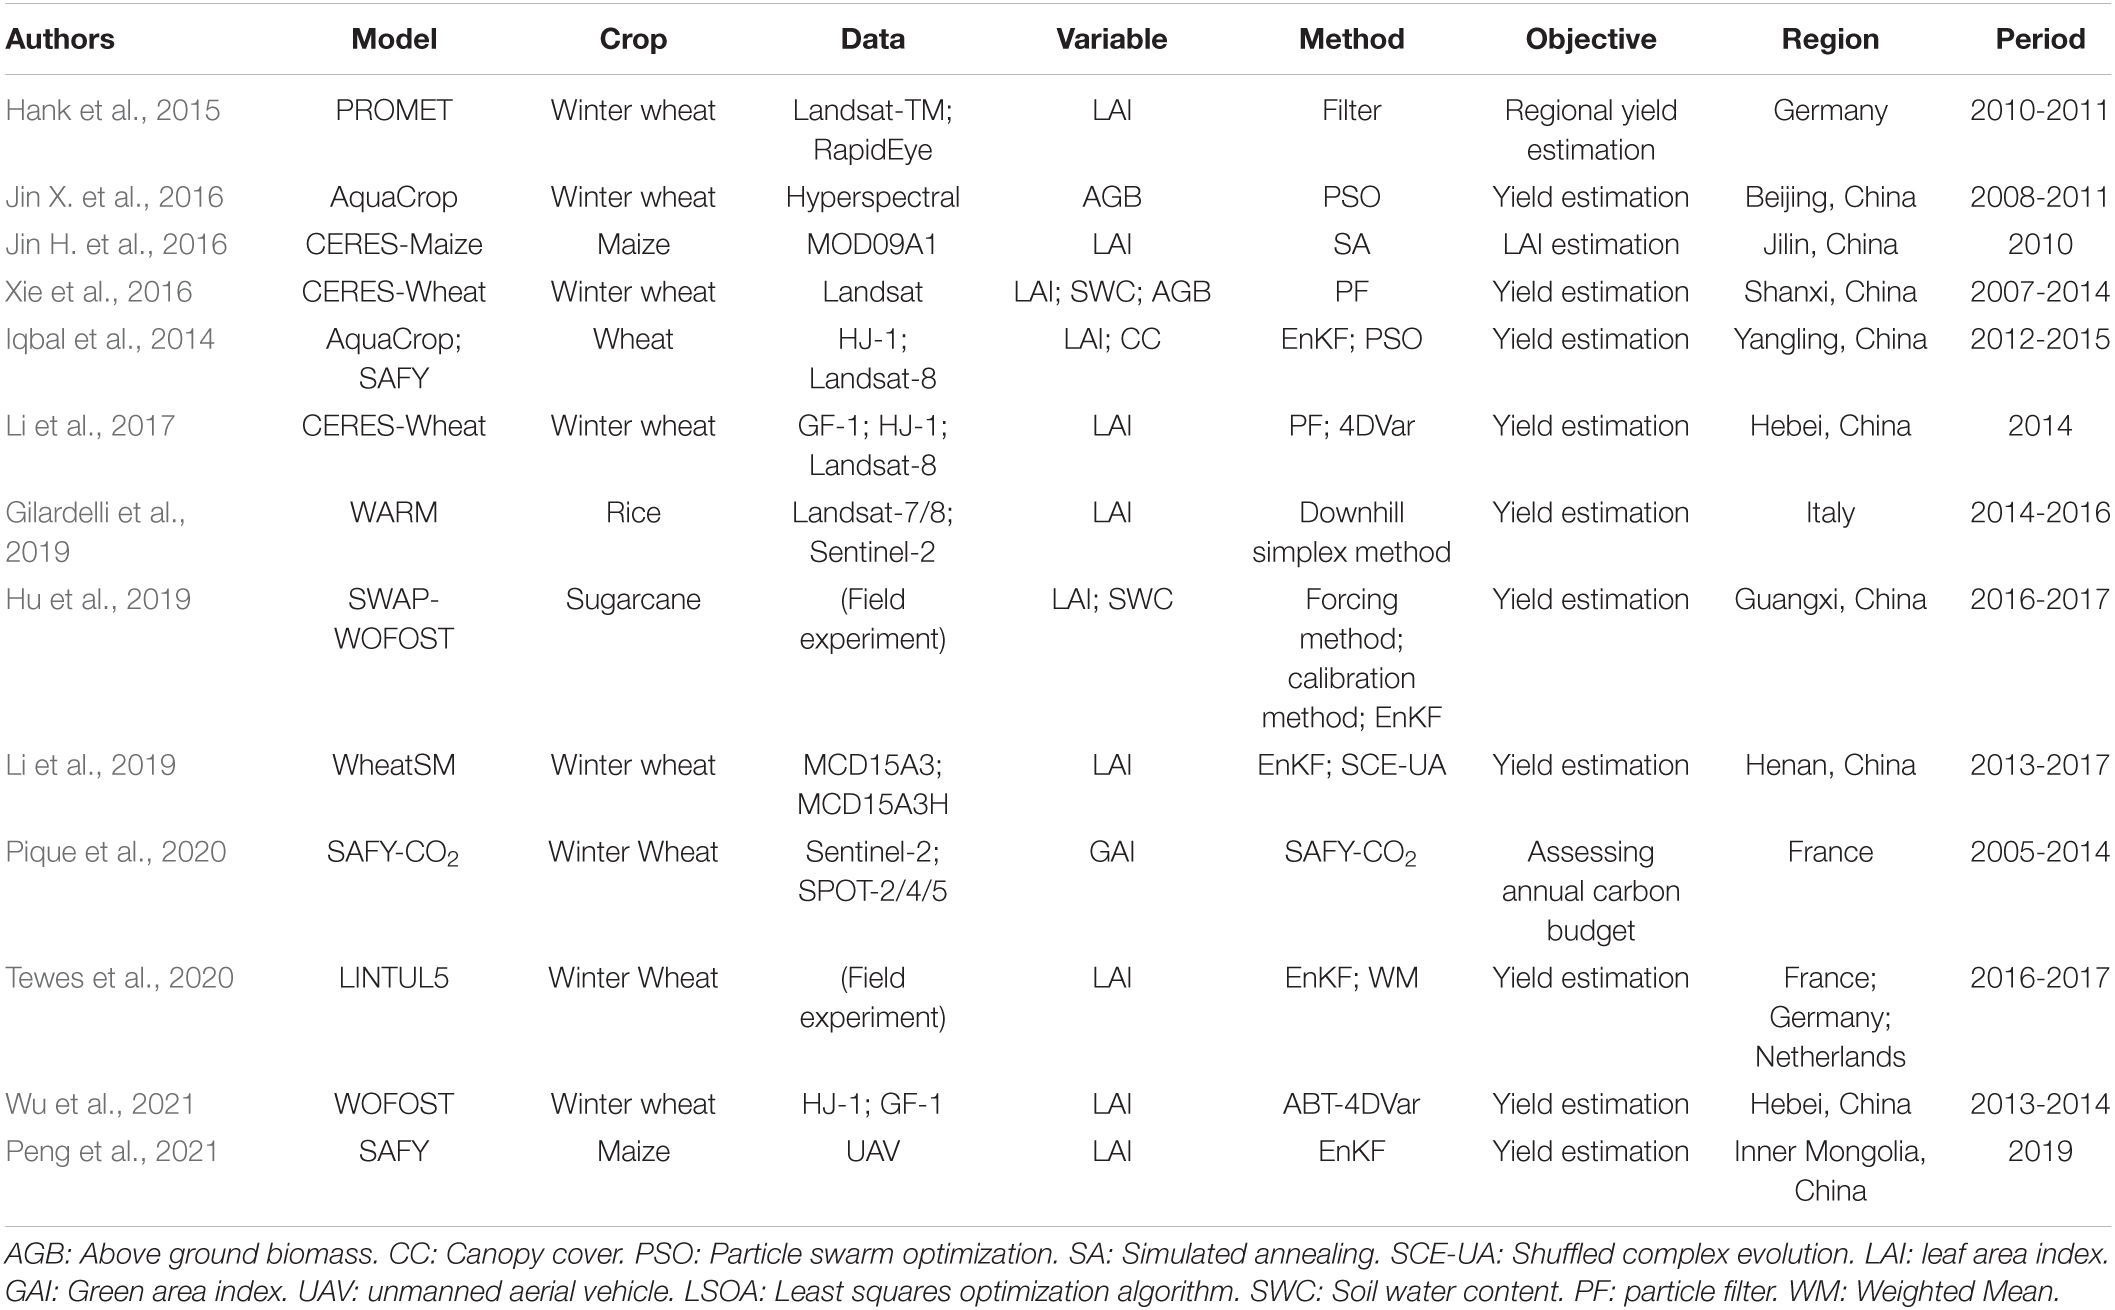
Table 1. Research status of the crop model and remote sensing data assimilation.
Although many studies have indicated the effectiveness of using crop models and remote sensing data assimilation for yield mapping, the expansion accuracy from the field to regional scale still lacks exploration (Steele-Dunne et al., 2017). Silvestro et al. (2017) used the updating assimilation method, the ensemble Kalman filter (EnKF), assimilated leaf area index (LAI) into the SAFY model, and used the calibration assimilation method, PSO, and assimilated canopy cover (CC) into the AquaCrop model to demonstrate the possibility of estimating wheat yield. The results show that the relative root-mean-square error (RRMSE) between the predicted and the measured yield ranges from 0.18 to 0.24 t/ha. SAFY with the EnKF method was more suitable than Aquacrop with PSO, which is mainly due to the high computational cost and the difficult calibration of the AquaCrop model. For the AquaCrop model, CC achieved a lower RMSE than LAI. Another finding of this article is that the accuracy of the assimilation method is greatly limited by the number of remote sensing images, three or four images with an error in LAI estimation of 30% and an error in the yield estimation of approximately 18%. Feng et al. (2019) used the multivariable linear regression model (MLR) and the RF model as external modifications of the APSIM crop model to predict wheat yield, while RF has a higher accuracy gain than MLR. The R2 and root-mean-square error (RMSE) between the predicted yield and the measured yield were 0.81 and 0.54 t/ha and 0.61 and 0.86 t/ha, respectively, before and after combining RF. Hu et al. (2019) used forcing, calibration, and EnKF, three assimilation methods for improving sugarcane crop simulation. The results show that EnKF performed the best in estimating soil water content, LAI development, and sugarcane yield. Assimilating LAI alone works better than assimilating LAI and SWC both under slight water stress levels, which demonstrates that the choice of assimilated variable relies on a reasonable diagnosis of the environment. In summary, the direct assimilation of remote sensing data to update vegetation assessments is very promising. Very limited literature available in Northeast China for yield estimation using data assimilation, especially for long-term study.
This study completed the calibration and validation of the AquaCrop model in Northeast China via field test data and applied 21 years of regional-scale simulations from 2000 to 2020. Then we selected FVC for AquaCrop model assimilation not only because it is one of the outputs of AquaCrop but also because it considers the important role it plays in surface process simulation. Due to the accumulation of sufficient assimilated FVC data and crop yield data, which reflect various environmental conditions, the relationship between yield and environmental factors was established through the machine learning method of random forest. Relying on the FVC assimilation curve, a high-precision estimation of crop yield can be obtained. This study aims to establish an assimilation system to better monitor FVC growth and provide better maize yield estimation, which is significant for local agricultural management.
Materials and Methods
Study Area
The Songnen Plain (42°56′ ∼ 50°03′ N, 122°05′ ∼ 128°12′ E) is located in the middle of the Songliao black soil basin in Northeast China, with a total area of approximately 206404.3 km2 and a large part of it is dominated by rain-fed agriculture. It has a temperate continental monsoon climate, the average annual temperature is approximately 0.4°C, the average annual precipitation is approximately 534 mm, and the altitude is approximately 250∼450 m. In 2021 Liu et al. (2021) classified the phaeozem and chernozem as typical black soil that is covered with a high content of organic matter dark humus and mapped three typical black soil areas in Northeast China which are Sanjiang, Songnen and Mengdong. This study took the Songnen typical black soil region as the study area, composed of Songnen Phaeozem region and Songnen chernozem region. Most farmland in the study area was planted with soybeans and maize without irrigation scheduling. The irrigation scenario was not set up in the subsequent application of crop model. This paper established a database from 28 meteorological stations and 155 practical soil profile samples, scattered as shown in Figure 1. The phenological information of maize is shown in Table 2.
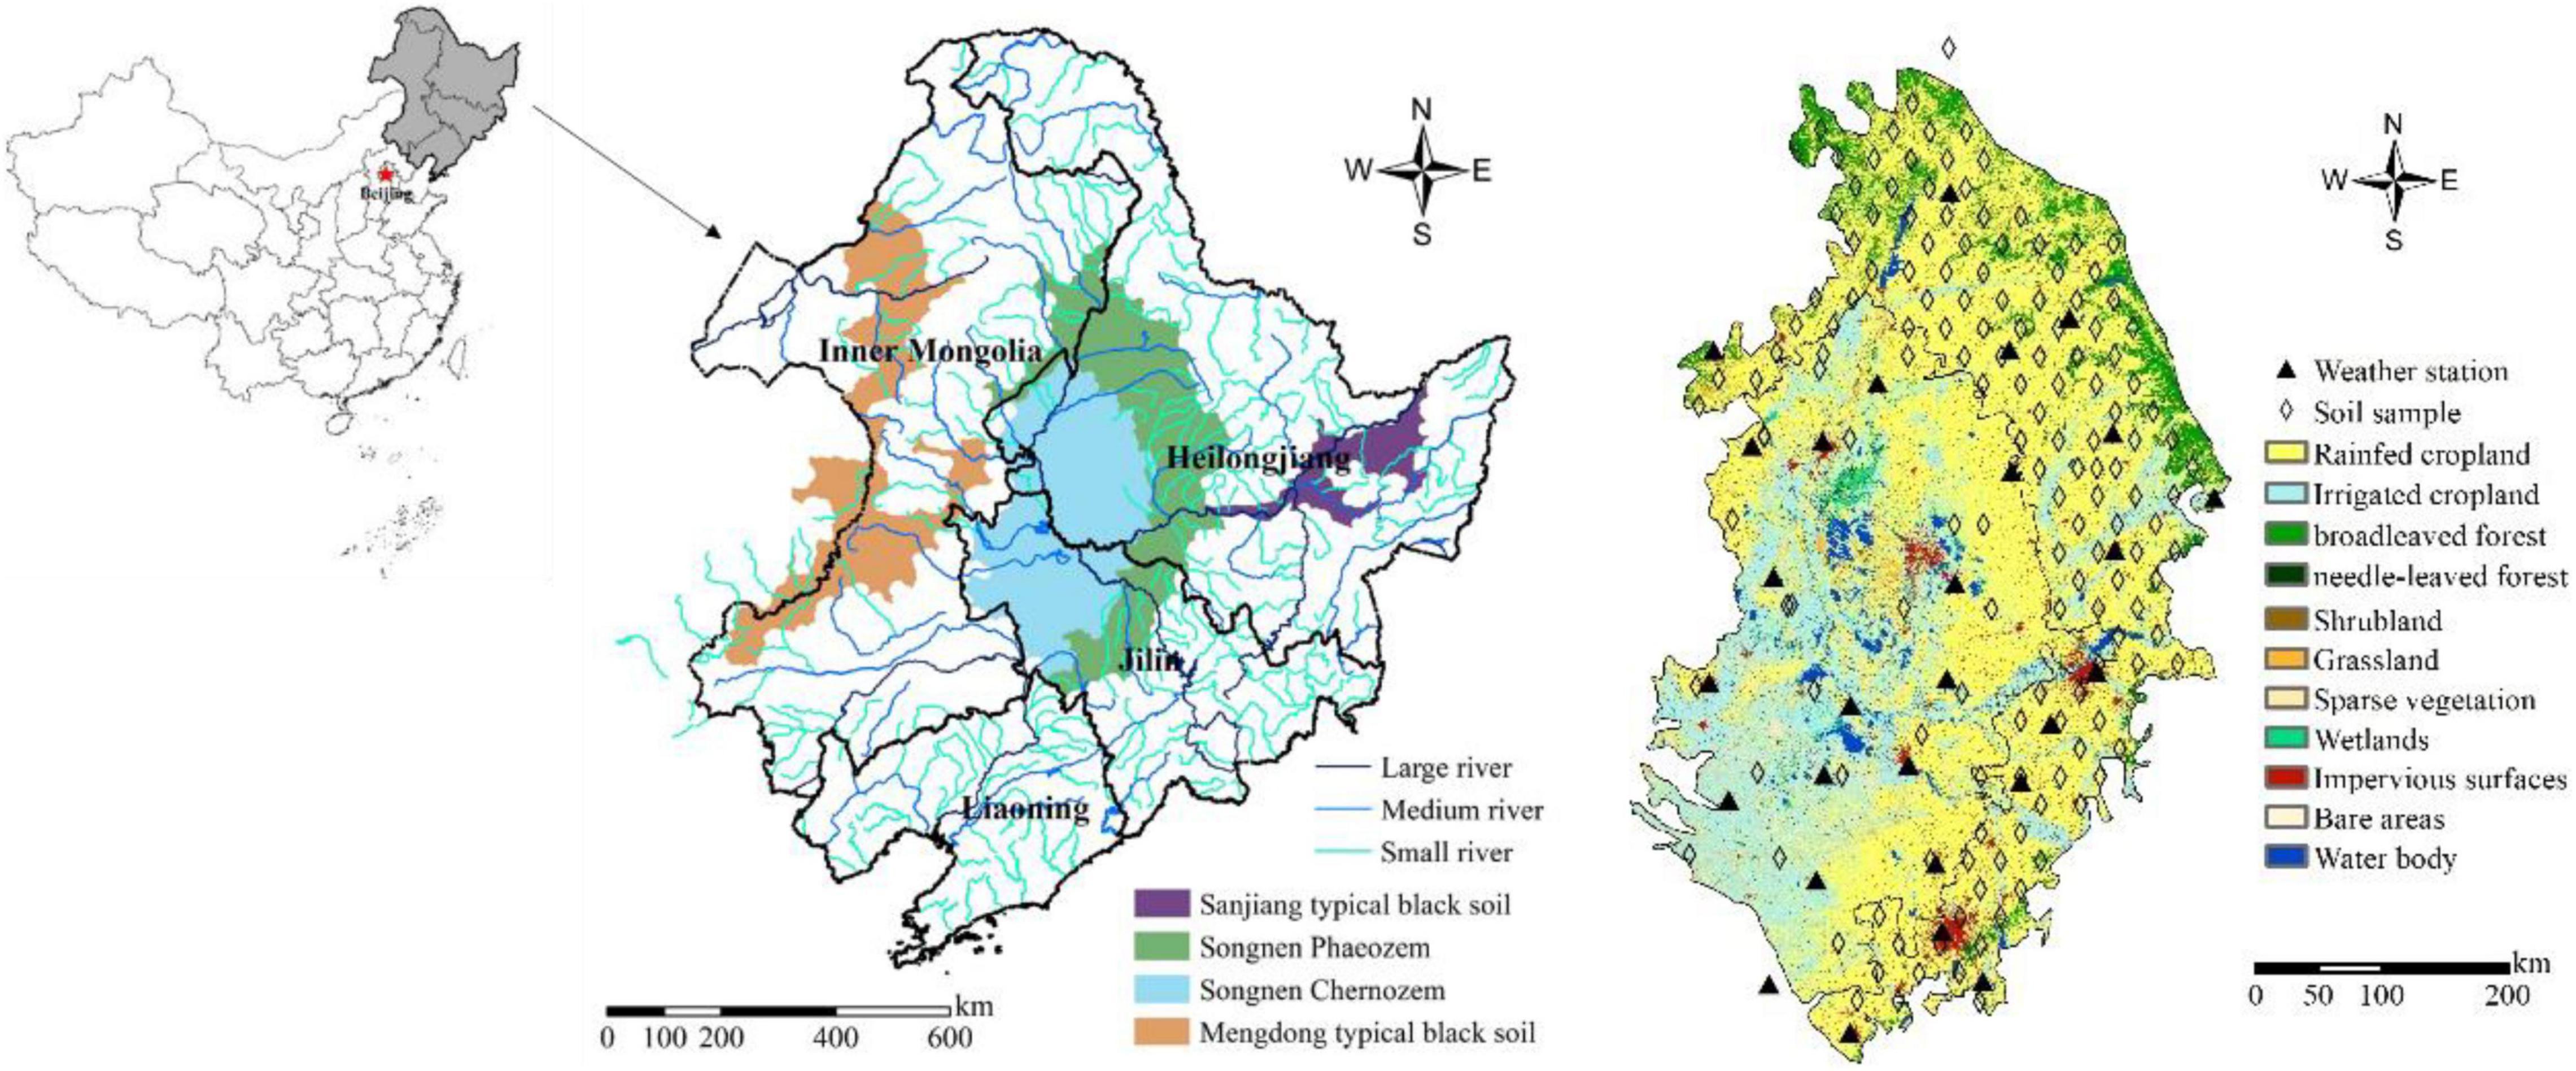
Figure 1. Distribution of phaeozem, chernozem and rivers in Northeast China (left); distribution of 30 m-resolution land cover type, meteorological stations and soil sampling points in Songnen Plain in 2020 (right).
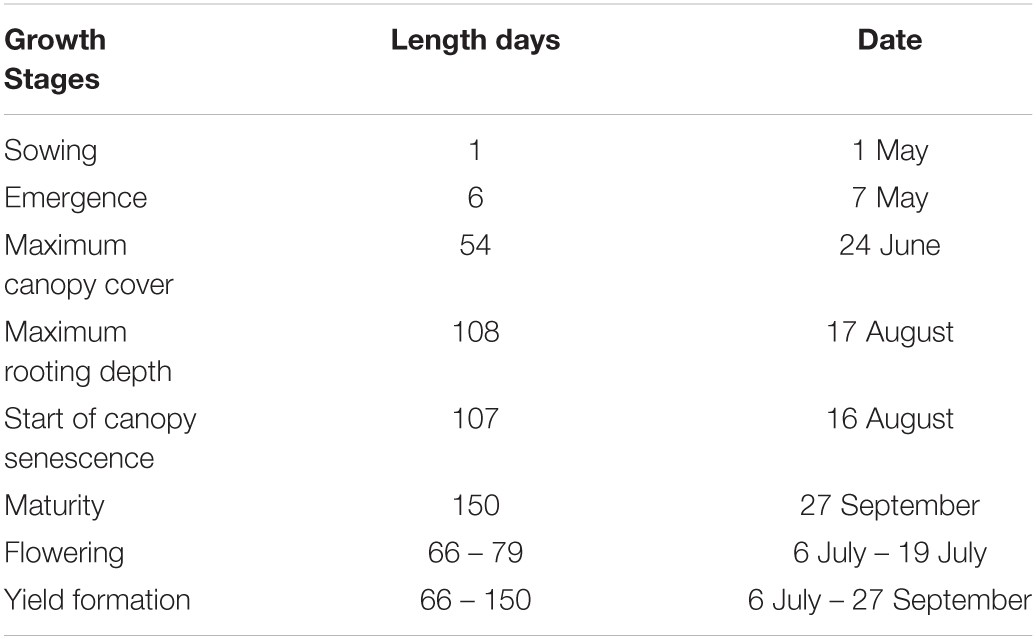
Table 2. Phenological information of maize in the black soil area of Northeast China.
Meteorological Data
This study collected meteorological data from 28 weather stations from 2000 to 2020, including daily rainfall (mm), minimum and maximum temperature (°C) and solar radiation (MJ m–2 day–1), as input to the AquaCrop meteorological module (see Appendix A for details). These data can be downloaded from National Meteorological Information Center1. Meanwhile, the reference evapotranspiration is calculated through the FAO ET0 calculator.
Soil Sampling
Soil properties have a major impact on crop yield chiefly because they affect the ability of soil to retain water and transfer water to crops (Bakker et al., 2007). AquaCrop model provides reference soil parameters for all kinds of soil texture, which reduces the difficulty of regional soil-property-information measurement. Therefore, a large number of measured soil texture data are used for establishing the corresponding soil module parameters of the AquaCrop model to ensure that the model considers the impact of soil hydraulic properties of different soil texture structures on crop growth. This study matched the nearest meteorological station data for 155 soil survey points by spatial location, and conducts regional AquaCrop simulations on these 155 units. The soil texture of 155 survey points in the Songnen black soil area is classified into 27 categories and can be further divided into 56 subcategories according to the thickness of each layer (Figure 2). The AquaCrop model assigns 56 groups of parameters in soil module according to these soil testure subcategories. The classification results show the high soil heterogeneity in Songnen Plain, although there are only four different textures. Soil classification improves the efficiency of regional model operation.
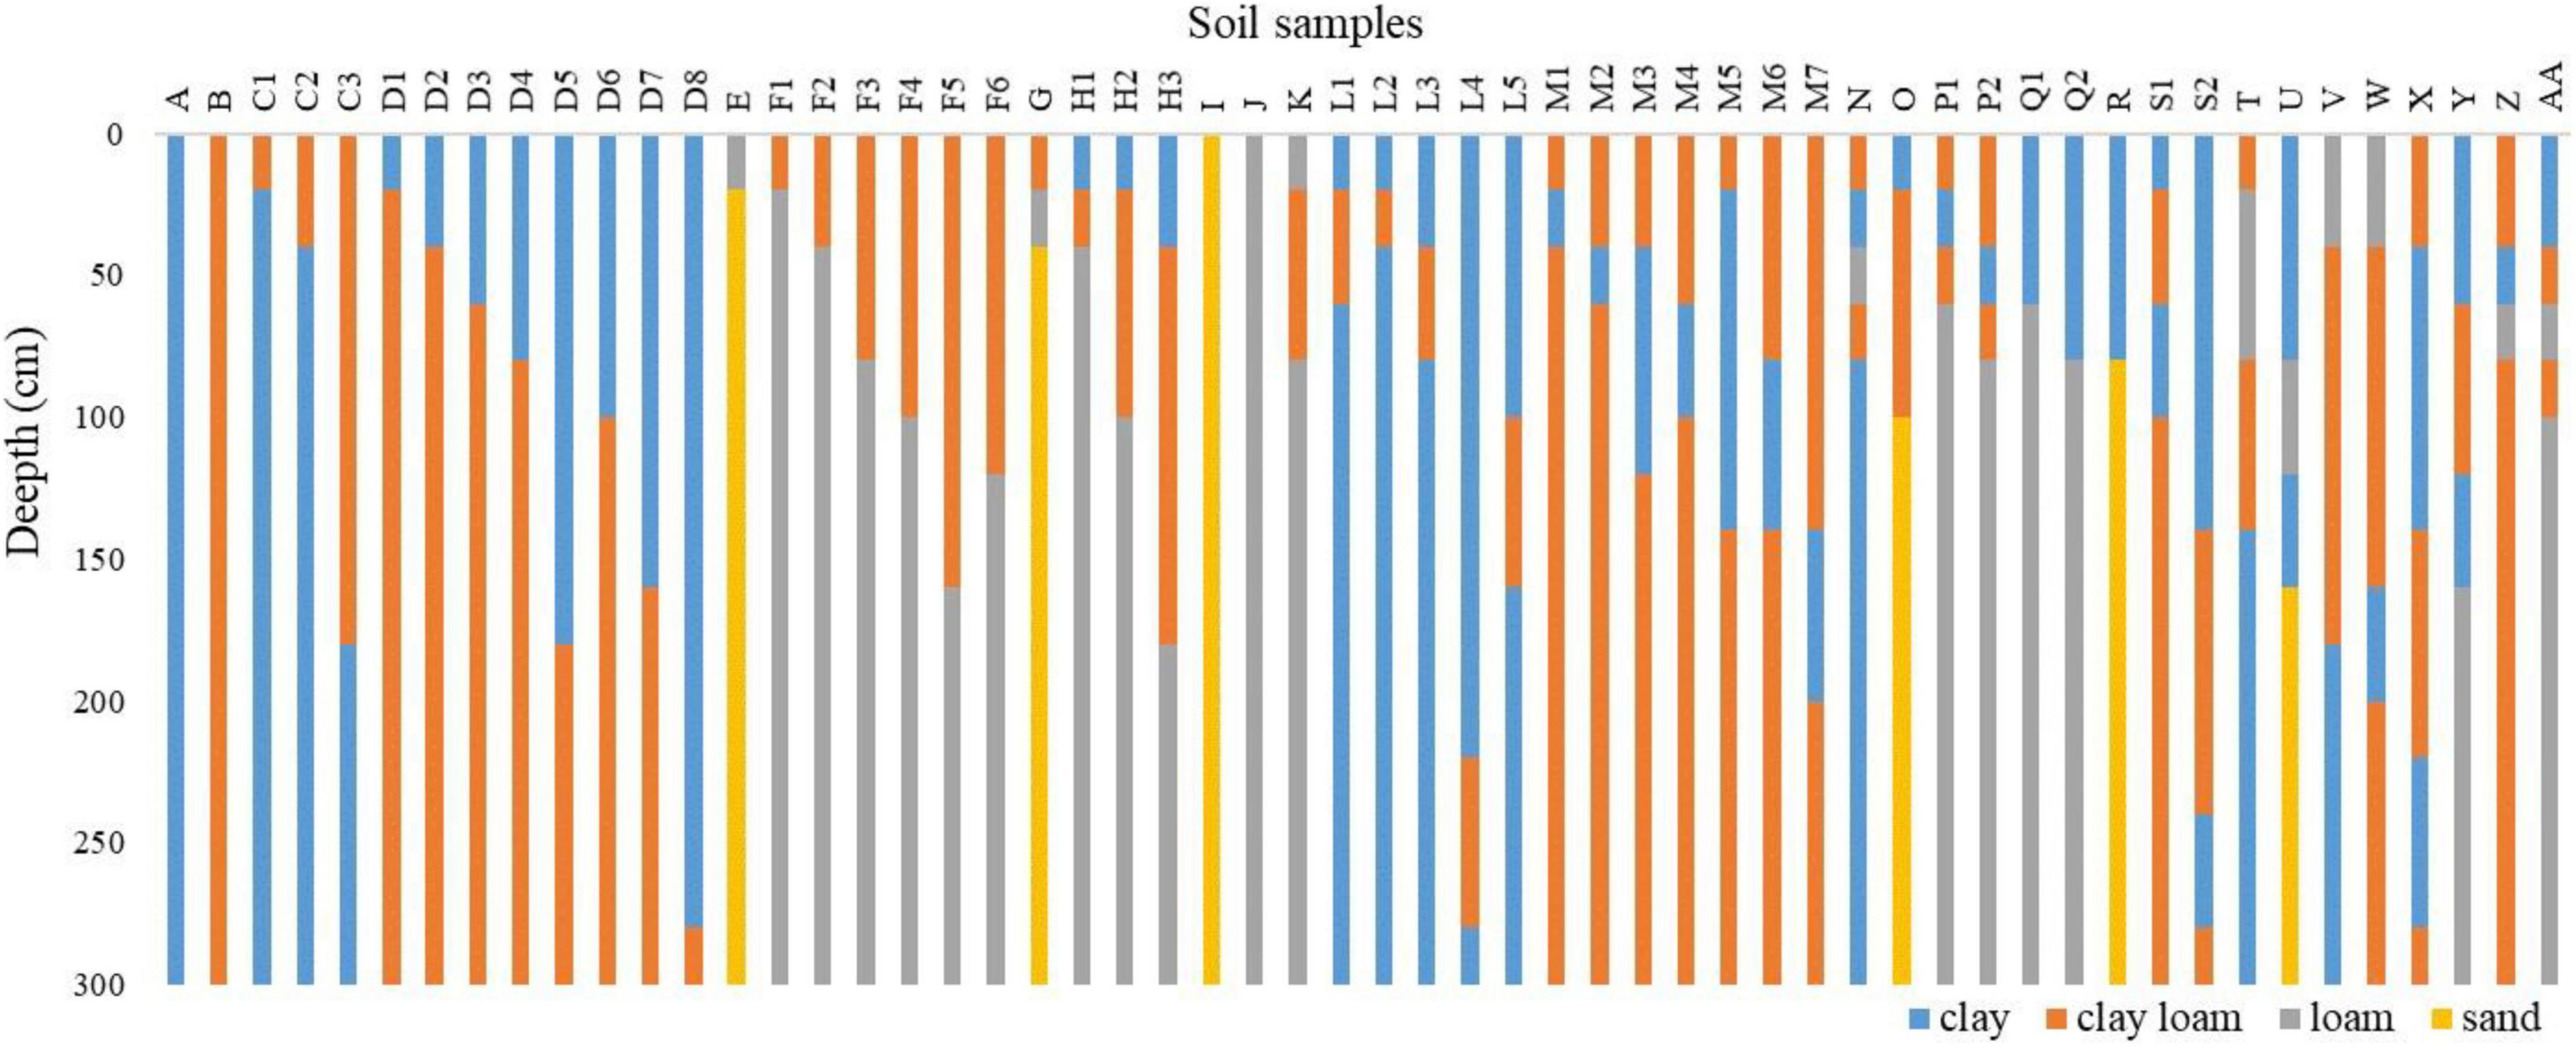
Figure 2. Detailed types of soil profile in Songnen Plain (soil depth: 0-300 cm).
Satellite-Based Data
GLASS fractional vegetation cover (FVC) products from 2000 to 2020 were collected for regional data assimilation. Multisource high-resolution optical remote sensing images in 2018 and 2020 were collected for relative accuracy verification of the GLASS FVC product and assimilation tests.
GLASS FVC is a global fractional vegetation cover product, with 500 meters spatial resolution and 8 days temporal resolution, published by the National Earth System Science Data Center2. The inversion algorithm is based on multisource remote sensing data and measured site data (Jia et al., 2015). This study adopted the GLASS FVC data with tile number h26v04 from 2000 to 2020.
Nenjiang is located at 49°10′ N, 125°13′ E, altitude of 242.2 meters, and Lishu is located at 43°10′ N, 124°19′ E, altitude of 165.7 meters. These two counties are the northernmost and southernmost parts of the Songnen black soil area, respectively. This study collected multiscene domestic GaoFen-1 satellite remote sensing images of Nenjiang County, Heilongjiang Province, in 2018 and Lishu County, Jilin Province, in 2020 with 8-meter spatial resolution and 4-day temporal resolution. Several domestic ZiYuan-3 satellite images and Landsat-8 images were collected as supplements with 6-meter spatial resolution and 5-day temporal resolution and 30-meter spatial resolution and 16-day temporal resolution (Table 3). The absolute calibration coefficient and solar irradiance are from the official website of the China Resources Satellite Application Center3.
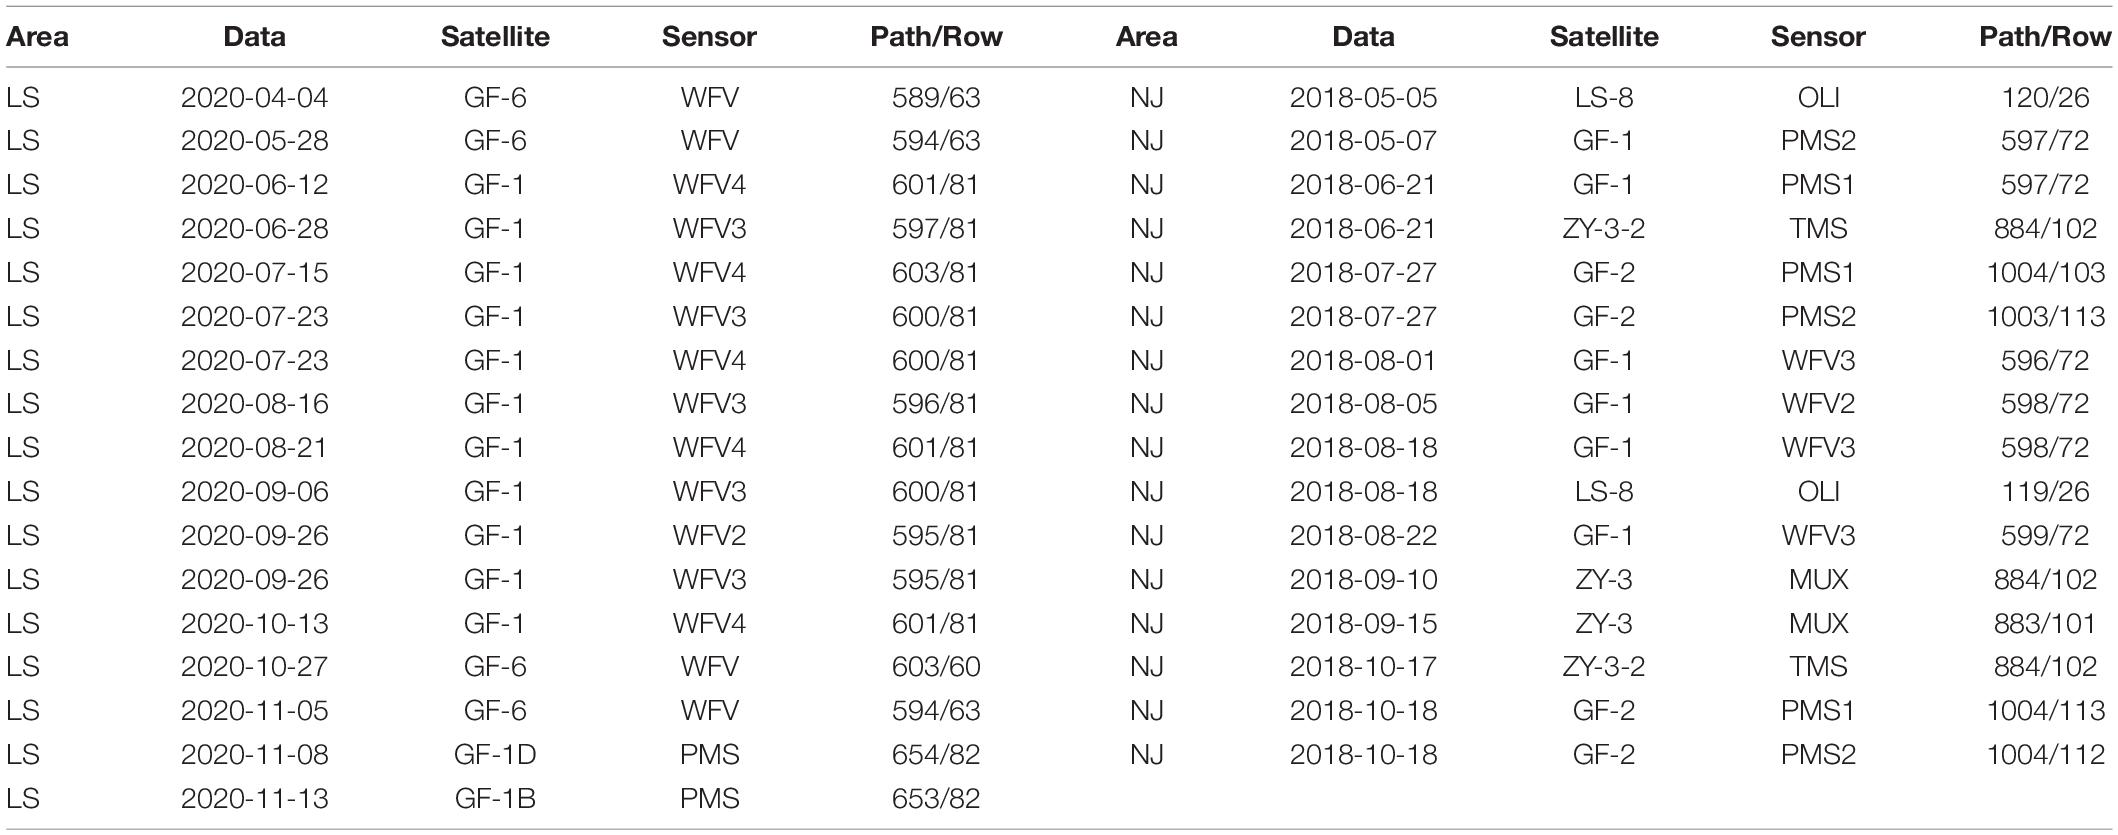
Table 3. List of satellite imagery collected in Nenjiang County and Lishu County.
After geometric correction and radiometric correction, the fractional vegetation cover (FVC) can be retrieved according to the pixel dichotomy:
where VI is the NDVI of the pixel, Vs is the NDVI of the pure soil pixel, and Vv is the NDVI of the pure vegetation pixel.
The remote sensing FVC curves obtained from different sensors and inversion methods are roughly the same, reflecting the reliability of the GLASS FVC product in Northeast China. Figure 3 shows the time sequence FVC of the two main maize-producing areas on the Songnen Plain. In the early stage of maize growth, the FVC was almost less than 0.15. From approximately 40 to 80 days, the FVC in most areas increased rapidly from 0.20 to 0.9. After approximately 120 days, FVC reached a high level, and maize started to mature. Some leaves began to curl, and those at the lower part of the canopy began to turn yellow. FVC showed a decreasing trend. By approximately 140 days, the FVC decreased to 0.6, and maize was ready to mature. By approximately 150 days, maize was harvested, and the FVC was below 0.2. The surface of black land was mainly cut straw.
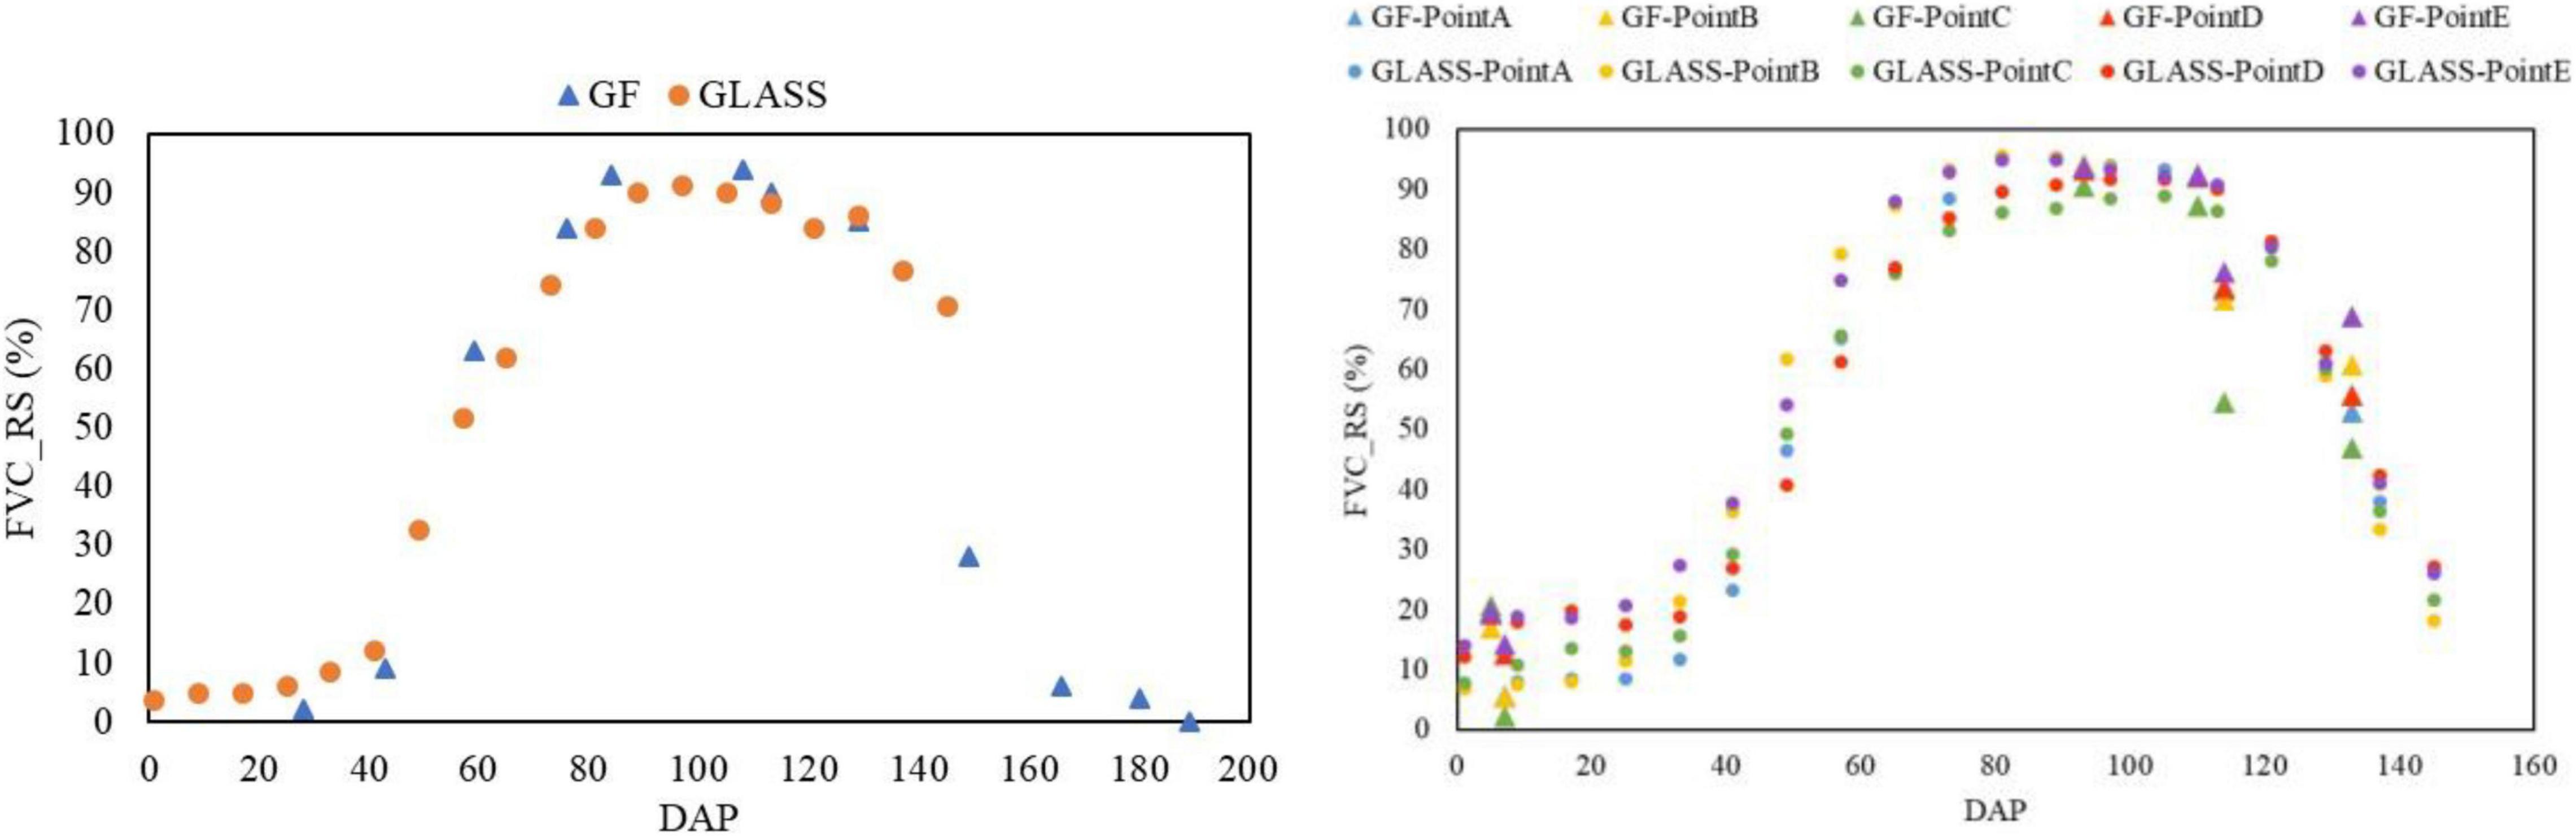
Figure 3. Verifying GLASS FVC with GF satellite image inversion. Lishu County in 2020 (left); Nenjiang County in 2018 (right).
Statistical Yield
National statistical yearbooks are formed by governments’ sampling surveys and have acknowledged the authenticity. This study collected province yearbooks from 2000 to 2020 for Jilin, Heilongjiang, Liaoning and Inner Mongolia, which are under the coverage of the Songnen Plain. The established yield dataset of Northeast China included 3666 statistical maize yields per unit area of 258 districts and counties, which was used to establish the regression relationship between FVC and yield based on spatial location. The linear fitting results of yearly yield are shown in Figure 4, which need “detrending” to eliminate the impact of these unquantifiable factors on the simulation accuracy (Wang X. et al., 2020), considering the progress of corn varieties and planting technology over the past 21 years while we applied field management measures in 2018.
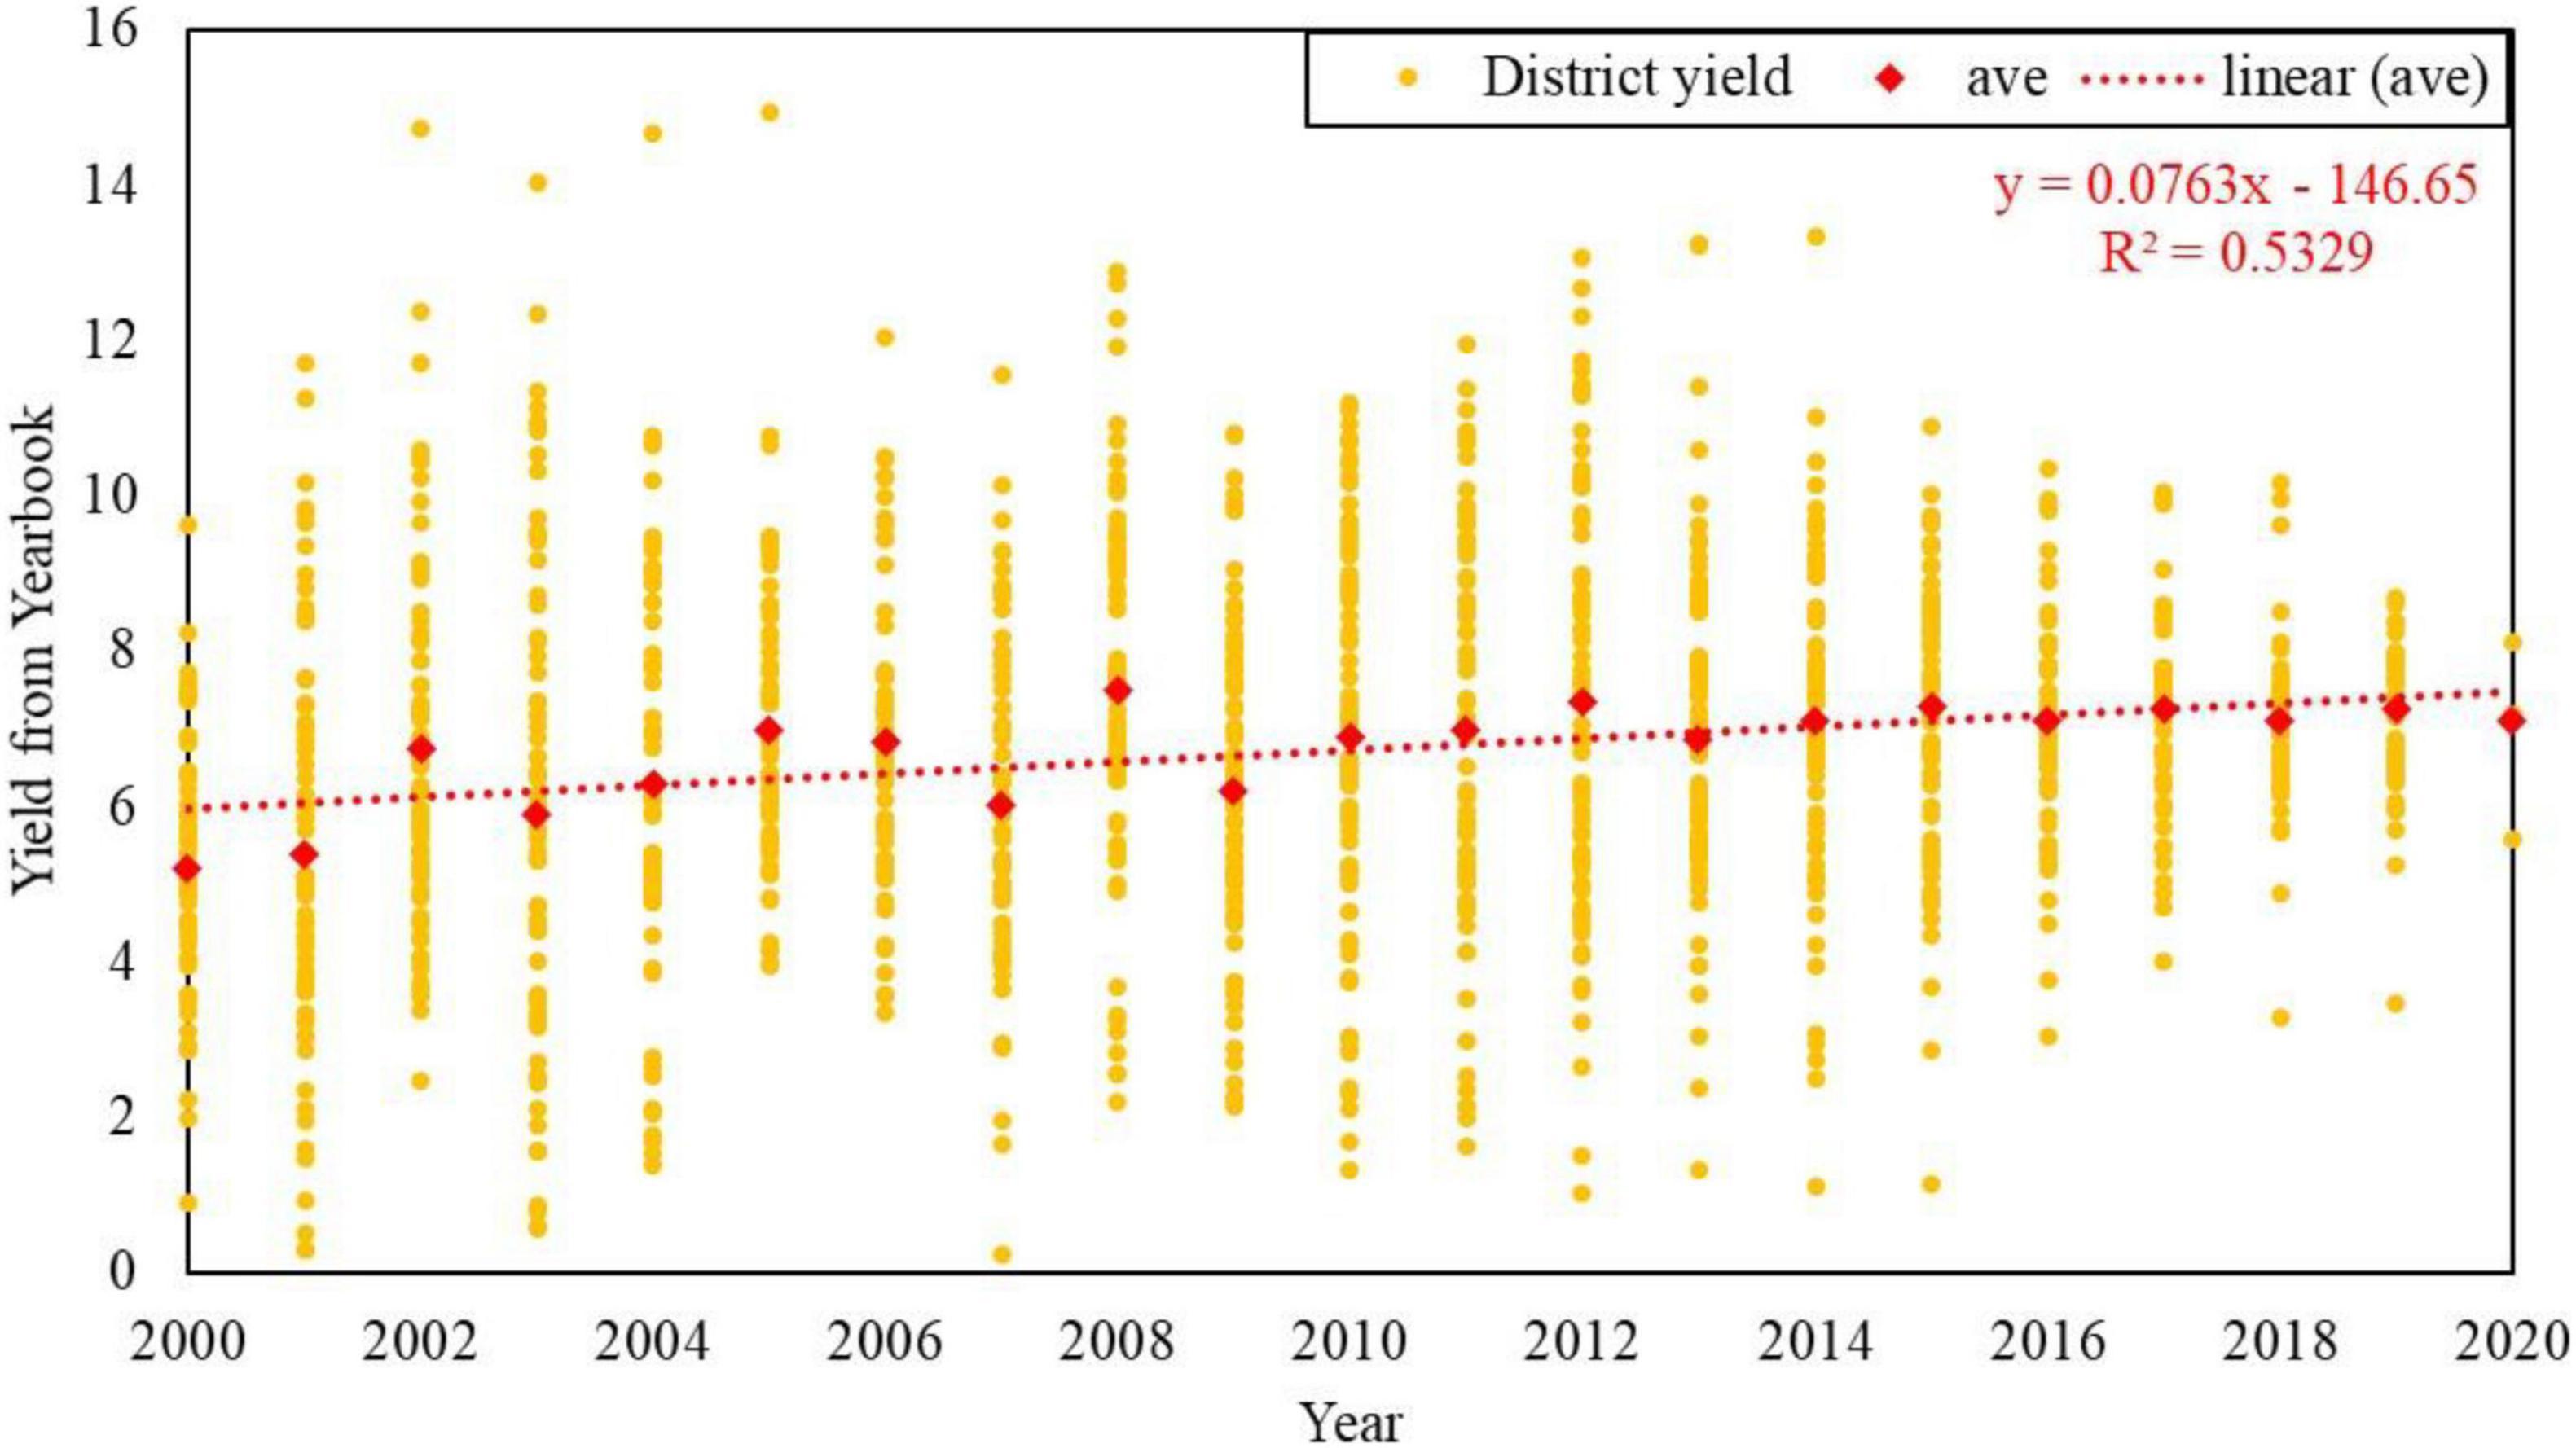
Figure 4. Maize yield (t/ha) dataset from 2000 to 2020’s Statistical Yearbook.
Models and Methods
The methodology adopted in this study mainly involved three parts: regional application of the AquaCrop model, FVC data assimilation by model outputs and remote sensing products, and yield estimation relying on the RF regression model (Figure 5).
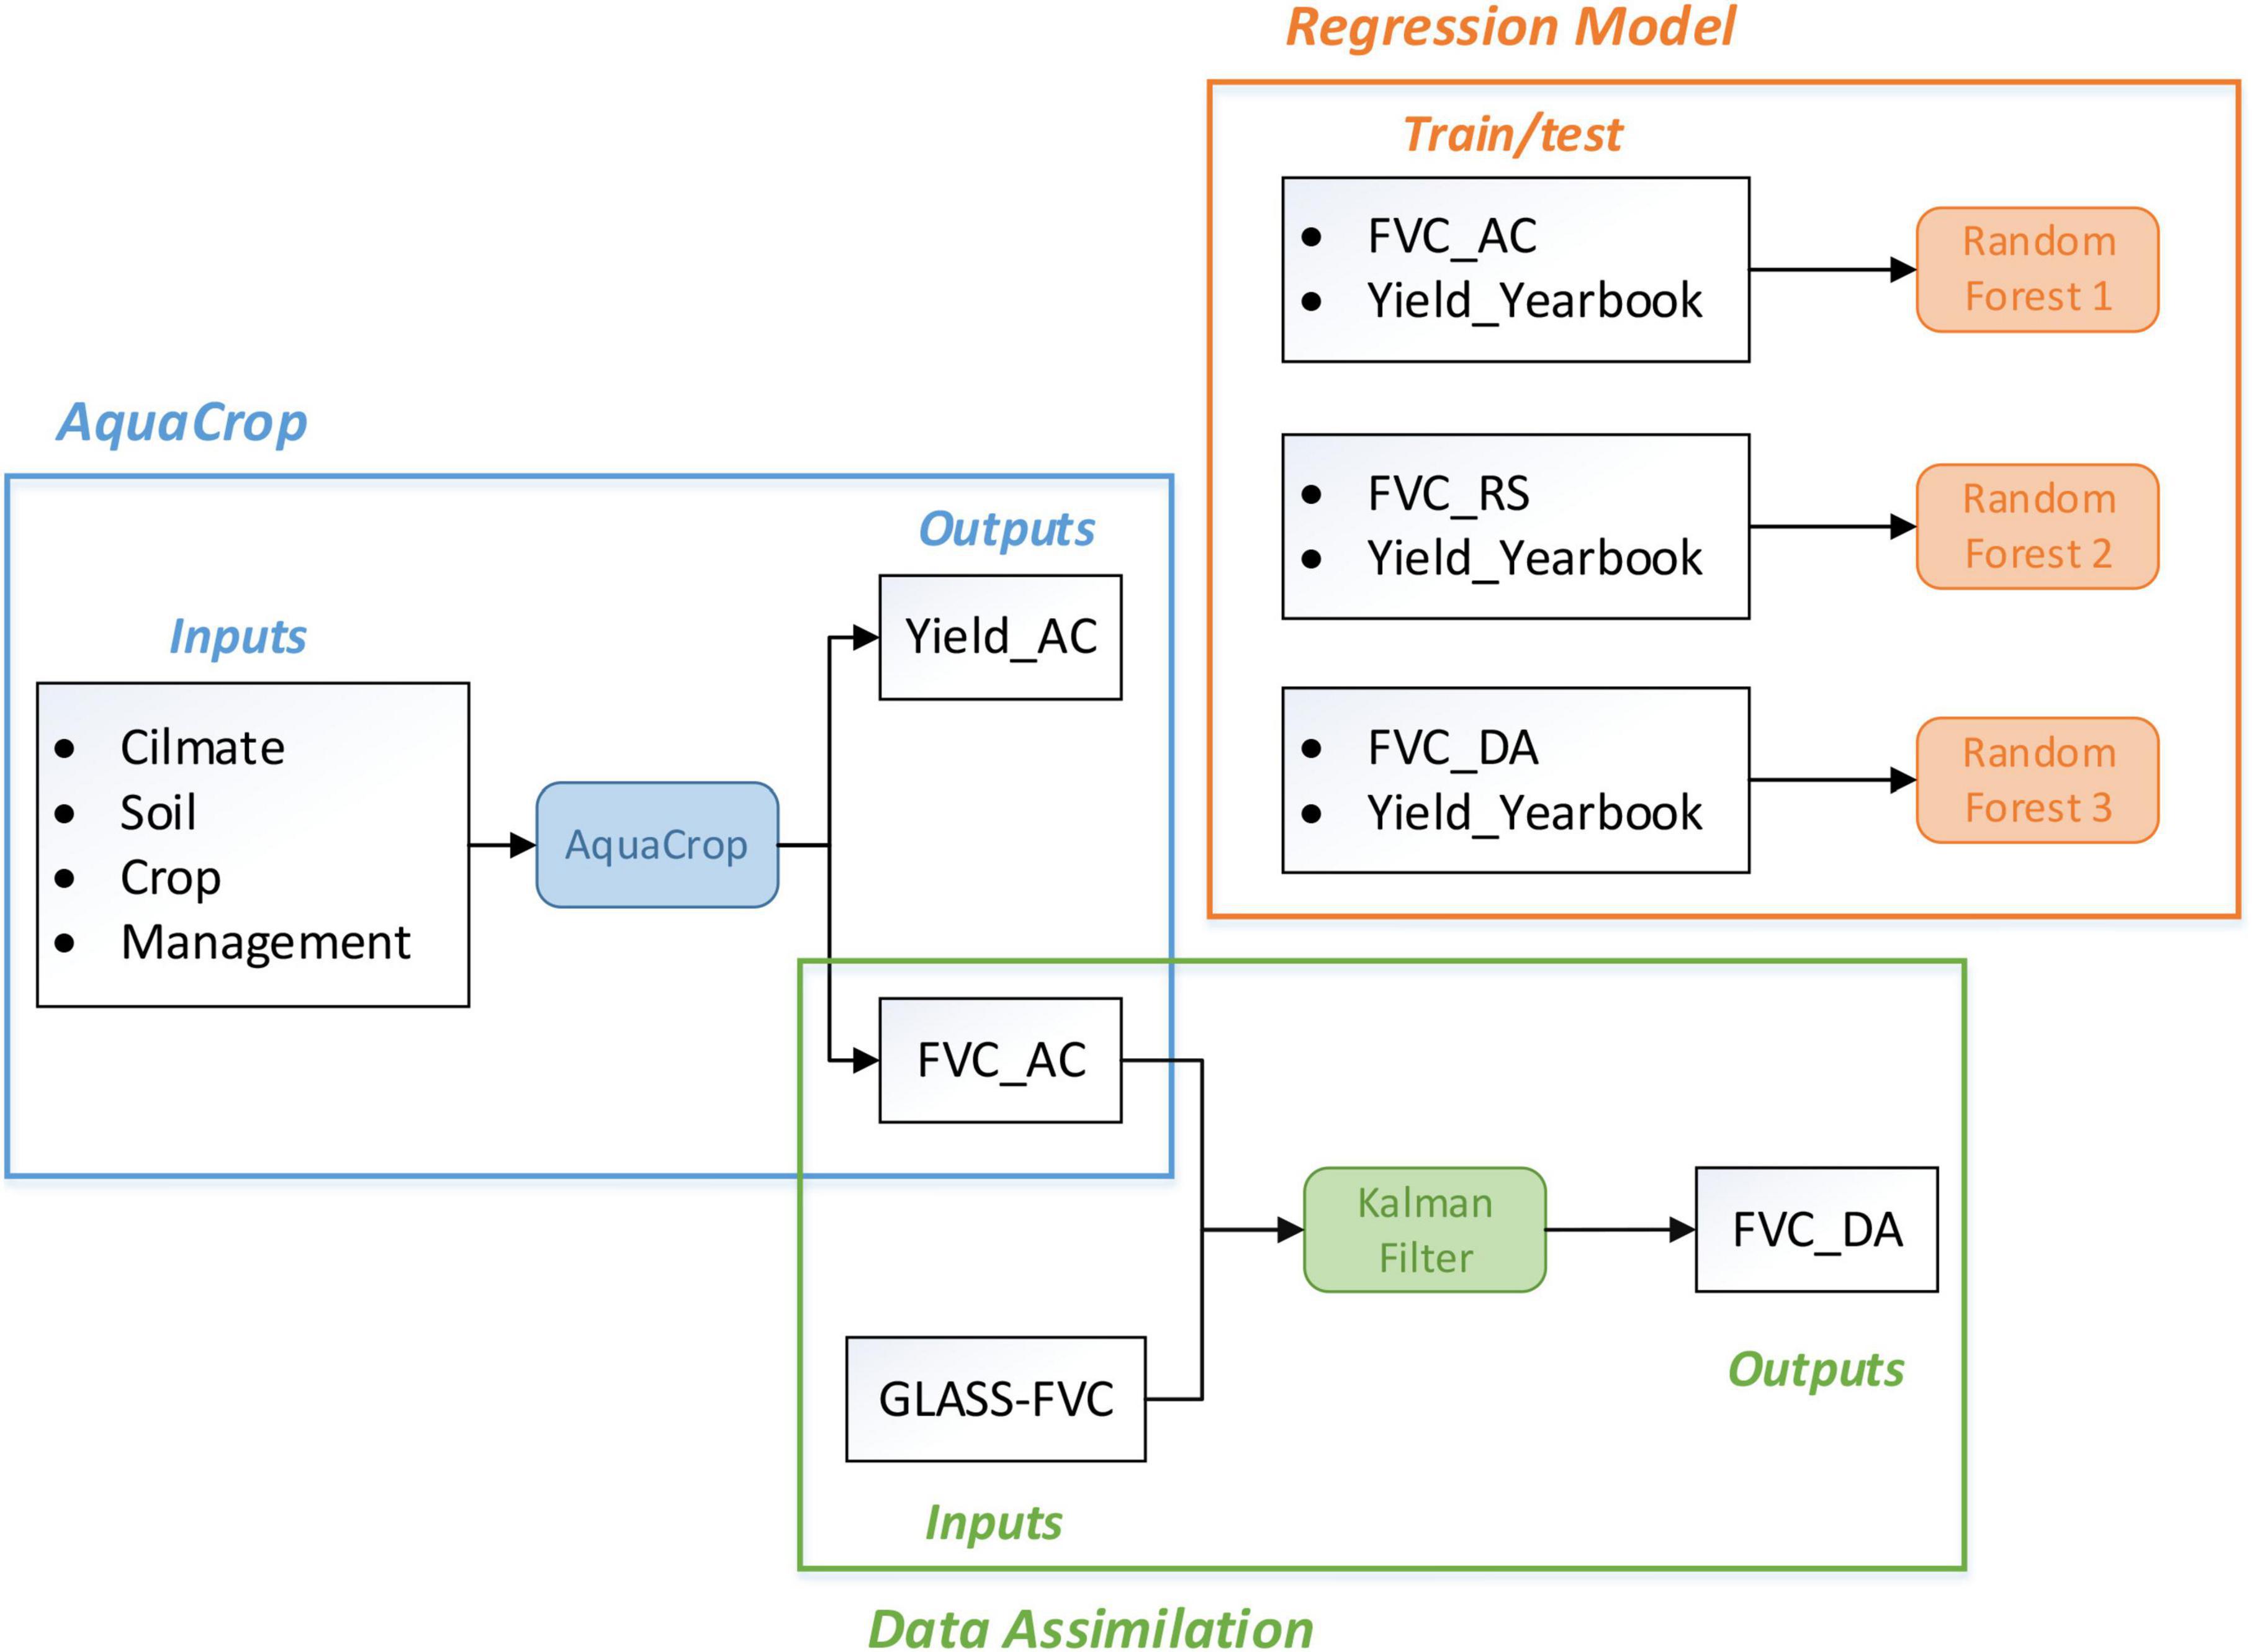
Figure 5. Flowchart of the methodology applied.
AquaCrop Model
The AquaCrop model simulates the transpiration process of crops by inputting climate, crop, soil, and field management data and finally outputs the daily prediction results of CC, rooting depth, biomass and yield (Raes et al., 2009; Steduto et al., 2009). A significant difference from other crop models is that AquaCrop uses CC instead of LAI as the basis for calculating transpiration, separates soil evaporation from leaf transpiration and avoids the confusion effect of unproductive water consumption (Equations 2-3). This variable obviously simplifies the simulation and integrates the leaf expansion growth, angle and distribution into an overall growth function. Another advantage is that CC can be easily obtained from remote sensing sources to check analog CC or as input of AquaCrop. Equation 4 and Equation 5 are the two stages of CC growth and the stage of CC decline, respectively.
where Tr is the leaf transpiration. KcTr is the crop transpiration coefficient. ET0 is the relative evapotranspiration without stress. CC* is the adjusted canopy cover. KcTr,x is the coefficient for maximum crop transpiration, which represents an integration of the effects of the characteristics that distinguish the crop with a complete canopy from reference grass.
CC is canopy coverage (%). t is the time accumulated from emergence. CC0 is the initial canopy coverage (%), generally taking the average seedling coverage at 90% emergence. CCx is the maximum value of canopy coverage (%). CGC is the canopy coverage growth rate, which indicates the increase in canopy coverage per unit growth degree day (% GDD–1). CDC is the canopy coverage decrease rate, which represents the reduction in daily canopy coverage per unit growth degree day (% GDD–1).
The accumulated biomass is calculated by daily transpiration (Tri), daily atmospheric evapotranspiration demand (ET0,i) and normalized water productivity (WP*), and crop yield is calculated by the biomass and harvest index, as shown in Equations 6-7.
A soil database can be established according to the layered structure of soil texture in the AquaCrop model, which covers 13 soil types (Table 4). The 155 measured soil texture data in Songnen black soil region can be flexibly set to found 57 groups of the corresponding parameters based on this table.
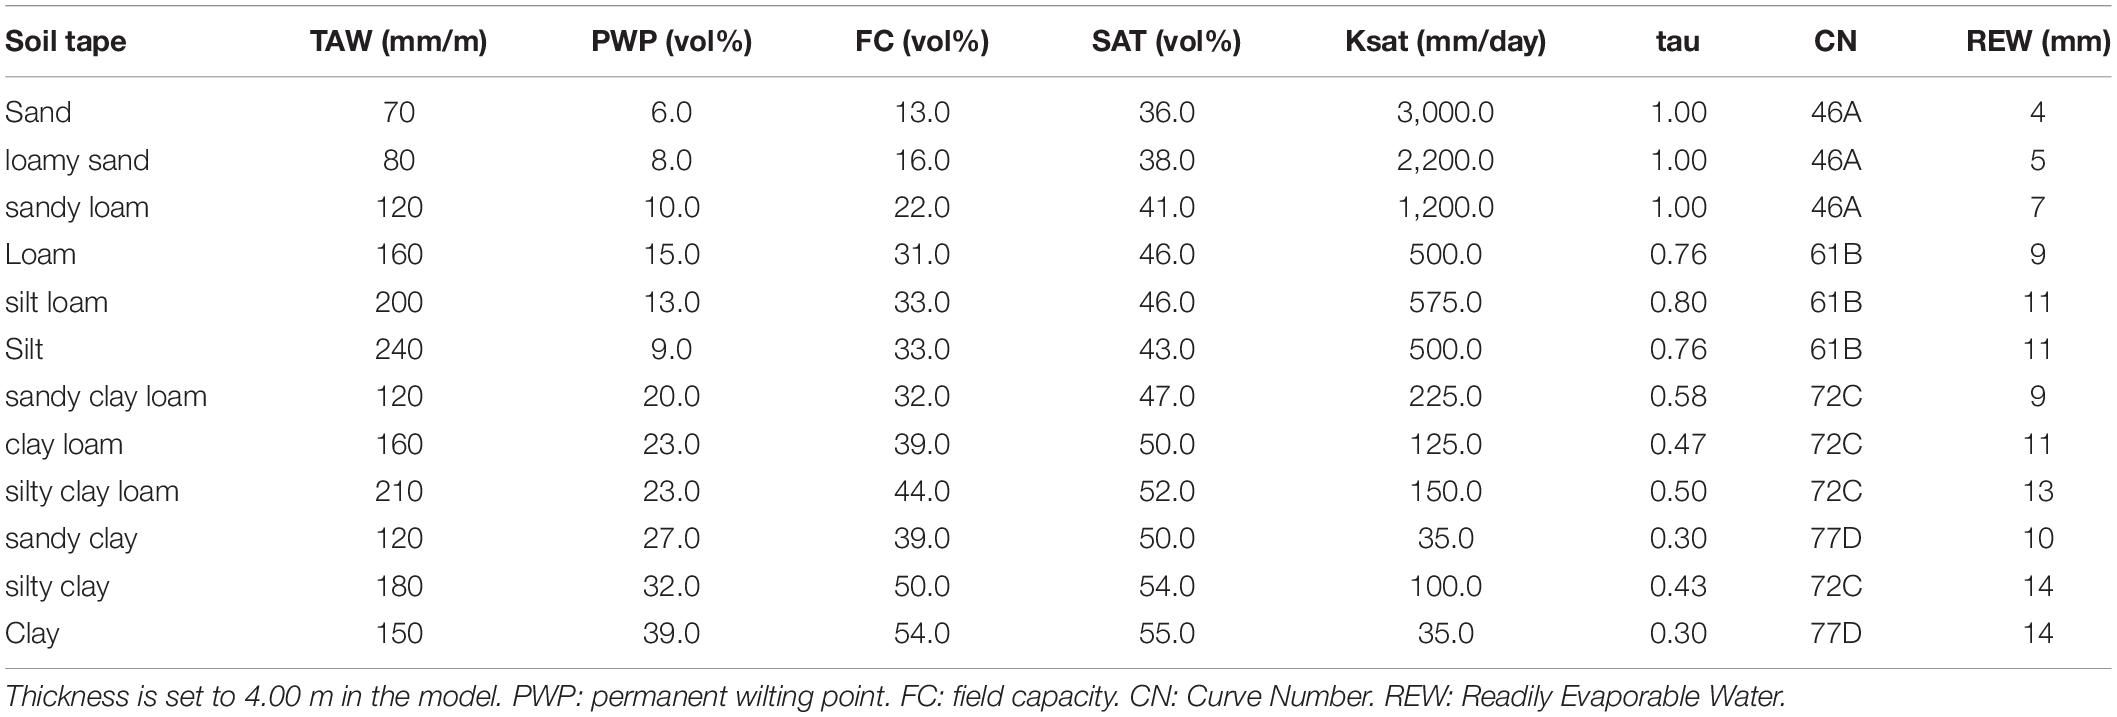
Table 4. AquaCrop model soil database (Van Gaelen and Raes, 2016).
After the sensitivity analyzed and parameters calibrated in the Hebei basin of Nenjiang County based on field experiments from 2011-2018, AquaCrop model has a good prediction effect on a point scale in Northeast China (Xie et al., 2003; Cui et al., 2021). Present research carry on using the same set of cultivar parameters from the previous study (see Appendix B for details).
Sequential Filter Assimilation
Referring to the application summary of remote sensing and crop model assimilation, modern data assimilation methods are mainly divided into the following two categories: parameter optimization methods based on cost functions and sequential filtering methods based on estimation theory (Huang et al., 2018). The former minimizes the difference between the remote sensing observation value and the model simulation value using iterations to achieve the optimal estimation, while the latter constantly relies on external observations to adjust the model simulation trajectory in real time to achieve the optimal prediction. For the yield estimation proposition, filter assimilation is more widely used because of its real-time performance. The most representative method is the EnKF, which is based on linear and Gaussian assumptions. In the context that the AquaCrop model simulated a daily FVC curve in the growing season and the GLASS FVC also provides multitemporal FVC values, it is possible to make FVC as the assimilation variable attempt to obtain a higher accuracy estimation based on ensemble Kalman filter (EnKF) algorithm.
KF is an assimilation algorithm that uses the linear system state equation to estimate the optimal system state through the system input and output observation data. Since the observation data include the influence of noise and interference in the system, the optimal estimation can also be regarded as a filtering process. The AquaCrop simulated FVC_AC and remote sensing inversion calculated FVC_RS contribute to the following dynamic models, which are constructed to evolve FVC in time and used to provide short-range prediction of FVC:
where FVCt−1 is the FVC value of the previous time, FVCt represents the present FVC value, w_t is the model error. FVC_RSt represents the FVC data observated from GLASS FVC products at time t. FVC_ACt represents the FVC data simulated by the AquaCrop model at time t, which is from the daily dataset during the crop growth period. Ft is a linear state transition operator:
where is an uncertainty factor that is set to 0.0001 to prevent the denominator from being 0. The observation operator is set to 1 due to the same parameter of simulation and observation.
EnKF integrates the model forward with the new observation data to obtain a set of analysis field sets, which are updated by the KF equation; the updated set, as the background field of the next moment, continues to make forward short-term forecasts and is assimilated with the new observation data of the next moment. EnKF overcomes the weakness that KF is limited to dealing with linear problems and solves the problem caused by the KF method requiring too much computing resources when calculating the covariance of prediction error. For KF assimilation, the observation operator H in EnKF is set to 1, but the process model error is set to 5% of the predicted value, the observation error is set to 5%, and the number of set elements is set to 20, 100, and 200.
Random Forest
In order to extend the improvement of FVC accuracy to yield estimation accuracy, this section build a regression model of time series FVC and maize yield in a data-driven approach. Machine learning is currently the most effective and rapidly developing data research method, which enable algorithmic models to learn knowledge from data autonomously and then have the ability of judge and predict in new problems. Random forest (RF) is a typical classifier that uses multiple decision trees to train and predict from input samples. It determines the category of test samples by voting and then takes the average output of each decision tree as the final result.
Referring to the Scikit-learn python machine learning library, this study uses the daily FVC value to estimate yield optimally through the RF model. In order to compare the impact on yield estimation accuracy before and after FVC assimilation, three random forest models were established to describe the regression relationship between the FVC curve and yield. The difference is in the input FVC, including the FVC simulated by AquaCrop, the FVC provided by the GLASS remote sensing product and the FVC obtained by data assimilation. Finally, the model with the highest accuracy is selected for maize yield prediction, so as to achieve the research goal of optimal yield estimation.
The total dataset of RF1-3 is composed of 21 growing seasons from 2000 to 2020, three types of FVC data of 155 simulation units and the corresponding statistical yield data. Each RF model should have 3255 records, each record have a set of FVC and a statistical yield. The actual number of records is finally determined by the amount of data with well assimilation effect. The scale of statistical yearbook data is suitable, which is of 258 districts and counties can be matched with the three series of FVC data on 155 simulation units. Another consideration of choosing statistical yield instead of AquaCrop simulated yield is to avoid the accuracy interference caused by the same model output as FVC_AC, and more objectively reflect the real harvest. The samples were randomly divided into two parts with a ratio of 8:2 the large part used for training and the other part used for accuracy evaluation (Table 5). The accuracy verification is indicated by MAE (mean absolute error) and R2, using Equations 11-12.
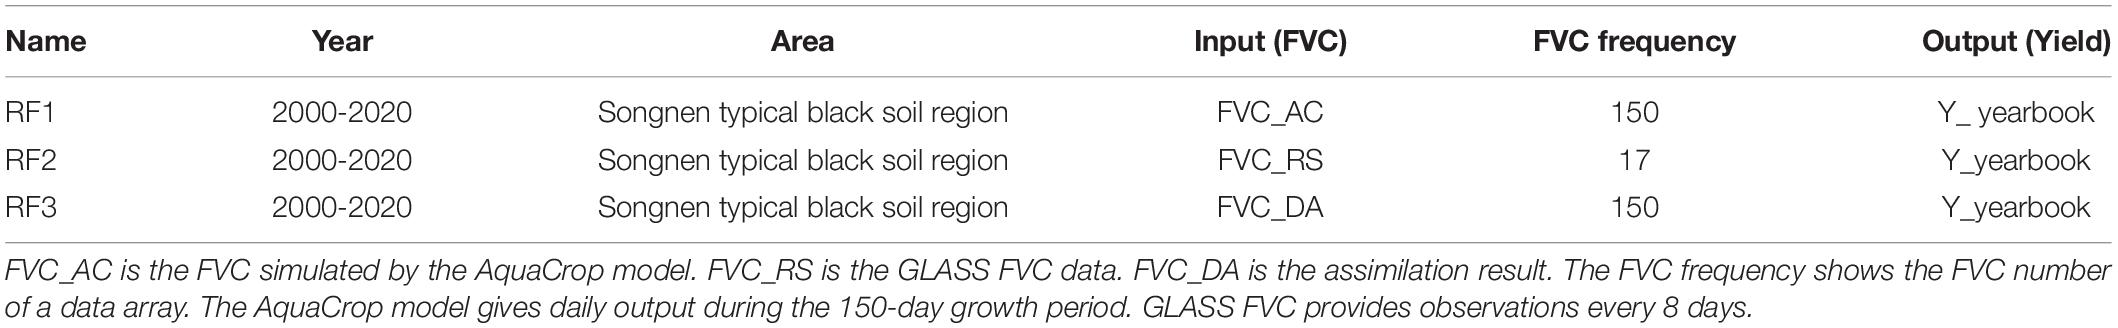
Table 5. Data composition of the random forest model.
Results and Analysis
Regional Continuous Simulation of the AquaCrop Model
Running the AquaCrop model of multithread scheduling for the 155 soil representative cells in Songnen black soil region from 2000 to 2020, we explored the spatial pattern of predicted yield by mapping the results after two empirical Bayesian Kriging interpolation to Figure 6.
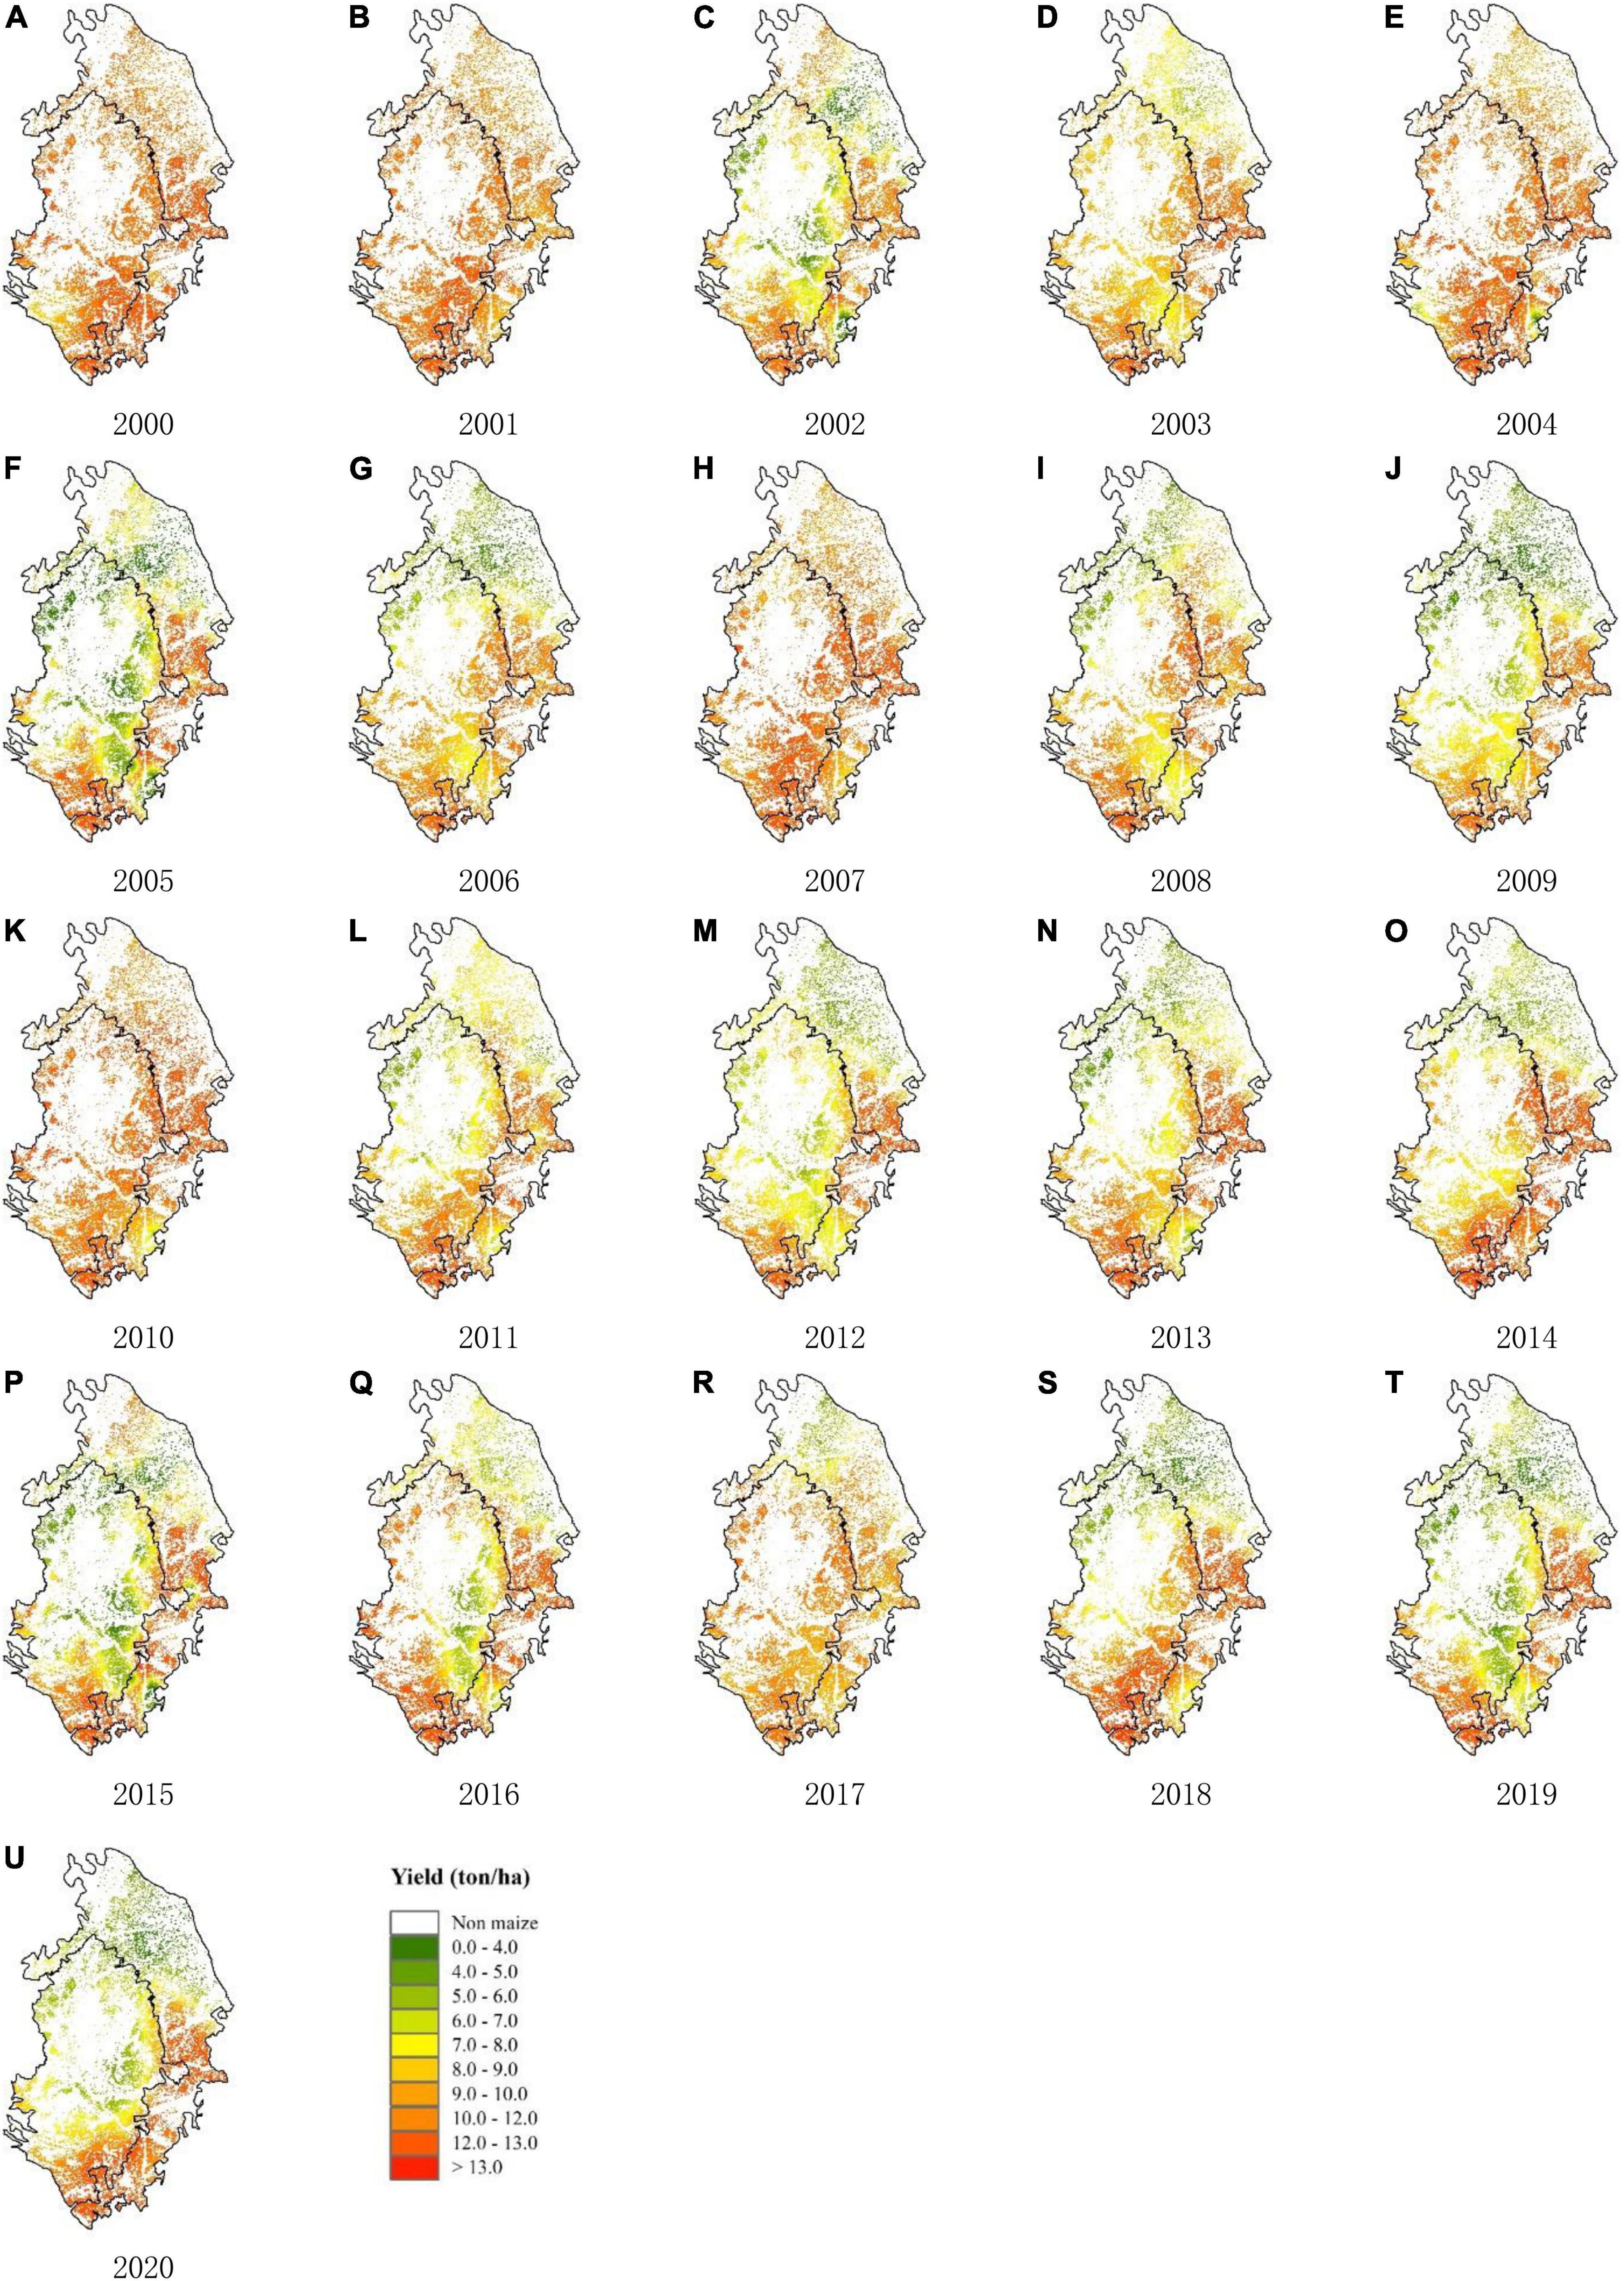
Figure 6. Maize yield map (ton/ha) for Songnen Plain simulated by AquaCrop model from 2000–2020.
In general, the spatial distribution and the temporal differences of predicted yield are reasonable reproduced, which is consistent with that of statistical yield (shown in Figure 7). Among them, the output of the southeast is the highest, followed by the southwest, and the northeast is the lowest. This spatial pattern is mainly caused by temperature and soil texture. During the growing season, the northern part of the study area is approximately 5°C lower than the southern part as a whole, as shown in Appendix A. A lower temperature makes it more difficult for crops to reach the effective accumulated temperature required for maturity, resulting in a lower final yield. Regarding the soil texture difference, although the fertility of chernozem is higher than that of phaeozem, it requires supplementary irrigation to effectively improve growth due to its relatively poor water storage capacity. For Northeast China, which relies on precipitation to provide water supply, phaeozem is more suitable for cultivated land than chernozem.

Figure 7. Comparison of random AquaCrop simulated yield and the corresponding statistical yield.
In terms of time series, the inter-annual differences were mainly caused by the differences of hydrothermal conditions in each growing season, especially the water factor. The output showed a stable trend, with 2000, 2001, 2004, 2007, 2010, 2017 being the good harvest years for the entire region, while other years clearly make out the spatial difference. Abnormal precipitation events during crop growth period, especially in the process of yield formation after flowering, are easy to cause low crop yields. Mild and continuous natural precipitation provides optimal water conditions for crop growth and development. The neglected soil erosion and the administration policies also affect the estimation accuracy.
Field Scale Assimilation of Fractional Vegetation Cover
This study implements a multithreaded univariate EnKF assimilation algorithm based on MATLAB language, which can realize the optimal estimation combining the daily FVC simulated by the AquaCrop model and the multitemporal remote sensing FVC in the corresponding growing season. The results show that EnKF assimilation can indeed integrate remote sensing data into simulation results, achieve higher spatiotemporal resolution and provide FVC estimation with good accuracy. All the assimilation results are defined into 4 types (Figure 8). Including: a) Approximately 80% of FVC_Optimal showed excellent assimilation results due to the similar shape of FVC_AC and FVC_RS. b) Approximately 1% of FVC_Optimal showed poor performance owing to the abnormal maize canopy growth reflected by FVC_AC, which differed greatly from the remote sensing observations at these points. c) A few FVC_RS fails to maintain coherence and showed the FVC inversion results of some phases may be distorted, which lead to doubts about the reliability of FVC_Optimal after correction according to the observed value. d) Approximately 10% of FVC_RS is generally lower than the corresponding FVC_AC, indicating an obvious failure to achieve the desired high level in canopy growth. It can be considered that maize planting failed at these locations.
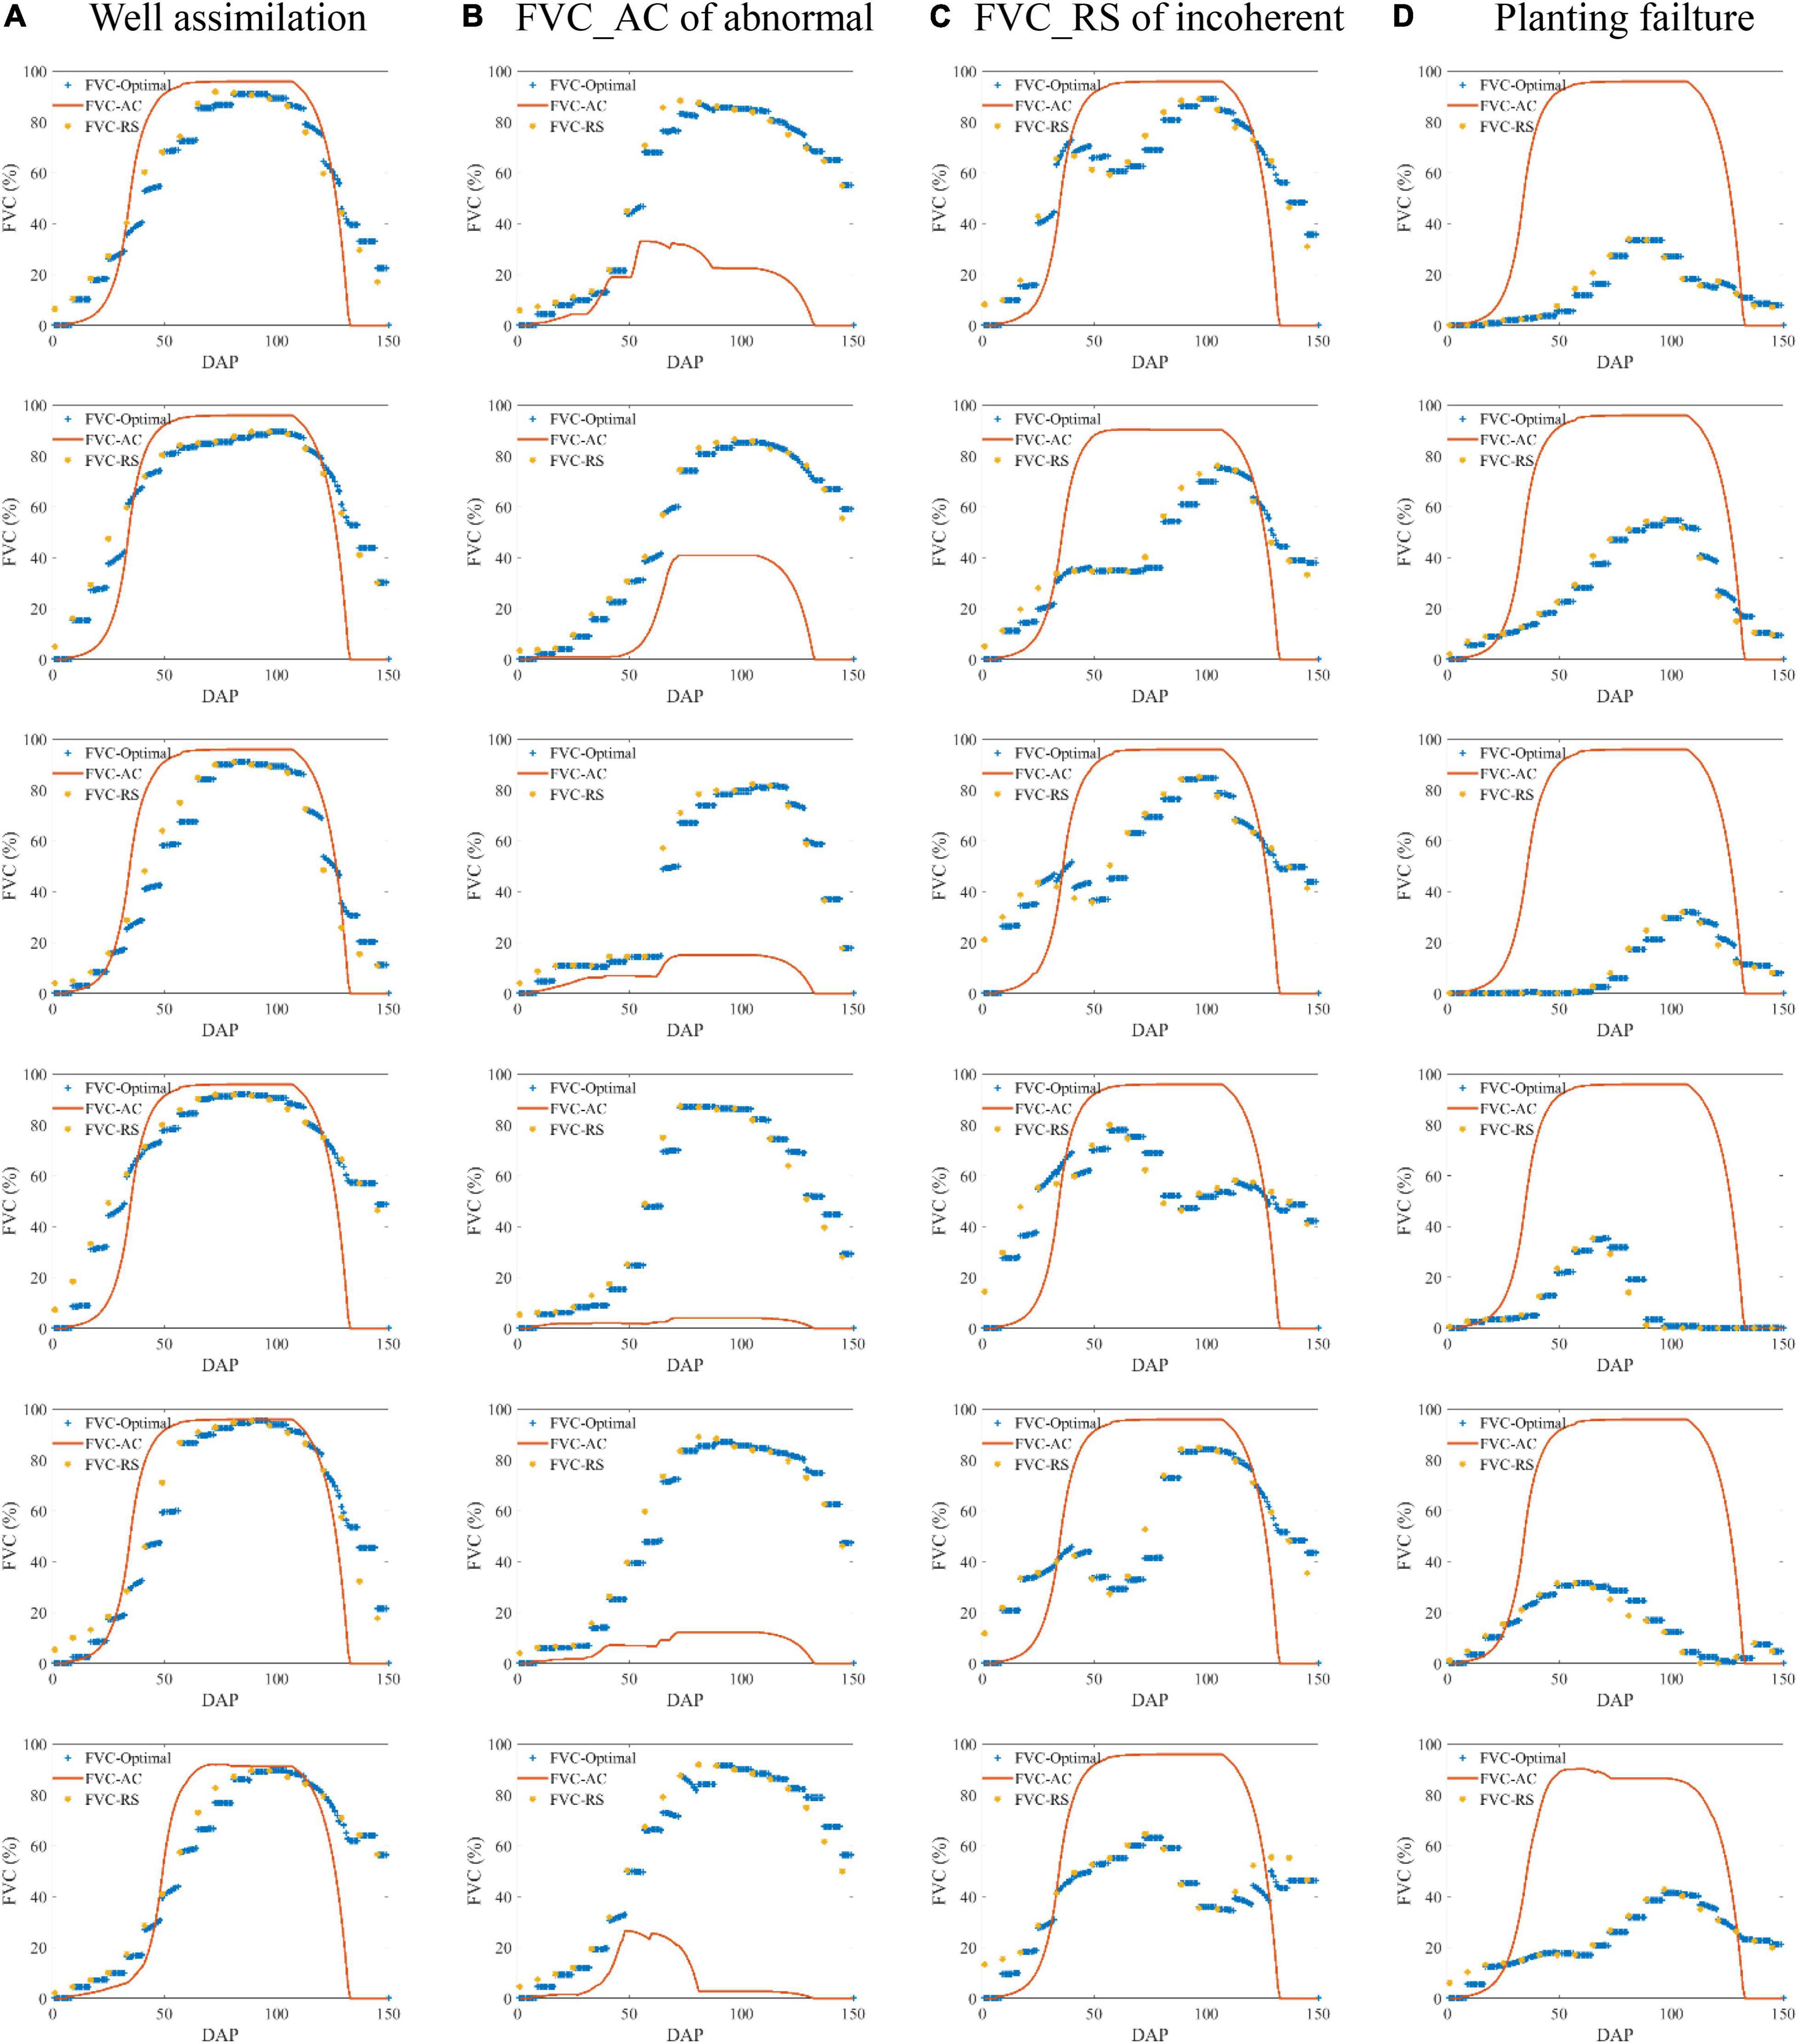
Figure 8. Several examples of FVC assimilation based on the EnKF multithreaded algorithm.
The unsatisfactory assimilation results were probably caused by mixed-pixel RS inversion, spatial mismatch and inaccurate phenological parameters that led to discrepancies between the simulation and reality. It should be noted that remote sensing data can reflect real surface information only when the spatial resolution is sufficiently high. The accuracy of the method will be dramatically promoted when the resolution of remote sensing input data is improved.
At the end of the growth period, FVC observed by remote sensing is not of maize crops, but background interference such as surface weeds, it will have no impact on yield simulation by removing the last 10 days of data before adding to the RF model.
Random Forest Model of Regression Between Fractional Vegetation Cover and Yield
Based on the FVC array and yield data in the last 20 years, this study established three RF models to describe the regression relationship between the three FVCs and the yield of the statistical yearbook. RF1 used the FVC simulated by the AquaCrop model, RF2 used the remote sensing GLASS FVC product, and RF3 used the optimal FVC assimilated by the two. Considering that the unsatisfactory assimilation results reflected the unreliability of FVC_AC or FVC_RS, the three random forest models only used the data corresponding to well-assimilated fraction of FVC in Figure 8. The verification results of the predicted yields of random forests are shown in Figure 9. As a typical data-driven machine learning model, random forest strongly shows the dependence of prediction results on input data, and they objectively reflect the invisible relationship between FVC and yield.
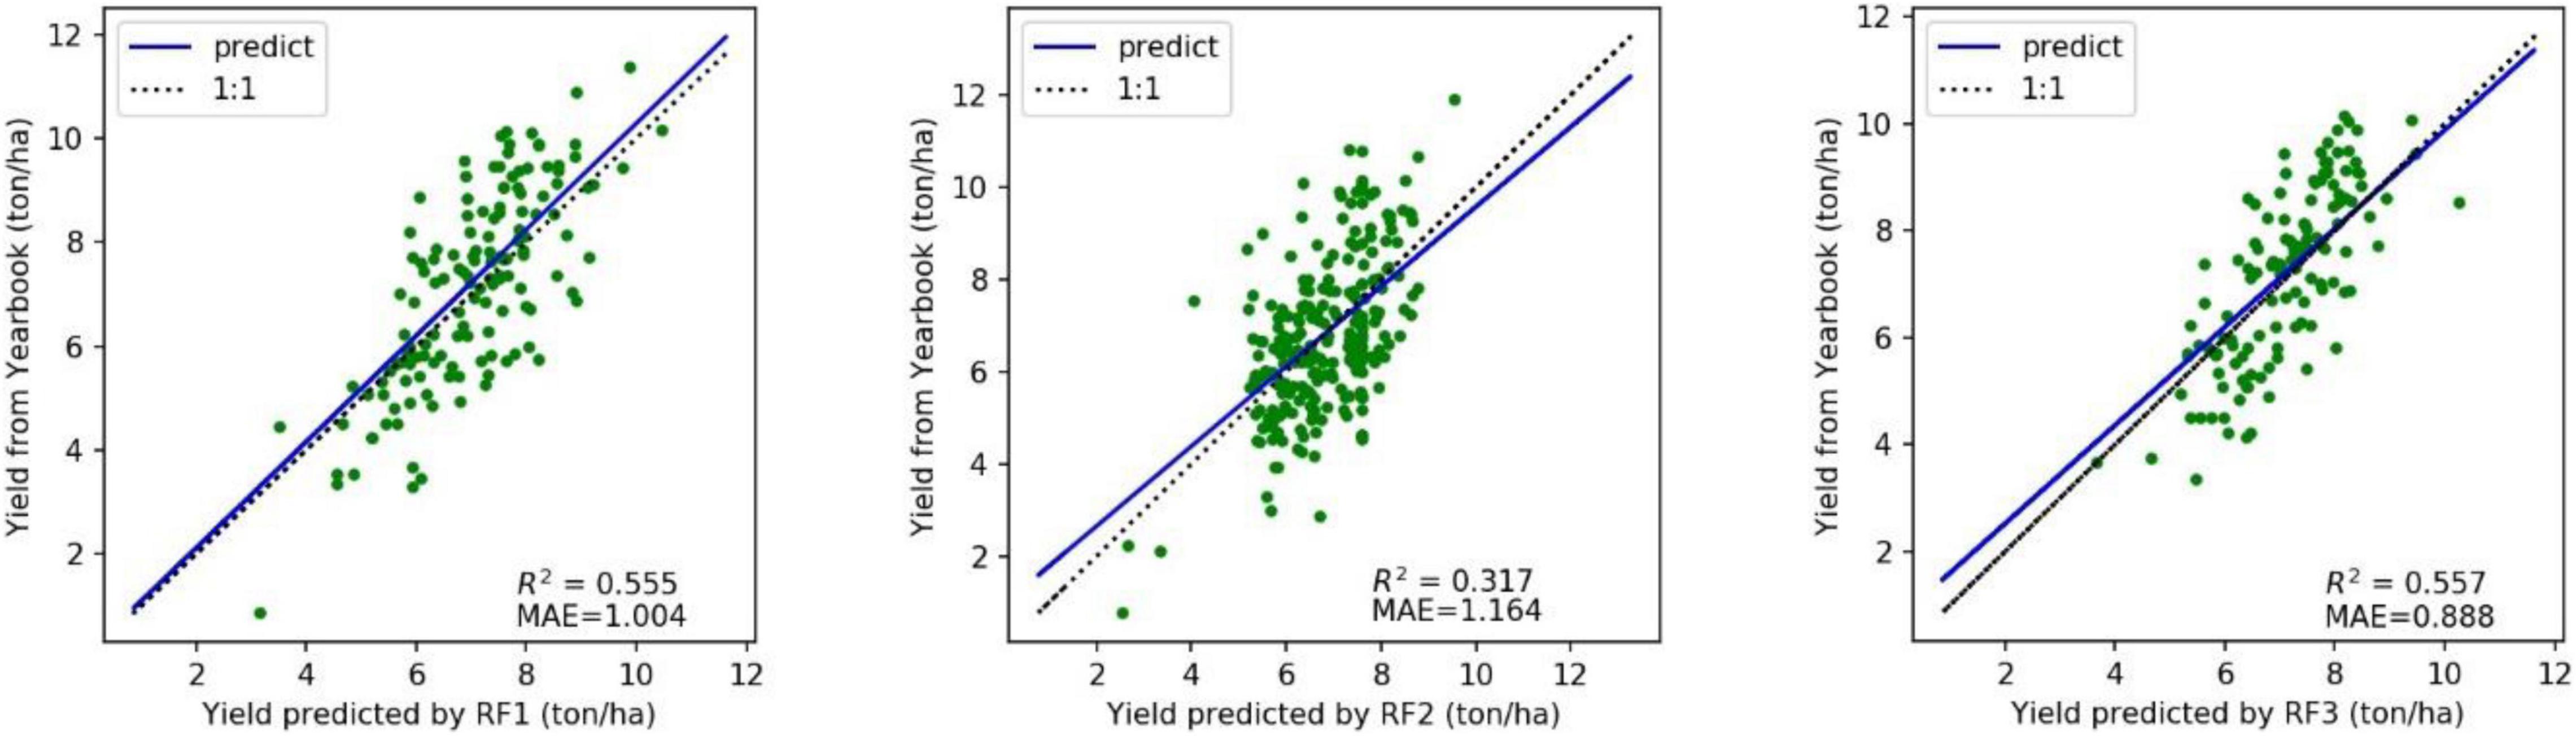
Figure 9. Comparison of accuracy between the three random forest models. (RF1: input FVC_AC; RF2: input FVC_RS; RF1: input FVC_Optimal).
Based on the optimal FVC curve, RF3 showed the best performance on maize yield prediction in the black soil area of Northeast China. RF3 is slightly better than RF1, which proves that the addition of remote sensing observation data still has a gain on the yield simulation model, R2 increases from 0.555 to 0.557, and MAE decreases from 1.004 ton/ha to 0.888 ton/ha. RF2, the yield estimation model based on remote sensing values alone has the lowest accuracy, probably because the amount of data input is far less than that of the other two models, and the quality of the data is greatly influenced by the scale effect. RF3 proved the feasibility of estimating yield with optimal FVC curve.
Discussion
Yield Estimation Benefits From Assimilating Fractional Vegetation Cover
From the results, the addition of assimilation only nets a slight improvement to the yield estimation accuracy, which may lead to doubts about the method effectiveness. Therefore, we establish the following assumptions to explain the benefit of the assimilation algorithm on yield estimation accuracy:
First, assume that Fs(t) is the FVC simulated by the AquaCrop model at time t, Fo(t) is the FVC observed by remote sensing at time t, and Ft(t) is the real FVC, which is unknown. Then, there are two errors, observation error o and simulation errors s:
Furthermore, assuming that the error of observation value and the simulation value are unbiased and have no correlation:
At this time, by calculating the variance of the observation error and variance of simulation error and determining the corresponding weight coefficient, we obtained an FVC estimation value Fa(t) that is closer to Ft(t). The reciprocal of variance is defined as the data precision.
Assuming that the estimated value is unbiased:
Then, minimize the variance of the estimated value Fa(t):
Obviously, the variance of the estimated value is always less than the observation error variance and simulation error variance. The coupling of observation and model simulation information is confirmed to obtain a better state estimation value.
However, no data source can guarantee the unbiased of its error nature. In terms of remote sensing data, if the observations are collectively higher than the true values, the addition of observed values during assimilation will lead the simulation process to a higher direction but make the estimation results more distorted. Therefore, it is necessary to control and reduce the reliability of each input data of the assimilation algorithm to ensure the final prediction effect. This requires the continued development of remote sensing technology and traditional mechanism models.
Uncertainties and Future Work
This paper mainly has uncertainty and limitations in the following two aspects: data assimilation by remote sensing and machine learning. In the ideal case, the AquaCrop model assimilation system coupled with multitemporal remote sensing products integrates the advantages of the two. On the one hand, the addition of a mechanism model makes up for the lack of biophysical significance of the system. On the other hand, the addition of remote sensing observations improves the reliability of the system and expands the application scope. But in fact, the analog of state variables in the crop model is not detailed enough, and many variation characteristics of FVC observed by remote sensing are not reflected in the simulation results. It should also focus on developing regional crop models to allow the input and output of surface parameters to better integrate and utilize regional products and serve regional research. In regional studies, remote sensing data are generally expected to be used due to their large scale and ready availability. However, the unverifiable authenticity of remote sensing data caused by mixed pixels must not be overlooked, and the final error may be three times the input LAI error (Fang et al., 2018). Although high spatial resolution imagery ensures the maximum number of pure pixels, the time resolution and width are sacrificed, resulting in high costs in regional applications. Research should balance the system investment and its efficiency. Above all, deliberately combining the advantages of different data resources to improve the practical value of crop models is still a valuable problem for agricultural research.
Introducing the data-driven method, this study established the regression relationship between time series FVC and yield based on the machine learning method of random forest. According to the crop yield predicted by the assimilated FVC and the statistical yield, the R2 of random forest reached 0.557, demonstrating that the construction logic of the system is tenable. It revealed that crop yield is not only reflected by FVC, which may account for 55.7% of the representation. The maize yield estimation accuracy was limited by the correlation between FVC and maize yield itself, which can hardly be surpassed by technology. For regional yield estimation, this is still a rare attempt to provide a relatively accurate yield forecast based only on time series FVC data.
Several previous studies have also found the significant association between surface state variables and crop yield, and all committed to estimating yield through these variables. Present yield estimation accuracy of 0.888 ton/ha through FVC assimilation has an advantage over previous assimilation studies. Hank et al., 2015) estimated winter wheat yield by assimilating LAI into PROMET model, the R2 was 0.93 and the RMSE was 1.15 ton/ha. Gilardelli et al. (2019) estimated rice yield in northern Italy by assimilating LAI into WARM rice model, the MAE was 0.66 ton/ha and the RRMSE was 13.8%. Their study got higher accuracy by using fine spatial resolution (30 meters) on an area lower than 3 km2, while our study using 500 m resolution product so as to achieved 20 km2 of yield estimation. Li et al., 2019) estimated winter wheat yield by assimilating LAI into WheatSM model, the RMSE was 1.641 ton/ha through SCE-UA assimilation method and 1.587 ton/ha through EnKF assimilation method. Wang P. X. et al. (2020) integrated remote sensing LAI of 4 phases to CERES-Maize model based on EnKF data assimilation approach in North China, the R2 of the estimated yield was 0.33, and the root mean square error (RMSE) was 0.371 ton/ha. Their study has only been verified in 8 research points for 5 years, while our study verified on 155 points for 21 years.
The results of this paper also show that there are many potential development space for the method of yield estimation based on the assimilation of surface state variable and machine learning. This finding is similar to those reported by Silva et al. (2020), which concluded that “big data” are useful to characterize cropping systems at the regional scale but need more progress to explain yield variability. Directions for improvement including optimizing machine learning algorithms to isolate and enhance the effect of FVC features on crop yield; and exploring multivariable joint assimilation integrating relevant biophysical indicators, such as evapotranspiration and temperature. It may also be necessary to apply continuous assimilation of multiple images into crop models to retain their spatial information.
Conclusion
This study proposed a yield prediction method based on a crop model and remote sensing data assimilation for maize in the black soil region of Northeast China. The calibrated AquaCrop model already has a good simulation effect at the point scale, which confirms the availability of the AquaCrop model in this area. Profit from the physiological response of crops to environmental and management conditions is intuitively reflected by the AquaCrop model. We applied the model to simulate the growth of maize crops in the Songnen black soil area from 2000 to 2020 and accumulated a large database. After confirming the accuracy of the remote sensing surface parameter products, synchronous time series observations are added to the AquaCrop simulation results of 21 years through the EnKF filtering assimilation algorithm, and an optimal FVC dataset is established. Using the optimal FVC and the regression relationship between FVC and statistical yield trained by random forest, a yield estimation method is formed. Data assimilation combines the two geodetic research methodologies of simulation and observation, while this study proposed that the method further integrates the idea of a mechanism model and machine learning and provides a feasible idea for crop yield estimation. Overall, the main contribution of current study is offering new insights and perspectives for the following two issues: one is how to integrate satellite remote sensing data into the crop model at the regional scale; the second is how to obtain more useful yield information from the available surface parameter data.
Data Availability Statement
The raw data supporting the conclusions of this article will be made available by the authors, without undue reservation.
Author Contributions
YC: conceptualization, methodology, software, formal analysis, investigation, and writing—review and editing. SL: conceptualization, writing—review and editing, supervision, and project administration. XL and HG: visualization. YX: data curation, conceptualization, and supervision. YH: data curation. All authors have read and agreed to the published version of the manuscript.
Funding
This study was supported by the National Key Research and Development Program of China (Grant No. 2021YFD1500705).
Conflict of Interest
The authors declare that the research was conducted in the absence of any commercial or financial relationships that could be construed as a potential conflict of interest.
Publisher’s Note
All claims expressed in this article are solely those of the authors and do not necessarily represent those of their affiliated organizations, or those of the publisher, the editors and the reviewers. Any product that may be evaluated in this article, or claim that may be made by its manufacturer, is not guaranteed or endorsed by the publisher.
Footnotes
- ^ http://data.cma.cn/site/index.html
- ^ http://www.cresda.com/CN/Data
- ^ http://www.geodata.cn/thematicView/GLASS.html
References
Bakker, M. M., Govers, G., Jones, R. A., and Rounsevell, M. D. A. (2007). The effect of soil erosion on Europe’s crop yields. Ecosystems 10, 1209–1219. doi: 10.1007/s10021-007-9090-3
Cui, Y., Lin, H., Xie, Y., and Liu, S. (2021). Application study of crop yield prediction based on aquacrop model in black soil region of northeast china. Acta Agron. Sin. 47, 159–168. doi: 10.3724/SP.J.1006.2021.03016
Eshete, D. G., Sinshaw, B. G., and Legese, K. G. (2020). Critical review on improving irrigation water use efficiency: advances, challenges, and opportunities in the Ethiopia context. Water Energy Nexus 3, 143–154. doi: 10.1016/j.wen.2020.09.001
Fang, H., Liang, S., Hoogenboom, G., Teasdale, J., and Cavigelli, M. (2018). Corn-yield estimation through assimilation of remotely sensed data into the CSM-CERES-Maize model. Int. J. Remote Sens. 29, 3011–3032. doi: 10.1080/01431160701408386
Feng, L., Wang, Y., Zhang, Z., and Du, Q. (2021). Geographically and temporally weighted neural network for winter wheat yield prediction. Remote Sens. Environ. 262:112514. doi: 10.1016/j.rse.2021.112514
Feng, P., Wang, B., Liu, D. L., Waters, C. M., and Yu, Q. (2019). Incorporating machine learning with biophysical model can improve the evaluation of climate extremes impacts on wheat yield in south-eastern Australia. Agric. For. Meteorol. 275, 100–113. doi: 10.1016/j.agrformet.2019.05.018
Gilardelli, C., Stella, T., Confalonieri, R., Ranghetti, L., Campos-Taberner, M., Garcia-Haro, F. J., et al. (2019). Downscaling rice yield simulation at sub-field scale using remotely sensed LAI data. Eur. J. Agron. 103, 108–116. doi: 10.1016/j.eja.2018.12.003
Hank, T., Bach, H., and Mauser, W. (2015). Using a remote sensing-supported hydro-agroecological model for field-scale simulation of heterogeneous crop growth and yield: application for wheat in central Europe. Remote Sens. 7, 3934–3965. doi: 10.3390/rs70403934
Hu, S., Shi, L., Huang, K., Zha, Y., Hu, X., Ye, H., et al. (2019). Improvement of sugarcane crop simulation by SWAP-WOFOST model via data assimilation. Field Crops Res. 232, 49–61. doi: 10.1016/j.fcr.2018.12.009
Huang, J., Huang, H., Ma, H., Zhou, W., and Zhu, D. (2018). Review on data assimilation of remote sensing and crop growth models. Trans. Chinese Soc. Agric. Eng. 34, 144–156. doi: 10.11975/j.issn.1002-6819.2018.21.018
Iqbal, M. A., Shen, Y., Stricevic, R., Pei, H., Sun, H., Amiri, E., et al. (2014). Evaluation of the FAO aquacrop model for winter wheat on the north china plain under deficit irrigation from field experiment to regional yield simulation. Agric. Water Manage. 135, 61–72. doi: 10.1016/j.agwat.2013.12.012
Jia, K., Liang, S., Liu, S., Li, Y., Xiao, Z., Yao, Y., et al. (2015). Global land surface fractional vegetation cover estimation using general regression neural networks from MODIS surface reflectance. IEEE Trans. Geosci. Remote Sens. 53, 4787–4796. doi: 10.1109/TGRS.2015.2409563
Jin, H., Li, A., Wang, J. D., and Bo, Y. (2016). Improvement of spatially and temporally continuous crop leaf area index by integration of CERES-Maize model and MODIS data. Eur. J. Agron. 78, 1–12. doi: 10.1016/j.eja.2016.04.007
Jin, X., Kumar, L., Li, Z., Xu, X., Yang, G., and Wang, J. (2016). Estimation of winter wheat biomass and yield by combining the AquaCrop model and field hyperspectral data. Remote Sens. 8:972. doi: 10.3390/rs8120972
Li, H. (2016). A Study On The Uncertainty Of Regional Winter Wheat Growth Simulation From A Crop Model Using Remote Sensing Data Assimilation. Beijing: Chinese Academy of Agricultural Sciences.
Li, H., Chen, Z., Liu, G., Jiang, Z., and Huang, C. (2017). Improving winter wheat yield estimation from the CERES-wheat model to assimilate leaf area index with different assimilation methods and spatio-temporal scales. Remote Sens. 9:190. doi: 10.3390/rs9030190
Li, X., and Bai, Y. (2010). A Bayesian filter framework for sequential data assimilation. Adv. Earth Sci. 25, 515–522. doi: 10.3788/gzxb20103907.1340
Li, Y., Chen, H. L., Tian, H. W., and Yu, W. D. (2019). Estimation of winter wheat yield based on coupling remote sensing information and WheatSM model. Chinese J.Ecol. 38, 2258–2264. doi: 10.13292/j.1000-4890.201907.039
Lin, H., Xie, Y., Liu, G., Zhai, J., and Li, S. (2019). Soybean and maize simulation under different degrees of soil erosion. Field Crops Res. 230, 1–10. doi: 10.1016/j.fcr.2018.10.004
Liu, B. Y., Zhang, G. L., Xie, Y., Shen, B., and Liu, B. (2021). Delineating the black soil region and typical black soil region of northeastern China. Chinese Sci. Bull. 66, 96–106. doi: 10.1360/TB-2020-0178
Monteith, J. L. (1996). The quest for balance in crop modeling. Agron. J. 88, 695–697. doi: 10.2134/agronj1996.00021962008800050003x
Passioura, J. B. (1996). Simulation models: science, snake oil, education, or engineering? Agron. J. 88, 690–694. doi: 10.2134/agronj1996.00021962008800050002x
Peng, X., Han, W., Ao, J., and Wang, Y. (2021). Assimilation of LAI derived from UAV multispectral data into the SAFY model to estimate maize yield. Remote Sens. 13:1094. doi: 10.1016/j.agrformet.2021.108345
Pique, G., Fieuzal, R., Bitar, A. A., Veloso, A., Tallec, T., Brut, A., et al. (2020). Estimation of daily CO2 fluxes and of the components of the carbon budget for winter wheat by the assimilation of Sentinel 2-like remote sensing data into a crop model. Geoderma 376:114428. doi: 10.1016/j.geoderma.2020.114428
Qian, X., Zang, H., Xu, H., Ren, C., Guo, L., Wang, C., et al. (2018). Relay strip intercropping of oat with maize, sunflower and mung bean in semi-arid regions of Northeast China: yield advantages and economic benefits. Field Crops Res. 223, 33–40. doi: 10.1016/j.fcr.2018.04.004
Qin, Q. M., Fan, W. J., and Ren, H. Z. (2018). Theory, Method And Application Of Farmland Quantitative Remote Sensing. Beijing: Science Press.
Raes, D., Steduto, P., Hsiao, T. C., and Fereres, E. (2009). AquaCrop—the FAO crop model to simulate yield response to water: II. Main algorithms and software description. Agron. J. 101, 438–447. doi: 10.2134/agronj2008.0140s
Sandhu, R., and Irmak, S. (2019). Performance of AquaCrop model in simulating maize growth, yield, and evapotranspiration under rainfed, limited and full irrigation. Agric. Water Manage. 223:105687. doi: 10.1016/j.agwat.2019.105687
Silva, J. V., Tenreiro, T. R., Spätjens, L., Anten, N. P. R., Ittersum, M. K. V., and Reidsma, P. (2020). Can big data explain yield variability and water productivity in intensive cropping systems? Field Crops Res. 255:107828. doi: 10.1016/j.fcr.2020.107828
Silvestro, P. C., Pignatti, S., Pascucci, S., Yang, H., Li, Z., Yang, G., et al. (2017). Estimating wheat yield in China at the field and district scale from the assimilation of satellite data into the Aquacrop and simple algorithm for yield (SAFY) models. Remote Sens. 9:509. doi: 10.3390/rs9050509
Steduto, P., Hsiao, T. C., Raes, D., and Fereres, E. (2009). AquaCrop—The FAO crop model to simulate yield response to water: I. Concepts and underlying principles. Agron. J. 101, 426–437. doi: 10.2134/agronj2008.0139s
Steele-Dunne, S. C., Mcnairn, H., Monsivais-Huertero, A., Judge, J., Liu, P. W., and Papathanassiou, K. (2017). Radar remote sensing of agricultural canopies: a review. IEEE J. Sel. Top. Appl. Earth Obs. Remote Sens. 10, 2249–2273. doi: 10.1109/JSTARS.2016.2639043
Tewes, A., Hoffmann, H., Krauss, G., Schafer, F., Kerkhoff, C., and Gaiser, T. (2020). New approaches for the assimilation of LAI measurements into a crop model ensemble to improve wheat biomass estimations. Agronomy 10:446. doi: 10.3390/agronomy10030446
Todorovic, M., Albrizio, R., Zivotic, L., Abi Saab, M. T., Stöckle, C., and Steduto, P. (2009). Assessment of AquaCrop, CropSyst, and WOFOST models in the simulation of sunflower growth under different water regimes. Agron. J. 101, 509–521. doi: 10.2134/agronj2008.0166s
Van Gaelen, H., and Raes, D. (2016). AquaCrop Training Handbooks–Book II Running AquaCrop[J]. Rome: Food and Agriculture Organization of the United Nations.
Van, D. C. A., Wolf, J., and Rappoldt, V. K. H. (1989). WOFOST: a simulation model of crop production. Soil Use Manage. 5, 16–24. doi: 10.1111/j.1475-2743.1989.tb00755.x
Wang, P. X., Hu, Y. J., Li, L., and Xu, L. X. (2020). Estimation of maize yield based on ensemble kalman filter and random forest for regression. Trans. Chinese Soc. Agric. Machinery 51, 135–143. doi: 10.6041/j.issn.1000-1298.2020.09.016
Wang, X., Huang, J., Feng, Q., and Yin, D. (2020). Winter wheat yield prediction at county level and uncertainty analysis in main wheat-producing regions of China with deep learning approaches. Remote Sens. 12:1744. doi: 10.3390/rs12111744
Wigneron, J. P., Jackson, T. J., Neill, P. O., Lannoy, D. G., Rosnay, D. P., Walker, J. P., et al. (2017). Modelling the passive microwave signature from land surfaces: a review of recent results and application to the L-band SMOS & SMAP soil moisture retrieval algorithms. Remote Sens. Environ. 192, 238–262. doi: 10.1016/j.rse.2017.01.024
Wu, S., Yang, P., Chen, Z., Ren, J., Li, H., and Sun, L. (2021). Estimating winter wheat yield by assimilation of remote sensing data with a four-dimensional variation algorithm considering anisotropic background error and time window. Agric. For. Meteorol. 30:108345.
Xie, Y., Kiniry, J. R., and Williams, J. R. (2003). The ALMANAC model’s sensitivity to input variables. Agric. Syst. 78, 1–16. doi: 10.1016/S0308-521X(03)00002-7
Xie, Y., Wang, P. X., Wang, L., Zhang, S., and Liu, J. (2016). Estimation of wheat yield based on crop and remote sensing assimilation models. Trans. Chinese Soc. Agric. Eng. 32, 179–186. doi: 10.11975/j.issn.1002-6819.2016.20.023
Appendix
Appendix A: Meteorological Data
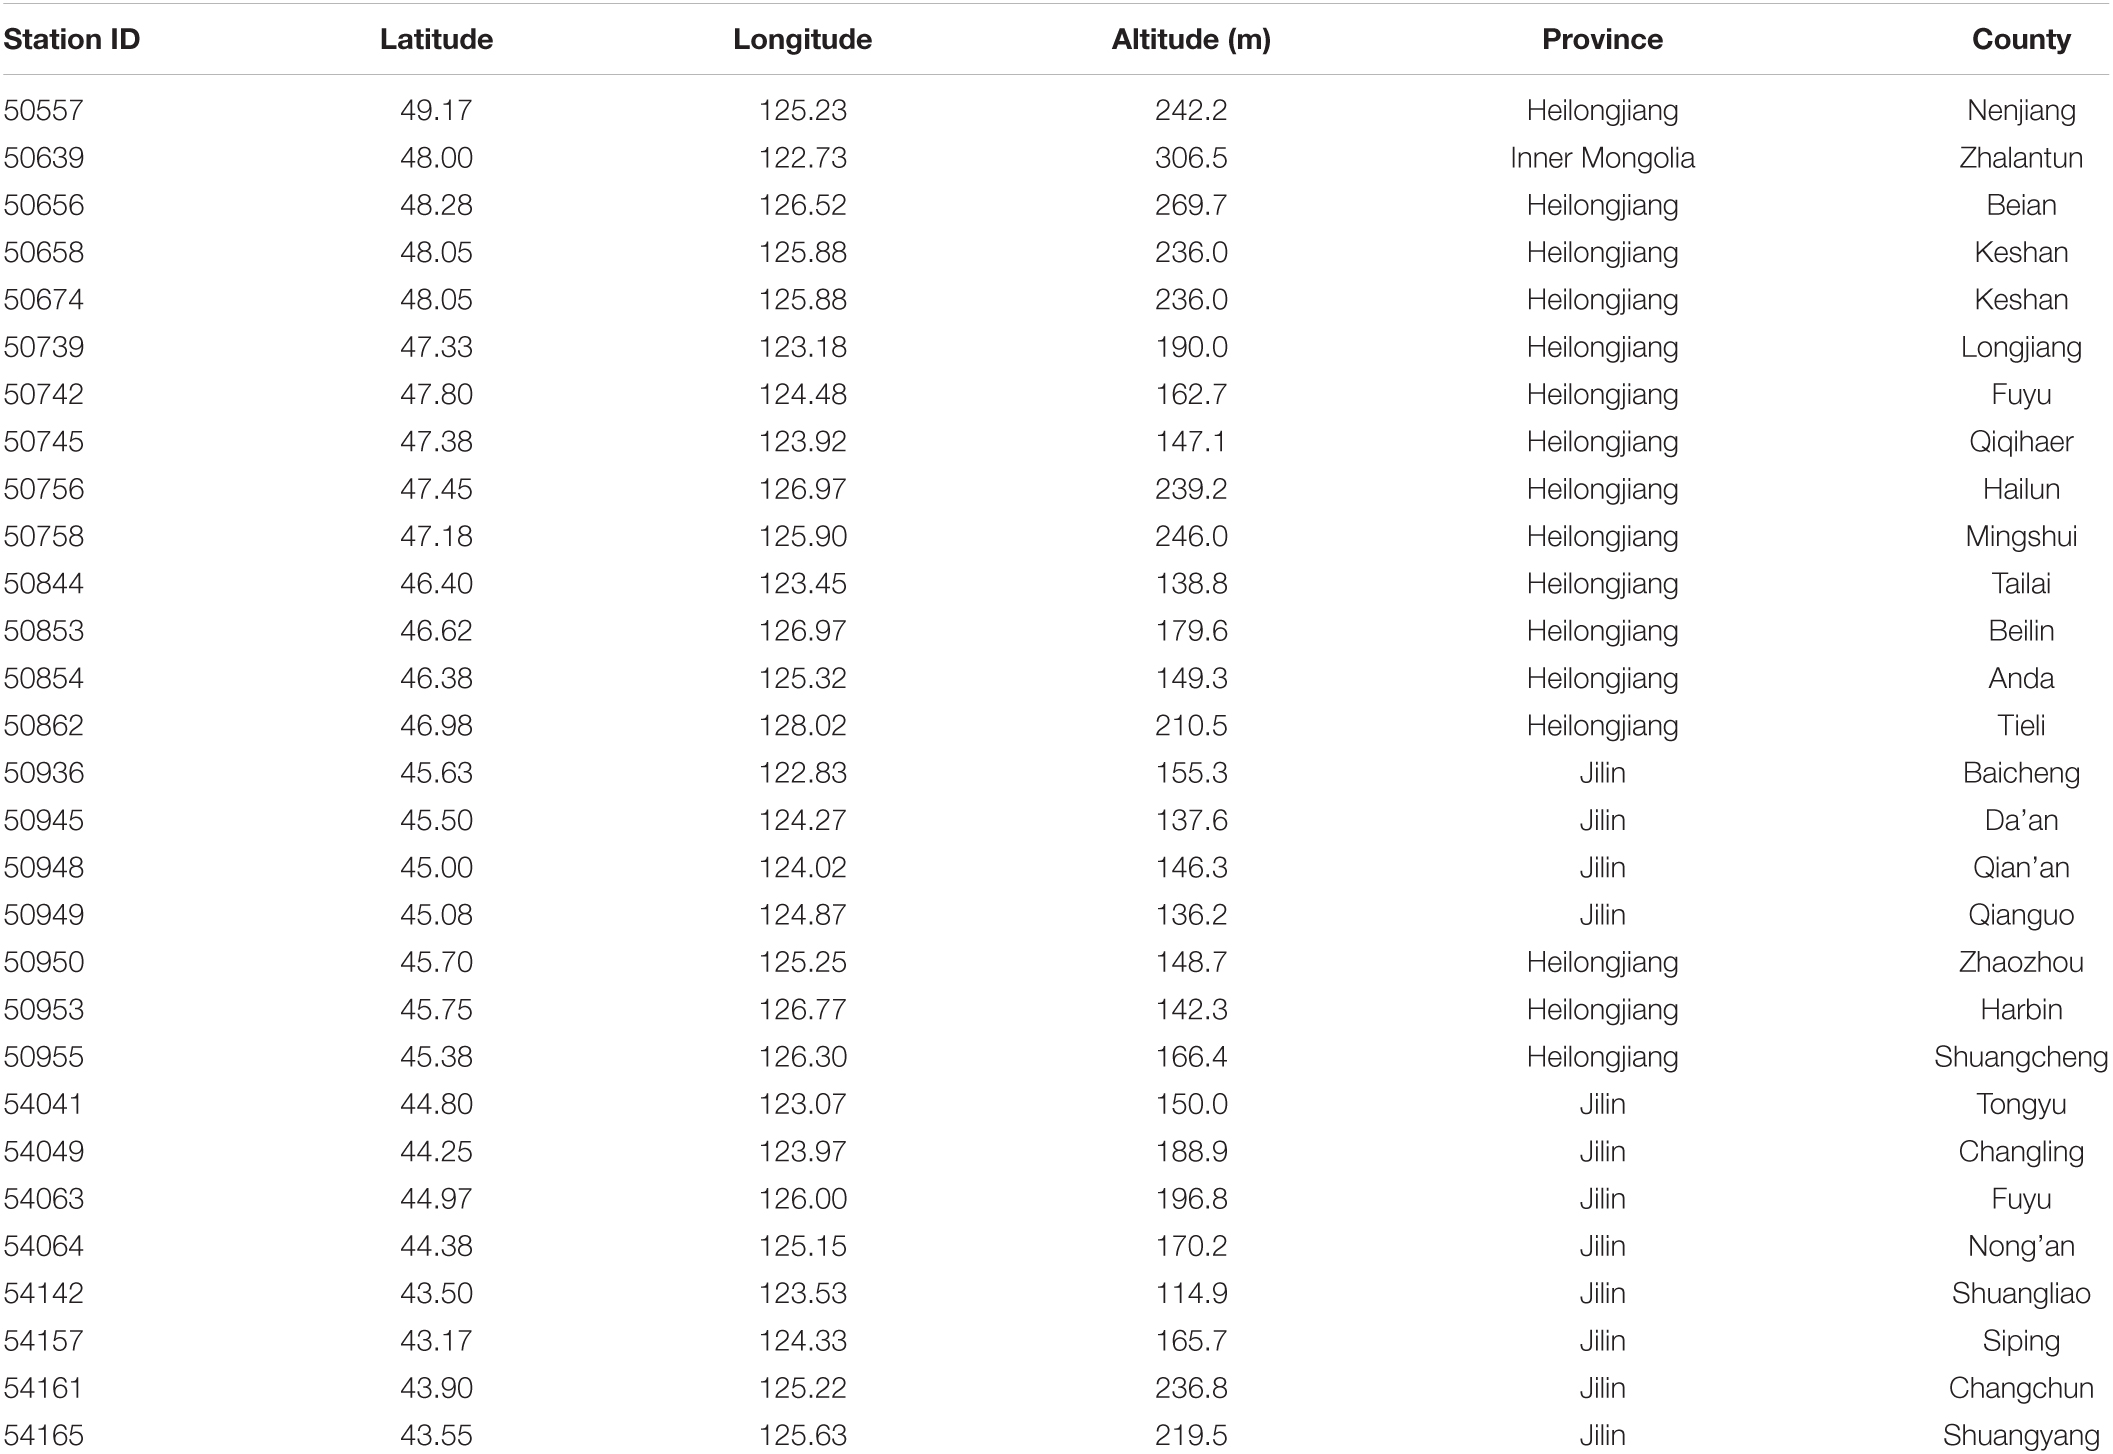
Table A1. Weather station information in Songnen Plain.
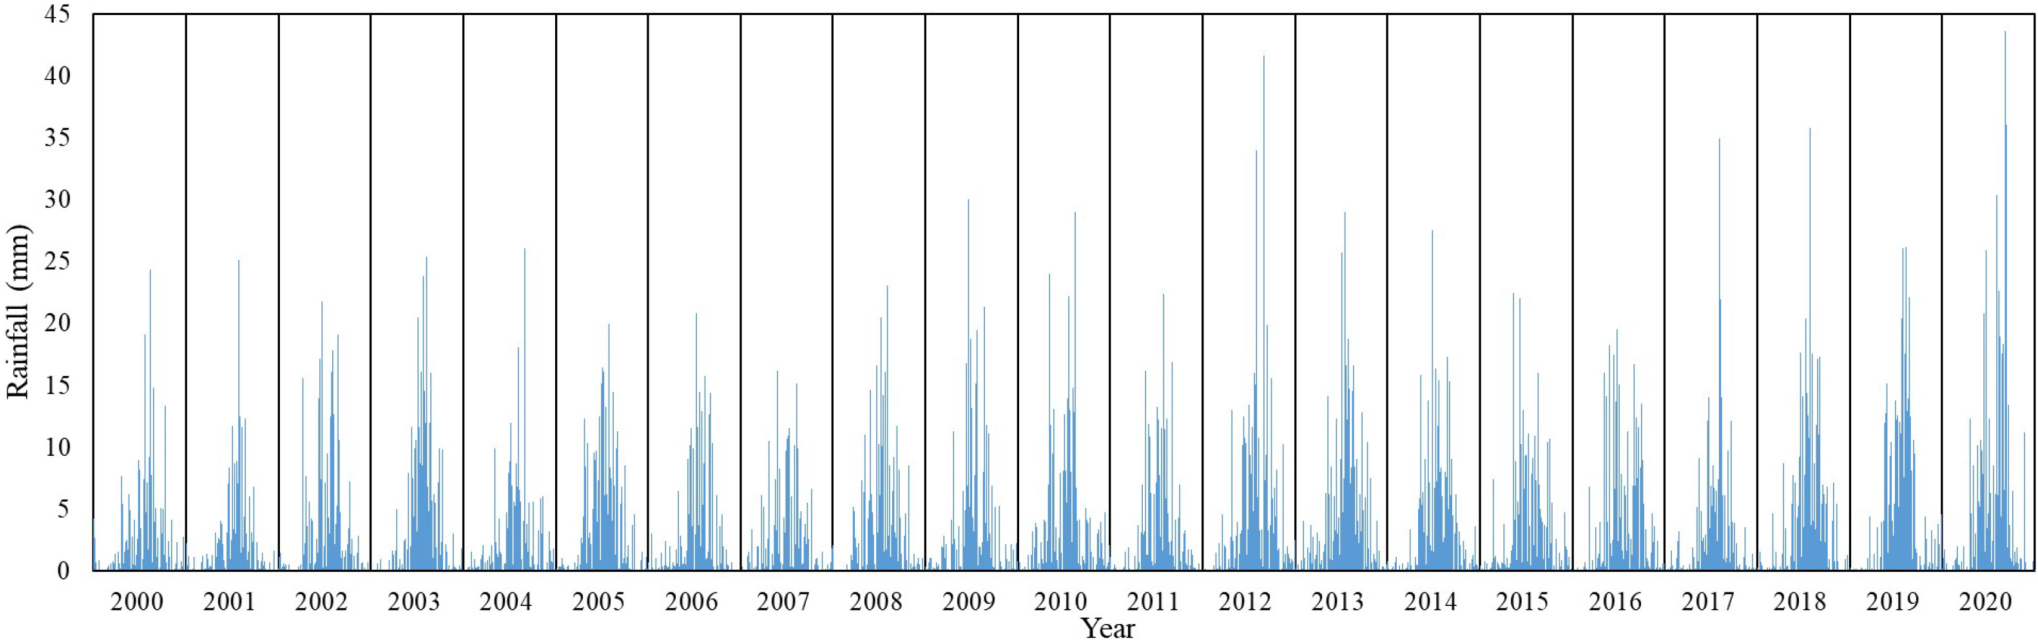
Figure A1. Average daily precipitation in Songnen Plain from 2000 to 2020.
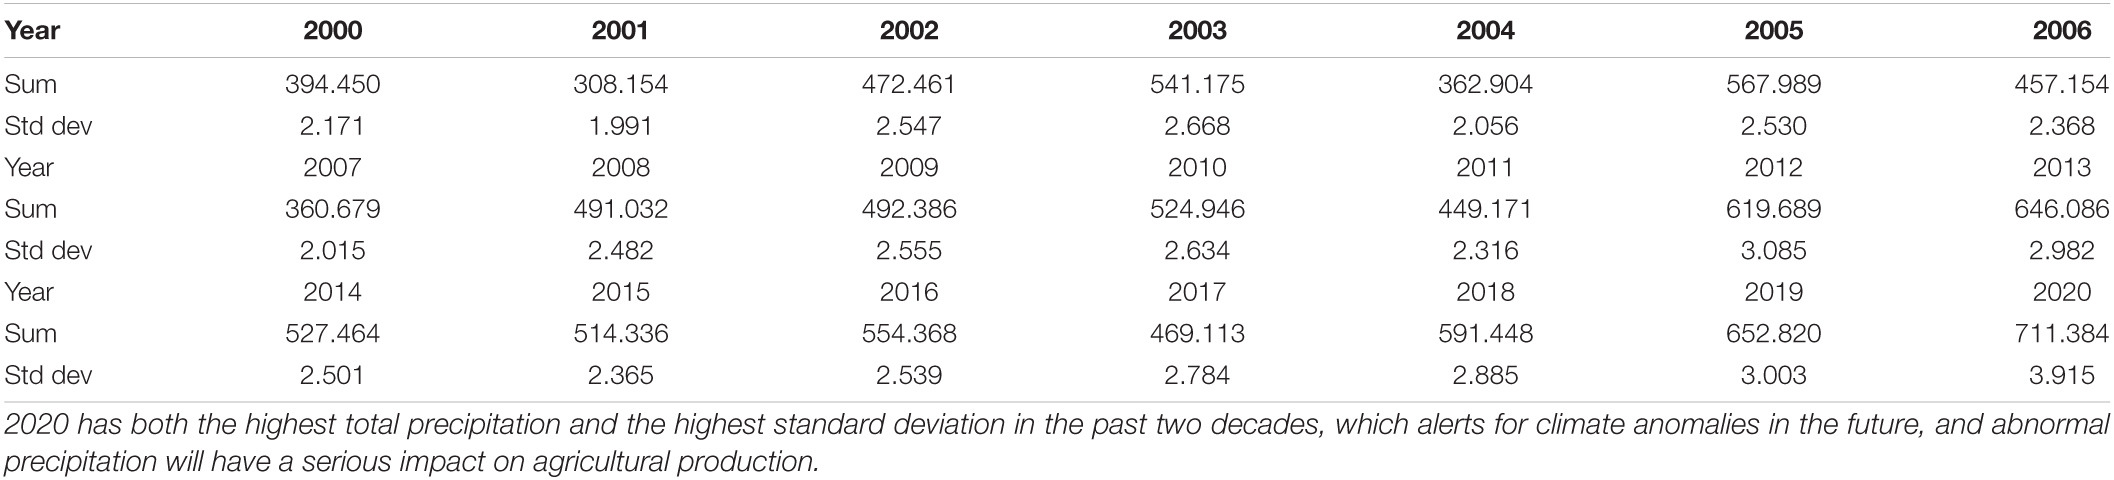
Table A2. Statistics of annual precipitation on the Songnen Plain.
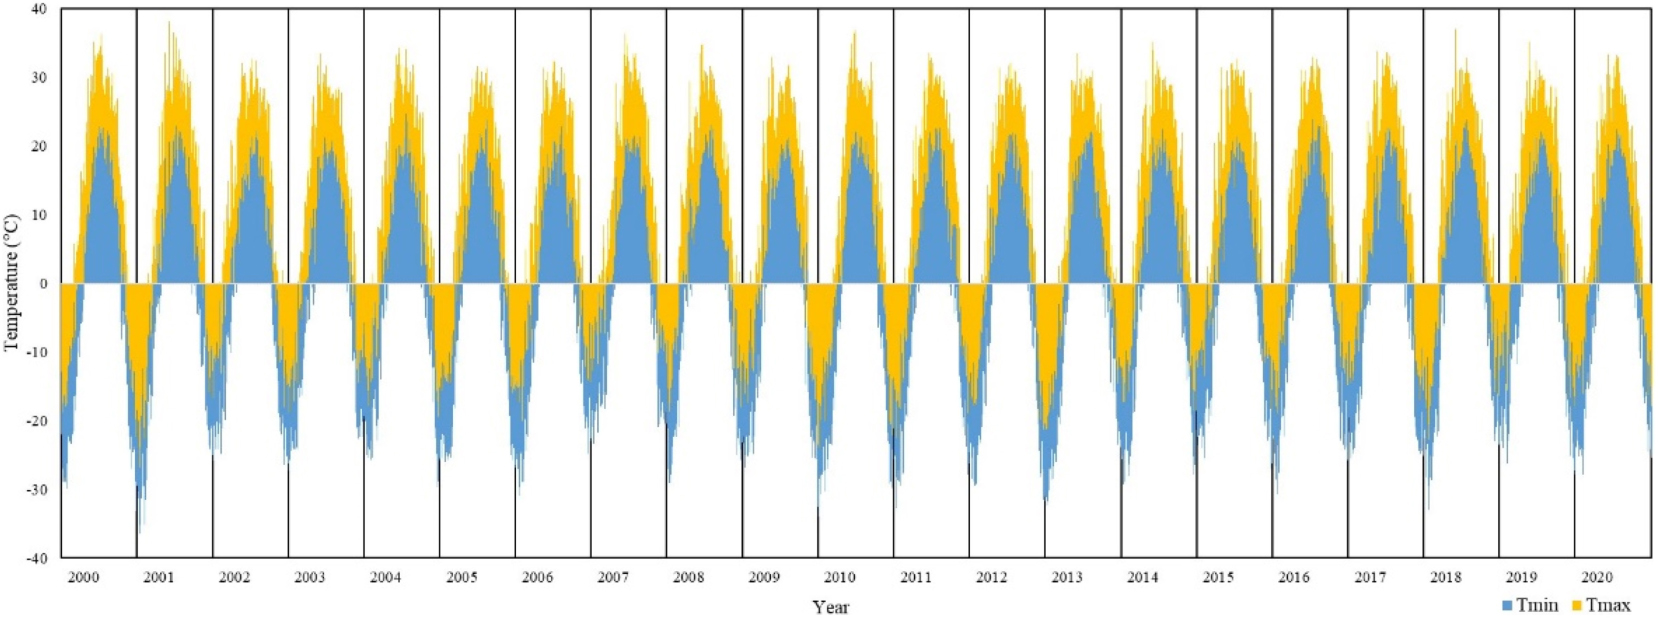
Figure A2. The average daily temperature in the Songnen Plain from 2000 to 2020 is close to the average long-term situation. The gentle temperature change provides a better planting environment and is conducive for crops to adapt to environmental changes.
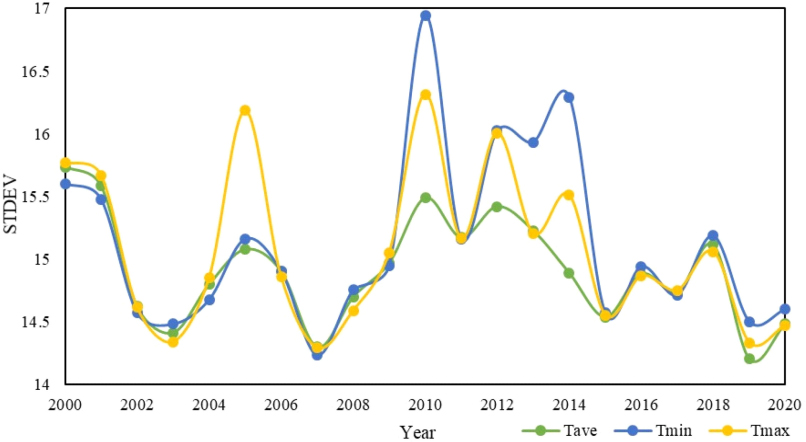
Figure A3. Standard deviation of annual average temperature in Songnen Plain from 2000 to 2020.
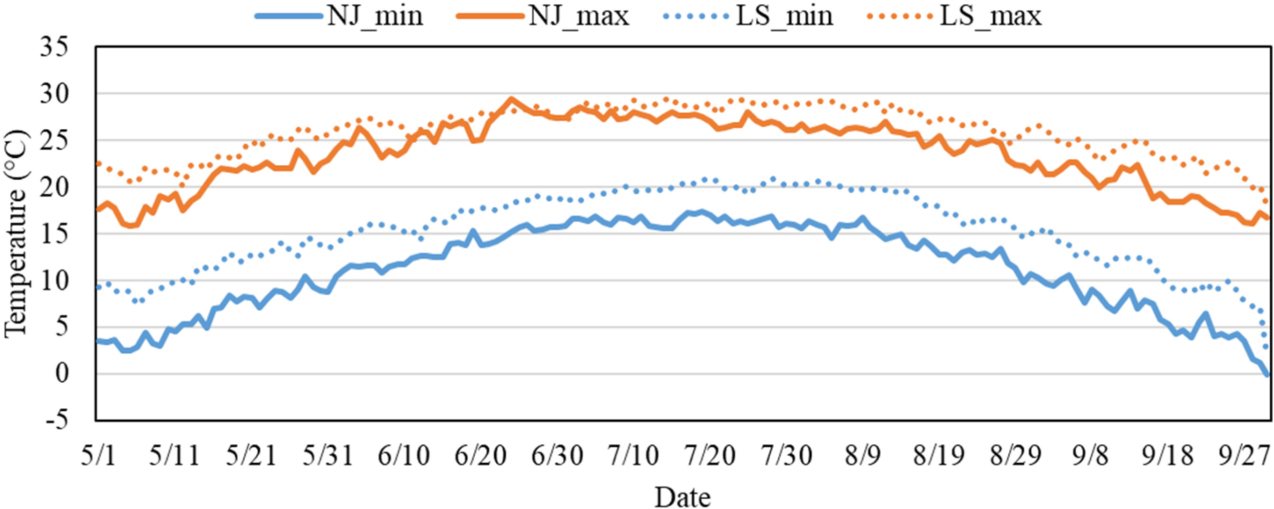
Figure A4. Average temperature of the northern and southern parts of the Songnen black soil region during the recent 21-maize growth season.
Appendix B: AquaCrop Model Parameters
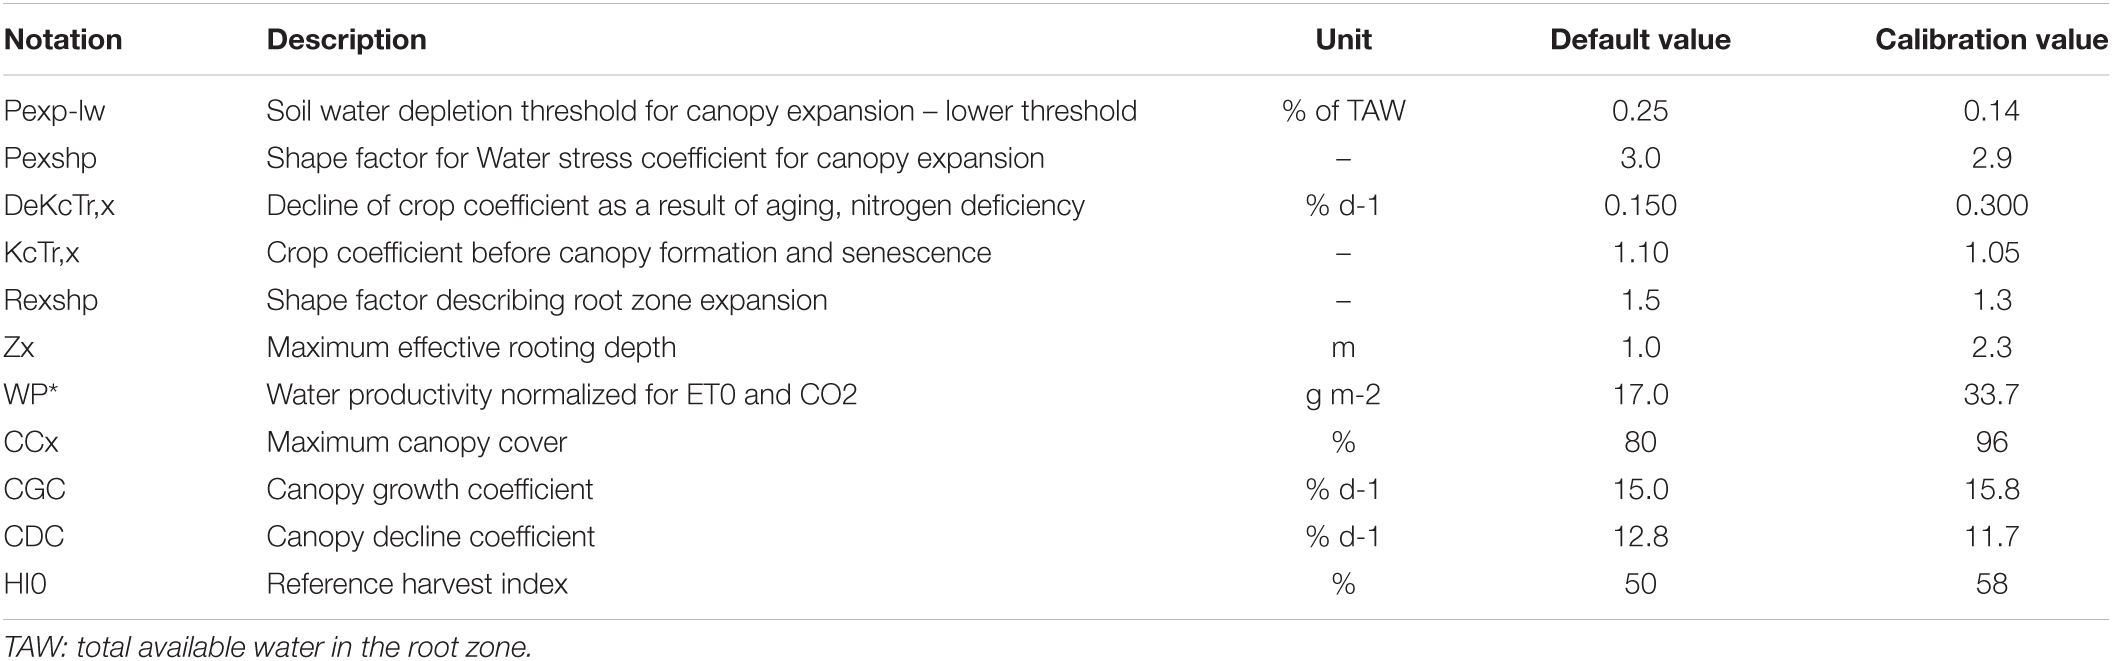
Table A1. Parameter calibration of the AquaCrop model simulating the growth of maize in the Northeast Chinese black soil area.
Keywords: AquaCrop model, Kalman filter, remote sensing, yield prediction, random forest, data assimilation
Citation: Cui Y, Liu S, Li X, Geng H, Xie Y and He Y (2022) Estimating Maize Yield in the Black Soil Region of Northeast China Using Land Surface Data Assimilation: Integrating a Crop Model and Remote Sensing. Front. Plant Sci. 13:915109. doi: 10.3389/fpls.2022.915109
Received: 07 April 2022; Accepted: 30 May 2022;
Published: 23 June 2022.
Edited by:
Xiuliang Jin, Key Laboratory of Crop Physiology and Ecology (CAAS), ChinaReviewed by:
Yunshan Yang, Shihezi University, ChinaChenyao Yang, University of Trás-os-Montes and Alto Douro, Portugal
Albert Thembinkosi Modi, University of KwaZulu-Natal, South Africa
Copyright © 2022 Cui, Liu, Li, Geng, Xie and He. This is an open-access article distributed under the terms of the Creative Commons Attribution License (CC BY). The use, distribution or reproduction in other forums is permitted, provided the original author(s) and the copyright owner(s) are credited and that the original publication in this journal is cited, in accordance with accepted academic practice. No use, distribution or reproduction is permitted which does not comply with these terms.
*Correspondence: Suhong Liu, bGl1c2hAYm51LmVkdS5jbg==