 Nannan Li
 Fengling Yu
 Dorothy Sack
 Zhaoquan Huang1
94% of researchers rate our articles as excellent or good
Learn more about the work of our research integrity team to safeguard the quality of each article we publish.
Find out more
ORIGINAL RESEARCH article
Front. Plant Sci., 20 June 2022
Sec. Plant Systematics and Evolution
Volume 13 - 2022 | https://doi.org/10.3389/fpls.2022.912627
This article is part of the Research TopicFrontiers in the Study of Ancient Plant RemainsView all 27 articles
This study investigates the reliability of phytolith assemblage analysis for characterizing subtropical vegetation and explores the potential for using these modern phytolith–vegetation relationships for paleoenvironmental interpretation in southeastern China. The samples were collected from five common subtropical vegetation communities in the Daiyun Mountains, southeastern China, with the above-ground vegetation recorded at each plot. Constrained ordination analysis was used to determine the most important factor governing the variations in phytolith assemblages that could be quantitatively reconstructed with weighted averaging partial least squares regression (WAPLS). The relationship between modern phytolith assemblages and the parent vegetation, as well as production, dispersal, and taphonomic processes, was discussed. Results demonstrated that the main subtropical biomes in southeastern China could be well distinguished by soil phytolith assemblages. In particular, the overall amount of tree coverage was well represented by topsoil phytolith assemblages. Grass silica short cell phytoliths (GSSCP) tended to occur in higher proportions in open habitats (shrub-meadow) at higher elevations, whereas non-grass phytolith morphotypes attained higher frequencies under mixed and broadleaf forests at lower elevations. Human-induced deforestation might increase the frequency of GSSCP within the bulk phytolith assemblage. Our results constitute the primary phytolith reference data for the subtropical zone in southeastern Asia where vegetation change during the Holocene period, particularly forest shifts, anthropogenic deforestation, and early agriculture are poorly documented.
Phytoliths are microscopic silica accumulations produced in many plants by the uptake of soluble monosilicic acid through roots and then precipitated as amorphous opal-A within or between plant cells and tissues (Piperno, 1988). Phytoliths occur in many plants but are especially abundant and diagnostic within Poaceae species (e.g., Twiss et al., 1969; Twiss, 1992; Barboni et al., 1999). As a result, fossil phytolith analysis has allowed researchers to distinguish between forest and grassland landscapes, C3 and C4 grasslands, and environments dominated by different subfamilies of Poaceae (e.g., Alexandre et al., 1997; Barboni et al., 1999; Strömberg, 2004; Boyd, 2005; Bremond et al., 2008; Dunn et al., 2015). In addition, because phytoliths remain well preserved in oxidizing conditions and soil aggregates (e.g., Li et al., 2020, 2022) and are diagnostic to the subfamily level (Twiss et al., 1969; Twiss, 1992; Barboni et al., 1999), they are increasingly recognized as a powerful tool for paleovegetation reconstructions that involve grasses (e.g., Alexandre et al., 1997; Barboni et al., 1999; Strömberg, 2004; Boyd, 2005; Bremond et al., 2008; Dunn et al., 2015; Li N. et al., 2018, 2021), especially for areas in which conventional pollen analysis is not an option.
Despite the valuable role of phytoliths in paleoecological reconstructions in grass-dominated ecosystems, whether phytoliths can aid in forest community differentiation has been questioned. A critical concern is that phytoliths may fail to reconstruct forest vegetation reliably where Poaceae species are absent or uncommon, as in shrublands (Bremond et al., 2004). Globally, the capability of phytolith assemblages to characterize a change in forest communities has been investigated but most of those studies have been conducted in the tropics (Bremond et al., 2004; Barboni et al., 2007; Crifò and Strömberg, 2021), especially in tropical Africa (e.g., Alexandre et al., 1997; Bremond et al., 2004, 2005; Barboni et al., 2007; Chen and Smith, 2013). Emphasis on the tropics may be attributed to the fact that phytoliths produced by tropical woody Palmaceae are easily differentiated using phytoliths. For extratropical vegetation, however, Palmaceae represent at most only a small portion of the vegetation community. Extratropical trees produce only a small amount of diagnostic phytoliths (e.g., Wang and Lu, 1993; Lu et al., 2006), and arboreal species from subtropical and temperate zones produce similar diagnostic types (e.g., Wang and Lu, 1993; Lu et al., 2006; Gao et al., 2018; Wen et al., 2018). Consequently, in extratropical forests where open-habitat grasses are absent or uncommon, very few topsoil-based phytolith–vegetation relationship calibrations are available (e.g., An et al., 2015; Dunn et al., 2015; Biswas et al., 2021; Pei et al., 2021), underscoring that extratropical region-specific calibration is still of great importance for future global dataset comparisons.
In East Asia, the broadleaved evergreen forest represents the climax vegetation of the subtropics and is a product of the monsoonal climate (Hou, 1982). Subtropical forest occupies 25% of China’s total land area and 71% of the total forest area in the global subtropics (Corlett and Hughes, 2015). These forests provide invaluable ecological, economic, social, and aesthetic benefits, particularly in the areas of biodiversity conservation, wood products, food and medicinal provisions, and regulation of regional and/or local hydroclimate (Bonan, 2008). Most of the original natural forest, however, has been removed by intensive agricultural and human disturbance, and has now been replaced by young secondary forests and monocultural plantations, except at high elevations (Corlett and Hughes, 2015). Various forest community types, including both pristine and human-disturbed communities, provide ideal areas to calibrate the phytolith–vegetation relationship in extratropical zones, and doing so would also help evaluate the effect of climate and humans on forest composition, structure, and evolution.
Previous phytolith reference investigations have demonstrated that phytolith types and production associated with broadleaf trees in northern (temperate) and southern (subtropical) China have no detectable differences (cf. Wang and Lu, 1993; Lu et al., 2006; An et al., 2015; Gao et al., 2018) despite tremendous variations in regional climate and forest type. This suggests diagnostic phytolith morphotype(s) that could directly distinguish subtropical forest from temperate forest in China is lacking. However, using morphological and statistical approaches, several recent studies have indicated that phytolith analysis should be considered a reliable tool for specifying forest communities and distinguishing grasslands from forested habitats in the northern temperate zone (Gao et al., 2018). For the subtropical evergreen forest zone, where grass is usually absent or uncommon and evergreen vegetation displays less seasonality (Corlett and Hughes, 2015), the number of phytolith-based studies related to subtropical non-grass and dicot species is quite limited. Phytolith assemblages from subtropical topsoil under different vegetation communities are still understudied, and this has hampered the application of phytolith analysis to paleoecological reconstructions in the subtropics. To overcome this limitation, analyses of topsoil phytolith assemblages and present vegetation could provide important information on representation, abundance, and characteristics of phytoliths in subtropical forests, and thus provide a fundamental reference for the interpretation of the fossil phytolith assemblages preserved in geological archives within this region.
The research reported here investigates the potential and limitations of phytolith assemblages for reconstructing vegetation and tree cover density in the subtropical zone. This initial investigation was accomplished by studying topsoil phytolith assemblages under different vegetation communities along an elevation transect in subtropical mountains of southeastern China. Referring to all available modern phytolith data, this work examines how modern vegetation communities in the monsoonal subtropical forest can be discriminated with phytolith assemblages. The resulting phytolith-based vegetation estimates are compared to satellite data to assess the potential for using phytolith assemblages as interregional and taxa-free proxies of vegetation coverage. The following questions are addressed: (1) Do phytolith assemblages reliably distinguish different forest communities within the subtropical zone? (2) What is the most important factor governing the variability in topsoil phytolith assemblages? (3) Can phytolith analysis serve as an alternative or complementary proxy to pollen? To answer the last question, the efficacy of phytolith analysis is further assessed using a modern pollen rain dataset collected from the same transect (Qiu, 1993).
To study a vegetation community with minimum anthropogenic disturbance, the Daiyun Mountains National Nature Reserve (25°38′07″-25°43′40″N, 118°05′22″-118°20′15″E) in central Fujian province of southeastern China was selected. The national reserve was created to preserve the natural subtropical mountain forest ecosystem, which represents one of the most common forest ecosystems in southeastern China (Lin, 2003). Within the core reserve area, farming and stockbreeding are not allowed.
The Daiyun Mountains region is characterized by a maritime monsoon climate. The lowest mean monthly temperatures occur in January and range from 6.5 to 10.5°C; the highest temperatures occur in July and vary from 23.0 to 27.5°C (Lin, 2003). Mean annual temperature for the study area ranges from 15.6 to 19.5°C, while mean annual precipitation in the region extends from 1,700 to 2,000 mm. More than 85% of the annual precipitation falls from March to September each year. The yearly average relative humidity is above 80%.
The average elevation of the reserve is more than 1,200 m, with a maximum elevation of 1,856 m, which represents the second tallest mountain in Fujian Province. Because of the significant elevation differences, the natural vegetation varies from broadleaf evergreen forest (900–1,000 m), broadleaf evergreen-deciduous mixed forest (1,000–1,300 m), coniferous-broadleaf mixed forest (1,100–1,300 m), warm/temperate coniferous forest (1,300–1,500 m), to evergreen shrub-meadow (>1,500 m). The natural variation in forest communities along the elevation gradient, as well as their climatic differences, provides a unique opportunity to verify the applicability of using phytolith assemblages to differentiate forest communities in the subtropics of China.
In October 2020, 14 topsoil samples were collected from the different vegetation communities along the elevation gradient of the Daiyun Mountains (peak elevation of 1,664 m). The samples were collected from south to north on 14 contiguous plots located along a 700-m elevation transect (Figure 1). Each plot was 10 × 10 m2, except those for shrub-meadow samples, which spanned 2 × 2 m2. Each sample consisted of 3–5 subsamples (5 × 5 × 1 cm3) of soil or litter collected at the four corners and center of each quadrat and then mixed together. Each mixed sample represents the average of the modern phytolith grains produced by the decomposition of above-ground vegetation over a few years. The geographical coordinates, elevation, and dominant species for each quadrat are summarized in Table 1.
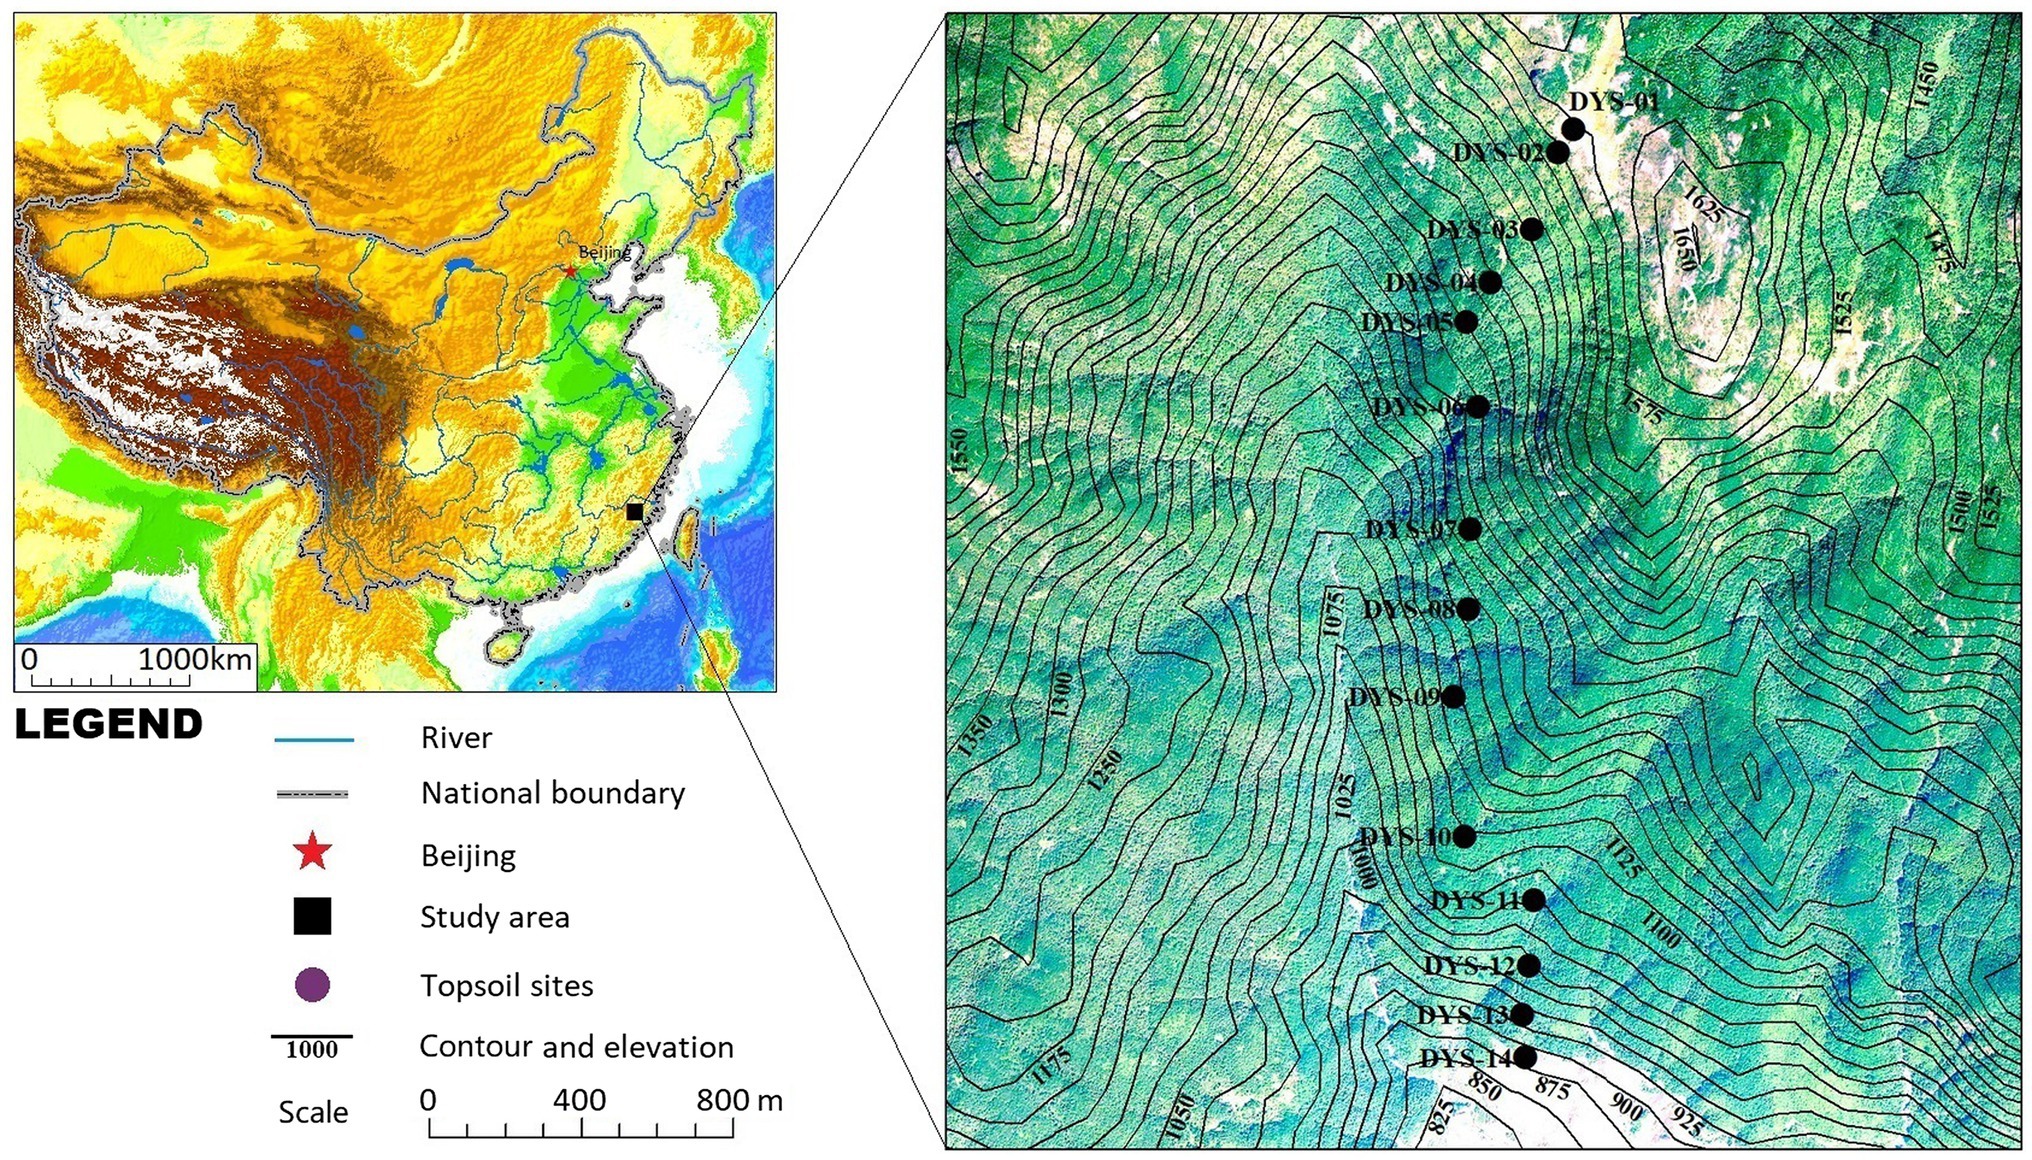
Figure 1. Location of the study area and topsoil sampling sites (Table 1) along the elevation gradient in the Daiyun Mountains, southeastern China.
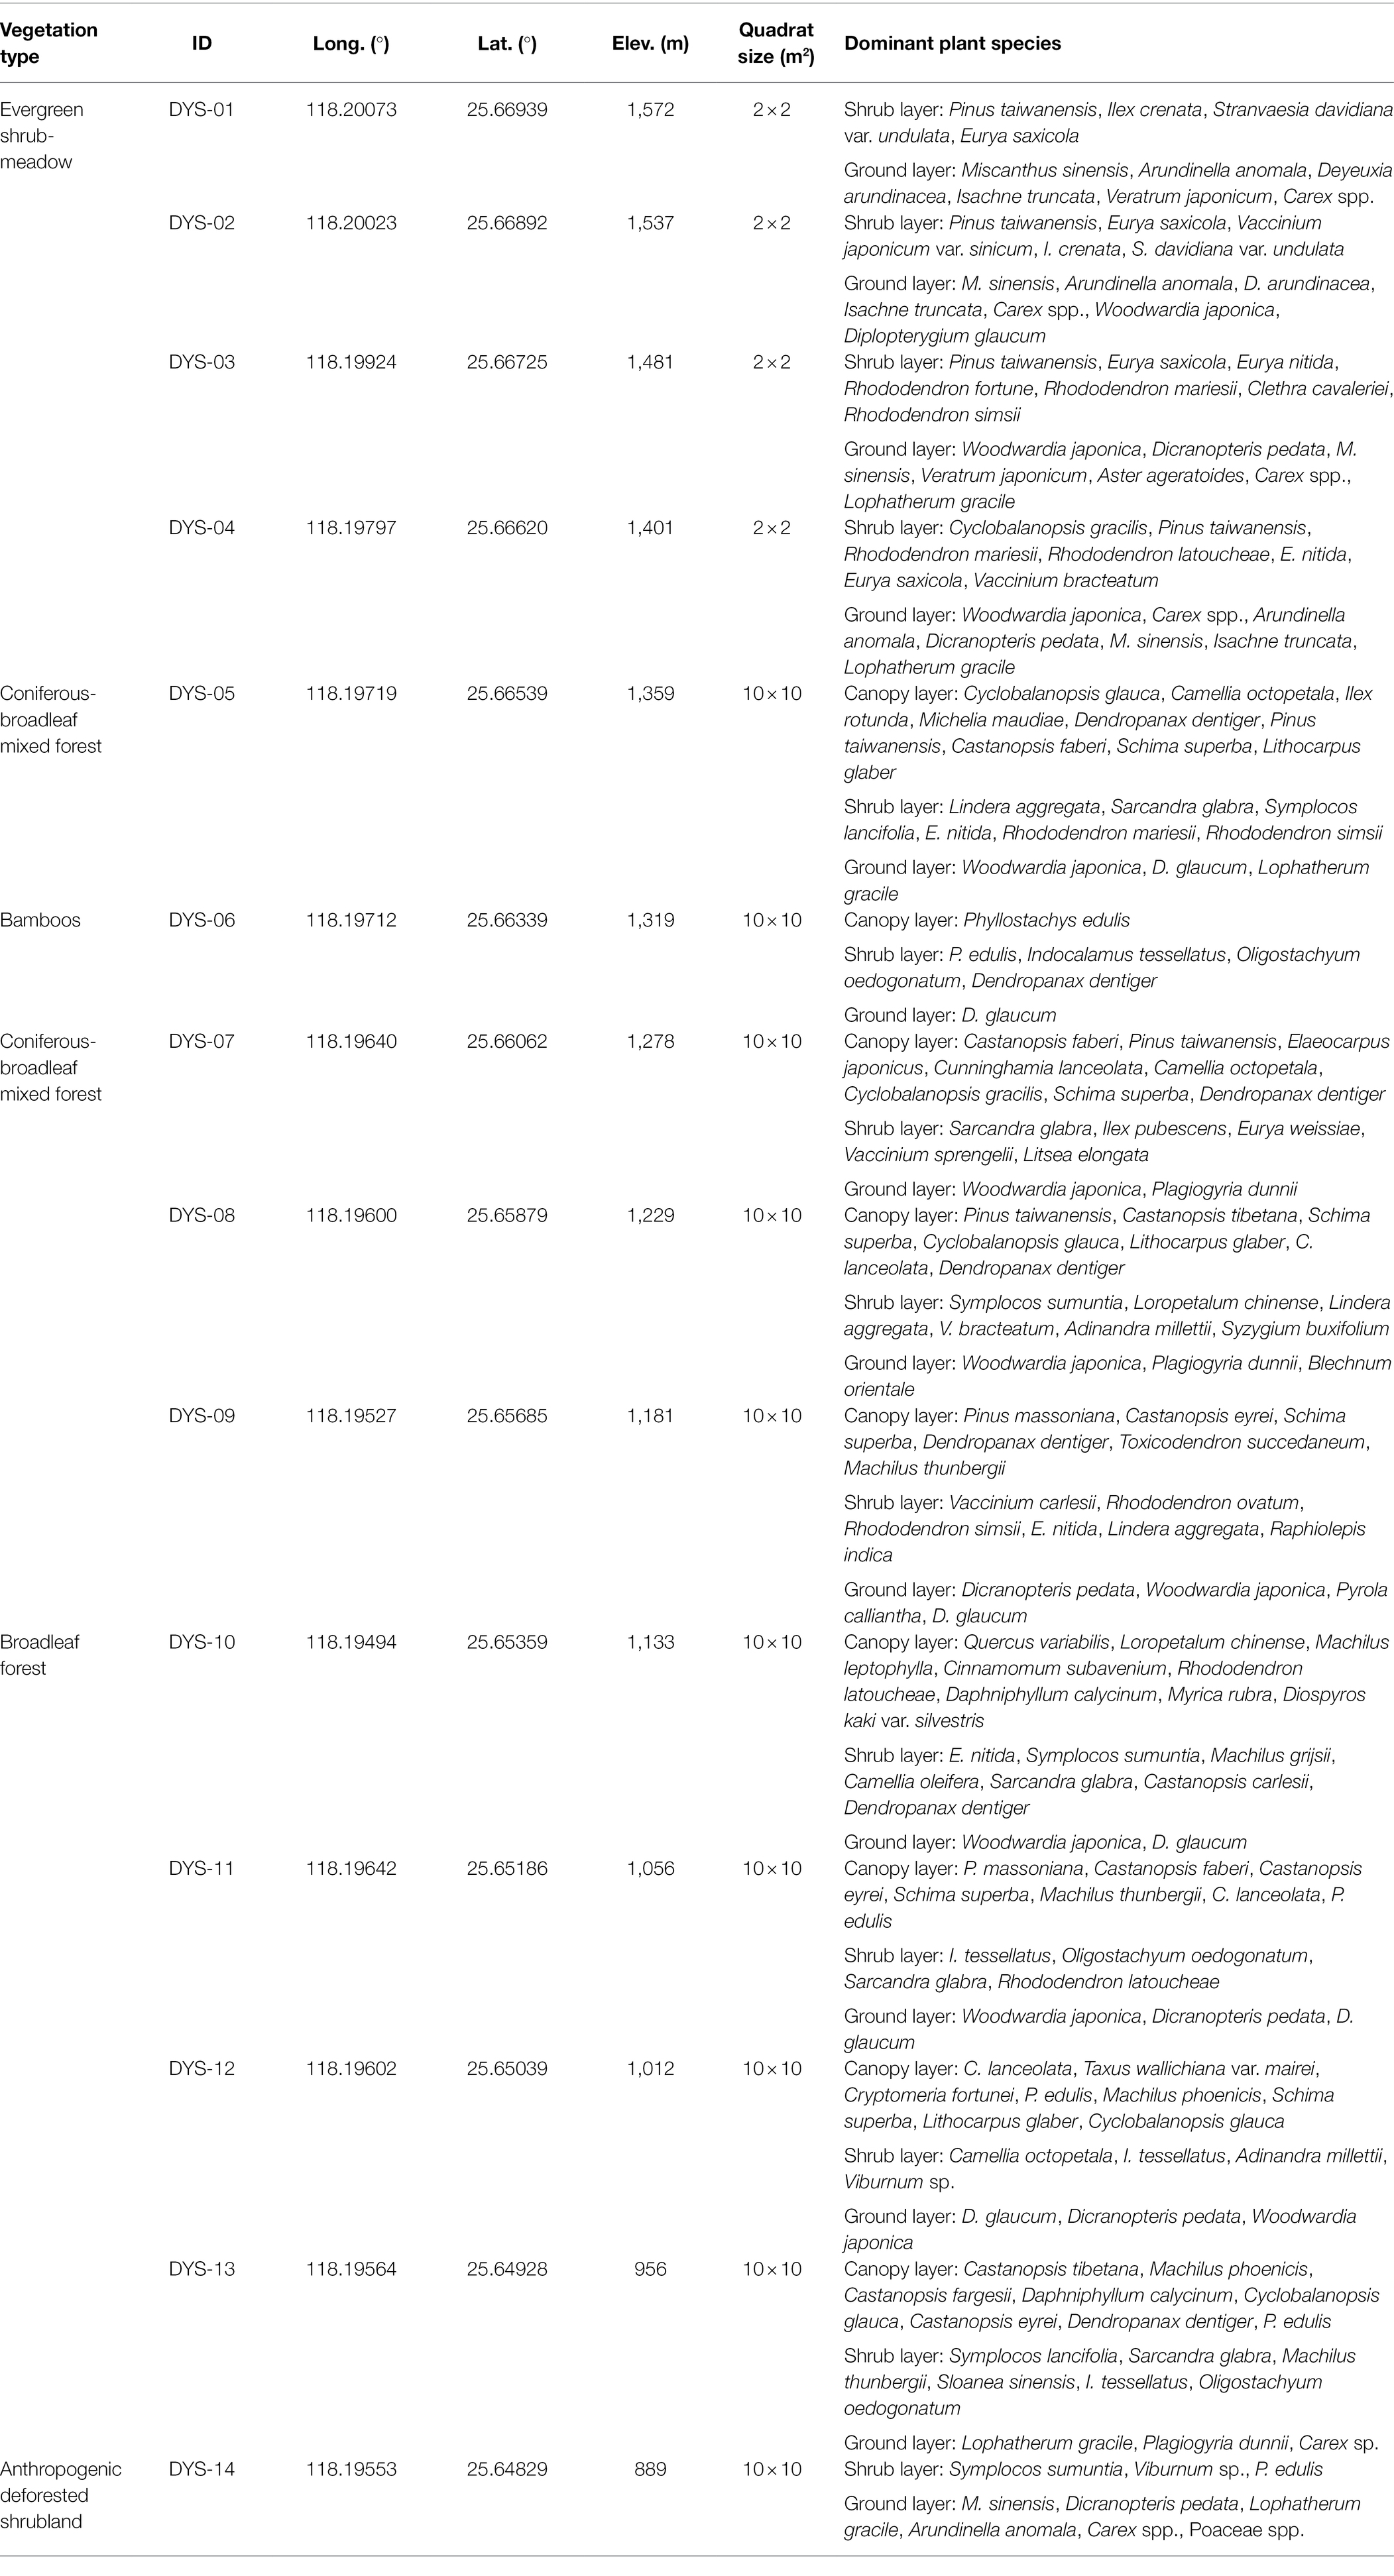
Table 1. Location, elevation, and dominant plant species for topsoil samples collected in the Daiyun Mountains.
Phytoliths were extracted from the approximately 5 g subsamples of the collected topsoil using a modified version of the Piperno (1988) method (Wang and Lu, 1993). Each subsample was treated with 10% HCl to remove carbonates. Organic matter was removed using 65% HNO3 in a 70°C water bath. The remaining material was then subjected to gravity sedimentation separation to remove suspended clays (repeated 3–5 times) until the pH was neutralized. Phytoliths were extracted through heavy liquid (ZnBr2) flotation at a density of 2.35 g/cm3. After cleaning, each sample was rinsed in distilled water and ethanol and placed on slides in Canada balsam for counting and storage. Phytoliths larger than 10 μm were identified mainly following the classification system used by Lu et al. (2006) and Gao et al. (2018) and with reference to the classification systems of Twiss et al. (1969). Phytolith identification, photographing, and counting (usually >300 diagnostic per sample) were performed at 600x magnification using an Olympus BX53 optical microscope at Xiamen University. Phytoliths were named according to the International Code for Phytolith Nomenclature 2.0 (International Committee for Phytolith Taxonomy (ICPT), 2019).
The annual and monthly climate datasets for each site (including temperature, precipitation, relative humidity, etc.) were interpolated from a network of 59 meteorological stations (Supplementary Figure S1) in Fujian Province provided by the National Climate Center, China Meteorological Administration,1 for the period from 1981 to 2010. Digital elevation model (DEM, 30 m) data were obtained from the NASA Shuttle Radar Topography Mission (SRTM) Global 1 arc second dataset (NASA, Jet Propulsion Laboratory (JPL), 2013). Based on climate data from, and geographical coordinates of, each station (Supplementary Figure S1), and with the aid of a geographical information system (GIS), multiple regression and residue correction methods were used to interpolate climate data for each sample site. The specific interpolation and calculation processes, as well as model performance details, are available in Liu et al. (2014).
The vegetation structure and canopy information for each sample quadrat was retrieved from long-term average (1988 to 2020) Landsat 4–8 satellite images. In this study, Enhanced Vegetation Index (EVI) and Normalized Difference Vegetation Index (NDVI) were calculated for each quadrat. All of these indices were obtained from EROS Science Processing Architecture (ESPA)2 on-demand interface, which offers Landsat 4–5 Thematic Mapper (TM), Landsat 7 ETM+, and Landsat 8 Operational Land Imager (OLI) original surface reflectance, metadata, and spectral indices. Quantitative tree cover data for the topsoil sample quadrats were extracted from a 2000–2012 averaged tree canopy cover dataset (Hansen et al., 2013). Although the spatial resolution of Landsat imaginary (30 × 30 m) and our sample quadrat size (10 × 10 m) differ, the Landsat imagery is of the finest resolution obtainable and is sufficient to allow an estimation of the ability to reconstruct vegetation structure characteristics from phytoliths. The interpolated climate parameters and vegetation indices for each plot appear in Table 2.
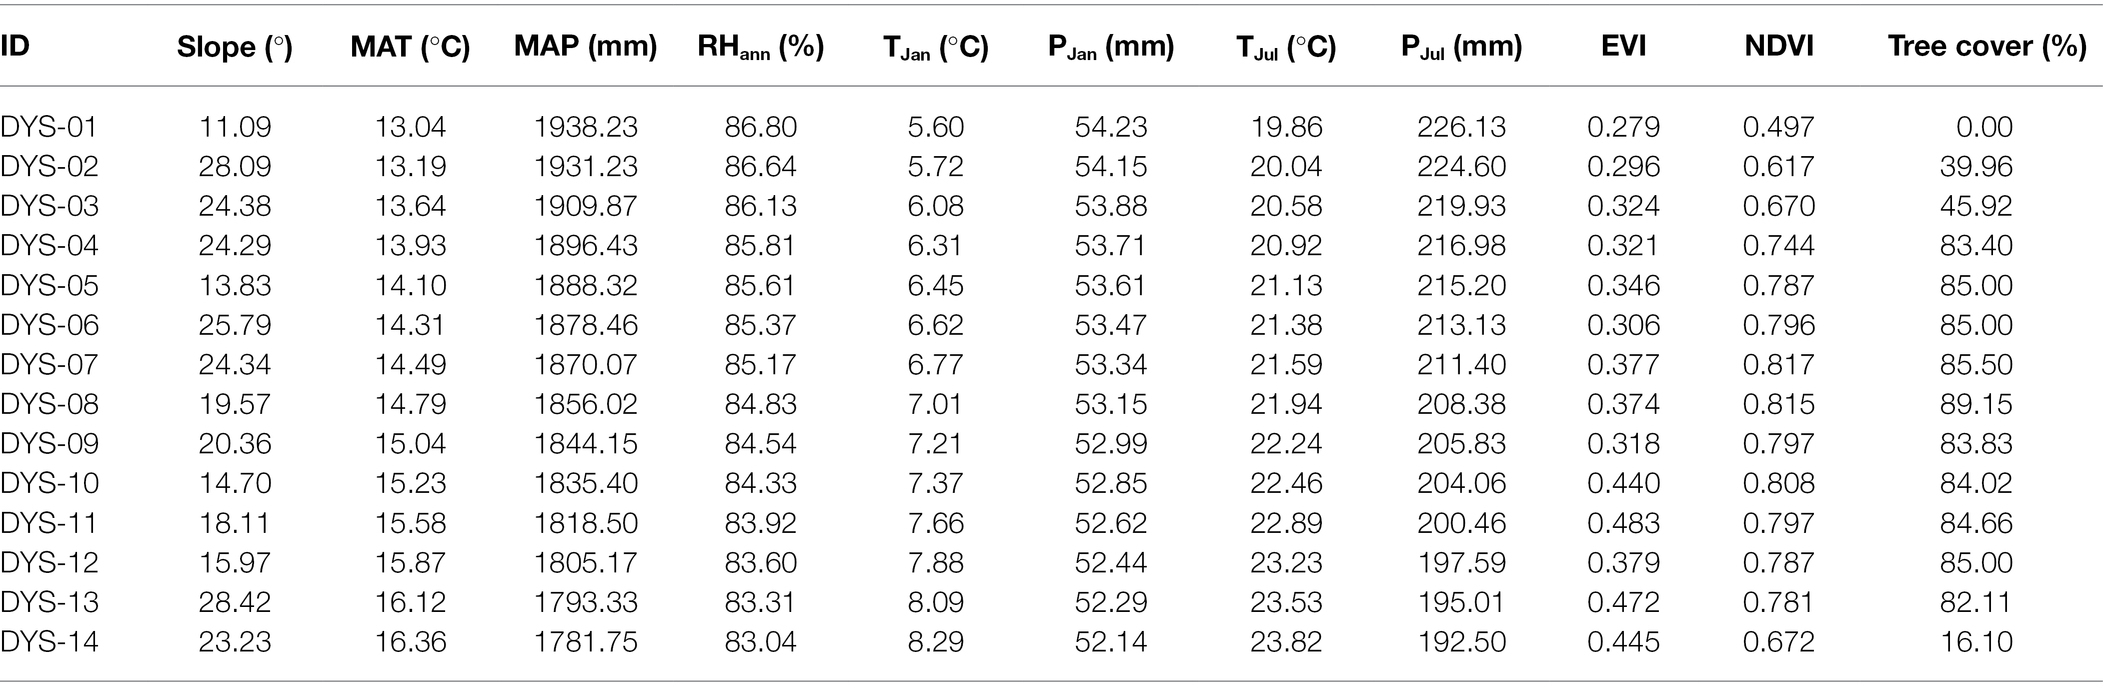
Table 2. Climate parameters and vegetation indices for samples collected along an elevation gradient in the Daiyun Mountains, southeastern China.
The percentage of each phytolith type (or taxon) was calculated as a relative frequency with respect to the total phytoliths counted per sample. Diagrams of the relative frequency results were created using TILIA software (Grimm, 1992). Detrended correspondence analysis (DCA) of phytolith assemblages (not shown) demonstrated relatively short environmental gradients in the dataset, thus, redundancy analysis (RDA) was used for constrained ordination analysis. Prior to analysis, phytolith abundances for each plot were Hellinger-transformed and the environmental parameters were standardized. Ordination analysis and RDA plots were performed using the vegan 2.5–7 package (Oksanen et al., 2020) in R. Weighted averaging partial least squares (WAPLS) regression was used to quantitatively reconstruct vegetation indices for the study region with the WAPLS() function in the rioja package of R (Juggins, 2020). All statistical analyses were performed in R 4.0.2 (R Core team, 2020) with RStudio v 1.3.1073 (RStudio team, 2020).
Twenty-six phytolith morphotypes were recovered from 14 surface soil samples collected from the Daiyun Mountains (Supplementary Table S1; Figure 2). The phytolith assemblage is shown in Figure 2, and a complete table of all phytolith types identified and counted is available as a supplementary table (Supplementary Table S1). Variations exist within the phytolith assemblages of each vegetation community and inter-plot. This section focuses on both different communities and inter-plot comparisons.
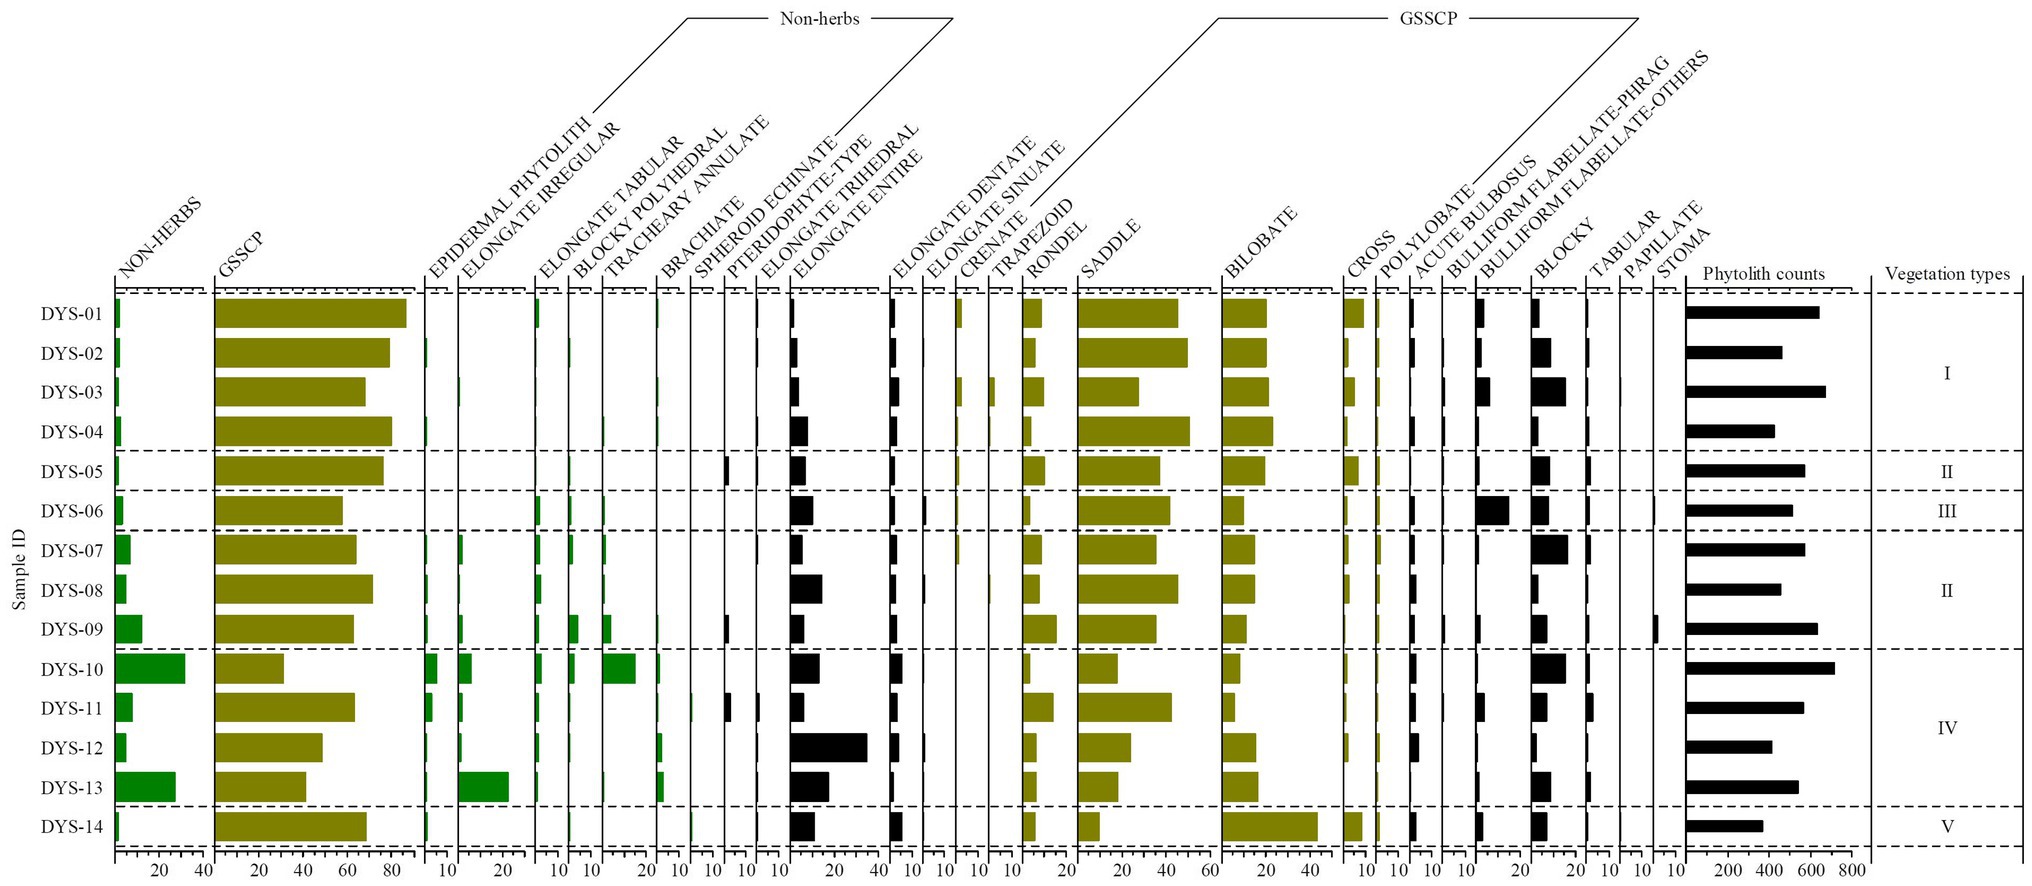
Figure 2. Frequency diagram of phytolith morphotypes observed in topsoil from elevation quadrats in the Daiyun Mountains, China. See Supplementary Table S1 for the full list of phytolith types counted and raw counts per sample. Group I represents evergreen shrub-meadow plots, Group II represents coniferous broadleaf mixed forest plots, Group III represents bamboo forest plot, Group IV represents broadleaf forest plots, and Group V represents anthropogenic deforested shrubland plots, respectively.
Four plot samples were collected under evergreen shrub-meadow (DYS-01, 02, 03, 04, Table 1). The phytolith assemblages in soils of this community were dominated exclusively by grass silica shot-cell phytoliths (GSSCP), particularly SADDLE, BILOBATE, RONDEL, and CROSS, at more than 78% (Figures 2, 3). SADDLE phytoliths alone constituted a significant portion of this phytolith assemblage (43% on average). The frequency of SADDLE phytoliths in this community exceeded that found for this phytolith type in samples from the other communities (Figure 2), suggesting contribution from Poaceae in the evergreen shrub-meadow. BULLIFORM FLABELLATE were observed in low amounts (3–6%) within these samples but its mean frequency was higher in the evergreen shrub-meadow than in any of the other communities. Arboreal phytolith frequencies were lower in this community than in any of the other natural vegetation communities analyzed (NON-HERBACEOUS mean < 2%). The majority of NON-HERBACEOUS phytoliths consisted of ELONGATE TABULAR, a characteristic phytolith morphotype of woody plants, especially from coniferous trees (Gao et al., 2018).
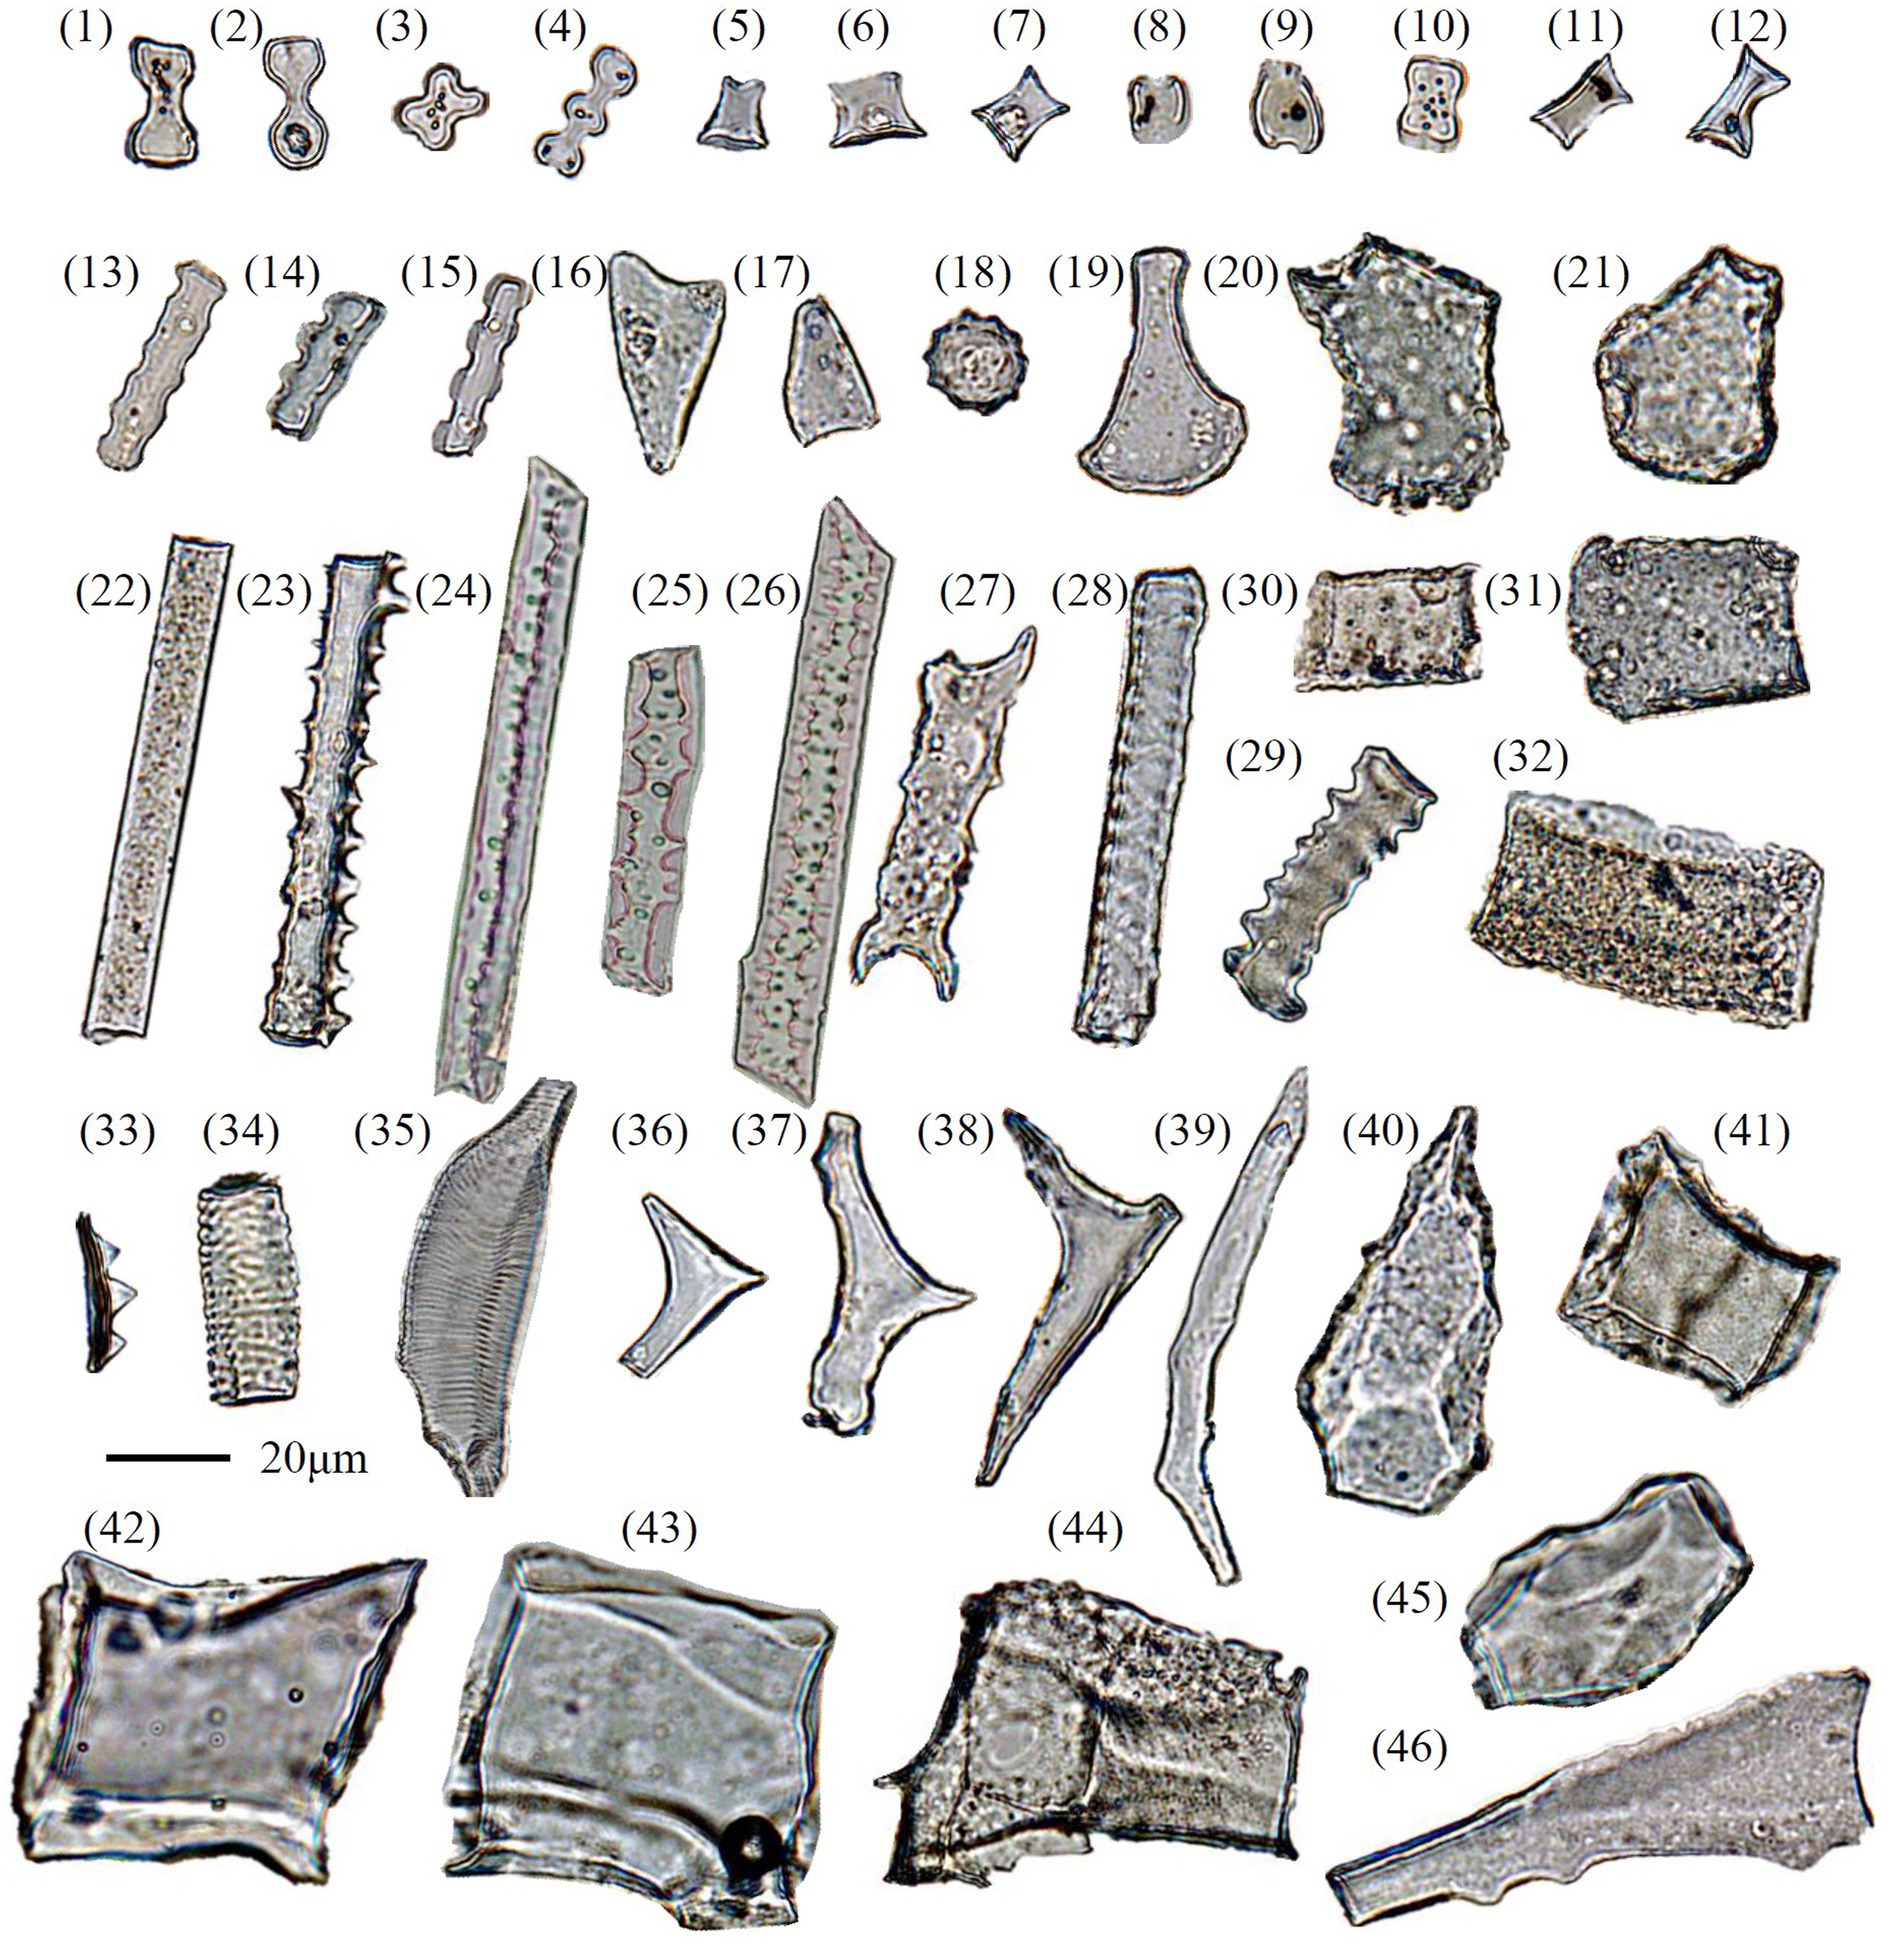
Figure 3. Microphotographs of selected phytolith types recovered from topsoil samples under different vegetation communities in the Daiyun Mountains, southeastern China. (1–2) BILOBATE; (3) CROSS; (4) POLYLOBATE; (5–7) RONDEL; (8–12) SADDLE; (13–15) CRENATE; (16–17) ACUTE BULBOSUS; (18) SPHEROID ECHINATE; (19–21) BULLIFORM FLABELLATE; (22) ELONGATE ENTIRE; (23, 27, 29) ELONGATE DENTATE; (24–26) ELONGATE SINUATE (Pteridophyte, cf. Lu et al., 2006); (28) ELONGATE TABULAR; (30–32) BLOCKY; (33) PAPILLATE; (34–35) TRACHEARY ANNULATE/HELICAL (woody species, cf. Lu et al., 2006; Wen et al., 2018); (36–38) BRACHIATE (woody species, cf. Lu et al., 2006; Wen et al., 2018); (39) ELONGATE GENICULATE (woody species, cf. Lu et al., 2006; Wen et al., 2018); (40,45) BLOCKY POLYHEDRAL (woody species, cf. Lu et al., 2006; Wen et al., 2018); (41–44) BLOCKY (woody species, cf. Lu et al., 2006; Gao et al., 2018); (46) unclassified (woody species?).
Coniferous-broadleaf mixed forest plots are represented by four topsoil samples (DYS-05, 07, 08, 09, Table 1). The phytolith assemblage from coniferous-broadleaf mixed forest quadrats was similar to that of evergreen shrub-meadow, particularly in terms of high GSSCP and low arboreal frequencies (Figure 2). Some differences, however, still exist. Samples from this community exhibited a slightly higher percentage of NON-HERBACEOUS phytoliths (>6% on average), compared to less than 2% in samples from evergreen shrub-meadows. The surface soil phytolith assemblage reflected the observed vegetation inventory with the increasing contribution of woody species. The frequency of GSSCP (68%), however, was lower than from evergreen shrub-meadow. SADDLE and BILOBATE phytoliths occurred in lower frequencies than they did in the evergreen shrub-meadow, likely because of the decrease in Poaceae abundance and richness (see Supplementary Table S1). Another distinctive feature of the phytolith assemblage under coniferous-broadleaf mixed forest was the presence of PTERIDOPHYTE-TYPE phytoliths, although their percentage was not high (about 1% on average).
Due to its comparatively narrow environmental gradient, only one subsample (DYS-06) was collected from the bamboo forest plot. GSSCP (58%) dominated its phytolith assemblage. Here, however, the composition of GSSCP was dominated by SADDLE with a notable decrease in the frequencies of BILOBATE, RONDEL, and CROSS phytoliths compared to other plots (Figure 2). One distinctive feature of the bamboo forest phytolith assemblage is the higher percentage of BULLIFORM FLABELLATE types (15%) than was found in any other studied plot (Figure 2). Morphology investigations suggested that most of the BULLIFORM FLABELLATE and some of the SADDLE phytoliths were produced by Bambusoideae (cf. Supplementary Figure S2 and Gu et al., 2016; Li R. et al., 2017). NON-HERB phytoliths occurred at a moderate level, again reflecting the contribution from woody species.
Four independent quadrat samples (DYS-10, 11, 12, 13) came from the broadleaf forest plots. The majority of phytolith samples obtained from the broadleaf forest plots showed a significant increase in ELONGATE ENTIRE (20%) but decreases in grass silica short cell phytoliths (GSSCP mean: 46%). NON-HERBACEOUS phytoliths, such as BLOCKY POLYHEDRAL, ELONGATE TABULAR, and TRACHEARY ANNULATE types, were consistently present at relatively low levels in the phytolith assemblages despite broadleaf trees being the most abundant species in the vegetation inventory (Table 1). TRACHEARY ANNULATE and the summed NON-HERBACEOUS phytoliths, however, reached their highest frequencies of the bulk phytolith assemblage (about 18%), undoubtedly reflecting the dominance of woody species in this vegetation community (Figure 2). In particular, in quadrat DYS-10, TRACHEARY ANNULATE phytoliths (Figure 3) accounted for 15% of the total phytoliths present and represent by far the largest occurrence of arboreal phytoliths. Understory taxa, for which data were not recorded in the botanical inventories, were relatively abundant (Figure 2) in the bulk phytolith assemblages in this community and consisted of plants from the Panicoideae (average 12%), Pooideae (average 7.5%), Chloridoideae (average 1.5%), and to a lesser extent, ferns (average 0.7%).
Only a single plot (DYS-14) was sampled within the human-disturbed shrubland (deforested evergreen broadleaf forest). The phytolith assemblage for this plot displayed similarities with assemblages from the evergreen shrub-meadow but differences were also visible (Figure 2), especially in the frequencies of SADDLE (10%), BILOBATE (43%), and CROSS (8%). The deforested shrubland had the highest frequency of Panicoideae (mean: 51%) phytoliths (BILOBATE and CROSS) among all sample studied (Figure 2 and Supplementary Table S1). The differences in GSSCP frequencies reflect the floristic inventory (Table 1), whereas the subfamily Panicoideae dominated the understory layer of the deforested shrubland. SADDLE no longer dominated the phytolith assemblage and presented in low amounts (<10%), which is in contrast to their widespread occurrence in the natural shrub-meadow and coniferous-broadleaf mixed communities at higher elevation sites (Figure 2). A few NON-HERBACEOUS phytoliths were identified but at very low frequencies (Figure 2). Generally, the good accordance between the phytolith assemblage and the botanical checklist suggests that phytoliths could serve as a useful indicator to identify anthropogenic deforestation.
Almost all phytolith morphotypes, except the PTERIDOPHYTE-TYPE (PTE), ELONGATE SINUATE (ELO_SIN), RONDEL (RON), and BLOCKY (BLO), showed significant correlation with elevation (Figure 4). The NON-HERBACEOUS phytolith category, which is mainly composed of BLOCKY POLYHEDRAL, TRACHEARY ANNULATE, BRACHIATE, SPHEROID ECHINATE, ELONGATE IRREGULAR, ELONGATE TABULAR, and EPIDERMAL types, showed negative correlations with GSSCP (r = −0.84, p < 0.01, n = 14). With an increase in elevation, the percentages of GSSCP increased, whereas the ELONGATE and NON-HERB phytolith decreased (Figures 2, 4).
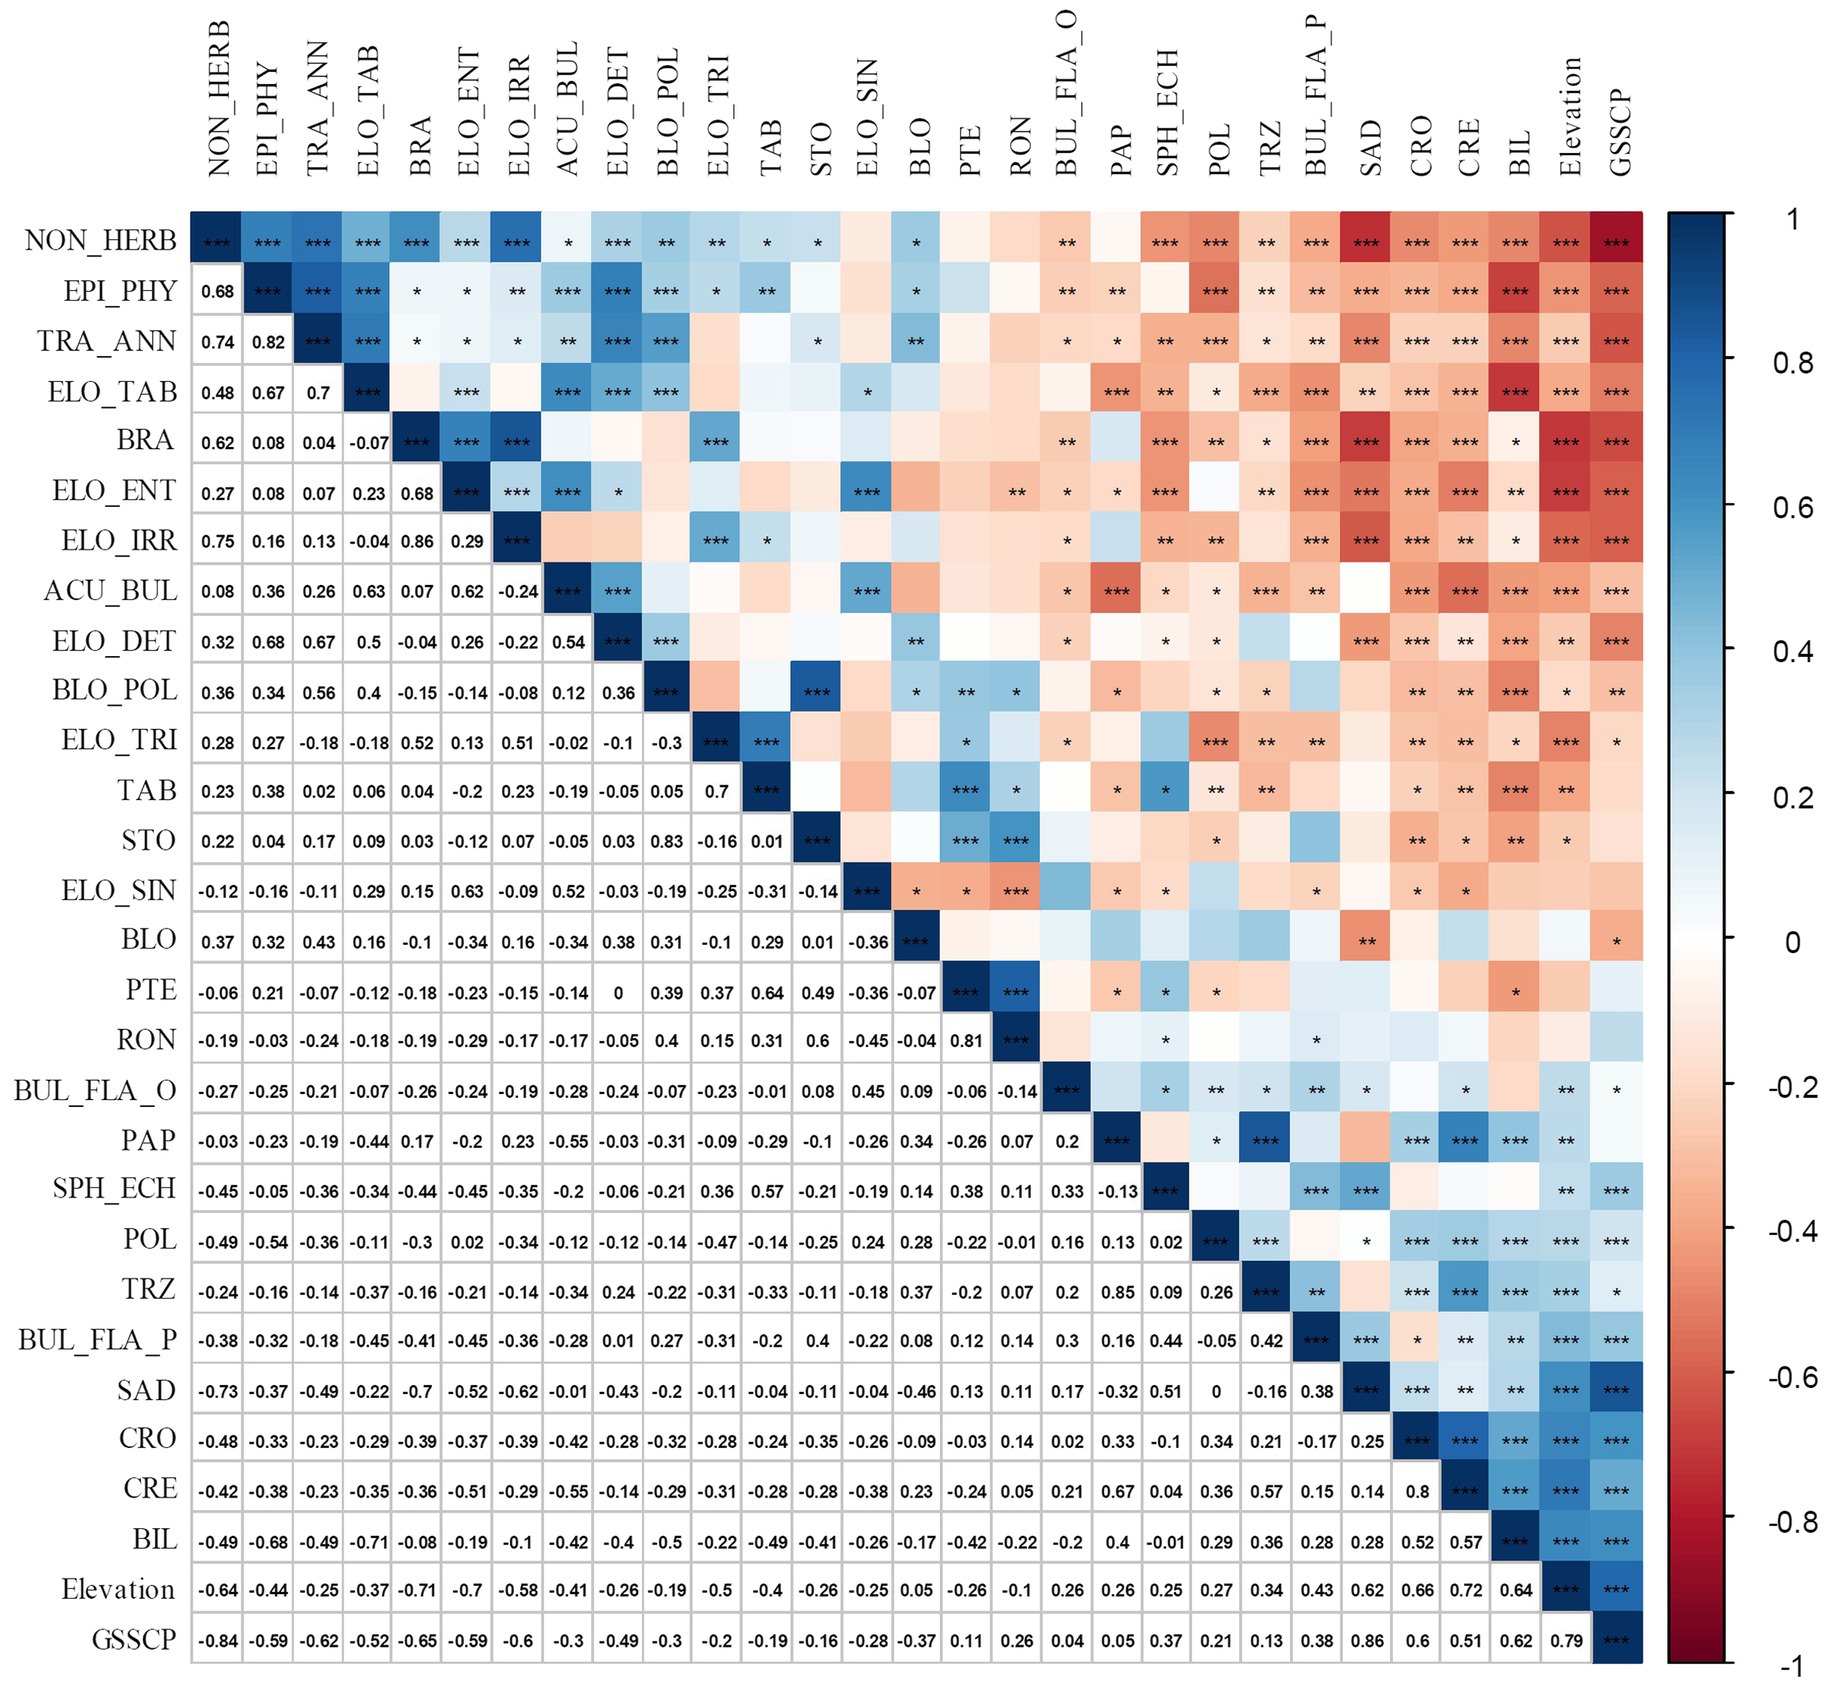
Figure 4. Correlation matrix made using the R package “corrplot,” between phytolith morphotype’s percentage and environmental parameters for the topsoil plots collected in the Daiyun Mountains. The legend on the right side of the diagram shows the Pearson correlation coefficients with their corresponding colors. Positive correlations are displayed in blue and negative correlations in red. *, **, and ***denote the statistical significance at α = 0.05, α = 0.01, and α = 0.001, respectively. Phytolith codes (abbreviations) used here are referred to International Committee for Phytolith Taxonomy (ICPT) (2019). Particularly, EPI_PHY denotes EPIDERMAL PHYTOLITH; ELO_IRR denotes ELONGATE IRREGULAR; ELO_TAB denotes ELONGATE TABULAR; BRA denotes BRACHIATE; PTE denotes PTERIDOPHYTE-type; BUL_FLA_P denotes BULLIFORM FLABELLATE that is produced by Phragmites; BUL_FLA_O denotes general BULLIFORM FLABELLATE; TAB denotes TABULAR; STO denotes silicified STOMA.
Detrended correspondence analysis (DCA) suggested that a linear response model is appropriate for these data. The length of the first DCA axis was 1.238 (Table 3), indicating that the samples represent a small fraction of the environmental gradient and that species responded to the environmental change linearly. Redundancy analysis (RDA), a linear ordination method, was then applied to the phytolith data. The RDA specified that the included environmental factors explained 51.78% of the variation in the phytolith assemblages across all sites. The first and second RDA axes explained 27.96 and 9.73%, respectively, of the total variation in the phytolith assemblage (Table 3). The first RDA axis had a relatively high eigenvalue and captured 53.99% of the total explainable variation among the phytolith–bioclimate relationship. The first two axes together captured 72.70% of the explainable variations. As shown in Figure 5, almost all explanatory variables were separately distributed along the RDA axis 1. Among these variables, elevation showed a negative correlation with axis 1, whereas the vegetation indices were plotted toward the positive direction of axis 1 (Figure 5). It is evident that axis 1 represents the vegetation change induced by the elevation gradient: more negative sample loadings denote higher elevation and lower canopy coverage, whereas more positive loadings suggest lower elevation and denser canopy coverages (Figure 5).

Table 3. Summarized results of detrended correspondence analysis (DCA) and redundancy analysis (RDA) on the phytolith assemblages recovered from the topsoil samples collected in the Daiyun Mountains. SD denotes standard deviation units for DCA.
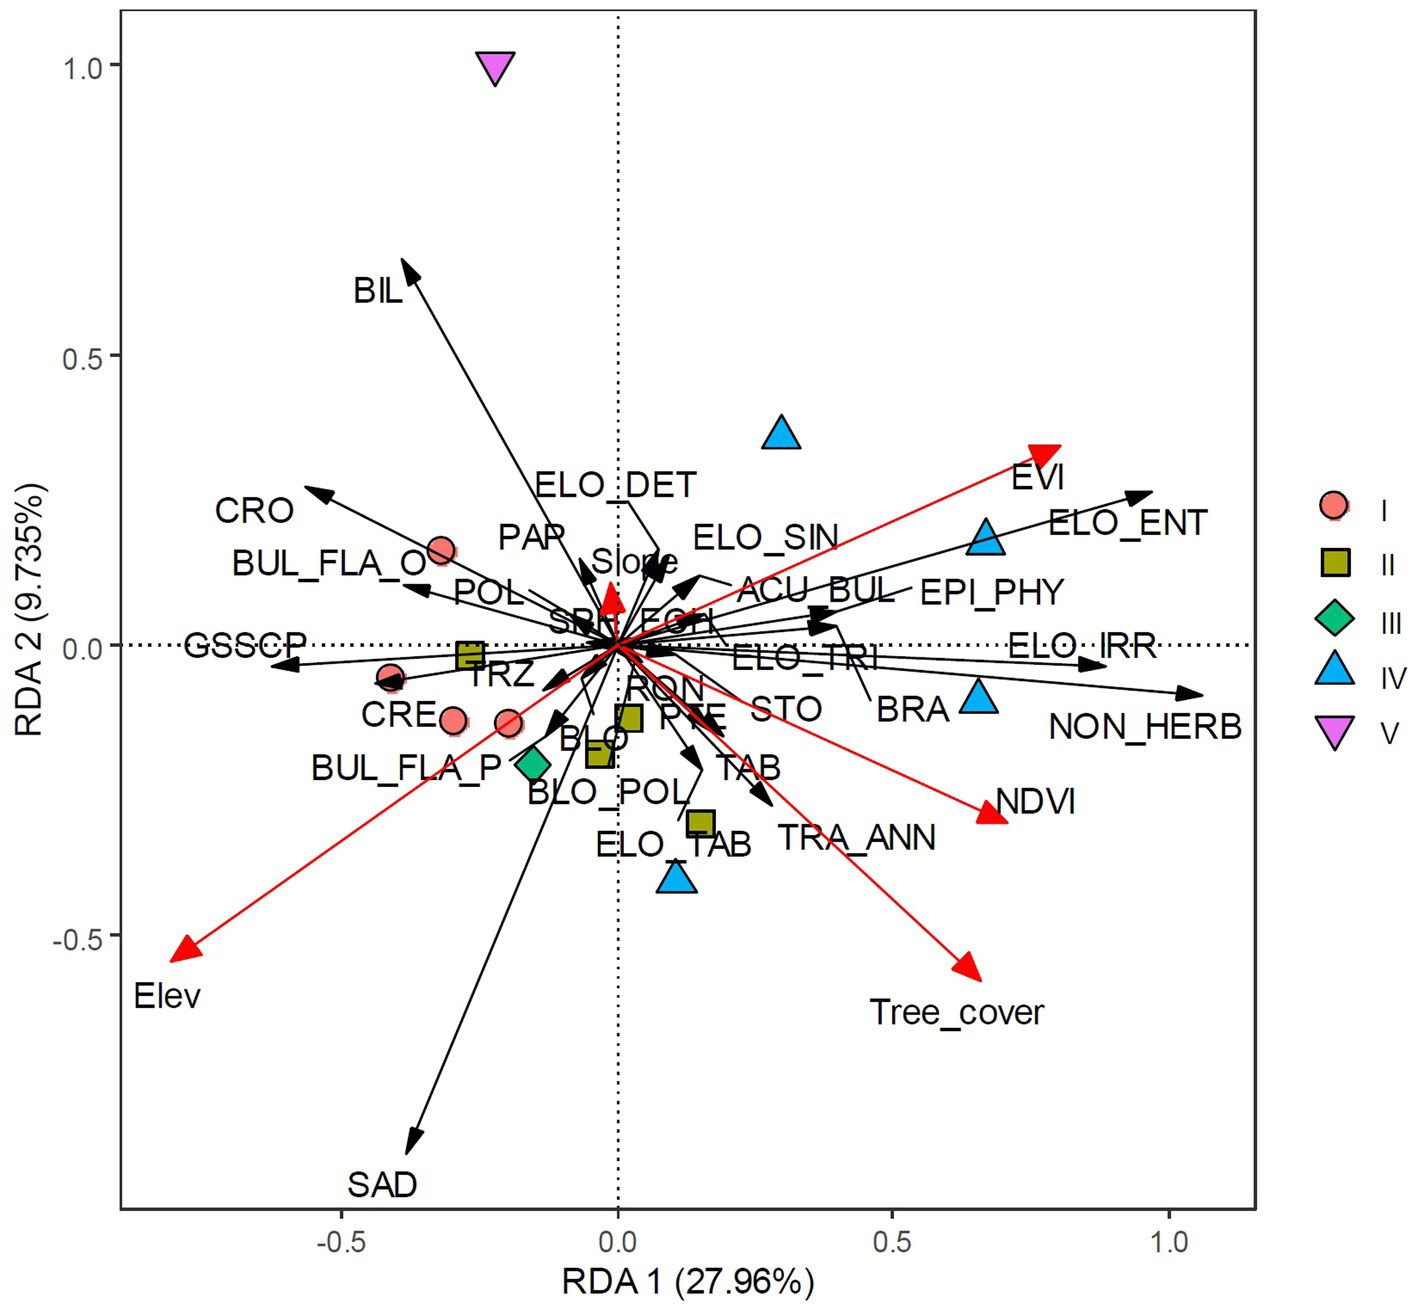
Figure 5. Redundancy analysis (RDA) plot of environmental parameters and phytolith taxa. Scatter points show the first two axis scores. Group I represents evergreen shrub-meadow plots, Group II represents coniferous broadleaf mixed forest plots, Group III represents bamboo forest plot, Group IV represents broadleaf forest plots, and Group V represents anthropogenic deforested shrubland plots, respectively.
Due to the elevation and vegetation gradient, different phytolith morphotypes can be classified into two distinct groups along the RDA axis 1. Grass silica short cell phytoliths (GSSCP), such as SADDLE, BILOBATE, CROSS, CRENATE, TRAPEZOID, and POLYLOBATE, were plotted separately from various ELONGATE types, ACUTE BULBOSUS, and NON-HERBACEOUS phytoliths (Figure 5). Quadrats sampled from high elevation sites (evergreen shrub-meadow, coniferous-broadleaf mixed forest) were plotted along the left direction of RDA axis 1, indicating negative loadings of GSSCP along axis 1 (Figure 5). In contrast, the positive component loadings of other phytoliths were recovered from low to middle elevation plots (broadleaf forest). The second RDA component (axis 2), however, did not show such a clear trend. The single sample collected under the anthropogenically deforested shrubland, which is characterized by high BILOBATE frequency, is quite different from the other sites (Figure 5).
Employing WA-PLS regression, the phytolith-based modern canopy tree coverage estimates matched satellite data well (Hansen et al., 2013). Table 4 lists the performance of transfer functions established to estimate the enhanced vegetation index (EVI) and canopy coverage for each quadrat in the Daiyun Mountains (NDVI were not estimated because tree coverage gives similar information with NDVI, r = 0.9386, p < 0.001). The five-component WAPLS model had the most robust performance statistics (Table 4; Figure 6) for both EVI and tree coverage, with satisfactory estimates of percent variance explained and root mean squared error (RMSE) for EVI (R2 = 0.9633, RMSE = 0.0125) and tree coverage (R2 = 0.8531, RMSE = 10.9516), respectively (Figure 6). This suggests that the potential is great for canopy coverage to be quantitatively estimated in subtropical areas.

Table 4. Performance of WAPLS model relating to EVI and canopy tree coverage and phytolith variance.
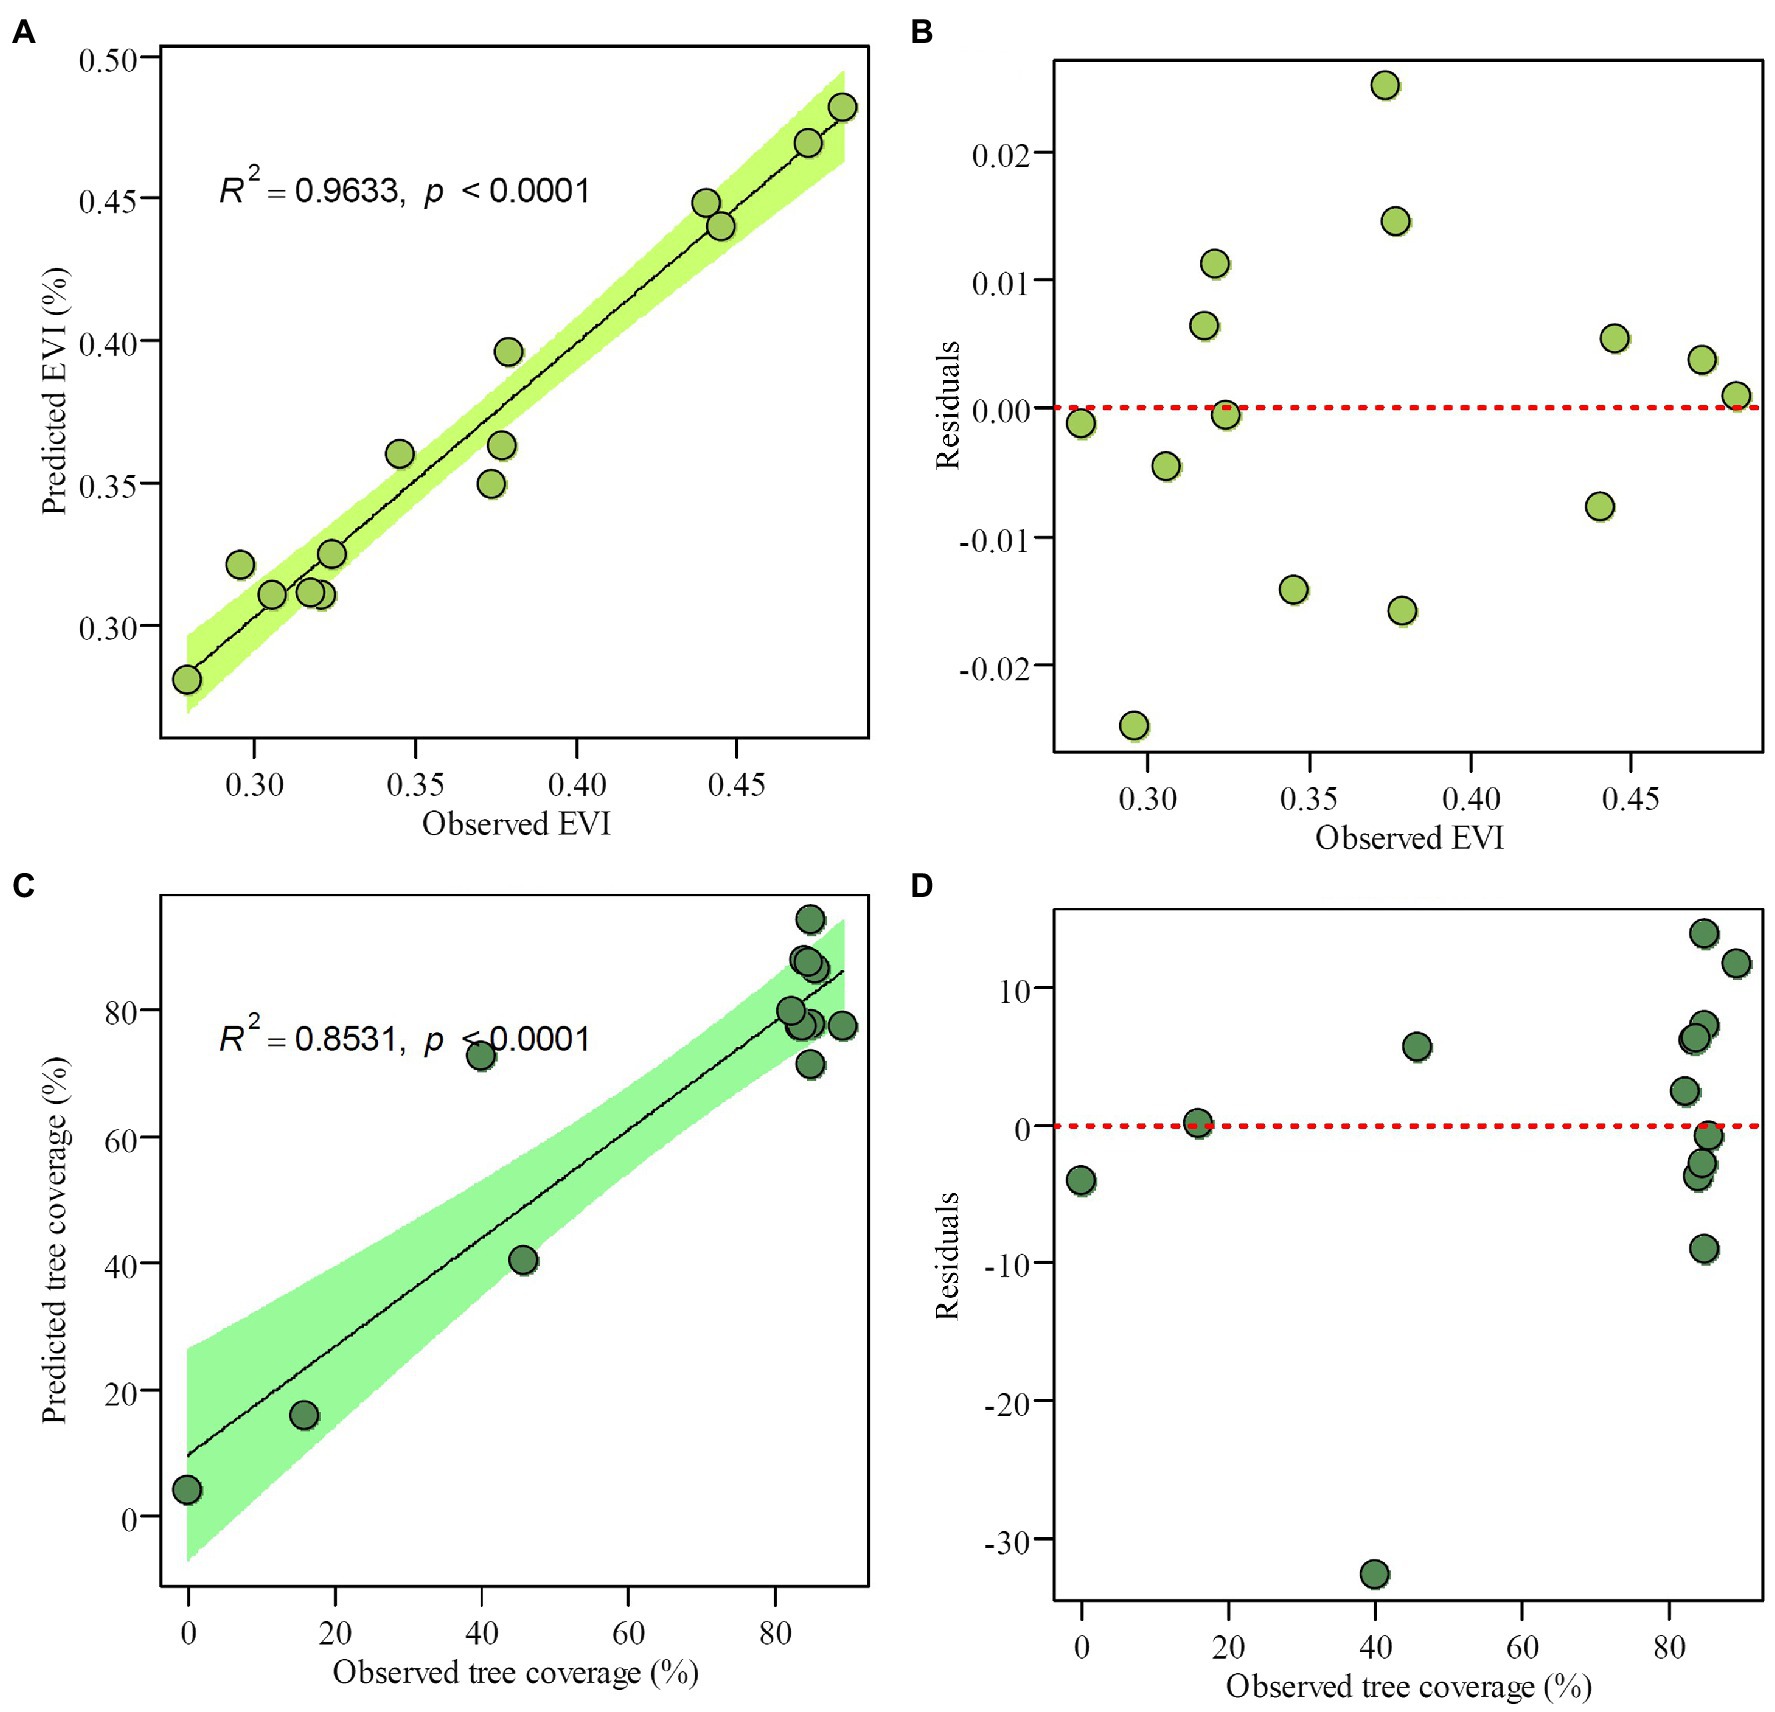
Figure 6. The 5-component WA-PLS inference model results for (A) observed versus predicted enhanced vegetation index (EVI), (B) observed EVI versus residual values, (C) observed versus inferred tree coverage (%), and (D) observed tree coverage versus residual values.
Comparing the phytolith assemblage to the floristic checklist, generally good accordance was found between the topsoil phytolith assemblages (Figure 2) and the plant taxa documented in the specific vegetation plot inventory (Table 1). For example, in the evergreen shrub-meadow plots, various Poaceae and Cyperaceae species were encountered during the field survey, and this is faithfully reflected by the dominance of GSSCP. However, differences still exist. For instance, Phragmites BULLIFORM FLABELLATE (<1% on average) was recovered from three of four evergreen shrub-meadow plots, but Phragmites species were not mentioned in the species list. Moreover, ferns were recorded in the plant checklist in the bamboo forests but diagnostic phytolith morphotypes of pteridophyte were not recognized within the surface soil phytolith assemblages. Those phytoliths may represent inheritance from past vegetation or input from a nearby quadrat transported into the study plot by aeolian processes or surface runoff (Dickau et al., 2013; Watling et al., 2016). The contribution of those extraneous phytoliths might increase the uncertainty of topsoil phytolith-based climate or vegetation estimation models, especially when dramatic differences exist between current and past vegetation. However, as reflected by the phytolith frequency diagram, the contribution of extraneous phytoliths to the bulk phytolith assemblages, was comparatively low (despite not being able to accurately estimate how many phytoliths were inherited or transported from past/nearby vegetation). Our phytolith sampling array generally reflected the alternations in natural vegetation communities: the percentages of GSSCP increased from lower elevation sites to higher elevation sites, whereas the silica long cell phytolith and NON-HERB phytolith decreased (Figures 2, 4).
Differences in representativeness between arboreal and herbaceous (or grass) phytoliths, however, were also significant in our study, which is consistent with previous calibrations (Piperno, 1988; Wang and Lu, 1993; Bremond et al., 2004; Hyland et al., 2013; Crifò and Strömberg, 2021). Topsoil phytolith assemblages of all samples were dominated exclusively by GSSCP, suggesting a strong over-representativeness of GSSCP to Poaceae species (Figure 2). Even in the broadleaf forest quadrat, NON-HERBACEOUS phytoliths, accounted for less than 18% (on average) of the bulk phytolith assemblage, whereas GSSCP represented approximately 46% of the total phytoliths (Figure 2). Since GSSCPs are produced abundantly by all parts of Poaceae, grass presence in the samples might be significantly over-represented. In contrast, as most arboreal phytoliths are produced in the leaves of the trees in subtropical evergreen forests, the under-representation of arboreal phytoliths to trees is not surprising (Piperno, 1988; Wang and Lu, 1993). Future additional calibrations are needed to address the representativeness differences between arboreal and herbaceous phytoliths, as has been done in palynology (e.g., Sun et al., 2016; Jiang et al., 2020; Fang et al., 2022). Regardless, relative abundances of arboreal and grass phytoliths varied consistently with natural vegetation changes along the elevation gradient, suggesting that phytolith assemblages might be a useful tool for quantitative vegetation reconstruction.
Because of intense deforestation activities in subtropical evergreen forests, the natural (or less disturbed) vegetation is restricted to high mountain areas. In this study, only 14 plots were sampled under different vegetation communities along the relatively short elevation transect in the Daiyun Mountains of subtropical China. It is not possible, therefore, to establish a robust phytolith assemblage-based quantitative estimate of canopy coverage for the entire subtropics based on the results of this study alone. As shown in Table 4, although the five-component WA-PLS model predicted EVI and tree coverage in close approximation to the observations obtained from satellite imagery (Figure 6), leave-one-out cross-validation suggested that the five-component WA-PLS model did not have a strong coefficient of determination (R2 < 0.1) nor a low root mean square error of prediction. This might be attributable to the small size of the training dataset: when fewer samples are considered, the robustness of the transfer function is challenged.
Turner et al. (2021) postulated that the robustness of a transfer function depends largely on the sampling range and the continuity of modern reference sites rather than on the number of samples. Despite the short sampling transect in the present study, the tree coverage of the studied plots as estimated from satellite data ranged from 0 to 89% (Table 2), spanning a wide range of canopy coverage that may represent the different vegetation types. However, the training dataset included more dense plots (forest plots that have denser canopy coverage) than sparse plots (shrub-meadow plots with less dense canopy cover). In leave-one-out cross-validation, the removal of those less but important plot points might significantly increase the discontinuity of modern reference sites, consequently causing significant bias and decreasing the robustness of the prediction model (Table 4).
To validate the effect of a small training dataset, when the initial dataset was expanded by one time (each training subsample replicates once without incorporating any new data), the robustness of the predictive model is significantly improved (Supplementary Table S2). Cross-validation of the WA-PLS transfer function based on 28 samples yielded significantly increased coefficients of determination and much lower root mean square errors of prediction (Supplementary Table S2). The limited stability of the 14-sample-based canopy coverage prediction model is attributable to the small size of the modern sample array. Therefore, each plot included in our sample array is vital for establishing a reliable canopy coverage prediction model, and the set of all samples should be treated as a whole.
Despite the above caveats, canopy coverage in subtropical forests can be estimated effectively by topsoil phytolith assemblages. In the future, incorporating more data points from the study area might improve the transfer function. The fundamental contributions of this study, however, should remain intact: phytolith assemblages from subtropical forest topsoil are strongly connected to the openness of the landscape, and the percentage of GSSCP decreases with increasing density of canopy cover.
Comparisons between topsoil pollen and phytolith assemblages suggest that phytolith assemblages faithfully reflect the vegetation composition as well as pollen does. In forest landscapes, pollen has been considered more powerful than phytoliths because pollen bears finer taxonomic resolution to different plant species than phytoliths do (phytoliths can distinguish only grass-related landscapes). However, results of the present study suggest that, despite the dominance of the non-herbaceous Fagaceae (oaks and other genera) in this subtropical forest (Table 1), phytolith assemblages display vertical distribution patterns that are similar to topsoil pollen assemblages.
Modern pollen assemblages collected along the elevation transect in the Daiyun Mountains were dominated by Pinus, Dicranopteris, Castanopsis, and Poaceae types, which account for more than 80% of the total pollen assemblage (Qiu, 1993). Pinus has been more frequently recorded in samples from the coniferous-broadleaf mixed and broadleaf forests but was almost absent in the shrub-meadow zone. Castanopsis, which was quite abundant in field plot surveys, presented low percentages below the elevation of 1,300 m but increased significantly above 1,300 m (Figure 7A). Interestingly, arboreal pollen reached its highest frequency in the coniferous-broadleaf mixed forest but was much lower in shrub-meadow (Figure 7A). Arboreal phytoliths, in contrast, had higher frequencies in coniferous-broadleaf mixed and broadleaf forests (Figure 7A). Poaceae pollen presented higher frequencies in high shrub-meadow zones, whereas Dicranopteris was frequently recorded in the coniferous-broadleaf mixed and broadleaf forests (Figures 7B,C). Our phytolith data agree with the pollen records: GSSCP gradually increased with elevation and PTERIDOPHYTE phytoliths were occasionally recorded in forest communities (Figures 7B,C).
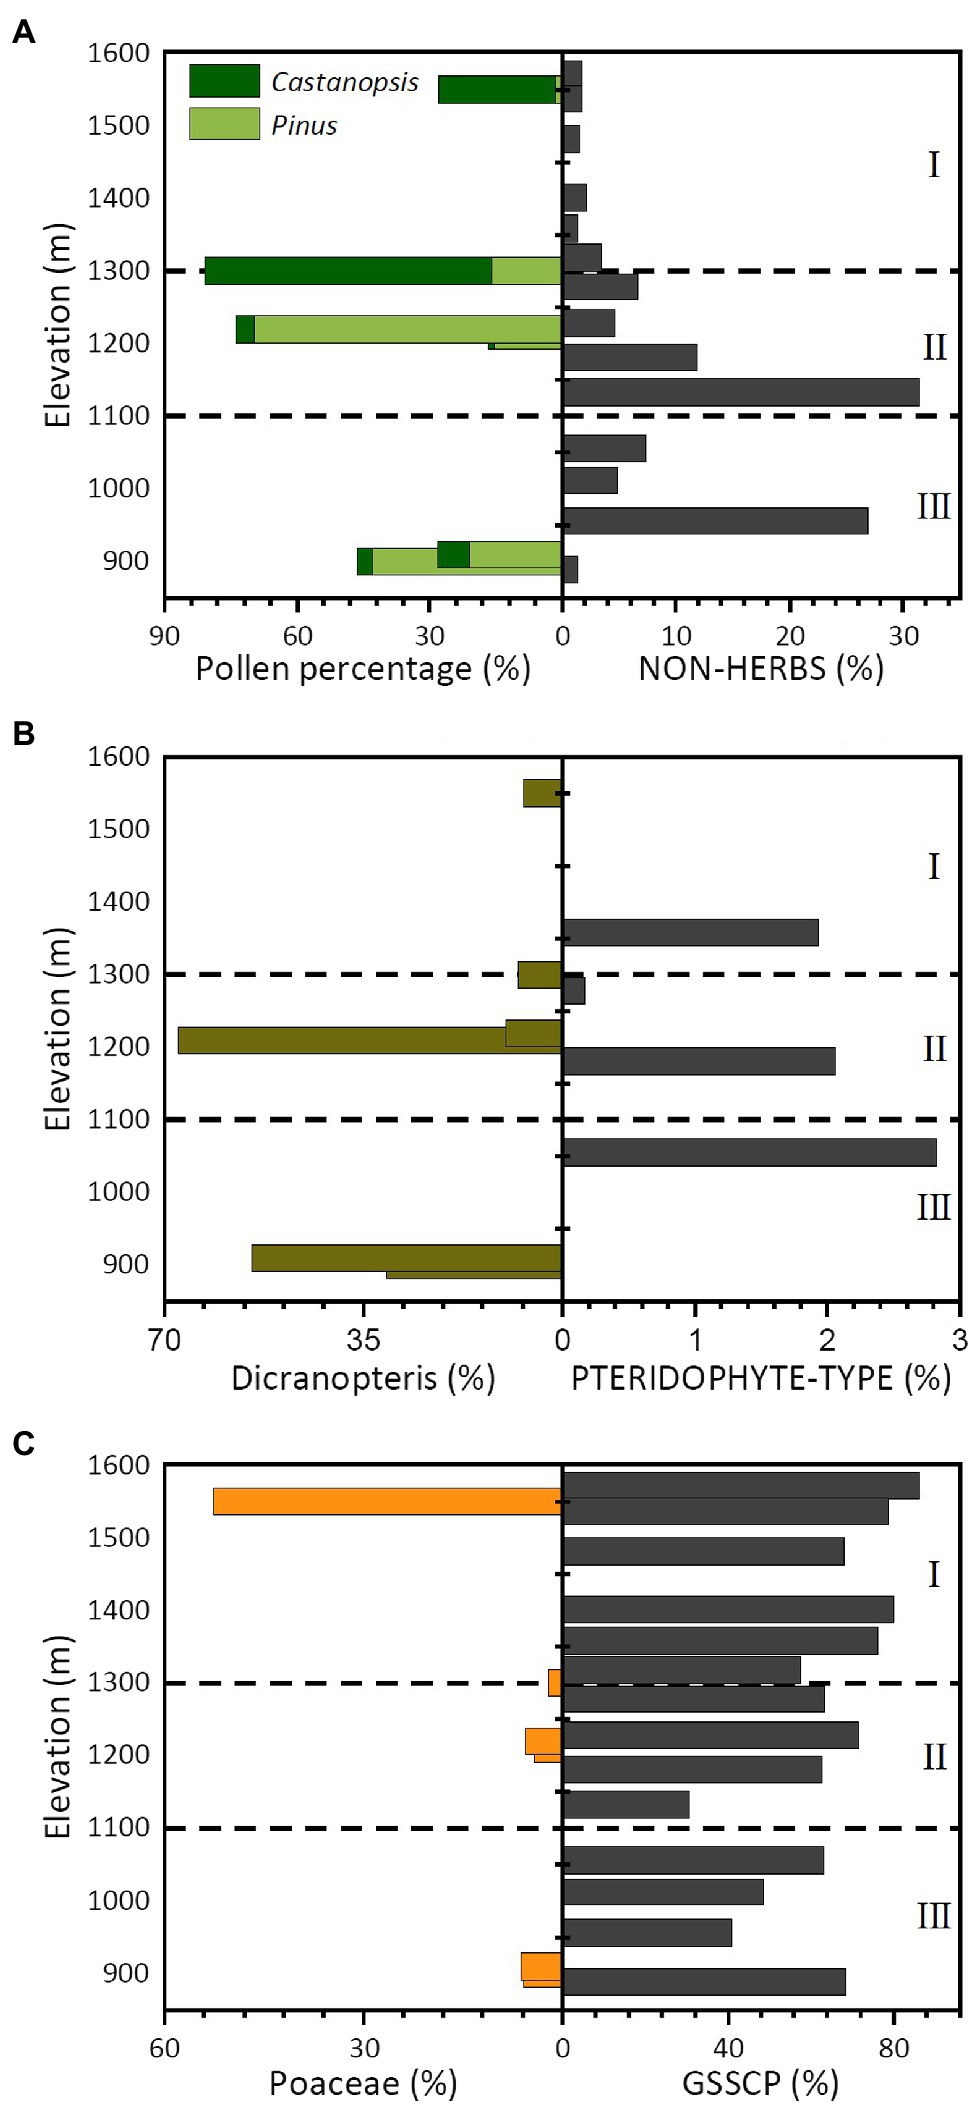
Figure 7. Bar chart showing the selected pollen (Qiu, 1993) and phytolith assemblages along the sampled elevation gradient in the Daiyun Mountains. (A) Major arboreal pollen versus Non-herb phytoliths; (B) Dicranopteris versus Pteridophyte phytoliths; (C) Poaceae pollen versus GSSCP.
Despite the general agreement, the relative abundance of each taxon shows dramatic differences between phytolith and pollen records. Arboreal pollen in coniferous-broadleaf mixed forest, for example, accounted for more than 60% of all pollen counted (Figure 7A, Qiu, 1993), but arboreal phytoliths represented no more than 6% of the phytolith assemblage. Another significant difference between pollen and phytolith records lies in their different representativeness to ferns. Dicranopteris spores represented more than 30% on average of the total pollen and spore assemblages in forest plots, whereas PTERIDOPHYTE phytoliths (Figure 7B) accounted for less than 1% of the phytolith assemblage. Phytoliths, moreover, may have significantly over-represented the presence of Poaceae (with GSSCP accounting for more than 65%), but Poaceae pollen comprised no more than 5% of the pollen assemblage under forest plots (Figure 7C).
Representativeness differences between pollen and phytoliths to different plant taxa agree with previous calibrations in the same or adjacent bioclimatic zones (e.g., Sun et al., 2016; Jiang et al., 2020; Fang et al., 2022). Pollen-vegetation relationship calibrations have found that R values of the Pinus, Castanopsis, and Dicranopteris pollen (or spores) are greater than 1 (R is the representativeness of a given pollen type, cf. Davis, 1963), indicating that those pollen and spore types may significantly over-represent their occurrence in subtropical forests (e.g., Sun et al., 2016; Jiang et al., 2020; Fang et al., 2022). This explains why the percentage of Pinus pollen was greater than 40% in broadleaf forest plots despite the almost total absence of Pinus species in those communities (Table 1 and Figure 7A). Strong over-representativeness was also found in Dicranopteris species, which usually occur in the ground layer of broadleaf or coniferous-broadleaf mixed forest types since they can survive better than other herbs under shady, humid habitats. Their frequency in the vegetation survey, however, was much lower than recorded Dicranopteris spores would suggest (approximately 60%). Poaceae pollen is moderately representative of Poaceae (with R value close to 1, cf. Sun et al., 2016; Jiang et al., 2020), and this explains why Poaceae pollen is a relatively good indicator of vegetation composition.
Phytoliths have the same problem with respect to representativeness differences. For instance, arboreal species might be significantly under-represented by arboreal phytoliths (e.g., Piperno, 1988; Dickau et al., 2013; Watling et al., 2016) because most arboreal phytoliths are produced in the leaves of the tree. Grasses, in contrast, are strong phytolith producers (cf. Piperno, 1988; Dickau et al., 2013; Watling et al., 2016). As a consequence, GSSCP that is diagnostic of Poaceae usually dominates the phytolith assemblages even where they are rare in the vegetation inventory.
Significant differences in dispersal, transport, and taphonomic processes are some other remaining factors accounting for the discrepancies between pollen and phytolith records. In mountainous areas, convectional uplift can cause significant upslope transportation of pollen (Qiu, 1993). Castanopsis species, for example, dominated the broadleaf forest understory (vegetation inventory) but were almost absent in the pollen assemblage. In shrub-meadow and coniferous-broadleaf mixed forest quadrats, however, Castanopsis dominated the pollen assemblage in topsoil (Qiu, 1993). The mismatch between the vegetation inventory and the topsoil pollen assemblage might be linked to the vertical transport of pollen (Qiu, 1993), causing additional complexities in interpreting the topsoil pollen assemblage accurately. Besides vertical transportation, topsoil pollen might be subject to selective preservation; thin-walled taxa may be destroyed during taphonomic processes resulting in lower percentages, while pollen taxa with thicker walls may survive and therefore accumulate in a comparably higher percentage (Mander and Punyasena, 2018; Chevalier et al., 2020; Fang et al., 2022). As a result, changes in the relative abundance of pollen assemblages may reflect taphonomic processes, rather than ecological factors (cf. Mander and Punyasena, 2018; Chevalier et al., 2020; Fang et al., 2022). For phytoliths, the aeolian transportation and selective preservation that is quite common for pollen, have less impact on soil phytolith assemblages. Due to their biogenic silica structure, phytoliths are less sensitive to aerial transportation and can be better preserved in the soil than pollen. Phytoliths faithfully recorded the above-ground vegetation and have finer taxonomic resolution for subfamilies of Poaceae. Despite the strong under-representation of arboreal species, the topsoil phytolith data in this study agree with pollen records (Qiu, 1993), reflecting the gradual canopy coverage change along the elevation gradient, and are less likely to be influenced by post-deposition transportation and taphonomic alterations.
Availability of sunlight to the ground layer has been shown to be the primary factor shaping the composition of and variation in herbaceous communities in time and space (e.g., Neufeld and Young, 2003; Niinemets, 2010; Plue et al., 2013; Mestre et al., 2017). The effective amount of radiation reaching the forest floor is determined by forest structural characteristics and tree species (e.g., Plue et al., 2013; Mestre et al., 2017). In evergreen broadleaf forests (lower elevation plots in this study), trees transmitted only a small proportion of sunlight to the forest floor, which depressed the grass richness and diversity but actively encouraged growth of ferns and sedges (strong shade-casting species). In other words, understory plants in dense evergreen broadleaf forests are adapted to low light availability in all seasons (Plue et al., 2013; Mestre et al., 2017). In the coniferous-broadleaf forests, however, the canopy of Pinus taiwanensis and broadleaf tree species is less dense and their leaves are substantially thinner than those of evergreen forest species. As a result, more solar radiation reaches the understory of this high elevation forest. In addition, because the coniferous trees in this area and deciduous trees drop their leaves in autumn, there exists an additional increase in light availability for the understory (Plue et al., 2013; Mestre et al., 2017). Previous field vegetation inventories in the Daiyun Mountains (Supplementary Figure S3; Dai, 2009; Zheng et al., 2016) have also shown that the composition and biodiversity of the understory herbaceous communities are mainly controlled by the sunlight reaching to the ground layer: shade-tolerant Pteridophyta and Cyperaceae dominate the ground layer in most forest quadrats and their dominance generally decrease with increasing elevation (Supplementary Figure S3; Dai, 2009; Zheng et al., 2016). Sunlight-demanding and dryness-tolerant Poaceae and Compositae start to dominate the ground layer in the shrub-meadow located at the top of the mountain (Supplementary Figure S3; Dai, 2009; Zheng et al., 2016).
The present study shows that the topsoil phytolith assemblages, although mostly produced by herbs, faithfully reflect the influence of canopy structure on understory structure and composition. Overall GSSCP richness is related to the forest type, following the order shrub-meadow > mixed forest > evergreen forest (Figure 8). This is in good accordance with field floristic studies, which have underscored that the diversity of the herbaceous layer is greater in the shrub-meadow community than in the mixed and evergreen forest. While coniferous-broadleaf forests are similar to evergreen broadleaf forests, the former may facilitate diversity and/or richness of the herbaceous layer by providing a heterogeneous environment allowing the co-existence of common shade-tolerant species along with light-demanding grasses (Plue et al., 2013; Zheng et al., 2016; Mestre et al., 2017). Canopy coverage control of sunlight remains the most likely driver behind the observed changes in phytolith assemblages. The prolonged period of quantitatively low (high canopy density) or even qualitatively decreasing light availability is likely to be the factor directly responsible for this marked decline in abundance, diversity, and/or frequency of grass short-cell phytoliths.
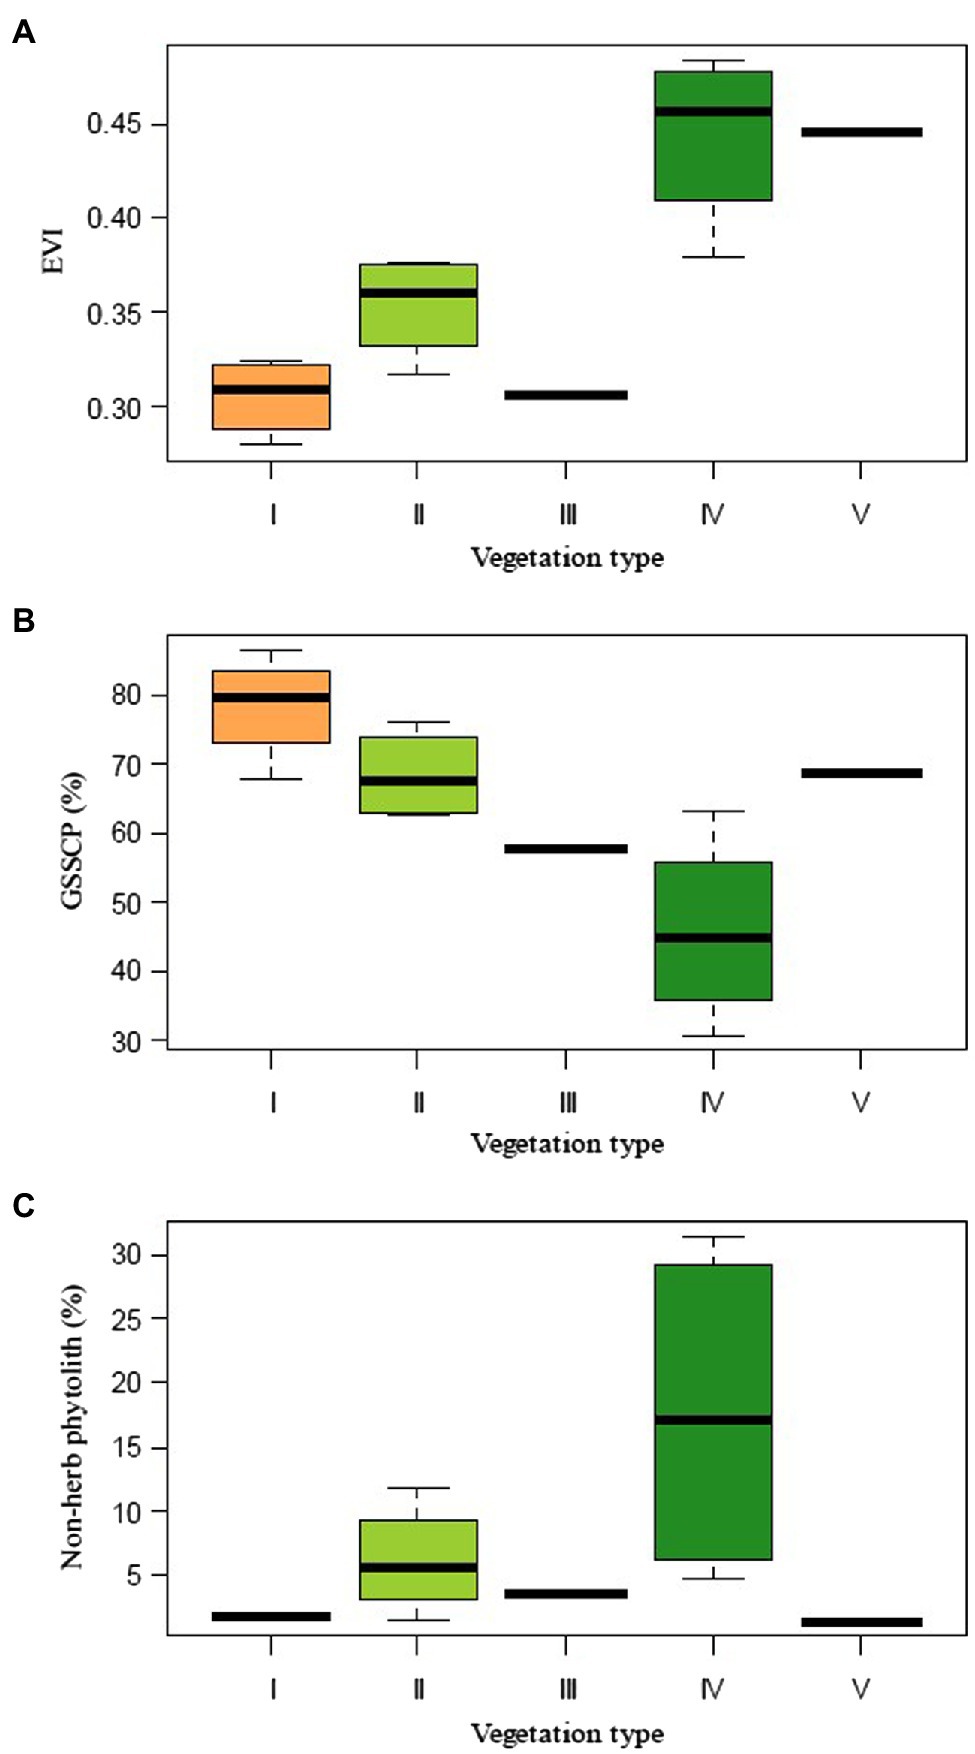
Figure 8. Summary of different vegetation index and phytolith percentages for different plant communities collected along the elevation gradient in the Daiyun Mountains. (A) Enhanced vegetation index (EVI); (B) Grass silica short cell phytolith (GSSCP); and (C) Non-herb phytolith percentages.
Using modern topsoil samples collected under different bioclimatic conditions, it has been proposed that variations in phytolith assemblages reflect changes in climate variables and therefore can be used for vegetation and climate reconstruction (e.g., Lu et al., 2006, 2007; An et al., 2015; Biswas et al., 2021). One fundamental assumption in that notion is that all species have climatic optima for efficient growth (e.g., Yu et al., 2004; Zheng et al., 2008). These optima, as well as extreme limits, can be reconstructed using pollen or phytolith evidence from plants (cf. Yu et al., 2004; Lu et al., 2006, 2007; Zheng et al., 2008).
Calibrating phytolith assemblages as a potential quantitative proxy for temperature or precipitation is more challenging than doing so with pollen mainly because of the multiplicity and redundancy characteristics intrinsic to the production of phytoliths (cf. Piperno, 1988; Barboni and Bremond, 2009). In addition, Poaceae, the most important phytolith producer, comprises about 10,000 species in approximately 700 genera that are distributed globally (e.g., Finot et al., 2011). The wide ecological amplitude of Poaceae, as well as the comparably narrow sampling gradient in the present investigation, means that a reliable transfer function which could be used to quantitatively estimate a climate variable for the subtropical area might be challenging. Because this investigation was conducted within a limited area of a 700-meter transect in the subtropical zone, the climatic gradients are limited: the mean annual temperature for each site ranges from 13.04°C to 16.36°C, whereas the mean annual precipitation varies from 1781.75 mm to 1938.23 mm (Table 2). However, the tree coverage gradient for our sampling array is relatively larger: the canopy coverage ranges from 0 to 89.15% (Table 2). Therefore, instead of trying to perform regression between climate parameters and phytolith assemblages, we here established the phytolith-based model to estimate the canopy coverage, since the most direct and intrinsic reason for changes in phytolith assemblages is change in vegetation (Dunn et al., 2015).
Due to the local depositional characteristics, phytoliths might perform better than other botanical indicators in quantitative canopy coverage reconstructions (cf. Dunn et al., 2015; Birks et al., 2016). They may help scientists better understand the ramifications that changes in global to local scale climate have on vegetation dynamics and on climate-vegetation feedbacks (e.g., Dunn et al., 2015). Caution, however, should be used when interpreting fossil (modern) phytolith assemblages because (1) Poaceae are the biggest producers of phytoliths, but also a large family whose species can adapt to different bioclimate conditions and are therefore distributed globally (e.g., Finot et al., 2011); (2) The complexity and redundancy of phytoliths may interfere with the correct identification of parent plants, especially for grass (cf. Piperno, 1988; Barboni and Bremond, 2009); (3) Differences in the representativeness of arboreal and herbaceous (particularly grass) phytoliths may lead to over-estimation of grass and underestimation of trees; (4) Anthropogenic deforestation could increase the canopy openness and consequently increase the frequencies of GSSCP (Figure 2) in a process that is independent of climate (Qiu, 1993). Caution must be exercised when using phytolith assemblages for quantitative paleoclimatic reconstruction lest it be interpreted incorrectly.
This study, along with others, contributes to the calibration of the climatic and vegetation significance of topsoil phytoliths (e.g., Lu et al., 2006, 2007; An et al., 2015; Biswas et al., 2021). The present study, however, is also important in linking phytolith assemblages to canopy coverage in the subtropical forest of China, with the frequency of grass short-cell phytoliths depending more on canopy coverage than climate factors directly. This explains topsoil phytolith investigations from the temperate forest-steppe ecotone where GSSCP account for 50 ~ 70% of the total phytolith assemblage (e.g., Li D. et al., 2017, 2018; Gao et al., 2018). Our analysis also supports the notion that human-induced deforestation may cause an increase in GSSCP that is independent of any climate variable. Future studies should collect data from different settings to understand how local climate and vegetation may change the phytolith–vegetation (climate) regressions in order to promote the application of phytolith analysis for paleoclimate and paleoelevation reconstructions in the subtropics.
This study provided fundamental information pertaining to the interpretation of fossil phytolith assemblages recovered from various sedimentary archives in the subtropics of monsoonal China. Phytoliths from 14 modern soil samples under different vegetation covers were examined and described. Analysis of topsoil samples along the elevation transect in the Daiyun Mountains revealed significant differences in phytolith morphotype composition that generally reflected species composition of the standing vegetation, especially the understory composition of different forests. While individual species cannot be detected, phytolith analysis could identify broadleaf forest, coniferous-broadleaf forest, and shrub-meadows: non-grass phytoliths appear to be the most distinctive morphotypes, but their relative abundance in vegetation might be significantly under-represented in phytolith assemblages. Grass phytoliths were the most abundant phytolith morphotypes but may over-represent the Poaceae species.
Study of phytolith–environmental relationships showed that certain morphotypes occurred preferentially in certain vegetation (climates) and at certain elevations. For example, GSSCP tended to occur in higher proportion in open habitats at higher elevations, while non-grass morphotypes occurred under mixed and broadleaf forests at lower elevations. Pteridophyta were generally more abundant in samples from moist habitats under dense broadleaf forests. The structure and openness of the canopy cover most likely modulates variations in phytolith assemblages along the evaluation gradient. We therefore established a WAPLS transfer function for future quantitative estimates of tree coverage for the study area. Our study implies that future quantitative and qualitative analyses of biogenic silica in subtropical mountainous soils (sediments) may provide a record of past fluctuations in elevation of woody versus herbaceous vegetation during the late Quaternary, triggered by variations of climate and/or by the impact of human activities. Sampling a wider range of sites across longer environmental gradients than used in this study could further improve and/or validate our understanding of the phytolith–vegetation–climate relationships.
The original contributions presented in the study are included in the article/Supplementary Material, further inquiries can be directed to the corresponding authors.
NL and FY designed the research. NL organized the field work with GT and SL. NL performed the research. NL, FY, and ZH analyzed the data. NL, DS, and FY wrote the paper. All authors contributed to the article and approved the submitted version.
This work was financially supported by the China Postdoctoral Science Foundation (Grant No. 2021M691862 to NL); the National Natural Science Foundation of China (Grant No. 42076207 to FY); and the Fundamental Research Funds for the Central Universities (Grant No. 0050-ZK1116 to FY). NL received funding from the Outstanding Postdoctoral Scholarship of the State Key Laboratory of Marine Environmental Science at Xiamen University, China.
The authors declare that the research was conducted in the absence of any commercial or financial relationships that could be construed as a potential conflict of interest.
All claims expressed in this article are solely those of the authors and do not necessarily represent those of their affiliated organizations, or those of the publisher, the editors and the reviewers. Any product that may be evaluated in this article, or claim that may be made by its manufacturer, is not guaranteed or endorsed by the publisher.
Wenwei Chen from the Daiyun Mountain National Nature Reserve Administration Bureau is acknowledged for kindly providing help during fieldwork. We thank the editor and reviewers for suggestions and comments that greatly improved the manuscript.
The Supplementary Material for this article can be found online at: https://www.frontiersin.org/articles/10.3389/fpls.2022.912627/full#supplementary-material
Alexandre, A., Meunier, J.-D., Lézine, A.-M., Vincens, A., and Schwartz, D. (1997). Phytoliths: indicators of grassland dynamics during the late Holocene in intertropical Africa. Palaeogeogr. Palaeoclimatol. Palaeoecol. 136, 213–229. doi: 10.1016/S0031-0182(97)00089-8
An, X., Lu, H., and Chu, G. (2015). Surface soil phytoliths as vegetation and altitude indicators: a study from the southern Himalaya. Sci. Rep. 5:15523. doi: 10.1038/srep15523
Barboni, D., Bonnefille, R., Alexandre, A., and Meunier, J. D. (1999). Phytoliths as paleoenvironmental indicators, west side middle Awash Valley. Ethiopia. Palaeogeogr. Palaeoclimatol. Palaeoecol. 152, 87–100. doi: 10.1016/S0031-0182(99)00045-0
Barboni, D., and Bremond, L. (2009). Phytoliths of east African grasses: an assessment of their environmental and taxonomic significance based on floristic data. Rev. Palaeobot. Palynol. 158, 29–41. doi: 10.1016/j.revpalbo.2009.07.002
Barboni, D., Bremond, L., and Bonnefille, R. (2007). Comparative study of modern phytolith assemblages from inter-tropical Africa. Palaeogeogr. Palaeoclimatol. Palaeoecol. 246, 454–470. doi: 10.1016/j.palaeo.2006.10.012
Birks, H. J. B., Felde, V. A., Bjune, A. E., Grytnes, J.-A., Seppä, H., and Giesecke, T. (2016). Does pollen-assemblage richness reflect floristic richness? A review of recent developments and future challenges. Rev. Palaeobot. Palynol. 228, 1–25. doi: 10.1016/j.revpalbo.2015.12.011
Biswas, O., Ghosh, R., Agrawal, S., Morthekai, P., Paruya, D. K., Mukherjee, B., et al. (2021). A comprehensive calibrated phytolith based climatic index from the Himalaya and its application in palaeotemperature reconstruction. Sci. Total Environ. 750:142280. doi: 10.1016/j.scitotenv.2020.142280
Bonan, G. B. (2008). Forests and climate change: forcings, feedbacks, and the climate benefits of forests. Science 320, 1444–1449. doi: 10.1126/science.1155121
Boyd, M. (2005). Phytoliths as paleoenvironmental indicators in a dune field on the northern Great Plains. J. Arid Environ. 61, 357–375. doi: 10.1016/j.jaridenv.2004.09.015
Bremond, L., Alexandre, A., Hély, C., and Guiot, J. (2005). A phytolith index as a proxy of tree cover density in tropical areas: calibration with leaf area index along a forest–savanna transect in southeastern Cameroon. Glob. Planet. Change 45, 277–293. doi: 10.1016/j.gloplacha.2004.09.002
Bremond, L., Alexandre, A., Véla, E., and Guiot, J. (2004). Advantages and disadvantages of phytolith analysis for the reconstruction of Mediterranean vegetation: an assessment based on modern phytolith, pollen and botanical data (Luberon, France). Rev. Palaeobot. Palynol. 129, 213–228. doi: 10.1016/j.revpalbo.2004.02.002
Bremond, L., Alexandre, A., Wooller, M. J., Hély, C., Williamson, D., Schäfer, P. A., et al. (2008). Phytolith indices as proxies of grass subfamilies on east African tropical mountains. Glob. Planet. Change 61, 209–224. doi: 10.1016/j.gloplacha.2007.08.016
Chen, S. T., and Smith, S. Y. (2013). Phytolith variability in Zingiberales: a tool for the reconstruction of past tropical vegetation. Palaeogeogr. Palaeoclimatol. Palaeoecol. 370, 1–12. doi: 10.1016/j.palaeo.2012.10.026
Chevalier, M., Davis, B. A. S., Heiri, O., Seppä, H., Chase, B. M., Gajewski, K., et al. (2020). Pollen-based climate reconstruction techniques for late quaternary studies. Earth Sci. Rev. 210:103384. doi: 10.1016/j.earscirev.2020.103384
Corlett, R. T., and Hughes, A. C. (2015). “Subtropical forests,” in The Routledge Handbook of Forest Ecology. eds. K. S.-H. Peh, R. T. Corlett, and Y. Bergeron (Oxford, UK: Routledge), 46–55.
Crifò, C., and Strömberg, C. A. E. (2021). Spatial patterns of soil phytoliths in a wet vs. dry neotropical forest: implications for paleoecology. Palaeogeogr. Palaeoclimatol. Palaeoecol. 562:110100. doi: 10.1016/j.palaeo.2020.110100
Dai, L., (2009). The study on the altitudinal gradient pattern of plant community characteristics in south slope of Daiyun Mountains. Master dissertation. Fuzhou, China: Fujian Agriculture and forestry University, (in Chinese).
Davis, M. B. (1963). On the theory of pollen analysis. Am. J. Sci. 261, 897–912. doi: 10.2475/ajs.261.10.897
Dickau, R., Whitney, B. S., Iriarte, J., Mayle, F. E., Soto, J. D., Metcalfe, P., et al. (2013). Differentiation of neotropical ecosystems by modern soil phytolith assemblages and its implications for palaeoenvironmental and archaeological reconstructions. Rev. Palaeobot. Palynol. 193, 15–37. doi: 10.1016/j.revpalbo.2013.01.004
Dunn, R. E., Strömberg, C. A. E., Madden, R. H., Kohn, M. J., and Carlini, A. A. (2015). Linked canopy, climate, and faunal change in the Cenozoic of Patagonia. Science 347, 258–261. doi: 10.1126/science.1260947
Fang, Y., Bunting, M. J., Ma, C., and Yang, X. (2022). Are modern pollen assemblages from soils and mosses the same? A comparison of natural pollen traps from subtropical China. Catena 209:105790. doi: 10.1016/j.catena.2021.105790
Finot, V. L., Barrera, J. A., Marticorena, C., and Rojas, G. (2011). “Systematic diversity of the family Poaceae (Gramineae) in Chile,” in The Dynamical Processes of Biodiversity-case Studies of Evolution and Spatial Distribution. eds. O. Grillo and G. Venora (Rijeka: InTech), 71–108.
Gao, G., Jie, D., Wang, Y., Liu, L., Liu, H., Li, D., et al. (2018). Phytolith reference study for identifying vegetation changes in the forest-grassland region of Northeast China. Boreas 47, 481–497. doi: 10.1111/bor.12280
Grimm, E. C. (1992). TILIA and TILIA*GRAPH Computer Program. Springfield, IL: Illinois State Museum.
Gu, Y., Liu, H., Wang, H., Li, R., and Yu, J. (2016). Phytoliths as a method of identification for three genera of woody bamboos (Bambusoideae) in tropical Southwest China. J. Archaeol. Sci. 68, 46–53. doi: 10.1016/j.jas.2015.08.003
Hansen, M. C., Potapov, P. V., Moore, R., Hancher, M., Turubanova, S. A., Tyukavina, A., et al. (2013). High-resolution global maps of 21st-century forest cover change. Science 342, 850–853. doi: 10.1126/science.1244693
Hou, X. (1982). Vegetation Geography of China and Chemical Components of their Dominant Plants. Beijing: Science Press, 1–411. (in Chinese).
Hyland, E., Smith, S. Y., and Sheldon, N. D. (2013). Representational bias in phytoliths from modern soils of Central North America: implications for paleovegetation reconstructions. Palaeogeogr. Palaeoclimatol. Palaeoecol. 374, 338–348. doi: 10.1016/j.palaeo.2013.01.026
International Committee for Phytolith Taxonomy (ICPT) (2019). International code for Phytolith nomenclature (ICPN) 2.0. Ann. Bot. 124, 189–199. doi: 10.1093/aob/mcz064
Jiang, F., Xu, Q., Zhang, S., Li, F., Zhang, K., Wang, M., et al. (2020). Relative pollen productivities of the major plant taxa of subtropical evergreen–deciduous mixed woodland in China. J. Quat. Sci. 35, 526–538. doi: 10.1002/jqs.3197
Juggins, S., (2020). rioja: Analysis of Quaternary Science Data. R package version 0.9-26, Available at: https://cran.r-project.org/package=rioja (Accessed June 7, 2022).
Li, Z., de Tombeur, F., Vander Linden, C., Cornelis, J. T., and Delvaux, B. (2020). Soil microaggregates store phytoliths in a sandy loam. Geoderma 360:114037. doi: 10.1016/j.geoderma.2019.114037
Li, R., Fan, J., Carter, J., Jiang, N., and Gu, Y. (2017). Monthly variations of phytoliths in the leaves of the bamboo Dendrocalamus ronganensis (Poaceae: Bambusoideae). Rev. Palaeobot. Palynol. 246, 62–69. doi: 10.1016/j.revpalbo.2017.06.006
Li, D., Jie, D., Liu, L., Liu, H., Gao, G., Gao, Z., et al. (2018). Herbaceous phytoliths from forest and grassland in Northeast China: potential significance for determining past forest–grassland boundaries. Flora 243, 19–31. doi: 10.1016/j.flora.2018.03.012
Li, D., Jie, D., Wang, Y., Liu, L., Liu, H., Gao, G., et al. (2017). Holocene climate reconstruction based on herbaceous phytolith indices from an AMS 14C-dated peat profile in the Changbai Mountains, Northeast China. Quat. Int. 447, 144–157. doi: 10.1016/j.quaint.2017.01.015
Li, Z., Meunier, J. D., and Delvaux, B. (2022). Aggregation reduces the release of bioavailable silicon from allophane and phytolith. Geochim. Cosmochim. Acta 325, 87–105. doi: 10.1016/j.gca.2022.03.025
Li, N., Sack, D., Gao, G., Liu, L., Li, D., Yang, X., et al. (2018). Holocene Artemisia-Chenopodiaceae-dominated grassland in North China: real or imaginary? The Holocene 28, 834–841. doi: 10.1177/0959683617744268
Li, N., Xie, M., Sack, D., Dubois, N., Yang, X., Gao, G., et al. (2021). Continuous aridification since the mid-Holocene as the main cause of C3/C4 dynamics in the grasslands of northeastern China. Eur. J. Soil Sci. 72, 356–371. doi: 10.1111/ejss.12960
Lin, P. (2003). Comprehensive Report of scientific Exploration to the Daiyun Mountain National Nature Reserve in Fujian Province, China. Xiamen University Press, Xiamen, 290 pp. (in Chinese).
Liu, X., Wang, H., Guo, J., Wei, J., Ren, Z., Zhang, J., et al. (2014). Spatially-explicit modelling of grassland classes–an improved method of integrating a climate-based classification model with interpolated climate surfaces. Rangel. J. 36, 175–183. doi: 10.1071/RJ13103
Lu, H., Wu, N., Liu, K., Jiang, H., and Liu, T. (2007). Phytoliths as quantitative indicators for the reconstruction of past environmental conditions in China II: palaeoenvironmental reconstruction in the loess plateau. Quat. Sci. Rev. 26, 759–772. doi: 10.1016/j.quascirev.2006.10.006
Lu, H., Wu, N., Yang, X., Jiang, H., Liu, K., and Liu, T. (2006). Phytoliths as quantitative indicators for the reconstruction of past environmental conditions in China I: phytolith based transfer functions. Quat. Sci. Rev. 25, 945–959. doi: 10.1016/j.quascirev.2005.07.014
Mander, L., and Punyasena, S. W. (2018). “Fossil pollen and spores in paleoecology,” in Methods in Paleoecology. eds. D. Croft, D. Su, and S. Simpson (Cham: Vertebrate Paleobiology and Paleoanthropology, Springer)
Mestre, L., Toro-Manríquez, M., Soler, R., Huertas-Herrera, A., Martínez-Pastur, G., and Lencinas, M. V. (2017). The influence of canopy-layer composition on understory plant diversity in southern temperate forests. For. Ecosyst. 4, 1–13. doi: 10.1186/s40663-017-0093-z
NASA, Jet Propulsion Laboratory (JPL) (2013). NASA shuttle radar topography Mission global 1 arc second. NASA EOSDIS Land Processes DAAC. doi: 10.5067/MEaSUREs/SRTM/SRTMGL1.003.
Neufeld, H. S., and Young, D. R. (2003). “Ecophysiology of the herbaceous layer in temperate deciduous forests,” in The Herbaceous Layer in Forests of Eastern North America. eds. F. S. Gilliam and M. R. Roberts (Oxford: Oxford University Press), 38–90.
Niinemets, Ü. (2010). A review of light interception in plant stands from leaf to canopy in different plant functional types and in species with varying shade tolerance. Ecol. Res. 25, 693–714. doi: 10.1007/s11284-010-0712-4
Oksanen, J., Blanchet, F. G., Friendly, M., Kindt, R., Legendre, P., McGlinn, D., et al., (2020). Vegan: community ecology package. R package version 2.5–7. Available at: https://CRAN.R-project.org/package=vegan (Accessed June 7, 2022).
Pei, Y., Dai, J., Chen, W., Li, W., and Zuo, X. (2021). Indication of topsoil phytoliths for the vertical vegetation change-a case study from Daiyun Mountain, Fujian Province. China. J. Earth Environ. 12, 57–67. (in Chinese)
Piperno, D. R. (1988). Phytolith Analysis. An Archaeological and Geological Perspective. Academic Press, New York.
Plue, J., Van Gils, B., De Schrijver, A., Peppler-Lisbach, C., Verheyen, K., and Hermy, M. (2013). Forest herb layer response to long-term light deficit along a forest developmental series. Acta Oecol. 53, 63–72. doi: 10.1016/j.actao.2013.09.005
Qiu, H., (1993). Late-Holocene vegetational history of a subtropical mountain in southeastern China [doctoral dissertation, Louisiana State University]. LSU Historical Dissertations and Theses. 5699. Available at: https://digitalcommons.lsu.edu/gradschool_disstheses/5699 (Accessed June 7, 2022).
R Core Team (2020). R: A Language and Environment for Statistical Computing. R Foundation for Statistical Computing, Vienna, Austria.
Strömberg, C. A. E. (2004). Using phytolith assemblages to reconstruct the origin and spread of grass-dominated habitats in the Great Plains of North America during the late Eocene to early Miocene. Palaeogeogr. Palaeoclimatol. Palaeoecol. 207, 239–275. doi: 10.1016/j.palaeo.2003.09.028
Sun, Z., Wang, J., Ren, H., Guo, Q., Shu, J., and Liu, N. (2016). To what extent local forest soil pollen can assist restoration in subtropical China? Sci. Rep. 6:37188. doi: 10.1038/srep37188
Turner, M. G., Wei, D., Prentice, I. C., and Harrison, S. P. (2021). The impact of methodological decisions on climate reconstructions using WA-PLS. Quat. Res. 99, 341–356. doi: 10.1017/qua.2020.44
Twiss, P. C. (1992). “Predicted world distribution of C3 and C4 grass phytoliths,” in Phytoliths Systematics: Emerging Issues. Advance Archaeological Museum Science. Vol. 1. eds. G. R. Rapp and S. C. Mulholland (New York: Plenum Press), 113–128.
Twiss, P. C., Suess, E., and Smith, R. M. (1969). Morphological classification of grass phytoliths. Soil Sci. Soc. Am. J. 33, 109–115. doi: 10.2136/sssaj1969.03615995003300010030x
Wang, Y., and Lu, H., (1993). The Study of Phytolith and its Application. China Ocean Press, Beijing. (in Chinese).
Watling, J., Iriarte, J., Whitney, B. S., Consuelo, E., Mayle, F., Castro, W., et al. (2016). Differentiation of neotropical ecosystems by modern soil phytolith assemblages and its implications for palaeoenvironmental and archaeological reconstructions II: Southwestern Amazonian forests. Rev. Palaeobot. Palynol. 226, 30–43. doi: 10.1016/j.revpalbo.2015.12.002
Wen, C., Lu, H., Zuo, X., and Ge, Y. (2018). Advance of research on modern soil phytolith. Sci. China: Earth Sci. 61, 1169–1182. doi: 10.1007/s11430-017-9220-8
Yu, G., Ke, X., Xue, B., and Ni, J. (2004). The relationships between the surface arboreal pollen and the plants of the vegetation in China. Rev. Palaeobot. Palynol. 129, 187–198. doi: 10.1016/j.revpalbo.2004.01.007
Zheng, Z., Huang, K., Xu, Q., Lu, H., Cheddadi, R., Luo, Y., et al. (2008). Comparison of climatic threshold of geographical distribution between dominant plants and surface pollen in China. Sci. China Ser. D Earth Sci. 51, 1107–1120. doi: 10.1007/s11430-008-0080-x
Keywords: phytoliths, tree coverage, quantitative reconstruction, subtropics, vegetation
Citation: Li N, Yu F, Sack D, Huang Z, Tian G and Liu S (2022) Phytolith Assemblages as a Promising Tool for Quantitative Canopy Coverage Reconstruction in Subtropical Forests, China. Front. Plant Sci. 13:912627. doi: 10.3389/fpls.2022.912627
Edited by:
Jianping Zhang, Institute of Geology and Geophysics (CAS), ChinaReviewed by:
Zimin Li, Catholic University of Louvain, BelgiumCopyright © 2022 Li, Yu, Sack, Huang, Tian and Liu. This is an open-access article distributed under the terms of the Creative Commons Attribution License (CC BY). The use, distribution or reproduction in other forums is permitted, provided the original author(s) and the copyright owner(s) are credited and that the original publication in this journal is cited, in accordance with accepted academic practice. No use, distribution or reproduction is permitted which does not comply with these terms.
*Correspondence: Nannan Li, bGluYW5uYW5AeG11LmVkdS5jbg==; Fengling Yu, ZmVuZ2xpbmcueXVAeG11LmVkdS5jbg==
Disclaimer: All claims expressed in this article are solely those of the authors and do not necessarily represent those of their affiliated organizations, or those of the publisher, the editors and the reviewers. Any product that may be evaluated in this article or claim that may be made by its manufacturer is not guaranteed or endorsed by the publisher.
Research integrity at Frontiers
Learn more about the work of our research integrity team to safeguard the quality of each article we publish.