 Xian-Mei Yu
 Jie Wang
 Rui Gao
 Bang-Chu Gong
 Cheng-Xiang Ai
- 1Shandong Institute of Pomology, Tai’an, China
- 2Research Institute of Subtropical Forestry, Chinese Academy of Forestry, Fuyang, China
Persimmon leaves are used for making persimmon leaf tea or as functional ingredients due to their enrichment in flavonoids, the beneficial mineral contents, and favorable flavors contributed by volatile aroma compounds. The varieties/cultivars had a significant influence on the quality and flavor of persimmon leaf tea. In this study, the integrated metabolomic-transcriptomic analysis was conducted to investigate the potential in flavonoid biosynthesis, mineral absorption, and degradation of aromatic compounds from tender leaves of “Diospyros kaki. Heishi” (HS), “Diospyros kaki Thunb. Nishimurawase” (NM), and “Diospyros kaki Thunb. Taifu” (TF), using rootstock “Diospyros Lotus Linn” (DL) as the control. The metabolomic analysis showed that 382, 391, and 368 metabolites were differentially accumulated in the comparison of DL vs. HS, DL vs. NM, and DL vs. TF, respectively, and 229 common metabolites were obtained by comparative analysis. By RNA sequencing, 182,008 unigenes with 652 bp of mean length were annotated and 2,598, 3,503, and 3,333 differentially expressed genes (DEGs) were detected from the comparison of DL vs. HS, DL vs. NM, and DL vs. TF, respectively. After the Gene Ontology (GO) and the Kyoto Encyclopedia of Genes and Genomes (KEGG) enrichment, 6, 6, and 3 DEGs [with | log2(fold change)| ≥ 1 simultaneously in the three comparisons] involved in flavonoid biosynthesis, mineral absorption, and degradation of aromatic compounds, respectively, were selected for quantitative reverse transcription-polymerase chain reaction (qRT-PCR) validation and the consistent trends of the relative expression level of each DEG with RNA sequencing (RNA-seq) data were observed. Based on the transcriptomic analysis and qRT-PCR validation, it was observed that the leaves of HS, NM, and TF had the greatest level of mineral absorption, flavonoid biosynthesis, and degradation of aromatic compounds, respectively. In addition, a positive correlation between the 15 DEGs and their metabolites was observed by the conjoint analysis. Thus, the tender leaves of HS, NM, and TF could be recommended for the production of persimmon leaf tea rich in mineral elements, flavonoid, and aroma compounds, respectively.
Introduction
Persimmon (Diospyros kaki L.) is originated in China and is cultivated in warm regions (Ashtiani et al., 2016). Persimmon is cherished for possessing high nutritional and nutraceutical values, due to its high nutrient content and unique flavor based on its primary and secondary metabolites (Giordani et al., 2011; Zhang et al., 2018). Persimmon leaves and their extracts have been reported to be rich in natural antioxidant compounds, especially flavonoids and, therefore, possess the antioxidant capacity (Liu et al., 2012; Martínez-Las Heras et al., 2014, 2016). Due to their enrichment in flavonoids, persimmon leaves have been used as traditional Chinese medicine for a long time to treat ischemia stroke, internal hemorrhage, atherosclerosis, angina, hypertension, and some other infectious diseases (Chang et al., 2019). On the other hand, persimmon leaves have also been used as an ingredient of herbal beverages for centuries in eastern Asia because they are beneficial to human health and their various components have health-promoting effects (Chen et al., 2009; Yaqub et al., 2016; Hossain et al., 2018; Kim et al., 2020). Persimmon leaf tea has become increasingly popular in Asian countries, such as China, Japan, and South Korea.
Minerals, such as Fe, Cu, Cr, Mn, and Zn, are essential and beneficial elements for humans. The mineral contents in herbal teas are extraordinary, attracting consumers not only from the nutritional viewpoint, but also to assess the quality and evaluate the potential benefit from their consumption (Bhat et al., 2010). Mineral elements of food, especially in agricultural products and their corresponding soil, are stable, which can be used as the signature of geographical origin of the product (Zhao et al., 2017b; Li et al., 2018; Tardugno et al., 2021). Meanwhile, the factors, such as geographical origin, variety, climate conditions, harvest season or growth stage, and their interactions had a significant influence on mineral contents and quality of tea leaves (Jia et al., 2016; Zhao et al., 2017a).
Tea is popular worldwide partly due to its favorable flavor and taste (Yang et al., 2013). Aromatic aroma compounds, including volatile compounds and non-volatile compounds, contribute to tea flavor. Volatile aroma compounds are representative and specialized metabolites in tea leaves, which contribute to the aroma property of tea flavor and determine the final quality and value of tea products (Naveed et al., 2018; Jiang et al., 2019; Wang et al., 2019).
Persimmon cultivars are classified into the four groups: pollination-constant non-astringent (PCNA), pollination variant non-astringent (PVNA), pollination-constant astringent (PCA), and pollination variant astringent (PVA). PVNA, PCA, and PVA were also categorized as non-PCNA types (Akagi et al., 2011; Yang et al., 2016). Variety/cultivar was one of the important impacting factors on the compositions and contents of flavonoids in persimmon leaves, which were significantly correlated with their antioxidant activities and the leaves from PCA persimmons had higher levels of total flavonoid and, thus, had better antioxidant effects, followed by PVNA persimmons and PCNA persimmons; the PVA variety had the lowest amount of total flavonoid (Chang et al., 2019).
Persimmon leaf tea has been used as a pleasant, functional beverage and an effective, traditional herbal remedy for a long time (Chen et al., 2009; Chang et al., 2019), but how to increase the content of functional compounds and improve the quality and flavor of persimmon leaf tea by screening the varieties/cultivars rich in flavonoid, mineral, or aroma compounds are largely unexplored. In recent years, integrative metabolomic-transcriptomic analysis has been extensively applied to reveal the relationship between the contents of secondary metabolites and their corresponding differentially expressed genes (DEGs; Zhou et al., 2019, 2022; Wan et al., 2020, 2021; Zhang et al., 2020; Qi et al., 2021; Wang et al., 2021).
In this study, we conducted the integrated metabolomic-transcriptomic analysis to investigate the flavonoid biosynthesis, mineral absorption, and degradation of aromatic compounds from tender leaves of different persimmon varieties, including PCA type “Diospyros kaki. Heishi” (HS), PVNA type “Diospyros kaki Thunb. Nishimurawase” (NM), and “Diospyros kaki Thunb. Taifu” (TF), using the rootstock “Diospyros Lotus Linn” (DL) as the control. We hope that this study would provide insight into the functional ingredients from persimmon leaves of different types or varieties/cultivars and the results would facilitate the selection of choice varieties/cultivars of persimmon for optional persimmon leaf tea with particular functional ingredients.
Materials and Methods
Plant Materials
The persimmon varieties of rootstock “Diospyros Lotus Linn” (DL), PCA type “Diospyros kaki. Heishi” (HS), PVNA type “Diospyros kaki Thunb. Nishimurawase” (NM), and “Diospyros kaki Thunb. Taifu” (TF) used in this study were grown in the persimmon test base of Shandong Institute of Pomology in Tai’an, China under natural conditions. On a sunny morning, 20 g of tender leaves were sampled from persimmon trees and three trees of each persimmon variety were used for sampling as three biological replicates.
Metabolomic Profiling and Metabolite Data Analysis
The sample preparation, extract analysis, metabolite identification, and quantification were performed at Wuhan Metware Biotechnology Co., Ltd., WuHan, China following1 the standard procedures, which were previously described by Yuan et al. (2018), Cao et al. (2019), and Zhang et al. (2019). Metabolite data analysis was carried out using the Analyst version 1.6.1 software (AB SCIEX, ON, Canada).
Ribonucleic Acid Extraction, Quantification, and Sequencing
Twelve complementary DNA (cDNA) libraries of four samples and three replicates were constructed for transcriptome sequencing. The extraction and quantification of total RNA, construction of cDNA libraries, and sequencing were completed at Wuhan Metware Biotechnology Co., Ltd. (see text footnote 1). The libraries were sequenced on the Illumina HiSeq™ 4000 platform and the 150 bp paired-end reads were generated.
Transcriptome Data Analysis
Raw reads were processed with FastQC2 and clean reads were obtained by removing the adapters and low-quality sequences. De novo assembly of the clean reads was performed using Trinity version 2.5.13 (Grabherr et al., 2011; Liu et al., 2013). Quantification of gene expression level was carried out using the featureCounts version 1.5.0-P3 (Liao et al., 2014) based on the expected number of fragments per kilobase of transcript sequence per millions of base pairs sequenced (FPKM) method (Trapnell et al., 2010). Differential expression analysis between the two compared groups (three biological replicates per group) was performed using the DESeq2 R package (version 1.20.0) (Love et al., 2014) with adjusted P-values. The differentially expressed genes (DEGs) were identified with the following parameters: adjusted P-value < 0.05 and | log2(fold change)| ≥ 1. The Gene Ontology (GO) and the Kyoto Encyclopedia of Genes and Genomes (KEGG) enrichment of DEGs were implemented by the GOseq R package (version 2.28.0) (Young et al., 2010) and KOBAS software (version 2.0) (Mao et al., 2005; Wu et al., 2006), respectively.
Quantitative Reverse Transcription-Polymerase Chain Reaction Validation of the Selected Differentially Expressed Genes
To validate the accuracy of DEGs obtained from the assembled datasets and profiling of gene expression via RNA sequencing (RNA-seq), quantitative reverse transcription-polymerase chain reaction (qRT-PCR) was carried out for the selected 15 DEGs, with the parameters of | log2(fold change)| ≥ 1 and P-value < 0.05 simultaneously in the three comparisons, using the primers shown in Table 1. The total RNAs used for RNA-seq were also used as the template for the qRT-PCR validation, glyceraldehyde-3-phosphate dehydrogenase (GAPDH) was used as the reference gene, and three biological replicates were analyzed.
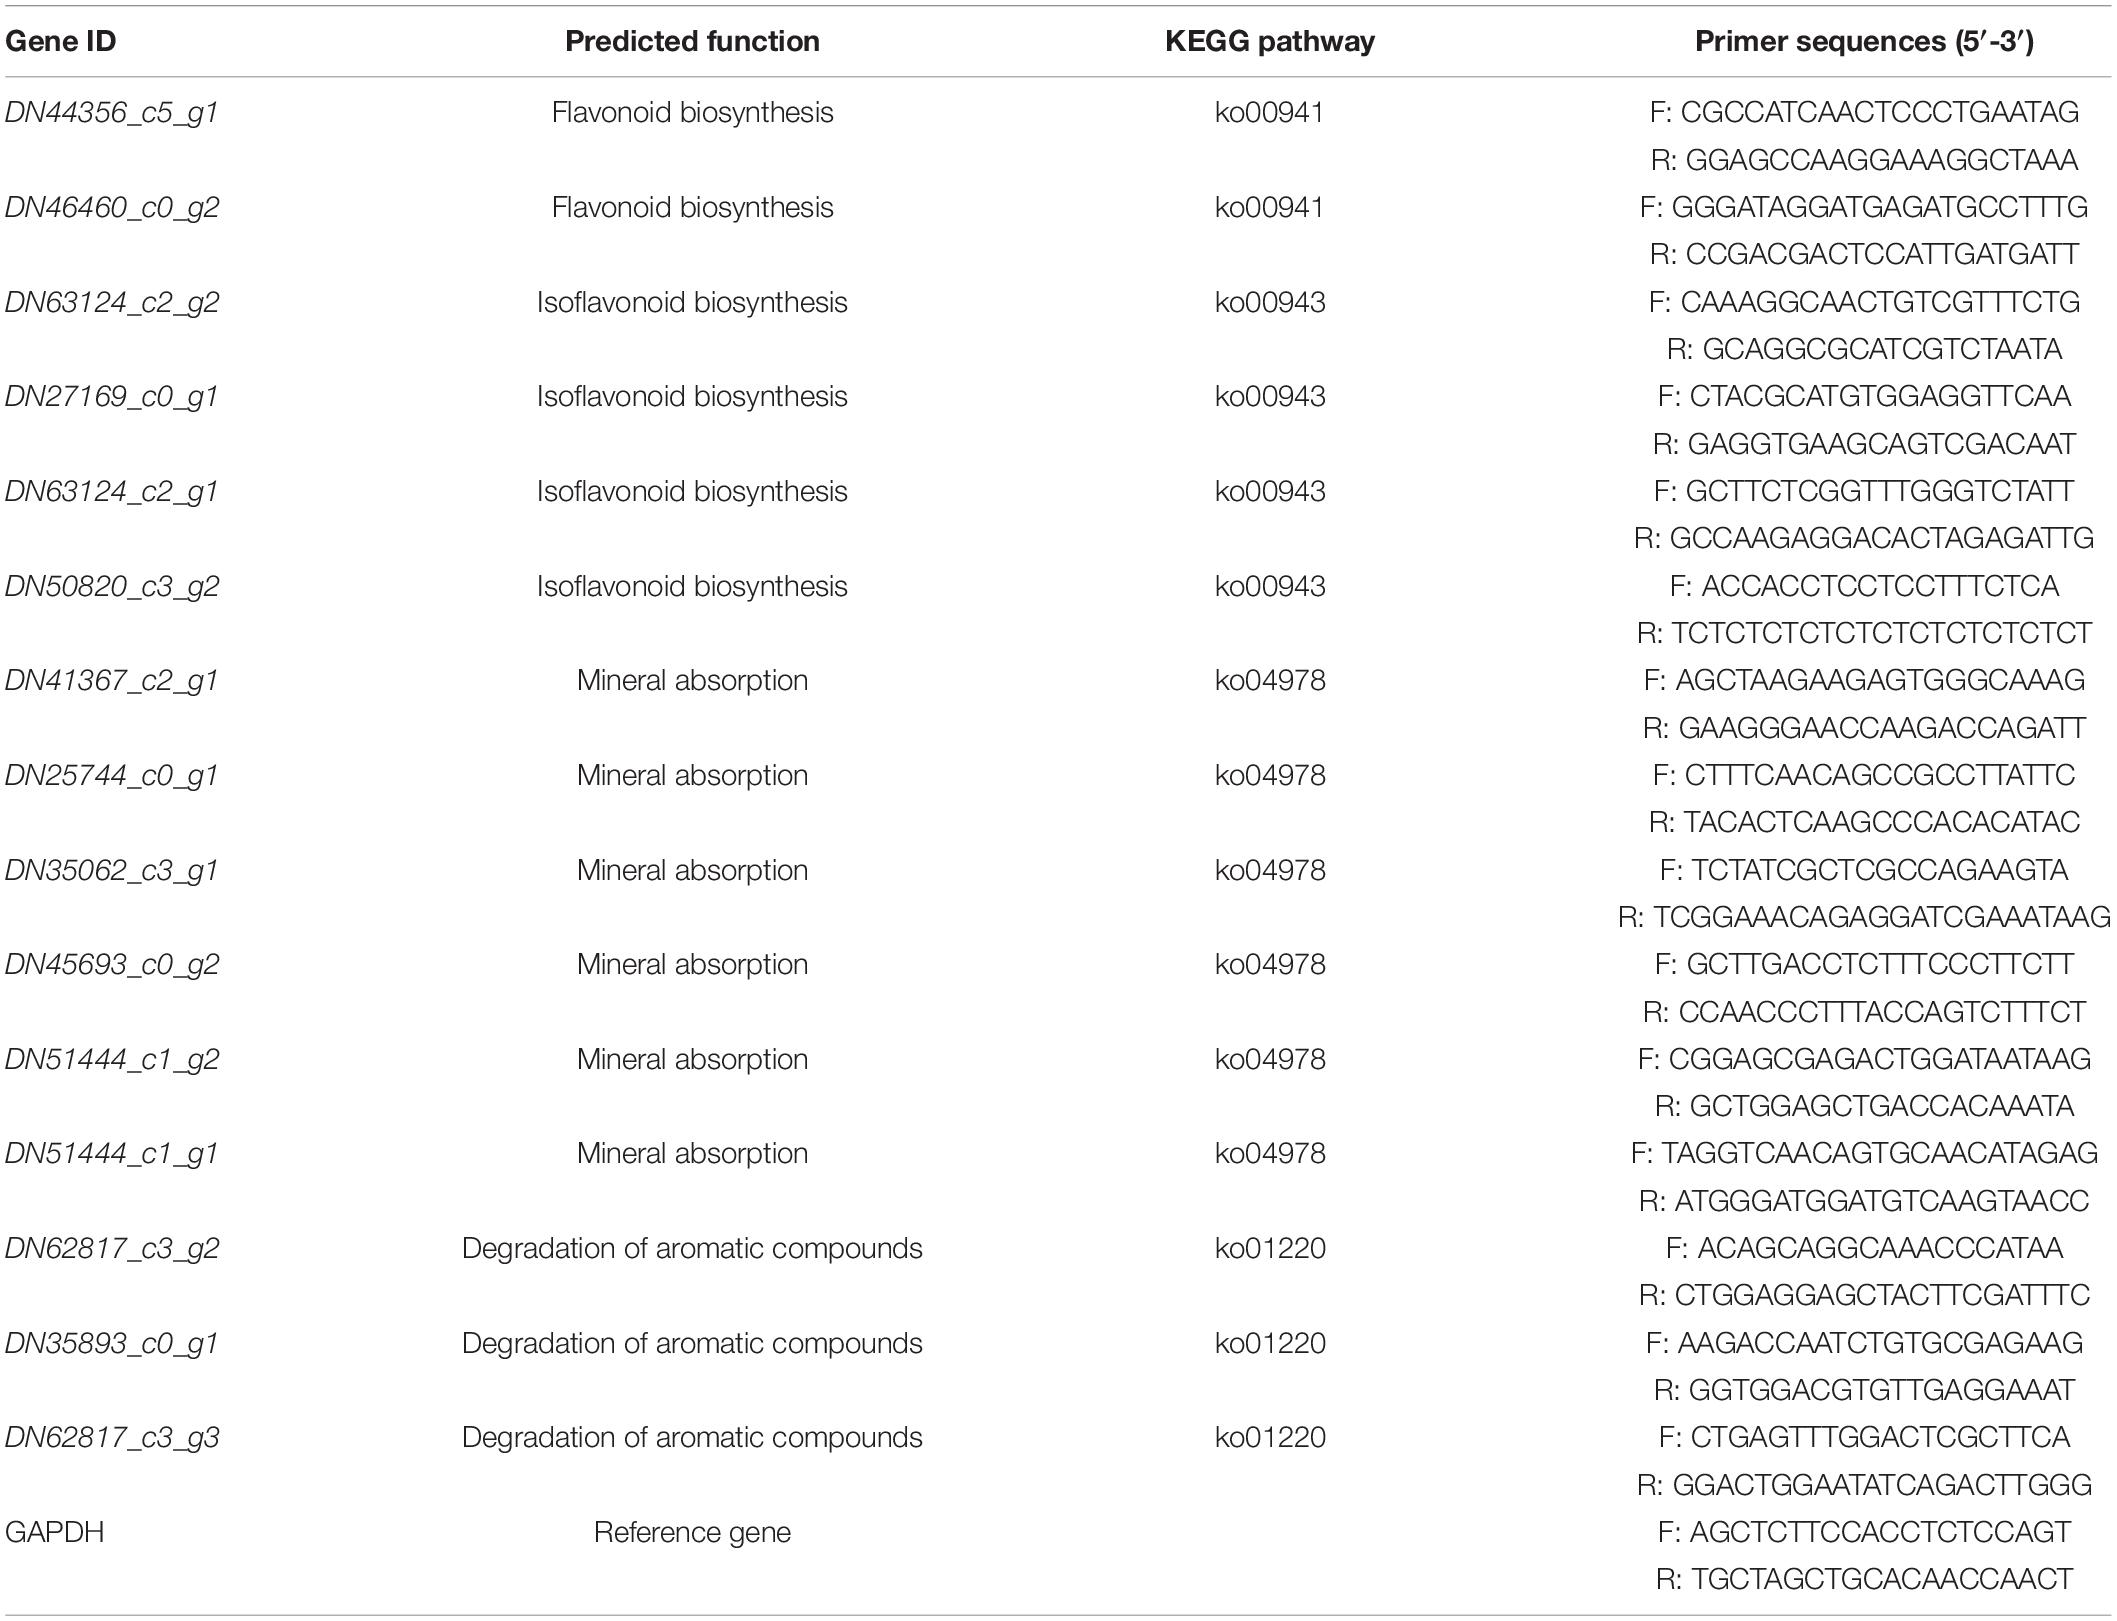
Table 1. The quantitative reverse transcription-polymerase chain reaction (qRT-PCR) primers and their sequences for the 15 selected differentially expressed genes (DEGs).
Conjoint Analysis of Metabolome and Transcriptome Data
For the conjoint analysis, the mean of metabolome data and transcriptome data was calculated and then the Pearson correlation (r) between metabolites and transcripts represented by network diagrams was calculated (Cho et al., 2016). Metabolome and transcriptome relationships were visualized using Cytoscape version 3.6.1 (Su et al., 2014).
Results
Metabolome Profiles
After profiling the metabolome of the four samples (Figure 1A) and three replicates using the widely targeted metabolomic approach, we detected 868 compounds clustered into 22 classes. The principal component analysis (PCA) of the four samples based on the metabolites showed that all the biological replicates clustered together (Figure 1B), indicating the reliability of the metabolome data. It was observed that the four samples were clustered into the two main groups in the heatmap (Figure 1C), suggesting that the metabolite profiles of DL were obviously distinct from those of HS, NM, and TF.
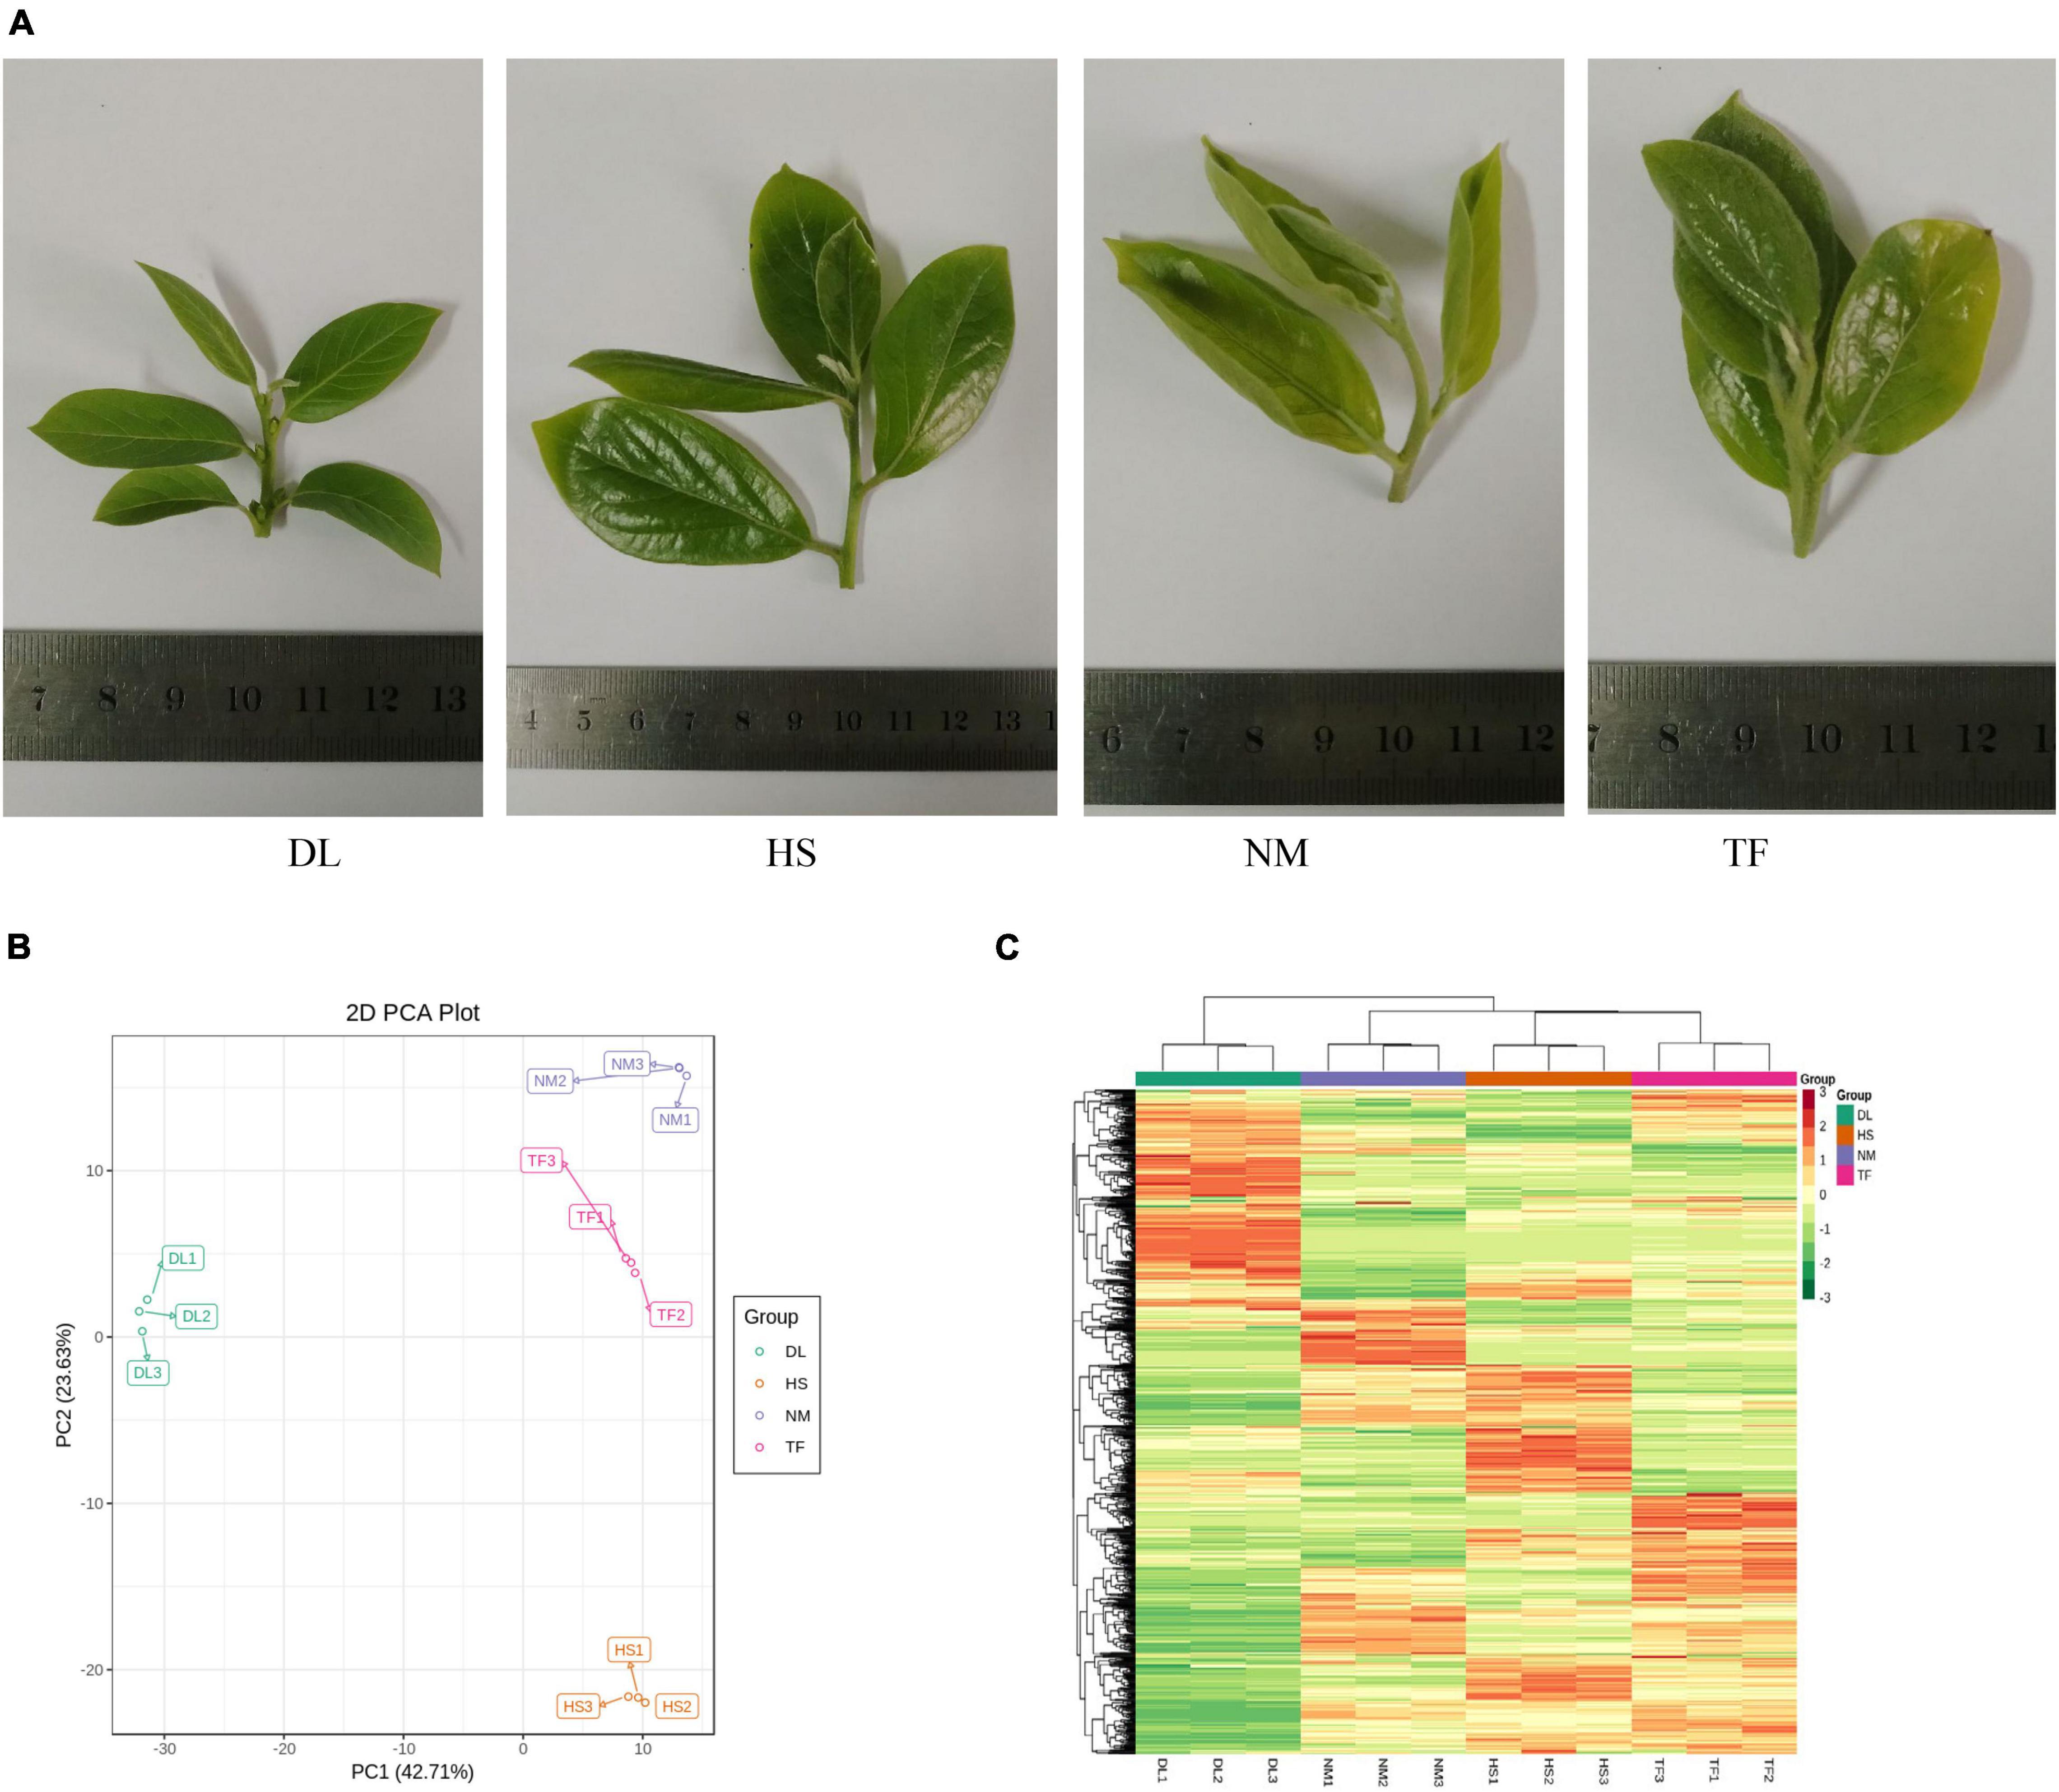
Figure 1. The metabolome profiles of the four samples of Diospyros Lotus Linn (DL), Diospyros kaki. Heishi (HS), Diospyros kaki Thunb. Nishimurawase (NM), and Diospyros kaki Thunb. Taifu (TF). (A) The samples in this study. (B) The principal component analysis (PCA) plot. (C) Heatmap of the metabolites from the four samples.
Identification of the Differentially Accumulated Metabolites
The differentially accumulated metabolites (DAMs) between the compared groups were determined based on the variable importance in projection (VIP) ≥1 and fold change ≥2 or fold change ≤0.5 (Yuan et al., 2018). A total of 382, 391, and 368 metabolites were differentially accumulated in the comparison of DL vs. HS, DL vs. NM, and DL vs. TF, respectively (Figures 2A–C). The top enriched KEGG terms of the DAMs detected for the three compared groups were metabolic pathways, biosynthesis of secondary metabolites, flavonoid biosynthesis, biosynthesis of plant secondary metabolites, flavone and flavonol biosynthesis, and isoflavonoid biosynthesis (Figures 2D–F). Comparative analysis of the three compared groups resolved to 229 common metabolites (Figure 2G). The unique DAMs related to the objective flavor of persimmon leaves were detected from the three compared groups, which are shown in Figure 2H.
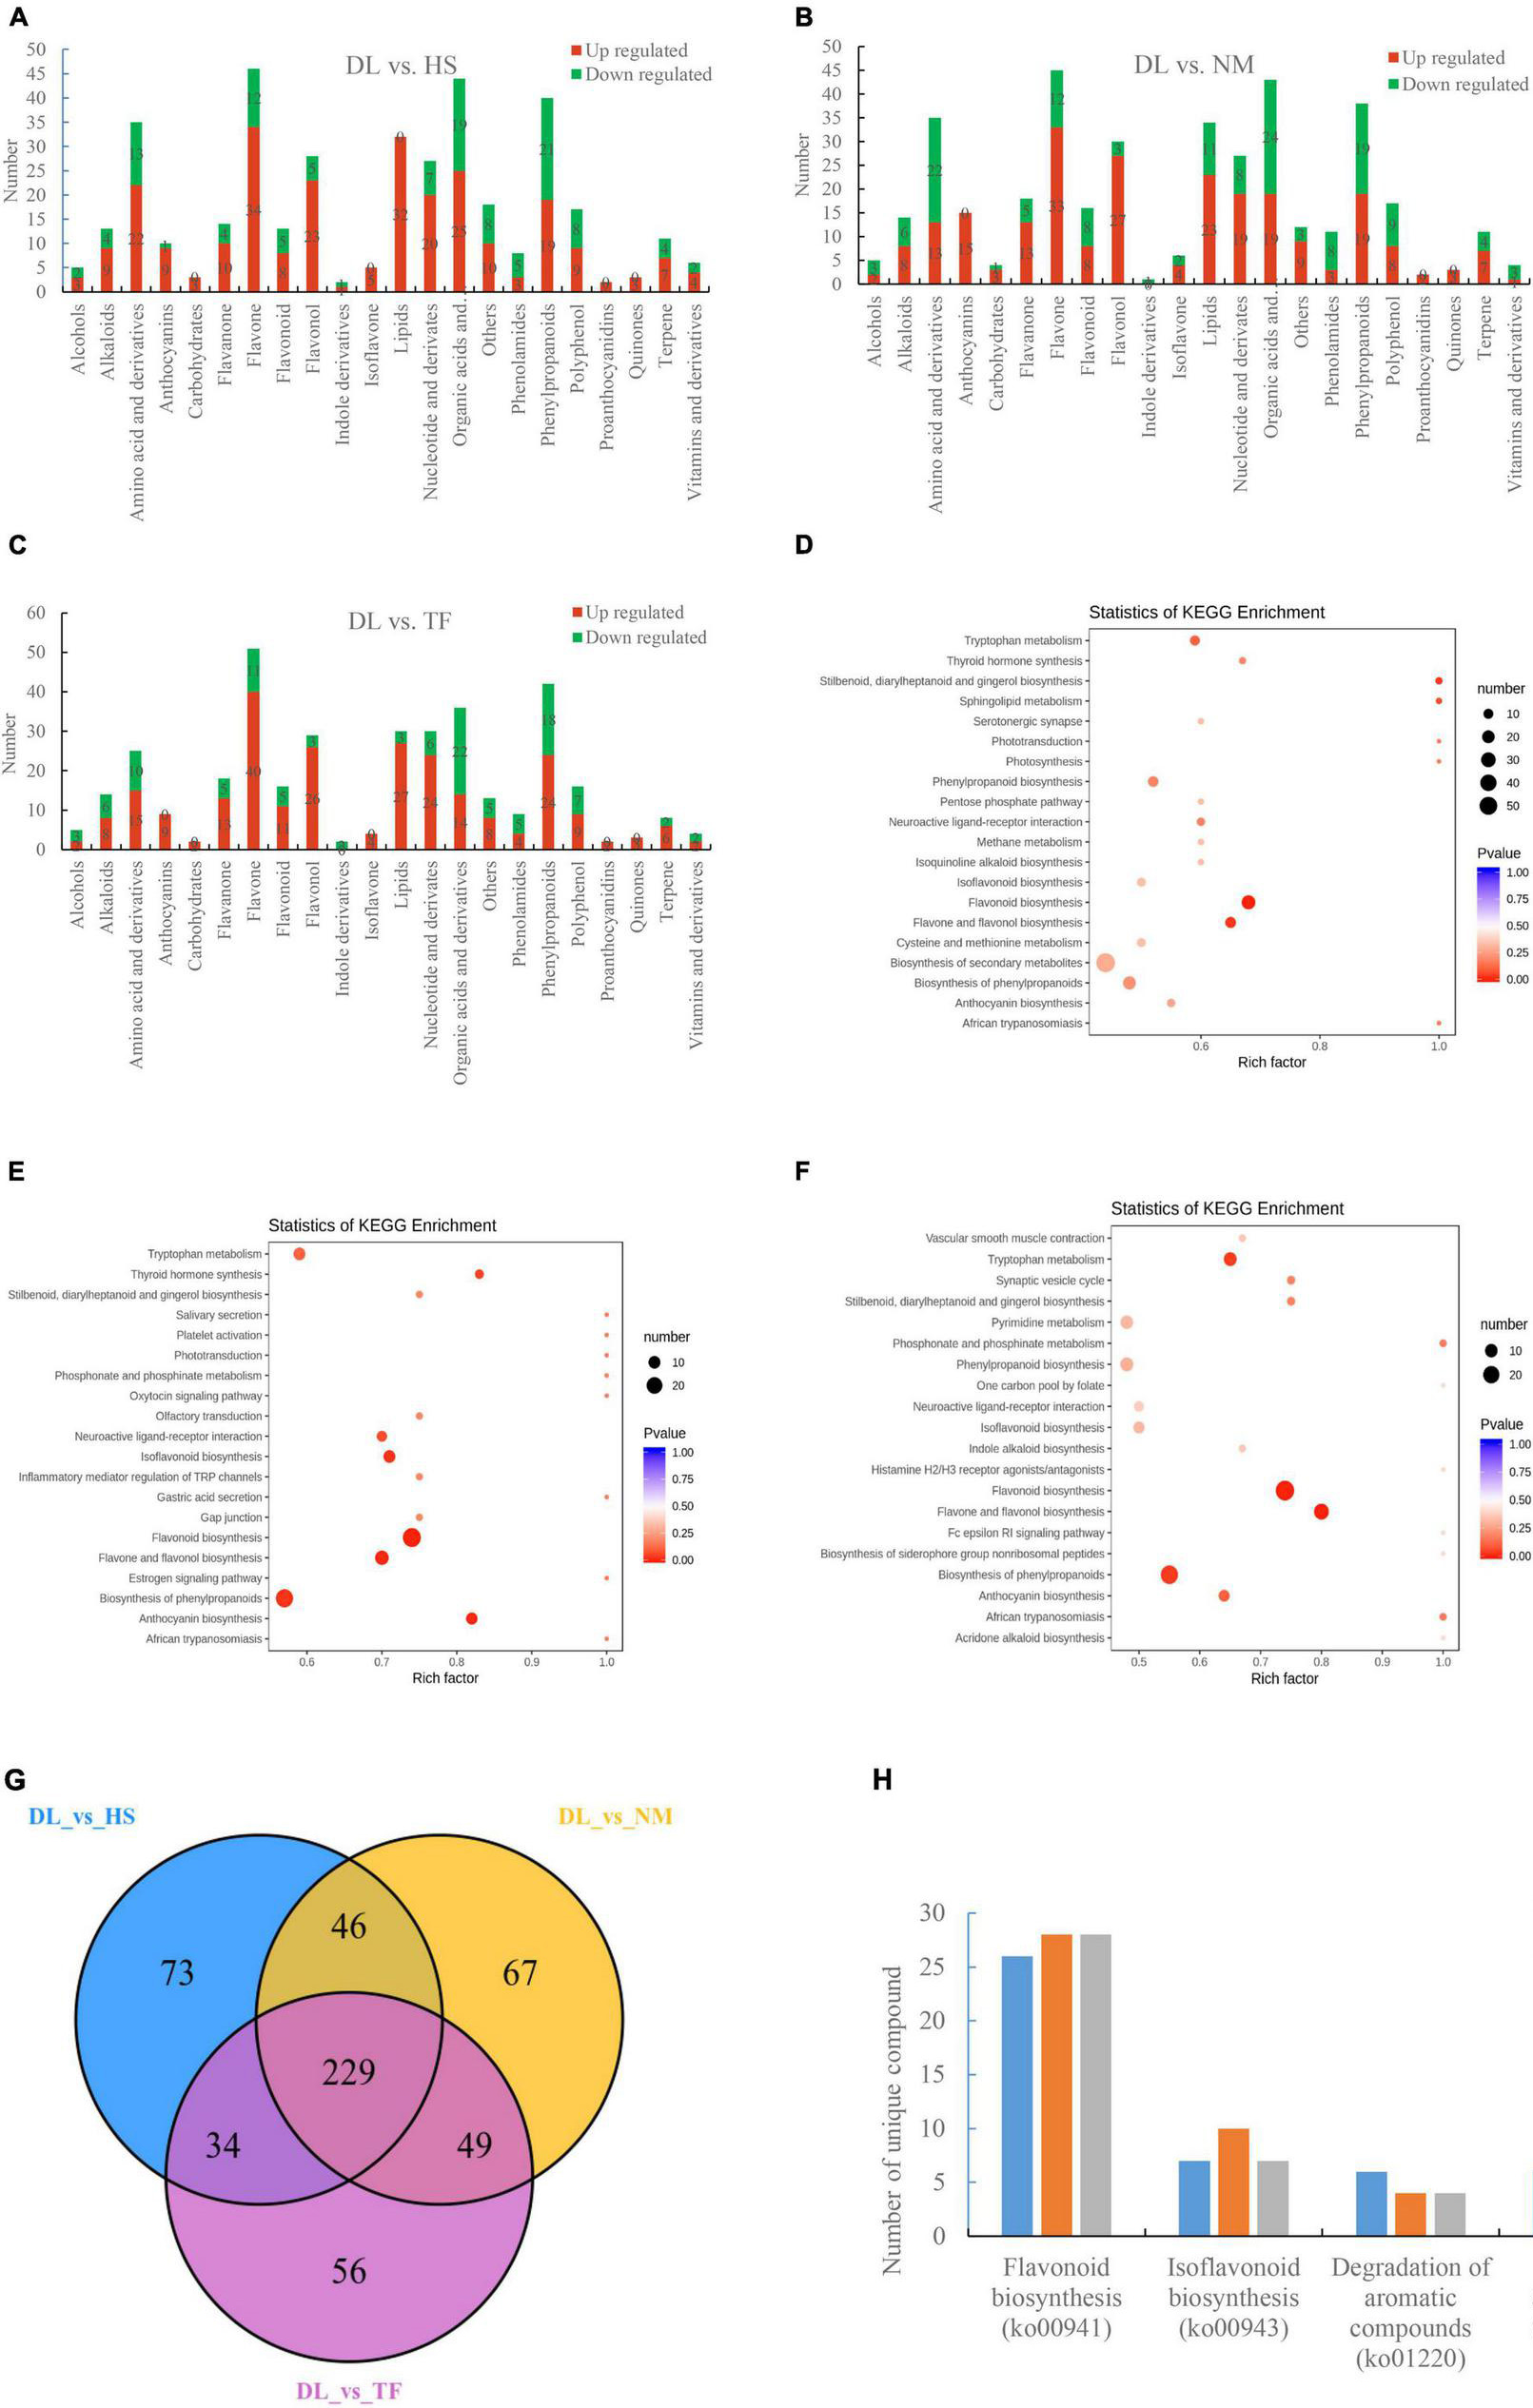
Figure 2. Identification and functional characterization of the differentially accumulated metabolites (DAMs) between the groups. (A–C) The metabolites accumulated in the comparison of DL vs. HS, DL vs. NM, and DL vs. TF, respectively. (D–F) The top enriched Kyoto Encyclopedia of Genes and Genomes (KEGG) terms of the DAMs from the comparison of DL vs. HS, DL vs. NM, and DL vs. TF, respectively. (G) Venn diagram depicting the shared and specific metabolites between the compared groups. (H) The unique DAMs related to flavor accumulated in the three compared groups.
Transcriptome Profiles
By construction of the 12 libraries and RNA sequencing, 779,759 million raw reads were obtained and the dataset of raw reads was deposited in the National Center for Biotechnology Information (NCBI) database with the accession number PRJNA6468454. After clean-up and quality filtering, 770,810 million clean reads containing 115.18 Gb clean bases were obtained and the bases scoring Q20 (base quality more than 20) and Q30 (base quality more than 30) were 97.48 and 93.06%, respectively (Table 2). By using the trinity assembling program, 439,550 transcripts with 693 bp of mean length were obtained and 182,008 unigenes with 652 bp of mean length were annotated. The transcripts and unigenes of <500 bp accounted 52.51 and 57.56%, respectively (Figure 3), indicating the high quality of RNA sequencing data.
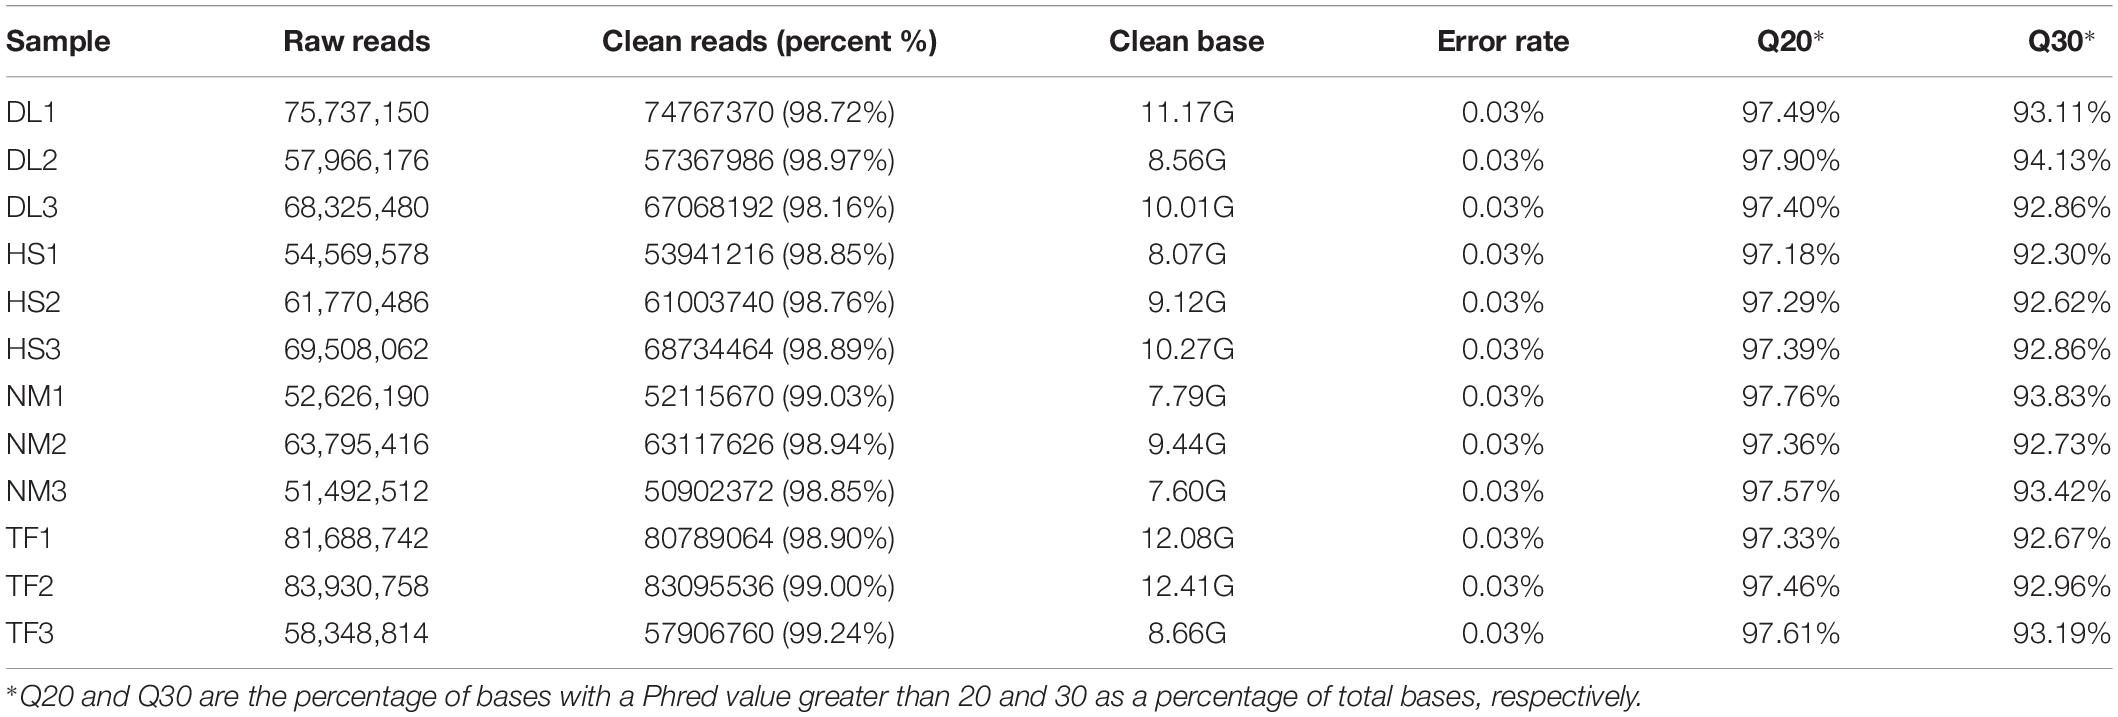
Table 2. The quality control statistics of the transcriptome sequencing data.
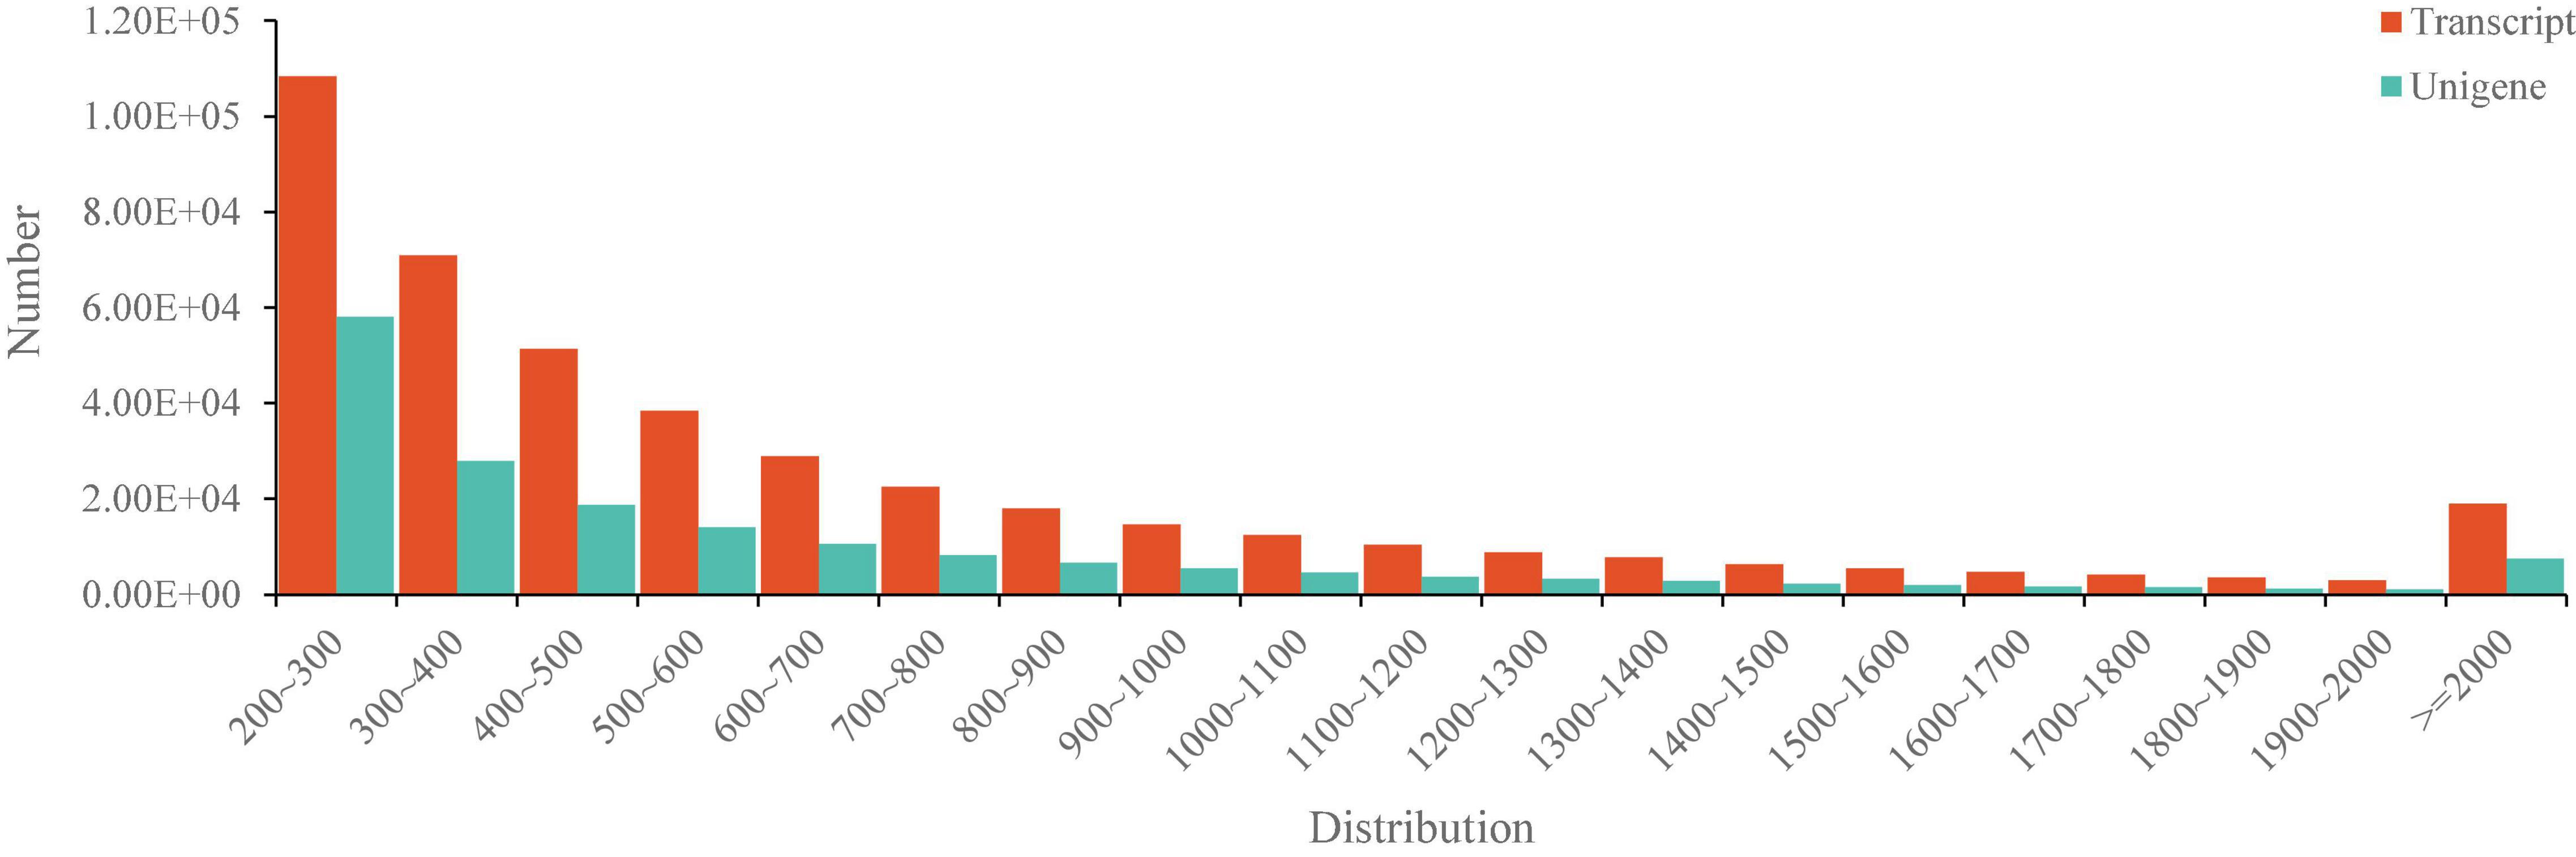
Figure 3. The length distribution of the transcriptome sequencing data.
The principal component analysis (PCA) of the samples based on the FPKM values showed that all the biological replicates clustered together, indicating the reliability of the sequencing data (Figure 4).
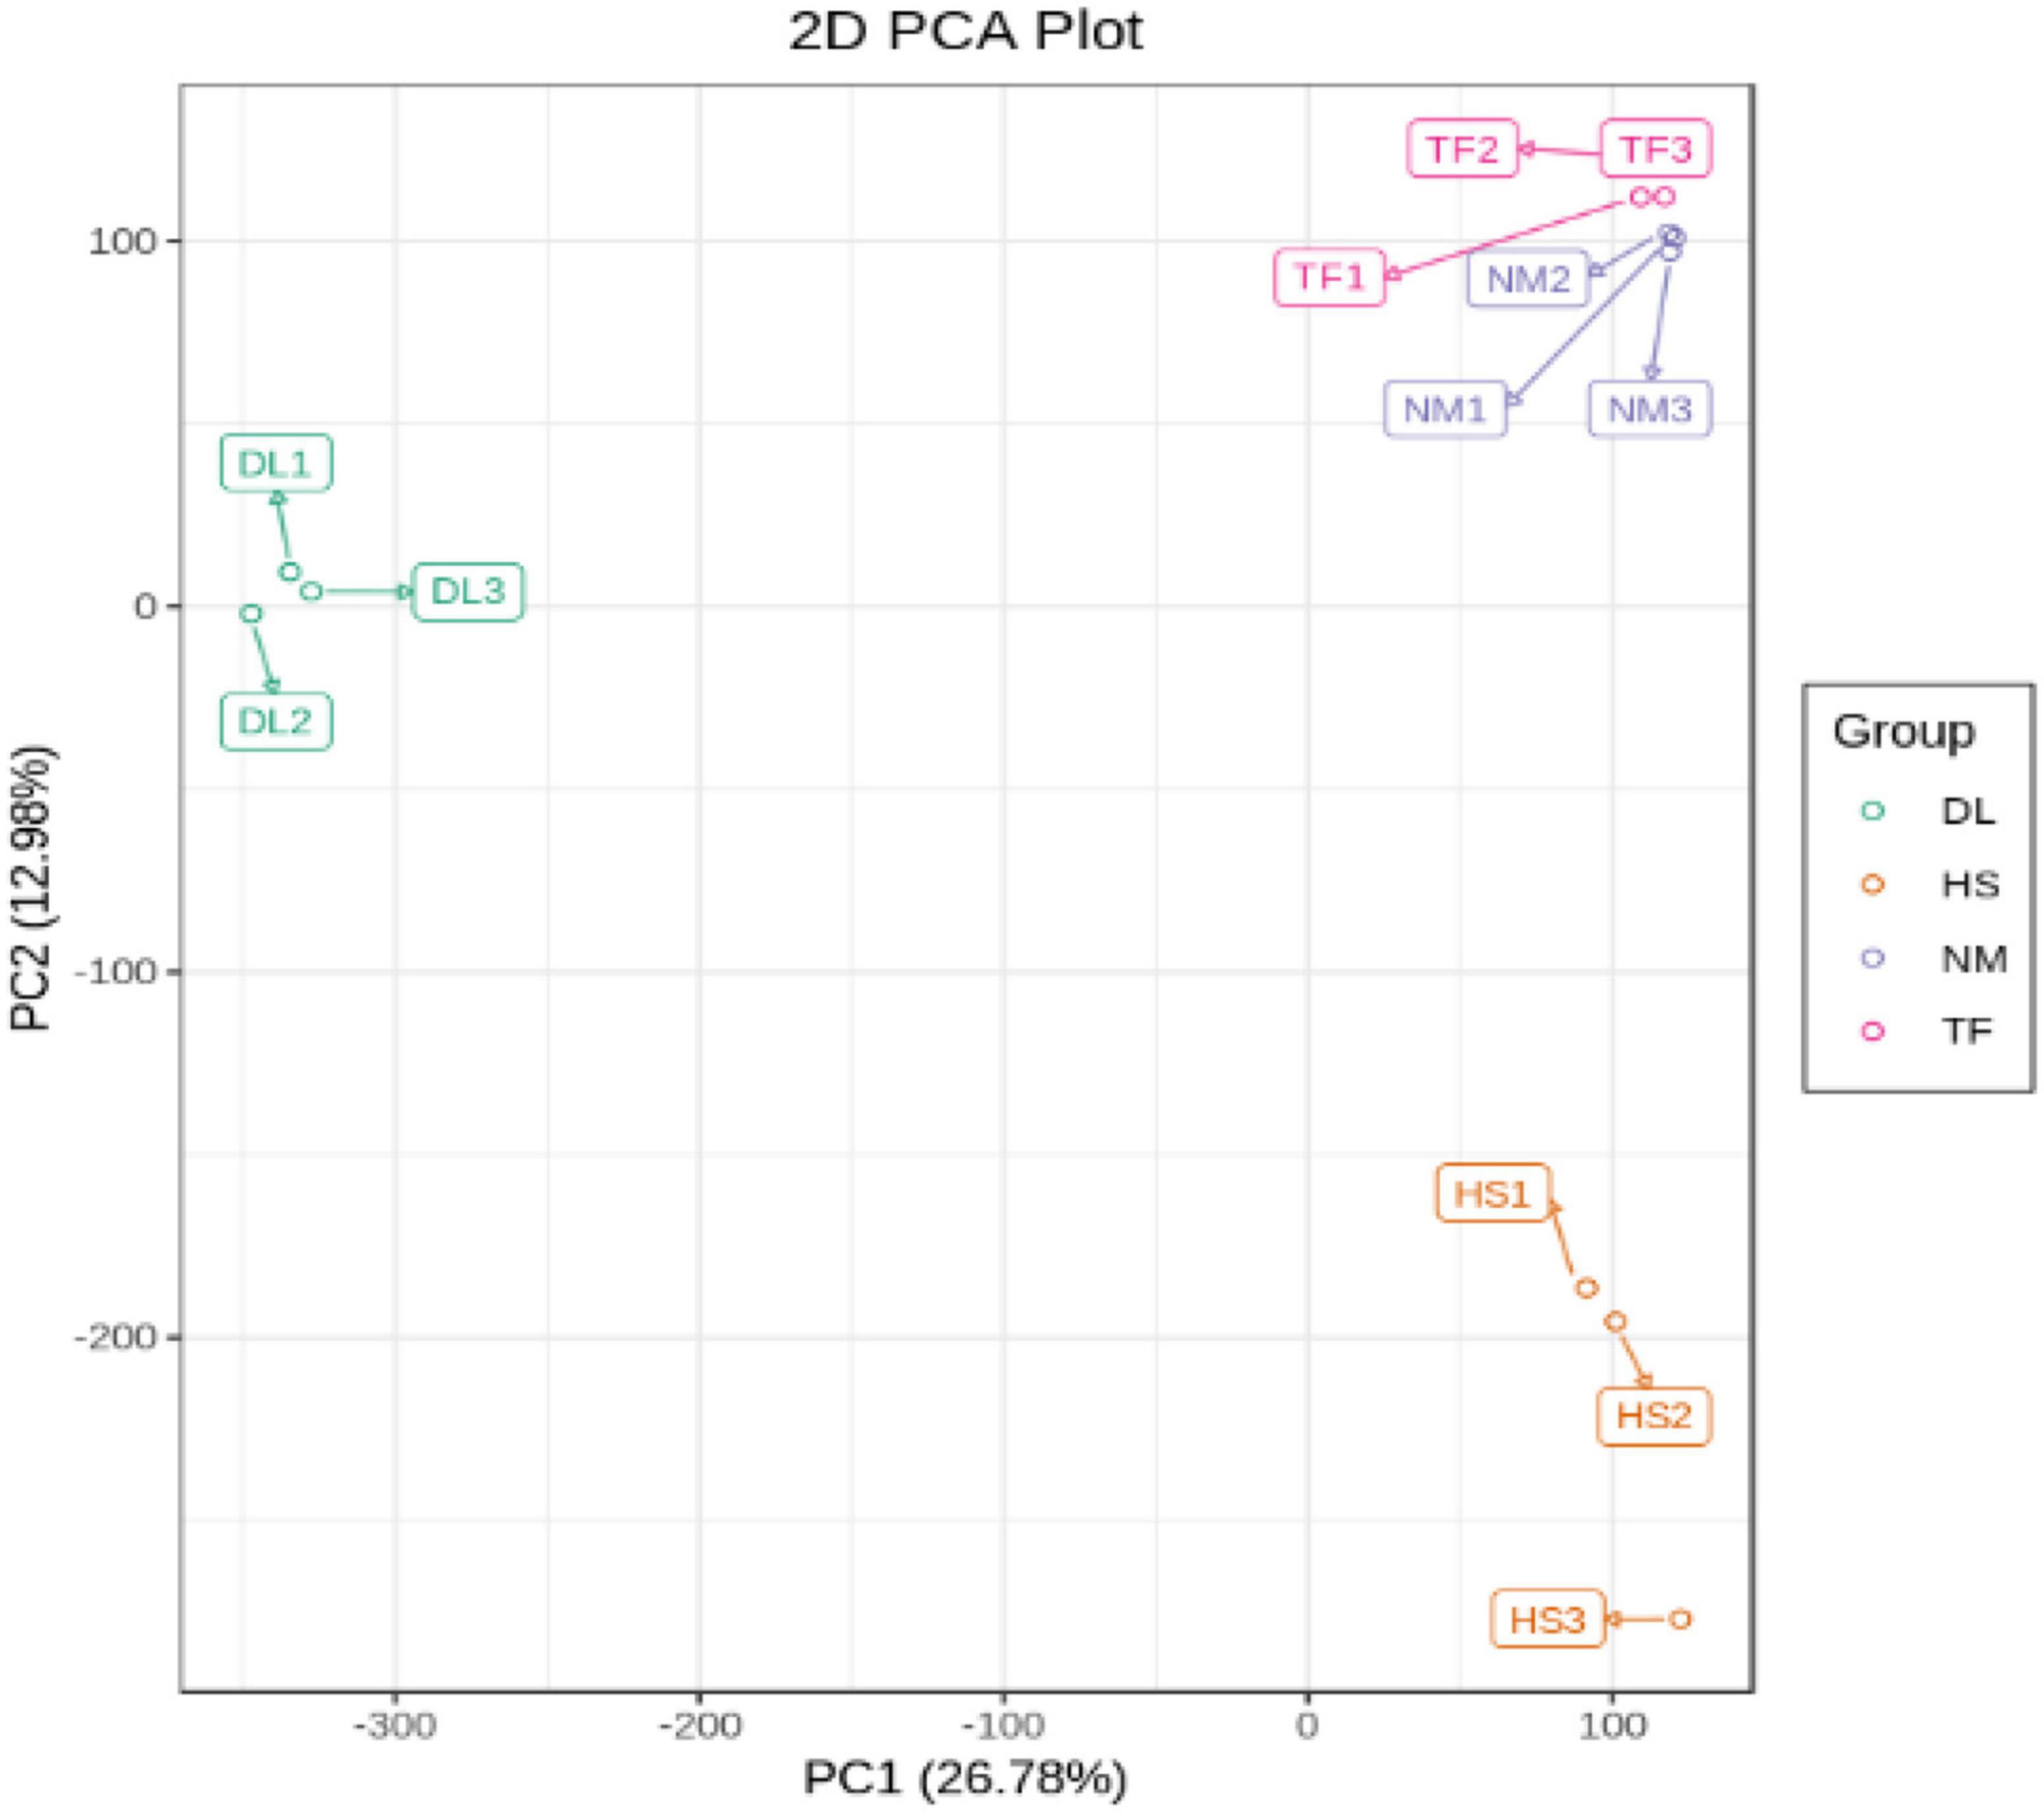
Figure 4. The PCA diagram based on the FPKM values of the transcriptome sequencing data.
Analysis of Differentially Expressed Genes
With the filter criteria of | log2(fold change)| ≥ 1 and P-value < 0.05, 2,598, 3,503, and 3,333 DEGs were detected from the comparisons of DL vs. HS, DL vs. NM, and DL vs. TF, respectively, of which 1,370, 1,524, and 1,678 genes were upregulated and 1,228, 1,979, and 1,655 genes were downregulated in the comparison of DL vs. HS, DL vs. NM, and DL vs. TF, respectively (Figures 5B,D). Based on the DEGs, the four samples were clustered into the two main groups in the heatmap (Figure 5A), which was consistent with the result of metabolome analysis, indicating the high reliability of the transcriptome sequencing data. Comparative analysis of the three comparisons was resolved to 11,794 common DEGs, which were shown in the Venn diagram (Figure 5C).
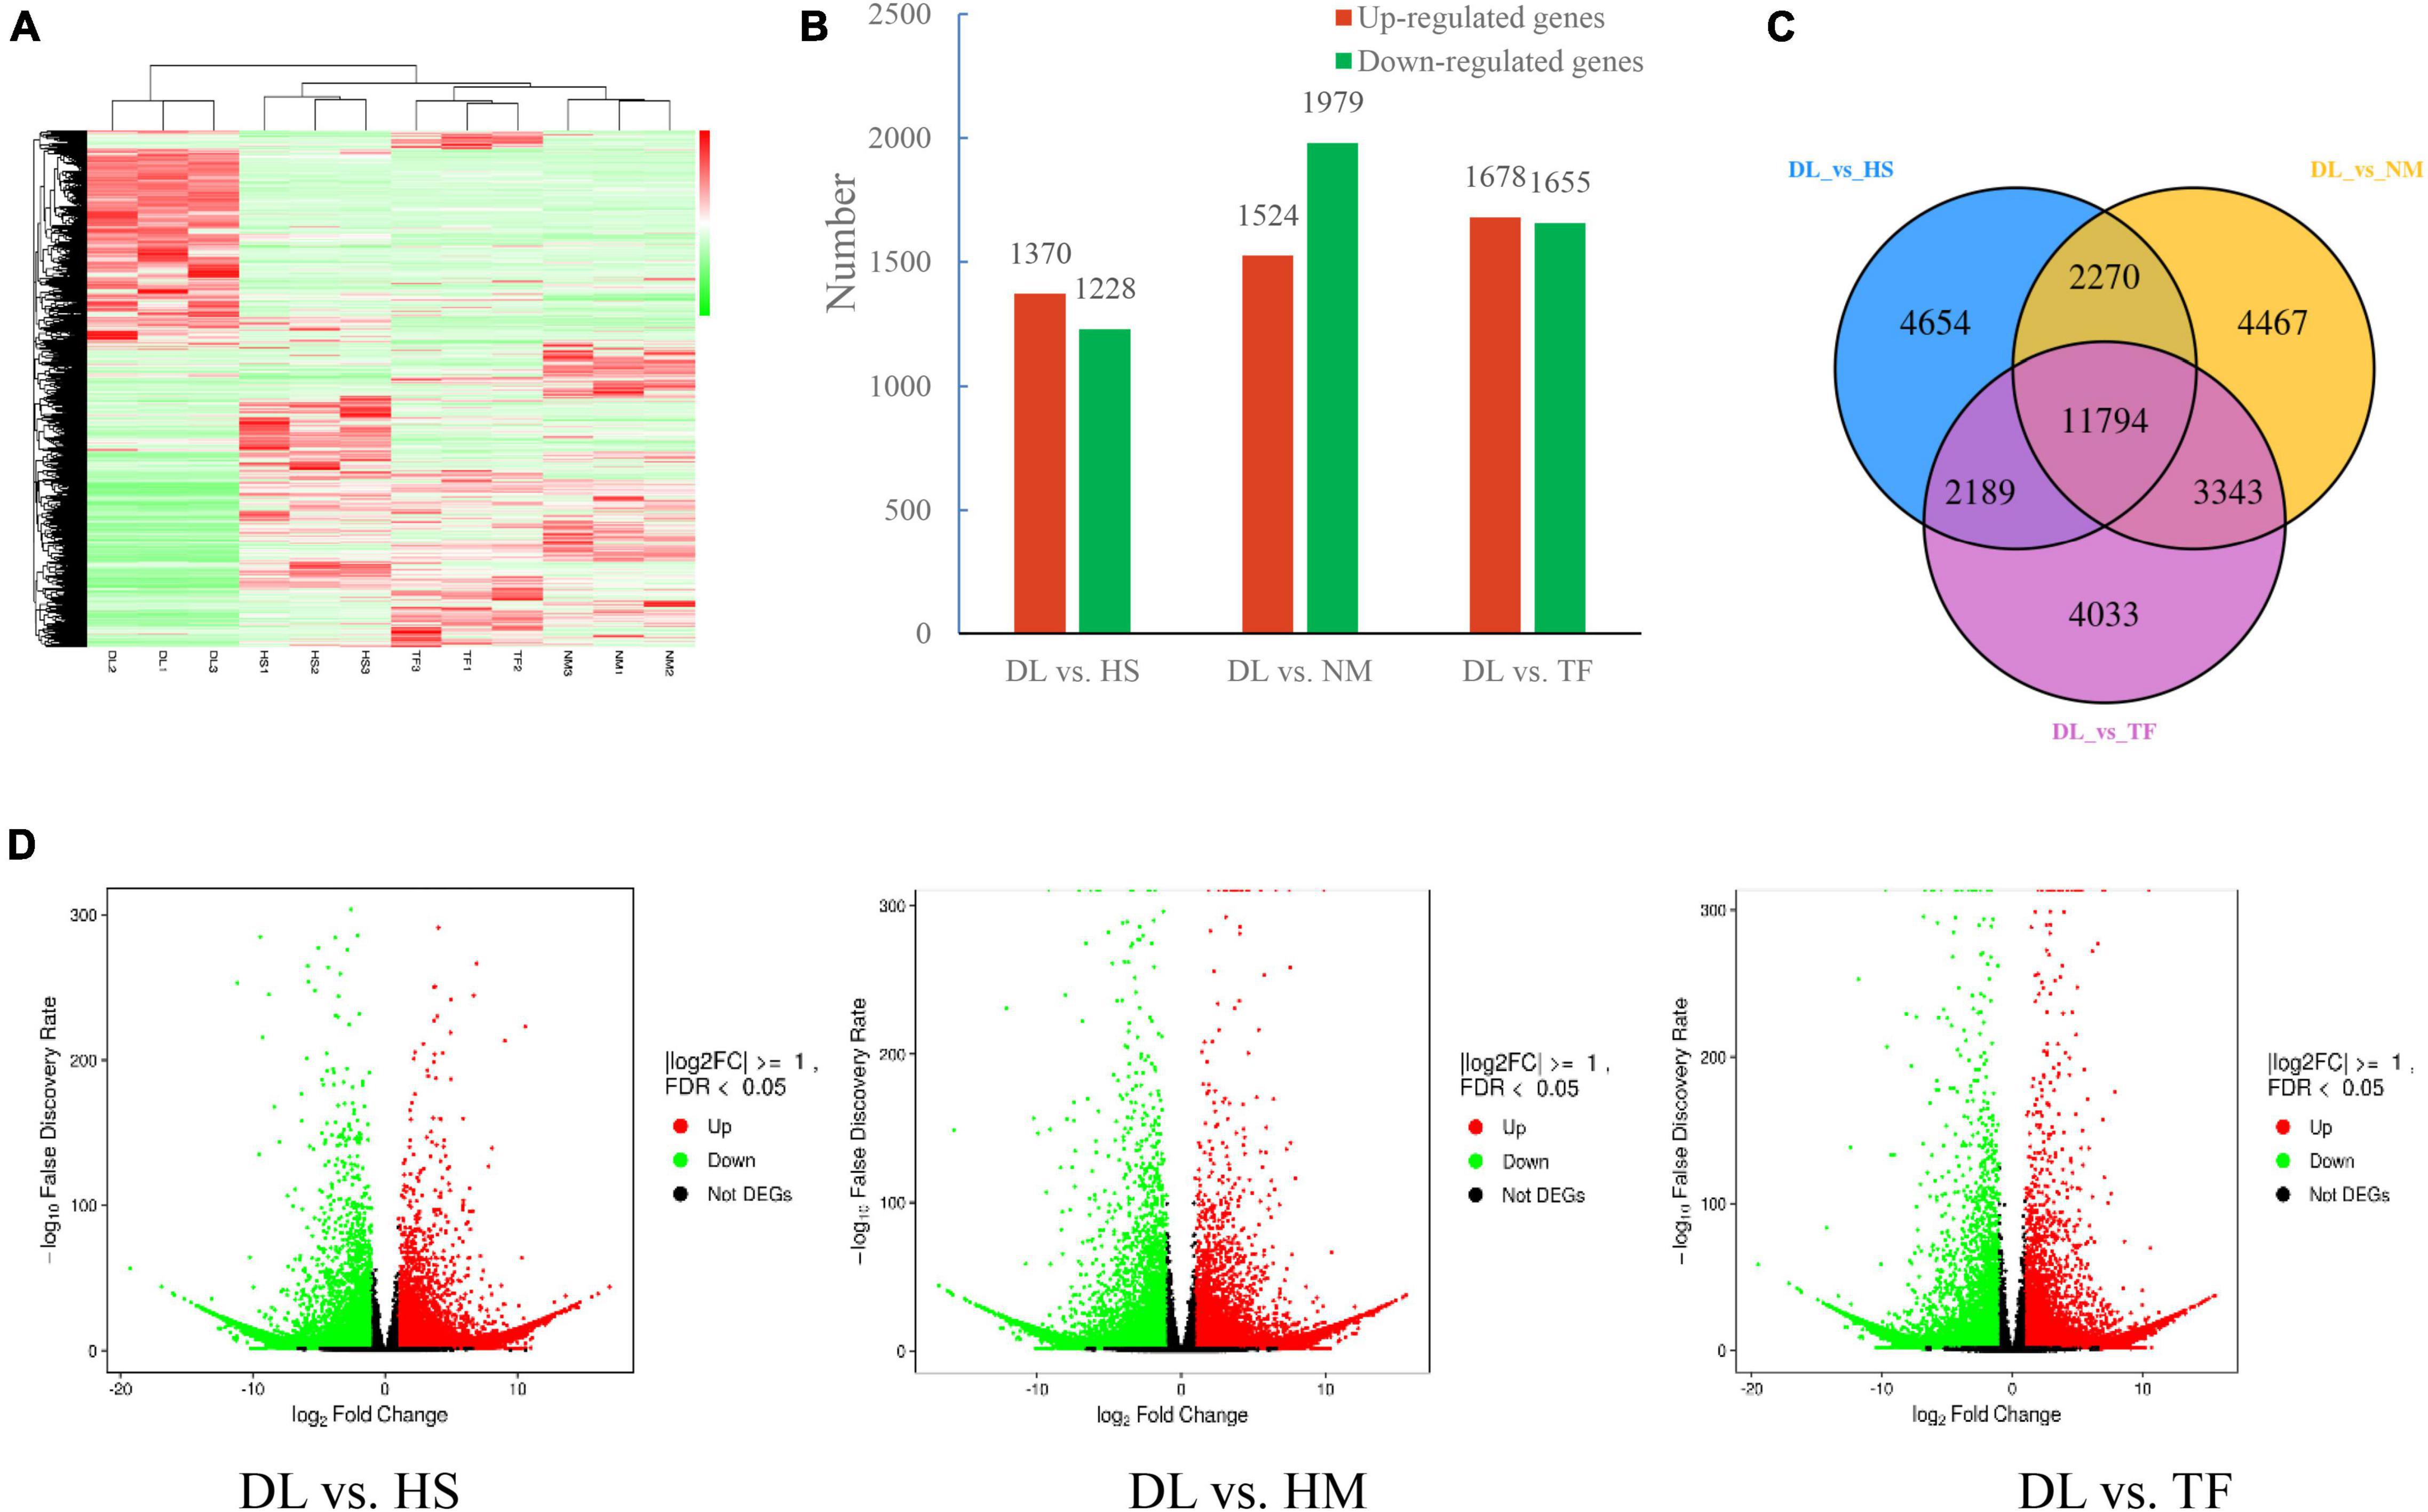
Figure 5. Differentially expressed genes (DEGs) in the three comparisons. (A) Heatmap of all the DEGs from the four samples. (B) Upregulated/downregulated DEGs in the three comparisons. (C) Venn diagrams of DEGs in the three comparisons. (D) Volcano plots of the DEGs from the comparison of DL vs. HS, DL vs. HM, and DL vs. TF, respectively, red/green dots indicate upregulated/downregulated expression of genes, respectively, and black dots indicate no difference.
By the Gene Ontology (GO) analysis, the 2,598 DEGs from the comparison of DL vs. HS were enriched into 2 classes and 51 subclasses, of which 1,244 (655 upregulated and 589 downregulated) and 1,354 (715 upregulated and 639 downregulated) DEGs were annotated with the GO terms related to “molecular function” and “biological process” (Figure 6A). The 3,503 DEGs from the comparison of DL vs. NM were enriched into 3 classes and 59 subclasses, of which 817 (253 upregulated and 564 downregulated), 1,469 (623 upregulated and 846 downregulated), and 1,217 (648 upregulated and 569 downregulated) were annotated with the GO terms related to “cellular component,” “molecular function,” and “biological process,” respectively (Figure 6B). The 3,333 DEGs from the comparison of DL vs. TF were enriched into 3 classes and 63 subclasses, of which 177 (85 upregulated and 92 downregulated), 1,387 (675 upregulated and 712 downregulated), and 1,769 (918 upregulated and 851 downregulated) were annotated with the GO terms related to “cellular component,” “molecular function,” and “biological process,” respectively (Figure 6C). The top enriched GO terms of the DEGs from the three comparisons were ADP binding, cell death, programmed cell death, iron ion binding, carbohydrate-binding, secondary metabolic process, and plant-type hypersensitive response, etc. (Figures 6D–F).
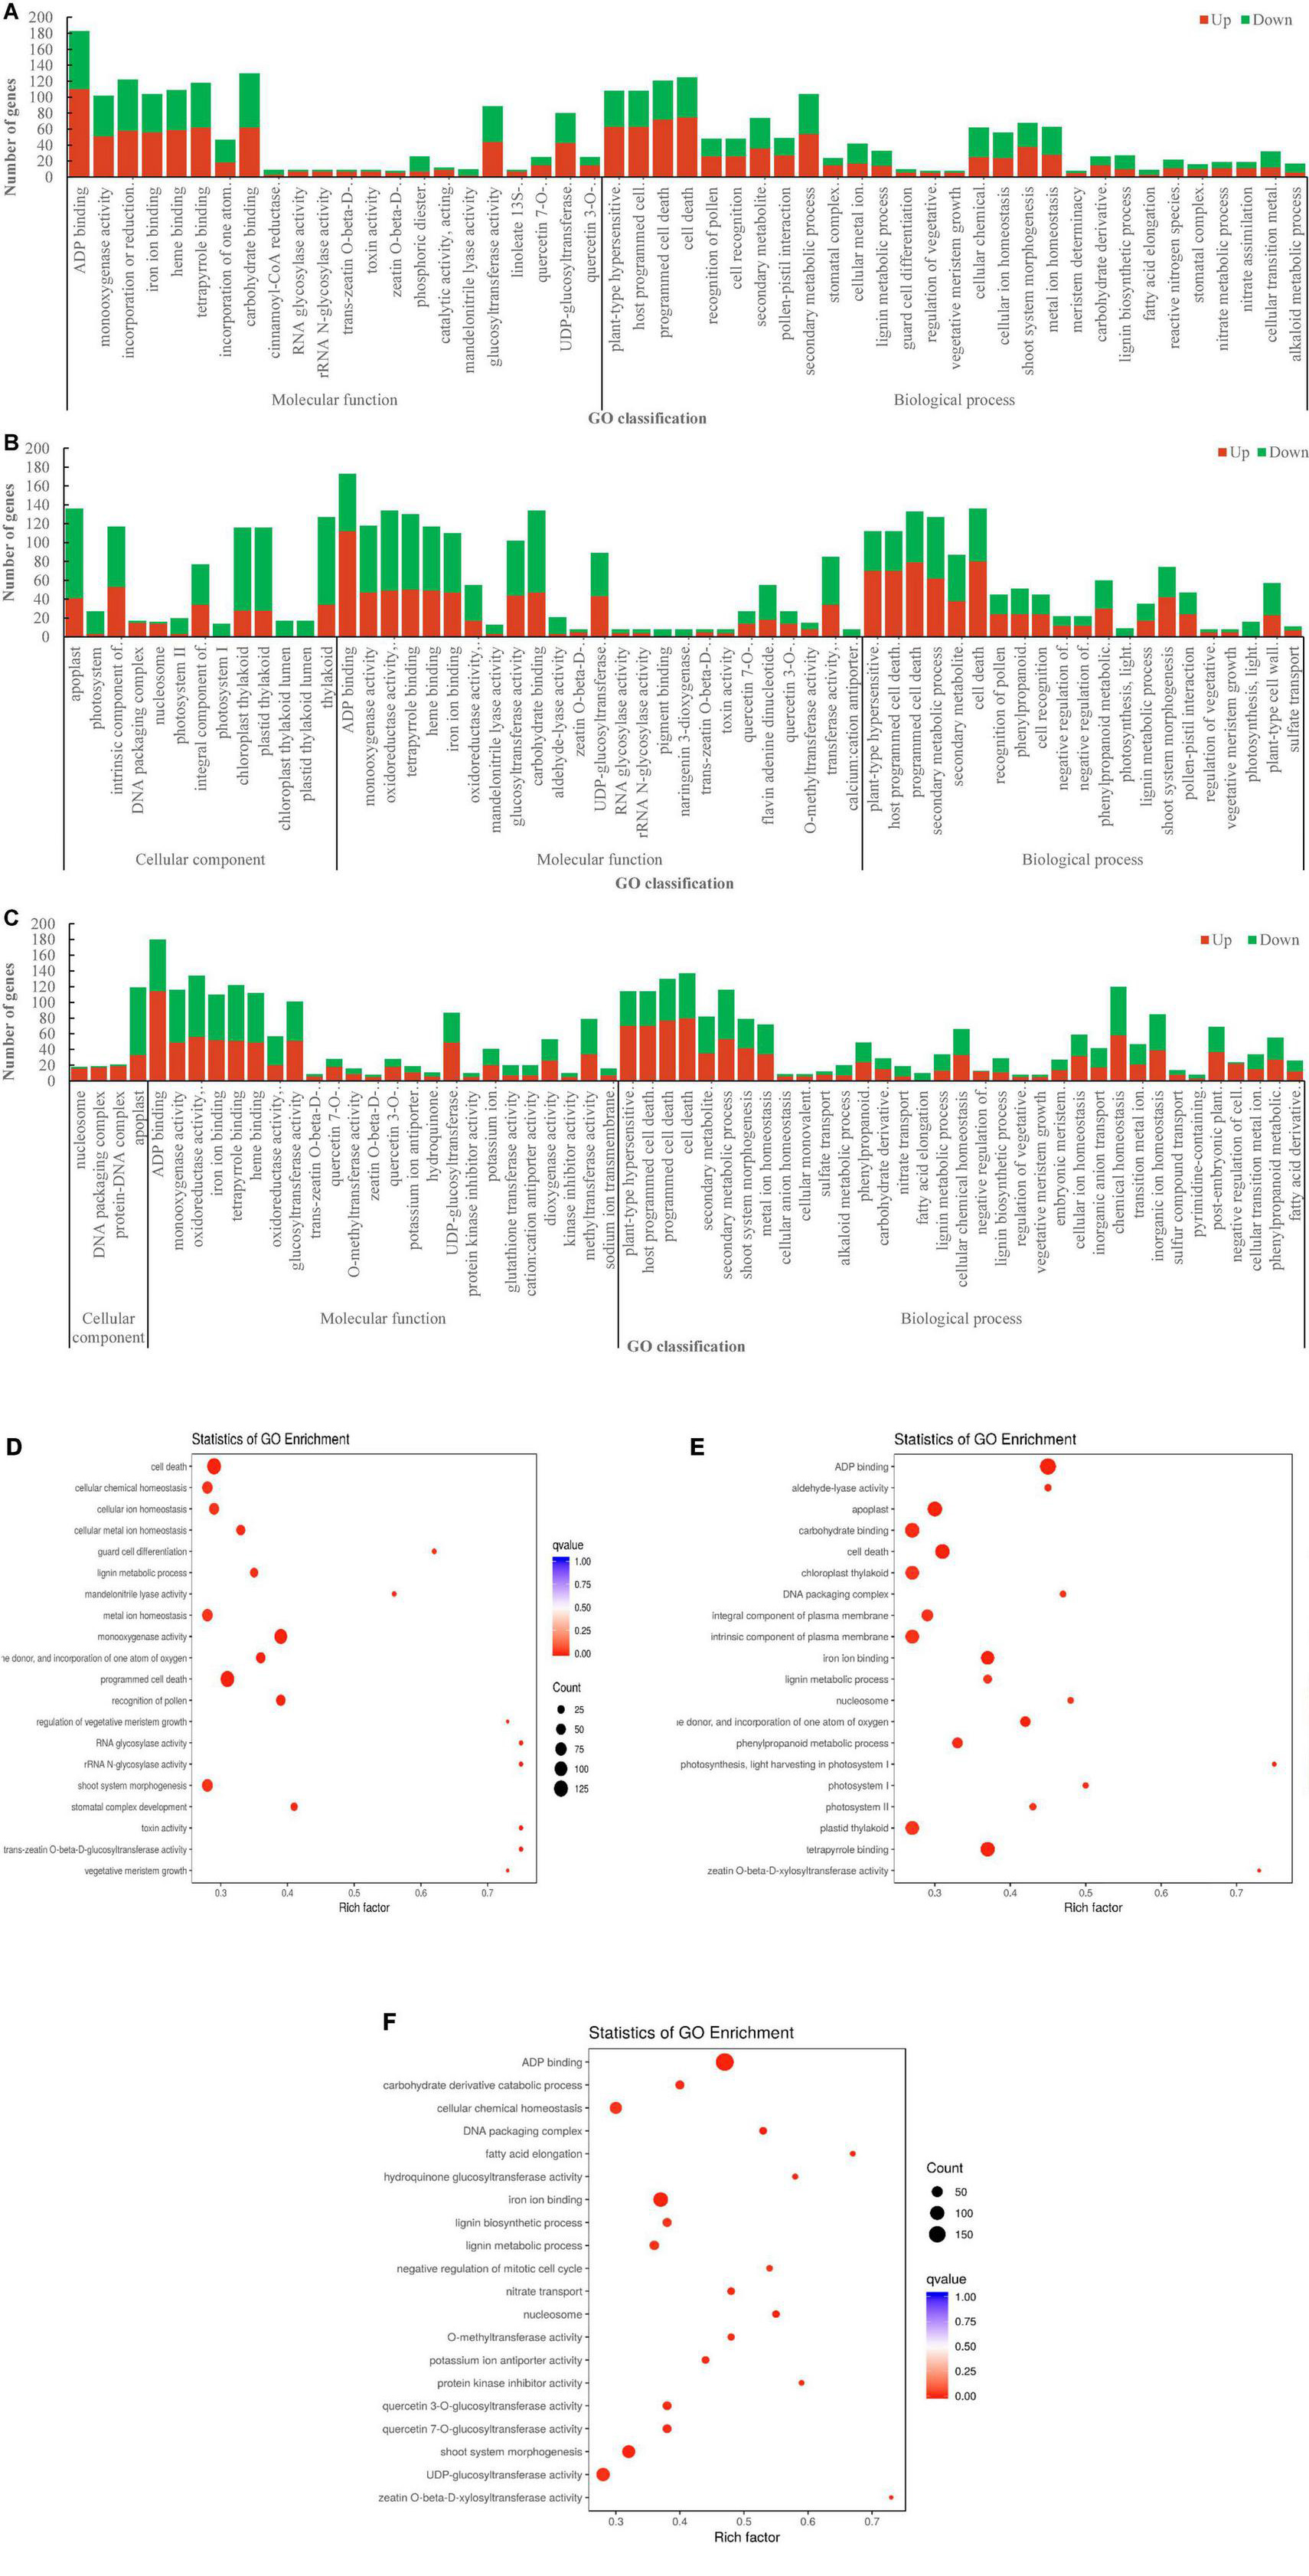
Figure 6. The Gene Ontology (GO) enrichment of DEGs from the three comparisons. (A) DL vs. HS. (B) DL vs. NM. (C) DL vs. TF. (D–F) The top enriched GO terms of the DEGs from the comparison of DL vs. HS, DL vs. NM, and DL vs. TF, respectively.
In the Kyoto Encyclopedia of Genes and Genomes (KEGG) pathway enrichment analysis, the top enriched KEGG pathways of the DEGs were biosynthesis of secondary metabolites, Toll and IMD signaling pathway, plant–pathogen interaction, Toll-like receptor signaling pathway, isoflavonoid biosynthesis, and flavonoid biosynthesis, etc. (Figures 7A–C). The KEGG-enriched DEGs involved in flavonoid biosynthesis, isoflavonoid biosynthesis, aroma degradation of aromatic compounds, and mineral absorption from the three comparisons are shown in Figure 7D.
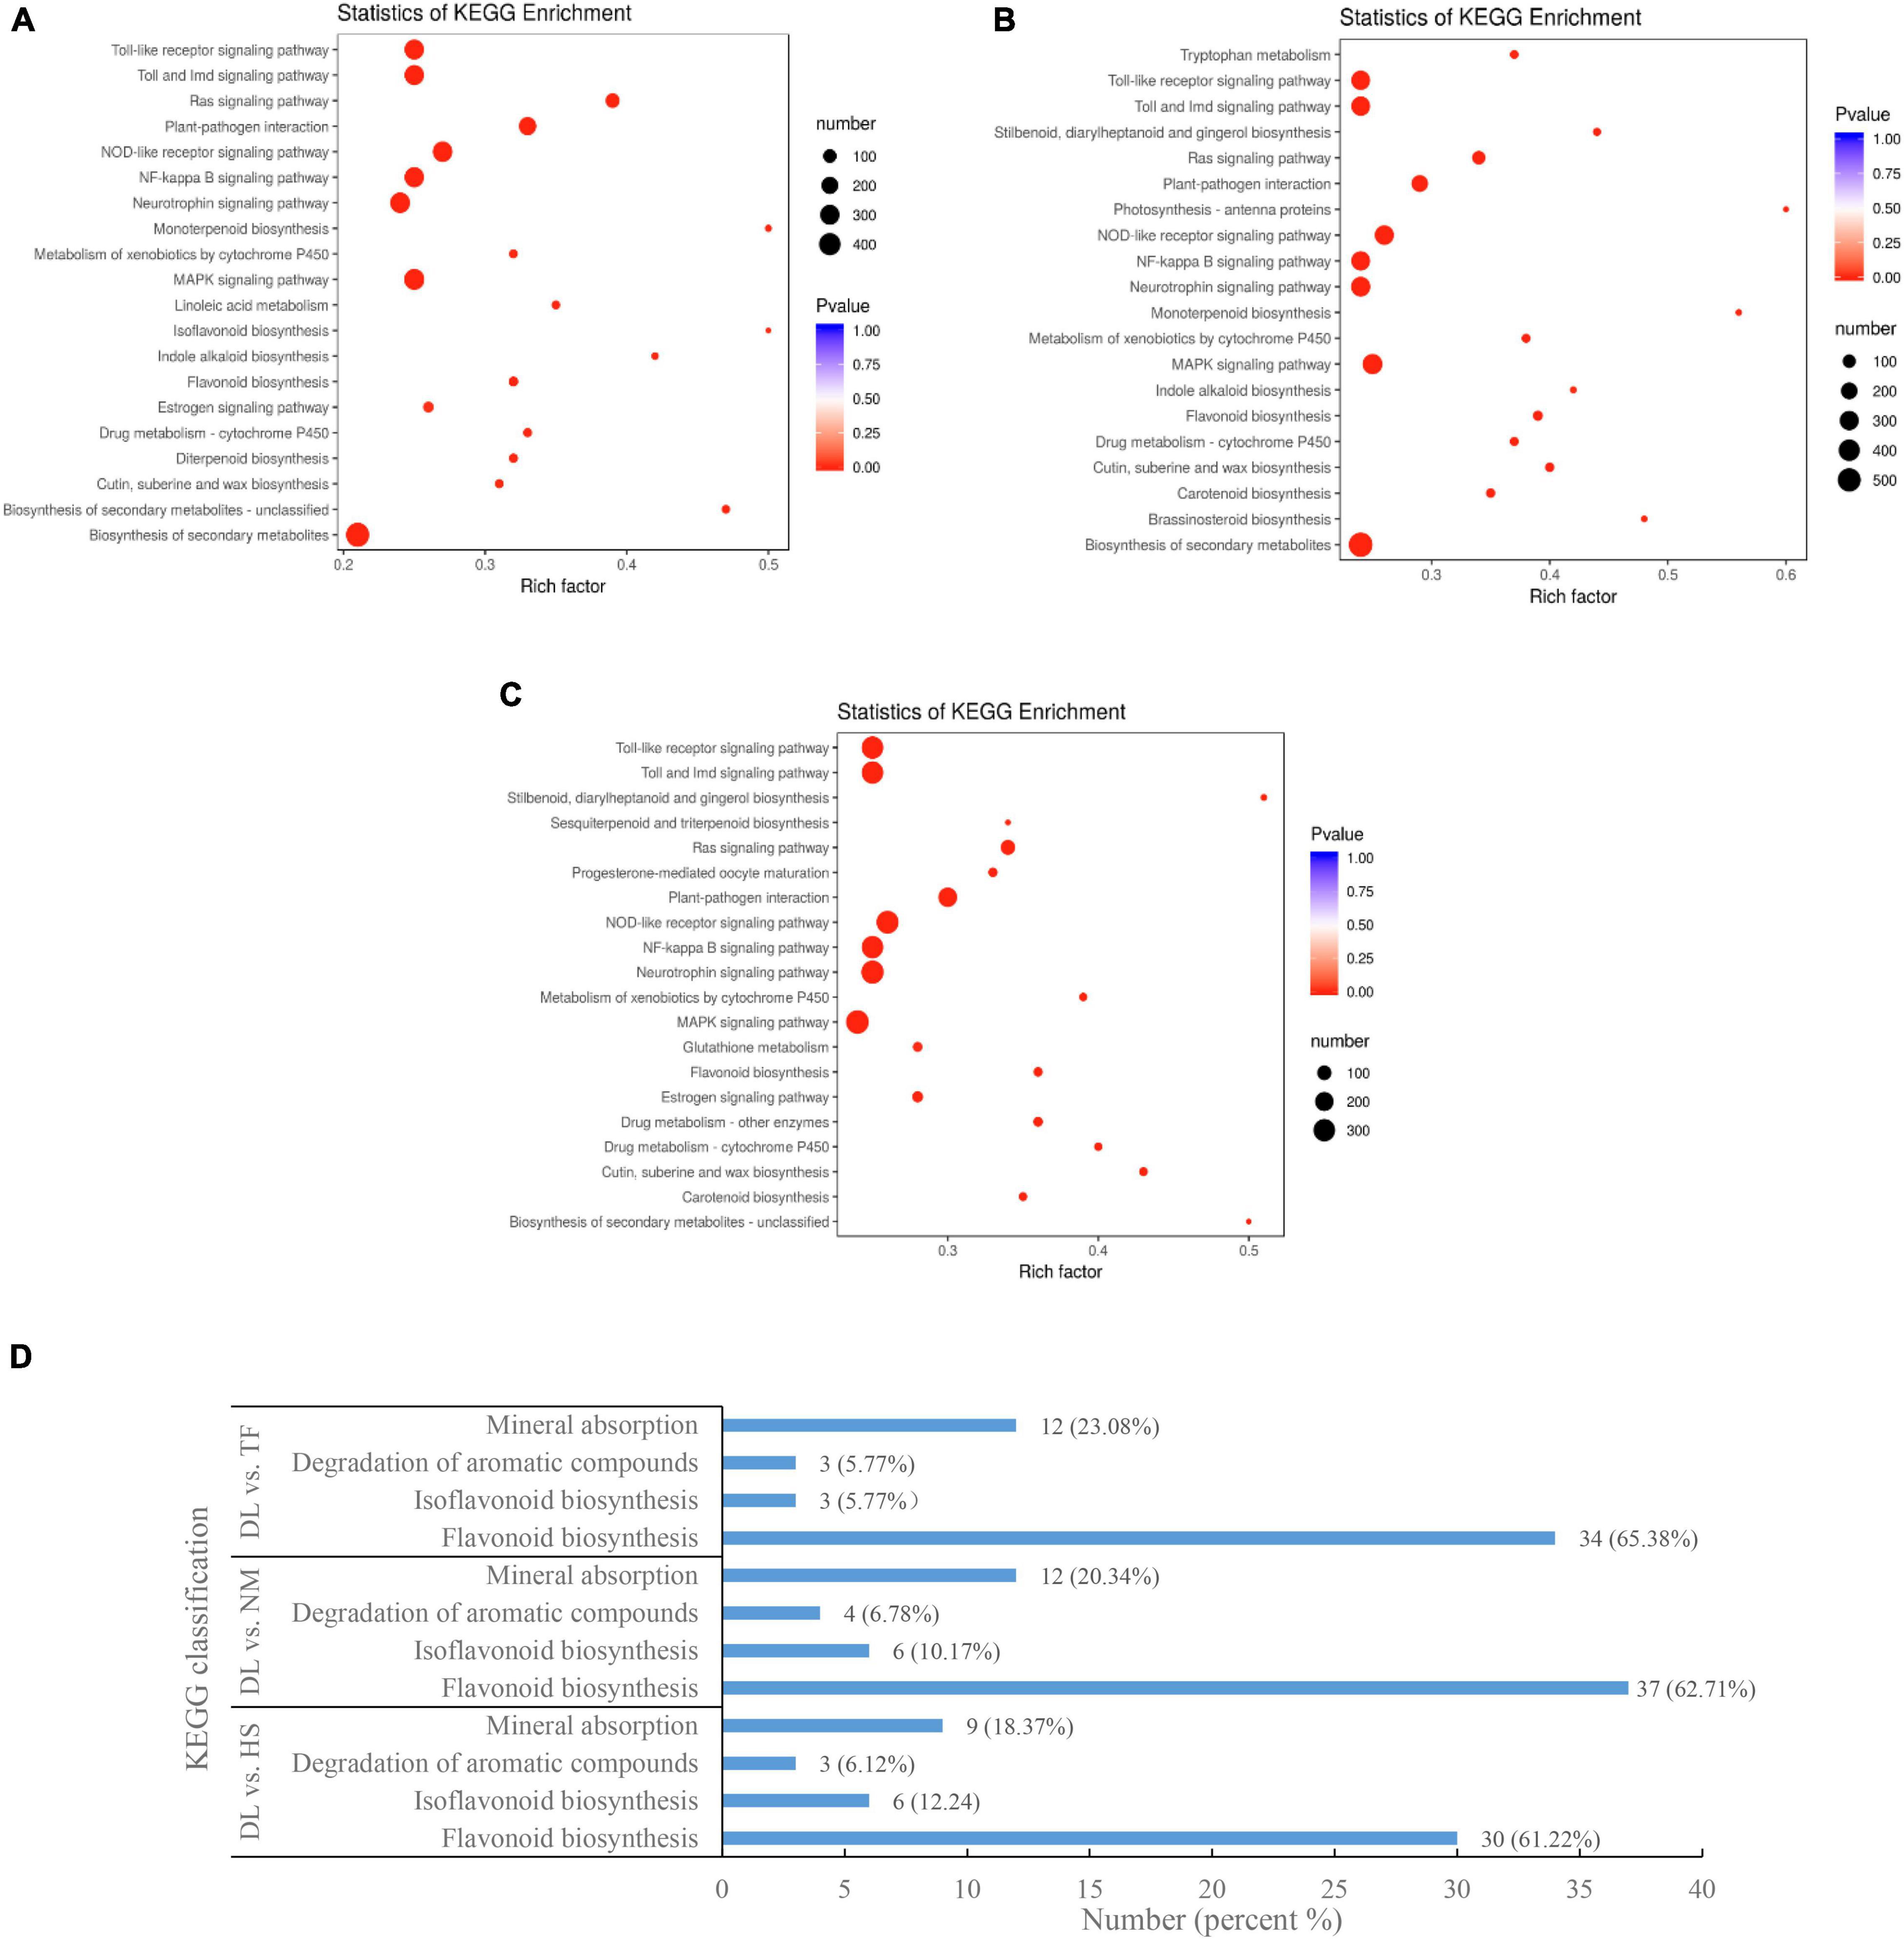
Figure 7. The KEGG enrichment of the DEGs from the three comparisons. (A–C) The top enriched KEGG terms from the comparison of DL vs. HS, DL vs. NM, and DL vs. TF, respectively. (D) The KEGG of DEGs related to flavonoid biosynthesis, degradation of aromatic compounds, and mineral absorption.
Quantitative Reverse Transcription-Polymerase Chain Reaction Validation of the Detected Differentially Expressed Genes
After the GO and the KEGG enrichment, the 15 DEGs related to flavonoid biosynthesis, degradation of aromatic compounds, and mineral absorption, which met with the parameter of | log2(fold change)| ≥ 1 (fold change ≥2 or <0.5) and P-value < 0.05 simultaneously in the three comparisons (Figures 8A,B), were selected for qRT-PCR validation (Table 1). Of the 15 DEGs, the FPKM values of 13 DEGs from HS, NM, and TF were more than twice that of DL and the FPKM values of DN41367_c2_g1 and DN25744_c0_g1 were 0.5-fold greater than that of DL (Figure 8A), resulting in the | log2(fold change)| of the FPKM for all the 15 DEGs ranging from 1.16 to 8.57 (Figure 8B).
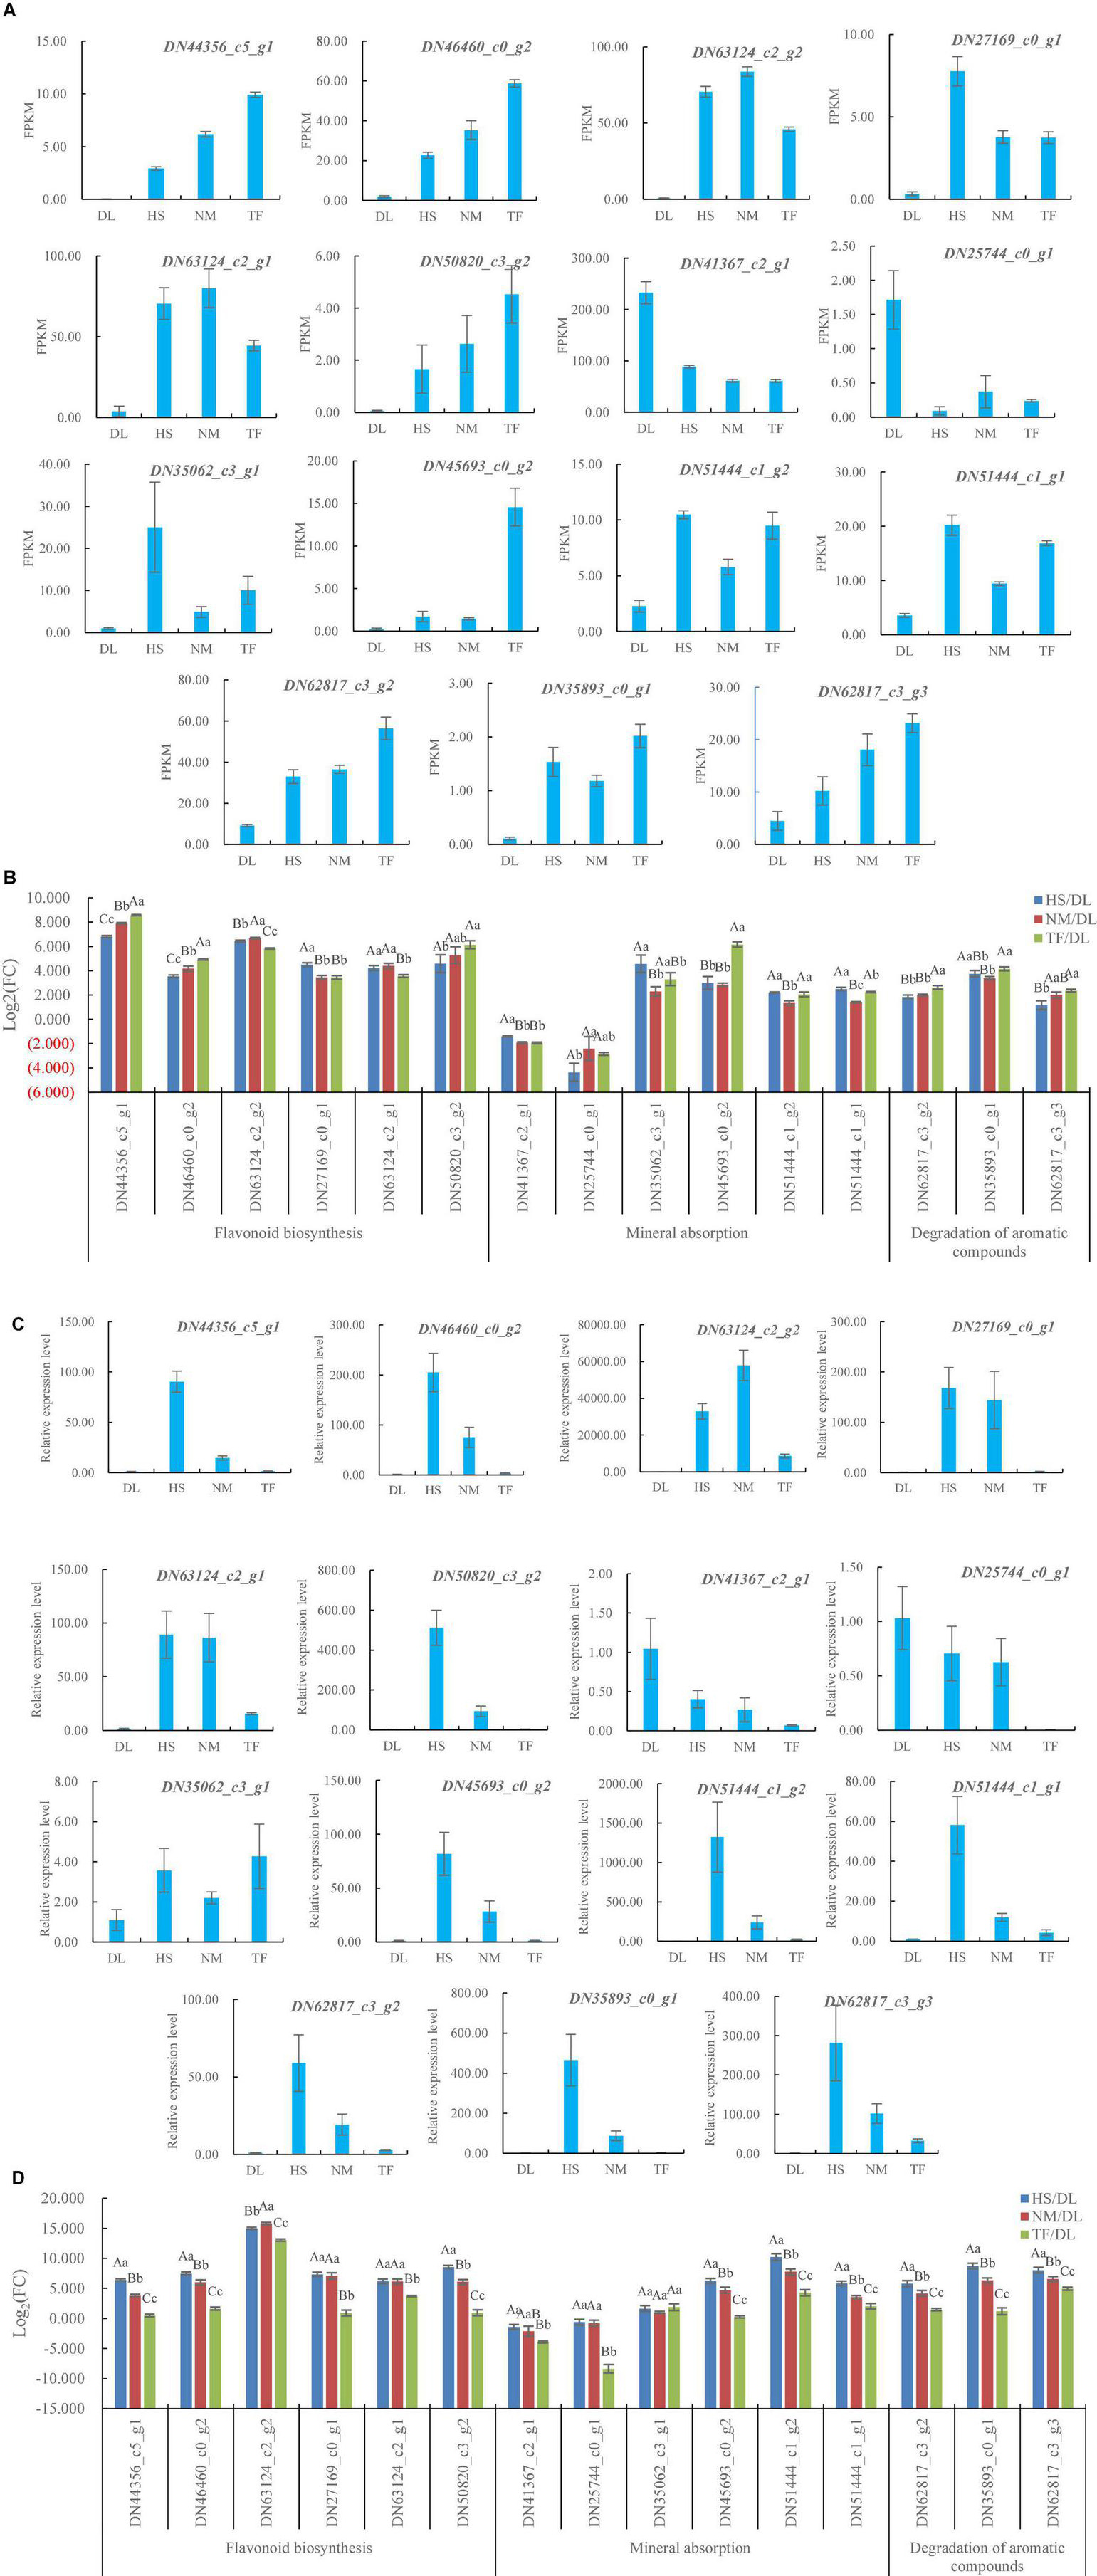
Figure 8. Differentially expressed genes (DEGs) in HS, HM, and TF compared with DL. (A) DEGs from RNA sequencing (RNA-seq) data. (B) Log2(fold change) of the FPKM for the DEGs from RNA-seq data. (C) Relative expression level of the DEGs. (D) Log2(fold change) of the relative expression level for the DEGs. Error bars indicate the SD of three biological replicates. The upper case and lower case indicated the significant difference at P < 0.01 and P < 0.05 level, respectively.
The qRT-PCR results showed that, of the selected 15 genes, the relative expression level of 13 DEGs from HS, NM, and TF was higher than that of DL and the relative expression level of DN41367_c2_g1 and DN25744_c0_g1 was less than that of DL (Figure 8C), resulting in the | log2(fold change)| of relative expression level for all the 15 DEGs ranging from 0.26 to 15.79 (Figure 8D). The results were consistent with RNA sequencing data, indicating the reliability of RNA sequencing and qRT-PCR validation.
Conjoint Analysis of Transcriptome and Metabolome
The principal component analysis (PCA) based on the conjoint analysis of RNA-seq data and metabolome profile showed that the three biological replicates of each samples clustered together in the two-dimensional (2D) PCA plot (Figure 9A) and three-dimensional (3D) PCA plot (Figure 9B), which was consistent with the PCA analysis of RNA-seq data (Figure 4) and metabolome profile (Figure 1B) separately, indicating that the reliability of transcriptome and metabolome profiles.
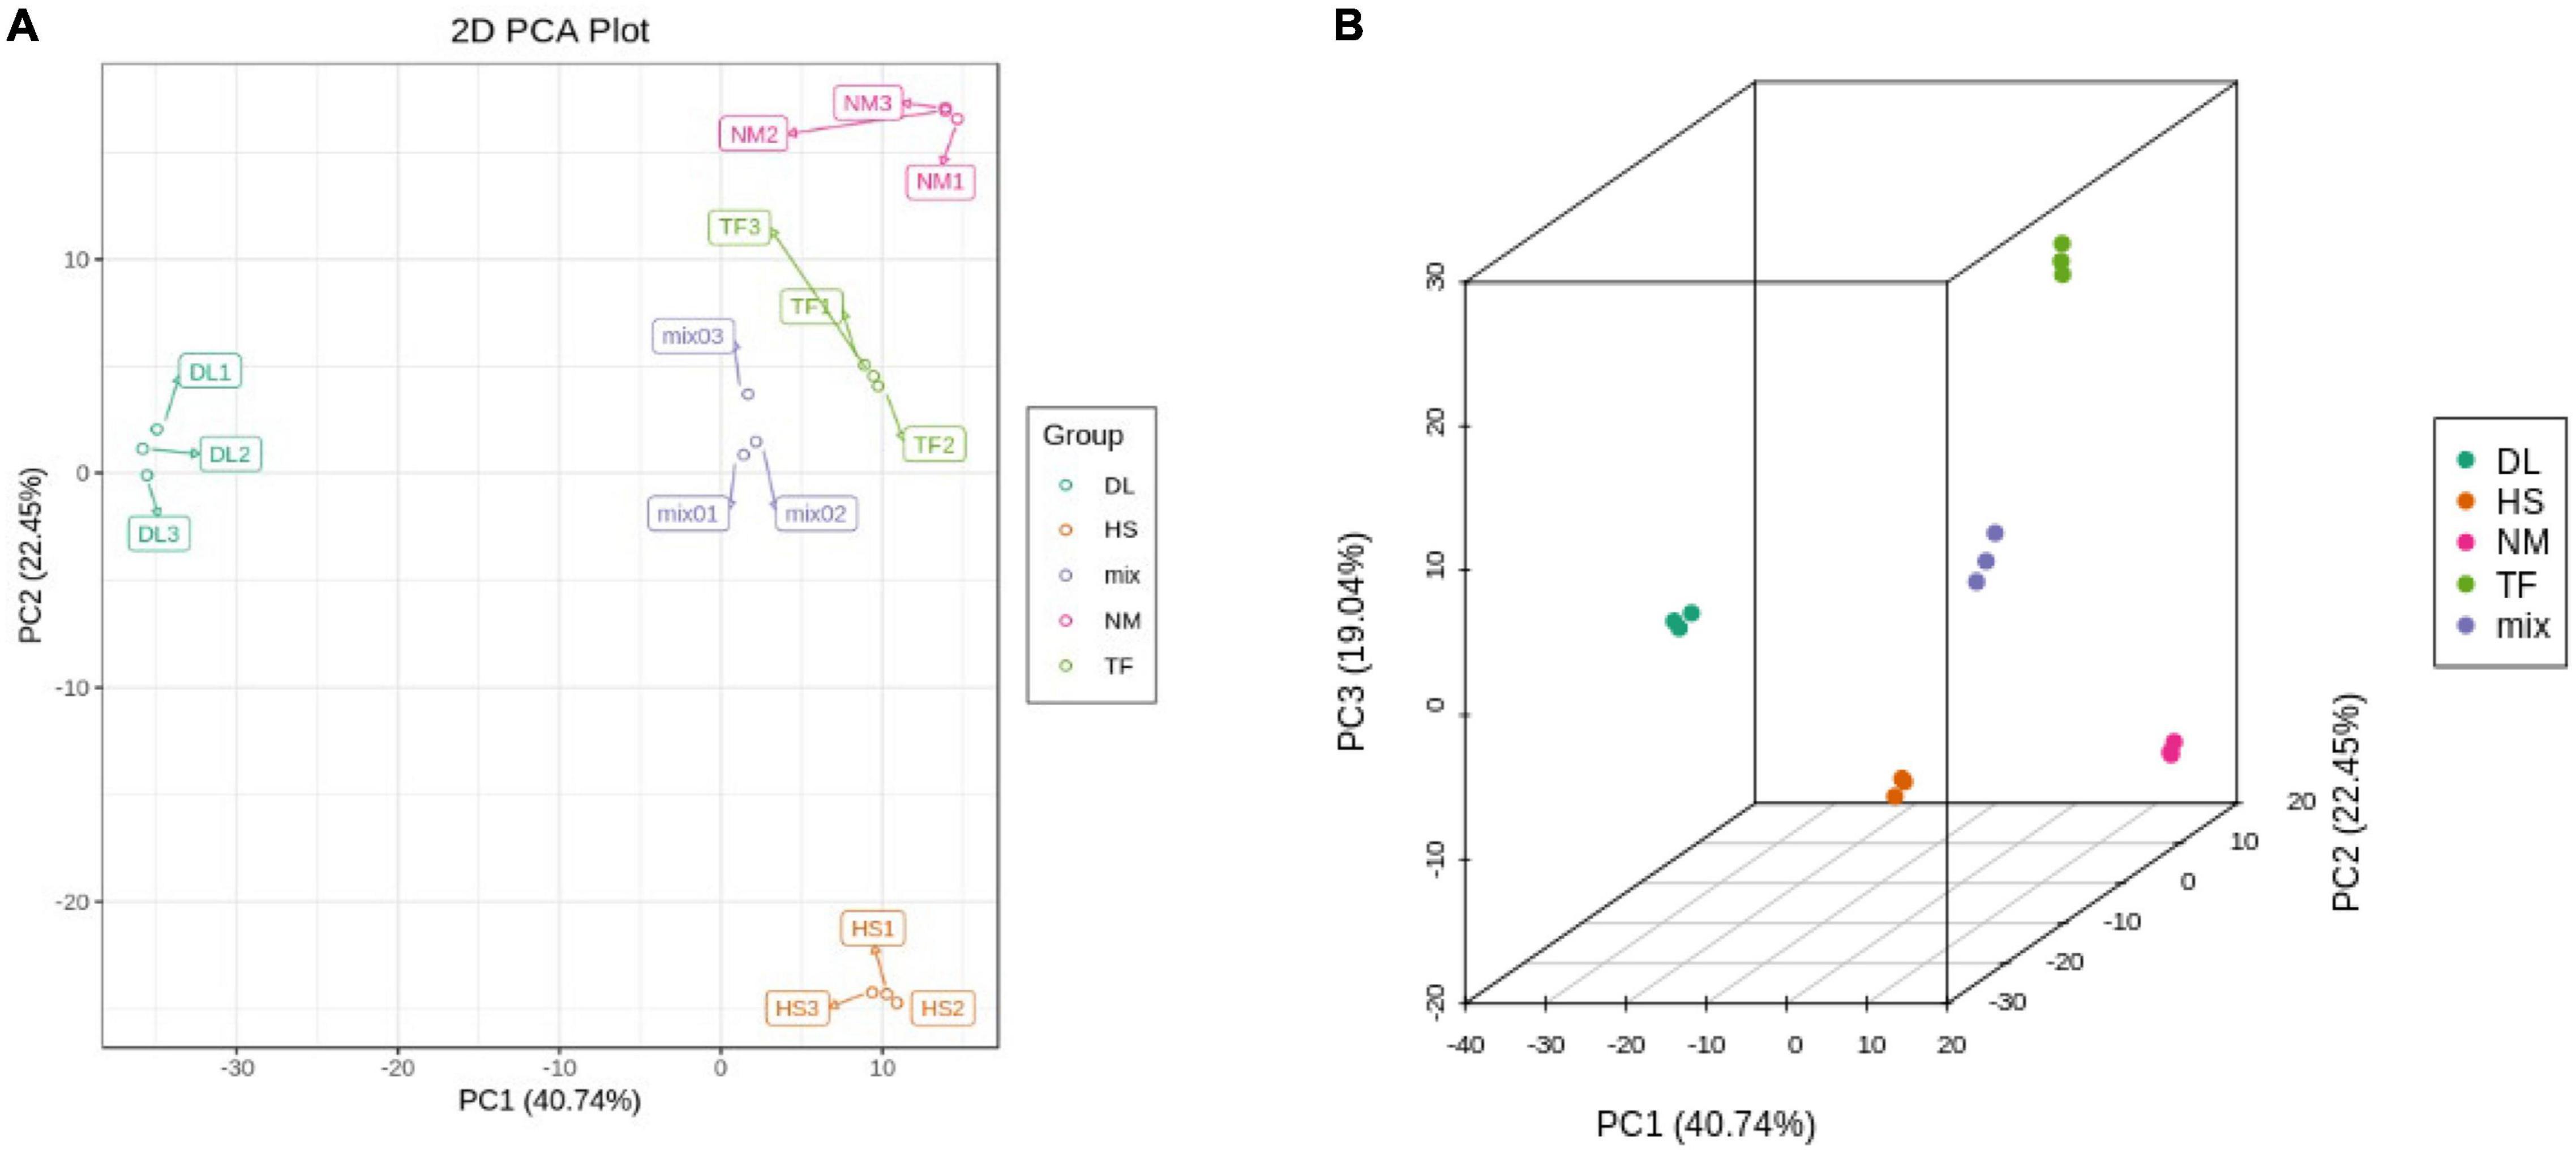
Figure 9. The two-dimensional (2D) PCA plot (A) and three-dimensional (3D) PCA plot (B) of conjoint analysis.
For all the 15 selected DEGs related to flavonoid biosynthesis, degradation of aromatic compounds, and mineral absorption, the Pearson correlation coefficient (PCC) of DEGs was ≥0.8 and all the DEGs were clustered in the cor heatmap, of which the DEGs related to flavonoid biosynthesis were top enriched (Figure 10A). In addition, in the nine quadrants diagram, all the 15 DEGs were located at the quadrant of 3 or 7, which indicate that these DEGs were positively correlated with their metabolites (Figure 10B).
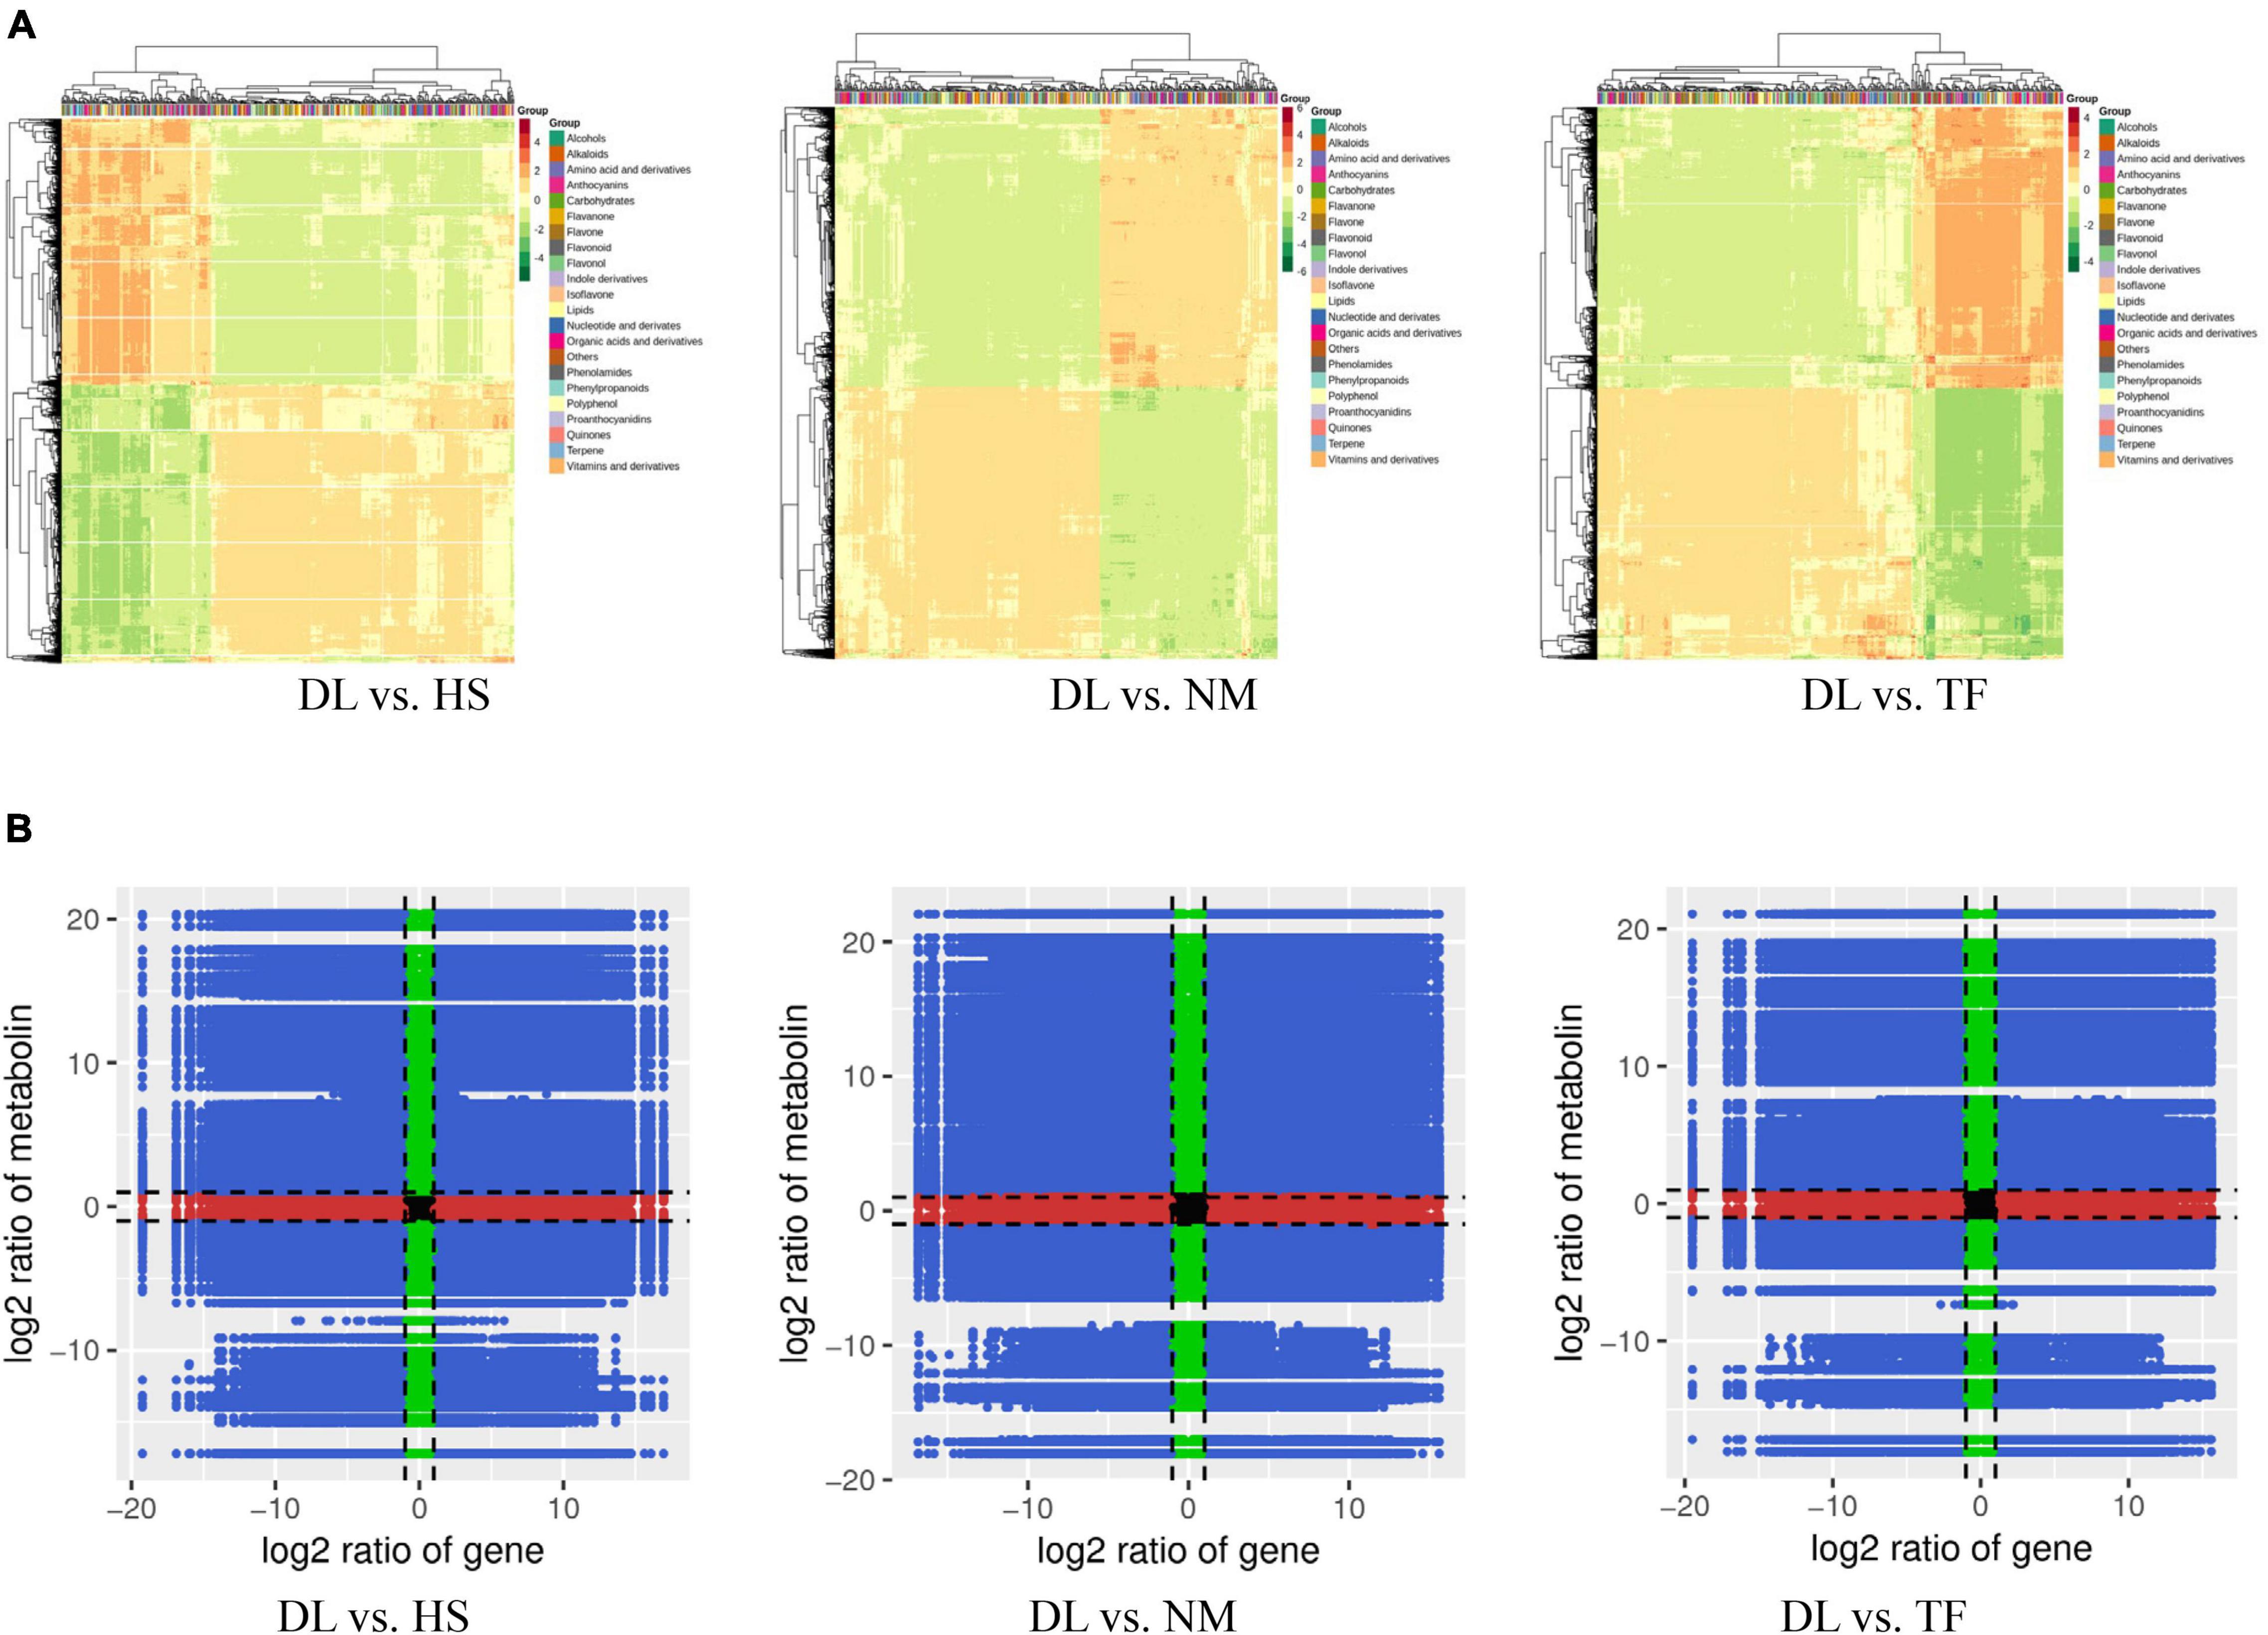
Figure 10. Conjoint analysis of RNA-seq data and metabolome profile from the three comparisons. (A) The cor heatmap of the comparison of DL vs. HS, DL vs. NM, and DL vs. TF. (B) The nine quadrants diagram of the comparison of DL vs. HS, DL vs. NM, and DL vs. TF. The (night quadrants diagram) were divided into 9 parts (1–9, from left to right, and from up to down in sequence) by the dotted line.
Discussion
Persimmon leaves can be used for making persimmon leaf tea or as a functional ingredient to add healthy and therapeutic properties (Jo et al., 2003; Sakanaka et al., 2005; Martínez-Las Heras et al., 2016, 2017) due to their possessing high medical values and exhibiting many biological activities, such as neuroprotection, radical scavenging, antithrombotic, antiallergic, and antimutagenic (Kotani et al., 2000; Matsumoto et al., 2002; Sakanaka et al., 2005; Chang et al., 2019), based on their enrichment in flavonoids, which are considered to be the primary active antioxidant components (Liu et al., 2012; Martínez-Las Heras et al., 2014, 2016).
As a functional beverage, the quality and flavor of persimmon leaf tea were primarily determined by the flavonoid contents, mineral contents, and aromatic aroma compounds, which were significantly influenced by the varieties or cultivars of persimmon. It is reported that the leaves from the PCA varieties, such as D. kaki cv. Bull Heart, D. kaki cv. Diamond Bull Heart, D. kaki cv. Aoso, and D. japonica, had higher levels of total flavonoid, the leaves from D. kaki cv. Amahyakume (PVNA) and D. kaki cv. Fuyu (PCNA) contained a lower amount of total flavonoid, and the leaves from the PVA variety D. kaki cv. Tonewase contained the lowest amount of total flavonoid (Chang et al., 2019). In this study, we selected PCA persimmon “Diospyros kaki. Heishi” (HS), PVNA persimmon “Diospyros kaki Thunb. Nishimurawase” (NM), and “Diospyros kaki Thunb. Taifu” (TF), using the rootstock “Diospyros Lotus Linn” (DL) as the control, to conduct the integrated metabolomic-transcriptomic analysis to investigate the flavonoid biosynthesis, mineral absorption, and degradation of aromatic compounds from their leaves, so as to estimate and recommend the suitable persimmon leaves for making persimmon leaf tea with higher and specified functional benefits.
In this study, flavonoid biosynthesis and isoflavonoid biosynthesis from the three compared groups of DL vs. HS, DL vs. NM, and DL vs. TF were top enriched in the KEGG terms of the differentially accumulated metabolites (DAMs; Figures 2D–F) and 229 common metabolites were obtained (Figure 2G). Meanwhile, the KEGG pathway of flavonoid biosynthesis was top enriched in the three comparisons and the KEGG pathway of isoflavonoid biosynthesis was top enriched in the comparison of DL vs. HS (Figure 7A). In detail, 30, 37, and 34 DEGs related to flavonoid biosynthesis and 6, 6, and 3 DEGs related to isoflavonoid biosynthesis were obtained from the comparison of DL vs. HS, DL vs. NM, and DL vs. TF, respectively (Figure 7B). Of the above DEGs, 2 DEGs (DN44356_c5_g1 and DN46460_c0_g2) related to flavonoid biosynthesis and 4 DEGs (DN63124_c2_g2, DN27169_c0_g1, DN63124_c2_g1, and DN50820_c3_g2) related to isoflavonoid biosynthesis simultaneously met with the parameters of | log2(fold change)| ≥ 1 and P-value < 0.05 in the three comparisons, with log2(fold change) of 3.44–8.57 (Figure 8B), which were, thus, selected for the following qRT-PCR validation. Fortunately, qRT-PCR validation showed that the relative expression level of these 6 DEGs exhibited consistent trends with the FPKM of each DEG from RNA-seq data, respectively, with log2(fold change) of 0.49–15.79 (Figure 8D).
Mineral elements of food are stable and can be used as the signature of geographical origin of the product (Zhao et al., 2017b; Li et al., 2018). The mineral contents and the quality of tea leaves were influenced by the factors of geographical origin, variety, climate conditions, harvest season, or growth stage (Jia et al., 2016; Zhao et al., 2017a). Among the factors, species and variety/cultivar played the important role in the mineral contents and the tea quality of the plants, which were grown in the geographic location.
In this study, mineral absorption from the three compared groups of DL vs. HS, DL vs. NM, and DL vs. TF was not top enriched in the KEGG terms of the DAMs (Figures 2D–F) and the KEGG pathway of mineral absorption was also not top enriched in the transcriptome profiles from the three comparisons (Figure 7A). However, 9, 12, and 12 DEGs related to mineral absorption were obtained from the comparison of DL vs. HS, DL vs. NM, and DL vs. TF, respectively (Figure 7B). Of which, 6 DEGs, including 2 downregulated DEGs (DN41367_c2_g1 and DN25744_c0_g1) and 4 upregulated DEGs (DN35062_c3_g1, DN45693_c0_g2, DN51444_c1_g2, and DN51444_c1_g1) simultaneously met with the parameters of | log2(fold change)| ≥ 1 and P-value < 0.05 in the three comparisons, with | log2(fold change)| of 1.34–6.15 (Figure 8B), which were then selected for the following qRT-PCR validation. The qRT-PCR validation showed that the relative expression level of the 6 DEGs exhibited consistent trends with the FPKM of each DEG from RNA-seq data, respectively (2 downregulated and 4 upregulated), with | log2(fold change)| of 0.26–10.21 (Figure 8D).
As a functional beverage, persimmon leaf tea attracts more and more consumers partly due to the unique flavors, especially the aroma contributed by volatile aroma compounds. Aroma compounds come from aroma compound precursors, such as aromatic compounds, through several different pathways by endoenzymatic reaction during manufacturing processes (Feng et al., 2019; Guo et al., 2019; Amorim et al., 2020). The potential level in degradation of aromatic compounds played an important part in the generation of tea flavors and the number of volatile aroma compounds is diverse in persimmon types and their varieties (Wang et al., 2012). In this study, degradation of aromatic compounds from the three compared groups of DL vs. HS, DL vs. NM, and DL vs. TF was not top enriched in the KEGG terms of the DAMs (Figures 2D–F) and the KEGG pathway of degradation of aromatic compounds was also not top enriched in the transcriptome profiles from the three comparisons (Figure 7A). However, 3, 4, and 3 DEGs related to the degradation of aromatic compounds were obtained from the comparison of DL vs. HS, DL vs. NM, and DL vs. TF, respectively (Figure 7B) and the 3 common DEGs met simultaneously with the parameters of | log2(fold change)| ≥ 1 and P-value < 0.05 in the three comparisons, with log2(fold change) of 1.16–4.16 (Figure 8B); thus, the 3 DEGs were selected for the following qRT-PCR validation. Similar to mineral absorption, flavonoid biosynthesis, and isoflavonoid biosynthesis, the relative expression level of the 3 DEGs exhibited consistent trends with the FPKM of each DEG from RNA-seq data, respectively, with log2(fold change) of 1.20–8.75 (Figure 8D).
In this study, of the 6 DEGs involved in flavonoid biosynthesis, which will determine the level of total flavonoid in persimmon leaves, the | log2(fold change)| of the FPKM of 4 DEGs (DN44356_c5_g1, DN46460_c0_g2, DN63124_c2_g2, and DN50820_c3_g2), 1 DEG (DN27169_c0_g1), and 1 DEG (DN63124_c2_g1) from comparisons of DL vs. NM was significantly greater than, significantly less than, and had no significant difference with those from a comparison of DL vs. HS. For the comparison of DL vs. TF, the | log2(fold change)| of the FPKM of 3 DEGs (DN44356_c5_g1, DN46460_c0_g2, and DN50820_c3_g2) and 3 DEGs (DN63124_c2_g2, DN27169_c0_g1, and DN63124_c2_g1) was significantly greater and significantly less than those from comparison of DL vs. HS, respectively (Figure 8B), i.e., the expression level of flavonoid biosynthesis from the leaves of Diospyros kaki Thunb. Nishimurawase (NM) was significantly higher than Diospyros kaki. Heishi (HS) and the flavonoid biosynthesis from the leaves of Diospyros kaki Thunb. Taifu (TF) was at least at an equivalent level with HS. These results represented a greater level of total flavonoid in the NM leaves (PCNA persimmon) than TF (PCNA persimmon) and HS (PCA persimmon) leaves and equivalent level of total flavonoid in TF and HS leaves, which were a little different from the report by Chang et al. (2019), in which, the leaves from PCA persimmons had higher levels of total flavonoid and leaves from PVNA persimmons had lower levels of total flavonoid. Therefore, it could be deduced that the leaves from the same type of persimmons might have different levels of total flavonoid, while the leaves from the different types of persimmons would have similar levels of total flavonoid.
According to the mineral contents in persimmon, Tardugno et al. (2021) evaluated the mineral composition of persimmon fruits from different regions; the results showed that the mineral profile of persimmon fruits was variable across the regions. But up to now, there were no reports about the mineral contents or composition from different varieties/cultivars of persimmons grown in the same region. In this study, of the 6 DEGs involved in mineral absorption, which will determine the mineral contents from the persimmon leaves, the | log2(fold change)| of 1 DEG (DN25744_c0_g1), 4 DEGs (DN41367_c2_g1, DN35062_c3_g1, DN51444_c1_g2, and DN51444_c1_g1), and 1 DEG (DN45693_c0_g2) from a comparison of DL vs. NM was significantly greater than, significantly less than, and have no significant difference with those from a comparison of DL vs. HS, respectively; the | log2(fold change)| of 2 DEGs (DN25744_c0_g1 and DN45693_c0_g2), 3 DEGs (DN41367_c2_g1, DN35062_c3_g1, and DN51444_c1_g1), and 1 DEG (DN51444_c1_g2) from a comparison of DL vs. TF was significantly greater than, significantly less than, and have no significant difference with those from a comparison of DL vs. HS, respectively (Figure 8B). In a word, the expression level of mineral absorption from the leaves of NM and TF was both less than that of HS, i.e., the leaves of HS had a greater level of mineral contents than those of NM and TF.
According to the flavor compounds in persimmon, Wang et al. (2022) reported the influence of microbial diversity on the flavor metabolites during the persimmon vinegar fermentation. However, there were no reports about the influence of persimmon variety/cultivar on the flavor metabolites and their contents. In this study, of the 3 DEGs involved in the degradation of aromatic compounds, which will determine the level of flavor metabolites, especially aroma compounds in persimmon leaves, the | log2(fold change)| of 1 DEG (DN62817_c3_g3), 1 DEG (DN35893_c0_g1), and 1 DEG (DN62817_c3_g2) from the comparison of DL vs. NM was significantly greater than, significantly less than, and have no significant difference with those from the comparison of DL vs. HS, respectively; the | log2(fold change)| of all the 3 DEGs from the comparison of DL vs. TF was significantly greater than those from the comparison of DL vs. HS, respectively (Figure 8B). In other words, the degradation of aromatic compounds from the leaves of NM was at least at an equivalent level with HS and the degradation of aromatic compounds from the leaves of TF was significantly greater than HS.
The following qRT-PCR validation showed that the relative expression level of all these 15 DEGs exhibited consistent trends with the FPKM of each DEG from RNA-seq data; in addition, the conjoint analysis confirmed the positive correlation between the DEGs and their metabolites; these results indicated the reliability of the integrated metabolomic-transcriptomic analysis in this study.
In conclusion, the leaves of Diospyros kaki Thunb. Nishimurawase (NM) had a greater level of flavonoid biosynthesis and less level of mineral absorption than those of Diospyros kaki. Heishi (HS) and had an equivalent level in degradation of aromatic compounds with HS; the leaves of Diospyros kaki Thunb. Taifu (TF) had an equivalent level with those of Diospyros kaki. Heishi (HS) and had a less level in mineral absorption and a significantly greater level in degradation of aromatic compounds than Diospyros kaki. Heishi (HS), respectively, i.e., of the three persimmon varieties in this study, the leaves of Diospyros kaki Thunb. Nishimurawase (NM) had the greatest level in flavonoid biosynthesis, in the leaves of Diospyros kaki. Heishi (HS) had the greatest level in mineral absorption, and the leaves of Diospyros kaki Thunb. Taifu (TF) had the greatest level in degradation of aromatic compounds. Thus, the tender leaves from Diospyros kaki. Heishi (HS), Diospyros kaki Thunb. Nishimurawase (NM), and Diospyros kaki Thunb. Taifu (TF) could be recommended for the production of persimmon leaf tea rich in mineral elements, total flavonoid, and aroma compounds, respectively.
Data Availability Statement
The original contributions presented in the study are included in the article/supplementary material, further inquiries can be directed to the corresponding author.
Author Contributions
X-MY and C-XA designed the experiments. X-MY performed most of the experiments, analyzed the data, and wrote the manuscript. All authors assisted in experiments, discussed the results, and commented on the final version of the manuscript.
Funding
This study was supported by National Key Research and Development Program of China (Grant No. 2019YFD1001204) and the National Natural Science Foundation of China (31701899).
Conflict of Interest
The authors declare that the research was conducted in the absence of any commercial or financial relationships that could be construed as a potential conflict of interest.
Publisher’s Note
All claims expressed in this article are solely those of the authors and do not necessarily represent those of their affiliated organizations, or those of the publisher, the editors and the reviewers. Any product that may be evaluated in this article, or claim that may be made by its manufacturer, is not guaranteed or endorsed by the publisher.
Footnotes
- ^ www.metware.cn
- ^ http://www.bioinformatics.babraham.ac.uk/projects/fastqc/
- ^ https://github.com/trinityrnaseq/trinityrnaseq/wiki
- ^ https://www.ncbi.nlm.nih.gov/search/all/?term=PRJNA646845
References
Akagi, T., Ikegami, A. K., and Yonemori, K. (2011). Proanthocyanidin biosynthesis of persimmon (Diospyros kaki Thunb.) fruit. Sci. Hortic. 130, 373–380. doi: 10.1016/j.scienta.2011.07.021
Amorim, C., Filho, E. G. A., Rodrigues, T. H. S., Bender, R. J., Canuto, K. M., Garruti, D. S., et al. (2020). Volatile compounds associated to the loss of astringency in ‘Rama Forte’ persimmon fruit. Food Res. Int. 136, 109570–109879. doi: 10.1016/j.foodres.2020.109570
Ashtiani, S. M., Salarikia, A., Golzarian, M. R., and Emadi, B. (2016). Non-destructive estimation of mechanical and chemical properties of persimmons by ultrasonic spectroscopy. Int. J. Food Prop. 19, 1522–1534. doi: 10.1080/10942912.2015.1082485
Bhat, R., Kiran, K., Arun, A. B., and Karim, A. A. (2010). Determination of mineral composition and heavy metal content of some nutraceutically valued plant products. Food Anal. Methods 3, 181–187. doi: 10.1007/s12161-009-9107-y
Cao, H., Ji, Y., Li, S., Lu, L., Tian, M., Yang, W., et al. (2019). Extensive metabolic profiles of leaves and stems from the medicinal plant Dendrobium officinale Kimura et Migo. Metabolites 9:215. doi: 10.3390/metabo9100215
Chang, Y. L., Lin, J. T., Lin, H. L., Liao, P. L., Wu, P. J., and Yang, D. J. (2019). Phenolic compositions and antioxidant properties of leaves of eight persimmon varieties harvested in different periods. Food Chem. 289, 74–83. doi: 10.1016/j.foodchem.2019.03.048
Chen, G., Wei, S. H., Huang, J., and Sun, J. (2009). A novel C-glycosylflavone from the leaves of Diospyros kaki. J. Asian Nat. Prod. Res. 11, 503–507. doi: 10.1080/10286020902911512
Cho, K., Cho, K., Sohn, H., Ha, I. J., Hong, S., Lee, H., et al. (2016). Network analysis of the metabolome and transcriptome reveals novel regulation of potato pigmentation. J. Exp. Bot. 67, 1519–1533. doi: 10.1093/jxb/erv549
Feng, Z., Li, Y., Li, M., Wang, Y., Zhang, L., Wan, X., et al. (2019). Tea aroma formation from six model manufacturing processes. Food Chem. 285, 347–354. doi: 10.1016/j.foodchem.2019.01.174
Giordani, E., Doumett, S., Nin, S., and del Bubba, M. (2011). Selected primary and secondary metabolites in fresh persimmon (Diospyros kaki Thunb.): A review of analytical methods and current knowledge of fruit composition and health benefits. Food Res. Int. 44, 1752–1767. doi: 10.1016/j.foodres.2011.01.036
Grabherr, M. G., Haas, B. J., Yassour, M., Levin, J. Z., Thompson, D. A., and Amit, I. (2011). Full length transcriptome assembly from RNA Seq data without a reference genome. Nat. Biotechnol. 29, 644–652. doi: 10.1038/nbt.1883
Guo, X., Ho, C. T., Schwab, W., Song, C., and Wan, X. (2019). Aroma compositions of large-leaf yellow tea and potential effect of theanine on volatile formation in tea. Food Chem. 280, 73–82. doi: 10.1016/j.foodchem.2018.12.066
Hossain, A., Moon, H. K., and Kim, J. K. (2018). Antioxidant properties of Korean major persimmon (Diospyros kaki) leaves. Food Sci. Biotechnol. 27, 177–184. doi: 10.1007/s10068-017-0195-y
Jia, S., Wang, Y., Hu, J., Ding, Z., Liang, Q., Zhang, Y., et al. (2016). Mineral and metabolic profiles in tea leaves and flowers during flower development. Plant Physiol. Bioch. 106, 316–326. doi: 10.1016/j.plaphy.2016.06.013
Jiang, H., Xu, W., and Chen, Q. (2019). Evaluating aroma quality of black tea by an olfactory visualization system: Selection of feature sensor using particle swarm optimization. Food Res. Int. 126:108605. doi: 10.1016/j.foodres.2019.108605
Jo, C., Son, J. H., Shin, M. G., and Byun, M. W. (2003). Irradiation effects on color and functional properties of persimmon (Diospyros kaki L. folium) leaf extract and licorice (Glycyrrhiza Uralensis Fischer) root extract during storage. Radiat. Phys. Chem. 67, 143–148. doi: 10.1016/s0969-806x(02)00443-7
Kim, K. A., Lee, C. H., Kang, T. K., Yang, S. J., Lee, C. Y., Lee, W. B., et al. (2020). Effect of persimmon leaves (Diospyros kaki) on goblet cell density and inflammation in experimental dry eye model. Appl. Biol. Chem. 63:45.
Kotani, M., Matsumoto, M., Fujita, A., Higa, S., Wang, W., Suemura, M., et al. (2000). Persimmon leaf extract and astragalin inhibit development of dermatitis and IgE elevation in NC/Nga mice. J. Allergy Clin. Immun. 106, 159–166. doi: 10.1067/mai.2000.107194
Li, L., Wen, Bo, Zhang, X., Zhao, Y., Duan, Y., Song, X., et al. (2018). Geographical origin traceability of tea based on multi-element spatial distribution and the relationship with soil in district scale. Food Control 90, 18–28. doi: 10.1016/j.foodcont.2018.02.031
Liao, Y., Smyth, G. K., and Shi, W. (2014). featureCounts: An efficient general purpose program for assigning sequence reads to genomic features. Bioinformatics 30, 923–930. doi: 10.1093/bioinformatics/btt656
Liu, L., Liu, R., Zhang, J., and Zhang, Z. (2012). Study on the PEG-based microwave-assisted extraction of flavonoid compounds from persimmon leaves. J. Sep. Sci. 35, 3412–3420. doi: 10.1002/jssc.201200495
Liu, S., Li, W., Wu, Y., Chen, C., and Lei, J. (2013). De novo transcriptome assembly in chili pepper (Capsicum frutescens) to identify genes involved in the biosynthesis of capsaicinoids. PLoS One 8:e48156. doi: 10.1371/journal.pone.0048156NODOI
Love, M. I., Huber, W., and Anders, S. (2014). Moderated estimation of fold change and dispersion for RNA-seq data with DESeq2. Genome Biol. 15, 1–21. doi: 10.1186/s13059-014-0550-8
Mao, X., Cai, T., Olyarchuk, J. G., and Wei, L. (2005). Automated genome annotation and pathway identification using the KEGG Orthology (KO) as a controlled vocabulary. Bioinformatics 21, 3787–3793. doi: 10.1093/bioinformatics/bti430
Martínez-Las Heras, R., Heredia, A., Castelló, M. L., and Andrés, A. (2014). Influence of drying method and extraction variables on the antioxidant properties of persimmon leaves. Food Biosci. 6, 1–8. doi: 10.1016/j.fbio.2014.01.002
Martínez-Las Heras, R., Pinazo, A., Heredia, A., and Andrés, A. (2017). Evaluation studies of persimmon plant (Diospyros kaki) for physiological benefits and bioaccessibility of antioxidants by in vitro simulated gastrointestinal digestion. Food Chem. 214, 478–485. doi: 10.1016/j.foodchem.2016.07.104
Martínez-Las Heras, R., Quifer-Rada, P., Andrés, A., and Lamuela-Raventós, R. (2016). Polyphenolic profile of persimmon leaves by high resolution mass spectrometry (LC-ESI-LTQ-Orbitrap-MS). J. Funct. Foods 23, 370–377. doi: 10.1016/j.jff.2016.02.048
Matsumoto, M., Kotani, M., Fujita, A., Higa, S., Kishimoto, T., Suemura, M., et al. (2002). Oral administration of persimmon leaf extract ameliorates skin symptoms and transepidermal water loss in atopic dermatitis model mice.. Brit. J. Dermatol. 146, 221–227. doi: 10.1046/j.1365-2133.2002.04557.x
Naveed, M., BiBi, J., Kamboh, A. A., Suheryani, I., Kakar, I., Fazlani, S. A., et al. (2018). Pharmacological values and therapeutic properties of black tea (Camellia sinensis): A comprehensive overview. Biomed. Pharmacother. 100, 521–531. doi: 10.1016/j.biopha.2018.02.048
Qi, Y., Li, C., Duan, C., Gu, C., and Zhang, Q. (2021). Integrated Metabolomic and Transcriptomic Analysis Reveals the Flavonoid Regulatory Network by Eutrema EsMYB90. Int. J. Mol. Sci. 22:8751. doi: 10.3390/ijms22168751
Sakanaka, S., Tachibana, Y., and Okada, Y. (2005). Preparation and antioxidant properties of extracts of Japanese persimmon leaf tea (kakinoha-cha). Food Chem. 89, 569–575. doi: 10.1016/j.foodchem.2004.03.013
Su, G., Morris, J. H., Demchak, B., and Bader, G. D. (2014). Biological network exploration with Cytoscape 3. Curr. Protoc. Bioinform. 47, 8.13.1–24. doi: 10.1002/0471250953.bi0813s47
Tardugno, R., Gervasi, T., Nava, V., Cammilleri, G., Ferrantelli, V., and Cicero, N. (2021). Nutritional and mineral composition of persimmon fruits (Diospyros kaki L.) from Central and Southern Italy. Nat. Prod. Res. 7, 1–6. doi: 10.1080/14786419.2021.1921768
Trapnell, C., Williams, B. A., Pertea, G., Mortazavi, A., Kwan, G., van Baren, M. J., et al. (2010). Transcript assembly and quantification by RNA-seq reveals unannotated transcripts and isoform switching during cell differentiation. Nat. Biotechnol. 28, 511–515. doi: 10.1038/nbt.1621
Wan, H., Zhang, X., Wang, P., Qiu, H., Guo, Y., Cheng, Y., et al. (2021). Integrated multi-omics analysis of developing ‘Newhall’ orange and its glossy mutant provide insights into citrus fragrance formation. Hortic. Plant J. doi: 10.1016/j.hpj.2021.12.002
Wan, L., Lei, Y., Yan, L., Liu, Y., Pandey, M. K., Wan, X., et al. (2020). Transcriptome and metabolome reveal redirection of flavonoids in a white testa peanut mutant. BMC Plant Biol. 20:161. doi: 10.1186/s12870-020-02383-7.NODOI
Wang, D., Wang, M., Cao, L., Wang, X., Sun, J., Yuan, J., et al. (2022). Changes and correlation of microorganism and flavor substances during persimmon vinegar fermentation. Food Biosci. 46:101565. doi: 10.1016/j.fbio.2022.101565
Wang, F., Wu, Y., Wu, W., Huang, Y., Zhu, C., Zhang, R., et al. (2021). Integrative analysis of metabolome and transcriptome profiles provides insight into the fruit pericarp pigmentation disorder caused by ‘Candidatus Liberibacter asiaticus’ infection. BMC Plant Biol. 21:397. doi: 10.1186/s12870-021-03167-3NODOI
Wang, X., Zeng, L., Liao, Y., Zhou, Y., Xu, X., Dong, F., et al. (2019). An alternative pathway for the formation of aromatic aroma compounds derived from L-phenylalanine via phenylpyruvic acid in tea (Camellia sinensis (L.) O leaves. Food Chem. 270, 17–24. doi: 10.1016/j.foodchem.2018.07.056
Wang, Y., Hossain, D., Perry, P. L., Adams, B., and Lin, J. (2012). Characterization of volatile and aroma-impact compounds in persimmon (Diospyros kaki L., var. Triumph). fruit by GC-MS and GC-O analyses. Flavour Frag. J. 27, 141–148. doi: 10.1002/ffj.2094
Wu, J., Mao, X. Z., Cai, T., Luo, J., and Wei, L. (2006). KOBAS server: a web-based platform for automated annotation and pathway identification. Nucleic Acids Res. 34, W720–W724. doi: 10.1093/nar/gkl167
Yang, S., Jiang, Y., Xu, L., Shiratake, K., Luo, Z., and Zhang, Q. (2016). Molecular cloning and functional characterization of DkMATE1 involved in proanthocyanidin precursor transport in persimmon (Diospyros kaki Thunb.) fruit. Plant Physiol. Bioch. 108, 241–250. doi: 10.1016/j.plaphy.2016.07.016
Yang, Z., Baldermann, S., and Watanabe, N. (2013). Recent studies of the volatile compounds in tea. Food Res. Int. 53, 585–599. doi: 10.1016/j.foodres.2013.02.011
Yaqub, S., Farooq, U., Shafi, A., Akram, K., Murtaza, M. A., Kausar, T., et al. (2016). Chemistry and functionality of bioactive compounds present in Persimmon. J. Chem. 16:3424025. doi: 10.1155/2016/3424025
Young, M. D., Wakefield, M. J., Smyth, G. K., and Oshlack, A. (2010). Gene ontology analysis for RNA-seq: accounting for selection bias. Genome Biol. 11:R14. doi: 10.1186/gb-2010-11-2-r14
Yuan, H., Zeng, X., Shi, J., Xu, Q., Wang, Y., Jabu, D., et al. (2018). Time-course comparative metabolite profiling under osmotic stress in tolerant and sensitive Tibetian hulless barley. BioMed. Res. Int. 2018:9415409. doi: 10.1155/2018/9415409
Zhang, J., Lu, J., Mantri, N., Jiang, L., Ying, S., Chen, S., et al. (2018). An effective combination storage technology to prolong storability, preserve high nutrients and antioxidant ability of astringent persimmon. Sci. Hortic. 241, 304–312. doi: 10.1016/j.scienta.2018.07.017
Zhang, X., Jiang, X., He, Y., Li, L., Xu, P., Sun, Z., et al. (2019). AtHB2, a class II HD-ZIP protein, negatively regulates the expression of CsANS, which encodes a key enzyme in Camellia sinensis catechin biosynthesis. Physiol. Plantarum. 166, 936–945. doi: 10.1111/ppl.12851
Zhang, Z., Tian, C., Zhang, Y., Li, C., Li, X., Yu, Q., et al. (2020). Transcriptomic and metabolomic analysis provides insights into anthocyanin and procyanidin accumulation in pear. BMC Plant Biol. 20:129. doi: 10.1186/s12870-020-02344-0
Zhao, H., Yu, C., and Li, M. (2017a). Effects of geographical origin, variety, season and their interactions on minerals in tea for traceability. J. Food Compos. Anal. 63, 15–20. doi: 10.1016/j.jfca.2017.07.030
Zhao, H., Zhang, S., and Zhang, Z. (2017b). Relationship between multi-element composition in tea leaves and in provenance soils for geographical traceability. Food Control 76, 82–87. doi: 10.1016/j.foodcont.2017.01.006
Zhou, C., Zhu, C., Tian, C., Xu, K., Huang, L., Shi, B., et al. (2022). Integrated volatile metabolome, multi-flux full-length sequencing, and transcriptome analyses provide insights into the aroma formation of postharvest jasmine (Jasminum sambac) during flowering. Postharvest Biol. Tech. 183:111726. doi: 10.1016/j.postharvbio.2021.111726
Keywords: persimmon leaf, metabolomics analysis, transcriptomic analysis, functional nutrients, flavonoids, mineral contents, aroma compounds
Citation: Yu X-M, Wang J, Gao R, Gong B-C and Ai C-X (2022) Integrated Metabolomic-Transcriptomic Analysis Reveals Diverse Resource of Functional Ingredients From Persimmon Leaves of Different Varieties. Front. Plant Sci. 13:904208. doi: 10.3389/fpls.2022.904208
Received: 25 March 2022; Accepted: 22 April 2022;
Published: 25 May 2022.
Edited by:
Sezai Ercisli, Atatürk University, TurkeyReviewed by:
Sadaruddin Chachar, Sindh Agriculture University, Tandojam, PakistanKang Wei, Tea Research Institute (CAAS), China
Copyright © 2022 Yu, Wang, Gao, Gong and Ai. This is an open-access article distributed under the terms of the Creative Commons Attribution License (CC BY). The use, distribution or reproduction in other forums is permitted, provided the original author(s) and the copyright owner(s) are credited and that the original publication in this journal is cited, in accordance with accepted academic practice. No use, distribution or reproduction is permitted which does not comply with these terms.
*Correspondence: Cheng-Xiang Ai, Y2hlbmd4aWFuZ18xOTc1QDE2My5jb20=