Abstract
Genes are subject to birth and death during the long evolutionary period. Here, young and old duplicate genes were identified in Vernicia fordii. We performed integrative analyses, including expression pattern, gene complexity, evolution, and functional divergence between young and old duplicate genes. Compared with young genes, old genes have higher values of Ka and Ks, lower Ka/Ks values, and lower average intrinsic structural disorder (ISD) values. Gene ontology and RNA-seq suggested that most young and old duplicate genes contained asymmetric functions. Only old duplicate genes are likely to participate in response to Fusarium wilt infection and exhibit divergent expression patterns. Our data suggest that young genes differ from older genes not only by evolutionary properties but also by their function and structure. These results highlighted the characteristics and diversification of the young and old genes in V. fordii and provided a systematic analysis of these genes in the V. fordii genome.
Introduction
Like all organisms, genes also undergo birth and death during the long evolutionary period. Following a gene duplication event, two identical copies of the ancestral gene perform exactly the same function, which may result in the death of some genes (Ota and Nei, 1994; Nei et al., 1997). According to the order of genes generation, they can be classified as old genes and young genes. Young genes retention may be closely related to the accommodation of environmental changes compared to old genes (Kaessmann, 2010; Song et al., 2019). Gene retroposition, horizontal transfer, duplication, recombination, or originating from non-genic sequences may be the source of these genes (Long et al., 2003, 2013; Kaessmann, 2010). So far, many researchers have studied the relationship between expression patterns and evolutionary patterns of young and old genes. Compared to old genes, young genes have a higher intrinsic structural disorder (ISD), shorter gene length, lower histone modification, lower gene expression level, more relaxed purifying selection, and faster evolutionary rate (Wolf et al., 2009; Capra et al., 2010; Vishnoi et al., 2010; Cui et al., 2015; Wang et al., 2016; Banerjee and Chakraborty, 2017; Wilson et al., 2017; Song et al., 2019). Old genes usually play an important role in the growth and development of organisms. In contrast, most young genes may not be necessary for plant growth and development, but a few of them may acquire new essential functions in the survival of new environments (Chen et al., 2010, 2012). Young genes tend to evolve more quickly and experience weaker purifying selection than old genes. Additionally, for young genes, duplicates experience weaker stronger translational selection than singletons and old genes (Yin et al., 2016).
So far, although there are many studies on the characteristics of young and old genes, both of function and characteristics of young and old duplicate genes produced by gene duplication events are still excluded. Compared with animals, plants have experienced one or more whole-genome duplication (WGD) events (Schranz et al., 2012). In addition, some plants have also undergone small-scale duplication (SSD) events along with their growth and development (Conant and Wolfe, 2008; Cao et al., 2019c). In general, duplicates that are retained by SSD are mainly involved in cell death, stress response, and metabolism, while duplicates formed by WGD participate in signal transduction, kinases, and development (Maere et al., 2005; Pareek et al., 2006; Corrochano et al., 2016). Although the genes produced by WGD and SSD may differ in their function, gene duplication events will produce new copies (i.e., young genes) that cause subfunctionalization or neofunctionalization to promote adaptive evolution and increase relative fitness in plants (Gottlieb, 1982; Flagel and Wendel, 2009; Van De Peer et al., 2017).
Vernicia fordii, as a unique industrial oil tree species in China, is a monecious plant with wide distribution and many varieties (Cao et al., 2019b). There are great differences in the yield of tung oil among different V. fordii varieties. Young and old duplicate genes may plant a significant role in this process. Previous researchers have sequenced the whole genome and RNA-seq of V. fordii (Chen et al., 2016; Cui et al., 2018; Liu et al., 2019), so we analyzed the characteristics of young and old duplicating genes in V. fordii. According to the synonymous substitution ratio (Ks) value for V. fordii, the young and old duplicate gene pairs were classified in the present study. We also compared gene complexity, gene expression patterns, and evolutionary patterns between young and old duplicate genes in V. fordii. This study may help us to further understand the functional divergence and evolution of duplicate genes in V. fordii.
Materials and Methods
Identification of Young and Old Duplicate Genes in Vernicia fordii
To identify the duplicate genes in V. fordii, we used the strict evaluation criteria as follows: (1) E-value ≤ 10–10, (2) identity >80%, and (3) length of aligned sequences >80% of the length of each sequence, as described by Clevenger et al. (2016) and Song et al. (2019). The young and old duplicate genes from V. fordii using a method described in Song et al. (2019). Briefly, the top and bottom 25% of Ks values for gene pairs were defined as old and young duplicate gene pairs, respectively (Song et al., 2019).
Chromosomal Location, Gene Ontology, Sequence Complex, and Substitution Rates
The chromosomal location of V. fordii genes was obtained from the V. fordii genomic annotation file. According to the sequencing name, the chromosomal location of each young and old duplicate gene was determined in V. fordii genome. The gene ontology for each young and old duplicate gene pair was generated using Blast2GO software against the NR database (Conesa et al., 2005). Ka/Ks (non-synonymous to synonymous substitution ratio), Ka, and Ks were determined using the aligned CDS in the Codeml procedure PAML software (version 4.4) all alignment gaps were deleted (Yang, 2007). Polypeptide length and Fop (frequency of optimal codons), for the young and old duplicate gene pairs were calculated using CodonW software (version 1.4.2).1 GC1 (GC content at the first codon site), GC2 (GC content at the second codon site), and GC3 (GC content at the third codon site) were estimated using an in-house Perl script. The IUPred2A online tool was used to estimate ISD with default parameters (Mészáros et al., 2018).
RNA-Seq Data
The raw sequences for 17 different tissues (PRJNA483508 and PRJNA445068) were filtered using the cutadapt software (version 1.8.1) (Martin, 2011). The high-quality reads were mapped to the V. fordii genome using HISAT2 software (version 2.1.0) with default parameters (Pertea et al., 2016). The StringTie software (version 2.0) was used to obtain FPKM (fragments per kilobase of exon model per million reads mapped) values for all young and old duplicate genes (Pertea et al., 2015, 2016). Gene-expression breadth is a measure of the number of tissues where a gene matched at least one tissue, and this value was also calculated in V. fordii (Jordan et al., 2005; Cao et al., 2019a).
The raw sequences for V. fordii root tissue infected by Fusarium wilt into three periods, including 2 dpi (i.e., the early stage), 8 dpi (i.e., the subsequent stage), and 13 dpi (i.e., the final stage), each with three biological replicates, obtained from NCBI Gene Expression Omnibus with accession number GSE80228 (Chen et al., 2016). The DESeq package was used to determine the differentially expressed transcription factors (DETs) with a fold-change ≥ 2 and p-value ≤ 0.05 (Love et al., 2014).
Results
Comparison of Young and Old Duplicate Genes in Vernicia fordii
According to the Ks values, we considered 463 and 465 duplicate gene pairs to be old duplicate genes (Ks: 1.3860–1.9935) and young duplicate genes (Ks: 0.0077–0.9489). Zhang et al. (2019) clarified that Jatropha curcas and V. fordii divergence occurred about 34.55 million years ago (Mya) (Ks = 0.52). These data suggested that young duplicate genes in V. fordii were formed before the divergence of J. curcas and V. fordii, and old duplicate genes in V. fordii were formed after the divergence of J. curcas and V. fordii.
Subsequently, we investigated gene complexity, gene expression, and evolution patterns between young and old duplicate gene pairs, and found that these parameters differed between these genes. Young duplicate genes were expressed at higher levels in most tissues than old duplicate genes, and the gene expression breadth of young duplicate genes was also greater than old duplicate genes (Table 1). For codon usage bias, we found that there were similarities between young and old duplicate genes. The GC1 and GC3 content of young duplicate genes was found to be lower than that of old duplicate genes, and the polypeptide length of young duplicate genes was shorter than that of old duplicate genes. For ISD of proteins, the average ISD value of young duplicate genes was less than old duplicate genes (Figure 1). When Ka, Ks, and Ka/Ks were compared between young and old duplicate gene pairs, the values of Ka and Ks were higher for old duplicate gene pairs than for young duplicate gene pairs. However, the value of Ka/Ks for young duplicate gene pairs was higher than that of old duplicate gene pairs.
TABLE 1
| Young duplicate genesa | Old duplicate genesa | P-value | |
| Stem | 0.32992 ± 1.69659 | 1.29889 ± 19.01985 | 0.4732 |
| Root | 0.23075 ± 2.38534 | 0.26472 ± 3.32038 | 0.1732 |
| Leaf | 0.17276 ± 1.32728 | 0.54662 ± 5.19718 | 0.8877 |
| 10_WAF | 0.16166 ± 0.93073 | 0.20305 ± 0.84959 | 0.641 |
| 15_WAF | 0.61856 ± 9.47926 | 0.21273 ± 0.88024 | 0.7041 |
| 20_WAF | 0.25948 ± 1.57819 | 0.22043 ± 1.60837 | 0.6372 |
| 25_WAF | 0.21053 ± 2.19179 | −0.03856 ± 5.21426 | 0.2906 |
| 30_WAF | −0.08646 ± 4.57126 | 0.03024 ± 8.43142 | 0.4939 |
| C1 | 0.22886 ± 0.87381 | 0.09930 ± 0.82954 | 0.007285 |
| C2 | 0.13126 ± 2.83309 | 0.18950 ± 1.12121 | 0.1539 |
| C3 | 0.20570 ± 3.37712 | 0.17215 ± 2.26439 | 0.0423 |
| C4 | 0.22757 ± 0.92811 | −0.09541 ± 9.72672 | 0.1998 |
| X1 | 0.39927 ± 2.21567 | 0.26412 ± 1.19283 | 0.05955 |
| X2 | 0.22806 ± 1.96253 | 0.23484 ± 1.15092 | 0.09925 |
| X3 | 0.22942 ± 4.14480 | 0.22514 ± 1.26084 | 0.7747 |
| X4 | 0.24818 ± 1.52190 | 0.37369 ± 5.79896 | 0.1583 |
| CX | 0.40889 ± 2.65661 | 0.43914 ± 4.12942 | 0.137 |
| Expression_ breadth | 12.93952 ± 4.48514 | 12.91720 ± 4.56255 | 0.000173 |
Comparison of gene expression levels between old and young duplicate genes in Vernicia fordii.
aMean ± SD. 10_WAF, 15_WAF, 20_WAF, 25_WAF, and 30_WAF represent 10, 15, 20, and 25 weeks after flowering, respectively. C1, C2, C3, and C4 represent 30, 20, 10, 1 days before female flowering, respectively. X1, X2, X3, and X4 represent 30, 20, 10, 1 days before male flowering, respectively. CX means hermaphrodite.
FIGURE 1
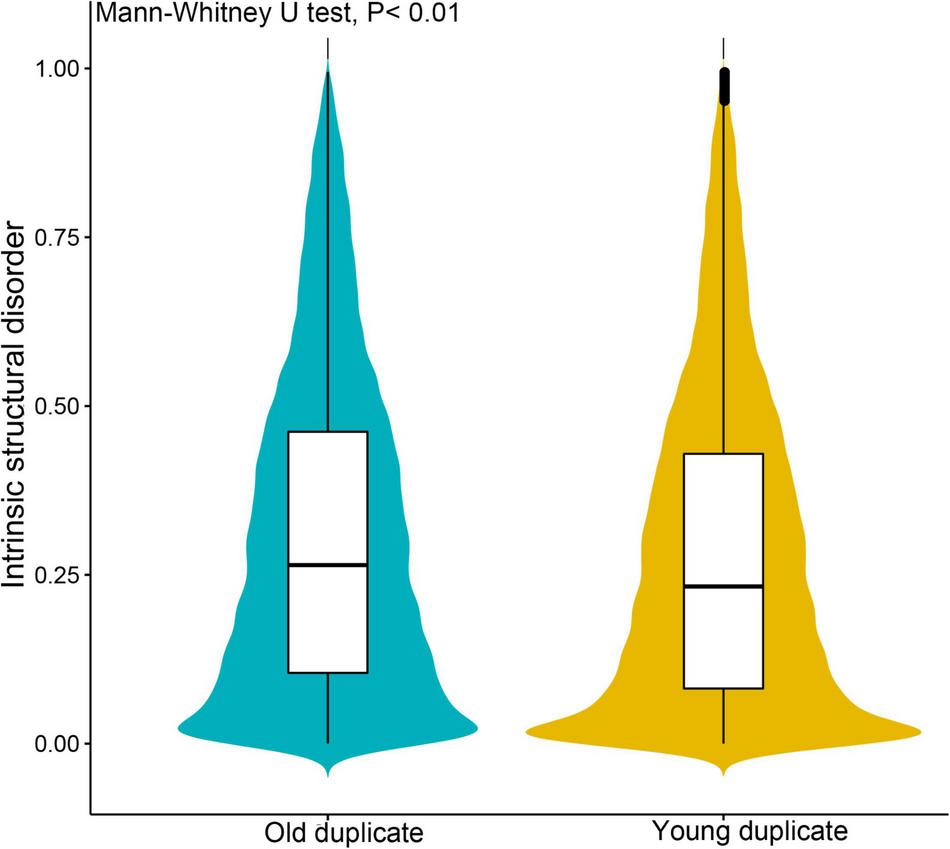
Comparison of intrinsic structural disorder (ISD) between young and old duplicate genes in Vernicia fordii. IUPred2A was used to estimate the ISD value with default parameters.
Previous studies have confirmed that there are different correlations among the gene complexity, expression pattern, and Ka and Ks between young and old duplicate genes (Song et al., 2019). To further understand this phenomenon in V. fordii, we performed a correlation analysis between young and old duplicate genes (Table 2 and Supplementary Figure 1). In young duplicate genes, there was no correlation between Ka, Ks, Ka/Ks, and the gene expression level of 17 different tissues. However, Ka and Ka/Ks have negatively correlated the gene expression level of 17 different tissues in old duplicate genes. We also noted that there are positive correlations among gene expression levels of 17 different tissues, and codon usage bias, gene expression breadth and GC3, and were negatively correlated GC2 in young duplicate genes. In old duplicate genes, the gene expression levels in 17 different tissues were positively correlated with gene-expression breadth, and were negatively correlated with GC2. However, codon usage bias, GC1, and GC3 were only positively correlated with the gene-expression level in partial tissues.
TABLE 2
| Young duplicate genesa | Old duplicate genesa | P-value | |
| Fop | 0.36932 ± 0.03604 | 0.37620 ± 0.03576 | 0.003657 |
| AA | 380.13282 ± 262.40793 | 416.40538 ± 248.39721 | 0.0004001 |
| GC1 | 49.19326 ± 4.69717 | 49.27901 ± 4.02039 | 0.8523 |
| GC2 | 41.03073 ± 5.65408 | 40.07084 ± 5.02216 | 0.006975 |
| GC3 | 36.50951 ± 5.79104 | 38.48259 ± 5.70046 | 2.06E-07 |
| Ka | 0.47117 ± 0.36448 | 0.38031 ± 0.26312 | 0.0003212 |
| Ks | 0.68886 ± 0.20766 | 1.60683 ± 0.16657 | 2.20E-16 |
| Ka/Ks | 0.84187 ± 1.05294 | 0.23830 ± 0.16605 | 2.20E-16 |
Comparison of gene complexity and substitution rate between young and old duplicate genes in Vernicia fordii.
aMean ± SD; AA, polypeptide length; Fop, frequency of optimal codons; GC1/2/3, GC content at the first/second/third codon site; Ka/Ks, non-synonymous to synonymous substitution ratio; Ka, non-synonymous substitution rate per non-synonymous site; Ks, synonymous substitution rate per synonymous site.
Comparison of Gene Ontology Between Old and Young Duplicate Genes
Gene ontology terms are currently widely used by many researchers to understand the function and biological significance of genes (Botstein et al., 2000; Song et al., 2019). To gain insight into the potential functional divergence between young and old duplicate genes, we performed GO analyses of these genes in V. fordii. Compared to the old duplicate genes, the young duplicate genes contained more numbers of GO terms. We also noted that the GO types in young duplicate genes were more than that in old duplicate genes (Supplementary Figure 2 and Supplementary Tables 1–3). In the cellular component, young duplicate genes included more GO-specific terms associated with “membrane,” while old duplicate genes contained more GO-specific terms associated with “protein complex.” In the biological processes, young duplicate genes were more likely to mainly participate in “multi-organism cellular process,” but old duplicate genes were more mainly involved in “transport regulation” and “stress response.” In the molecular function, young duplicate genes preferentially carried out the “catalytic activity” function, while old duplicate genes are mainly involved in the “molecular adaptor” or “cyclin-dependent protein kinase activity” function (Supplementary Tables 1–3). Taken together, the analysis of GO terms suggests that young and old duplicate genes contain potential functional divergence during evolution.
Location and Expression Divergence Analyses of Old and Young Duplicate Genes in Vernicia fordii
To further understand the chromosomal location of young and old duplicate genes, we obtained the GFF3 annotation file and performed location analysis in V. fordii (Figure 2). Our study suggested that young and old duplicate genes were mainly located in the end and beginning of chromosomes. In young and old duplicate genes, we found that 437 and 450 duplicate gene pairs were distributed among different chromosomes in V. fordii, respectively. Remarkably, a higher density of young and old duplicate genes was found on some chromosomes, such as chromosome 5 contained the highest number of duplicate genes (260), followed by chromosome 0 (214). In young duplicate genes, the highest number of old duplicate genes were mainly located in chromosome 5 (123) and chromosome 0 (106), respectively. However, old duplicate genes were located in chromosome 5 (137) and chromosome 9 (110), respectively.
FIGURE 2
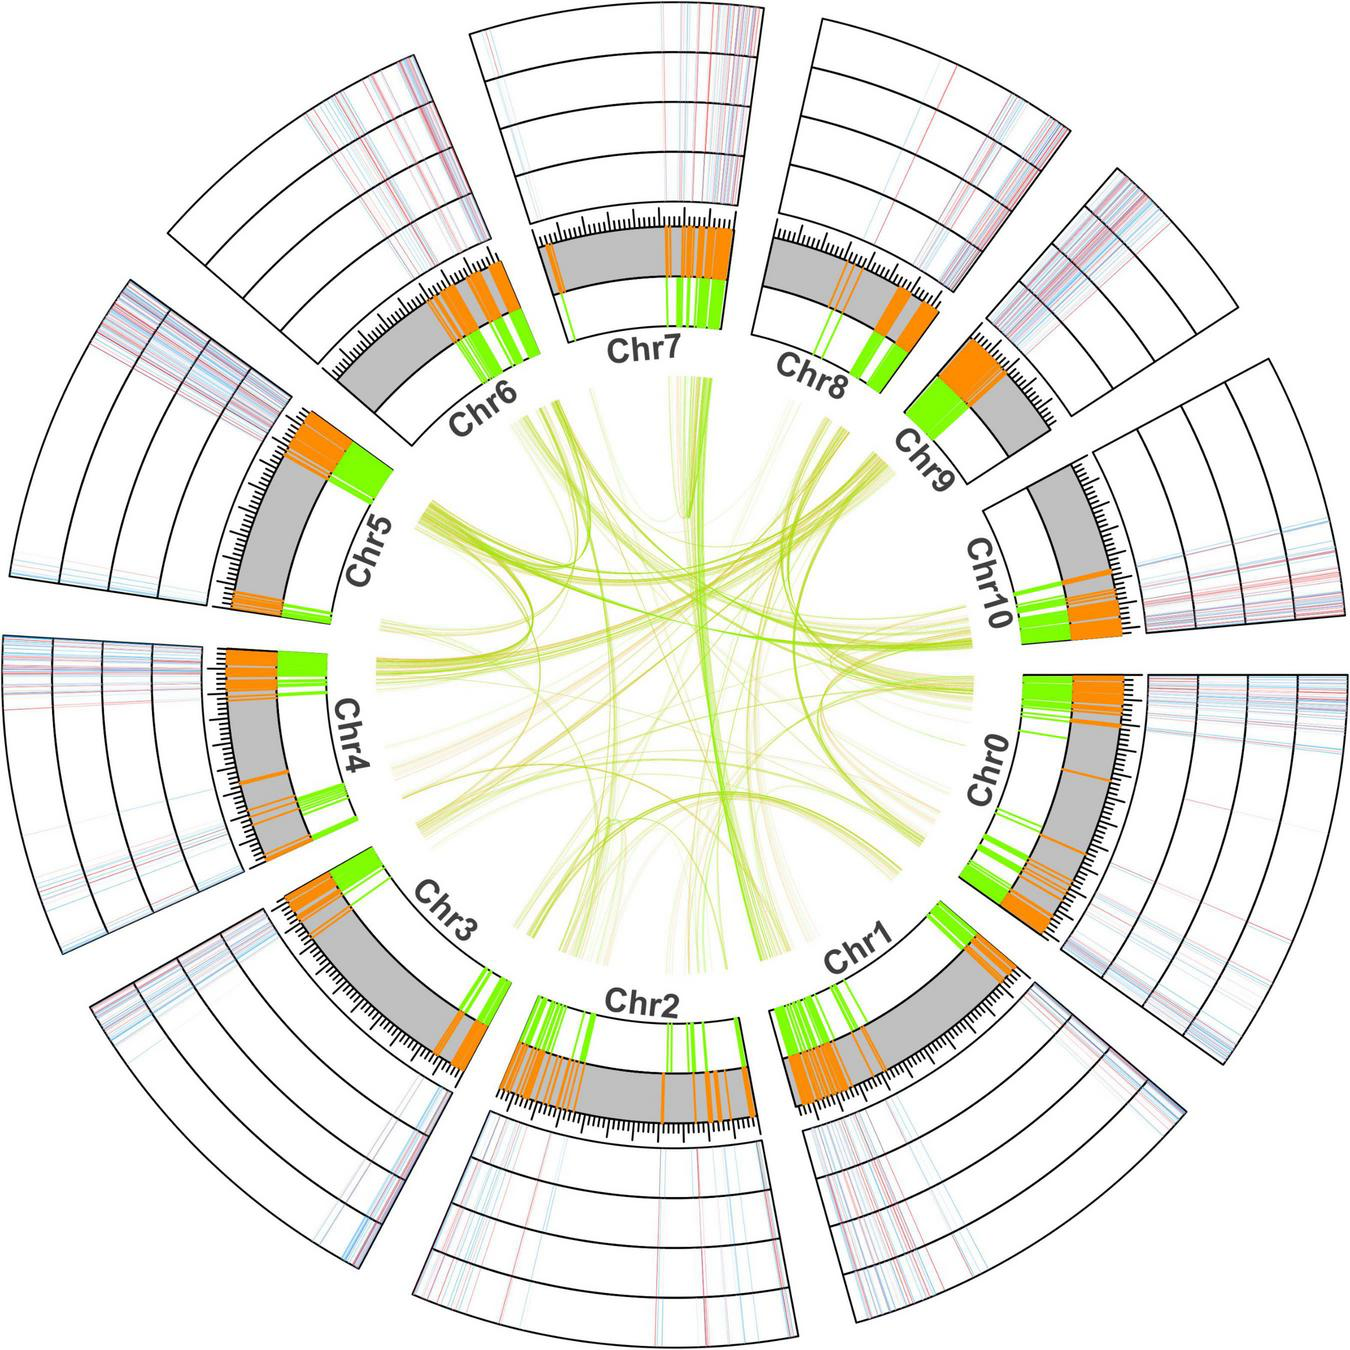
The location and expression analyses of young and old duplicate genes in Vernicia fordii. The green and orange represent the positional information of old and young duplicate genes on chromosomes in V. fordii, respectively. Blue and red represent the low and high expression levels of duplicate genes under Fusarium wilt disease, respectively. The outermost ring indicates F3, followed by F2, F1, and F0.
To further understand the degree of expression similarity between young and old duplicate genes, we analyzed the Pearson’s correlation coefficient (r) of each duplicate genes during V. fordii different tissues and/or development stages (Figure 3). The expression correlations for young duplicate genes demonstrated that the average value was r = 0.048, ranging from −0.069 to 1.000. By way of contrast, the correlations of old duplicate genes demonstrated a relatively low average value of 0.039 within a broad range of −0.119 to 1.000. However, the Mann–Whitney U-test found no significant difference between the two average r values (p = 0.55), which may be due to the relatively small number of samples. These data may further reflect some degree of ongoing functional divergence between duplicate genes during the long evolutionary period.
FIGURE 3
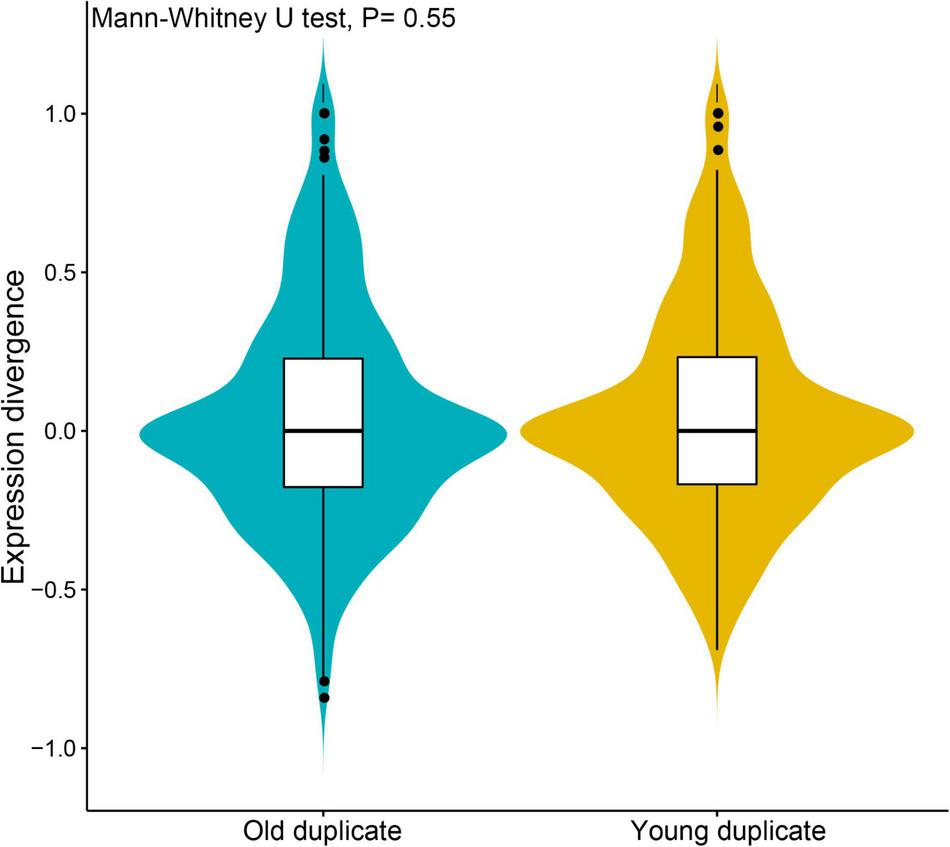
Expression divergence analyses of young and old duplicate genes during Vernicia fordii different tissues and/or development stages. The divergence and similarity between expression profiles of duplicate genes by using pearson’s correlation coefficient (r).
Differential Gene Expression Between Young and Old Duplicate Genes Under Fusarium Wilt Disease
Vernicia fordii can produce biomass diesel, which is a promising industrial crop (Zhang et al., 2014; Liu et al., 2016). However, Fusarium wilt has caused devastating damage to V. fordii tress (Chen et al., 2016). To further understand the role of young and old duplicate genes in the resistance to Fusarium wilt, we performed a transcriptome analysis. A total of 72.79% (674/926) young and 82.80% (770/930) old genes expressed in the resistance to Fusarium wilt, indicating that these genes might play important roles in the resistance to Fusarium wilt (Figure 2). Compared to the young duplicate genes, the number of old duplicate genes was large, indicating that these genes involved in resistance to Fusarium wilt were not rapid expanded by duplication events during evolution.
To determine the young and old genes with differential gene expression (DGE) during stages under Fusarium wilt disease, a significance threshold of 0.01 was applied using DESeq package. We revealed the differential expression modes between the young and old duplicate genes (Figures 4, 5). For old genes, we found that 25 and 58 genes were repressed and upregulated, respectively, at the early stage (F1 vs. F0), subsequent stage (F2 vs. F0), and finally stage (F3 vs. F0) after infection. However, for young genes, only 13 and 19 genes were repressed and induced, respectively, at the early stage (F1 vs. F0, F2 vs. F0, and F3 vs. F0) after infection. These results suggested that old genes might play a more important role in the resistance to Fusarium wilt than young genes. Remarkably, no young duplicate genes were observed in any three time periods. However, four old duplicate genes were detected at least one time period. Further, a divergent expression pattern was found in these old duplicate genes. The divergent expression patterns indicated that young and old duplicate genes contain different regulatory mechanisms in response to Fusarium wilt infection. Taken together, our study suggested that asymmetric function was found in young and old duplicate gene pairs under Fusarium wilt infection.
FIGURE 4
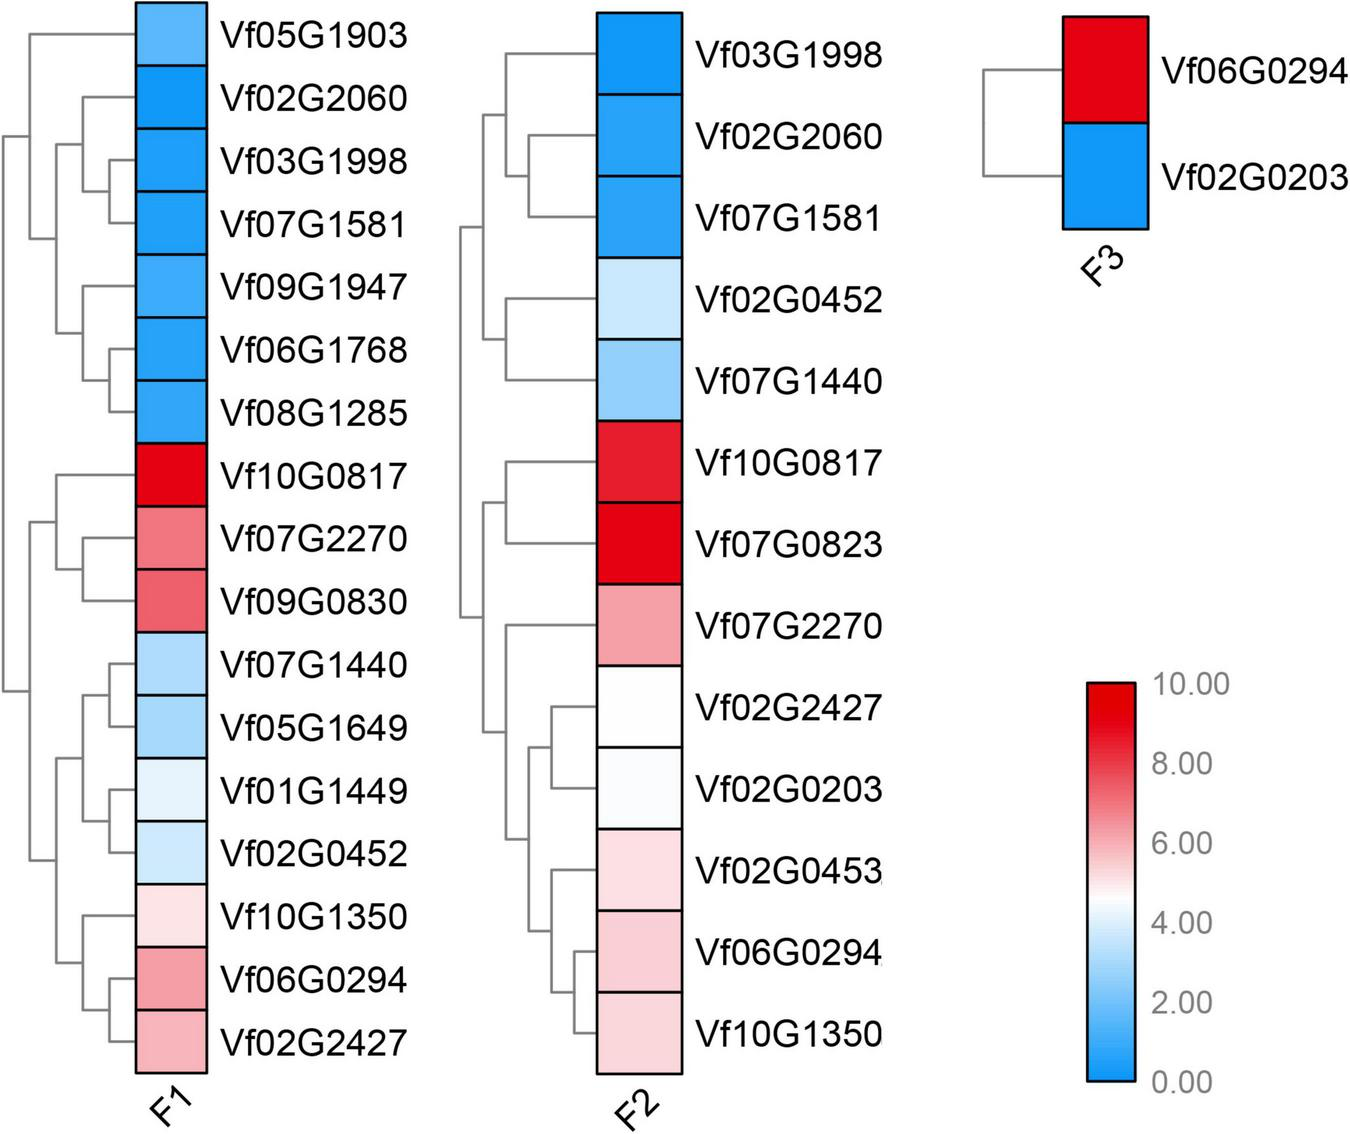
Young duplicate genes involved in response to Fusarium wilt disease stress. The same color font suggests that a duplicate gene was simultaneously involved in Fusarium wilt disease stress over more than one periods.
FIGURE 5
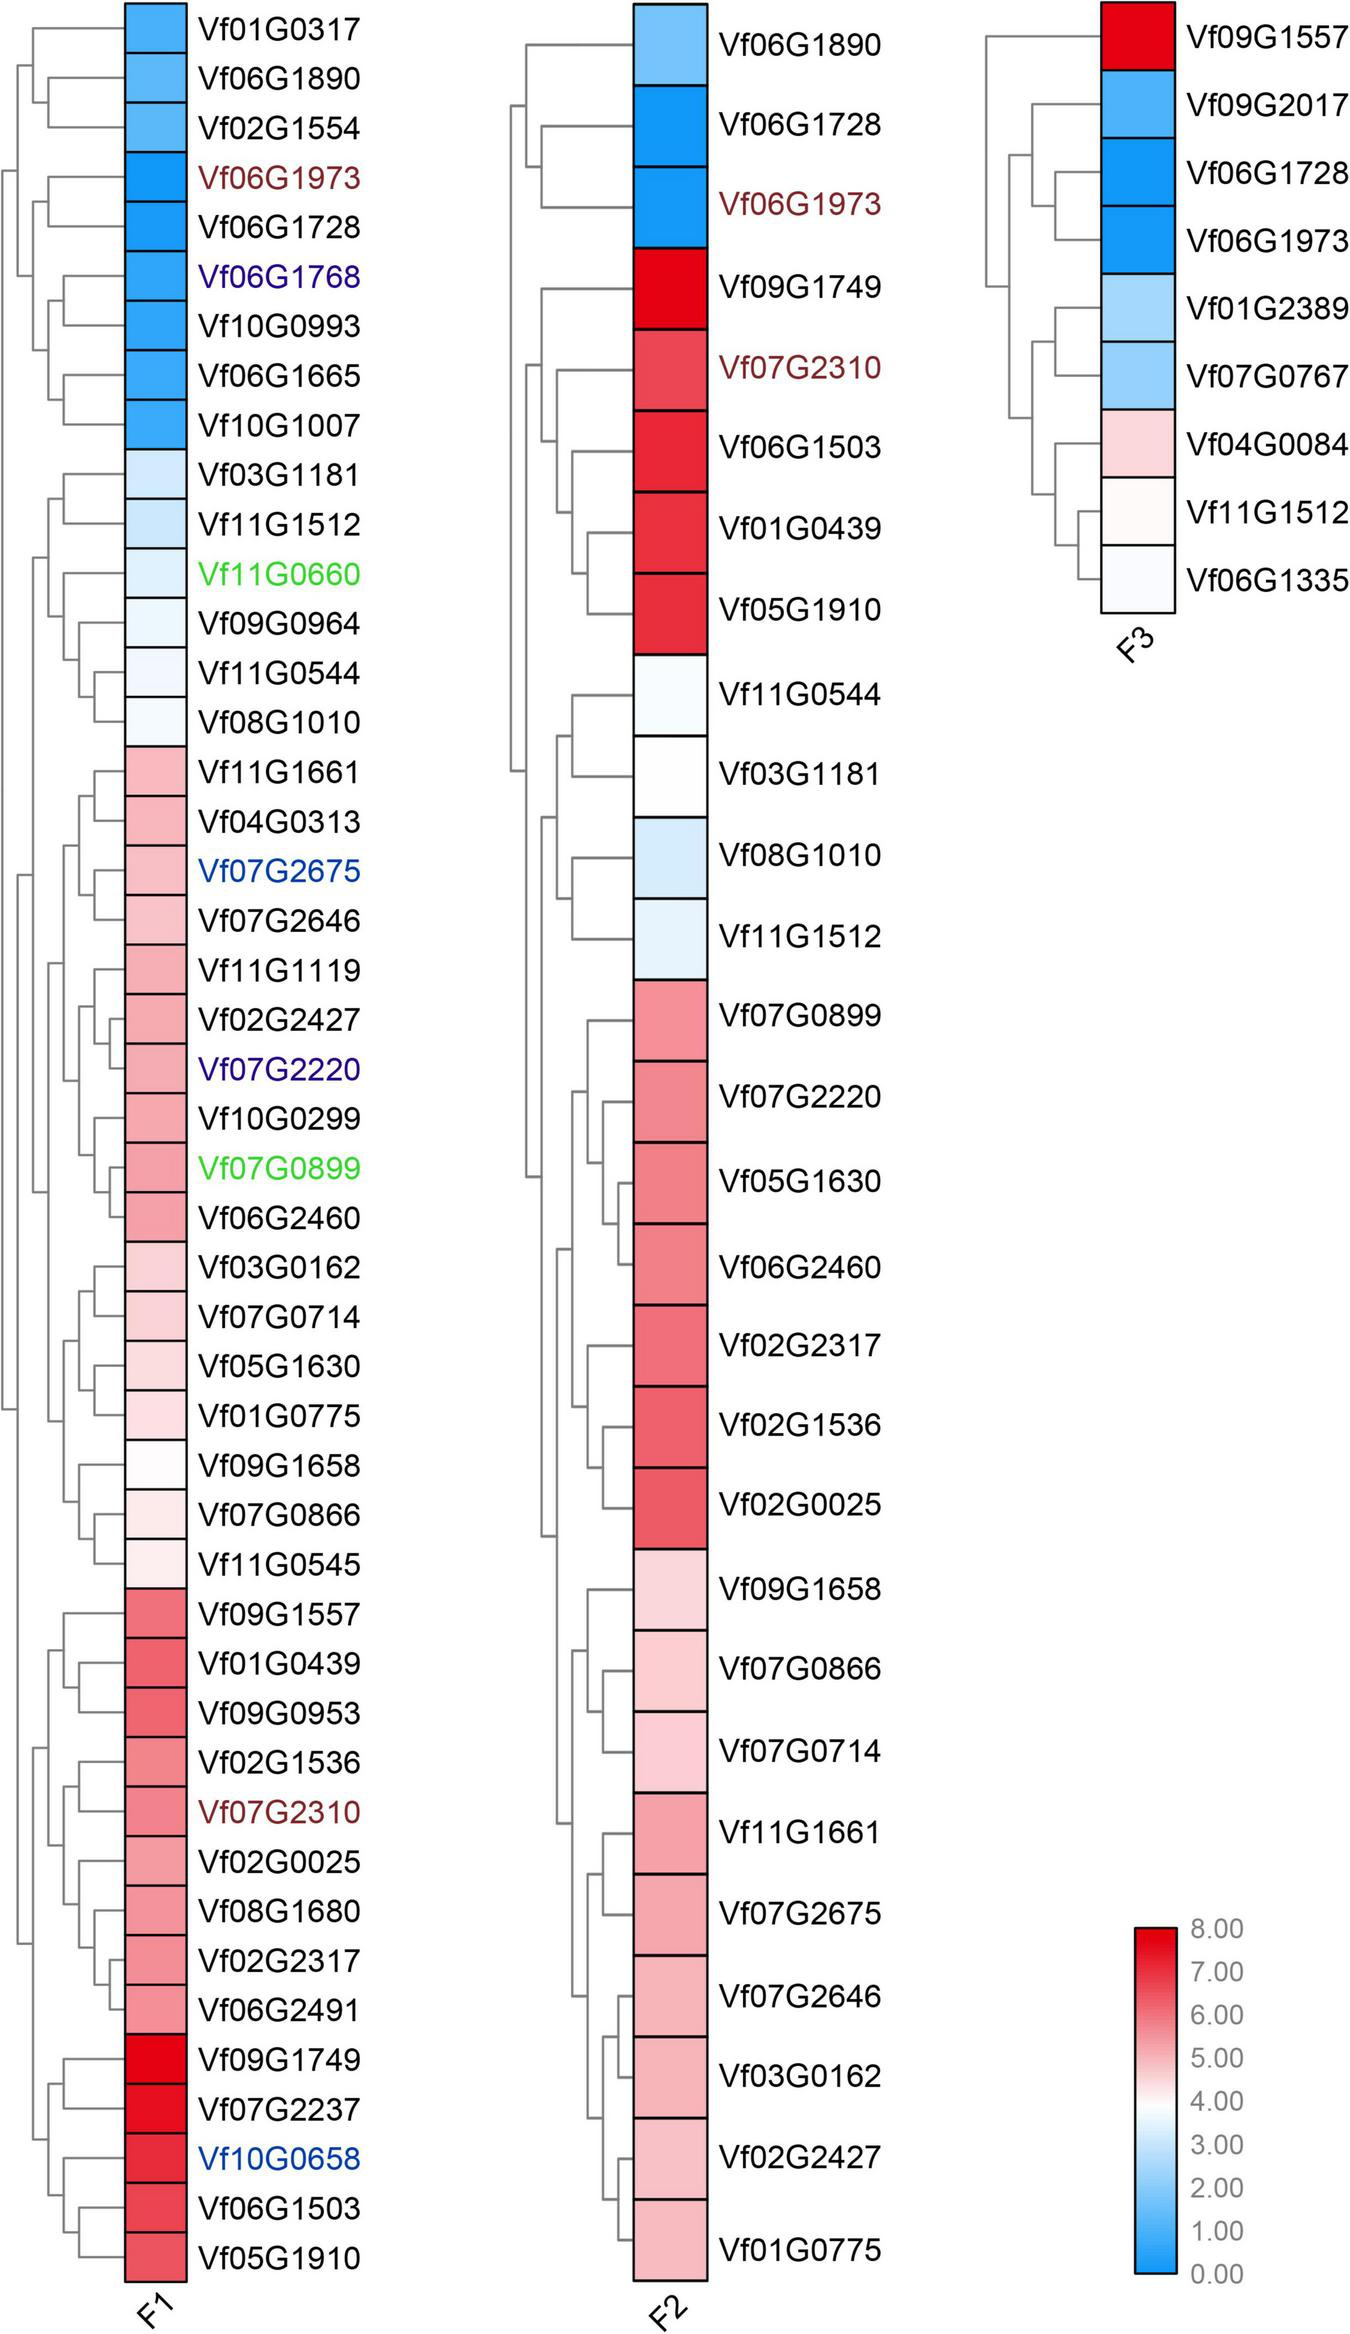
Old duplicate genes involved in response to Fusarium wilt disease stress. The same color font suggests that a duplicate gene was simultaneously involved in Fusarium wilt disease stress over more than one periods.
Discussion
Characteristics of the Young and Old Genes in Vernicia fordii
Surprisingly, there are few studies focused on young and old duplicate genes in plant genomes. Previous studies indicated that gene expression patterns are correlated with evolutionary patterns between young and old genes (Wolf et al., 2009; Cui et al., 2015; Gossmann et al., 2016). Unlike these studies, our analyses focused on gene complexity, expression profiles, functional divergence, and evolutionary patterns of young and old duplicate genes in V. fordii. In the present study, we found some interesting phenomena, including: (1) Young duplicate genes contained lower gene-expression levels than old duplicate genes; (2) Young duplicate genes possessed shorter polypeptide length than old duplicate genes; and (3) Young duplicate genes had relaxed purifying selection and lower ISD value than old duplicate genes. These data suggested that young and old duplicate genes differ not only in evolutionary patterns but also in expression profiles, selection pressure, and gene complexity, consistent with the results of articles published in animals, fungi and plants (Arendsee et al., 2014; Cui et al., 2015; Banerjee and Chakraborty, 2017; Wilson et al., 2017). For example, Song et al. (2019) found that there are no correlation between selective pressure and gene expression level, but selective pressure negatively correlated with the gene-expression level of old genes.
Previous studies have shown that the old genes were mainly influenced by natural selection, but young genes undergone multiple selection pressures (Vishnoi et al., 2010; Yin et al., 2016). Additionally, young genes were unstably expressed, while old genes were stably expressed and played essential functions in organisms (Chen et al., 2010, 2012; Hanada et al., 2018). Compared to the young genes, old genes have undergone strong purifying selection, which may help them maintain protein structure stability. In the present study, Ka and Ka/Ks of old duplicate genes negatively correlated with the gene expression, but no correlation was found between Ka, Ks, Ka/Ks, and the gene expression level in young duplicate genes. Remarkably, we found that the gene expression level of young duplicate genes was positively correlated with Fop, while was not correlated with Fop of old duplicate genes. These data suggested that although we used Ks values to classify young and old genes, most of the characteristics of these genes were consistent with previous studies, further confirming that the use of Ks values was a relatively reliable method for identification of young and old duplicate genes.
Functional Analysis of the Young and Old Genes in Vernicia fordii
As a hemi-biotrophic root pathogen, F. oxysporum infects manly plants, such as Musa nana, Solanum lycopersicum, cotton, and V. fordii (Michielse and Rep, 2009). Tung wilt disease caused by F. oxysporum is considered to be the most deadly disease of V. fordii. To determine the potential function of young and old genes in the resistance to Fusarium wilt, a transcriptome analysis was performed during pathogen infection. In the young genes, most genes (72.79%, 674/926), especially transcription factors, are expressed in the resistance to Fusarium wilt. This phenomenon also exists in the old genes (82.80%, 770/930), which might indicate strong positive selection to maintain transcription factors. The comparative analysis revealed that the majority of duplicated genes, whether the young or old genes, presented similar expression patterns, and only a few duplicate genes presented divergent expression trends during pathogen infection. These data indicated that the most duplicate genes shared a similar function in resistance to pathogen infection, and only a few genes play the decisive roles by showing divergent expression trends.
Compared to young duplicate genes, the number of old duplicate genes was relatively small. However, the old duplicate genes were preferentially responded to biotic stress by GO terms results. The transcriptome analysis also suggested that old duplicate genes are involved in the response to Fusarium wilt. Previous studies showed that V. fordii has undergone only an ancient WGD, while not experienced a recent WGD event (Tang et al., 2016; Cao et al., 2019b). In the present study, old duplicate genes were mainly produced in an ancient whole genome duplication event. The climate of the earth has undergone tremendous changes in ancient times. The changing environment has increased biodiversity, including the number of parasites and microorganisms. In this case, plants adapt to parasites or pathogenic infections by increasing the resistance of the resistant biotic genes. In the present study, more old duplicate genes were authenticated during stages under Fusarium wilt disease. We propose that these genes that respond to biotic stress were increasingly produced in V. fordii, which was supported by the finding that old duplicate genes have participated in response to Fusarium wilt.
Conclusion
In the present study, the properties of young and old duplicate genes were analyzed in V. fordii for the first time. Firstly, we generated a systematic investigation of young and old genes in V. fordii, which revealed common properties between our results and previous published papers. Next, we performed GO terms and examined the expression patterns of young and old duplicate genes in V. fordii, which suggested most young and old duplicate genes contained asymmetric function. These results will contribute to reveal the evolution and functional divergence of duplicate genes in V. fordii, and the identified important duplicate genes will provide key information to reveal targets for controlling wilt disease in V. fordii.
Publisher’s Note
All claims expressed in this article are solely those of the authors and do not necessarily represent those of their affiliated organizations, or those of the publisher, the editors and the reviewers. Any product that may be evaluated in this article, or claim that may be made by its manufacturer, is not guaranteed or endorsed by the publisher.
Statements
Data availability statement
Publicly available datasets were analyzed in this study. Transcriptome data of tung tree (Vernicia fordii) can be found in NCBI with accession numbers of PRJNA483508, PRJNA445068, and GSE80228.
Author contributions
LJ, TF, XL, and JX designed and performed the experiments. LJ analyzed the data. LJ and JX wrote the manuscript. All authors reviewed and approved the final submission.
Funding
The authors declare that this study received funding from the Natural Science Fund Youth Project of Hunan Province (Grant No. 2021JJ41068), the Natural Science Fund of Hunan Province (Grant No. 2020JJ4049), and the Outstanding youth of the Education Department of Hunan Province (20B617).
Acknowledgments
We extend our thanks to the reviewers and editor for their careful reading and helpful comments on this manuscript.
Conflict of interest
XL was employed by the company China Tobacco Hunan Industrial Co., Ltd. The remaining authors declare that the research was conducted in the absence of any commercial or financial relationships that could be construed as a potential conflict of interest. The handling editor declared a past co-authorship with one of the authors LJ.
Supplementary material
The Supplementary Material for this article can be found online at: https://www.frontiersin.org/articles/10.3389/fpls.2022.902649/full#supplementary-material
Supplementary Figure 1Correlation analysis of gene complexity, gene expression breadth, gene expression level, and substitution rate between young and old duplicate genes in Vernicia fordii. The figure was constructed using the gplots package in R. 10_WAF, 15_WAF, 20_WAF, 25_WAF, and 30_WAF represent 10, 15, 20, and 25 weeks after flowering, respectively. C1, C2, C3, and C4 represent 30, 20, 10, 1 days before female flowering, respectively. X1, X2, X3, and X4 represent 30, 20, 10, 1 days before male flowering, respectively. CX means hermaphrodite.
Supplementary Figure 2Comparisons of the number of gene ontology (GO) terms between young and old duplicate genes in Vernicia fordii.
Supplementary Table 1Specific gene ontology terms for cell components between young and old duplicate genes in Vernicia fordii.
Supplementary Table 2Specific gene ontology terms for molecular functions between young and old duplicate genes in Vernicia fordii.
Supplementary Table 3Specific gene ontology terms for biological processes between young and old duplicate genes in Vernicia fordii.
Footnotes
References
1
Arendsee Z. W. Li L. Wurtele E. S. (2014). Coming of age: orphan genes in plants.Trends Plant Sci.19698–708. 10.1016/j.tplants.2014.07.003
2
Banerjee S. Chakraborty S. (2017). Protein intrinsic disorder negatively associates with gene age in different eukaryotic lineages.Mol. BioSyst.132044–2055. 10.1039/c7mb00230k
3
Botstein D. Cherry J. M. Ashburner M. Ball C. Blake J. Butler H. et al (2000). Gene Ontology: tool for the unification of biology.Nat. Gene.2525–29.
4
Cao Y. Jiang L. Wang L. Cai Y. (2019a). Evolutionary rate heterogeneity and functional divergence of orthologous genes in Pyrus.Biomolecules9:490. 10.3390/biom9090490
5
Cao Y. Liu W. Zhao Q. Long H. Li Z. Liu M. et al (2019b). Integrative analysis reveals evolutionary patterns and potential functions of SWEET transporters in Euphorbiaceae.Int. J. Biol. Macromol.1391–11. 10.1016/j.ijbiomac.2019.07.102
6
Cao Y. Meng D. Han Y. Chen T. Jiao C. Chen Y. et al (2019c). Comparative analysis of B-BOX genes and their expression pattern analysis under various treatments in Dendrobium officinale.Bmc Plant Biol.19:245. 10.1186/s12870-019-1851-6
7
Capra J. A. Pollard K. S. Singh M. (2010). Novel genes exhibit distinct patterns of function acquisition and network integration.Genome Biol.11:R127. 10.1186/gb-2010-11-12-r127
8
Chen S. Zhang Y. E. Long M. (2010). New genes in Drosophila quickly become essential.Science3301682–1685. 10.1126/science.1196380
9
Chen W.-H. Trachana K. Lercher M. J. Bork P. (2012). Younger genes are less likely to be essential than older genes, and duplicates are less likely to be essential than singletons of the same age.Mol. Biol. Evol.291703–1706. 10.1093/molbev/mss014
10
Chen Y. Yin H. Gao M. Zhu H. Zhang Q. Wang Y. (2016). Comparative transcriptomics atlases reveals different gene expression pattern related to Fusarium wilt disease resistance and susceptibility in two Vernicia Species.Front. Plant Sci.7:1974. 10.3389/fpls.2016.01974
11
Clevenger J. Chu Y. Scheffler B. Ozias-Akins P. (2016). A developmental transcriptome map for allotetraploid Arachis hypogaea.Front. Plant Sci.7:1446.
12
Conant G. C. Wolfe K. H. (2008). Turning a hobby into a job: how duplicated genes find new functions.Nat. Rev. Gen.9:938. 10.1038/nrg2482
13
Conesa A. Götz S. García-Gómez J. M. Terol J. Talón M. Robles M. (2005). Blast2GO: a universal tool for annotation, visualization and analysis in functional genomics research.Bioinformatics213674–3676. 10.1093/bioinformatics/bti610
14
Corrochano L. M. Kuo A. Marcet-Houben M. Polaino S. Salamov A. Villalobos-Escobedo J. M. et al (2016). Expansion of signal transduction pathways in fungi by extensive genome duplication.Curr. Biol.261577–1584. 10.1016/j.cub.2016.04.038
15
Cui P. Lin Q. Fang D. Zhang L. Li R. Cheng J. et al (2018). Tung Tree (Vernicia fordii, Hemsl.) Genome and Transcriptome Sequencing Reveals Co-Ordinate Up-Regulation of Fatty Acid β-Oxidation and Triacylglycerol Biosynthesis Pathways During Eleostearic Acid Accumulation in Seeds.Plant Cell Physiol.591990–2003.
16
Cui X. Lv Y. Chen M. Nikoloski Z. Twell D. Zhang D. (2015). Young genes out of the male: an insight from evolutionary age analysis of the pollen transcriptome.Mol. Plant8935–945. 10.1016/j.molp.2014.12.008
17
Flagel L. E. Wendel J. F. (2009). Gene duplication and evolutionary novelty in plants.New Phytol.183557–564. 10.1111/j.1469-8137.2009.02923.x
18
Gossmann T. I. Saleh D. Schmid M. W. Spence M. A. Schmid K. J. (2016). Transcriptomes of plant gametophytes have a higher proportion of rapidly evolving and young genes than sporophytes.Mol. Biol. Evol.331669–1678. 10.1093/molbev/msw044
19
Gottlieb L. J. S. (1982). Conservation and duplication of isozymes in plants.Science216373–380. 10.1126/science.216.4544.373
20
Hanada K. Tezuka A. Nozawa M. Suzuki Y. Sugano S. Nagano A. J. et al (2018). Functional divergence of duplicate genes several million years after gene duplication in Arabidopsis.DNA Res.25327–339. 10.1093/dnares/dsy005
21
Jordan I. K. Mariño-Ramírez L. Koonin E. V. (2005). Evolutionary significance of gene expression divergence.Gene345119–126. 10.1016/j.gene.2004.11.034
22
Kaessmann H. (2010). Origins, evolution, and phenotypic impact of new genes.Gen. Res.201313–1326. 10.1101/gr.101386.109
23
Liu C. Shang Q. Jia P. Dai Y. Zhou Y. Liu Z. et al (2016). Tung oil-based unsaturated co-ester macromonomer for thermosetting polymers: Synergetic synthesis and copolymerization with styrene.ACS Sustainable Chem.43437–3449.
24
Liu M. Li W. Zhao G. Fan X. Long H. Fan Y. et al (2019). New insights of salicylic acid into stamen abortion of female flowers in tung tree (Vernicia fordii).Front. Genet.10:316. 10.3389/fgene.2019.00316
25
Long M. Betrán E. Thornton K. Wang W. (2003). The origin of new genes: glimpses from the young and old.Nat. Rev. Gene.4:865. 10.1038/nrg1204
26
Long M. Vankuren N. W. Chen S. Vibranovski M. D. (2013). New gene evolution: little did we know.Ann. Rev. Gen.47307–333. 10.1146/annurev-genet-111212-133301
27
Love M. Anders S. Huber W. (2014). Differential analysis of count data–the DESeq2 package.Genome Biol.15:10.1186.
28
Maere S. De Bodt S. Raes J. Casneuf T. Van Montagu M. Kuiper M. et al (2005). Modeling gene and genome duplications in eukaryotes.Proc. Natl. Acad. Sci.1025454–5459. 10.1073/pnas.0501102102
29
Martin M. (2011). Cutadapt removes adapter sequences from high-throughput sequencing reads.EMBnet. J.1710–12. 10.1089/cmb.2017.0096
30
Mészáros B. Erdös G. Dosztányi Z. (2018). IUPred2A: context-dependent prediction of protein disorder as a function of redox state and protein binding.Nucl. Acids Res.46W329–W337. 10.1093/nar/gky384
31
Michielse C. B. Rep M. (2009). Pathogen profile update: Fusarium oxysporum.Mol. Plant Pathol.10311–324. 10.1111/j.1364-3703.2009.00538.x
32
Nei M. Gu X. Sitnikova T. (1997). Evolution by the birth-and-death process in multigene families of the vertebrate immune system.Proc. Natl. Acad. Sci.947799–7806. 10.1073/pnas.94.15.7799
33
Ota T. Nei M. (1994). Divergent evolution and evolution by the birth-and-death process in the immunoglobulin VH gene family.Mol. Biol. Evol.11469–482. 10.1093/oxfordjournals.molbev.a040127
34
Pareek A. Singh A. Kumar M. Kushwaha H. R. Lynn A. M. Singla-Pareek S. L. (2006). Whole-genome analysis of Oryza sativa reveals similar architecture of two-component signaling machinery with Arabidopsis.Plant Physiol.142380–397. 10.1104/pp.106.086371
35
Pertea M. Kim D. Pertea G. M. Leek J. T. Salzberg S. L. (2016). Transcript-level expression analysis of RNA-seq experiments with HISAT. StringTie and Ballgown.Nat. protocols11:1650. 10.1038/nprot.2016.095
36
Pertea M. Pertea G. M. Antonescu C. M. Chang T.-C. Mendell J. T. Salzberg S. L. (2015). StringTie enables improved reconstruction of a transcriptome from RNA-seq reads.Nat. Biotechnol.33:290. 10.1038/nbt.3122
37
Schranz M. E. Mohammadin S. Edger P. P. (2012). Ancient whole genome duplications, novelty and diversification: the WGD Radiation Lag-Time Model.Curr. Opin. Plant Biol.15147–153. 10.1016/j.pbi.2012.03.011
38
Song H. Sun J. Yang G. (2019). Old and young duplicate genes reveal different responses to environmental changes in Arachis duranensis.Mol. Gene. Genom.2941199–1209. 10.1007/s00438-019-01574-8
39
Tang C. Yang M. Fang Y. Luo Y. Gao S. Xiao X. et al (2016). The rubber tree genome reveals new insights into rubber production and species adaptation.Nat. Plants2:16073. 10.1038/nplants.2016.73
40
Van De Peer Y. Mizrachi E. Marchal K. (2017). The evolutionary significance of polyploidy.Nat. Rev. Genet.18:411.
41
Vishnoi A. Kryazhimskiy S. Bazykin G. A. Hannenhalli S. Plotkin J. B. (2010). Young proteins experience more variable selection pressures than old proteins.Genome Res.201574–1581. 10.1101/gr.109595.110
42
Wang J. Tao F. Marowsky N. C. Fan C. (2016). Evolutionary fates and dynamic functionalization of young duplicate genes in Arabidopsis genomes.Plant Physiol.172427–440. 10.1104/pp.16.01177
43
Wilson B. A. Foy S. G. Neme R. Masel J. (2017). Young genes are highly disordered as predicted by the preadaptation hypothesis of de novo gene birth.Nat. Ecol. Evol.1:0146.
44
Wolf Y. I. Novichkov P. S. Karev G. P. Koonin E. V. Lipman D. J. (2009). The universal distribution of evolutionary rates of genes and distinct characteristics of eukaryotic genes of different apparent ages.Proc. Natl. Acad. Sci.1067273–7280. 10.1073/pnas.0901808106
45
Yang Z. (2007). PAML 4: phylogenetic analysis by maximum likelihood.Mol. Biol. Evol.241586–1591.
46
Yin H. Ma L. Wang G. Li M. Zhang Z. (2016). Old genes experience stronger translational selection than young genes.Gene59029–34. 10.1016/j.gene.2016.05.041
47
Zhang L. Jia B. Tan X. Thammina C. S. Long H. Liu M. et al (2014). Fatty acid profile and unigene-derived simple sequence repeat markers in tung tree (Vernicia fordii).PLoS One9:e105298. 10.1371/journal.pone.0105298
48
Zhang L. Liu M. Long H. Dong W. Pasha A. Esteban E. et al (2019). Tung tree (Vernicia fordii) genome provides a resource for understanding genome evolution and improved oil production.Genomics Proteomics Bioinformatics17, 558–575.
Summary
Keywords
young and old duplicate gene, Vernicia fordii , evolution, asymmetric function, evolutionary properties
Citation
Jiang L, Fan T, Li X and Xu J (2022) Functional Heterogeneity of the Young and Old Duplicate Genes in Tung Tree (Vernicia fordii). Front. Plant Sci. 13:902649. doi: 10.3389/fpls.2022.902649
Received
23 March 2022
Accepted
12 May 2022
Published
20 June 2022
Volume
13 - 2022
Edited by
Yunpeng Cao, Wuhan Botanical Garden (CAS), China
Reviewed by
Lixin Wang, Agricultural University of Hebei, China; Yan Wang, Anhui Agricultural University, China
Updates
Copyright
© 2022 Jiang, Fan, Li and Xu.
This is an open-access article distributed under the terms of the Creative Commons Attribution License (CC BY). The use, distribution or reproduction in other forums is permitted, provided the original author(s) and the copyright owner(s) are credited and that the original publication in this journal is cited, in accordance with accepted academic practice. No use, distribution or reproduction is permitted which does not comply with these terms.
*Correspondence: Xiaoxu Li, 82101171073@caas.cnJun Xu, xujunsea@163.com
†These authors have contributed equally to this work
This article was submitted to Plant Bioinformatics, a section of the journal Frontiers in Plant Science
Disclaimer
All claims expressed in this article are solely those of the authors and do not necessarily represent those of their affiliated organizations, or those of the publisher, the editors and the reviewers. Any product that may be evaluated in this article or claim that may be made by its manufacturer is not guaranteed or endorsed by the publisher.