 Xinru He
 Fengying LongYingjie LiYaowen XuLongsheng HuTianshu YaoYingying HuangDie HuYujie YangYongjun Fei*
- College of Horticulture and Gardening, Yangtze University, Jingzhou, China
Machilus microcarpa is a rare national tree species in China and possesses important ornamental and ecological value. M. microcarpa can be planted in low-temperature areas, depending on whether its seedlings can withstand the harm. To face this problem, the annual seedlings of M. microcarpa were subjected to five temperature treatments, and eight physiological indicators were measured. Furthermore, comparative transcriptome analysis was performed between M. microcarpa leaves treated at 25°C and −2.8°C. A total of 9,385 differentially expressed genes (DEGs) were involved in low-temperature stress in M. microcarpa. An upregulated (cobA) and five downregulated (HEM, CHLM, CRD, CLH, and PORA) genes associated with the porphyrin and chlorophyll metabolism pathway may reduce chlorophyll synthesis under low-temperature stress. Upregulation of six DEGs (two GAPDHs, PFK, PGAM, PDC, and PK) involved in the glycolysis/gluconeogenesis pathway provided energy for M. microcarpa under adverse cold conditions. Thirteen upregulated and seven downregulated genes related to antioxidant enzymes were also observed under low-temperature stress. Candidate transcription factors (TFs) played key roles in signal transduction under low-temperature stress in M. microcarpa, and quantitative real-time PCR (qRT-PCR) analysis validated the RNA-seq data. The results provide valuable information for further studies on the cold response mechanisms for low-temperature stress in M. microcarpa.
Introduction
Machilus microcarpa is a woody plant of the Lauraceae family. It is officially listed as a national rare tree species in China, where it is extensively distributed in the Sichuan, Hubei, and Guizhou provinces. It is an excellent wood species with many ecological functions, such as dust retention, insect repellent, and noise reduction. It is evergreen all year round, and its new leaves are bright red; its seeds reproduce easily and grow rapidly. It can be cultivated as an urban street tree and is a landscaping tree species with great development potential. In recent years, studies have focused on the leaf epidermis structure, dust-retention ability (He et al., 2019), structure characteristics (Chen et al., 2015), and transpiration characteristics (Li et al., 2019a) of M. microcarpa.
For a long time, some excellent garden trees in the south have been introduced and cultivated from the south to the north at high latitudes. Due to temperature restrictions, they cannot adapt to the local climate and have difficulty overwintering. Exploring the cold resistance mechanism of plants is the basic work of plant breeding, reasonable introduction, and cold-resistant cultivation. It is one of the important components of botany research and has important economic value for reducing natural disasters. Different Machilus plants show different adaptabilities to low-temperature stress. A previous research has shown that M. microcarpa has strong cold tolerance in Hubei Province, which is an ideal material for studying the low-temperature tolerance of Machilus. Therefore, elucidating the response mechanism of this species to low-temperature stress is essential for future breeding concerning the cold tolerance of M. microcarpa. Among the various abiotic stresses, low temperature is one of the most common environmental stresses that seriously affect the growth and development of plants (Megha et al., 2018). Under low temperatures, plants will perform a series of adaptive and self-protection processes, such as changes in membrane permeability, accumulation of osmolytes, and an increase of antioxidants (Zhang et al., 2016). Malonaldehyde is the final product of lipid peroxidation, and its content shows the extent of damage to the membrane (Rakei et al., 2016). Soluble sugars and soluble proteins accumulated in plants serve as cryoprotectants, which can decrease the freezing point of water in seedlings (Meng et al., 2015; Farhangi-Abriz and Torabian, 2017). The activity of superoxide dismutase, peroxidase, and polyphenol oxidase can remove redundant reactive oxygen species (ROS) and detoxify their harmful effects (Gill and Tuteja, 2010). The soluble protein content and enzymatic activity increase under low-temperature stress, regulating the plant's cold hardiness, according to Chen et al. (2014).
The RNA-seq technology plays an important role in the research progress of plants' cold resistance. By analyzing the transcriptome of plant samples under low-temperature stress, DEGs can be identified and isolated to identify cold resistance genes. Under low-temperature stress, genes can regulate many functions of plants and make the expression of related genes resist stress (Liu et al., 2013; Baxter et al., 2014). Currently, RNA-seq has been widely used in Eucalyptus nitens (Gaete-Loyola et al., 2017), Arabidopsis thaliana (Fowler and Thomashow, 2002), Olea europaea (Guerra et al., 2015), and Triticum aestivum (Laudencia-Chingcuanco et al., 2011; Xiong et al., 2017) in low-temperature. To clarify the responses of the expansin gene in a highly cold-tolerant winter wheat variety (D2) to low-temperature stress, the transcriptome of plants treated at 4°C was analyzed by Feng et al. (2019), which showed that the expression level of TaEXPB7-B responded to low-temperature stress. In addition, TaEXPB7-B enhanced antioxidants and osmotic regulation in transgenic Arabidopsis, thus, improving the tolerance and survival rates of plants under low-temperature stress.
In this study, the physiological indexes under different temperature treatments were measured for M. microcarpa. Through RNA-seq technology, which was used to conduct a comprehensive analysis of transcriptional responses, cold response genes were identified, and the regulatory mechanism of low temperature in M. microcarpa was analyzed, thus, having great economic value for reducing the natural disasters of M. microcarpa under low temperature. New gene resource for genetic improvement was provided, and the molecular mechanism of cold tolerance formation was clarified, accumulating biological knowledge of M. microcarpa.
Materials and Methods
Plant Materials and Treatments
In this study, annual M. microcarpa plants were grown at the Germplasm Resources Evaluation and Innovation Center of Phoebe, Yangtze University, Jingzhou, China. A total of 450 independent plants with uniform growth and no pests or diseases were collected. There were three biological replicates of 30 plants each. Annual M. microcarpa plants in the artificial intelligence incubator were cooled at a rate of 1°C/d to reach different target temperatures (2, 1, 5, 0, and −5°C). Plants were kept at each temperature for 24 h. Then, the leaves were removed from the same part of the plant and stored at −80°C in an ultra-low temperature freezer (Haier, China) until further use.
Determination of Growth and Physiology Characteristics
The measurement of relative electric conductivity (REC) followed Feng et al. (2005). The temperature at 50% REC was defined as the lethal temperature of the tissues (LT50). The total chlorophyll content was determined as described by Wellburn (1994). The malondialdehyde (MDA) content was determined using the thiobarbituric acid (TBA) method (Li et al., 2010). Soluble sugar content was measured using the anthrone colorimetric method (Moustakas et al., 2011). Total soluble protein content was determined using the Bradford method (Bradford, 1976). The activities of antioxidant enzymes, including superoxide dismutase (SOD), peroxidase (POD), and polyphenol oxidase (PPO) were determined using kits (Nanjing Jiancheng Bioengineering Institute, China).
RNA Extraction and Transcriptome Sequencing
The tender leaves were removed after being treated at 25°C and −2.8°C (LT50) for 24 hours, and three biological replicates were set. The sample treated at 25°C was called C, and the sample treated at −2.8°C was called M. Six RNA samples (C-1, C-2, C-3, M-1, M-2, and M-3) were extracted using the EASY spin Plus Plant RNA Kit (AidLab, China) according to the protocol. RNA sample purity was measured using a NanoPhotometer spectrophotometer, and the integrity and RNA sample integrity and concentration were checked using an Agilent 2100 RNA Bioanalyzer. The concentration and quality of these libraries were evaluated on the Agilent 2100 bioanalyzer and the Qubit2.0 fluorometer. All the samples were sequenced on the Illumina HiSeq X-ten platform, which was performed by Beijing Nuohe Zhiyuan Biotechnology Co., Ltd. Raw image data from Illumina HiSeq X-ten was transformed to raw reads by CASAVA base recognition and stored in FASTQ format. To obtain high-quality clean data, the raw reads were filtered, mainly to remove reads with sequencing adapters, reads containing indeterminate base information, and low-quality reads (Qphred ≤ 20 for >50% read).
Functional Gene Annotation
A transcriptome assembly for all clean reads was done using Trinity (Grabherr et al., 2011) with min-kmer-cov set to 2 by default and all other parameters set at default (Liu et al., 2022). The functional annotation of transcriptome assembly sequences was annotated based on the following databases: Non-redundant (Nr), Nucleotide sequences (Nt), Protein sequence (Swiss-Prot), Kyoto Encyclopedia of Genes and Genomes (KEGG), Clusters of Orthologous Groups of proteins (KOG), and Gene Ontology (GO).
Differentially Expressed Gene Analysis
The assembled transcriptome was used as a reference database, and all clean reads were mapped back to the reference transcriptome by Bowtie 2, the read count for each gene was derived from the mapping results using RSEM (Nan et al., 2018). Following that, the fragments per kilobase of an exon in per million fragments mapped reads (FPKM) values were used to represent the expression abundance of the reading frame corresponding to the unigenes (Song et al., 2019). In this study, we used DESeq to compare the treatment group with the control group and selected a false discovery rate (FDR) of <0.01 and a fold change (FC) of ≥ 2, which indicates differential expression (Gou et al., 2020). The DEGs were screened by pairwise comparison of the two libraries, C and M, for gene function enrichment analysis and metabolic pathway enrichment analysis.
qRT-PCR Analysis
Total RNA isolation was extracted using an EASY spin Plus Plant RNA Kit (RN38, AidLab, China). First-strand cDNA was synthesized with HiScript II Q RT SuperMix for qPCR (+gDNA wiper) (R223, Vazyme, Nanjing, China) and the extracted RNA was used as the template. The Ef-1a-C11786.0 was selected as the reference gene of M. microcarpa, and primers were designed using Primer 6.0 (Supplementary Table S1). qRT-PCR was performed using the LineGene 9600 Plus Fluorescent Quantitative PCR System (Bioer, Hangzhou, China) and the ChamQ SYBR qPCR Master Mix (Without ROX, Q311, Vazyme). Each sample was performed on three biological replicates and three technical replicates to ensure reproducibility and reliability. The reaction system was 20 μl: 10 μl of 2 × ChamQ SYBR qPCR Master Mix, 1 μl of sense primer (10 μM), 1 μl of antisense primer (10 μM), 2 μl of cDNA, and 6 μl of RNase-free water. The PCR program was as follows: 95°C for 30 s, 40 cycles at 95°C for 10 s, and 60°C for 30 s, followed by 95°C for 15 s, 60°C for 60 s, and 95°C for 15 s. The relative expression values were calculated using the 2−ΔΔCt method (Schmittgen and Livak, 2008).
Statistical Analysis
The treatment temperature and REC were fitted with the logistic function to obtain the inflection point temperature of the curve to determine the LT50 of tissue (Li et al., 2017; Wang et al., 2018). The logistic regression function was Y = K/(1 + ae −bx), LT50 = lna / b, where Y represents REC at low temperature; x is the treatment temperature; and K, a, and b are the function parameters. K was set to 100, indicating the saturation value of Y. The corresponding relationship between x and Y is represented by b.
Data were analyzed in Microsoft Excel 2019 and using analysis of variance (ANOVA) in SPSS 22.0, followed by Duncan's significant difference test at p ≤ 0.05. Each dataset had three biological replicates.
Results
Effects of Different Temperature Treatments on Physiological Changes in M. microcarpa Leaves
The REC of M. microcarpa leaves increased with a decrease in temperature (Figure 1A). At 25°C, the REC was the lowest at 21.37%. At 0°C, the REC rapidly increased to 88.16%. At −5°C, the REC was more than 90%. The data on the logistic functions and LT50 showed that the function's fitting degree was 0.92, reaching an extremely significant level. The linear equation was y = 100/(1 + 1.15e0.05x), and the LT50 of M. microcarpa was attained at −2.8°C.
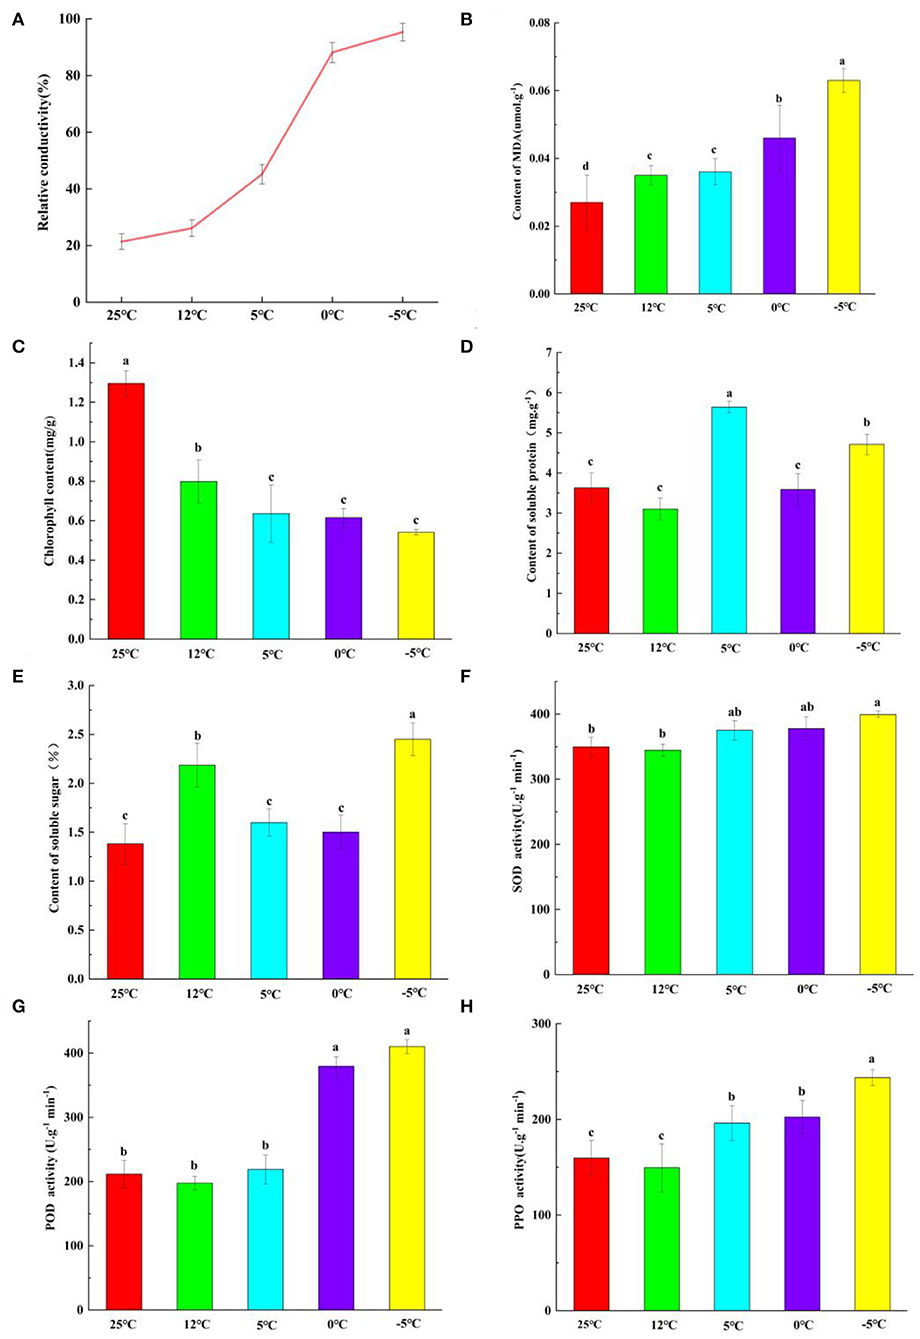
Figure 1. Comparison of physiological indexes of M. microcarpa leaves treated by five temperature treatments. (A–H) The relative electric conductivity, MDA content, chlorophyll content, soluble protein content, soluble sugar content, SOD, POD, and PPO activities were compared under five temperature treatments of M. microcarpa leaves, respectively. All data were shown as mean ± SE (n = 3). Within each treatment, means with different letters were significantly different at p < 0.05.
Malondialdehyde (MDA) is a product of cell membrane peroxidation, and its content determines the degree of damage to the cell membrane. The MDA content of M. microcarpa leaves increased with a decrease in temperature (Figure 1B). At 25°C, the MDA content was the lowest. At −5°C, the MDA content was the highest, and there were significant differences from the other treatment groups.
In M. microcarpa leaves, the total chlorophyll content decreased with decreasing temperature (Figure 1C), and the contents of soluble proteins (Figure 1D) and soluble sugars (Figure 1E) changed irregularly. At 25°C, the total chlorophyll content was the highest, and the soluble sugar content was the lowest. At −5°C, the total chlorophyll content was the lowest, and the soluble sugar content was the highest. The soluble protein content was the lowest at 12°C. The soluble protein content was the highest at 5°C, and it was significantly different from the other groups. With decreasing temperature, the changes in SOD (Figure 1F), POD (Figure 1G), and PPO (Figure 1H) activities were consistent in the M. microcarpa leaves. The POD, SOD, and PPO activities were the lowest at 12°C. In contrast, when the treatment temperature was −5°C, the POD, SOD, and PPO activities were the highest.
Correlation Analysis of Physiological Indexes Under Different Temperature Treatments in M. microcarpa
To further investigate the relationships among these physiological indicators, a correlation analysis was performed (Supplementary Table S2). POD activity was positively correlated with soluble protein, and the correlation coefficient was.596. SOD activity was positively correlated with soluble protein and POD activity (0.583 and 0.524, respectively). PPO activity was positively correlated with soluble protein, had a highly significant positive correlation with POD and SOD activities, and had a highly significant negative correlation with chlorophyll content (0.595, 0.758, 0.686, and −0.684, respectively). Soluble sugar had a highly significant negative correlation with PPO activity and a positive correlation with chlorophyll content; the correlation coefficients were 0.786 and −0.692, respectively. POD, SOD, and PPO activities and soluble sugar all played an important role in the removal of ROS in M. microcarpa leaves, and reached a significant or highly significant level, indicating that antioxidants play a more important role in the removal of ROS in the M. microcarpa leaves under low-temperature treatments.
Recovery of M. microcarpa After Treatment at Different Temperatures
As shown in Figure 2, when treated at 25, 12, and 5°C, M. microcarpa leaves showed no significant change before and after temperature treatment. When M. microcarpa was treated at 0°C and recovered for 0 days, the leaves showed slight drooping. However, after 2 days of recovery, M. microcarpa leaves returned to normal, and there was no significant change from before treatment. When M. microcarpa was treated at −5°C and recovered for 0 days, the leaves underwent intercellular freezing. After 2 days of recovery, the leaves and stem segments dried up, and the plant died.
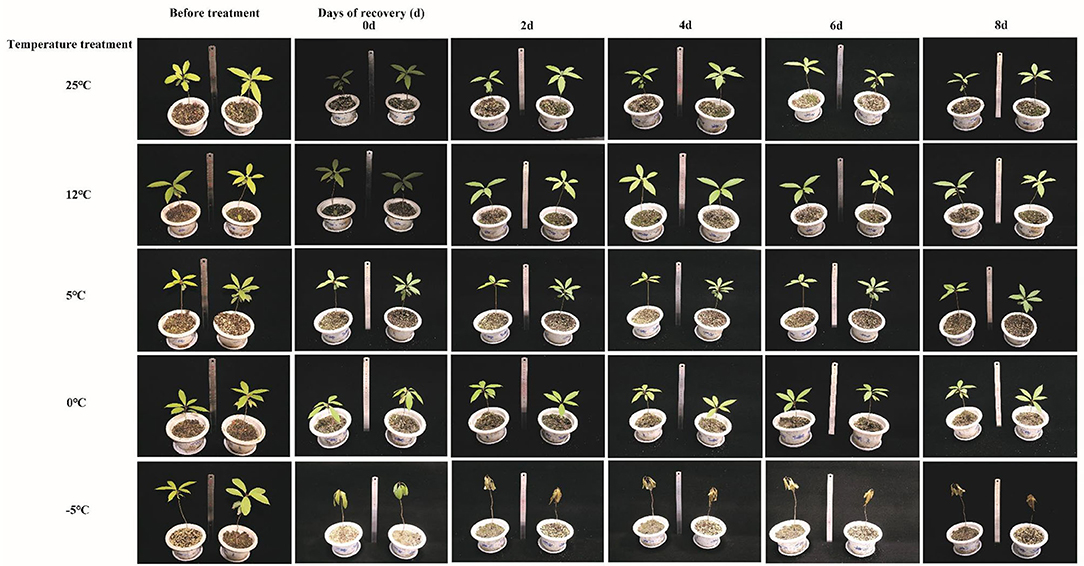
Figure 2. Recovery of M. microcarpa after being treated at different temperatures.
Overview of the Transcriptome Data
In this study, a total of 60.50 Gb clean data were obtained by analyzing the leaves of M. microcarpa. Each sample produced over 9.64 Gb of clean data. The Q30 percentage was over 93.10%, and the GC content was in the range of 46.14–47.16%. After filtering out low-quality reads, an average of 67,233,156 reads were obtained for each sample (Supplementary Table S3). The results showed that the sampling of M. microcarpa was reliable and suitable for further analysis in this study.
Functional Annotation and Classification of M. microcarpa Unigenes
The unigene sequences of the M. microcarpa were compared with a general functional database (Supplementary Table S4). From the NR database, 36,352 (41%) annotated unigenes were obtained; 21,054 (23.74%), 14,044 (15.84%), 25,756 (29.05%), 29,166 (32.89%), 29,166 (32.89%), and 7,944 (8.96%) were obtained from the NT, KO, Swiss-Prot, Protein family (PFAM), Gene Ontology (GO), and microcarpa Ortholog Groups (KOG) databases, respectively. NR is the official protein sequence database of the NCBI. M. microcarpa transcripts were highly similar to Nelumbo nucifera (19.7%), Macleaya cordata (11.4%), and Vitis vinifera (6.1%) (Figure 3A). KOG is a database of orthologous gene families. A total of 7,944 unigenes of M. microcarpa were annotated to 25 KOG pathways (Figure 3B). A total of 1,250 unigenes were annotated to the post-translational modification, protein turnover, and chaperones, followed by 1,110, and 963 annotations related to gene expression, including translation, ribosomal structure and biogenesis, and general function prediction classification, respectively. GO is a gene function database. A total of 29,166 unigenes from M. microcarpa were annotated into 55 GO pathways (Figure 3C). The functions of unigenes in biological process classifications contained cellular process, metabolic process, and single-organism process. The cell, cell part, organelle, and macromolecular complex were the most abundant functions in terms of cellular component classifications. In the molecular function classification, binding, catalytic activity, and transporter activity were more abundant.
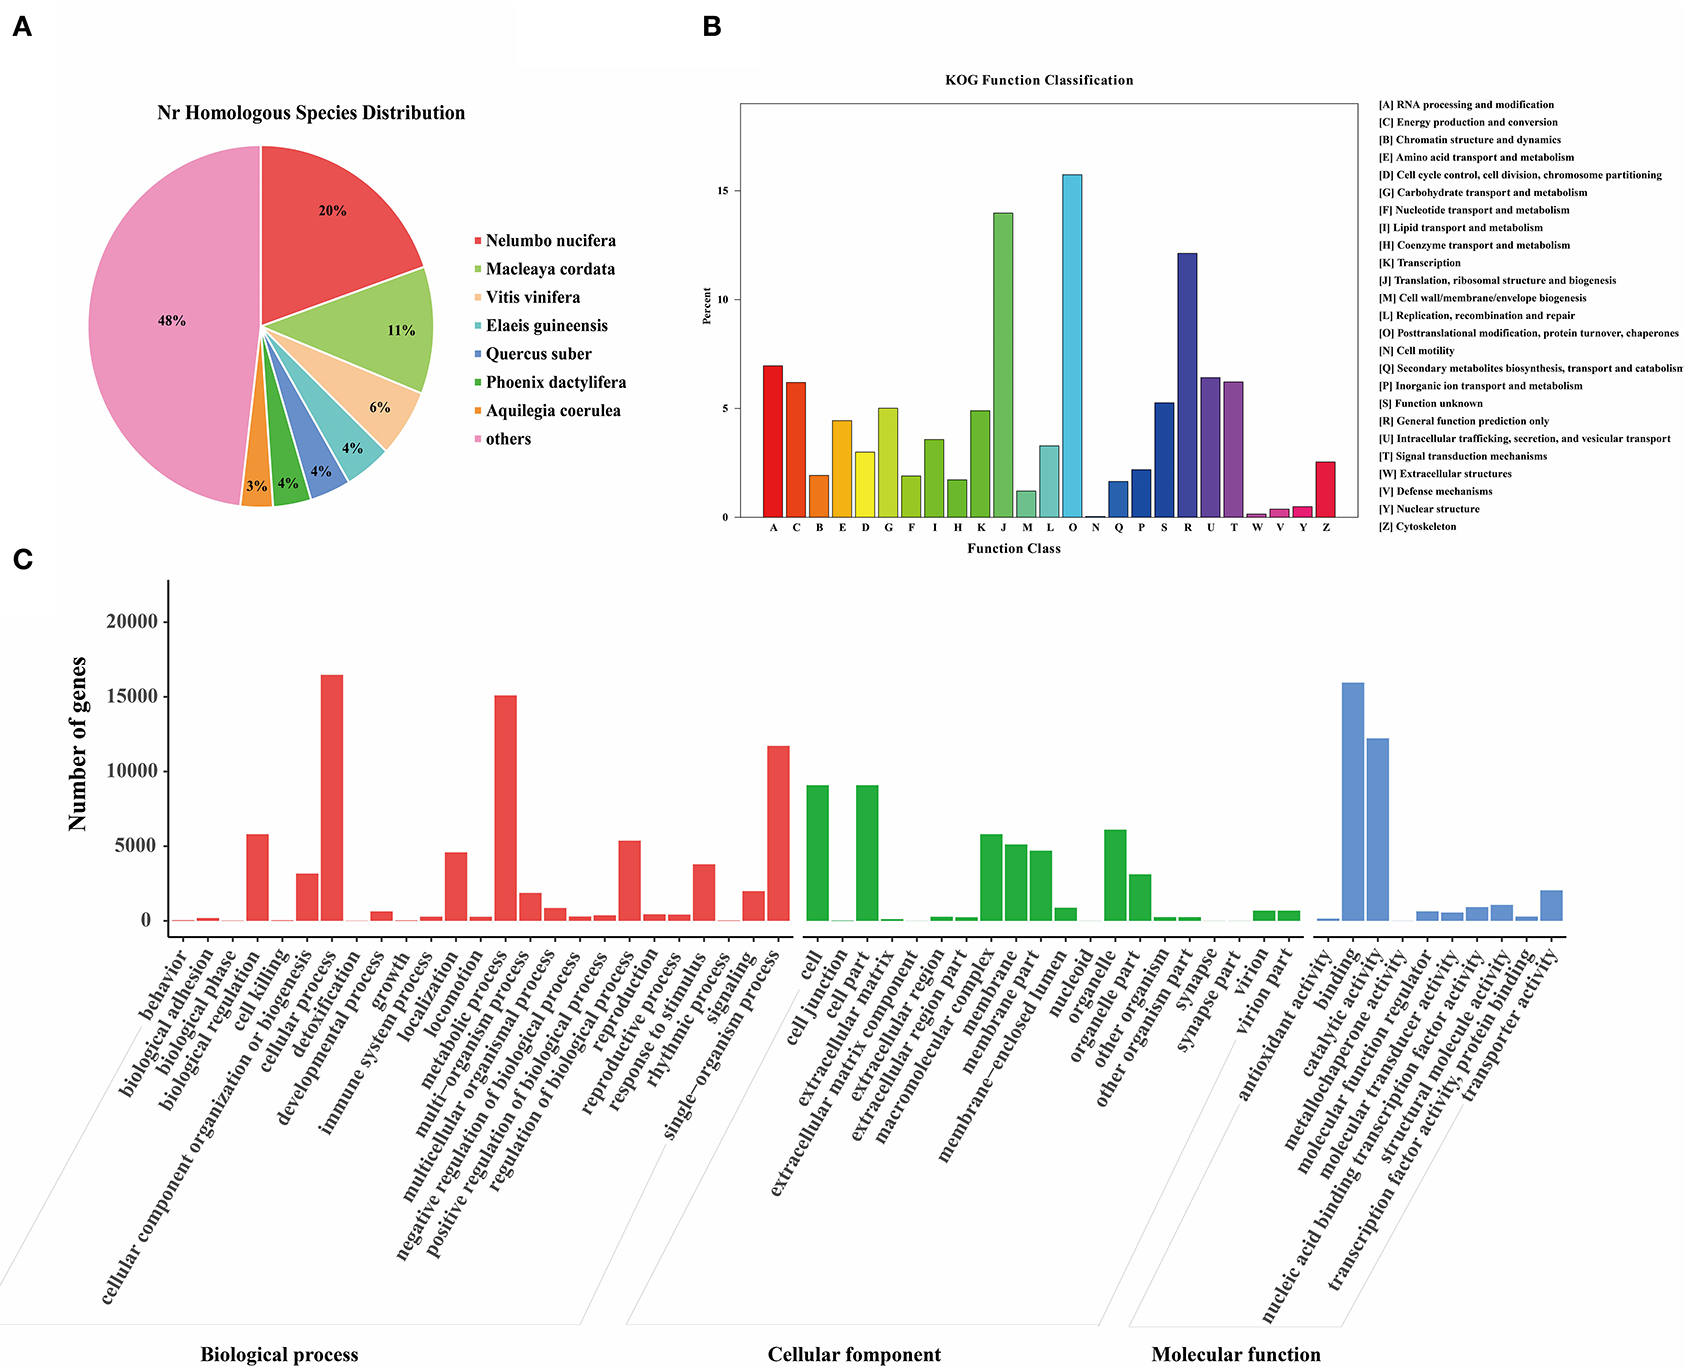
Figure 3. Functional annotations of the unigenes of the M. microcarpa transcriptome. (A) Species distribution of the NR results of M. microcarpa transcriptome. (B) KOG function annotation of unigenes. (C) GO function annotation of unigenes.
To demonstrate the reliability and adequacy of sample selection, gene expression correlations between samples are very important. For biological replicate samples receiving the same treatment, Pearson correlation coefficients were always >0.8 (Figure 4), which indicated good reproducibility of the three biological replicates in each treatment.
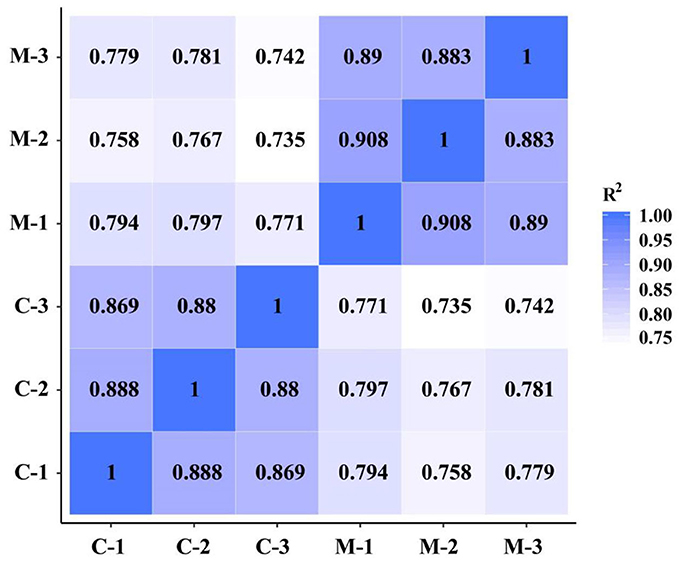
Figure 4. Pearson correlation between samples of the M. microcarpa transcriptome. The number in the color block represents the value of correlation coefficient. C, samples treated at 25°C; M, samples treated at −2.8°C.
Identification and Functional Annotation of DEGs
To study the expression difference of unigenes in different treatments according to the expression level between the two groups of samples, the differential genes were divided into upregulated and downregulated genes. Through comparison, 9,385 DEGs were obtained, including 4,525 upregulated genes and 4,860 downregulated genes (Figure 5A).
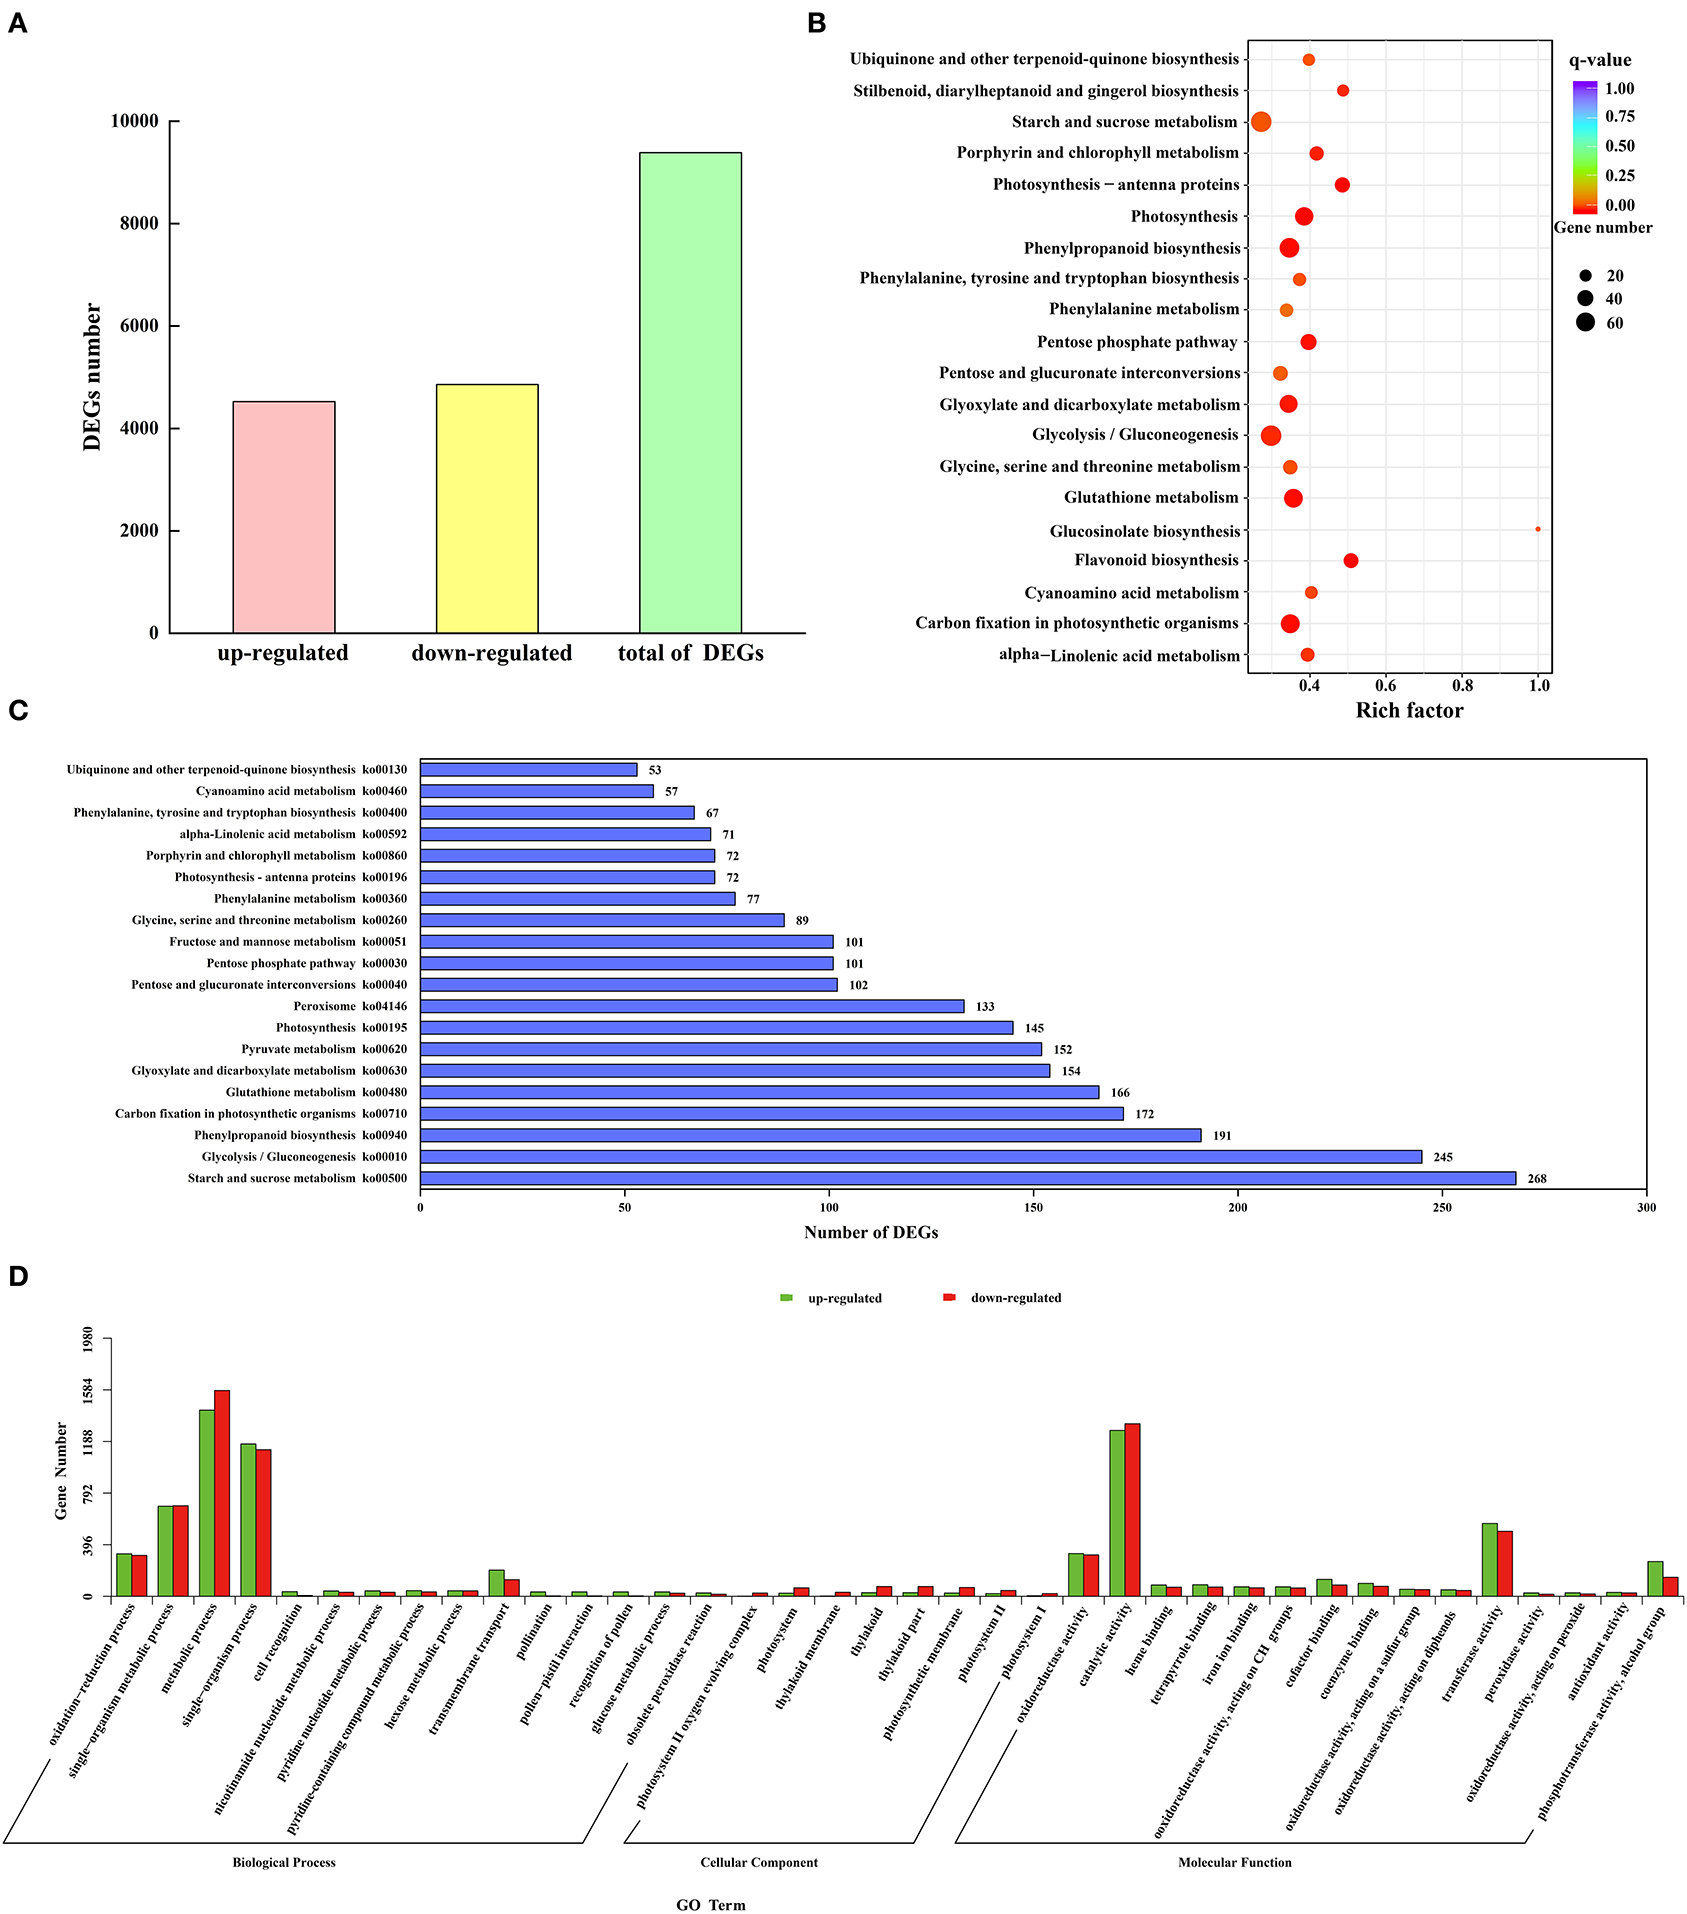
Figure 5. Identification and functional annotation of DEGs. (A) The number of upregulated and downregulated DEGs. (B) Q-value distribution of the top 20 enrichment pathways. (C) Enrichment of the top 20 KEGG pathways of all DEGs. (D) GO enrichment results of upregulated and downregulated DEGs.
A total of 38 functional annotations of the DEGs of M and C were obtained in the GO database (Figure 5D). The biological process contained 15 GO entries, mainly focusing on the metabolic process, single-organism process, and single-organism metabolic process, with 1,428, 1,169, and 691 upregulated genes, respectively, and 1,579, 1,125, and 695 downregulated genes, respectively. There were 8 GO entries in the cellular component, and the thylakoid and thylakoid parts were the main ones, with 28 upregulated genes and 75 downregulated genes, respectively. The molecular function had 15 GO entries, mainly distributed in catalytic activity and transferase activity, with 1,273 and 559 upregulated genes and 1,324 and 499 downregulated genes, respectively. Using significance enrichment analysis (FDR ≤ 0.05), DEGs were enriched in biological processes, cellular components, and molecular functions (Supplementary Table S5). The biological process was mainly enriched in metabolic process, single-organism process, single-organism metabolic process, and oxidation-reduction process. The cellular component was mainly enriched in the photosystem II oxygen-evolving complex. The molecular function was mainly enriched in catalytic activity, transferase activity, and oxidoreductase activity. To further analyze the DEGs in the M. microcarpa, functional annotation information statistics of the DEGs were produced. A total of 11, 277 DEGs were annotated on 120 KEGG pathways, of which 18 pathways were significantly enriched (P < 0.05). According to the top 20 q-value distribution (Figure 5B) and enrichment of the KEGG pathway statistics of the DEG number (Figure 5C), the flavonoid biosynthesis (ko00941) pathway was the most significantly enriched (P < 0.05). The number of DEGs involved in starch and sucrose metabolism (ko00500), glycolysis/gluconeogenesis (ko00010), and phenylpropanoid biosynthesis (ko00940) pathways were the highest, with 268, 245, and 191 DEGs, respectively. DEGs were also enriched in antioxidant enzyme-related pathways, such as phenylalanine metabolism (ko00360) and peroxisome (ko04146) pathways. These enable the mining of key genes for low-temperature tolerance in M. microcarpa.
DEGs Related to Porphyrin and Chlorophyll Metabolism
To investigate the role of chlorophyll content in low temperatures. We determined that the highest content of chlorophyll was found in the control, followed by the low-temperature treatment (Figure 1C). Six DEGs were related to the porphyrin and chlorophyll metabolism pathway. The expression levels of six DEGs differed significantly between low-temperature treatment and control (Figure 6A). The expression levels of oxygen-dependent coproporphyrinogen-III oxidase (HEM), magnesium protoporphyrin IX methyltransferase (CHLM), magnesium-protoporphyrin IX monomethyl ester cyclase (CRD), chlorophyllase-2 (CLH), and protochlorophyllide reductase (PORA) were significantly lower in low-temperature treatment than in the control. Moreover, cluster analysis revealed that siroheme synthase (cobA) was significantly highly expressed in low-temperature treatment. Hence, the expression levels of HEM, CHLM, CRD, CLH, and PORA were downregulated by low-temperature treatment, and the synthesis of chlorophyll was reduced under low temperature during M. microcarpa leaves.
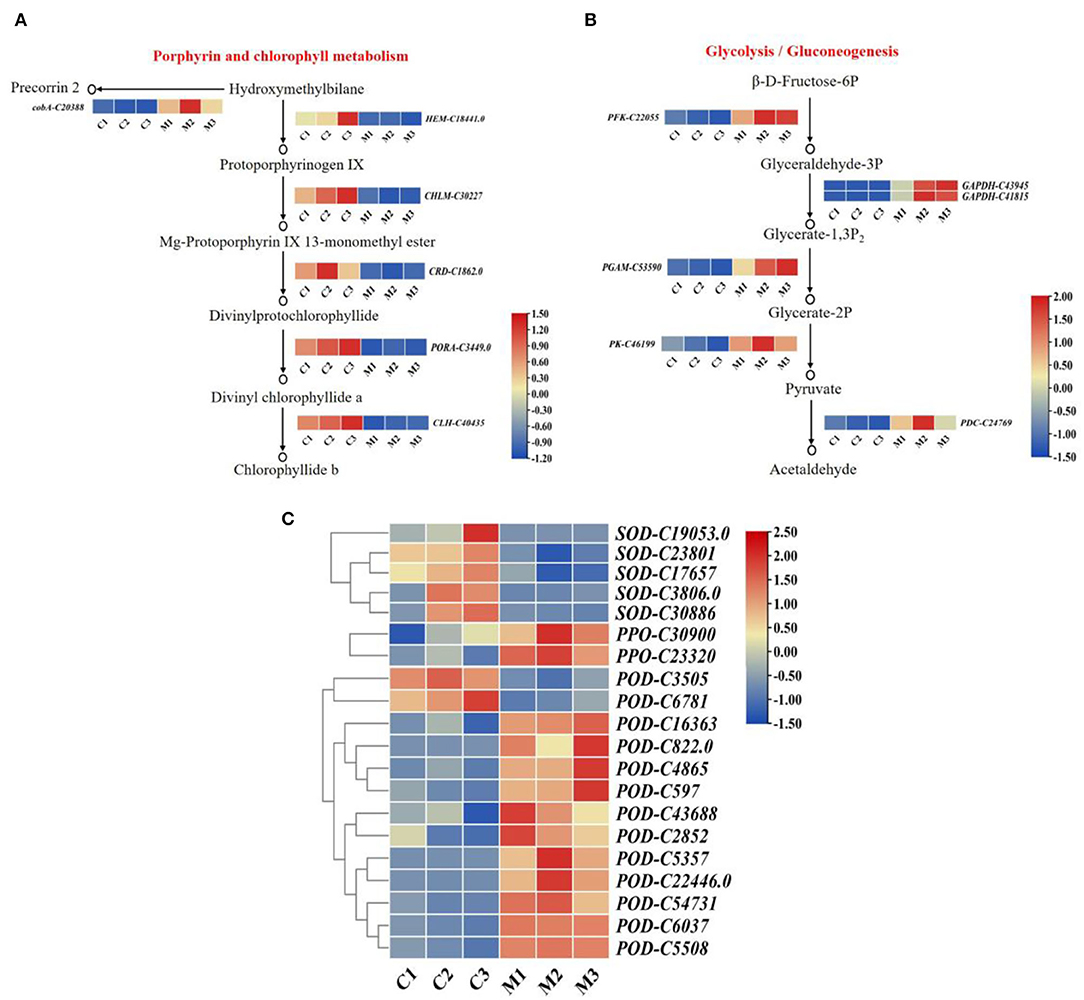
Figure 6. The expression patterns of DEGs. (A) The expression patterns of DEGs involved in porphyrin and chlorophyll metabolism pathway in M. microcarpa. (B) The expression patterns of DEGs involved in glycolysis/gluconeogenesis pathway in M. microcarpa. (C) Heat map depicting the expression patterns of antioxidant enzyme-related DEGs in M. microcarpa. Changes in expression level are indicated by a change in color, blue indicates a lower expression level, whereas red indicates a higher expression level. C, samples treated at 25°C; M, samples treated at −2.8°C.
DEGs Related to Glycolysis/Gluconeogenesis
At low temperatures, the content of soluble sugar increased compared with the control in the M. microcarpa leaves (Figure 1E). The KEGG annotations showed that six DEGs were related to the glycolysis/gluconeogenesis pathway. Heatmap analysis indicated that the expression levels of six DEGs differed significantly in low-temperature treatment than in the control (Figure 6B). Glyceraldehyde-3-phosphate dehydrogenase (GAPDH), ATP-dependent 6-phosphofructokinase (PFK), 2,3-bisphosphoglycerate-dependent phosphoglycerate mutase (PGAM), pyruvate decarboxylase (PDC), and pyruvate kinase (PK) were more highly expressed in low-temperature treatment. The expression levels of the DEGs were consistent with the trends of soluble sugar content, thus, these six DEGs might be important in promoting soluble sugar. Hence, low temperature could promote the expression level of key genes in the glycolysis/gluconeogenesis pathway in M. microcarpa leaves.
DEGs Related to Antioxidant Enzyme
To identify DEGs involved in antioxidant enzymes, we determined the POD, SOD, and PPO activities in the M. microcarpa leaves. From the transcriptome, we found 20 unigenes encoding antioxidant enzymes. Among these 20 DEGs, the expression levels of 13 unigenes of PPO-C30900, PPO-C23320, POD-C16363, POD-C822.0, POD-C4865, POD-C597, POD-C43688, POD-C2852, POD-C5357, POD-C22446.0, POD-C54731, POD-C6037, and POD-C5508 were significantly higher in the low-temperature treatment than in the control. Furthermore, the expression levels of SOD-C19053.0, SOD-C23801, SOD-C17657, SOD-C3806, SOD-C30886, POD-C3505, and POD-C6781 were the lowest in the low-temperature treatment (Figure 6C). Hence, the expression levels of PPO and POD increased enzymatic activity in the M. microcarpa under low temperatures.
Gene Expression Analysis of TFs
The gene expression network regulated by TFs plays a very important role in the regulation of plant abiotic stress. Overall, 1,745 TFs were annotated and classified into 62 families in M. microcarpa, 428 of which were differentially expressed (Figure 7A). To better understand the molecular mechanism of low-temperature treatment in M. microcarpa, we determined the differentially expressed TFs and obtained 28 TFs with significant differences from six TF families between the low-temperature treatment and CK (Figure 7B). Compared with the control, the results indicated that significantly upregulated TFs included two TFs belonging to the bHLH family (bHLH-C14208.0, bHLH-C19410), two TFs from the HSF family (HSF-C2991, HSF-C21912), two TFs from the WRKY family (WRKY-C24599, WRKY-C42373), four TFs from the NAC family (NAC-C1433.0, NAC-C1679, NAC-C28019, NAC-C2825), six TFs from the MYB family (MYB-C1334, MYB-C56279, MYB-C31275, MYB-C3182, MYB-C15788, MYB-C21357), and six TFs from the AP2/ERF family (AP2/ERF-C549.0, AP2/ERF-C5002, AP2/ERF-C44862, AP2/ERF-C13504.0, AP2/ERF-C23760.0, AP2/ERF-C5912). The significantly downregulated TFs included one NAC family (NAC-C27218), one MYB family (MYB-C26337), one bHLH family (bHLH-C7787), one HSF family (HSF-C18380), and two AP2/ERF families (AP2/ERF-C51600, AP2/ERF-C10780). These TFs may play a very important role in promoting the low-temperature treatment in M. microcarpa. Moreover, the low-temperature stress in M. microcarpa comprises a highly complex transcriptional network, and these results provide a basis for studying the role of TFs in low-temperature stress in M. microcarpa.
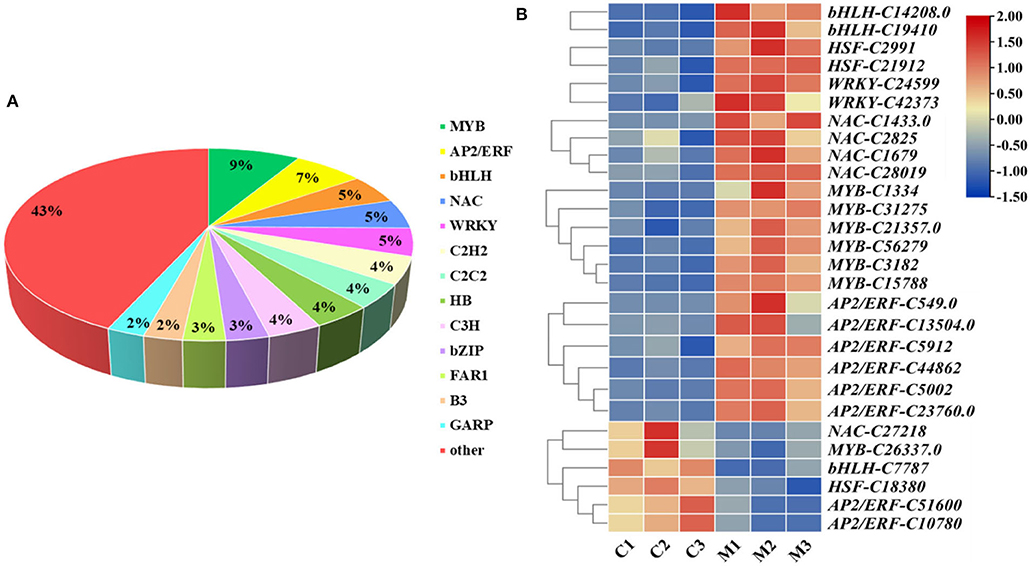
Figure 7. Analysis of differentially expressed TFs related to low-temperature stress. (A) Distribution of TF families in the transcriptome in M. microcarpa leaves. (B) Expression profiles of differentially expressed TFs. Changes in expression level are indicated by a change in color, blue indicates a lower expression level, whereas red indicates a higher expression level. C, samples treated at 25°C; M, samples treated at −2.8°C.
Validation of DEGs by qRT-PCR
To assess the accuracy of the RNA-seq data, 20 DEGs were randomly selected from the two groups of samples for qRT-PCR (Figure 8). The relative transcript levels of the low-temperature treatment and control were compared using qRT-PCR (Figure 8A). Among the 20 DEGs, qRT-PCR values of 11 genes (otsB-C13480, PK-C31237, GBEI-C30467, AMY-C18669, PFP-C26219, glgc-C33427, ALDO-C35063, MYB-C46336, MYB-C24599, MYB-C31275, and WRKY-C30062) were 3.9, 1.3, 2.3, 6, 2.6, 6.7, 4.9, 2.1, 1.6, 3.6, and 5.9 times higher, while 9 genes (ENO-C26476, PGK-C29740, glgA-C20045, SPS-C31843, SS-C30481, pgm-C39009, MYB-C18193, WRKY-C22005, and WRKY-C16730) were 7.4, 1.6, 3.2, 12.5, 10, 2, 1.4, 6.7, and 3.7 times lower in the treatment group than the control group in low temperature, respectively. As expected, a significantly positive correlation was observed between the qRT-PCR and transcriptome data in the M and C libraries (R2 = 0.6374, p < 0.05; Figure 8B). The transcriptome data were highly reproducible and reliable and could be used to further study the key genes related to tolerance to low temperatures in M. microcarpa.
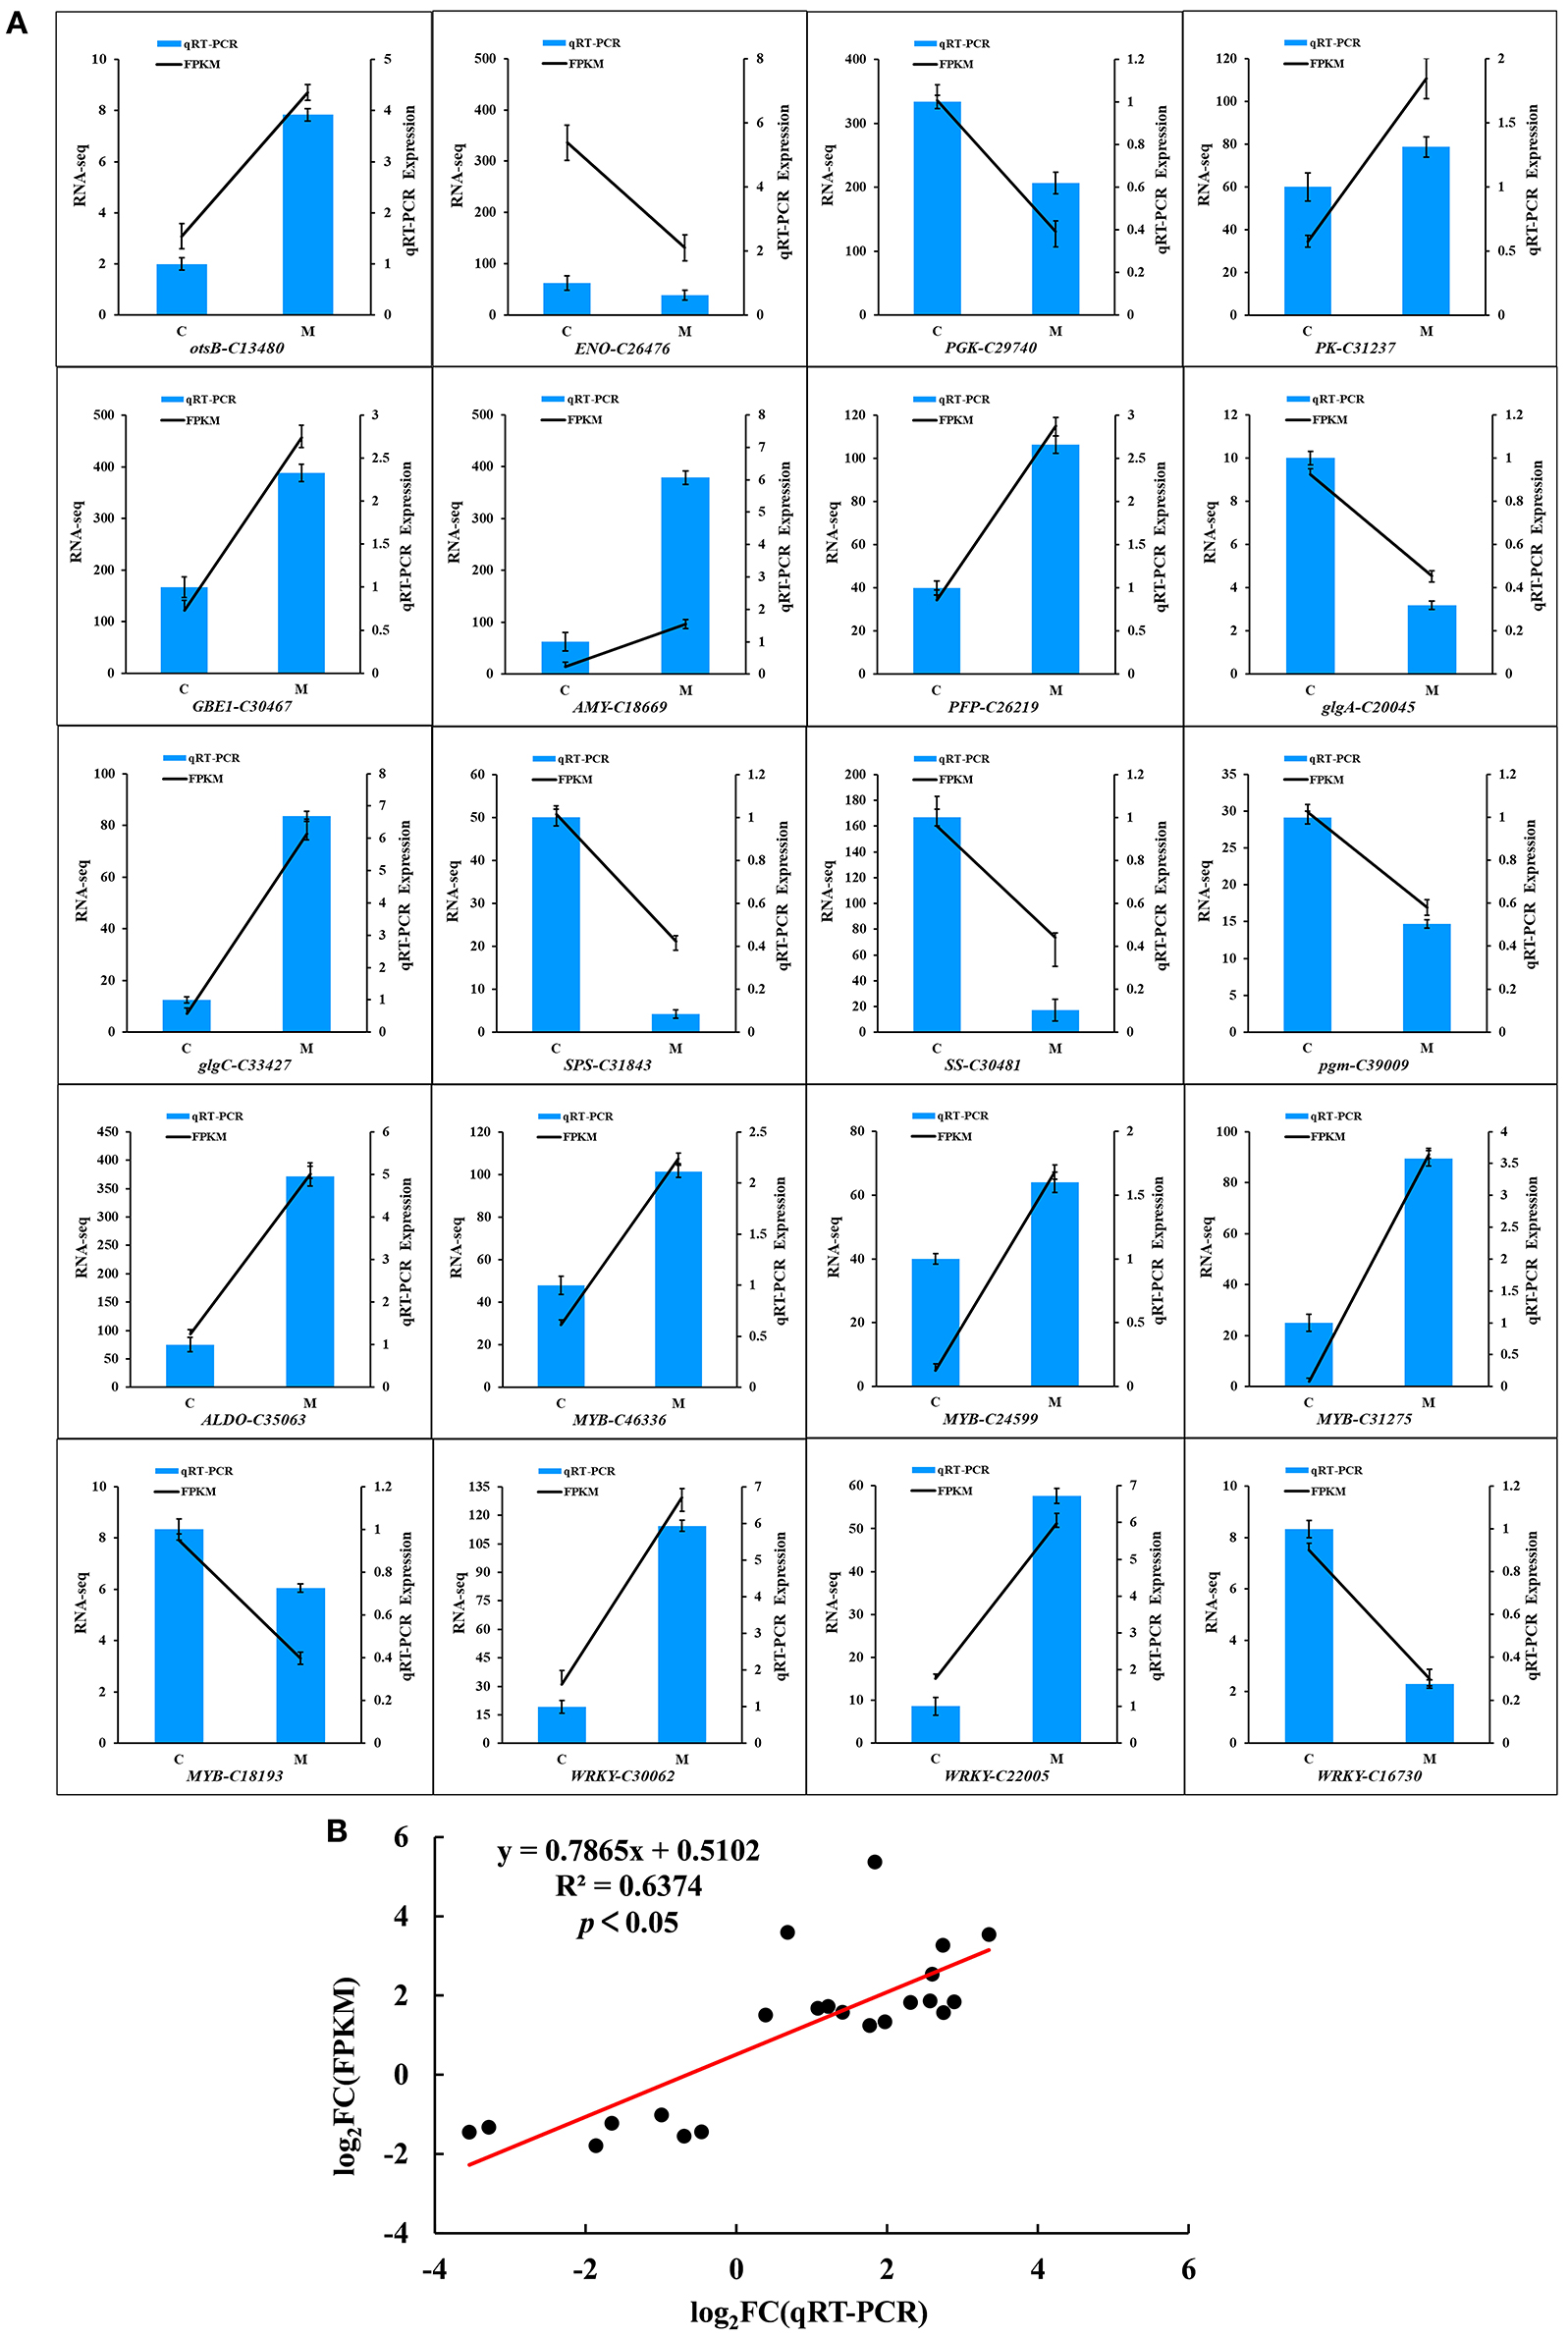
Figure 8. Quantitative Real-Time PCR validation of the 20 candidate genes in M. microcarpa transcriptome. (A) qRT-PCR validation of gene expression level in the transcriptome. The error bars represent the standard error of three biological replicates. Means with different letters in each tissue represent a significant difference at p ≤ 0.05. (B) Correlation analysis of the results between RNA-seq and qRT-PCR. Results were calculated using log2 fold variation measurements. The R2 value represents the correlation between the RNA-seq and qRT-PCR results.
Discussion
Physiological Changes in M. microcarpa Under Different Temperature Treatments
Conductivity is an important indicator of cell membrane permeability. The lower the cell tissue conductivity, the smaller the cell membrane permeability and the smaller the damage to cell membrane integrity (Yang et al., 2022). Measuring the electrolyte extravasation rate is one of the most effective methods for studying the cold tolerance of plants. This rate is combined with a logistic curve equation to derive the LT50, which can accurately reflect the low-temperature limit of plant tolerance (Yue et al., 2020); LT50 is widely used and applied to study the cold tolerance of plants (Zheng et al., 2015; Lu et al., 2017, 2019). In this study, the relative electrical conductivity of M. microcarpa leaves under different temperature treatments was measured, and the relative conductivity showed different trends. Under 25°C, the relative conductivity was the lowest. With the continuous decrease in temperature, the relative conductivity showed an “S” curve and an obvious upward trend. When the treatment temperature was −5°C, the relative conductivity was the highest, at more than 90%. This was consistent with the research conclusions of Armstrong et al. (2015) and Peixoto et al. (2015).
One of the reasons for the destruction of plants subjected to low-temperature stress is the lipid peroxidation of unsaturated fatty acids in the membrane induced by free radicals in cells (Wang et al., 2018). MDA is the final product of membrane lipid peroxidation, which represents an informative indicator of membrane damage (Cui et al., 2015). In this study, the malondialdehyde content in M. microcarpa leaves under different temperature treatments was measured. The malondialdehyde content showed an upward trend with a decrease in temperature. At 25°C, the content of MDA was the lowest. With a decrease in temperature, the content of MDA increased. When the temperature was reduced to −5°C, the MDA content was the highest, indicating that low-temperature stress had caused damage to the cells, leading to a large accumulation of MDA in M. microcarpa. This was consistent with the results of Zhang et al. (2016) on winter wheat, in which the MDA level increased in the overwintering period.
The chlorophyll content in plants directly affects the rate of photosynthesis and the use of light energy. It also affects the growth and development of the whole plant and has a great impact on normal metabolism in plants (Sharma et al., 2020). In this study, chlorophyll content showed a downward trend as the temperature decreased. At 25°C, the chlorophyll content was the highest. With a continuous decrease in temperature, the chlorophyll content gradually decreased, indicating that M. microcarpa has a relatively strong tolerance to low temperatures. Under low-temperature stress, the changes in leaf morphology might be related to the physiological dehydration caused by low temperature, while the changes in leaf color were related to the reduction of new chlorophyll synthesis and the destruction of the original chlorophyll under low temperatures.
Plants under environmental stress accumulate osmotic regulators, which help reduce cell osmotic potential, maintain cell expansion pressure, and improve the water absorption ability of cells (Farhangi-Abriz and Torabian, 2017). Soluble sugar and soluble protein are all osmotic regulatory substances in plant cytoplasm. Numerous studies have reported that cold stress induces the accumulation of osmotic substances in plants to improve cold resistance (Saladin et al., 2003; Wang et al., 2019). In this study, the variations in soluble sugars and soluble proteins showed different trends under different temperatures. At 12°C, the soluble protein content was the lowest. With the continuous decrease in temperature, the soluble protein content increased first and then decreased, possibly because M. microcarpa could adapt to environmental changes by regulating metabolic substances in plants at low temperatures. At 25°C, the soluble sugar content was the lowest, and with the decrease in temperature, the soluble sugar content showed a trend of increase–decrease–increase. At −5°C, the soluble sugar content was the highest, indicating that the soluble sugar content could be increased by inducing the activity of hydrolase at a low temperature.
Antioxidant enzymes are defensive enzymes when plants are subjected to stress conditions and play an important role in cell signaling and homeostasis (Wang et al., 2016). SOD, POD, and PPO are all important antioxidative enzymes that maintain the normal physiological activities of plants to a certain extent (Rahman et al., 2004; Kaur et al., 2009; Kusvuran et al., 2016). Many reports have confirmed that the capacity of antioxidative systems is a remarkable responsive mechanism for the cold tolerance of plants (Yang et al., 2008; Liu et al., 2010). In the present study, the POD, SOD, and PPO activities showed a consistent trend at different temperatures. With the decrease in temperature, POD, SOD, and PPO activities overall showed an increasing trend. There are reports that plants can resist cold damage by increasing the activity of antioxidant enzymes (Rivero et al., 2002). The POD, SOD, and PPO activities were the lowest at 12°C, and highest at −5°C. At low temperatures, plants initiate emergency mechanisms for the accumulation of free radicals to enhance their cold resistance, while low-temperature stress causes an increase in SOD, POD, and PPO activities.
Role of Chlorophyll Metabolism in M. microcarpa Low-Temperature Stress
Transcriptome sequencing plays an important role in plant functional genomes, which can reflect differences in gene expression levels in different physiological states, different organs, or at different times. RNA-seq can identify many cold stress-responsive DEGs (Shen et al., 2014; da Maia et al., 2016; Yang et al., 2019).
Chlorophyll is an important pigment related to plant photosynthesis, as it plays a role in the plant's tolerance to cold stress. In Brassica campestris, comparative transcriptome analysis revealed that chlorophyll metabolism contributes to leaf color changes in response to cold (Yuan et al., 2021). The main significantly downregulated pathways were involved in porphyrin and chlorophyll metabolism related to cold resistance of Lilium davidii (Tian et al., 2020). In this study, six DEGs (HEM, CHLM, CRD, CLH, and PORA downregulated expression, and cobA upregulated expression) are involved in porphyrin and chlorophyll metabolism were identified from the RNA-seq data. The result showed that five key genes were downregulated under low-temperature stress, reducing chlorophyll synthesis in M. microcarpa leaves. The cobA was up-regulated expression, which played a defensive role under low-temperature stress, to improve the synthesis of chlorophyll and maintain the survival and growth of plants.
Role of Sugar Metabolism in M. microcarpa Low-Temperature Stress
Sugars play an important role in plant cold tolerance and can function as signal molecules, participating in growth and various stress responses in plants (Yang et al., 2019; Saksena et al., 2020; Salvi et al., 2022). Many genes related to sugar synthesis have been identified in Arabidopsis, and these genes show differential expression during cold tolerance (Fowler and Thomashow, 2002). Several studies have shown that low temperatures induce starch degradation and that the genes encoding the major enzymes involved in this pathway are differentially regulated, promoting low-temperature responses (Li et al., 2011; Purdy et al., 2013). In the present study, six DEGs (two GAPDHs, PFK, PGAM, PDC, and PK) related to the glycolysis/gluconeogenesis pathway were identified from transcriptome analyses, which implied that these key genes are upregulated under low-temperature stress and promote the conversion of β-D-Fructose-6P to acetaldehyde (Figure 6B). Plants adapt to low-temperature stress by accelerating the oxidative decomposition of sugars. Sugar increased water retention and osmotic potential in cells and provided energy for the plant under adverse cold conditions (Yang et al., 2019).
Role of Antioxidant Enzyme in M. microcarpa Low-Temperature Stress
Low-temperature stress promotes the accumulation of ROS, which are toxic substances that cause oxidative damage to plants (Sachdev et al., 2021). An enzymatic antioxidant system including superoxide dismutase, peroxidase, and polyphenol oxidase, provides an efficient and specific ROS scavenging system for plants. They play an essential role in protecting plants from oxidative damage by ROS (Mittler, 2002). In the current study, the expression levels of DEGs (two PPOs and 11 PODs) were significantly higher in the low-temperature treatment than in the control. However, the SOD genes were downregulated in response to low-temperature stress, a similar report was found in barley cultivars (Kayihan et al., 2012). The results indicated that although these POD, SOD, and PPO genes could display different expression roles under low-temperature stress, SOD genes played a critical and positive role in different plants' responses to various abiotic stresses. These genes perform unique functions under stressful conditions and play special functions under stress conditions, forming a complex antioxidant defense system in vivo.
Candidate TFs Involved in M. microcarpa Low-Temperature Stress
TFs play an important role in plant response and resistance to stress (Gujjar et al., 2014). In this study, 1,745 TFs were annotated and classified into 62 families in M. microcarpa, 428 of which were differentially expressed. Among these TF families, bHLH, WRKY, NAC, MYB, and AP2/ERF accounted for a big proportion. The results were similar to those of the Populus tomentosa (Yang et al., 2019), Betula platyphylla (Yan et al., 2020), and indica rice (Pradhan et al., 2019) transcriptomes, in which WRKY, MYB, NAC, bHLH, HSF, and AP2/ERF TFs play regulatory effects on plant abiotic stress (Saha et al., 2015; Li et al., 2020).
Expression data from different plant species have indicated that members of the MYB family participate in plant responses to cold stress (Jiang et al., 2013; Tian et al., 2013). The ectopic expression of Myb4 TF improves physiological and biochemical adaptation to cold stress and modifies metabolite accumulation in apples (Pasquali et al., 2008). Arabidopsis thaliana transgenic plants overexpressing OsMYB3R-2 show increased tolerance to cold temperatures (Dai et al., 2007). The AP2/ERF is a large TF family in plants involved in plant developmental processes (Klay et al., 2018). The TF family includes DRE-binding proteins (DREB) and C-repeat binding factor (CBF). AgDREB1 and AgDREB2 contribute to the enhanced resistance to abiotic stress in transgenic Arabidopsis (Li et al., 2019b). In Betula platyphylla, BpERF13 regulates physiological processes underlying cold tolerance (Yan et al., 2020). At present, many NAC TFs have been reported to be involved in plants' low-temperature stress. MaNAC1 can enhance the cold tolerance in Musa acuminata (Shan et al., 2014). In the Capsicum annuum, the expression of CaNAC2 seedlings increased at low temperatures (Guo et al., 2015). However, MdNAC029 negatively regulated the cold tolerance of apples by inhibiting the expression of MdCBF1 and MdCBF4 (An et al., 2018). In this study, six MYBs, six AP2/ERFs, and four NACs were significantly upregulated, an MYB and NAC gene, and two AP2/ERFs were downregulated after low-temperature treatment. Therefore, when MYB, AP2/ERF, and NAC TFs participate in the regulation of low-temperature response, there may be positive and negative ways, among which the transcription factors with positive regulation account for the majority.
It also appears likely that WRKY, bHLH, and HSF TFs play an important role in M. microcarpa under low-temperature stress. There are many studies on how WRKY, bHLH, and HSF TFs respond strongly and rapidly to abiotic stress (Jiang et al., 2009; Chen et al., 2012; Ma et al., 2014). In Verbena bonariensis, VbWRKY32, as a positive regulator, upregulates the transcriptional level of cold response genes and improves survival ability under cold stress (Wang et al., 2020). In eggplant, SmWRKY26 and SmWRKY32 positively regulate the response to cold stress (Yang et al., 2020). Under low-temperature stress, OsbHLH1 gene expression is induced in rice seedlings (Wang et al., 2003). MdCIbHLH1 encodes a transcription factor that is important for the cold tolerance response in apples (Feng et al., 2012). Overexpression of TaHSF3 in transgenic Arabidopsis enhances tolerance to extreme temperatures (Zhang et al., 2013). In this study, two of the WRKYs, bHLHs, and HSFs were significantly upregulated after low-temperature treatment, thereby indicating that these TFs might play some positive regulatory roles in M. microcarpa.
In summary, combined physiological indexes and transcriptome sequencing showed that the low-temperature tolerance of M. microcarpa may occur through the synthesis of cold-inducible TFs initiating a series of cellular pathways, for example, increasing soluble sugar and other osmotic regulatory substances to resist external stress and producing SOD, POD, and PPO antioxidant enzymes to eliminate excessive free radicals generated in cells due to low-temperature stress. In this process, many enzyme genes are expressed, initiating a series of cell activities against external environmental stress.
Conclusions
In this study, annual M. microcarpa plants were treated at 25, 12, 5, 0, and −5°C. The relative electric conductivity of M. microcarpa leaves increased with decreasing temperature, and the LT50 was −2.8°C. The total chlorophyll content decreased, and the contents of MDA and soluble sugar and the activities of POD, SOD, and PPO increased and were used as the indexes of cold tolerance in M. microcarpa. POD, SOD, and PPO activities and soluble sugar content play an important role in the scavenging of active oxygen substances in M. microcarpa. Transcriptome data of M. microcarpa leaves revealed the molecular regulation of low-temperature tolerance. There were 9,385 DEGs involved in low-temperature stress in the M. microcarpa transcriptome data. Some DEGs were related to chlorophyll, sugar, and antioxidant enzyme, and some important TFs were involved in M. microcarpa under low-temperature stress (Figure 9). Differential expression analysis indicated that low-temperature stress downregulated key genes involved in the porphyrin and chlorophyll metabolism pathway, thus, reducing chlorophyll synthesis in M. microcarpa leaves. The expression levels of key genes also related to sugar metabolism and antioxidant enzyme were influenced by low-temperature treatment. In addition, some TFs, such as MYB, AP2/ERF, NAC, WRKY, bHLH, and HSF genes played an important role under low-temperature stress in M. microcarpa leaves. The transcriptome data can provide a basis for further analysis of the molecular mechanisms of low-temperature stress in M. microcarpa.
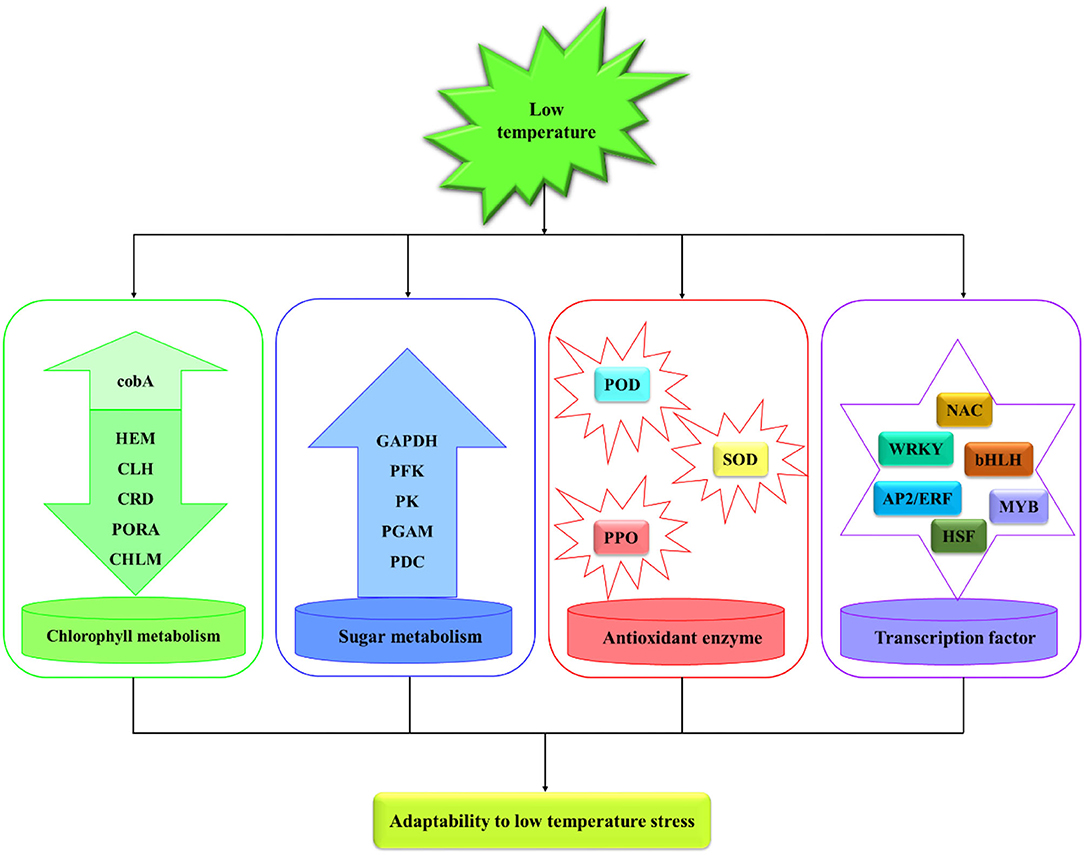
Figure 9. Regulation network model in M. microcarpa leaves under low-temperature stress.
Data Availability Statement
The datasets presented in this study have been deposited in the Genome Sequence Archive (Wang et al., 2017) in National Genomics Data Center (CNCB-NGDC Members and Partners, 2022), China National Center for Bioinformation/Beijing Institute of Genomics, Chinese Academy of Sciences, under accession number CRA006331 that are publicly accessible at https://ngdc.cncb.ac.cn/.
Author Contributions
YF and XH designed the research. XH wrote the manuscript. LH, TY, and YH collected the experimental materials. XH, FL, YL, and YX completed the experiment. DH and YY helped with the experiment. YF revised the manuscript. XH analyzed all the materials in this research. All authors contributed to the article and approved the submitted version.
Funding
This work was supported by the Science and Technology Research Project of the Education Department in Hubei Province of P.R. China (Q20181314) and the Natural Science Foundation Project in Hubei Province of P.R. China (2017CFB390).
Conflict of Interest
The authors declare that the research was conducted in the absence of any commercial or financial relationships that could be construed as a potential conflict of interest.
Publisher's Note
All claims expressed in this article are solely those of the authors and do not necessarily represent those of their affiliated organizations, or those of the publisher, the editors and the reviewers. Any product that may be evaluated in this article, or claim that may be made by its manufacturer, is not guaranteed or endorsed by the publisher.
Supplementary Material
The Supplementary Material for this article can be found online at: https://www.frontiersin.org/articles/10.3389/fpls.2022.900870/full#supplementary-material
References
An, J. P., Li, R., Qu, F. J., You, C. X., Wang, X. F., and Hao, Y. J. (2018). An apple NAC transcription factor negatively regulates cold tolerance via CBF-dependent pathway. J. Plant Physiol. 221, 74–80. doi: 10.1016/j.jplph.2017.12.009
Armstrong, J. J., Takebayashi, N., Sformo, T., and Wolf, D. E. (2015). Cold tolerance in Arabidopsis kamchatica. Am. J. Bot. 102, 439–448. doi: 10.3732/ajb.1400373
Baxter, A., Mittler, R., and Suzuki, N. (2014). ROS as key players in plant stress signalling. J. Exp. Bot. 65, 1229–1240. doi: 10.1093/jxb/ert375
Bradford, M. M.. (1976). A rapid and sensitive method for the quantitation of microgram quantities of protein utilizing the principle of protein-dye binding. Anal. Biochem. 72, 248–254. doi: 10.1016/0003-2697(76)90527-3
Chen, L., Song, Y., Li, S., Zhang, L., Zou, C., and Yu, D. (2012). The role of WRKY transcription factors in plant abiotic stresses. Biochim. Biophys. Acta Gene Regul. Mech. 1819, 120–128. doi: 10.1016/j.bbagrm.2011.09.002
Chen, L. J., Xiang, H. Z., Miao, Y., Zhang, L., Guo, Z. F., Zhao, X. H., et al. (2014). An overview of cold resistance in plants. J. Agron. Crop Sci. 200, 237–245. doi: 10.1111/jac.12082
Chen, R., Guo, J., and Zhu, T. (2015). Structure characteristics of Machilus microcarpa and Phoebe bournei. J. For. Environ. 35, 358–363. doi: 10.13324/j.cnki.jfcf.2015.04.011
Cui, M., Lin, Y., Zu, Y., Efferth, T., Li, D., and Tang, Z. (2015). Ethylene increases accumulation of compatible solutes and decreases oxidative stress to improve plant tolerance to water stress in Arabidopsis. J. Plant Biol. 58, 193–201. doi: 10.1007/s12374-014-0302-z
da Maia, L. C., Cadore, P. R., Benitez, L. C., Danielowski, R., Braga, E. J., Fagundes, P. R., et al. (2016). Transcriptome profiling of rice seedlings under cold stress. Funct. Plant Biol. 44, 419–429. doi: 10.1071/FP16239
Dai, X., Xu, Y., Ma, Q., Xu, W., Wang, T., Xue, Y., et al. (2007). Overexpression of an R1R2R3 MYB gene, OsMYB3R-2, increases tolerance to freezing, drought, and salt stress in transgenic Arabidopsis. Plant Physiol. 143, 1739–1751. doi: 10.1104/pp.106.094532
Farhangi-Abriz, S., and Torabian, S. (2017). Antioxidant enzyme and osmotic adjustment changes in bean seedlings as affected by biochar under salt stress. Ecotoxicol. Environ. Saf. 137, 64–70. doi: 10.1016/j.ecoenv.2016.11.029
Feng, G., Yang, H., and Li, Y. (2005). Kinetics of relative electrical conductivity and correlation with gas composition in modified atmosphere packaged bayberries (Myrica rubra Siebold and Zuccarini). LWT Food Sci. Technol. 38, 249–254. doi: 10.1016/j.lwt.2004.05.015
Feng, X., Xu, Y., Peng, L., Yu, X., Zhao, Q., Feng, S., et al. (2019). TaEXPB7-B, a β-expansin gene involved in low-temperature stress and abscisic acid responses, promotes growth and cold resistance in Arabidopsis thaliana. J. Plant Physiol. 240, 153004. doi: 10.1016/j.jplph.2019.153004
Feng, X. M., Zhao, Q., Zhao, L. L., Qiao, Y., Xie, X. B., Li, H. F., et al. (2012). The cold-induced basic helix-loop-helix transcription factor gene MdCIbHLH1 encodes an ICE-like protein in apple. BMC Plant Biol. 12, 22. doi: 10.1186/1471-2229-12-22
Fowler, S., and Thomashow, M. F. (2002). Arabidopsis transcriptome profiling indicates that multiple regulatory pathways are activated during cold acclimation in addition to the CBF cold response pathway. Plant Cell 14, 1675–1690. doi: 10.1105/tpc.003483
Gaete-Loyola, J., Lagos, C., Beltrán, M. F., Valenzuela, S., Emhart, V., and Fernández, M. (2017). Transcriptome profiling of Eucalyptus nitens reveals deeper insight into the molecular mechanism of cold acclimation and deacclimation process. Tree Genet. Genomes 13, 1–18. doi: 10.1007/s11295-017-1121-4
Gill, S. S., and Tuteja, N. (2010). Reactive oxygen species and antioxidant machinery in abiotic stress tolerance in crop plants. Plant Physiol. Biochem. 48, 909–930. doi: 10.1016/j.plaphy.2010.08.016
Gou, Y., Cheng, S., Ye, J., Zhou, X., Xu, F., Chen, Z., et al. (2020). Comparative transcriptome analysis reveals the potential molecular mechanism involved in fatty acids biosynthesis of Juglans regia. Sci. Hortic. 269, 109388. doi: 10.1016/j.scienta.2020.109388
Grabherr, M., Haas, B., Yassour, M., Levin, J., Thompson, D., et al. (2011). Full-length transcriptome assembly from RNA-Seq data without a reference genome. Nat. Biotechnol. 29, 644–652. doi: 10.1038/nbt.1883
Guerra, D., Lamontanara, A., Bagnaresi, P., Orrù, L., Rizza, F., Zelasco, S., et al. (2015). Transcriptome changes associated with cold acclimation in leaves of olive tree (Olea europaea L.). Tree Genetics and Genomes, 11, 1–24. doi: 10.1007/s11295-015-0939-x
Gujjar, R. S., Akhtar, M., and Singh, M. (2014). Transcription factors in abiotic stress tolerance. Indian J. Plant Physiol. 19, 306–316. doi: 10.1007/s40502-014-0121-8
Guo, W. L., Wang, S. B., Chen, R. G., Chen, B. H., Du, X. H., Yin, Y. X., et al. (2015). Characterization and expression profile of CaNAC2 pepper gene. Front. Plant Sci. 6, 755. doi: 10.3389/fpls.2015.00755
He, X., Zhang, Y., Sun, B., Wei, P., and Hu, D. (2019). Study on leaf epidermis structure and dust-retention ability of five Machilus species. Notulae Botanicae Horti Agrobotanici Cluj-Napoca 47, 1224–1229. doi: 10.15835/nbha47411608
Jiang, Y., Peng, D., Bai, L. P., Ma, H., Chen, L. J., Zhao, M. H., et al. (2013). Molecular switch for cold acclimation-anatomy of the cold-inducible promoter in plants. Biochemistry 78, 342–354. doi: 10.1134/S0006297913040032
Jiang, Y., Yang, B., and Deyholos, M. K. (2009). Functional characterization of the Arabidopsis bHLH92 transcription factor in abiotic stress. Mol. Genet. Genomics 282, 503–516. doi: 10.1007/s00438-009-0481-3
Kaur, S., Gupta, A. K., Kaur, N., Sandhu, J. S., and Gupta, S. K. (2009). Antioxidative enzymes and sucrose synthase contribute to cold stress tolerance in chickpea. J. Agron. Crop Sci. 195, 393–397. doi: 10.1111/j.1439-037X.2009.00383.x
Kayihan, C., Eyidogan, F., Afsar, N., Oktem, H. A., and Yucel, M. (2012). Cu/Zn superoxide dismutase activity and respective gene expression during cold acclimation and freezing stress in barley cultivars. Biol. Plant. 56, 693–698. doi: 10.1007/s10535-012-0143-x
Klay, I., Gouia, S., Liu, M., Mila, I., Khoudi, H., Bernadac, A., et al. (2018). Ethylene Response Factors (ERF) are differentially regulated by different abiotic stress types in tomato plants. Plant Sci. 274, 137–145. doi: 10.1016/j.plantsci.2018.05.023
Kusvuran, S., Kiran, S., and Ellialtioglu, S. S. (2016). “Antioxidant enzyme activities and abiotic stress tolerance relationship in vegetable crops,” in Abiotic and Biotic Stress in Plants—Recent Advances and Future Perspectives ed. A. K. Shanker and C. Shanker (London: IntechOpen), 481–506. doi: 10.5772/62235
Laudencia-Chingcuanco, D., Ganeshan, S., You, F., Fowler, B., Chibbar, R., and Anderson, O. (2011). Genome-wide gene expression analysis supports a developmental model of low temperature tolerance gene regulation in wheat (Triticum aestivum L.). BMC Genomics 12, 299. doi: 10.1186/1471-2164-12-299
Li, C., Liu, Y., Ding, F., Shu, D., Cui, Y., Zhao, W., et al. (2019a). Transpiration characteristics and influencing factors of the dominant species of Machilus microcarpa in Maolan Karst forest. J. Nanjing For. Univ. 43, 51–58. doi: 10.3969/j.issn.1000-2006.201808018
Li, G., Wan, S., Zhou, J., Yang, Z., and Qin, P. (2010). Leaf chlorophyll fluorescence, hyperspectral reflectance, pigments content, malondialdehyde and proline accumulation responses of castor bean (Ricinus communis L.) seedlings to salt stress levels. Ind. Crops Prod. 31, 13–19. doi: 10.1016/j.indcrop.2009.07.015
Li, M. Y., Liu, J. X., Hao, J. N., Feng, K., Duan, A. Q., Yang, Q. Q., et al. (2019b). Genomic identification of AP2/ERF transcription factors and functional characterization of two cold resistance-related AP2/ERF genes in celery (Apium graveolens L.). Planta 250, 1265–1280. doi: 10.1007/s00425-019-03222-2
Li, R., Jin, X., Hu, X., Chai, Y., Cai, M., Luo, F., et al. (2017). Analysis and comprehensive evaluation on cold resistance of six varieties of Michelia. J. Appl. Ecol. 28, 1464–1472. doi: 10.13287/j.1001-9332.201705.039
Li, T., Xu, S. L., Oses-Prieto, J. A., Putil, S., Xu, P., Wang, R. J., et al. (2011). Proteomics analysis reveals post-translational mechanisms for cold-induced metabolic changes in Arabidopsis. Mol. Plant 4, 361–374. doi: 10.1093/mp/ssq078
Li, W., Pang, S., Lu, Z., and Jin, B. (2020). Function and mechanism of WRKY transcription factors in abiotic stress responses of plants. Plants 9, 1515. doi: 10.3390/plants9111515
Liu, L., Duan, L., Zhang, J., Zhang, Z., Mi, G., and Ren, H. (2010). Cucumber (Cucumis sativus L.) over-expressing cold-induced transcriptome regulator ICE1 exhibits changed morphological characters and enhances chilling tolerance. Sci. Hortic. 124, 29–33. doi: 10.1016/j.scienta.2009.11.018
Liu, S., Wang, N., Zhang, P., Cong, B., Lin, X., Wang, S., et al. (2013). Next-generation sequencing-based transcriptome profiling analysis of Pohlia nutans reveals insight into the stress-relevant genes in Antarctic moss. Extremophiles 17, 391–403. doi: 10.1007/s00792-013-0528-6
Liu, X. M., Tan, J. P., Cheng, S. Y., Chen, Z. X., Ye, J. B., Zheng, J. R., et al. (2022). Comparative transcriptome analysis provides novel insights into the molecular mechanism of berberine biosynthesis in Coptis chinensis. Sci. Hortic. 291, 110585. doi: 10.1016/j.scienta.2021.110585
Lu, Y., Hu, Y., and Li, P. (2017). Consistency of electrical and physiological properties of tea leaves on indicating critical cold temperature. Biosyst. Eng. 159, 89–96. doi: 10.1016/j.biosystemseng.2017.04.012
Lu, Y., Hu, Y., Snyder, R. L., and Kent, E. R. (2019). Tea leaf's microstructure and ultrastructure response to low temperature in indicating critical damage temperature. Inform. Proc. Agricult. 6, 247–254. doi: 10.1016/j.inpa.2018.09.004
Ma, J., Xu, Z. S., Wang, F., Tan, G. F., Li, M. Y., and Xiong, A. S. (2014). Genome-wide analysis of HSF family transcription factors and their responses to abiotic stresses in two Chinese cabbage varieties. Acta Physiol. Plant. 36, 513–523. doi: 10.1007/s11738-013-1432-5
Megha, S., Basu, U., and Kav, N. (2018). Regulation of low temperature stress in plants by microRNAs. Plant Cell Environ. 41, 1–15. doi: 10.1111/pce.12956
Meng, P., Bai, X., Li, H., Song, X., and Zhang, X. (2015). Cold hardiness estimation of Pinus densiflora var. zhangwuensis based on changes in ionic leakage, chlorophyll fluorescence and other physiological activities under cold stress. J. For. Res. 26, 641–649. doi: 10.1007/s11676-015-0111-3
Mittler, R.. (2002). Oxidative stress, antioxidants and stress tolerance. Trends Plant Sci. 7, 405–410. doi: 10.1016/S1360-1385(02)02312-9
Moustakas, M., Sperdouli, I., Kouna, T., Antonopoulou, C. I., and Therios, I. (2011). Exogenous proline induces soluble sugar accumulation and alleviates drought stress effects on photosystem II functioning of Arabidopsis thaliana leaves. Plant Growth Regul. 65, 315–325. doi: 10.1007/s10725-011-9604-z
Nan, F., Feng, J., Lv, J., Liu, Q., and Xie, S. (2018). Transcriptome analysis of the typical freshwater rhodophytes Sheathia arcuata grown under different light intensities. PLoS ONE 13, e0197729. doi: 10.1371/journal.pone.0197729
Pasquali, G., Biricolti, S., Locatelli, F., Baldoni, E., and Mattana, M. (2008). Osmyb4 expression improves adaptive responses to drought and cold stress in transgenic apples. Plant Cell Rep. 27, 1677–1686. doi: 10.1007/s00299-008-0587-9
Peixoto, M. D. M., Friesen, P. C., and Sage, R. F. (2015). Winter cold-tolerance thresholds in field-grown Miscanthus hybrid rhizomes. J. Exp. Bot. 66, 4415–4425. doi: 10.1093/jxb/erv093
Pradhan, S. K., Pandit, E., Nayak, D. K., Behera, L., and Mohapatra, T. (2019). Genes, pathways and transcription factors involved in seedling stage chilling stress tolerance in indica rice through RNA-seq analysis. BMC Plant Biol. 19, 352. doi: 10.1186/s12870-019-1922-8
Purdy, S. J., Bussell, J. D., Nunn, C. P., and Smith, S. M. (2013). Leaves of the Arabidopsis maltose exporter1 mutant exhibit a metabolic profile with features of cold acclimation in the warm. PLoS ONE 8, e79412. doi: 10.1371/journal.pone.0079412
Rahman, S. L., Mackay, W. A., Nawata, E., Sakuratani, T., Uddin, A. M., and Quebedeaux, B. (2004). Superoxide dismutase and stress tolerance of four tomato cultivars. HortScience 39, 983–986. doi: 10.21273/HORTSCI.39.5.983
Rakei, A., Maali-Amiri, R., Zeinali, H., and Ranjbar, M. (2016). DNA methylation and physio-biochemical analysis of chickpea in response to cold stress. Protoplasma 253, 61–76. doi: 10.1007/s00709-015-0788-3
Rivero, R. M., Ruiz, J. M., García, P. C., López-Lefebre, L. R., Sánchez, E., and Romero, L. (2002). Response of oxidative metabolism in watermelon plants subjected to cold stress. Funct. Plant Biol. 29, 643–648. doi: 10.1071/PP01013
Sachdev, S., Ansari, S. A., Ansari, M. I., Fujita, M., and Hasanuzzaman, M. (2021). Abiotic stress and reactive oxygen species: generation, signaling, and defense mechanisms. Antioxidants 10, 277. doi: 10.3390/antiox10020277
Saha, G., Park, J. I., Jung, H. J., Ahmed, N. U., Kayum, M. A., Kang, J. G., et al. (2015). Molecular characterization of BZR transcription factor family and abiotic stress induced expression profiling in Brassica rapa. Plant Physiol. Biochem. 92, 92–104. doi: 10.1016/j.plaphy.2015.04.013
Saksena, H. B., Sharma, M., Singh, D., and Laxmi, A. (2020). The versatile role of glucose signalling in regulating growth, development and stress responses in plants. J. Plant Biochem. Biotechnol. 29, 687–699. doi: 10.1007/s13562-020-00614-4
Saladin, G., Clément, C., and Magné, C. (2003). Stress effects of flumioxazin herbicide on grapevine (Vitis vinifera L.) grown in vitro. Plant Cell Rep. 21, 1221–1227. doi: 10.1007/s00299-003-0658-x
Salvi, P., Agarrwal, R., Gandass, N., Manna, M., Kaur, H., and Deshmukh, R. (2022). Sugar transporters and their molecular tradeoffs during abiotic stress responses in plants. Physiol. Plantarum 174, e13652. doi: 10.1111/ppl.13652
Schmittgen, T. D., and Livak, K. J. (2008). Analyzing real-time PCR data by the comparative CT method. Nat. Protoc. 3, 1101–1108. doi: 10.1038/nprot.2008.73
Shan, W., Kuang, J. F., Lu, W. J., and Chen, J. Y. (2014). Banana fruit NAC transcription factor MaNAC1 is a direct target of MaICE1 and involved in cold stress through interacting with MaCBF1. Plant Cell Environ. 37, 2116–2127. doi: 10.1111/pce.12303
Sharma, A., Kumar, V., Shahzad, B., Ramakrishnan, M., Singh Sidhu, G. P., Bali, A. S., et al. (2020). Photosynthetic response of plants under different abiotic stresses: a review. J. Plant Growth Regul. 39, 509–531. doi: 10.1007/s00344-019-10018-x
Shen, C., Li, D., He, R., Fang, Z., Xia, Y., Gao, J., et al. (2014). Comparative transcriptome analysis of RNA-seq data for cold-tolerant and cold-sensitive rice genotypes under cold stress. J. Plant Biol. 57, 337–348. doi: 10.1007/s12374-014-0183-1
Song, Q., Cheng, S., Chen, Z., Nie, G., Xu, F., Zhang, J., et al. (2019). Comparative transcriptome analysis revealing the potential mechanism of seed germination stimulated by exogenous gibberellin in Fraxinus hupehensis. BMC Plant Biol. 19, 1–17. doi: 10.1186/s12870-019-1801-3
Tian, D. Q., Pan, X. Y., Yu, Y. M., Wang, W. Y., Zhang, F., Ge, Y. Y., et al. (2013). De novo characterization of the Anthurium transcriptome and analysis of its digital gene expression under cold stress. BMC Genomics 14, 827. doi: 10.1186/1471-2164-14-827
Tian, X., Xie, J., and Yu, J. (2020). Physiological and transcriptomic responses of Lanzhou Lily (Lilium davidii, var. unicolor) to cold stress. PLoS ONE 15, e0227921. doi: 10.1371/journal.pone.0227921
Wang, F., Liang, D., Pei, X., Zhang, Q., Zhang, P., Zhang, J., et al. (2019). Study on the physiological indices of Pinus sibirica and Pinus koraiensis seedlings under cold stress. J. For. Res. 30, 1255–1265. doi: 10.1007/s11676-018-0833-0
Wang, F., Liu, J., Zhou, L., Pan, G., Li, Z., and Cheng, F. (2016). Senescence-specific change in ROS scavenging enzyme activities and regulation of various SOD isozymes to ROS levels in psf mutant rice leaves. Plant Physiol. Biochem. 109, 248–261. doi: 10.1016/j.plaphy.2016.10.005
Wang, M. Q., Huang, Q. X., Lin, P., Zeng, Q. H., Li, Y., Liu, Q. L., et al. (2020). The overexpression of a transcription factor gene VbWRKY32 enhances the cold tolerance in Verbena bonariensis. Front. Plant Sci. 10, 1746. doi: 10.3389/fpls.2019.01746
Wang, Y., Song, F., Zhu, J., Zhang, S., Yang, Y., Chen, T., et al. (2017). GSA: genome sequence archive. Genom. Proteom. Bioinf. 15, 14–18. doi: 10.1016/j.gpb.2017.01.001
Wang, Y. J., Zhang, Z. G., He, X. J., Zhou, H. L., Wen, Y. X., Dai, J. X., et al. (2003). A rice transcription factor OsbHLH1 is involved in cold stress response. Theor. Appl. Genet. 107, 1402–1409. doi: 10.1007/s00122-003-1378-x
Wang, Y. X., Ya, H. U., Chen, B. H., Zhu, Y. F., Dawuda, M. M., and Svetla, S. (2018). Physiological mechanisms of resistance to cold stress associated with 10 elite apple rootstocks. J. Integr. Agric. 17, 857–866. doi: 10.1016/S2095-3119(17)61760-X
Wellburn, A.. (1994). The spectral determination of chlorophylls a and b, as well as total carotenoids, using various solvents with spectrophotometers of different resolution. J. Plant Physiol. 144, 307–313. doi: 10.1016/S0176-1617(11)81192-2
Xiong, H., Guo, H., Xie, Y., Zhao, L., Gu, J., Zhao, S., et al. (2017). RNA-seq analysis reveals pathways and candidate genes associated with salinity tolerance in a spaceflight-induced wheat mutant. Sci. Rep. 7, 1–13. doi: 10.1038/s41598-017-03024-0
Yan, S., Zhang, D., Chen, S., and Chen, S. (2020). Transcriptome sequencing analysis of birch (Betula platyphylla Sukaczev) under low-temperature stress. Forests 11, 970. doi: 10.3390/f11090970
Yang, J. Y., Gao, Y., Li, Y. M., Qi, X. H., and Zhang, M. F. (2008). Salicylic acid-induced enhancement of cold tolerance through activation of antioxidative capacity in watermelon. Sci. Hortic. 118, 200–205. doi: 10.1016/j.scienta.2008.06.015
Yang, X., Zhao, T., Rao, P., Gao, K., Yang, X., Chen, Z., et al. (2019). Transcriptome profiling of Populus tomentosa under cold stress. Ind. Crops Prod. 135, 283–293. doi: 10.1016/j.indcrop.2019.04.056
Yang, Y., Huang, C., Ge, Z., Zhou, B., Su, G., Liu, C., et al. (2022). Exogenous glycine betaine reduces drought damage by mediating osmotic adjustment and enhancing antioxidant defense in Phoebe hunanensis. Phyton 91, 129. doi: 10.32604/phyton.2022.016704
Yang, Y., Liu, J., Zhou, X., Liu, S., and Zhuang, Y. (2020). Identification of WRKY gene family and characterization of cold stress-responsive WRKY genes in eggplant. PeerJ. 8, e8777. doi: 10.7717/peerj.8777
Yuan, L., Zhang, L., Wu, Y., Zheng, Y., Nie, L., Zhang, S., et al. (2021). Comparative transcriptome analysis reveals that chlorophyll metabolism contributes to leaf color changes in wucai (Brassica campestris L.) in response to cold. BMC Plant Biol. 21, 438. doi: 10.1186/s12870-021-03218-9
Yue, Y., Ren, M., Quan, Y., Lian, M., Piao, X., Wu, S., et al. (2020). Autopolyploidy in Chrysanthemum cv. ‘Gongju' improved cold tolerance. Plant Mol. Biol. Rep. 38, 655–665. doi: 10.1007/s11105-020-01225-y
Zhang, B., Jia, D., Gao, Z., Dong, Q., and He, L. (2016). Physiological responses to low temperature in spring and winter wheat varieties. J. Sci. Food Agric. 96, 1967–1973. doi: 10.1002/jsfa.7306
Zhang, S., Xu, Z. S., Li, P., Yang, L., Wei, Y., Chen, M., et al. (2013). Overexpression of TaHSF3 in transgenic Arabidopsis enhances tolerance to extreme temperatures. Plant Mol. Biol. Rep. 31, 688–697. doi: 10.1007/s11105-012-0546-z
Keywords: Machilus microcarpa, cold tolerance, transcriptome, RNA-Seq, differentially expressed genes
Citation: He X, Long F, Li Y, Xu Y, Hu L, Yao T, Huang Y, Hu D, Yang Y and Fei Y (2022) Comparative Transcriptome Analysis Revealing the Potential Mechanism of Low-Temperature Stress in Machilus microcarpa. Front. Plant Sci. 13:900870. doi: 10.3389/fpls.2022.900870
Received: 21 March 2022; Accepted: 02 June 2022;
Published: 19 July 2022.
Edited by:
Zixian Zeng, Sichuan Normal University, ChinaReviewed by:
Jun Tang, Jiangsu Academy of Agricultural Sciences, ChinaGuo-Qiang Wu, Lanzhou University of Technology, China
Copyright © 2022 He, Long, Li, Xu, Hu, Yao, Huang, Hu, Yang and Fei. This is an open-access article distributed under the terms of the Creative Commons Attribution License (CC BY). The use, distribution or reproduction in other forums is permitted, provided the original author(s) and the copyright owner(s) are credited and that the original publication in this journal is cited, in accordance with accepted academic practice. No use, distribution or reproduction is permitted which does not comply with these terms.
*Correspondence: Yongjun Fei, fyj2010@163.com