
95% of researchers rate our articles as excellent or good
Learn more about the work of our research integrity team to safeguard the quality of each article we publish.
Find out more
ORIGINAL RESEARCH article
Front. Plant Sci. , 27 June 2022
Sec. Plant Biotechnology
Volume 13 - 2022 | https://doi.org/10.3389/fpls.2022.898307
This article is part of the Research Topic Mechanisms of Abiotic Stress Responses and Tolerance in Plants: Physiological, Biochemical and Molecular Interventions, volume II View all 37 articles
 Hafiz Muhammad Rizwan1
 Abdul Waheed2
 Songfeng Ma1Jiankun Li1Muhammad Bilal Arshad3Muhammad Irshad4Binqi Li1Xuelian Yang1Ahmad Ali5
 Mohamed A. A. Ahmed6Nusrat Shaheen7
 Sandra S. Scholz8Ralf Oelmüller1,8Zhimin Lin9*Faxing Chen1*
Plant surfaces are covered with cuticle wax and are the first barrier between a plant and environmental stresses. Eceriferum (CER) is an important gene family involved in wax biosynthesis and stress resistance. In this study, for the first time, 34 CER genes were identified in the passion fruit (Passiflora edulis) genome, and PeCER proteins varied in physicochemical properties. A phylogenetic tree was constructed and divided into seven clades to identify the evolutionary relationship with other plant species. Gene structure analyses revealed that conserved motifs ranged from 1 to 24, and that exons ranged from 1 to 29. The cis-element analysis provides insight into possible roles of PeCER genes in plant growth, development and stress responses. The syntenic analysis revealed that segmental (six gene pairs) and tandem (six gene pairs) gene duplication played an important role in the expansion of PeCER genes and underwent a strong purifying selection. In addition, 12 putative ped-miRNAs were identified to be targeting 16 PeCER genes, and PeCER6 was the most targeted by four miRNAs including ped-miR157a-5p, ped-miR164b-5p, ped-miR319b, and ped-miR319l. Potential transcription factors (TFs) such as ERF, AP2, MYB, and bZIP were predicted and visualized in a TF regulatory network interacting with PeCER genes. GO and KEGG annotation analysis revealed that PeCER genes were highly related to fatty acid, cutin, and wax biosynthesis, plant-pathogen interactions, and stress response pathways. The hypothesis that most PeCER proteins were predicted to localize to the plasma membrane was validated by transient expression assays of PeCER32 protein in onion epidermal cells. qRT-PCR expression results showed that most of the PeCER genes including PeCER1, PeCER11, PeCER15, PeCER17, and PeCER32 were upregulated under drought and Fusarium kyushuense stress conditions compared to controls. These findings provide a foundation for further studies on functions of PeCER genes to further facilitate the genetic modification of passion fruit wax biosynthesis and stress resistance.
Plant growth and development are significantly affected by different environmental factors such as biotic and abiotic stresses (Pandey et al., 2017; Raza, 2021; Sharif et al., 2021). The plant cuticle is a hydrophobic protective layer covering plant epidermis and is the first barrier between the environment and plants. Epicuticle wax is composed of very-long-chain fatty acids (VLCFAs) and their derivatives such as alkanes, ketones, primary and secondary alcohols, aldehydes, esters, and triterpenes (Zhang et al., 2020). The wax of plant cuticles play an important role in controlling non-stomatal water loss and preventing mechanical damages, ultraviolet (UV) light, pathogens, and other environmental biotic and abiotic stresses (Lewandowska et al., 2020). Plant leaves without wax tend to have high transpiration rate, low chlorophyll content, and inferior CO2 assimilation ability (Medeiros et al., 2017). According to reports, fruit quality and shelf life are also associated with the development and structure of wax on fruit surfaces (Lara et al., 2019; Ding et al., 2020; Zhang et al., 2021).
Eceriferum (CER) genes play an important role in VLCFAs and wax biosynthesis pathways, and have been thoroughly investigated in numerous plant species (Li et al., 2021). The first member, the CER1 gene, was molecularly characterized in Arabidopsis (AtCER1) and was discovered to be responsible for the conversion of ultra-long-chain aldehydes into ultra-long-chain alkanes and stimulated under biotic and abiotic stresses (Aarts et al., 1995; Wang et al., 2021). The overexpression of OsCER1 in rice (Oryza sativa) involved the biosynthesis of VLCFAs and alkanes, differentiation of plastids, and pollen development (Ni et al., 2018). Wang et al. (2020) also pointed out that BnCER1-2 in overexpressed rapeseed (Brassica napus) plants stimulated the production of alkanes and improved the tolerance to drought. Sakuradani et al. (2013) found that the CER22 gene, an allele of CER1, was involved in the biosynthesis of cuticular wax alkanes in Arabidopsis. AtCER2 was found to be involved in VLCFA biosynthesis and acyltransferase in C28 elongation process (Pascal et al., 2013) as well as in pollen coat and cuticle formation (Haslam et al., 2015). CER3 was found to be involved in epidermal wax biosynthesis in response to changes in humidity in Arabidopsis. CER3 interacts with CER1 and catalyzes redox-dependent VLCFAs from very long chain acyl-CoA (Rowland et al., 2007; Kim et al., 2019). CER4 encodes fatty acyl-CoA that forms alcohol reductase and is involved in the ester reduction pathway for production of Arabidopsis epidermal wax. CER4 has been reported to be expressed in different plant tissues including plant stem, roots, flowers, leaves, and siliques (Rowland et al., 2006). Adenosine triphosphate-binding cassette (ABC) proteins are transporters in endogenous substrates across the plasma and intracellular membranes (Sharom et al., 2011). Epicuticular wax is produced in epidermal cells and transported to the cuticle via ABC transporters. Pighin et al. (2004) reported that the Arabidopsis CER5 gene encodes an ABC transporter, which is required for wax export to the cuticle and localized in the plasma membrane of epidermal cells. The overexpression of the CER6 gene in Arabidopsis showed a significant increase in the production of stem wax (Hooker et al., 2002), as well as in the production of fatty acids from C26 to C28 (Tresch et al., 2012).
Arabidopsis CER7 mutants participate in wax biosynthesis by reducing the expression level of CER3/WAX2 and promoting cellular procedures (Hooker et al., 2007). Lü et al. (2009) reported that the Arabidopsis CER8/LACS (long-chain acyl-CoA-synthetase-1) mutant showed an overlapping function with LACS2 in cuticle wax biosynthesis. CER9 was involved in cuticle biosynthesis and maintained plant water level by encoding the putative E3 ubiquitin ligase in Arabidopsis and participating in the signal transduction of abscisic acid (ABA) in seeds and seedlings (Zhao et al., 2014). Zheng et al. (2005) reported that CER10 was involved in VLCFA biosynthesis, and later on, Ensing et al. (2016) further identified that the CER10 mutant exhibited an increase in non-stomatal water loss and was tolerant to drought conditions. Pascal et al. (2013) demonstrated that the CER26 and CER2-like proteins were involved in the elongation of VLCFAs and wax biosynthesis. The overexpression of CER26 mutants exhibited a glossy stem phenotype and C30 carbon leading to cuticle wax biosynthesis. CER60 was involved in VLCFA, which prolonged C28 to C30 activity and produces trace amounts of VLCFA after expressed in yeast (Hooker et al., 2002; Trenkamp et al., 2004).
Cuticular wax plays an important role in plant biotic and abiotic stresses. Drought is the main type of abiotic stress, limiting the growth and productivity of plants and leading to global food security and terrestrial health (Kumar et al., 2021). The expression levels of CER genes were upregulated in response to drought, osmotic, and ABA responses (Xue et al., 2017). The ectopic overexpression of AtCER1 and AtCER3 genes in tobacco improved the cuticle wax and reduced water loss under drought stress conditions (Cameron et al., 2006). Wang et al. (2015) reported that the overexpression of cucumber (Cucumis sativus) CsWAX2 homologous to CER3 increased resistance to drought and pathogens. The biosynthesis of cuticle wax is mediated by different transcription factors (TFs) and the coordinated expression of multiple related genes (Al-Abdallat et al., 2014). Different TFs have been reported to be involved in the biosynthesis of fatty acids and wax including AP2/ERF (APETALA2/ETHYLENE RESPONSIVE FACTOR), WIN1 (WAX INDUCER1), SHN1 (SHINE1), and WRI1 (WRINKLED1) (Hao et al., 2017).
In addition, micro-RNAs (miRNAs) are non-coding single-stranded RNAs (~21–30 nucleotides) found in plants and animals. It has been reported that miRNAs play an important role in numerous cellular mechanisms as well as in stress resistance by translational inhibition and/or cleavage of target mRNAs during or after transcription (Yadav et al., 2020). The miRNA, such as trans-acting small interfering RNA (tasiRNA) in Arabidopsis thaliana has been reported to be involved in CER3 silencing during stem wax production (Lam et al., 2015). Similarly, Liu et al. (2019) mentioned that brassica miRNA (bna-miR165a-5p) may be involved in the synthesis of wax by regulating the BnaA06g40560D gene. These findings suggested that miRNA might have a significant role in wax biosynthesis by modulating targeted genes. Gene Ontology (GO) is a collection of ideas described in terms that aimed to classify genes on the basis of function and consists of three main classifications, biological processes (GO-BP), cellular component (GO-CC), and molecular function (GO-MF). Using advanced GO terms, functional classification of genes can be conducted on species (Ashburner et al., 2000; Raza et al., 2022). The Kyoto Encyclopedia of Genes and Genomes (KEGG) is a bioinformatics resource for understanding biological functions at genomic levels, and contains network information to present functions in pathways (Masoudi-Nejad et al., 2007).
The CER gene family has been identified in different plant species including 29 CER family members in jujuba (Ziziphus jujuba Mill.) (Li et al., 2021), 10 CER family members in apple (Malus domestica) (Qi et al., 2019a), and 37 CER family members in sunflower (Helianthus annuus) (Ahmad et al., 2021). However, the CER gene family has not been identified in passion fruit (Passiflora edulis). Passion fruit is a perennial climbing vine and is usually cultivated throughout tropical and subtropical regions of the world. Passion fruit is an economically important fruit plant and is well-known for its fresh juice, rich aroma, and distinctive nutritional values (Rizwan et al., 2021). Recently, the passion fruit genome (Ma et al., 2021) has been published. For the first time, a comprehensive genome-wide study was conducted to identify the CER genes in the passion fruit genome. Moreover, their in-silico prediction of TFs, subcellular localization, evolutionary relationship via phylogenic and syntenic analysis, conserved motifs, gene structures, cis-regulatory elements, prediction of putative miRNA, and functional annotation analyses were performed. qRT-PCR expression profiles in different passion fruit tissues under drought stress (abiotic stress) and Fusarium kyushuense fungal stress (biotic stress) conditions were identified to gain insight into passion fruit CER genes. This study provides a foundation for further functional studies on candidate passion fruit CER genes to further genetic improvement of passion fruit.
In order to perform the genome-wide identification of CER genes in passion fruit, all known CER family protein sequences of Arabidopsis thaliana (AtCER) were downloaded from The Arabidopsis Information Resource (TAIR) database (http://www.Arabidopsis.org), Malus domestica (apple, MdCER) (Qi et al., 2019a) from the Phytozome database (https://data.jgi.doe.gov/refine-download/phytozome?organism=Mdomestica&expanded=491), and Helianthus annuus (sunflower, HaCER) (Ahmad et al., 2021) and Ziziphus jujuba (jujuba, ZjCER) (Li et al., 2021) from National Center for Biotechnology Information (NCBI) (https://www.ncbi.nlm.nih.gov/). The passion fruit protein, CDS (coding DNA sequence), gff, and genome sequence files were downloaded from the passion fruit genome (http://ftp.cngb.org/pub/CNSA/data3/CNP0001287/CNS0275691/CNA0017758/) (Ma et al., 2021). To identify the homologous CER genes in the passion fruit genome, BLASTp (Basic Local Alignment Search Tool for proteins) was performed in default mode using the protein sequences in TBtools software package v 1.098726 (https://github.com/CJ-Chen/TBtools/releases/tag/1.098726) (Chen C. et al., 2020).
Physicochemical features such as molecular weight (MW), CDS length, amino acid (AA) length, instability index (II), aliphatic index (AI), isoelectric point (pl), number of exons and introns (E/I) of PeCER genes were evaluated using the ExPASY-Prot online tool (https://web.expasy.org/protparam/) (Gasteiger et al., 2005). Subcellular localization of PeCER genes was predicted using CELLO v.2.5 (http://cello.life.nctu.edu.tw) (Yu et al., 2004). Full-length protein sequences of the CER genes of P. edulis, A. thaliana, M. domestica, H. annus, and Z. jujuba were aligned with Molecular Evolutionary Genetics Analyses (MEGA) software v 10.1.8 (https://www.megasoftware.net/) (Kumar et al., 2008) and were used for phylogenetic analyses. A neighbor-joining (NJ) tree was constructed using the MEGA software with 1,000 bootstrap replicates, and all other parameters were set to default. The iTOL web tool (https://itol.embl.de/login.cgi) (Letunic and Bork, 2007) was used to visualize the phylogenetic tree and divide it into clades. Passion fruit genomic files were used to investigate the distribution of PeCER genes on all passion fruit chromosomes with the TBtools software (Chen C. et al., 2020). Moreover, the online SIAS (Sequence Identity and Similarity) (http://imed.med.ucm.es/Tools/sias.html) tool was used to perform pairwise sequence identification on passion fruit CER genes.
Gene structure annotations for candidate CER genes were retrieved from passion fruit gff genomic files. Conserved motifs of PeCER proteins were recognized by employing the MEME (Multiple Expectation Maximization for Motif Elicitation) online tool (http://meme-suite.org/index.html) (Bailey et al., 2006), and the number of motifs was set to fifteen. The TBtools software was used to merge and visualize PeCER gene structures and conserved motifs from passion fruit.
Two-thousand-bp sequences of upstream regions of all PeCER genes were extracted from genomic DNA sequences for the prediction of putative cis-regulatory elements. Furthermore, the extracted sequences (2,000 bp) were subjected to the online PlantCARE database (https://bioinformatics.psb.ugent.be/ webtools/plantcare/html/) (Lescot, 2002), and a figure was drawn using the TBtools software (Chen C. et al., 2020). The numbers, functions, and sequences of putative cis-acting elements of PeCER genes were summarized and highlighted into different categories including plant growth and development, phytohormone responses, and stress responses.
Segmental and tandem duplication provides new insight into family gene development and genome progression. Homologous PeCER genes on the same passion fruit chromosome with no more than one intervention gene were considered tandem duplicates, while on other chromosomes were considered segmental duplicates. PeCER gene duplicates were identified and visualized according to their physical position on chromosomes in the passion fruit genome. Gene duplication, synteny, and non-synonymous (Ka)/synonymous (Ks) analysis of CER genes were performed with the TBtools software (Chen C. et al., 2020). The syntenic relationships of CER genes between P. edulis, A. thaliana, M. domestica, H. annus, and Z. jujuba were performed by TBtools software using MCScanX toolkit package (Chen C. et al., 2020). Ka and Ks nucleotide substitution rates and Ka/Ks ratios were annotated using TBtools, and divergence time (mya = millions year ago) was calculated as follows: time = Ks/2x (x = 6.38 × 10⁻⁹) (Ma et al., 2021).
The PeCER protein-protein interaction network was predicted using the online tool STRING 11.0 (https://string-db.org/cgi/input.pl), and the interaction was constructed based on known Arabidopsis proteins. The parameters for the STRING tool were set as follows: network type-full STRING network: the meaning of network edge evidence; minimum required interaction score was set to medium confidence parameter (0.4), and the maximum number of interactors to show was no more than 10. The protein secondary structures of PeCER were predicted using SOPMA SECONDARY STRUCTURE PREDICTION METHOD (https://npsa-prabi.ibcp.fr/cgi-bin/npsa_automat.pl?page=npsa_sopma.html) (Geourjon and Deleage, 1995). All 34 PeCER proteins were three-dimensionally modeled (3D) using Phyre2 with default mode (http://www.sbg.bio.ic.ac.uk/phyre2/html/) (Kelley et al., 2015).
The potential miRNA target sites in PeCER genes were predicted by the following steps; first, the published mature sequences of passion fruit miRNAs were downloaded (Paul et al., 2020), later the CDS sequences of all the 34 PeCER genes were submitted to the psRNATarget server with default parameters (https://www.zhaolab.org/psRNATarget/) for the prediction of potential miRNAs in PeCER genes. Cytoscape software V 3.9 (https://cytoscape.org/download.html) was used to visualize the interaction network between the predicted miRNAs and PeCER target genes. The GO and KEGG annotation analyses were performed by submitting all the 34 PeCER protein sequences to the online database eggNOG (http://eggnog-mapper.embl.de/), and their enrichment and annotation analysis were performed with the TBtools software (Chen C. et al., 2020).
The plant TF prediction and regulatory network analysis were performed as described by Zheng et al. (2020) with slight modifications. In order to predict the TFs in the upstream regions of PeCER genes, 1,000-bp nucleotide sequences from the upstream promoter region of PeCER genes were extracted from the passion fruit genome and submitted to Plant Transcriptional Regulatory Map (PTRM) (http://plantregmap.gao-lab.org/binding_site_prediction.php) with p ≤ 1e-6 (Tian et al., 2020). The transcription factor regulatory network was constructed and visualized with the Cytoscape 3.9 software (Kohl et al., 2011).
The expression profiles of the 34 identified PeCER genes in different tissues of yellow and purple passion fruit cultivars were evaluated through the available public data. The RNA-Seq raw reads were downloaded from the NCBI Sequence Read Archive database (http://www.ncbi.nlm.nih.gov/sra) with the following accession numbers: SRP150688 (Xu et al., 2019) and PRJNA634206 (Wu et al., 2021). The passion fruit sample information for the NCBI raw reads was as follows: peel tissue samples were from yellow (P. edulis. Flavicarpa cv Huangjin) and purple (P. edulis. Sims cv Tainong) cultivars in the ripening stage, and pulp samples were from fruit developmental stages (fruitlet, green, version, and ripening stages). Root tissue samples were from the purple passion fruit Pingtan-1 cold-tolerant cultivar in two cultivation areas: limestone (L) and sandy dolomite (D) rocky desertification areas. Leaf tissue samples were from yellow Huangjinguo (HJG) cold-sensitive and purple Tainong-1 cold-tolerant cultivars under normal temperature (NT) and chilling stress (CS) conditions.
RNA-Seq raw reads were quality-controlled and filtered with the fastp package (Chen S. et al., 2018) and mapped to the passion fruit reference genome (Ma et al., 2021) using the HISAT2 package (Kim and Langmead, 2015) in Ubuntu wslv 20.04.3 (https://ubuntu.com/wsl). The sequence alignment map (SAM) files were transformed to binary alignment map (BAM) and sorted with the Samtools package (Li et al., 2009). Fragments per kilobase of exon per million mapped fragments (FPKM) values were calculated using the limma and edgeR (Law et al., 2016). Since the FPKM expression values of different tissues of passion fruit were quite different, the FPKM values were converted to log2FC (FC = fold change), and heatmaps were constructed using the TBtools software.
To study the expression profiles of selected PeCER genes under drought stress and normal conditions, seeds of two commercial passion fruit cultivars yellow (P. edulis. Flavicarpa cv Huangjin) and purple (P. edulis. Sims cv Tainong) were grown in plastic pots filled with peat moss and soil (2:1 ratio). Greenhouse temperature was 25 ± 2°C, photoperiod was 16/8 h, light/dark, and relative humidity was 75%. One-month-old passion fruit seedlings were subjected to dehydration for 10 days and rewatered. Leaf, root, and stem samples from each cultivar with three biological replicates were taken and immediately frozen in liquid nitrogen and were stored at −80°C for further use. Samples from normally watered plants were taken as control. For F. kyushuense fungal biotic stress samples, fruits of both cultivars were obtained from a commercial orchard located in Fujian province, China (23°48035.200 N and 117°07008.100 E). Fruits were surface-sterilized and inoculated with F. kyushuense pathogenic fungus by following the protocol mentioned in our previous publication (Rizwan et al., 2021). Peel samples from the infected areas were collected at 9th and 12th day post-inoculation (dpi), and fruits without infections were used as control.
Total RNA was isolated from frozen samples using a Tiangen mini-RNA extraction kit (Tiangen, China) following the manufacturer's instructions and was quantified with a Thermo Fisher Scientific NanoDrop 2000 UV-Vis spectrophotometer (United States). The first strand of complementary DNA (cDNA) was synthesized using 1 μg of total RNA by Takara PrimeScript™ RT Reagent Kit with a gDNA eraser (TAKARA, China), and cDNA was diluted five times with double distilled water (ddH2O). The quantitative real-time polymerase chain reaction (qRT-PCR) was carried out on LightCycler® 96 (Roche Applied Science, Penzberg, Germany) in a 20-μl total reaction mixture, which was composed of 10 μl of a TB Green premixed enzyme solution (TAKARA, China), 1 μl each of the forward and reverse primers (100 μM), 1 μl cDNA, and 7 μl ddH2O. Passion fruit genes encoding Pe60S, PeTIF (transcription initiation factor), and histone were used as the reference genes for internal control (Munhoz et al., 2015). The qRT-PCR reaction was performed as described below, including preincubation at 95°C for 30 s, followed by 45 cycles at 95°C for 10 s, and 60°C for 30 s. Each reaction was performed with three biological replicates, and relative gene expression levels were normalized with the Pe60S gene and calculated using the 2−ΔΔCT method (Schmittgen and Livak, 2008). The details of all the primers used in this study can be found in Supplementary Table S1.
To validate the predicted results of the subcellular localization of PeCER proteins, a transient expression assay of the PeCER32 protein was performed in onion epidermal cells with a pCAMBIA1302 vector containing a cauliflower mosaic virus 35S (CaMV35S) promoter and a green fluorescent protein (GFP) tag in the upstream region of the multiple cloning sites (MCS). The full-length CDS (930 bp) of PeCER32 without stop codon was amplified by PCR using the following primers: 5′-ACGGGGGACTCTTGACCATGGATGAAGGTGACTGTAGTTTCTCGC-3′ (NcoI) and 5′- TCTCCTTTACTAGTCAGATCTCAGGAATGGGGGCAGTATAATCCA-3′ (BglII) (restriction sites are underlined), and cloned into the pMD™ 19-T vector (Cat# 6013; TAKARA, Shiga, Japan). Sequencing (Sangon Biotech Co., Ltd., Shanghai, China) was performed to confirm the positive clones, which were digested with NcoI and BglII restriction enzymes (TAKARA, China). ClonExpress II One Step Cloning Kit (Cat# C112; Vazyme Biotech Co., Ltd., Nanjing, China) was used for ligation into the NcoI-BglII-digested pCAMBIA1302 vector and transferred to Agrobacterium tumefaciens EHA105 strain for subsequent infection. The resulting plasmids were named CaMV35S-PeCER32-GFP and empty vector CaMV35S-GFP, and they were successfully transformed into onion epidermal cells with the agroinfiltration method. GFP signals were detected and visualized with a laser scanning confocal microscope (Olympus, Tokyo, Japan; FV1200) after 24-72 h of agroinfiltration (Xu et al., 2014).
All statistical analyses were performed by one-way analysis of variance (ANOVA) and figures were generated with GraphPad Prism 8.0.1 (https://www.graphpad.com/scientific-software/prism). Student's t-test (p <0.05) was conducted to compare the samples of yellow and purple passion fruits tissues under controlled and stressed condition.
In this study, the known CER protein sequences from different species were blasted with passion fruit genome proteins and after removing redundant, repetitive, and unrecognized sequences, finally, 34 CER genes were identified in the passion fruit genome with computational tools. The passion fruit CER genes were named from PeCER1 to PeCER34 based on their positions on chromosomes (Table 1). The PeCER genes were unevenly distributed on eight out of nine passion fruit chromosomes. Chromosome number 1 contained a comparatively high number of PeCER genes (12 genes) followed by chromosome 6 (6 genes), chromosome 5 (5 genes), chromosomes 2 and 8 (4 genes on each); chromosomes 3, 5, and 9 contained only one PeCER gene (Table 1, Supplementary Figure S1). The detailed information of all the 34 PeCER genes is available in Table 1, and protein sequences have been provided in Supplementary Table S2. The protein analysis shows that the length of the PeCER protein varied from 182 (PeCER15) to 1,718 bp (PeCER13), that the CDS length ranged from 549 (PeCER15) to 5,157 bp (PeCER13), and that the protein molecular weight ranged from 20.64 (PeCER15) to 199.26 KDa (PeCER13) (Table 1). The isoelectric point of proteins ranged from 5.92 (PeCER23) to 10.07 (PeCER2), the protein instability index varied from 30.11 (PeCER3) to 52.21 (PeCER30), and the aliphatic index of proteins varied from 82.11 (PeCER30) to 110.12 (PeCER28). The GRAVY ranged from −0.25 (PeCER16) to 0.383 (PeCER21). The number of exons varied from 1 (PeCER6, PeCER8, and PeCER9) to 28 (PeCER13). The subcellular location prediction showed that most of the PeCER proteins were associated with the plasma membrane except for PeCER2, PeCER3 and PeCER15 (mitochondrial), and PeCER22 and PeCER23 (cytoplasmic) (Table 1).
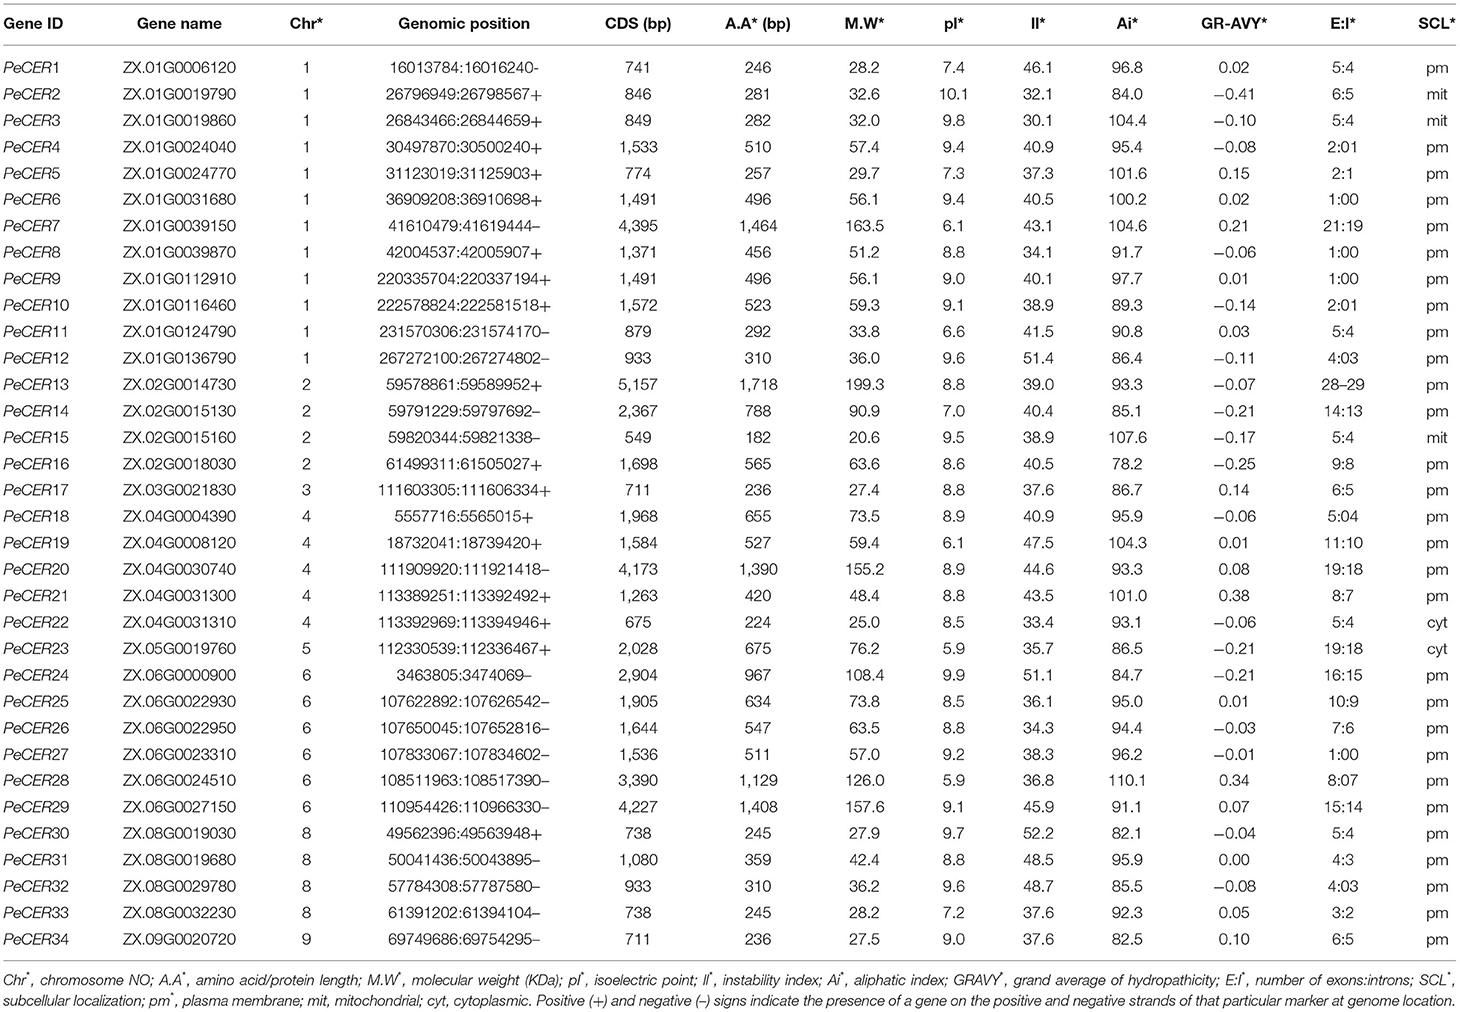
Table 1. Physicochemical features of PeCER genes.
One hundred and forty-four CER protein sequences from P. edulis (PeCER), A. thaliana (AtCER), M. domestica (MdCER), H. annus (HaCER), and Z. jujuba (ZjCER) were used to assess the evolutionary relationship and construct the phylogenetic tree (all the protein sequences used for the phylogenetic tree has been provided in Supplementary Table S2). The protein sequences were aligned, and a neighbor-joining tree was constructed by grouping into seven clades based on sunflower HaCER (Ahmad et al., 2021) (Figure 1A). The results showed that clade 1 comprised of 24 CER genes (3 PeCERs, 4 AtCERs, 7 HaCERs, 6 MdCERs, and 4 ZjCERs); clade 2 comprised of 16 genes (3 PeCERs, 4 AtCERs, 1 ZjCERs, 3 MdCERs, and 5 HaCERs); clade 3 comprised of 37 genes (7 PeCERs, 6 AtCERs, 4 HaCERs, 7 MdCERs, and 13 ZjCERs); clade 4 comprised of 12 genes (6 PeCERs and 6 ZjCERs); clade 5 comprised of 22 genes (8 PeCERs, 6 AtCERs, 6 HaCERs, and 2 ZjCERs); clade 6 comprised of 15 genes (6 PeCERs, 4 HaCERs, 2 AtCERs, and 3 ZjCERs); clade 7 comprised of 18 genes (1 PeCER, 9 AtCERs, 7 HaCERs, and 1 MdCER) (Figure 1A). Each clade varied in the number of genes; among them, clade 2 was found to be the largest group containing the highest number of CER genes (37 genes) followed by clade 1 (24 genes), whereas clade 4 was the smallest group that contained only 12 CER genes (Figure 1A). PeCER genes also varied in their unequal distribution among the different clades such as the highest number of PeCER genes (8 genes) found in clade 5 followed by clade 3 (7 genes), and clade 7 contained only 1 PeCER gene (Figure 1A). These alignment and evolutionary results revealed that the PeCER proteins shared greater homology with A. thaliana and Z. jujuba compared with H. annus and M. domestica CER proteins (Figure 1A). In terms of pairwise gene similarity percentage index in the PeCER genes, the similarity index also varied from 2.66 (PeCER7/PeCER22) to 91.54% (PeCER6/PeCER9). The results showed that the PeCER6 and PeCER9 proteins showed the highest similarity of 91.54% and were consistent with the phylogenetic results as grouped in the same clade 5 (Figure 1A, Supplementary Table S3).
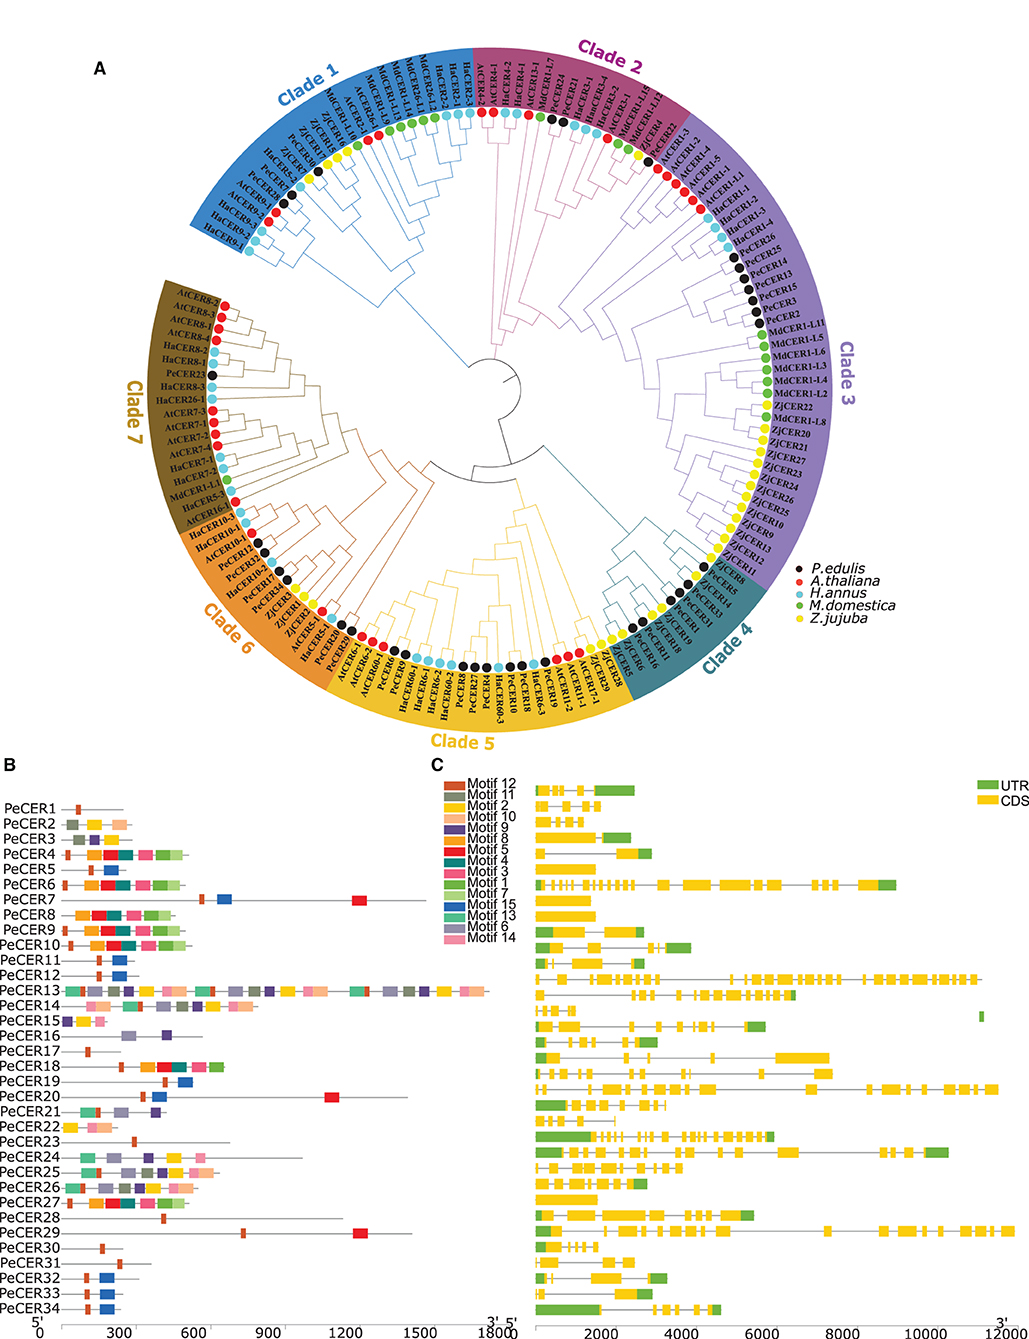
Figure 1. (A) Unrooted neighbor-joining phylogenetic tree among P. edulis, A. thaliana, M. domestica, H. annus, and Z. jujuba CER amino acid sequences with 1,000 bootstraps constructed with MEGA software v10.1.8. The protein sequences of PeCER, AtCER, HaCER, MdCER, and ZjCER are represented by black, red, aqua, green, and yellow color circles, respectively. (B) Conserved motifs were represented via boxes, and different colors represent different motifs. (C) PeCER gene structures; yellow color indicates the exons, green color shows the untranslated 5′ and 3′-regions, and gray color indicates the introns.
The conserved motifs and exon-intron organization of gene structure were analyzed to further understand the development of the PeCER gene family. Furthermore, the conserved motifs among 34 PeCER genes were predicted using the online MEME suit, and the range of conserved motifs varied from 1 to 24 (Figure 1B). Overall, a total of 15 conserved motifs were predicted among the 34 PeCER proteins (Supplementary Table S4). The majority of PeCER genes (12 genes) have 8 motifs followed by 3 motifs (4 genes). PeCER7 contains 11 motifs, and PeCER 15 and PeCER16 contain 9 motifs. A maximum of 24 and 10 motifs were recognized in PeCER13 and PeCER14 respectively, whereas PeCER1, PeCER17, PeCER23, PeCER28, PeCER30, and PeCER31 contained only 1 motif (Figure 1B, Supplementary Table S4). The genomic structural analysis for exon-intron position in the 34 PeCER genes revealed that the number of exon-intron in the identified PeCER genes varied from 1 to 29 (Figure 1C). Most of the PeCER genes contained more than 5 exons, whereas genes such as PeCER13, PeCER7, PeCER20, and PeCER24 contained 29, 21, 19, and 16 exons, respectively. For instance, the PeCER6, PeCER8, and PeCER9 genes contained only 1 exon and no intron (Figure 1C). These findings stated that variation of motifs and exon-intron during the evolutionary process occurred instantaneously in PeCER gene family development, and that PeCER genes that contain the same features may have the same function.
To further understand the possible role of PeCER genes in response to biotic and abiotic stresses, the cis-regulatory elements of PeCER genes from 2,000 bp upstream promoter regions were analyzed (Figure 2). The promoters of PeCER genes mainly comprised four categories of cis-regulatory elements including plant growth- and development-responsive (six different types of cis-elements including CAT-box, circadian, GCN4-motif, O2-site, RY-element, and CCGTCC motif), phytohormone-responsive (twelve different types of cis-elements including ABRE, AuxRR-core, CGTCA-motif, ERE, GARE-motif, P-box, TATC-box, TCA-element, TGA-box, TGA-element, JERE, and TGACG-motif), light-responsive (nineteen different types of cis-elements including 3-AF1 binding site, ACE, AE-box, AT1-motif, ATC-motif, ATCT-motif, TCT-motif, Box 4, chs-CMA1a/2a/2b/2c, GA-motif, GATA-motif, G-Box, GT1-motif, GTGGC motif, I-box, LAMP-element, MRE, Sp1, and TCCC-motif), and stress-responsive including anaerobic induction, MYB binding site, and wound and temperature-responsive, (eight different types of cis-elements: ARE, GC-motif, LTR, MBS, TC-rich repeats, CARE, WUN-motif, and CCAAT-box) elements (Figure 2A, Supplementary Table S5). In terms of cis-element categories, the light-responsive category contains the maximum number of cis-elements followed by phytohormone-responsive and stress-responsive, while the lowest number of cis-elements was found in the plant growth and development-responsive category (Figure 2B). In addition, the PeCER genes were classified based on the number of genes involved in each category (Figure 2Ba). It was found that all the 34 PeCER genes were involved in phytohormones and light-responsive, 33 PeCER genes were involved in stress-responsive, while only 24 PeCER genes were involved in plant growth and development responsiveness (Figure 2Ba). These results proposed that transcript profiling of PeCER may vary among hormones and stress-responsive. The plant growth and development category was further classified into four subcategories (meristem, metabolism, seed related, and circadian). Meristem-related cis-elements include CAT-box and GCN4-motifs, which belong to meristem expression.
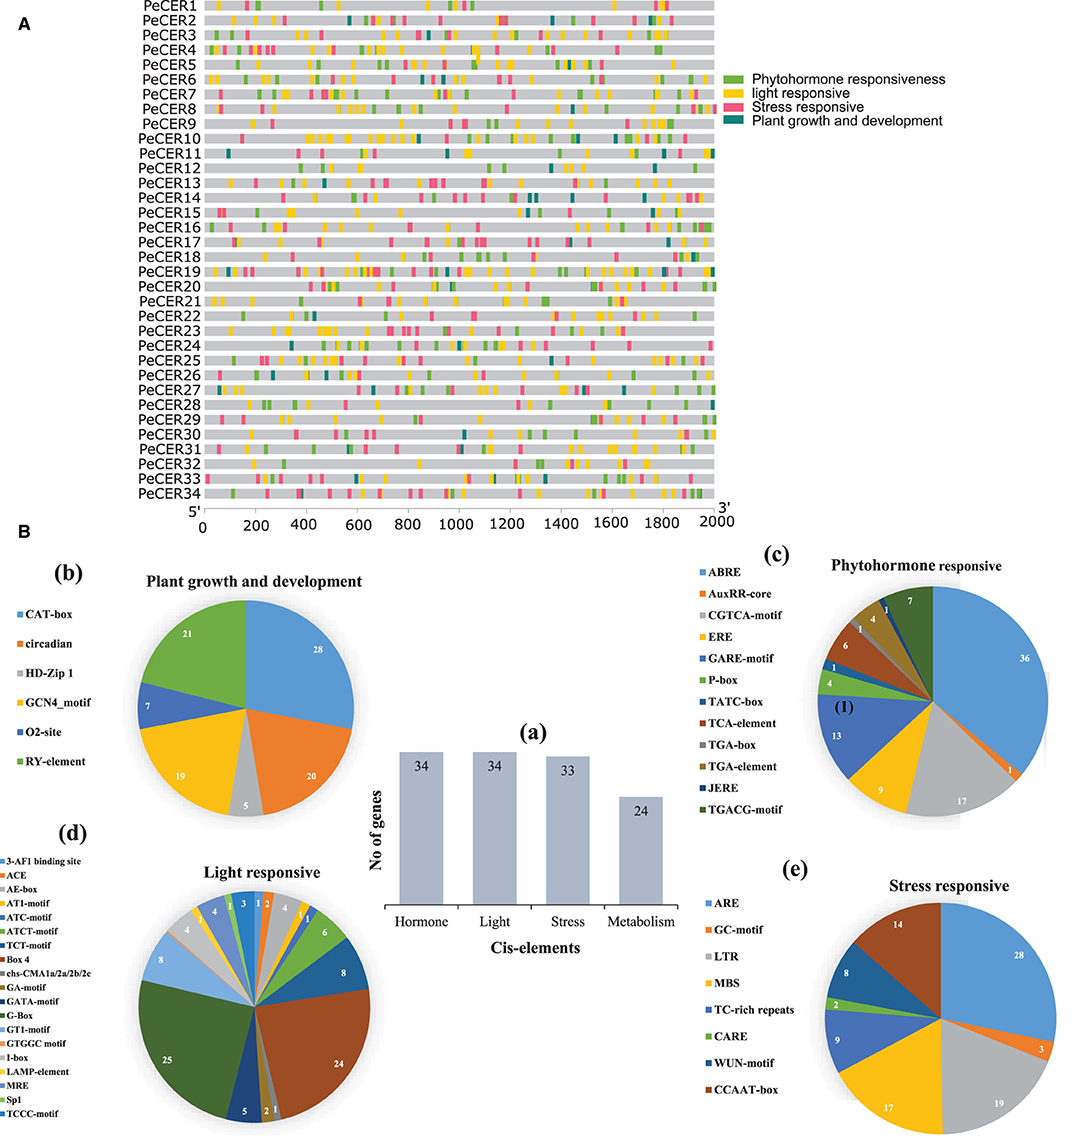
Figure 2. (A) Cis-regulatory element analysis on PeCER genes. (B) (a) Sum number of cis-elements and PeCER genes involved in four categories. Percentage (%) ratio of numerous cis-elements from each category is presented in pie charts; (b) plant growth and development-responsive, (c) phytohormone-responsive, (d) light-responsive, (e) stress-responsive. Different colors indicate different cis-acting elements and their ratio present in PeCER genes.
The metabolism-related cis-element includes O2-sit and seed, and the circadian-related cis-element includes RY-element. In the plant growth and development category, the highest number of cis-elements (28%) consisted of CAT-box, followed by circadian (20%), and the lowest (5%) consisted of HDzip1 (Figure 2Bb). The phytohormone-responsive category comprised of ABRE (abscisic acid-responsive), AuxRR-core (auxin-responsive), ERE (ethylene-responsive), GARE-motif, P-box, TATC-box (gibberellin responsive); TCA-element (salicylic acid-responsive); TGA-element and TGACG-motif (methyl jasmonate responsive) cis-elements. The highest number of cis-elements from the phytohormone category comprised of ABRE at 36% followed by CGTCA-motif at 17%, whereas the AuxRR-core, TATC box, and TGA box were the lowest, containing only 1% cis-elements (Figure 2Bc). The light-responsive category contained the 3-AF1 binding site, ACE, AE-box, AT1-motif, ATC-motif, ATCT-motif, TCT-motif, Box 4, chs-CMA1a/2a/2b/2c, GA-motif, GATA-motif, G-Box, GT1-motif, I-box, LAMP-element, MRE, Sp1, and TCCC-motif cis-elements. The highest light-responsive category comprised of only G-Box (25%) followed by Box-4 (24%), while AT1-motif and ATC-motif were the lowest and comprised of only 1% (Figure 2Bd). The stress-responsive category contained ARE, GC-motif, LTR, MBS, TC-rich repeats, CARE, WUN-motif, and CCAAT-box cis-elements; among which, ARE comprised the highest number (28%) followed by LTR and MBS (19 and 17%), while CARE contained only 2% (Figure 2Be). The detailed information about cis-regulatory elements in the passion fruit CER genes has been provided in Supplementary Table S5.
The expansion and evolutionary mechanism of the PeCER gene family in the passion fruit genome and genomes of other species were further investigated by synteny analysis. The tandem and segmental duplication analysis of the PeCER genes was performed to elucidate the duplication of the PeCER genes. There were eight duplicated PeCER gene pairs, among which six gene pairs were segmentally duplicated on chromosomes 1, 2, 4, 6, and 8, whereas two PeCER gene pairs were tandem-duplicated on chromosomes 1 and 2. PeCER13 and PeCER25 were duplicated twice (Figure 3A, Supplementary Table S6). These findings suggested that gene duplication has played an important role in PeCER gene family development in the passion fruit genome.
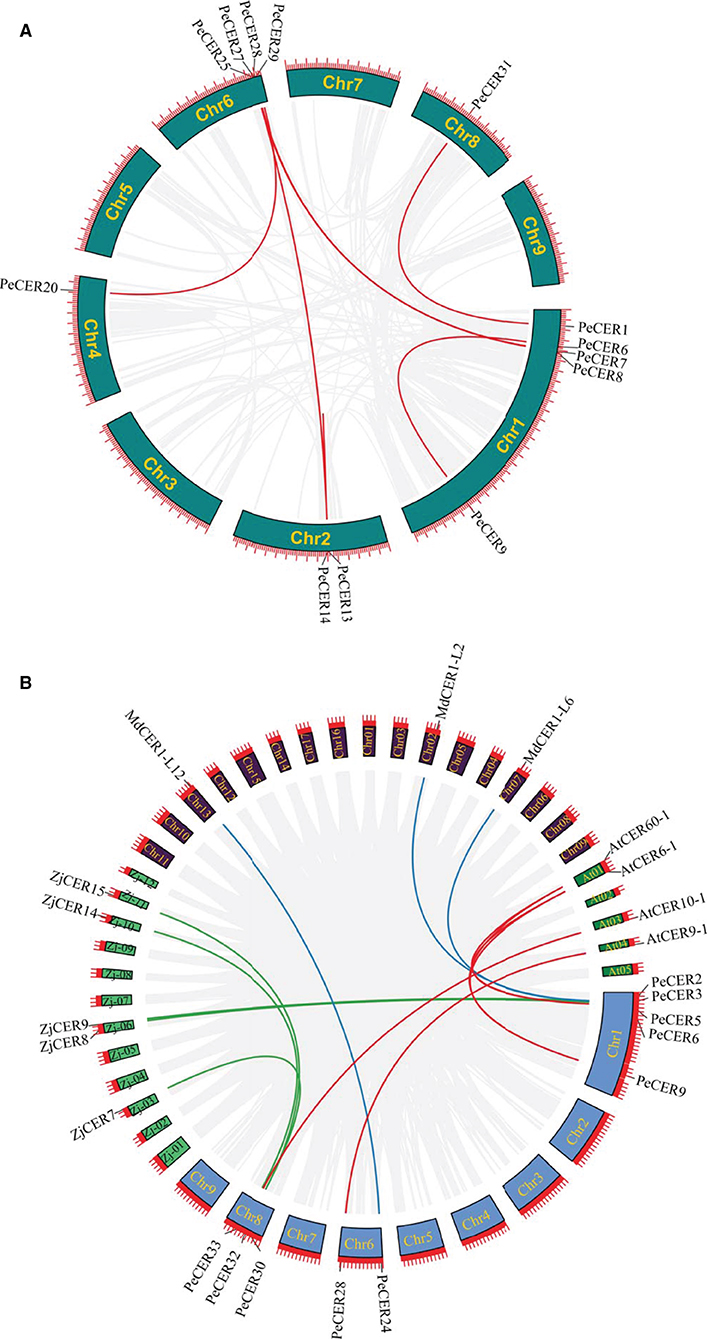
Figure 3. Circos illustrations of PeCER gene duplication. (A) Gene duplication of CER genes in P. edulis. The background gray lines show all the syntenic blocks in the passion fruit genome, and the red lines show segmental or tandem duplication link regions among the PeCER genes. The approximate location of PeCER genes were labeled with a short gray line outside with gene names. (B) Orthologous of P. edulis CER genes with A. thaliana, M. domestica, and Z. jujuba CER genes. Chromosomes of P. edulis are represented with Chr1-Chr9, A. thaliana with At01-At05, M. domestica with Chr01-Chr17, and Z. jujuba with Zj-01 to Zj-12. The background gray lines show all the syntenic blocks in different genomes, blue lines represent the syntenic relationship among P. edulis and M. domestica CER genes, red lines represent the syntenic relationship among P. edulis and A. thaliana genes, and green lines represent the syntenic relationship among P. edulis and Z. jujuba genes.
To determine the selection pressure and evolution rate among duplicated genes, Ka/Ks ratio is an indicator. Generally, if Ka/Ks ratio is more than 1, it indicates that genes have undergone a positive selection, a ratio <1 indicates purifying selection, while a ratio equal to 1 indicates neutral selection. The details about Ka and Ks values and Ka/Ks ratios of duplicated PeCER gene pairs are shown in Supplementary Table S6. Overall, all the segmental and tandem duplicated PeCER gene pairs exhibited a Ka/Ks ratio <1, indicating that all the duplicated PeCER genes underwent purifying selection (Supplementary Table S6). Furthermore, the time of divergence among the duplicated genes was measured based on a substitution rate of 6.38 × 10⁻⁹ substitutions per site per year (Ma et al., 2021). The results showed that the rate of divergence process among the tandem and segmental PeCER genes was estimated to be 1.12 to 20.78 mya (Supplementary Table S6). It can be concluded that the evolutionary mechanism of PeCER genes shows maintenance in the process of passion fruit domestication.
In addition, a comprehensive synteny analysis of P. edulis CER genes with CER genes of other species, including A. thaliana, M. domestica, and Z. jujuba, was performed by alignment and chromosomal localization (Supplementary Table S7). The results showed that out of the 34 PeCER genes, 10 PeCER were paired with 12 CER genes from the above-mentioned species, and that the 10 PeCER genes were located on passion fruit chromosomes 1, 6, and 8 (Figure 3B, Supplementary Table S8). The presence of six PeCER gene pairs with AtCER (PeCER9:AtCER60-1, PeCER9:AtCER6-1, PeCER6:AtCER6-1, PeCER6:AtCER60-1, and PeCER32:AtCER10-1) (Figure 3B, Supplementary Table S8), three PeCER gene pairs with MdCER (PeCER3:MdCER1-L2, PeCER2:MdCER1-L6, and PeCER24:MdCER1-L12), and five PeCER gene pairs with ZdCER (PeCER3:ZjCER9, PeCER5:ZjCER8, PeCER30:ZjCER7, PeCER33:ZjCER14, and PeCER30:ZjCER15) was detected and visualized with Circos (Figure 3B, Supplementary Table S8). Overall, the PeCER and AtCER genes showed a greater degree of synteny than the other species, indicating that they might belong to the same ancestors with the same functions, which required further study.
Furthermore, a multicollinearity analysis of P. edulis CER genes with genomes of A. thaliana, M. domestica, H. annus, and Z. jujuba species was performed to reveal the robust orthologs in the genomes of these species. Multiple collinear gene pairs between the aforementioned species were found to be inferred and have undergone lineage-specific amplification of genetic copies (Figure 4). The multicollinearity results showed that the highest collinearity was found between P. edulis with M. domestica (43 collinear genes) followed by P. edulis with H. annus and A. thaliana (26 collinear genes), whereas the least collinearity was found between P. edulis with Z. jujuba (16 collinear genes) (Figure 4, Supplementary Table S9). P. edulis chromosome 1 shared the maximum collinear genes among M. domestica (20 genes), H. annus (14 genes), A. thaliana (13 genes), and Z. jujuba (7 genes) (Figure 4, Supplementary Table S9). These findings suggest that the CER genes were conserved and might have the same ancestors besides the duplication or loss of CER genes.
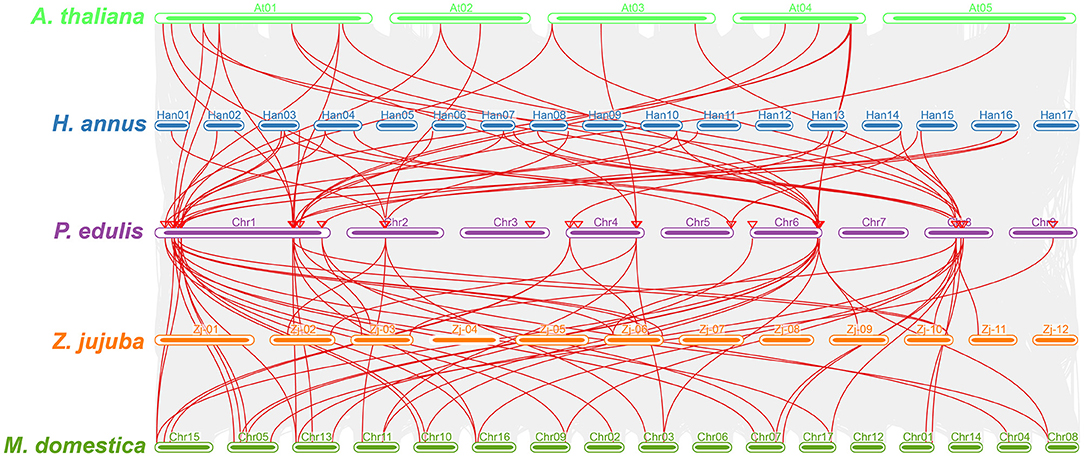
Figure 4. Multicollinearity analysis of the P. edulis CER genes with genomes of the A. thaliana, M. domestica, H. annus, and Z. jujuba species. The red lines represent the CER syntenic genes among P. edulis, A. thaliana, M. domestica, H. annus, and Z. jujube genomes, and the gray lines in the background represent all orthologous genes from the genomes of P. edulis and other species.
The PeCER protein-protein interaction network was constructed based on Arabidopsis orthologous proteins. PeCER proteins with highest homologous similarity to Arabidopsis proteins were selected as STRING proteins. All the 34 PeCER proteins have an association with known Arabidopsis proteins (Figure 5A, Supplementary Table S10). PeCER proteins belonging to different groups may have diverse functions. PeCER2, PeCER3, PeCER13, PeCER14, PeCER15, PeCER25, and PeCER26 were homologous with AtCER1; PeCER21 and PeCER28 with AtCER9; PeCER32 with AtCER10; PeCER 23 with AtLACS1; PeCER22 and PeCER24 with AtCER3, and they all had a strong interaction among them. PeCER1 and PeCER31 were homologous with AtSTE1 and interacted with AtDWF1, AtDWF5, AtSMO2-1, AtSMO2-2, AtSMO2-3, and AtFAH1/T29F13.2 (Figure 5A). PeCER2, PeCER3, PeCER14, PeCER15, PeCER25, and PeCER26 were homologous with AtCER1; PeCER4 and PeCER8 were homologous with AtKCS4; PeCER6 and PeCER9 with AtKCS6; PeCER18 with AtKCS11; PeCER10 with AtKCS20, and they had a strong interaction between them (Figure 5A). PeCER5 and PeCER33 showed homology with AtSBH1 and interacted with AtCER10, AtDWF5 and AtFAH1/T29F13.2. PeCER proteins and that showed a strong interaction with known Arabidopsis proteins and might have similar functions as in Arabidopsis. The higher the interaction coefficient, the thicker the line between proteins and vice versa (Figure 5A, Supplementary Table S10).
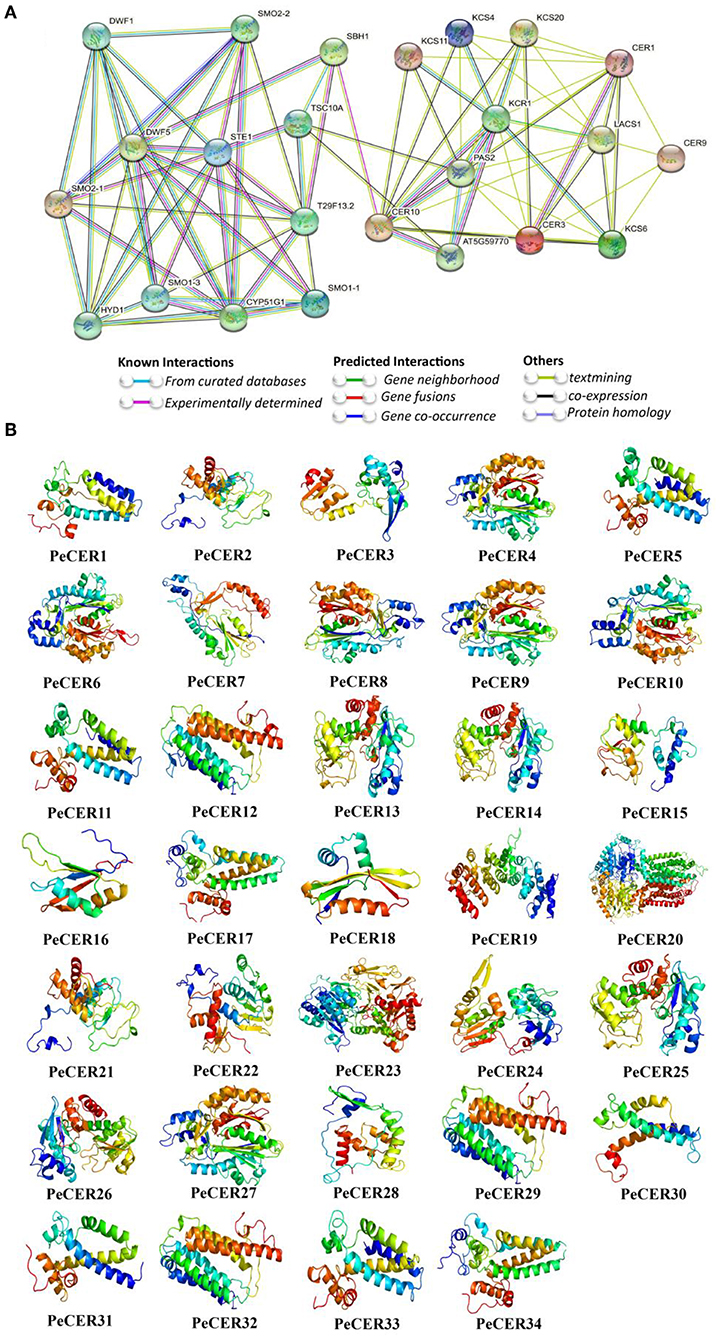
Figure 5. Protein-protein interaction of PeCER proteins based on known Arabidopsis protein orthologous. (A) The network was constructed using the online STRING software. The proteins were displayed at network nodes with 3D structure of the proteins in nodes, and the line colors indicate different data sources. (B) Predicted 3D models of PeCER proteins. 3D models were constructed using the online Phyre2 server with default mode.
A protein secondary structure analysis was performed, which generally consists of alpha helices, extended strands, beta turns, and random coils (Supplementary Table S11). Among all the 34 PeCER proteins, alpha helix accounted for the largest percentage of secondary structures ranging from 31.96 to 57.2% (PeCER13, PeCER19) followed by random coils from 25.19 to 40.95% (PeCER19, PeCER24), and extended strands from 11.43 to 25.68% (PeCER33 and PeCER15), whereas beta turns ranged from 1.95 to 9.29% (PeCER28 and PeCER15) (Supplementary Table S11). Additionally, the 3D structures and models of all the 34 PeCER proteins were predicted by the Phyre2 online server with default mode (Figure 5B).
Templates were used for the predicted PeCER protein models such as template c4zr0A was used in the PeCER1, PeCER5, PeCER11, PeCER17, PeCER30, PeCER31 and PeCER33 protein models; template c6jzuA was used in the PeCER2, PeCER3, PeCER13, PeCER14, PeCER15, PeCER21, PeCER22, PeCER24, PeCER25, and PeCER26 protein models; template c4jatB was used in the PeCER6 and PeCER9 protein models; template c4zr0A in the PeCER34 model; template c5mstA in the PeCER23 model; template c7c83A in the PeCER12 and PeCER29 models; template d2cq0a1 in the PeCER16 model; template c1u0mA in the PeCER10 model; templatec6hb2B in the PeCER19 model; template c2d8sA in the PeCER7 and PeCER28 models; template c3wy0A in the PeCER8 model; template c4jatB in the PeCER4 and PeCER27 models; template c7p06A in the PeCER20 model; template c7c83A in the PeCER32 model; template c6z00B in the PeCER18 model. All the PeCER proteins had flexible structures due to the existence of coils (Figure 5B). Based on our results, it was proposed that CER genes from individual genomes might be ancestrally similar to each other or initial differences may have been stabilized during long-term domestication, leading to changes in protein structure and function.
During the past few decades, various investigations have reported that the miRNAs induced the regulation of stresses, plant development, and signal transduction. Therefore, to better understand the regulatory mechanism of miRNAs involved in the regulation of PeCER genes, 12 putative miRNAs targeting 16 PeCERs genes were identified, as shown in the network illustration (Figure 6A) and the schematic diagrams indicating the PeCER genes targeted by miRNAs (Figure 6B). The detailed information on the putative miRNA targeting sites and the PeCER genes has been provided in Supplementary Table S12. The results showed that two members of the ped-miR171 family targeted two genes including PeCER4 and PeCER7; one member of the ped-miR157 family targeted one gene, PeCER6; one member of the ped-miR164 family targeted one gene, PeCER6; two members of the ped-miR319 family targeted one gene, PeCER6; one member of the ped-miR395 family targeted three gene including, PeCER7, PeCER13, and PeCER14; one member of the ped-miR394 family targeted three gene including, PeCER7, PeCER12, and PeCER28; two members of the ped-miR399 family targeted three gene including, PeCER8, PeCER9, and PeCER27; two members of the ped-miR166 family targeted three gene including, PeCER13, PeCER14, PeCER15, and PeCER30; one member of the ped-miR828 family targeted two gene including, PeCER20 and PeCER29; one member of the ped-miR162 family targeted only PeCER24 gene (Figures 6A,B, Supplementary Table S12).
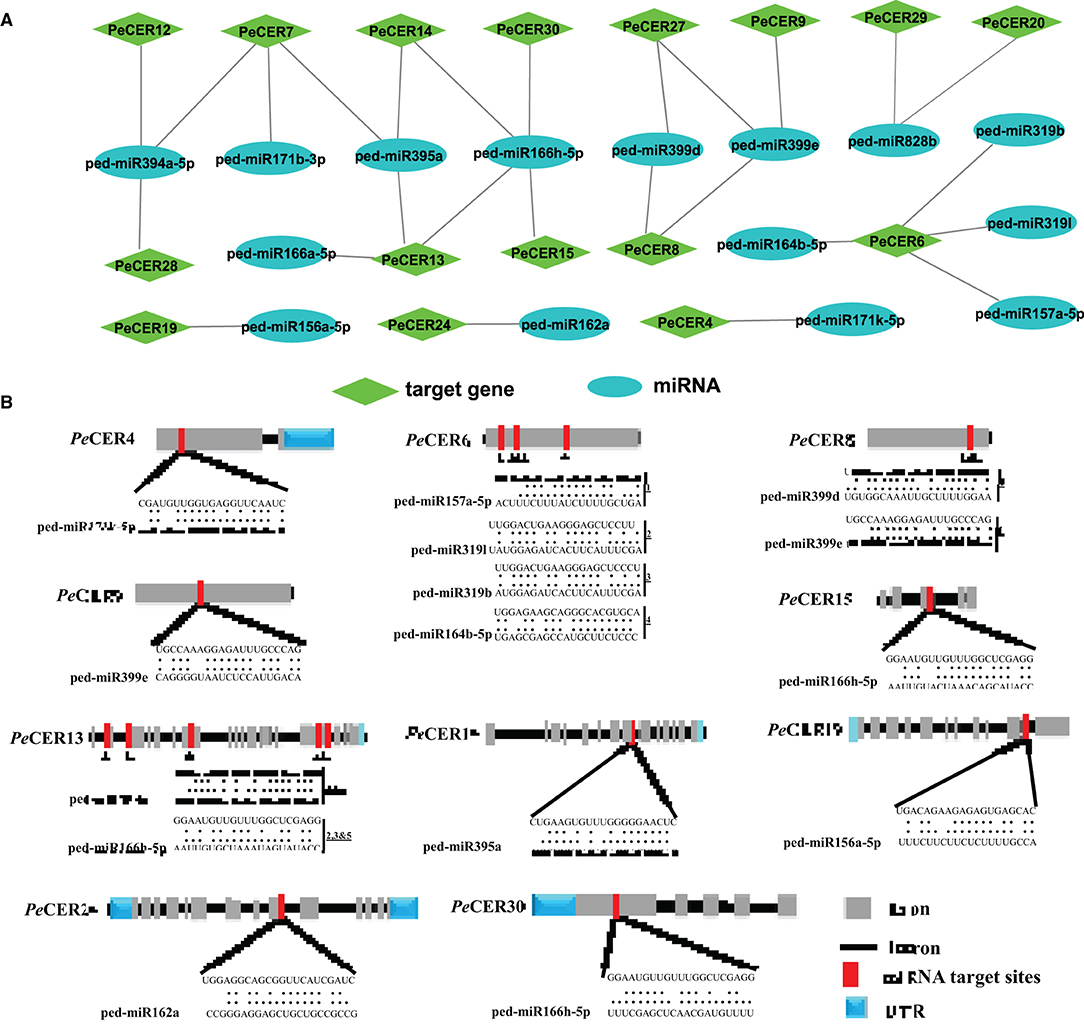
Figure 6. Predicted miRNA targeting PeCERs genes. (A) Network illustration of predicted miRNA targeting PeCER genes. Green hexagon colors represent PeCER genes, and bluish ellipse shapes represent miRNAs. (B) The schematic diagram indicates the PeCER genes targeted by miRNAs.
Overall, the prediction results show that the PeCER7 gene was targeted by three miRNA families including, ped-miR395a, ped-miR394a-5p, and ped-miR171b-3p; similarly, the PeCER13 gene was also targeted by three miRNA families including, ped-miR166h-5p, ped-miR395a, and ped-miR166a-5, whereas the PeCER6 gene was targeted by four miRNA families including, ped-miR157a-5p, ped-miR164b-5p, ped-miR319b, and ped-miR319l (Figures 6A,B, Supplementary Table S12). The expression levels of these predicted miRNAs and their target PeCER genes require further studies to better understand their functions in passion fruit.
The potential TF regulatory network of the PeCER genes was identified by extracting 1,000-bp upstream sequences from all the 34 PeCER genes, and was analyzed using the PTRM online database. The results showed that there were 2402 TFs from numerous TF families including ERF, TCP, MYB, NACWRKY, BBR-BPC and bHLH, which were involved in the regulation of the 34 PeCER genes (Supplementary Table S13). Among all the predicted TFs, the most abundant members belonged to the ERF family (1,122), followed by the BBR-BPC (221), TCP (121), MYB (117), and NAC (101) TF families (Figure 7A). The least-targeted TF family members belonged to ARR-B (2), EIL (2), VOZ (2), S1Fa-like (1), and NF-YB (1) (Figure 7A). All the PeCER genes were targeted by numerous TFs families members such as PeCER33 that interacts with 108, PeCER14 with 83, PeCER15 with 81, and PeCER27 with 56 TF families. In addition, the PeCER33 gene was the one targeted by most TFs (762), followed by PeCER15 (267). Among the targeted TF families, the ERF family was dominated by 680 and 216 members in PeCER33 and PeCER15 genes (Figure 7B). The TF regulatory network of all the 34 PeCER genes are shown in Figure 7A, and the networks of the top five highly targeted PeCER genes are shown in Figure 7B, respectively. Fatty acids and wax biosynthesis-related TFs belonging to different TF families were also predicted in this study including ERF, AP2, bHLH, and MYB. Different TFs involved in plant growth and development including TCP, bHLH, BBR-BPC, WRKY, LBD, and AP2 were also found in the PeCER genes. In addition, phytohormone-related TFs were also identified, including ERF and ARF. Interestingly, ERF and AP2 TFs were shown to be universally distributed in most of the PeCER genes (Figure 7, Supplementary Table S13).
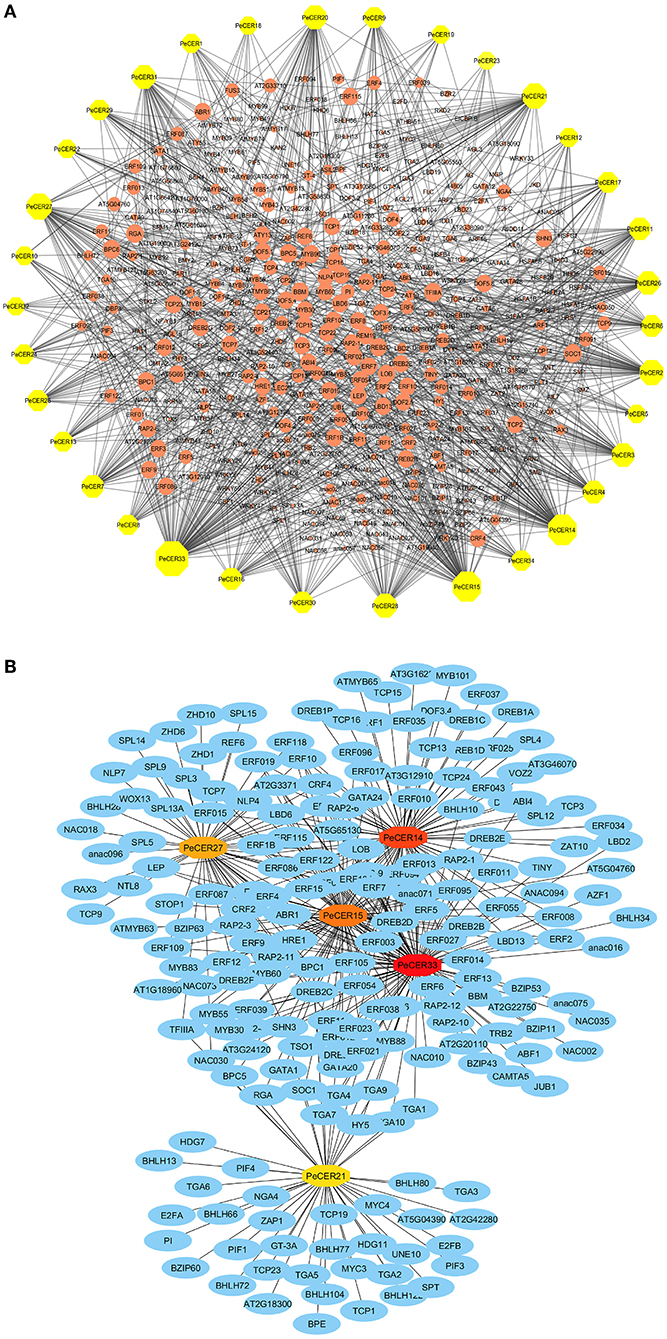
Figure 7. Putative transcription factor regulatory network analysis of the PeCER genes. (A) Orange peel circular nodes represent transcription factors; yellow octagonal nodes represent PeCER genes, and node size represents the degree of interaction between nodes based on degree value. (B) Top 5 highly enriched and targeted PeCER genes with TFs are shown, blue nodes represent the TFs, dark red to light red colors show the PeCER genes, and darker PeCER node color shows highly enriched and vice versa.
GO and KEGG function annotation and enrichment analyses of passion fruit PeCER genes were performed. The GO function annotation and enrichment analysis was classified into the molecular function (MF), cellular component (CC), and biological process (BP) classes. The detailed annotation results and highly enriched terms of MF, CC, and BP have been provided in Supplementary Tables S14A,B. The results showed that the highest 200 terms were found in the GO-BP class, followed by 90 terms in GO-MF and at least 29 terms in the GO-CC class (Supplementary Table S14A). In terms of high enrichment analysis, there were 27 highly enriched terms in the GO-BP class inducing metabolic process (GO:0008152), lipid metabolic process (GO:0006629), organic substance biosynthetic process (GO:1901576), fatty acid derivative biosynthetic process (GO:1901570), wax metabolic process (GO:0010166), wax biosynthetic process (GO:0010025), cuticle development (GO:0042335), response to cold (GO:0009409), response to temperature stimulus (GO:0009266), and response to light stimulus (GO:0009416). Six terms were highly enriched in the GO-MF class including catalytic activity (GO:0003824), oxidoreductase activity (GO:0016491), fatty acid elongase activity (GO:0009922), fatty acid synthase activity (GO:0004312), and acyltransferase activity (GO:0016746-47). The GO-CC enrichment results exhibited 20 highly enriched terms including endoplasmic reticulum (GO:0005783), endomembrane system (GO:0012505), obsolete cytoplasmic part (GO:0044444), membrane-bounded organelle (GO:0043227), and organelle membrane (GO:0031090) (Figure 8A, Supplementary Table S14B).
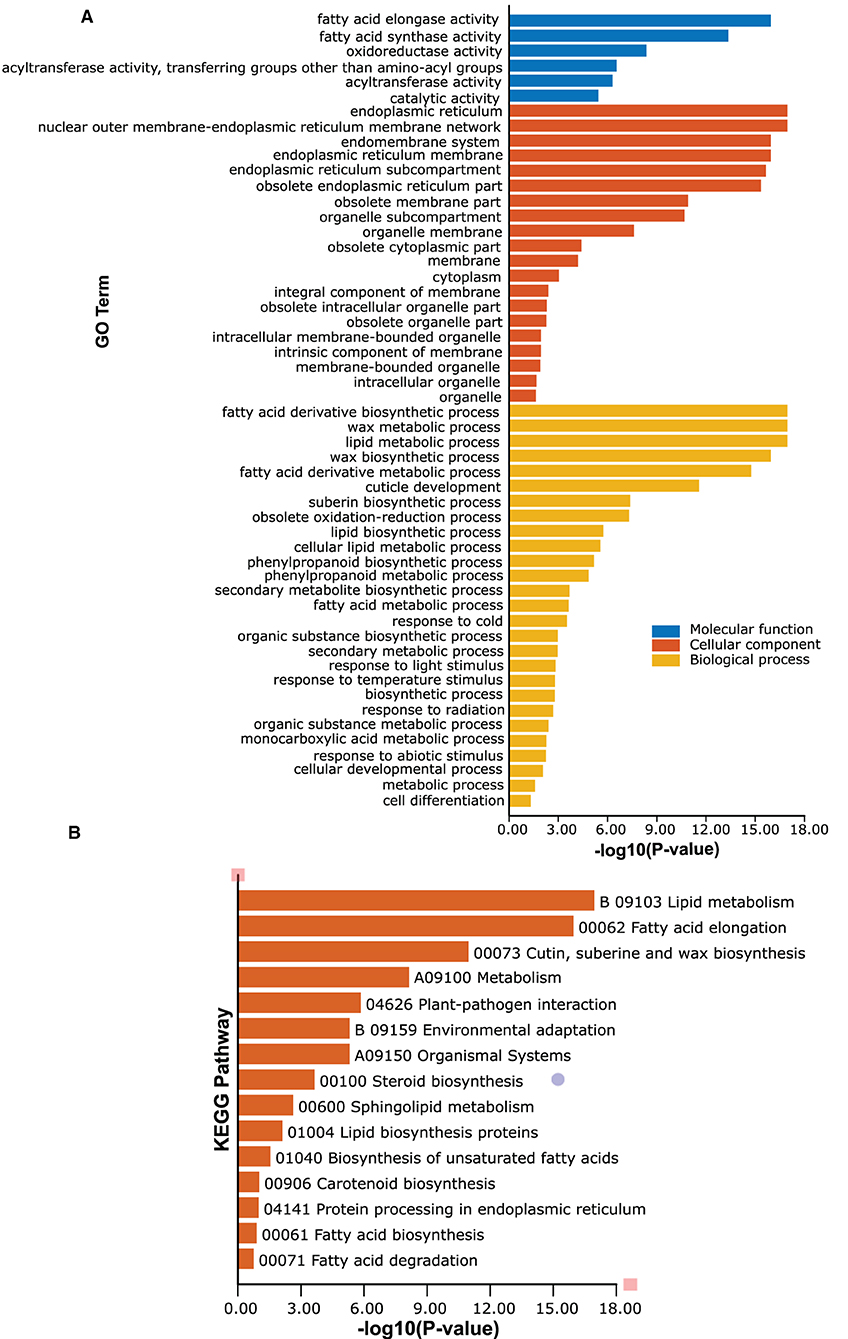
Figure 8. Gene Ontology (GO) and Kyoto Encyclopedia of Genes and Genomes (KEGG) enrichment analyses of PeCERs genes. (A) Highly enriched GO terms in PeCER genes. (B) Highly enriched KEGG pathways in PeCER genes. Further detailed annotation results and numerous significantly enriched terms of MF, CC, BP, and KEGG pathways can be found in Supplementary Tables S14A, S15.
The KEGG pathway analysis revealed that there were 31 KEGG pathways predicted in the 34 PeCER genes; among them, the highly enriched pathways are shown in Figure 8B including metabolism (A09100), lipid metabolism (B09103), fatty acid elongation (00062), cutin, suberine, and wax biosynthesis (00073), plant-pathogen interaction (04626), environmental adaptation (B09159), and organismal systems (A09150) (Figure 8B, Supplementary Table S15). Overall, the GO and KEGG enrichment analyses show that the PeCER genes might play an important role in several biological, molecular, and cellular processes such as plant metabolism, fatty acid and wax biosynthesis as well as in response to biotic and abiotic stress.
Most of the PeCER proteins were hypothetically predicted to be localized to the plasma membrane (Table 1). The validation of predicted subcellular localization was performed by selecting a PeCER32 protein, which were strongly evolved in various predicted functions including metabolism, organ-specific, organ developmental, and different stress responses. A transient expression assay was carried out by transformation with the CaMV35S-PeCER32-GFP fusion construct (Figure 9Aa) and empty vector CaMV35S-GFP (Figure 9Ab) into onion epidermal cells with the agroinfiltration method. The results showed that GFP signals were highly expressed in the plasma membrane (Figures 9Bd–f). The empty vector CaMV35S-GFP was used as control, and the results showed a dispersed pattern of GFPs throughout the whole cell (Figures 9Ba–c). The subcellular localization results of PeCER32 protein were consistent with the most preferential prediction.
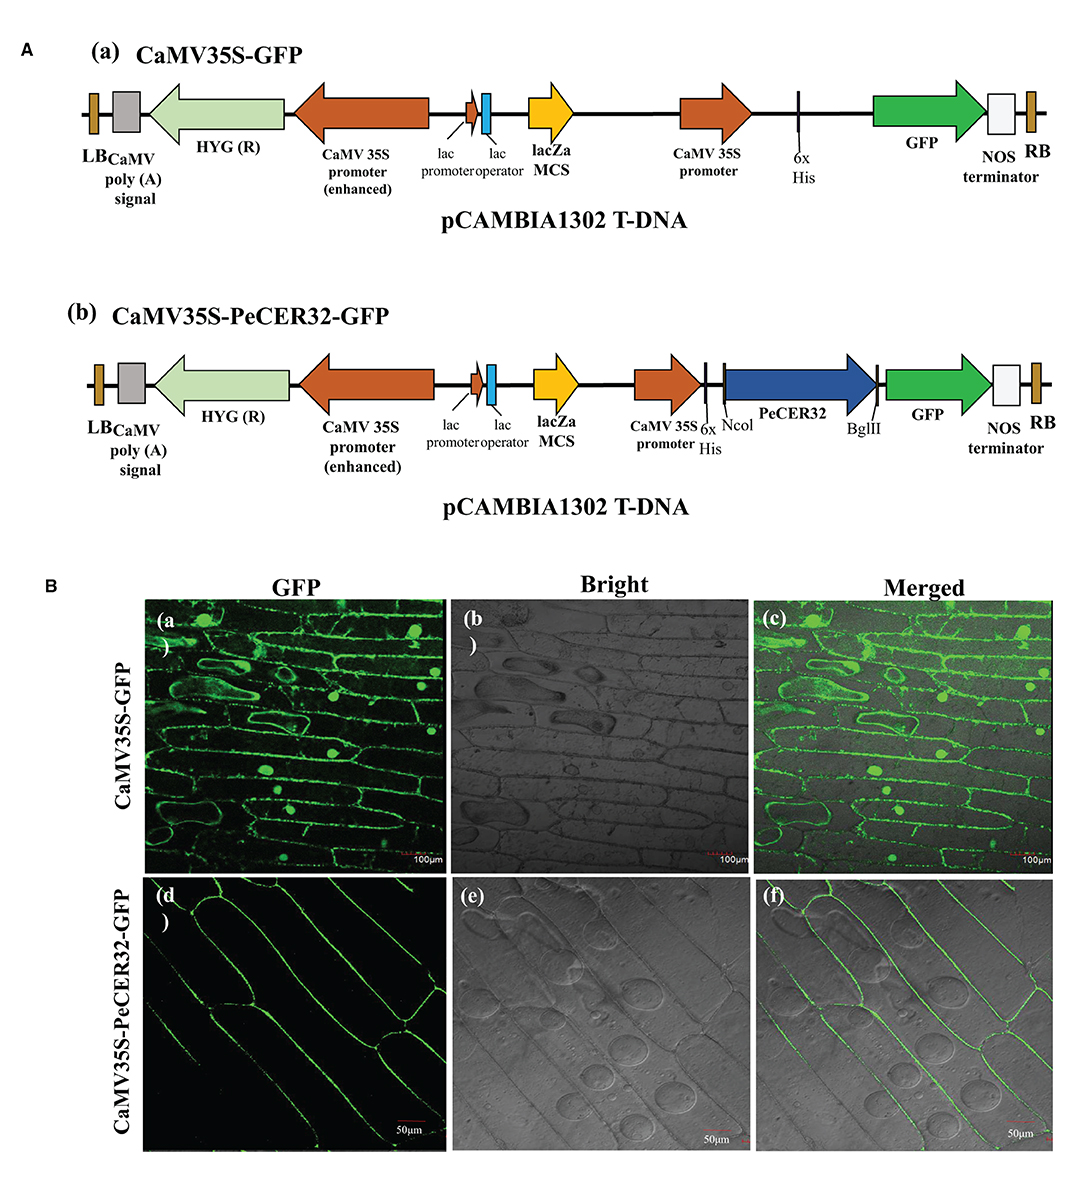
Figure 9. Subcellular localization of GFP-fused PeCER32 protein based on transient expression assays in onion epidermal cells. (A) (a) Structure of CaMV35S-GFP as empty vector. (b) Structure of CaMV35S-PeCER32-GFP as construct. (B) (a–c) Onion cells transformed with CaMV35S-GFP as control (scale bar = 100 μm). (d–f) Onion cells transformed with CaMV35S-PeCER32-GFP (scale bar = 50 μm). (a,d) GFP signals visualized under dark field. (b,e) Onion epidermal cells under bright light. (c,f) represent merging of (a,b,d,e).
The expression profiles of the 34 PeCER genes in pulp tissues of yellow and purple passion fruit cultivars were further evaluated based on FPKM expression levels in four fruit development stages. The FPKM expression values have been provided in Supplementary Table S16. The FPKM values were transformed to log2FC, and a heatmap was generated with the TBtools software. The expression profiles of PeCER genes varied between both cultivars and developmental stages. Taken together, the results showed that 32 (94%) of the 34 (100%) PeCER genes were expressed during fruit development and ripening in both cultivars (Figure 10, Supplementary Table S16).
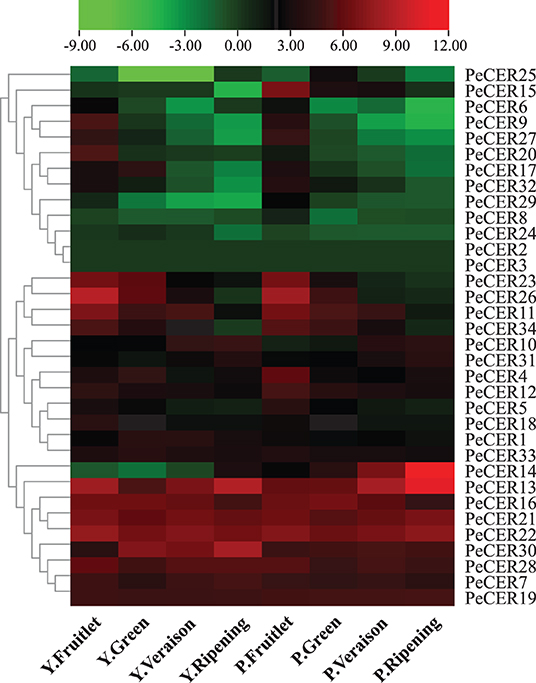
Figure 10. Expression profiles of PeCER genes in pulp tissue of yellow and purple passion fruit cultivars in four fruit development stages. Y and L represent the yellow (Y) and purple (P) passion fruit cultivars. FPKM values were transformed by log2, and heatmap was constructed with the TBTools software. The red color shows the highest and the blue color shows the lowest expression levels in expression bar.
PeCER2 and PeCER3 were not expressed in all the tissues, indicating that they might not be involved in fruit development. In the yellow passion fruit cultivar, 32 (94%), 31 (91%), 31 (91%), and 30 (88%) PeCER genes were expressed in the fruitlet, green, veraison, and ripening stages. Among the expressed genes, 17 (53%), 16 (51%), 11 (35%), and 10 (33%) PeCER genes were highly expressed (FPKM > 10) in the fruit development and ripening stages. In addition, 9 genes (PeCER7, PeCER13, PeCER16, PeCER19, PeCER21, PeCER22, PeCER28, PeCER29, and PeCER30) showed an increased expression pattern (FPKM = 13.97 to 440.13) throughout the fruit development and ripening stages. However, another 9 genes (PeCER9, PeCER11, PeCER12, PeCER18, PeCER20, PeCER23, PeCER26, PeCER27, and PeCER34) showed decreased expression level (FPKM = 489.71 to 0.07) from fruit development to ripening stages (Figure 10, Supplementary Table S16).
In the purple passion fruit cultivar, overall 32 (94%) PeCER genes were expressed in the fruitlet, green, veraison, and ripening stages. Among the 32 expressed genes, 19 (59%), 13 (41%), 11 (34%), and 11 (34%) PeCER genes exhibited high expression levels (FPKM > 10) in all tested stages,. Furthermore, 8 genes (PeCER7, PeCER13, PeCER16, PeCER19, PeCER21, PeCER22, PeCER28, and PeCER30) showed constantly high expressions (FPKM = 14.59 to 1575.51) through out all the tested stages, whereas 10 genes (PeCER4, PeCER5, PeCER11, PeCER12, PeCER15, PeCER23, PeCER26, PeCER27, PeCER32, and PeCER34) exhibited reduced expression levels (FPKM = 271.84 to 0.11) during fruit development to ripening stages. Comparing the PeCER expression profiles of both cultivars in fruit development and ripening stages, the results showed that 7 genes (PeCER7, PeCER13, PeCER16, PeCER21, PeCER22, PeCER28, and PeCER30) were found to have similar expression between both cultivars in all the tested stages (FPKM > 10). Overall, the purple cultivar had higher expression (FPKM = 3123.21, PeCER14) than the yellow (FPKM = 489.7, PeCER26). The highest expression level in the purple cultivar was observed during the stage of ripening (FPKM = 3123.22), followed by the veraison (FPKM = 321.01) > fruitlet > (FPKM = 99.3) and green (FPKM = 94.78) stages. In the yellow cultivar, the highest expression patterns were observed in the stage of fruitlet (FPKM = 489.70), followed by ripening (FPKM = 440.13) > veraison (FPKM = 127.38) and green stage (FPKM = 89.90) (Figure 10, Supplementary Table S16). These FPKM expression-based findings suggest that the PeCER genes may have significant roles in fruit development and ripening in the yellow and purple passion fruit cultivars, and further research is still needed.
The PeCER gene expression patterns in roots of the purple cultivar, and leaves and peel tissues of the yellow and purple cultivars were evaluated based on FPKM values. The FPKM expression values have been provided in Supplementary Table S17. The FPKM values were transformed to log2FC, and a heatmap was constructed with TBtools (Figure 11, Supplementary Table S17). Among all the 34 PeCER genes, 26 (76.47%) genes were expressed in purple L and D roots; 28 (82%) genes were expressed in yellow and purple leaves under NT and CS conditions; whereas, 29 (85%) genes were expressed in yellow and purple peel tissues, respectively. Among the expressed PeCER genes in the L and D roots, 12 (46%) and 11 (42%) genes were highly expressed (FPKM > 10). Comparing the expression levels of PeCER genes in L and D roots, the expression levels of root genes in L conditions (FPKM = 120.04, PeCER16) had the higher expression than those in D conditions (FPKM = 119.09, PeCER16). Among the expressed PeCER genes in purple and yellow peels, 11 (39%) and 16 (55%) PeCER genes showed highest expressions (FPKM > 10) in the yellow and purple peels. The purple peels showed highest expression level in PeCER22 (FPKM = 144.42) compared with yellow PeCER30 (FPKM = 58) (Figure 11, Supplementary Table S17).
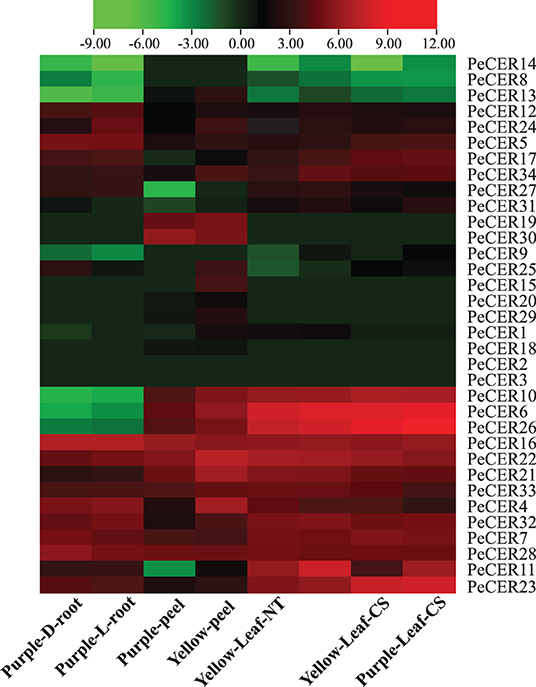
Figure 11. Expression profiles of PeCER genes in roots, peels, and leaves of yellow and purple passion fruit cultivars under different conditions. L and D represent the samples from limestone (L) and sandy dolomite (D) rocky desertification areas. NT and CS indicate the normal temperature (NT) and chilling stress (CS) conditions. FPKM values were transformed by log2, and heatmap was constructed with the TBTools software. The red color shows the highest and the blue color shows the lowest expression levels in expression bar.
The expression pattern in leaf tissues of the two cultivars under CS and NT conditions showed that 15 (58%), 13 (50%), 15 (58%), and 16 (61%) PeCER genes were highly expressed (FPKM > 10) in purple leaf-NT, yellow leaf-NT, purple leaf-CS, and yellow leaf-CS conditions. Comparing the leaf expressions of the two cultivars under CS and NT conditions, the highest expression was found in purple leaf-CS (FPKM = 647.01, PeCER26), followed by yellow leaf-CS (FPKM = 394.1, PeCER26), purple leaf-NT (FPKM = 303.78, PeCER6), and yellow leaf-NT (FPKM = 266.04, PeCER6). Taken together, the purple cultivar showed the highest expression in all the tested tissues such as purple leaf-CS > yellow leaf-CS > purple leaf-NT > yellow leaf-NT followed by purple L-root > purple D-root, and the lowest expression was found in the yellow peel (Figure 11, Supplementary Table S17). PeCER2 and PeCER3 were not expressed in all the tested tissues, indicating that they might not be involved in fruit or plant development, whereas PeCER6 and PeCER16 showed the highest expression, indicating that these genes might have important roles for specific functions in all the tissues, but further research is needed. These genotype-based tissue expression patterns provide ideas for further studies on plant and fruit development of the PeCER gene family in passion fruit.
CER genes have been reported to play important roles in drought stress conditions; to evaluate the expression profile of the PeCER genes under drought stress conditions, seven passion fruit PeCER genes were selected based on their significantly different FPKM expressions, cis-elements, and GO terms to participate in various stress responses and other functions. A qRT-PCR expression analysis was performed on the seven selected PeCER genes (Figure 12). Overall, all the seven PeCER genes exhibited diverse expression patterns in stems, leaves, and root tissues of the yellow and purple passion fruit cultivars under drought stress conditions. The results showed that the expression levels of most of the genes were upregulated in cultivars subjected to drought stress conditions as compared to the controls (Figure 12).
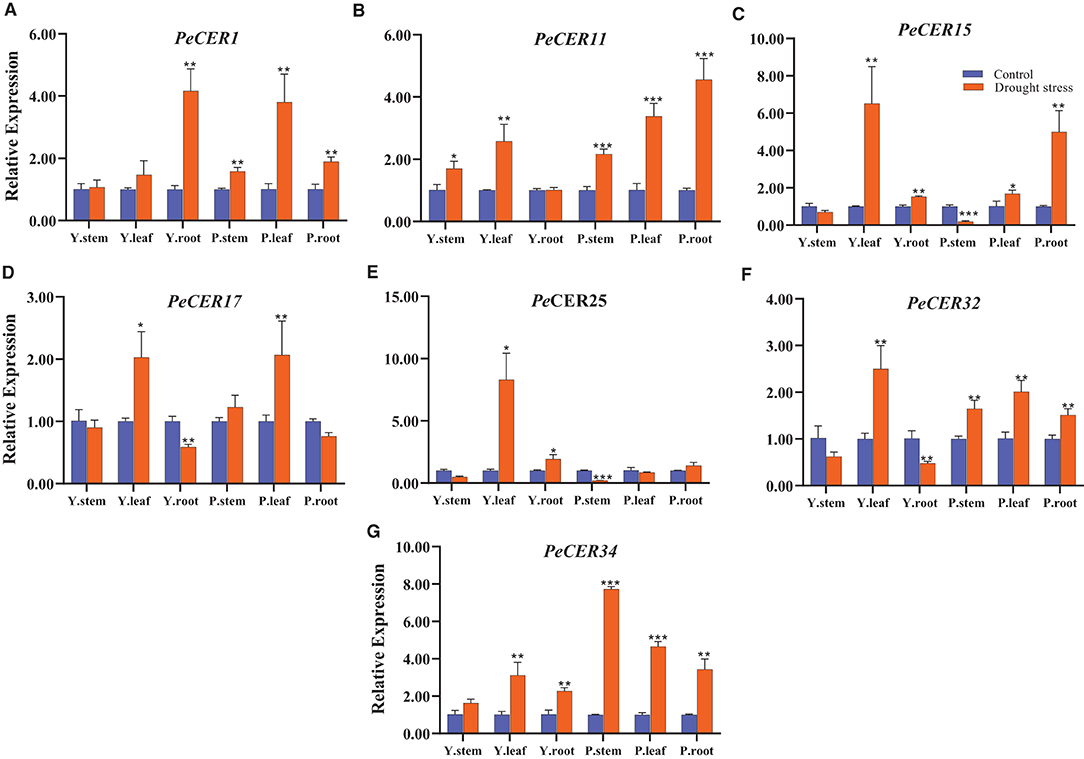
Figure 12. Relative expressions of PeCER genes (A–G) in stem, root, and leaf tissues of yellow and purple passion fruit plants under control and drought stress conditions. Relative gene expression levels were calculated using 2−ΔΔct. Plants with regular watering were taken as control. Vertical bars represent means ± SD (n = 3). *, **, and *** show significance at p ≤ 0.05, p ≤ 0.01, and p ≤ 0.001, respectively, under control and drought stress condition according to Students t-test. Y represents yellow passion fruit, and P represents purple passion fruit.
Overall all the seven PeCER genes were highly upregulated in leaf tissues compared with stem and root tissues (Figure 12). The PeCER25 gene showed the highest expression level (8.29-fold) in the leaf tissue of the yellow cultivar (Figure 12E), followed by PeCER34 (7.73-fold) in the stem tissue of the purple cultivar (Figure 12G) under drought conditions compared with the controls. PeCER15 showed higher expression levels (6.51-fold) in yellow cultivar leaves and purple cultivar root tissues (4.99-fold), while downregulated in both cultivar stem tissues under drought stress conditions compared to the control (Figure 12C). The PeCER17 gene showed consistent expression levels in yellow and purple leaves and root tissues among genotypes (Figure 12D). In the comparison of expression levels in tissues of the two genotypes, the stem tissues of the purple cultivar showed the highest expression level (1.7-fold) (Figure 12B), whereas the leaves (8.29-fold) (Figure 12E) and root (4.16-fold) (Figure 12A) tissues of the yellow cultivar showed highest expressions under drought stress conditions compared to the controls. These findings indicated the importance of PeCER genes under drought stress conditions and provide a foundation for further functional studies.
CER genes have been reported to play important roles under biotic stress conditions, and the qRT-PCR expression profiles of the seven selected passion fruit PeCER genes under F. kyushuense (biotic stress) stress conditions were investigated (Figure 13). The PeCER gene expression in peel tissues of the yellow and purple passion fruit cultivars at 9th and 12th days post-inoculation (dpi) of the pathogenic fungus F. kyushuense was analyzed by comparing with the controls (Figure 13). Overall, all the PeCER genes exhibited different expression levels under biotic stress conditions in the yellow and purple cultivars compared to the controls. PeCER32 showed the highest expression (4.03-fold) in purple 9 dpi (Figure 13F).
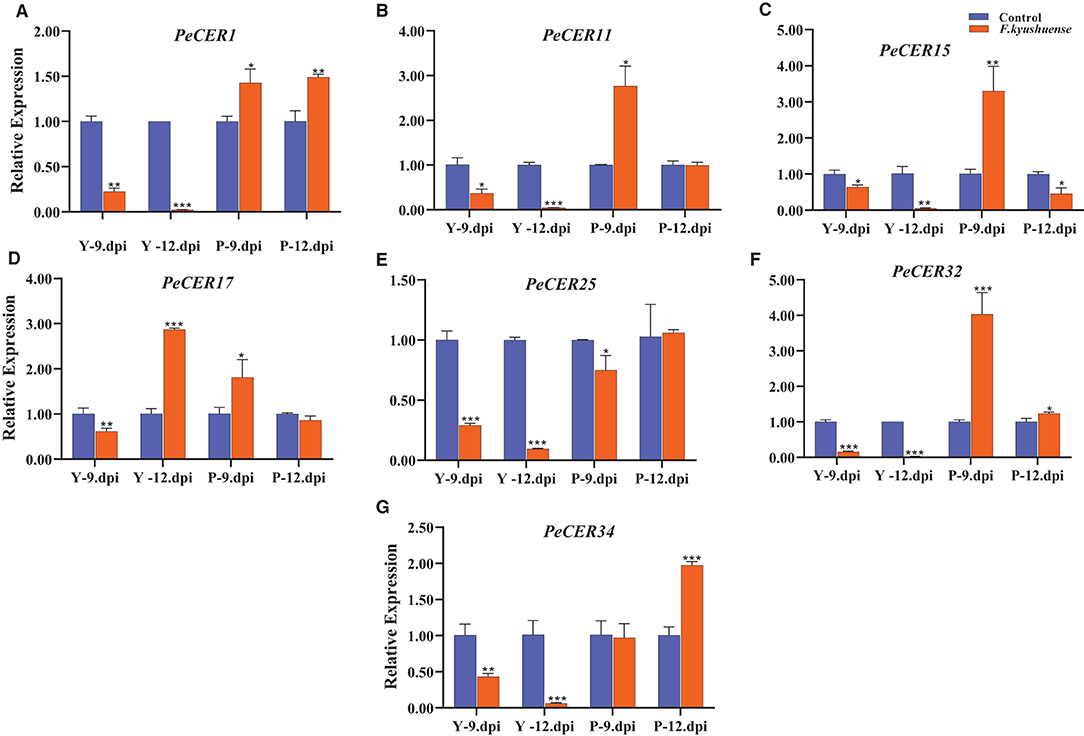
Figure 13. qRT-PCR expression profiles of PeCER genes (A–G) in peel tissues of yellow and purple passion fruit cultivars under F. kyushuense biotic stress and control conditions. Relative gene expression levels were calculated using 2−ΔΔct. Vertical bars represents means ± SD (n = 3). *, **, and *** show significance at p ≤ 0.05, p ≤ 0.01, and p ≤ 0.001, respectively, under control and biotic stress conditions according to Students t-test. Y, yellow passion fruit; P, purple passion fruit; dpi, days post inoculation.
In comparison between the two cultivars at 9th and 12th dpi, the results showed that the expression levels of all the PeCER genes were downregulated under F. kyushuense stress conditions in the yellow cultivar except for the PeCER17 gene and were upregulated in the purple cultivar compared to the controls (Figure 13). The expression of the PeCER17 gene was upregulated in yellow (2.87-fold) 12 dpi compared with the control (Figure 13D). The PeCER1, PeCER11, PeCER15, PeCER17, and PeCER32 genes were highly upregulated (1.42, 2.76, 3.3, 1.80, and 4.03 folds) in the purple cultivars at 9th dpi compared to the controls (Figure 13). However, the PeCER15 and PeCER17 genes at 12th dpi were downregulated in the purple cultivar compared with the controls (Figures 13C,D). Altogether, the results show that the PeCER genes in the passion fruit purple cultivars presented high expressions in cultivars at 9th and 12th dpi samples compared with the yellow cultivar (Figure 13). These results suggest that genes with significantly higher expression levels including PeCER1, PeCER11, PeCER15, PeCER17, and PeCER32 may have important roles, and the purple cultivar with highly upregulated expressions under biotic stress provides basic information for further studies on the genetic improvement in passion fruit (Figure 13).
According to FPKM expression values, the PeCER1, PeCER11, PeCER17, PeCER25, PeCER32, and PeCER34 genes were significantly expressed in most of the roots, leaves, pulp, and peel tissues, especially in the purple cultivar compared to yellow (Figures 12, 13). The FPKM expression data were further validated by qRT-PCR analysis using the above-mentioned PeCER genes in yellow and purple passion fruit peel tissues. After normalization with Pe60S, all the tested PeCER genes showed a trend line consistent with the FPKM expression values (Figure 14). These results revealed that FPKM expression values provided an appropriate expression result for all the tested tissues between both passion fruit cultivars.
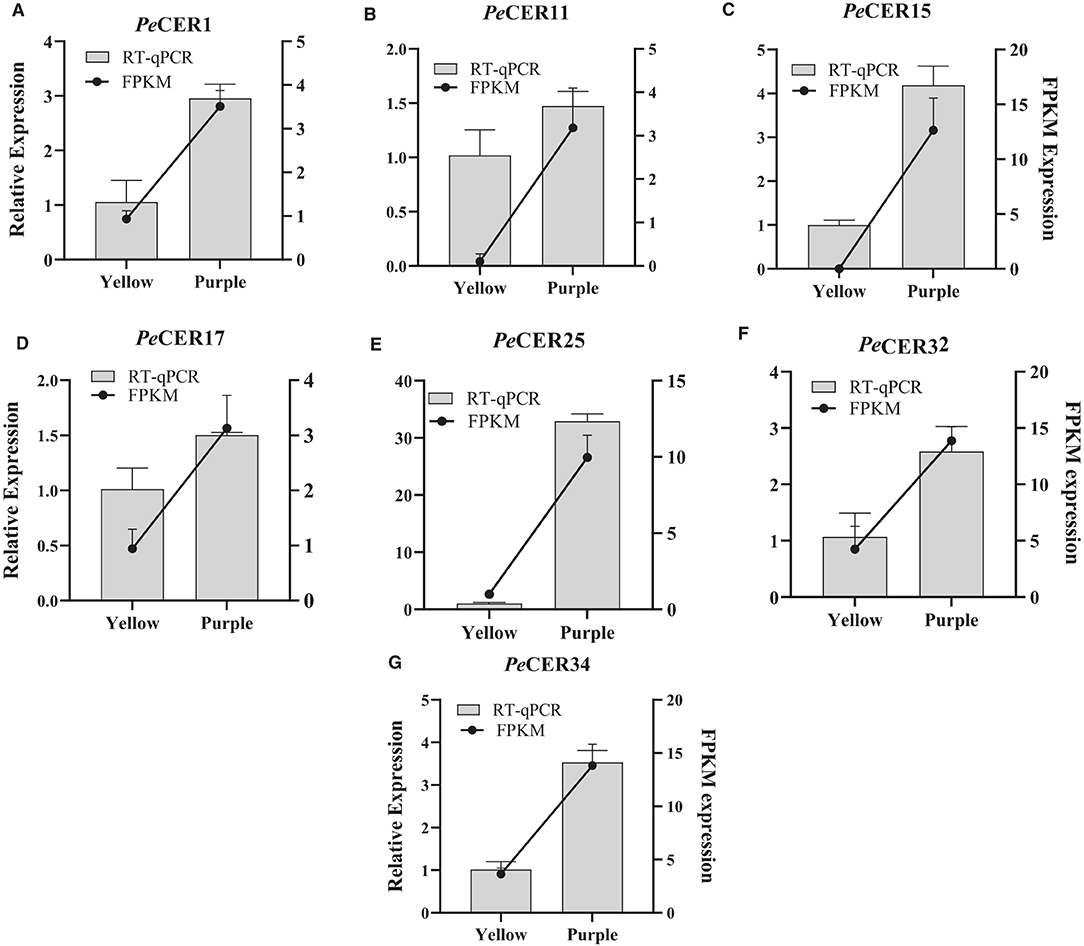
Figure 14. Validation of FPKM expression data by qRT-PCR. (A–G) Histograms show the qPCR results of seven PeCER genes in peel tissues of yellow and purple passion fruit cultivars at the ripening stage. Black line charts show the FPKM values of PeCER genes, and vertical gray bars show the qPCR results (2−ΔΔct) and represent mean ± SD. The left Y-axis represents the qPCR relative expression levels, and the right Y-axis indicates the FPKM expression values.
The cuticle of plants is a hydrophobic layer and is the first barrier between the environment and plants to protect them from biotic and abiotic stresses. It is composed of VLCFAs and their derivatives (Yeats and Rose, 2013). Wax biosynthesis has been described in different plant species including B. napus (Wang et al., 2020), O. sativa (Ni et al., 2018), A. thaliana (Aarts et al., 1995; Hooker et al., 2002; Trenkamp et al., 2004; Rowland et al., 2007; Pascal et al., 2013; Kim et al., 2019; Yang et al., 2020b), Mangifera indica (Tafolla-Arellano et al., 2017), Sichuan kumquat (Yang et al., 2022), P. pratensis (Wang et al., 2021), and M. domestica (Zhang et al., 2019a, 2020). Different genes are involved in cuticular wax biosynthesis and have been previously reported including CER (Bourdenx et al., 2011), KCS (Wang et al., 2020), KCR (beta-ketoacyl-CoA reductase) (Gan et al., 2016), FAR (fatty acyl-CoA reductase) (Wang et al., 2017), LACS (Schnurr et al., 2004), CUT1 (Millar et al., 1999), and FAE (fatty acid elongase) (Millar and Kunst, 1997). CER is one of the main gene families involved in cuticle wax biosynthesis and stress response (Bourdenx et al., 2011). The genome-wide identification of CER family genes has been reported in different plant species including Z. jujuba Mill (Li et al., 2021), M. domestica (Qi et al., 2019a), and H. annuus (Ahmad et al., 2021) and has been functionally characterized in A. thaliana (Aarts et al., 1995; Hooker et al., 2002; Trenkamp et al., 2004; Rowland et al., 2007; Pascal et al., 2013; Kim et al., 2019; Yang et al., 2020b), P. pratensis (Wang et al., 2021), O. sativa (Ni et al., 2018), B. napus (Wang et al., 2020), and Brachypodium distachyon (Wu et al., 2019). Information on CER genes in P. edulis remained unknown, but the availability of the passion fruit genome (Ma et al., 2021) made it possible studies on genomic levels.
In this study, 34 PeCER genes were identified in the passion fruit genome and were unevenly distributed across eight chromosomes, with the largest number of genes located on chromosome 1 (Table 1, Supplementary Figure S1). Ahmad et al. (2021) mentioned that the diversity of genes in the same family on different chromosomes may be due to their involvement in various functions. The 34 identified PeCER genes in the passion fruit genome were relatively similar in terms of number to sunflower CER (thirty-seven genes) (Ahmad et al., 2021), jujuba CER (twenty-nine) (Li et al., 2021), while some species have fewer CER genes including apple, which has 10 CER genes (Qi et al., 2019a); the difference in gene number may be due to differences in genome size. The phylogenetic tree was constructed among P. edulis, A. thaliana, M. domestica, H. annus, and Z. jujuba proteins and divided into 7 clades according to sunflower CER (Ahmad et al., 2021) (Figure 1A). Liu et al. (2018) pointed out that genes present in the same clade might perform similar functions. Differences in protein functions can be described by identifying conserved motifs during the development of different gene families (Wong et al., 2015). Furthermore, conserved motifs were predicted in PeCER proteins and a diverse motif pattern ranging from 1 to 24 motifs was found, indicating that PeCER proteins have a remarkably conserved protein structure (Figure 1B). Our results are inconsistent with Li et al. (2021), who also found similar motif results in jujuba.
Differences between the number of exons and introns provide an important source for gene family variation and determine the different functions and expressions of genes (Xu et al., 2012). In this study, a quite different number of introns were found in the PeCER genes ranging from 0 to 28 introns. The PeCER6, PeCER8, and PeCER9 genes have no introns, and similar results have been reported previously for intron-less genes such as AtCER6-2 and HanCER6-2 (Ahmad et al., 2021), while PeCER13 contained 28 introns (Figure 1C). These results indicate that ancestors of the PeCER genes might have gone through several rounds of intron loss and gain during development (Frugoli et al., 1998).
The cis-regulatory element analysis of PeCER genes revealed that ABRE, CGTCA-motif, GARE-motif, G-Box, Box 4, and ARE cis-elements were found in abundance (Figure 2), indicating that PeCER might be involved in different plant developmental and stress responses (Wingender et al., 1990; Wang et al., 2011; Xiong et al., 2020). Fujita et al. (2013) demonstrated the important roles of the ABRE element in ABA and stress responses. Kaur et al. (2017) reported the involvement of GARE cis-elements in hormone responsiveness. Liu et al. (2016) reported the involvement of W-box and G-box elements in early senescence of rice flag leaf. Gene duplication is a prominent feature of plant genomics that could lead to evolutionary and functional novelties that arise from existing genes (Flagel and Wendel, 2009). The differences in CER genes and chromosome numbers among passion fruit, apple, sunflower, jujuba, and Arabidopsis species suggest that they have gone through lineage-specific genome duplication. Whole-genome duplication (WGD) consists of tandem and segmental duplications that cause a sudden increase in the size of a genome and entire gene sets by generating two gene copies (Van De Peer et al., 2009). The results of the synteny analysis and calculation of Ka/Ks values in PeCER genes showed that the duplication process between the tandem and segmental PeCER genes was estimated to be 1.12 to 20.78 mya (Supplementary Table S6), which is consistent with a published report on passion fruit, indicating that passion fruit has gone through WGD twice (12 and 65 mya) (Xia et al., 2021).
Six segmental and two tandem duplicate CER genes in the passion fruit genome (Figure 3A, Supplementary Table S6) were identified, which is consistent with Xia et al. (2021) who also found two tandem repeats in the passion fruit TPS-b subfamily. Furthermore, the synteny analysis of P. edulis CER genes with A. thaliana, M. domestica, and Z. jujuba CER genes identified 10 PeCER genes as orthologous to 12 CER genes from the above species (Figure 3B). The multicollinearity analysis of the P. edulis CER genes revealed the highest collinearity between P. edulis and M. domestica (43 collinear genes). Santos et al. (2014) reported that compared to dicot genomes, the number of repetitive elements between P. edulis and M. domestica genomes was 42.4% (Figure 4), suggesting that these orthologous may share the same ancestors and retain corresponding functions.
The protein--to-protein interaction network of a particular gene family provides evidence of the relationship between members (Piya et al., 2014). The protein-to-protein interaction results of PeCER proteins showed that seven PeCER proteins were homologous with AtCER1 (Figure 5A). (Bernard and Joubès 2013) reported that AtCER1 dynamically contributes to wax biosynthesis and actively responds to biotic and abiotic stresses. Two PeCER proteins showed homology with AtCER3, and it has been reported that AtCER3 interacts with AtCER1 and catalyzes the redox-dependent VLCAs from very long-chain-Acyl-CoAs (Wu et al., 2019). Two PeCER proteins showed homology with AtSTE1 and interact with AtDWF1 and AtDWF5. Silvestro et al. (2013) stated that AtSTE1 (Delta(7)-sterol-C5(6)-desaturase1) is a precursor of growth-promoting brassinosteroids and is involved in sitosterol and campesterol biosynthesis. Choe et al. (2000) stated that AtDWF57-dehydrocholesterol reductase was involved in cholesterol production. Some PeCER proteins showed homology with AtKCS. Batsale et al. (2021) described that AtKCS was involved in the biosynthesis of VLCFAs and essential for cuticular wax and suberine biosynthesis. Two PeCER proteins showed interaction with AtSBH (sphingoid base hydroxylases). Shu et al. (2015) stated that AtSBH is involved in sphingolipid trihydroxy long-chain base (4-hydroxysphinganine) biosynthesis and response to high humidity and temperature stress. The PeCER protein-to-protein interaction results suggest that the homology and interaction with known Arabidopsis proteins may have the same functions such as wax biosynthesis, plant development, and stress responses, but further studies are required (Figure 5A).
The protein's secondary structures are the physical arrangement of amino acid sequences and are highly conserved between homologous proteins. The order of amino acids directly affects protein folding, 3D structure, and functions (Ridout et al., 2010). The results of PeCER protein secondary structure and 3D modeling indicate that the alpha helix accounts for the largest percentage of secondary structures (57.2%), followed by random coils (40.95%) and extended strands (25.68%) (Supplementary Table S11), and our results are identical to those of Lian et al. (2020), who also found the largest percentage of secondary structures followed by random coils and extended strands. In terms of 3D modeling, most of the PeCER proteins showed similar 3D structures except for a few of them (Figure 5B), indicating that the identified PeCER proteins were conserved and consistent with motif and gene structure analysis. Ridout et al. (2010) pointed out that protein structures, similar or different, may be due to differences in amino acid sequence size or arrangement.
In recent times, different miRNAs have been identified in numerous species, such as maize (Zea mays) (Aravind et al., 2017), cowpea (Vigna unguiculata) (Barrera-Figueroa et al., 2011), soybean (Glycine max) (Song et al., 2011), peanut (Arachis hypogaea) (Zhao et al., 2015), and passion fruit, that are involved in different metabolism, development, and environmental stresses (Paul et al., 2020). In this study, 12 putative miRNAs targeting 16 PeCER genes were identified (Figure 6, Supplementary Table S12), and two members of the ped-miR166 family targeted four PeCER genes. miR166 has been reported to be involved in drought stress in maize (Aravind et al., 2017) and cowpea (Barrera-Figueroa et al., 2011), seed development in soybean (Song et al., 2011), disease resistance in peanut (Zhao et al., 2015), development of protein metabolic process, shoot apical meristem in passion fruit (Paul et al., 2020), plant growth, development, and stress response in apple (Varkonyi-Gasic et al., 2010).
Two members of the ped-miR171 family targeted two PeCER genes, and miR171 has been reported to be involved in development, metabolism, and photosynthesis in grapevine (Vitis vinifera) (Han et al., 2014), in coffee (Coffea Arabica) (Chaves et al., 2015); stress response in tea plant (Camellia sinensis) (Zhang et al., 2014), and development and defense responses in passion fruit (Paul et al., 2020). One member of the ped-miR395 family targeted three PeCER genes. miR395 was found to be involved in abiotic stress in wheat (Triticum aestivum) (Han et al., 2013), starch metabolism in cassava (Manihot esculenta) (Patanun et al., 2013), development and stress response in sorghum (Sorghum bicolor) (Katiyar et al., 2012a; Su et al., 2021), and salt stress tolerance in cotton (Gossypium hirsutum) (Wang et al., 2013). Two members of the ped-miR399 family targeted three PeCER genes and have been stated to be involved in drought stress response in barley (Hordeum vulgare), sugarcane (Saccharum officinarum) (Zanca et al., 2010), phosphate homeostasis, signaling, transport in apple (Pant et al., 2008), and phosphate deficiencyin sorghum (Katiyar et al., 2012a). These findings proposed that the identified ped-miRNAs may play key roles in combating multiple stresses by modifying the transcriptional level of CER genes in passion fruit but requires further studies.
Plant TFs have been reported to be involved in regulation of fatty acids and wax biosynthesis, as well as stress responses under different conditions (Hao et al., 2017). In this study, various TFs targeting the 34 PeCER genes were predicted and their regulatory network interactions with the PeCER genes were constructed (Figure 7, Supplementary Table S13). The ERF TF family was found to be the most abundant, followed by BBR-BPC, TCP, MYB, NAC, and AP2, indicating their positive or negative roles in wax and fatty acid biosynthesis and different stresses. Go et al. (2014) found that wax biosynthesis in Arabidopsis was negatively regulated by AP2/ERF-type TFs. The overexpression of AP2/ERF-type TFs in Arabidopsis and tobacco increased the load of wax and drought resistance (Yang et al., 2020a). BBR-BPC TFs response to cytokinin and control flower development, brassinosteroid signaling, size of stem cells, and seed development (Shanks et al., 2018; Theune et al., 2019). TCP TFs regulate plant growth, development, and stress response (Li, 2015; Danisman, 2016; Mir et al., 2022). MYB TFs regulate VLCFA biosynthesis, plant development, metabolism, and response to stresses (Raffaele et al., 2008; Katiyar et al., 2012b; Ambawat et al., 2013). Zhang et al. (2019b) reported that the MYB30 TF played an important role in cuticular wax biosynthesis and resistance to pathogens. NAC TFs play an important role in plant immunity and biotic and abiotic stresses (Nuruzzaman et al., 2013). Our results are consistent with previous reports indicating that the role of TFs in PeCER genes may be to regulate plant stress resistance, while the wax regulation analysis requires further investigation.
GO aims to functionally classify genes into distinct terms, which can be further classified into three ontology categories at the genome level: GO-BP, GO-CC, and GO-MF (Ashburner et al., 2000). KEGG bioinformatics resources can be used to obtain genome-level biological functions in pathway maps (Masoudi-Nejad et al., 2007). GO and KEGG annotation and enrichment analyses were also performed on the PeCER genes (Figure 8, Supplementary Tables S14, S15). Most of the GO terms were related to organelle membrane, fatty acid synthase, wax and lipid metabolic process, organic substance, and stress response. Highly enriched KEGG pathways among the PeCER genes include lipid and fatty acid metabolism, cutin, suberine and wax biosynthesis, and plant-pathogen interaction. Our results are consistent with previous reports (Ni et al., 2016; Qi et al., 2019b), which also found similar GO terms and KEGG pathways related to wax and fatty acid biosynthesis, plant-pathogen interaction, and different stress responses. Cuticular wax plays an important role in plant biotic and abiotic stress tolerance. CER genes play an important role in VLCFA and wax biosynthesis (Li et al., 2021). CER10 is involved in VLCFA biosynthesis (Zheng et al., 2005), and the CER10 mutant exhibits increase in non-stomatal water loss and tolerance to drought conditions (Ensing et al., 2016). The expression of AtCER1 and AtCER3 improved the cuticle wax and reduced water loss under drought stress conditions in tobacco (Cameron et al., 2006). The FPKM expression results showed that the PeCER genes were differentially and constitutively expressed in different passion fruit tissues under different conditions (Figures 13, 14).
The FPKM expression results showed that compared with NT leaves, the expression levels of PeCER genes were higher in CS leaves, which were consistent with qRT-PCR expression results that the expressions of PeCER genes in drought-stressed leaves were higher compared to the control group (Figures 13, 14). Similarly, Wang et al. (2021) also found that the expression of PpCER1-2 was higher in drought-stressed leaves than in watered leaves. Wang et al. (2020) also pointed out that the BnCER1-2 in brassica-overexpressed plants stimulates the production of alkanes and improves tolerance to drought. PpCER1-2 was constitutively expressed in multiple tissues, with high expression in stems and leaves but very low expression in root tissues (Wang et al., 2021). In rice, OsCER1 was highly expressed in the tapetum and bicellular pollen cells but lower in vegetative organs, suggesting a role in organ development. Based on the FPKM and qRT-PCR expression results between different tissues and PeCER genes, the results showed diverse expressions such as PeCER1, PeCER11, PeCER15, and PeCER32 were highly expressed in roots and leaves but not in stem tissues. Similar results were found in Pascal et al. (2013), where CER26 was highly expressed in leaves but not in stems, CER2 was expressed in all tissues, and CER26-like was highly expressed in flowers but low in all other tissues.
Rowland et al. (2006) also found that CER4 was involved in the production of Arabidopsis epidermal wax and expressed in different plant tissues such as plant stems, roots, flowers, leaves, and siliques. Furthermore, cuticle wax also played an important role in plant defense against bacterial and fungal pathogens. The qRT-PCR expression results of F. kyushuense (biotic stress) showed that the PeCER genes under biotic stress conditions were upregulated in the purple cultivar compared with the controls, and are consistent with Bourdenx et al. (2011) who demonstrate that CER1 was involved in alkane biosynthesis and was highly correlated with responses to biotic and abiotic stresses. Wang et al. (2015) also reported that the overexpression of cucumber CsWAX2 homologous to CER3 showed a significant increase in resistance to drought and pathogens. The qRT-PCR expression results of PeCER genes were also consistent with the predicted TF results that the expression levels of PeCER genes containing numerous wax- and VLCFA-related transcription factors (EFR) were upregulated under stress conditions compared to the controls. Overall, these results suggest that the PeCER genes showed an important role by positive or negative regulation under stress conditions. In future studies, the identified PeCER genes could be used for further functional studies on wax biosynthesis and stress associated with the purpose of genetic improvement of passion fruit.
In this study, comprehensive analyses were performed, and 34 PeCER genes in the passion fruit genome were identified. All the PeCER genes were subjected to physio-chemical features, evolutionary relationships, chromosomal mapping, motifs, gene structures, cis-regulatory elements, protein-protein interaction, syntenic analysis, TFs regulatory network analysis, GO andKEGGannotation, and putative miRNA prediction analysis. The PeCER genes were expanded and subjected to purification selection. The predicted subcellular localization was validated by transient expression assay of the PeCER32 in onion epidermal cells. Different TFs including ERF, TCP, MYB, and NAC were identified, and a TF regulatory network associated with the PeCER genes was constructed. Diverse FPKM expression profiles of the PeCER genes were found in the roots, peels, leaves, and pulp tissues under different conditions. The qRT-PCR expression results revealed that PeCER1, PeCER11, PeCER15, PeCER17, and PeCER32 were highly upregulated under drought and F. kyushuense stress conditions compared to the controls but varied in the yellow and purple passion fruit cultivars. These findings provide preliminary information for future functional studies on the PeCER genes for the genetic improvement of passion fruit, and the genes including PeCER1, PeCER11, PeCER15, PeCER17, and PeCER32 that were highly expressed under stress may play important roles in wax biosynthesis and stress response, but further functional studies are needed.
The original contributions presented in the study are included in the article/Supplementary Materials, further inquiries can be directed to the corresponding authors.
FC and HMR: conceptualization and validation. AW, SM, MBA, JL, MI, and BL: methodology. HMR and AA: software. HMR, NS, MAAA, and XY: formal analysis. HMR: data curation and writing and original draft preparation. FC, SSS, and RO: review and editing. FC: supervision. ZL and FC: funding acquisition. All the authors have read and agreed to the published version of the manuscript.
FC research project was funded by the Department of Science and Technology, Fujian Province, China (2020N0004 and 2020S0056) and the Engineering Research Center of Fujian Province University (G2-KF2006). ZL research project was funded by Enterprise Technology Development (Contract: 2020-3501-04-001995).
The authors declare that the research was conducted in the absence of any commercial or financial relationships that could be construed as a potential conflict of interest.
All claims expressed in this article are solely those of the authors and do not necessarily represent those of their affiliated organizations, or those of the publisher, the editors and the reviewers. Any product that may be evaluated in this article, or claim that may be made by its manufacturer, is not guaranteed or endorsed by the publisher.
The Supplementary Material for this article can be found online at: https://www.frontiersin.org/articles/10.3389/fpls.2022.898307/full#supplementary-material
Aarts, M., Keijzer, C. J., Stiekema, W. J., and Pereira, A. (1995). Molecular characterization of the CER1 gene of Arabidopsis involved in epicuticular wax biosynthesis and pollen fertility. Plant Cell 7, 2115–2127. doi: 10.1105/tpc.7.12.2115
Ahmad, H. M., Wang, X., Fiaz, S., Nadeem, M. A., Khan, S. A., Ahmar, S., et al. (2021). Comprehensive genomics and expression analysis of eceriferum (CER) genes in sunflower (Helianthus annuus). Saudi J. Biol. Sci. 28, 6884–6896. doi: 10.1016/j.sjbs.2021.07.077
Al-Abdallat, A. M., Al-Debei, H. S., Ayad, J. Y., and Hasan, S. (2014). Over-expression of SlSHN1gene improves drought tolerance by increasing cuticular wax accumulation in tomato. Int. J. Mol. Sci. 15, 19499–19515. doi: 10.3390/ijms151119499
Ambawat, S., Sharma, P., Yadav, N. R., and Yadav, R. C. (2013). MYB transcription factor genes as regulators for plant responses: an overview. Physiol. Mol. Biol. Plants 19, 307–321. doi: 10.1007/s12298-013-0179-1
Aravind, J., Rinku, S., Pooja, B., Shikha, M., Kaliyugam, S., Mallikarjuna, M. G., et al. (2017). Identification, characterization, and functional validation of drought-responsive microRNAs in subtropical maize inbreds. Front. Plant Sci. 8, 941. doi: 10.3389/fpls.2017.00941
Ashburner, M., Ball, C. A., Blake, J. A., Botstein, D., Butler, H., Cherry, J. M., et al. (2000). Gene ontology: tool for the unification of biology. Nat. Genet. 25, 25–29. doi: 10.1038/75556
Bailey, T. L., Williams, N., Misleh, C., and Li, W. W. (2006). MEME: discovering and analyzing DNA and protein sequence motifs. Nucleic Acids Res. 34, W369–W373. doi: 10.1093/nar/gkl198
Barrera-Figueroa, B. E., Gao, L., Diop, N. N., Wu, Z., Ehlers, J. D., Roberts, P. A., et al. (2011). Identification and comparative analysis of drought-associated microRNAs in two cowpea genotypes. BMC Plant Biol. 11, 1–11. doi: 10.1186/1471-2229-11-127
Batsale, M., Bahammou, D., Fouillen, L., Mongrand, S., Joubès, J., and Domergue, F. (2021). Biosynthesis and functions of very-long-chain fatty acids in the responses of plants to abiotic and biotic stresses.Cells 10, 1284. doi: 10.3390/cells10061284
Bernard, A., and Joubès, J. (2013). Arabidopsis cuticular waxes: advances in synthesis, export and regulation. Prog. Lipid Res. 52, 110–129. doi: 10.1016/j.plipres.2012.10.002
Bourdenx, B., Bernard, A., Domergue, F., Pascal, S., Léger, A., Roby, D., et al. (2011). Overexpression of ArabidopsisECERIFERUM1 promotes wax verylong-chain alkane biosynthesis and influences plant response to biotic and abiotic stresses. Plant Physiol. 156, 29–45. doi: 10.1104/pp.111.172320
Cameron, K. D., Teece, M. A., and Smart, L. B. (2006). Increased accumulation of cuticular wax and expression of lipid transfer protein in response to periodic drying events in leaves of tree tobacco. Plant Physiol. 140, 176–183. doi: 10.1104/pp.105.069724
Chaves, S., Fernandes-Brum, C., Silva, G., Ferrara-Barbosa, B., Paiva, L., Nogueira, F., et al. (2015). New insights on Coffea miRNAs: features and evolutionary conservation. Appl. Biochem. Biotechnol. 177, 879–908. doi: 10.1007/s12010-015-1785-x
Chen, C., Chen, H., Zhang, Y., Thomas, H. R., Frank, M. H., He, Y., and Xia, R. (2020). TBtools: an integrative toolkit developed for interactive analyses of big biological data. Mol. Plant 13, 1194–1202. doi: 10.1016/j.molp.2020.06.009
Chen, S., Zhou, Y., Chen, Y., and Gu, J. (2018). fastp: an ultra-fast all-in-one FASTQ preprocessor. Bioinformatics 34, i884–i890. doi: 10.1093/bioinformatics/bty560
Choe, S., Tanaka, A., Noguchi, T., Fujioka, S., Takatsuto, S., Ross, A. S., et al. (2000). Lesions in the sterol Δ7 reductase gene of Arabidopsis cause dwarfism due to a block in brassinosteroid biosynthesis. Plant J. 21, 431–443. doi: 10.1046/j.1365-313x.2000.00693.x
Danisman, S.. (2016). TCP transcription factors at the interface between environmental challenges and the plant's growth responses. Front. Plant Sci. 7, 1930. doi: 10.3389/fpls.2016.01930
Ding, S., Zhang, J., Yang, L., Wang, X., Fu, F., Wang, R., et al. (2020). Changes in cuticle components and morphology of 'Satsuma'Mandarin (Citrus unshiu) during ambient storage and their potential role on Penicillium digitatum infection. Molecules 25, 412. doi: 10.3390/molecules25020412
Ensing, A., Gerson, E., Hofer, K., and Tanuseputra, O. (2016). The effect of water deficit on the growth rate of cer10 Arabidopsis thaliana mutants. Expedition 6. Available online at: https://ojs.library.ubc.ca/index.php/expedition/article/view/189104
Flagel, L. E., and Wendel, J. F. (2009). Gene duplication and evolutionary novelty in plants. New Phytol. 183, 557–564. doi: 10.1111/j.1469-8137.2009.02923.x
Frugoli, J. A., Mcpeek, M. A., Thomas, T. L., and Mcclung, C. R. (1998). Intron loss and gain during evolution of the catalase gene family in angiosperms. Genetics 149, 355–365. doi: 10.1093/genetics/149.1.355
Fujita, Y., Yoshida, T., and Yamaguchi-Shinozaki, K. (2013). Pivotal role of the AREB/ABF-SnRK2 pathway in ABRE-mediated transcription in response to osmotic stress in plants. Physiol. Plant. 147, 15–27. doi: 10.1111/j.1399-3054.2012.01635.x
Gan, L., Wang, X., Cheng, Z., Liu, L., Wang, J., Zhang, Z., et al. (2016). Wax crystal-sparse leaf 3 encoding a β-ketoacyl-CoA reductase is involved in cuticular wax biosynthesis in rice. Plant Cell Rep. 35, 1687–1698. doi: 10.1007/s00299-016-1983-1
Gasteiger, E., Hoogland, C., Gattiker, A., Wilkins, M. R., Appel, R. D., and Bairoch, A. (2005). “Protein identification and analysis tools on the ExPASy server,” in The Proteomics Protocols Handbook, ed J. M. Walker (Totowa, NJ: Humana Press Inc), 571–607. doi: 10.1385/1-59259-890-0:571
Geourjon, C., and Deleage, G. (1995). SOPMA: significant improvements in protein secondary structure prediction by consensus prediction from multiple alignments. Bioinformatics 11, 681–684. doi: 10.1093/bioinformatics/11.6.681
Go, Y. S., Kim, H., Kim, H. J., and Suh, M. C. (2014). Arabidopsis cuticular wax biosynthesis is negatively regulated by the DEWAX gene encoding an AP2/ERF-type transcription factor. Plant Cell 26, 1666–1680. doi: 10.1105/tpc.114.123307
Han, J., Fang, J., Wang, C., Yin, Y., Sun, X., Leng, X., et al. (2014). Grapevine microRNAs responsive to exogenous gibberellin. BMC Genom. 15, 1–17. doi: 10.1186/1471-2164-15-111
Han, J., Kong, M., Xie, H., Sun, Q., Nan, Z., Zhang, Q., et al. (2013). Identification of miRNAs and their targets in wheat (Triticum aestivum L.) by EST analysis. Genet. Mol. Res. 12, 805. doi: 10.4238/2013.September.19.11
Hao, S., Ma, Y., Zhao, S., Ji, Q., Zhang, K., Yang, M., et al. (2017). McWRI1, a transcription factor of the AP2/SHEN family, regulates the biosynthesis of the cuticular waxes on the apple fruit surface under low temperature. PLoS ONE 12, e0186996. doi: 10.1371/journal.pone.0186996
Haslam, T. M., Haslam, R., Thoraval, D., Pascal, S., Delude, C., Domergue, F., et al. (2015). ECERIFERUM2-LIKE proteins have unique biochemical and physiological functions in very-long-chain fatty acid elongation. Plant Physiol. 167, 682–692. doi: 10.1104/pp.114.253195
Hooker, T. S., Lam, P., Zheng, H., and Kunst, L. (2007). A core subunit of the RNA-processing/degrading exosome specifically influences cuticular wax biosynthesis in Arabidopsis. Plant Cell 19, 904–913. doi: 10.1105/tpc.106.049304
Hooker, T. S., Millar, A. A., and Kunst, L. (2002). Significance of the expression of the CER6 condensing enzyme for cuticular wax production in Arabidopsis. Plant Physiol. 129, 1568–1580. doi: 10.1104/pp.003707
Katiyar, A., Smita, S., Chinnusamy, V., Pandey, D. M., and Bansal, K. (2012a). Identification of miRNAs in sorghum by using bioinformatics approach. Plant Signal. Behav. 7, 246–259. doi: 10.4161/psb.18914
Katiyar, A., Smita, S., Lenka, S. K., Rajwanshi, R., Chinnusamy, V., and Bansal, K. C. (2012b). Genome-wide classification and expression analysis of MYB transcription factor families in rice and Arabidopsis. BMC Genom. 13, 1–19. doi: 10.1186/1471-2164-13-544
Kaur, A., Pati, P. K., Pati, A. M., and Nagpal, A. K. (2017). In-silico analysis of cis-acting regulatory elements of pathogenesis-related proteins of Arabidopsis thaliana and Oryza sativa. PLoS ONE 12, e0184523. doi: 10.1371/journal.pone.0184523
Kelley, L. A., Mezulis, S., Yates, C. M., Wass, M. N., and Sternberg, M. J. (2015). The Phyre2 web portal for protein modeling, prediction and analysis. Nat. Protoc. 10, 845–858. doi: 10.1038/nprot.2015.053
Kim, D., and Langmead, B. (2015). Salzberg SLHISAT. A fast spliced aligner with low memory requirements. Nat. Methods 12, 357–360. doi: 10.1038/nmeth.3317
Kim, H., Yu, S.-I., Jung, S. H., Lee, B.-H., and Suh, M. C. (2019). The F-box protein SAGL1 and ECERIFERUM3 regulate cuticular wax biosynthesis in response to changes in humidity in Arabidopsis. Plant Cell 31, 2223–2240. doi: 10.1105/tpc.19.00152
Kohl, M., Wiese, S., and Warscheid, B. (2011). “Cytoscape: software for visualization and analysis of biological networks,” in Data Mining in Proteomics, eds M. Hamacher, M. Eisenacher, and C. Stephan (Totowa, NJ: Humana Press), 291–303. doi: 10.1007/978-1-60761-987-1_18
Kumar, M., Patel, M. K., Kumar, N., Bajpai, A. B., and Siddique, K. H. (2021). Metabolomics and molecular approaches reveal drought stress tolerance in plants. Int. J. Mol. Sci. 22, 9108. doi: 10.3390/ijms22179108
Kumar, S., Nei, M., Dudley, J., and Tamura, K. (2008). MEGA: a biologist-centric software for evolutionary analysis of DNA and protein sequences. Brief Bioinform. 9, 299–306. doi: 10.1093/bib/bbn017
Lam, P., Zhao, L., Eveleigh, N., Yu, Y., Chen, X., and Kunst, L. (2015). The exosome and trans-acting small interfering RNAs regulate cuticular wax biosynthesis during Arabidopsis inflorescence stem development. Plant Physiol. 167, 323–336. doi: 10.1104/pp.114.252825
Lara, I., Heredia, A., and Domínguez, E. (2019). Shelf life potential and the fruit cuticle: the unexpected player. Front. Plant Sci. 10, 770. doi: 10.3389/fpls.2019.00770
Law, C. W., Alhamdoosh, M., Su, S., Dong, X., Tian, L., Smyth, G. K., et al. (2016). RNA-seq analysis is easy as 1-2-3 with limma, Glimma and edgeR. F1000Research 5: ISCB Comm J-1408. doi: 10.12688/f1000research.9005.3
Lescot, M.. (2002). Patrice D hais, Gert Thijs, Kathleen Marchal, Yves Moreau, Yves Van de Peer, Pierre Rouz and Stephane Rombauts. Nucleic Acids Res. 30, 325–327. doi: 10.1093/nar/30.1.325
Letunic, I., and Bork, P. (2007). Interactive Tree Of Life (iTOL): an online tool for phylogenetic tree display and annotation. Bioinformatics 23, 127–128. doi: 10.1093/bioinformatics/btl529
Lewandowska, M., Keyl, A., and Feussner, I. (2020). Wax biosynthesis in response to danger: its regulation upon abiotic and biotic stress. New Phytol. 227, 698–713. doi: 10.1111/nph.16571
Li, H., Handsaker, B., Wysoker, A., Fennell, T., Ruan, J., Homer, N., et al. (2009). The sequence alignment/map format and SAMtools. Bioinformatics 25, 2078–2079. doi: 10.1093/bioinformatics/btp352
Li, N., Li, X., Song, Y., Yang, S., and Li, L. (2021). Genome-wide identification, characterization, and expression profiling of the ECERIFERUM (CER) gene family in Ziziphus jujube. Russian J. Plant Physiol. 68, 828–837. doi: 10.1134/S1021443721050101
Li, S.. (2015). The Arabidopsis thaliana TCP transcription factors: a broadening horizon beyond development. Plant Signal. Behav. 10, e1044192. doi: 10.1080/15592324.2015.1044192
Lian, X.-Y., Wang, X., Gao, H.-N., Jiang, H., Mao, K., You, C.-X., et al. (2020). Genome-wide analysis and functional identification of MdKCS genes in apple. Plant Physiol. Biochem. 151, 299–312. doi: 10.1016/j.plaphy.2020.03.034
Liu, C., Wright, B., Allen-Vercoe, E., Gu, H., and Beiko, R. (2018). Phylogenetic clustering of genes reveals shared evolutionary trajectories and putative gene functions. Genome Biol. Evol. 10, 2255–2265. doi: 10.1093/gbe/evy178
Liu, L., Xu, W., Hu, X., Liu, H., and Lin, Y. (2016). W-box and G-box elements play important roles in early senescence of rice flag leaf. Sci. Rep. 6, 1–9. doi: 10.1038/srep20881
Liu, T., Tang, J., Chen, L., Zeng, J., Wen, J., Yi, B., et al. (2019). Differential expression of miRNAs and their targets in wax-deficient rapeseed. Sci. Rep. 9, 1–12. doi: 10.1038/s41598-019-48439-z
Lü, S., Song, T., Kosma, D. K., Parsons, E. P., Rowland, O., and Jenks, M. A. (2009). Arabidopsis CER8 encodes LONG-CHAIN ACYL-COA SYNTHETASE 1 (LACS1) that has overlapping functions with LACS2 in plant wax and cutin synthesis. Plant J. 59, 553–564. doi: 10.1111/j.1365-313X.2009.03892.x
Ma, D., Dong, S., Zhang, S., Wei, X., Xie, Q., Ding, Q., et al. (2021). Chromosome-level reference genome assembly provides insights into aroma biosynthesis in passion fruit (Passiflora edulis). Mol. Ecol. Resour. 21, 955–968. doi: 10.1111/1755-0998.13310
Masoudi-Nejad, A., Goto, S., Endo, T. R., and Kanehisa, M. (2007). “KEGG bioinformatics resource for plant genomics research,” in Plant Bioinformatics, ed D. Edwards (Totowa, NJ: Humana Press), 437–458.
Medeiros, C., Falcão, H., Almeida-Cortez, J., Santos, D., Oliveira, A., and Santos, M. (2017). Leaf epicuticular wax content changes under different rainfall regimes, and its removal affects the leaf chlorophyll content and gas exchanges of Aspidosperma pyrifolium in a seasonally dry tropical forest. South Afr. J. Bot. 111, 267–274. doi: 10.1016/j.sajb.2017.03.033
Millar, A. A., Clemens, S., Zachgo, S., Giblin, E. M., Taylor, D. C., and Kunst, L. (1999). CUT1, an Arabidopsis gene required for cuticular wax biosynthesis and pollen fertility, encodes a very-long-chain fatty acid condensing enzyme. Plant Cell 11, 825–838. doi: 10.1105/tpc.11.5.825
Millar, A. A., and Kunst, L. (1997). Very-long-chain fatty acid biosynthesis is controlled through the expression and specificity of the condensing enzyme. Plant J. 12, 121–131. doi: 10.1046/j.1365-313X.1997.12010121.x
Mir, R. A., Bhat, B. A., Yousuf, H., Islam, S. T., Raza, A., Rizvi, M. A., et al. (2022). Multidimensional role of silicon to activate resilient plant growth and to mitigate abiotic stress. Front. Plant Sci. 13, 819658. doi: 10.3389/fpls.2022.819658
Munhoz, C., Santos, A., Arenhart, R., Santini, L., Monteiro-Vitorello, C., and Vieira, M. (2015). Analysis of plant gene expression during passion fruit-Xanthomonas axonopodis interaction implicates lipoxygenase 2 in host defense. Ann. Appl. Biol. 167, 135–155. doi: 10.1111/aab.12215
Ni, E., Zhou, L., Li, J., Jiang, D., Wang, Z., Zheng, S., et al. (2018). OsCER1 plays a pivotal role in verylong-chain alkane biosynthesis and affects plastid development and programmed cell death of tapetum in rice (Oryza sativa L.). Front. Plant Sci. 9, 1217. doi: 10.3389/fpls.2018.01217
Ni, Y., Guo, N., Zhao, Q., and Guo, Y. (2016). Identification of candidate genes involved in wax deposition in Poa pratensis by RNA-seq. BMC Genom. 17, 1–12. doi: 10.1186/s12864-016-2641-2
Nuruzzaman, M., Sharoni, A. M., and Kikuchi, S. (2013). Roles of NAC transcription factors in the regulation of biotic and abiotic stress responses in plants. Front. Microbiol. 4, 248. doi: 10.3389/fmicb.2013.00248
Pandey, P., Irulappan, V., Bagavathiannan, M. V., and Senthil-Kumar, M. (2017). Impact of combined abiotic and biotic stresses on plant growth and avenues for crop improvement by exploiting physio-morphological traits. Front. Plant Sci. 8, 537. doi: 10.3389/fpls.2017.00537
Pant, B. D., Buhtz, A., Kehr, J., and Scheible, W. R. (2008). MicroRNA399 is a long-distance signal for the regulation of plant phosphate homeostasis. Plant J. 53, 731–738. doi: 10.1111/j.1365-313X.2007.03363.x
Pascal, S., Bernard, A., Sorel, M., Pervent, M., Vile, D., Haslam, R. P., et al. (2013). The Arabidopsis cer26 mutant, like the cer2 mutant, is specifically affected in the very long-chain fatty acid elongation process. Plant J. 73, 733–746. doi: 10.1111/tpj.12060
Patanun, O., Lertpanyasampatha, M., Sojikul, P., Viboonjun, U., and Narangajavana, J. (2013). Computational identification of microRNAs and their targets in cassava (Manihot esculenta Crantz.). Mol. Biotechnol. 53, 257–269. doi: 10.1007/s12033-012-9521-z
Paul, S., De La Fuente-Jiménez, J. L., Manriquez, C. G., and Sharma, A. (2020). Identification, characterization and expression analysis of passion fruit (Passiflora edulis) microRNAs. 3 Biotech 10, 1–9. doi: 10.1007/s13205-019-2000-5
Pighin, J. A., Zheng, H., Balakshin, L. J., Goodman, I. P., Western, T. L., Jetter, R., et al. (2004). Plant cuticular lipid export requires an ABC transporter. Science 306, 702–704. doi: 10.1126/science.1102331
Piya, S., Shrestha, S. K., Binder, B., Stewart, C. N., and Jr Hewezi, T. (2014). Protein-protein interaction and gene co-expression maps of ARFs and Aux/IAAs in Arabidopsis. Front. Plant Sci. 5, 744. doi: 10.3389/fpls.2014.00744
Qi, C., Jiang, H., Zhao, X., Mao, K., Liu, H., Li, Y., et al. (2019a). The characterization, authentication, and gene expression pattern of the MdCER family in Malus domestica. Horticultural Plant J. 5, 1–9. doi: 10.1016/j.hpj.2018.11.003
Qi, X., Ogden, E. L., Die, J. V., Ehlenfeldt, M. K., Polashock, J. J., Darwish, O., et al. (2019b). Transcriptome analysis identifies genes related to the waxy coating on blueberry fruit in two northern-adapted rabbiteye breeding populations. BMC Plant Biol. 19, 1–15. doi: 10.1186/s12870-019-2073-7
Raffaele, S., Vailleau, F., Léger, A., Joubès, J., Miersch, O., Huard, C., et al. (2008). A MYB transcription factor regulates very-long-chain fatty acid biosynthesis for activation of the hypersensitive cell death response in Arabidopsis. Plant Cell 20, 752–767. doi: 10.1105/tpc.107.054858
Raza, A.. (2021). Eco-physiological and biochemical responses of rapeseed (Brassica napus L.) to abiotic stresses: consequences and mitigation strategies. J. Plant Growth Regul. 40, 1368–1388. doi: 10.1007/s00344-020-10231-z
Raza, A., Tabassum, J., Zahid, Z., Charagh, S., Bashir, S., Barmukh, R., et al. (2022). Advances in “omics” approaches for improving toxic metals/metalloids tolerance in plants. Front. Plant Sci. 2:2949. doi: 10.3389/fpls.2021.794373
Ridout, K. E., Dixon, C. J., and Filatov, D. A. (2010). Positive selection differs between protein secondary structure elements in Drosophila. Genome Biol. Evol. 2, 166–179. doi: 10.1093/gbe/evq008
Rizwan, H. M., Zhimin, L., Harsonowati, W., Waheed, A., Qiang, Y., Yousef, A. F., et al. (2021). Identification of fungal pathogens to control postharvest passion fruit (Passiflora edulis) decays and multi-omics comparative pathway analysis reveals purple is more resistant to pathogens than a yellow cultivar. J. Fungi 7, 879. doi: 10.3390/jof7100879
Rowland, O., Lee, R., Franke, R., Schreiber, L., and Kunst, L. (2007). The CER3 wax biosynthetic gene from Arabidopsis thaliana is allelic to WAX2/YRE/FLP1. FEBS Lett. 581, 3538–3544. doi: 10.1016/j.febslet.2007.06.065
Rowland, O., Zheng, H., Hepworth, S. R., Lam, P., Jetter, R., and Kunst, L. (2006). CER4 encodes an alcohol-forming fatty acyl-coenzyme A reductase involved in cuticular wax production in Arabidopsis. Plant Physiol. 142, 866–877. doi: 10.1104/pp.106.086785
Sakuradani, E., Zhao, L., Haslam, T. M., and Kunst, L. (2013). The CER22 gene required for the synthesis of cuticular wax alkanes in Arabidopsis thaliana is allelic to CER1. Planta 237, 731–738. doi: 10.1007/s00425-012-1791-y
Santos, A. A., Penha, H. A., Bellec, A., De Freitas Munhoz, C., Pedrosa-Harand, A., Bergès, H., et al. (2014). Begin at the beginning: a BAC-end view of the passion fruit (Passiflora) genome. BMC Genom. 15, 1–16. doi: 10.1186/1471-2164-15-816
Schmittgen, T. D., and Livak, K. J. (2008). Analyzing real-time PCR data by the comparative CT method. Nat. Protoc. 3, 1101–1108. doi: 10.1038/nprot.2008.73
Schnurr, J., Shockey, J., and Browse, J. (2004). The acyl-CoA synthetase encoded by LACS2 is essential for normal cuticle development in Arabidopsis. Plant Cell 16, 629–642. doi: 10.1105/tpc.017608
Shanks, C. M., Hecker, A., Cheng, C. Y., Brand, L., Collani, S., Schmid, M., et al. (2018). Role of BASIC PENTACYSTEINE transcription factors in a subset of cytokinin signaling responses. Plant J. 95, 458–473. doi: 10.1111/tpj.13962
Sharif, R., Raza, A., Chen, P., Li, Y., El-Ballat, E. M., Rauf, A., et al. (2021). HD-ZIP gene family: potential roles in improving plant growth and regulating stress-responsive mechanisms in plants. Genes 12, 1256. doi: 10.3390/genes12081256
Sharom, F. J., Kretzschmar, T., Burla, B., Lee, Y., Martinoia, E., and Nagy, R. (2011). Functions of ABC transporters in plants. Essays Biochem. 50, 145–160. doi: 10.1042/bse0500145
Shu, Y., Tao, Y., Wang, S., Huang, L., Yu, X., Wang, Z., et al. (2015). GmSBH1, a homeobox transcription factor gene, relates to growth and development and involves in response to high temperature and humidity stress in soybean. Plant Cell Rep. 34, 1927–1937. doi: 10.1007/s00299-015-1840-7
Silvestro, D., Andersen, T. G., Schaller, H., and Jensen, P. E. (2013). Plant sterol metabolism. Δ7-sterol-C5-desaturase (STE1/DWARF7), Δ5, 7-sterol-Δ7-reductase (DWARF5) and Δ24-sterol-Δ24-reductase (DIMINUTO/DWARF1) show multiple subcellular localizations in Arabidopsis thaliana (Heynh) L. PLoS ONE 8, e56429. doi: 10.1371/journal.pone.0056429
Song, Q.-X., Liu, Y.-F., Hu, X.-Y., Zhang, W.-K., Ma, B., Chen, S.-Y., et al. (2011). Identification of miRNAs and their target genes in developing soybean seeds by deep sequencing. BMC Plant Biol. 11, 1–16. doi: 10.1186/1471-2229-11-5
Su, W., Raza, A., Gao, A., Jia, Z., Zhang, Y., Hussain, M. A., et al. (2021). Genome-wide analysis and expression profile of superoxide dismutase (SOD) gene family in rapeseed (Brassica napus L.) under different hormones and abiotic stress conditions. Antioxidants 10, 1182. doi: 10.3390/antiox10081182
Tafolla-Arellano, J. C., Zheng, Y., Sun, H., Jiao, C., Ruiz-May, E., Hernández-Oñate, M. A., et al. (2017). Transcriptome analysis of mango (Mangifera indica L.) fruit epidermal peel to identify putative cuticle-associated genes. Sci. Rep. 7, 1–13. doi: 10.1038/srep46163
Theune, M. L., Bloss, U., Brand, L. H., Ladwig, F., and Wanke, D. (2019). Phylogenetic analyses and GAGA-motif binding studies of BBR/BPC proteins lend to clues in GAGA-motif recognition and a regulatory role in brassinosteroid signaling. Front. Plant Sci. 10, 466. doi: 10.3389/fpls.2019.00466
Tian, F., Yang, D.-C., Meng, Y.-Q., Jin, J., and Gao, G. (2020). PlantRegMap: charting functional regulatory maps in plants. Nucleic Acids Res. 48, D1104–D1113. doi: 10.1093/nar/gkz1020
Trenkamp, S., Martin, W., and Tietjen, K. (2004). Specific and differential inhibition of very-long-chain fatty acid elongases from Arabidopsis thaliana by different herbicides. Proc. Nat. Acad. Sci. U.S.A. 101, 11903–11908. doi: 10.1073/pnas.0404600101
Tresch, S., Heilmann, M., Christiansen, N., Looser, R., and Grossmann, K. (2012). Inhibition of saturated very-long-chain fatty acid biosynthesis by mefluidide and perfluidone, selective inhibitors of 3-ketoacyl-CoA synthases. Phytochemistry 76, 162–171. doi: 10.1016/j.phytochem.2011.12.023
Van De Peer, Y., Maere, S., and Meyer, A. (2009). The evolutionary significance of ancient genome duplications. Nat. Rev. Genet. 10, 725–732. doi: 10.1038/nrg2600
Varkonyi-Gasic, E., Gould, N., Sandanayaka, M., Sutherland, P., and Macdiarmid, R. M. (2010). Characterization of microRNAs from apple (Malus domestic royal Gala') vascular tissue and phloem sap. BMC Plant Biol. 10, 1–15. doi: 10.1186/1471-2229-10-159
Wang, D., Ni, Y., Liao, L., Xiao, Y., and Guo, Y. (2021). Poa pratensis ECERIFERUM1 (PpCER1) is involved in wax alkane biosynthesis and plant drought tolerance. Plant Physiol. Biochem. 159, 312–321. doi: 10.1016/j.plaphy.2020.12.032
Wang, M., Wang, Q., and Zhang, B. (2013). Response of miRNAs and their targets to salt and drought stresses in cotton (Gossypium hirsutum L.). Gene 530, 26–32. doi: 10.1016/j.gene.2013.08.009
Wang, M., Wu, H., Xu, J., Li, C., Wang, Y., and Wang, Z. (2017). Five fatty acyl-coenzyme a reductases are involved in the biosynthesis of primary alcohols in Aegilops tauschiileaves. Front. Plant Sci. 8, 1012. doi: 10.3389/fpls.2017.01012
Wang, W., Liu, X., Gai, X., Ren, J., Liu, X., Cai, Y., et al. (2015). Cucumis sativus L. WAX2 plays a pivotal role in wax biosynthesis, influencing pollen fertility and plant biotic and abiotic stress responses. Plant Cell Physiol. 56, 1339–1354. doi: 10.1093/pcp/pcv052
Wang, Y., Jin, S., Xu, Y., Li, S., Zhang, S., Yuan, Z., et al. (2020). Overexpression of BnKCS1-1, BnKCS1-2, and BnCER1-2 promotes cuticular wax production and increases drought tolerance in Brassica napus. Crop J. 8, 26–37. doi: 10.1016/j.cj.2019.04.006
Wang, Y., Liu, G.-J., Yan, X.-F., Wei, Z.-G., and Xu, Z.-R. (2011). MeJA-inducible expression of the heterologous JAZ2 promoter from Arabidopsis in Populus trichocarpa protoplasts. J. Plant Dis. Protect. 118, 69–74. doi: 10.1007/BF03356384
Wingender, R., Röhrig, H., Höricke, C., and Schell, J. (1990). cis-regulatory elements are involved in ultraviolet light regulation and plant defense. Plant Cell 2, 1019–1026. doi: 10.1105/tpc.2.10.1019
Wong, A., Gehring, C., and Irving, H. R. (2015). Conserved functional motifs and homology modeling to predict hidden moonlighting functional sites. Front. Bioeng. Biotechnol. 3, 82. doi: 10.3389/fbioe.2015.00082
Wu, H., Shi, S., Lu, X., Li, T., Wang, J., Liu, T., et al. (2019). Expression analysis and functional characterization of CER1 family genes involved in very-long-chain alkanes biosynthesis in Brachypodium distachyon. Front. Plant Sci. 10, 1389. doi: 10.3389/fpls.2019.01389
Wu, Y., Huang, W., Tian, Q., Liu, J., Xia, X., Yang, X., et al. (2021). Comparative transcriptomic analysis reveals the cold acclimation during chilling stress in sensitive and resistant passion fruit (Passiflora edulis) cultivars. PeerJ 9, e10977. doi: 10.7717/peerj.10977
Xia, Z., Huang, D., Zhang, S., Wang, W., Ma, F., Wu, B., et al. (2021). Chromosome-scale genome assembly provides insights into the evolution and flavor synthesis of passion fruit (Passiflora edulis Sims). Horticult. Res. 8, 1–14. doi: 10.1038/s41438-020-00455-1
Xiong, J., Liu, L., Ma, X., Li, F., Tang, C., Li, Z., et al. (2020). Characterization of PtAOS1 promoter and three novel interacting proteins responding to drought in Poncirus trifoliata. Int. J. Mol. Sci. 21, 4705. doi: 10.3390/ijms21134705
Xu, G., Guo, C., Shan, H., and Kong, H. (2012). Divergence of duplicate genes in exon-intron structure. Proc. Nat. Acad. Sci. U.S.A. 109, 1187–1192. doi: 10.1073/pnas.1109047109
Xu, K., Huang, X., Wu, M., Wang, Y., Chang, Y., Liu, K., et al. (2014). A rapid, highly efficient, and economical method of Agrobacterium-mediated in planta transient transformation in living onion epidermis. PLoS ONE 9, e83556. doi: 10.1371/journal.pone.0083556
Xu, M., Li, A., Teng, Y., Sun, Z., and Xu, M. (2019). Exploring the adaptive mechanism of Passiflora edulis in karst areas via integrative analysis of nutrient elements and transcriptional profiles. BMC Plant Biol. 19, 1–16. doi: 10.1186/s12870-019-1797-8
Xue, D., Zhang, X., Lu, X., Chen, G., and Chen, Z.-H. (2017). Molecular and evolutionary mechanisms of cuticular wax for plant drought tolerance. Front. Plant Sci. 8, 621. doi: 10.3389/fpls.2017.00621
Yadav, V., Arif, N., Singh, V. P., Deshmukh, R., Sahi, S., Shivaraj, S., et al. (2020). “Roles of microRNAs in plant development and stress tolerance,” in Plant Life Under Changing Environment, eds D. Kumar Tripathi, V. Pratap Singh, N. Ramawat et al. (Cambridge, MA: Academic Press), 719–733.
Yang, L., Qiu, L., Liu, D., Kuang, L., Hu, W., and Liu, Y. (2022). Changes in the crystal morphology, chemical composition, and key gene expression of'Suichuan'kumquat cuticular waxes after hot water dipping. Sci. Hortic. 293, 110753. doi: 10.1016/j.scienta.2021.110753
Yang, S. U., Kim, H., Kim, R. J., Kim, J., and Suh, M. C. (2020a). AP2/DREB transcription factor RAP2. 4 activates cuticular wax biosynthesis in Arabidopsis leaves under drought. Front. Plant Sci. 11, 895. doi: 10.3389/fpls.2020.00895
Yang, X., Feng, T., Li, S., Zhao, H., Zhao, S., Ma, C., et al. (2020b). CER16 inhibits post-transcriptional gene silencing of CER3 to regulate alkane biosynthesis. Plant Physiol. 182, 1211–1221. doi: 10.1104/pp.19.01002
Yeats, T. H., and Rose, J. K. (2013). The formation and function of plant cuticles. Plant Physiol. 163, 5–20. doi: 10.1104/pp.113.222737
Yu, C. S., Lin, C. J., and Hwang, J. K. (2004). Predicting subcellular localization of proteins for Gram-negative bacteria by support vector machines based on n-peptide compositions. Protein Sci. 13, 1402–1406. doi: 10.1110/ps.03479604
Zanca, A. S., Vicentini, R., Ortiz-Morea, F. A., Del Bem, L. E., Da Silva, M. J., Vincentz, M., et al. (2010). Identification and expression analysis of microRNAs and targets in the biofuel crop sugarcane. BMC Plant Biol. 10, 1–13. doi: 10.1186/1471-2229-10-260
Zhang, M., Zhang, P., Lu, S., Ou-Yang, Q., Zhu-Ge, Y., Tian, R., et al. (2021). Comparative analysis of cuticular wax in various grape cultivars during berry development and after storage. Front. Nutr. 1272:1272. doi: 10.3389/fnut.2021.817796
Zhang, Y., Zhu, X., Chen, X., Song, C., Zou, Z., Wang, Y., et al. (2014). Identification and characterization of cold-responsive microRNAs in tea plant (Camellia sinensis) and their targets using high-throughput sequencing and degradome analysis. BMC Plant Biol. 14, 1–18. doi: 10.1186/s12870-014-0271-x
Zhang, Y.-L., You, C.-X., Li, Y.-Y., and Hao, Y.-J. (2020). Advancesin biosynthesis, regulation, and function of apple cuticular wax. Front. Plant Sci. 11:1165. doi: 10.3389/fpls.2020.01165
Zhang, Y.-L., Zhang, C.-L., Wang, G.-L., Wang, Y.-X., Qi, C.-H., You, C.-X., et al. (2019a). Apple AP2/EREBP transcription factor MdSHINE2 confers drought resistance by regulating wax biosynthesis. Planta 249, 1627–1643. doi: 10.1007/s00425-019-03115-4
Zhang, Y.-L., Zhang, C.-L., Wang, G.-L., Wang, Y.-X., Qi, C.-H., Zhao, Q., et al. (2019b). The R2R3 MYB transcription factor MdMYB30 modulates plant resistance against pathogens by regulating cuticular wax biosynthesis. BMC Plant Biol. 19, 1–14. doi: 10.1186/s12870-019-1918-4
Zhao, C., Xia, H., Cao, T., Yang, Y., Zhao, S., Hou, L., et al. (2015). Small RNA and degradome deep sequencing reveals peanut microRNA roles in response to pathogen infection. Plant Mol. Biol. Rep. 33, 1013–1029. doi: 10.1007/s11105-014-0806-1
Zhao, H., Zhang, H., Cui, P., Ding, F., Wang, G., Li, R., et al. (2014). The putative E3 ubiquitin ligase ECERIFERUM9 regulates abscisic acid biosynthesis and response during seed germination and postgermination growth in Arabidopsis. Plant Physiol. 165, 1255–1268. doi: 10.1104/pp.114.239699
Zheng, H., Rowland, O., and Kunst, L. (2005). Disruptions of the Arabidopsis enoyl-CoA reductase gene reveal an essential role for verylong-chain fatty acid synthesis in cell expansion during plant morphogenesis. Plant Cell 17, 1467–1481. doi: 10.1105/tpc.104.030155
Keywords: cuticle wax biosynthesis, synteny, gene ontology, micro-RNA, stress conditions
Citation: Rizwan HM, Waheed A, Ma S, Li J, Arshad MB, Irshad M, Li B, Yang X, Ali A, Ahmed MAA, Shaheen N, Scholz SS, Oelmüller R, Lin Z and Chen F (2022) Comprehensive Genome-Wide Identification and Expression Profiling of Eceriferum (CER) Gene Family in Passion Fruit (Passiflora edulis) Under Fusarium kyushuense and Drought Stress Conditions. Front. Plant Sci. 13:898307. doi: 10.3389/fpls.2022.898307
Received: 17 March 2022; Accepted: 27 April 2022;
Published: 27 June 2022.
Edited by:
Mohammad Anwar Hossain, Bangladesh Agricultural University, BangladeshReviewed by:
Muhammad Azhar Nadeem, Sivas University of Science and Technology, TurkeyCopyright © 2022 Rizwan, Waheed, Ma, Li, Arshad, Irshad, Li, Yang, Ali, Ahmed, Shaheen, Scholz, Oelmüller, Lin and Chen. This is an open-access article distributed under the terms of the Creative Commons Attribution License (CC BY). The use, distribution or reproduction in other forums is permitted, provided the original author(s) and the copyright owner(s) are credited and that the original publication in this journal is cited, in accordance with accepted academic practice. No use, distribution or reproduction is permitted which does not comply with these terms.
*Correspondence: Zhimin Lin, bGluemhpbWluQGZhYXMuY24=; Faxing Chen, ZnhjaGVuQGZhZnUuZWR1LmNu
Disclaimer: All claims expressed in this article are solely those of the authors and do not necessarily represent those of their affiliated organizations, or those of the publisher, the editors and the reviewers. Any product that may be evaluated in this article or claim that may be made by its manufacturer is not guaranteed or endorsed by the publisher.
Research integrity at Frontiers
Learn more about the work of our research integrity team to safeguard the quality of each article we publish.