 Xiaojing Chen1,2*
 Zhongshan Xu1,2
 Baoping Zhao1,2Yanming Yang1,2Junzhen Mi1,2Zhou Zhao1,2
 Jinghui Liu1,2*
- 1Cereal Industry Collaborative Innovation Center, Inner Mongolia Agricultural University, Hohhot, China
- 2National Outstanding Talents in Agricultural Research and Their Innovative Teams, Hohhot, China
Oat is considered as a moderately salt-tolerant crop that can be used to improve saline and alkaline soils. Previous studies have focused on short-term salt stress exposure, and the molecular mechanisms of salt tolerance in oat have not yet been elucidated. In this study, the salt-tolerant oat cultivar Vao-9 and the salt-sensitive oat cultivar Bai5 were treated with 6 days of 0 and 150 mmol L−1 salt stress (nNaCl:nNa2SO4 = 1:1). Label-Free technology was then used to analyze the differentially expressed proteins in leaves under 0 and 150 mmol L−1 salt stress. The obtained results indicated that total of 2,631 proteins were identified by mass spectrometry in the four samples. The salt-tolerant cultivar Vao-9 mainly enhances its carbohydrate and energy metabolism through the pentose and glucuronate interconversions, and carbon fixation pathways in prokaryotes, thereby reducing the damage caused by salt stress. In addition, the down-regulation of ribosomes expression and the up-regulated expression of HSPs and CRT are all through the regulation of protein synthesis in response to salt stress. However, GABA metabolism presents a different synthesis pattern in Bai5 and Vao-9. The main KEGG function of differential expressed protein (DEP) in Bai5 is classified into protein processing in the endoplasmic reticulum, estrogen signaling pathway, antigen processing and presentation, longevity regulating pathway-multiple species, arginine and proline metabolism, beta-alanine metabolism, vitamin B6 metabolism, salmonella infection, chloroalkane and chloroalkene degradation, and limonene and pinene degradation. Moreover, the main KEGG functions of DEP in Vao-9 are classified as ribosome and carbon fixation pathways in prokaryotes, pentose and glucuronate interconversions, GABA ergic synapse, and taurine and hypotaurine metabolism. The results obtained in this study provide an important basis for further research on the underlying mechanisms of salt response and tolerance in oat and other plant species.
Introduction
Soil salinization has become an important agricultural issue, with the global saline-alkali land area covering approximately 800 million hectares. It is estimated that, globally, soil salinity affects 80 million hectares of cultivated land (Zhang et al., 2012). Previous studies have reported that salinity is one of the main factors restricting the growth of crops (Flowers and Colmer, 2008), because it can cause ion imbalance, hyperosmotic stress, and oxidative damage in plants (Mahajan and Tuteja, 2005; Chinnusamy et al., 2006; Tuteja, 2007). To prevent the potentially harmful effects of such stresses, plants have evolved sophisticated mechanisms to recognize external signal networks and serve as evidence for adaptive responses at the physiological, biochemical, and molecular levels (Nam et al., 2017).
In recent years, sequencing of many plant genomes has been completed, which has led to many researchers exploring the function of various genes. Several previous studies have identified and cloned some proteins such as osmotic pressure-synthesizing protein (Verbruggen et al., 1993), ion channels (Horie et al., 2001), signal transduction pathways, and other important genes of enzymes associated with salt stress (Zhu, 2002; Hu et al., 2006). The studies have revealed the basic functions of these genes in response to salt stress. However, the mRNA levels are usually not associated with the protein expression levels due to the variable splicing of transcription and post-translational modifications (such as phosphorylation and glycosylation). It is worth noting that the protein expression levels are more directly associated with signal transduction and metabolic processes under salt stress. Therefore, it is important to study salt stress response at the protein level.
Analyzing the salt-responsive proteome in plants provides more information for understanding the complex mechanisms of plant salt tolerance. Currently, about 2,100 salt-responsive proteins have been identified in the buds, leaves, roots, seedlings, radicles, and hypocotyls of arabidopsis (Pang et al., 2010), barley (Witzel et al., 2009; Rasoulnia et al., 2011), wheat (Peng et al., 2009; Jacoby et al., 2010), sugar beet (Wang et al., 2019) and other crops. The proteins are involved in changes targeting photosynthesis, active oxygen scavenging system, ion homeostasis, osmotic homeostasis, membrane transport, signal transduction, protein synthesis, and other pathways. This general information has laid a solid foundation for further research on the molecular mechanism of salt tolerance in plants. However, a previous study reported that different crops or varieties of the same crop have different salt tolerance mechanisms (Guo et al., 2012).
Oat (Arena sativa L.), an annual gramineous herb used as a food and feed crop, has the characteristics of salt-alkali tolerance, barren tolerance, and cold resistance. It has become a pioneer crop for improving saline-alkali land. Presently, the research on oats salt tolerance mainly focuses on ion absorption and accumulation, physiological changes of oats mediated by exogenous substances (Gao et al., 2019), transcriptome (Wu et al., 2018), metabolome (Xu et al., 2021) and proteome. However, only a single species has been selected for research (Bai et al., 2016), and thus the molecular mechanism of salt tolerance between the species has not yet been elucidated. The cultivation of oats in China is mainly concentrated in the semi-arid farming and pastoral areas in the northwest and the high-altitude mountainous areas in the southwest, with Inner Mongolia province having the largest planting area. The saline soil of Inner Mongolia mainly contains Na+, K+, Cl−, and SO42− salt ions, and the ratio of Cl− to SO42− is about 1. Therefore, the Label-Free technology was used in this study to compare the leaves of salt-sensitive varieties (Bai5) and salt-tolerant varieties (Vao-9) under 150 mmol L−1 (nNaCl: nNa2SO4 = 1:1) salt stress. In this study, we address two questions: (1) What are the proteins that are involved in the oat salt stress response? (2) What biological processes/pathways are these proteins involved in? The results obtained in this study will provide a more effective scientific basis and theoretical basis for crop salt tolerance breeding.
Materials and Methods
Plant Culture and Salt Treatment
The salt-tolerant oat cultivar Vao-9 selected by Ottawa Research and Development Centre, Agriculture and Agri-Food Canada and the salt-sensitive variety Bai5 were obtained from Baicheng Academy of Agricultural Sciences (Xu et al., 2021). This study was conducted in the greenhouse at the Oat Research Center of Inner Mongolia Agricultural University. Thirty seeds of each variety were sown in a plastic bucket (the upper diameter of the bucket was 24 cm, the lower diameter was 22 cm, and the height was 25 cm) filled with the substrate (sand: vermiculite: ceramsite = 3:1:2). After emergence, the seedlings were thinned to 20 plants per bucket. It is worth noting that five round holes with a diameter of 4 mm were drilled at the bottom of each bucket for water flow and ventilation. The plants were fed with 250 ml of Hogland nutrient solution three times a week. The oats were then treated with 100 and 150 mmol L−1 salt stress at the three-leaf stage (molar concentration NaCl:Na2SO4 = 1:1 mixed in the nutrient solution) for 6 days, and the same volume of nutrient solution was used for the control plants. This was followed by the sample collection process where 2 g leaf samples for each treatment and the control were transferred to 1.5 ml cryopreservation tubes. Incubation conditions were 16 h of light at 25°C, 8 h of darkness at 20°C, humidity at 70%. The samples were then quickly frozen in liquid nitrogen, and stored at −80°C for physiological index detection. Proteomics analysis was then conducted for CK and 150 mmol L−1 processed samples.
Physiological Analysis
For ion concentration determination, root samples were dried in an oven at 70°C for 3 days, then digested in a concentrated nitric acid at 140°C. K+, Na+, Ca2+, and Mg2+ contents in the digested solution were determined using an inductively coupled plasma-optical emission spectrometer (iCAP 6000 series, Thermo Fisher scientific, United States) as per the manufacturer’s instructions. Superoxide Dismutase(SOD), Peroxide(POD), malondialdehyde (MDA) and proline content were measured using Assay Kit A001-1-1, A084-3, A005, A123, A003-1, and A145, respectively, (Nanjing Jiancheng Bioengineering Institute, China). We performed One-Way ANOVA analysis using the SPSS software (IBM SPSS Statistics Version19.0) to associations of different index between the treatments. Value of p ≤ 0.05 and p ≤ 0.01 were considered significant and highly significant, respectively.
Extraction of Total Protein From Oat Leaves
The frozen samples were crushed using a crusher pre-cooled with liquid nitrogen, and liquid nitrogen was then used to grind the crushed powder. The powder was added to the lysis buffer [100 mM NH4HCO3(pH 8),6 M Urea and 0.2% SDS] according to 1:10 (w/v) ratio, followed by vortexing. Ultrasound was then conducted for 60 s at 0.2 s on, followed by 2 s off at 22% amplitude. The proteins were then extracted at room temperature for 30 min, followed by centrifugation at 15,000 × g for 1 h at 10°C. The supernatant was then collected, divided, and frozen at −80°C after loading.
Protein Quantification
The Bradford (1976) method was used to determine the protein concentration of each sample. The protein concentration of each sample (μg μl−1) was calculated according to the curve formula. BSA standard protein solutions and sample solutions with different dilution multiples were added into 96-well plate to fill up the volume to 20 μl, respectively. Each gradient was repeated three times. The plate was added 180 μl G250 dye solution quickly and placed at room temperature for 5 min, the absorbance at 595 nm was detected. The standard curve was drawn with the absorbance of standard protein solution and the protein concentration of the sample was calculated. Twenty microgram of the protein sample was loaded to 12% SDS-PAGE gel electrophoresis, wherein the concentrated gel was performed at 80 V for 20 min, and the separation gel was performed at 120 V for 90 min. The gel was stained by coomassie brilliant blue R-250 and decolored until the bands were visualized clearly.
Proteolysis (Filter Aided Sample Preparation)
After protein quantification, 200 μg protein solution was transferred to a centrifuge tube followed by the addition of DTT to make a final concentration of 25 mmol L−1. The solution was then reacted at 60°C for 1 h, followed by the addition of iodoacetamide to make a final concentration of 50 mmol L−1. The solution was then kept at room temperature for 10 min. After reductive alkylation, the protein solution was added to a 10 K ultrafiltration tube, and centrifuged at 12,000 × g for 20 min. After centrifugation, the solution at the bottom of the tube was collected followed by the addition of 100 μl Dissolution buffer which containing 0.1 M triethylammonium bicarbonate (TEAB, pH 8.5) and 6 M urea. The solution was centrifuged at 12,000 × g for 20 min, and then the solution at the bottom of the collection tube was discarded and the process was repeated three times. Trypsin was then added to the new ultrafiltration tube to make a solution with a total protein mass of 4 μg (mass ratio to protein was 1:50) and volume of 50 μl. The reaction was then incubated overnight at 37°C. The next day, the solution was centrifuged at 12,000 × g for 20 min, and the peptide solution at the bottom of the tube after enzymatic digestion by centrifugation was collected. Fifty microliter dissolution buffer was then added to the ultrafiltration tube, followed by centrifugation at 12,000 × g for 20 min. The obtained solution at the bottom of the ultrafiltration tube was then combined with the solution in the previous step to obtain a total solution of 100 μl in the collection tube sample after enzymolysis. Finally, the solution was lyophilized in readiness for loading.
Nano-Upgraded Reversed-Phase Chromatography-Q Exactive for Protein Analysis
Twenty microliter preconstituted 2% methanol and 0.1% formic acid were used for this experiment. The solution was centrifuged at 12,000 × g for 10 min, the supernatant drawn, and finally the sample was loaded. Ten microliter sample volume was used to load. The loading pump flow rate was 350 nl min−1 for 15 min, while the separation flow rate was 300 nl min−1.
Mass Spectrometry Data Analysis
The database uniprot-Pooideae361804_20170619.fasta. Fasta (362,934 sequences) was used. Mass spectrometry analysis was done using a Thermo Q Exactive mass spectrometer. Peptide Spectrum Matches (PSMs) with more than 95% reliability were trusted PSMs, while the proteins which contains at least one unique peptide (specific peptides) were the trusted proteins. It is worth noting that this study only used trusted peptides and proteins, and FDR verification was used to remove peptides with FDR greater than 1% and egg whites. The protein was different between the pairs of samples to be compared in the different replicate groups, and the mean value of the different multiples was used as the multiple of the difference between the two samples. T-test was then used to obtain the value of p, which was used as the significance index.
Data Processing and Bioinformatics Analysis
Microsoft Excel 2010 and SAS 9.0 software were used for the statistical analysis of all the data obtained in this study. Common functional database annotations were performed for the identified proteins, including COG, GO, and KEGG databases. A series of differential protein functional analysis such as GO and KEGG functional enrichment analysis were then performed for the selected differentially expressed proteins.
Real-Time Quantitative Reverse Transcription PCR Analysis
All qRT-PCR experiments were run in triplicates on a Light-Cycler Roche 480 instrument (Roche Applied Science, Mannheim, Germany). Primers of choriolysin genes and actin were used as housekeeping genes (the primers shown in Table 1). mRNA level of choriolysin was estimated using 2−ΔΔCt method. Data is presented as mean ± SEM. One-way ANOVA was used for data analysis.
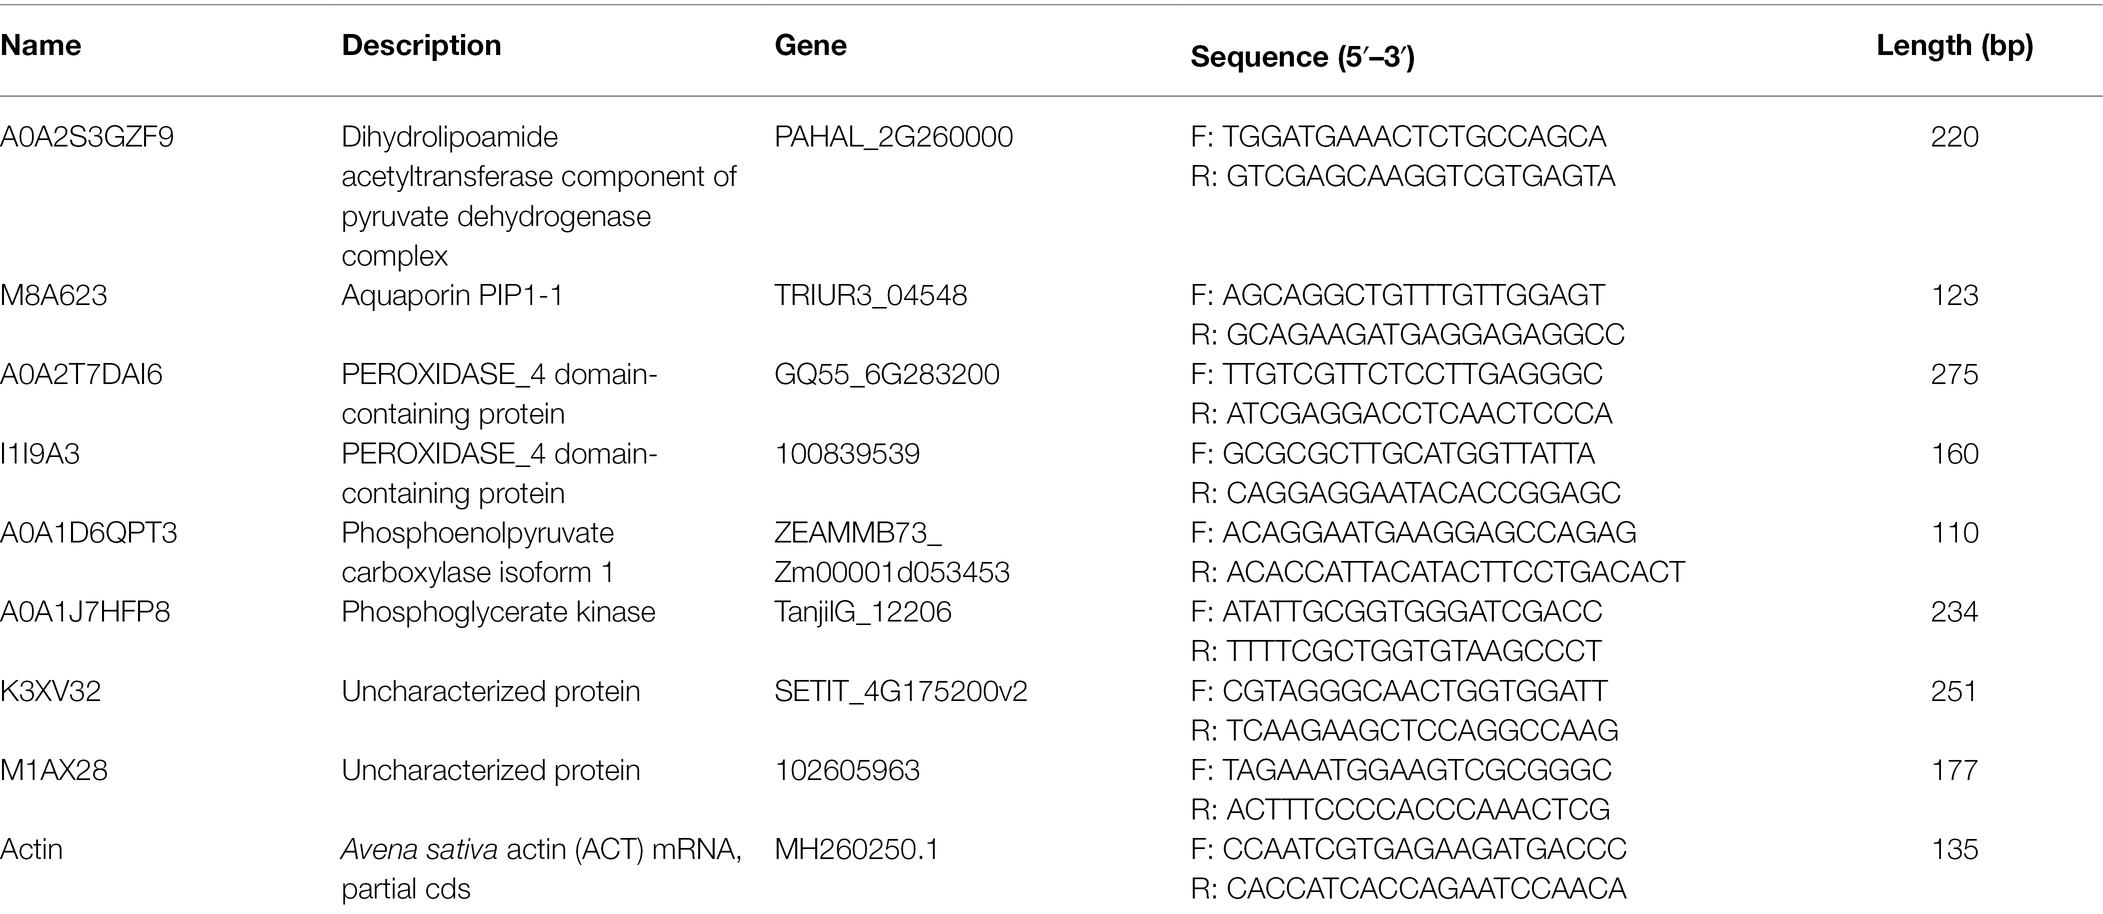
Table 1. Quantitative qRT-PCR primers.
Results
Physiological Changes of Oat Leaves in Response to Salt Stress
The K+ content in leaves of two oat cultivars decreased with the increase of salt stress concentration (Figure 1). But the three concentrations showed that K+ content of Vao-9 was higher than that of Bai5, which were 12.9%, 18.2%, and 8.8%, respectively. With the increase of salt stress concentration, the Na+ content of the leaves of the two cultivars of oat showed a gradually increasing trend. The Na+ content of Bai5 was higher than that of Vao-9 under each concentration treatment, and the difference between the two cultivars was more significant under severe stress. The Ca2+ content in leaves of the two cultivars of oat decreased with the increase of salt stress concentration. The Ca2+ content of Vao-9 was higher than that of Bai5 under each concentration treatment, which were 8.8%, 12.8%, and 22.5%, respectively. The change trend of Mg2+ content in leaves of two varieties of oat was the same as that of Ca2+, and both decreased with the increase of salt stress concentration.
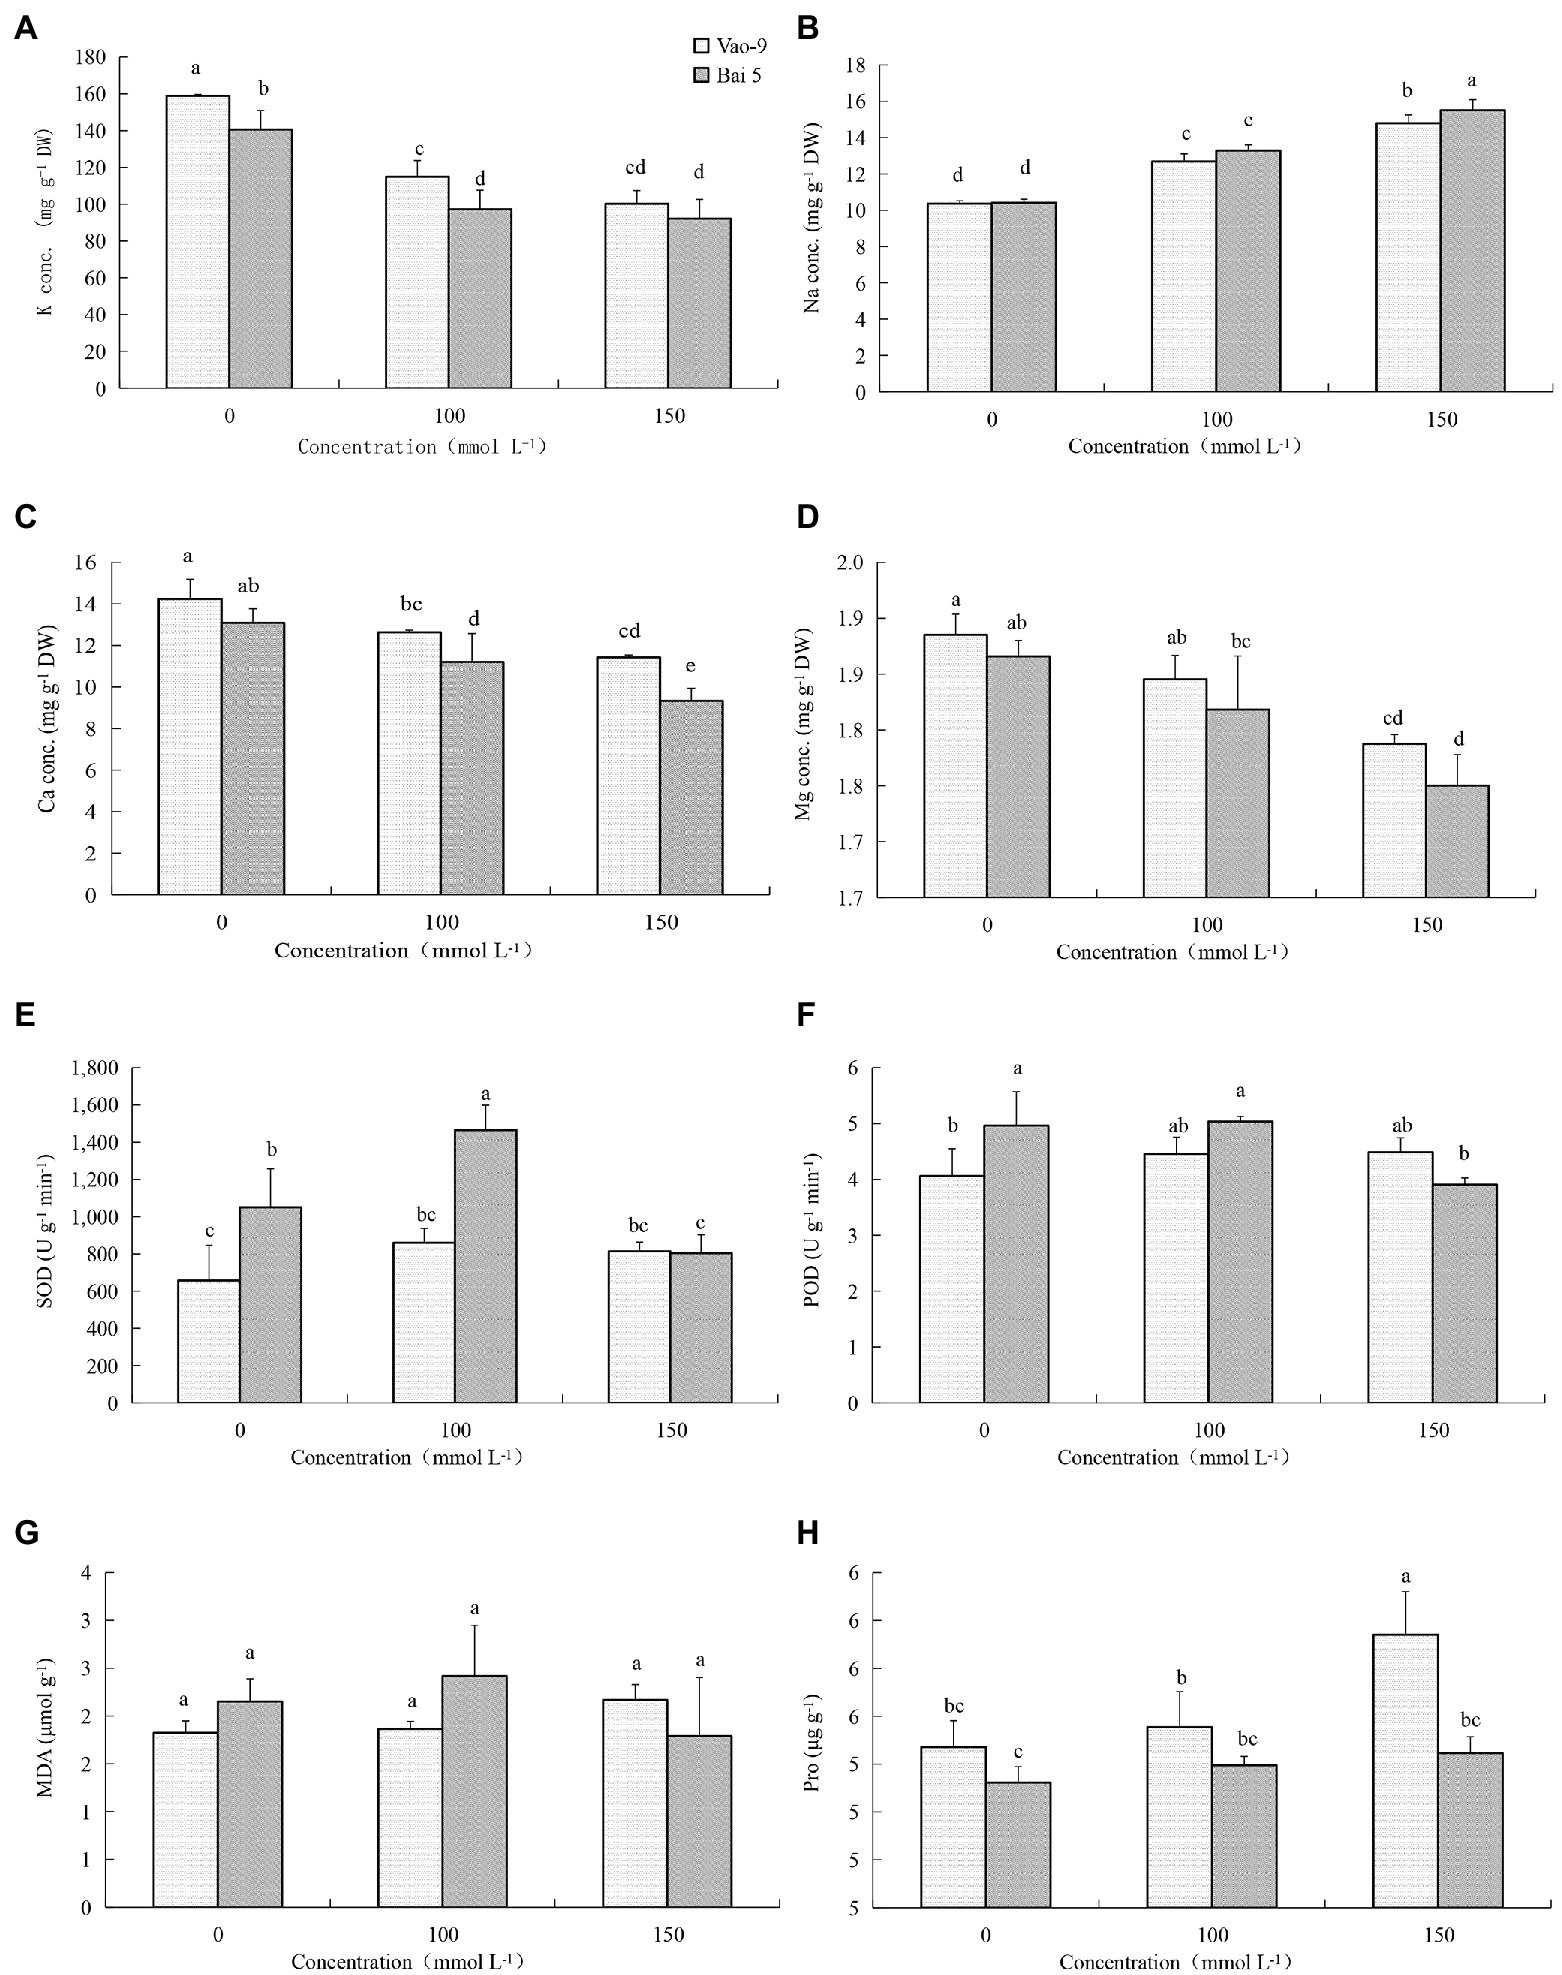
Figure 1. Physiological changes in the leaves of Vao-9 and Bai5 under normal and salt stress conditions. Contents of K+ (A), Na+ (B), Ca2+ (C), Mg2+ (D), SOD (E), POD (F), MDA (G), and Pro (H) were determined in the leaves of Vao-9 and Bai5 after salt treatments and CK. Data are means ± SD of three biological replicates (n = 3) and different letters indicate significant difference at p < 0.05 by the One-Way ANOVA test.
SOD enzyme activity of Vao-9 leaves increased with the increase of salt stress concentration, and the moderate and severe stress increased by 30.8% and 24.5% compared with CK, respectively; SOD enzyme activity of Bai5 leaves increased first and then decreasing trend. POD enzyme activity of Vao-9 increased but it increased first and then decreased in Bai5 with the increase of salt stress concentration. The variation trend of MDA content in oat leaves was consistent with SOD and POD. The content of MDA in Vao-9 leaves under moderate and severe stress increased by 2.7% and 19.2%, respectively, compared with CK. The content of Pro in leaves of two oat cultivars increased with the increase of salt stress concentration. The Pro content of Vao-9 was higher than that of Bai5 among all treatments, and only under severe stress showed differences among cultivars, which were 1.5%, 1.5%, and 4.6%, respectively.
The Effect of Salt Stress on Quantitative Proteome
A total of 2,631 proteins including 2,471 in Bai5 and 2,493 in Vao-9 were qualitatively obtained by mass spectrometry using the Label-Free method. Among the obtained total proteins, 138 were specific in Bai5 while 160 were specific in Vao-9. In addition, 2,333 proteins were shared by the two varieties, accounting for 88.7% of the total number. The 2,631 proteins identified by mass spectrometry were screened according to the fold change >2 or <0.65 (p < 0.05), and a total of 262 differential expressed proteins (DEPs) were obtained. Among them, there were 76 proteins in Bai5 where 51 were up-regulated and 25 were down-regulated. On the other hand, 141 of the 214 proteins in Vao-9 were up-regulated while 73 were down-regulated. However, only 28 of the selected 262 DEPs were co-expressed in the two varieties, accounting for 10.7% of the total, which was far smaller than the 88.7% of the co-expressed proteins in the total protein. Specifically, 48 of the 262 DEPs were expressed in Bai5, while 186 were expressed in Vao-9. This accounts for 18.3% and 71%, respectively, of the total number of DEPs [the vast majority (89.3%) of DEPs]. Moreover, both groups of DEPs were specifically expressed in the two varieties. For the 28 DEPs co-expressed in the two varieties, 18 were up-regulated and 10 were down-regulated (Table 2).
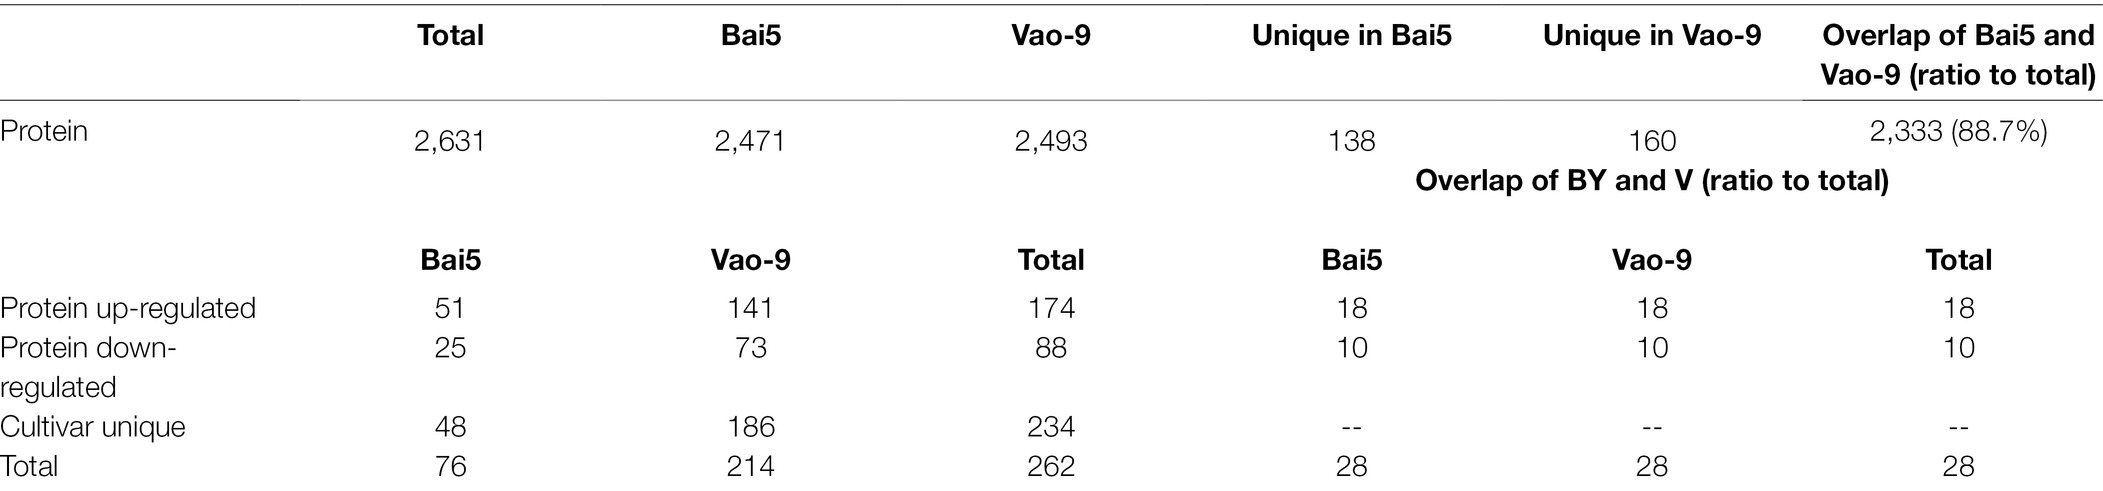
Table 2. Number of proteins and DEPs identified from the samples (>2 or <0.65-fold change, p < 0.05).
Hierarchical Cluster Analysis of DEPs
All the selected DEPs were analyzed using hierarchical clustering according to the obtained Label-Free protein abundance data. The 12 samples analyzed included the control and salt treatment for the two varieties, and the experiment was replicated three times. The obtained results indicated that the three samples each for BYC, BYS, VC, and VS were directly replicated, and there were significant differences between the treatment and CK. In addition, the changes in protein abundance obtained by cluster analysis not only illustrated the huge and complex changes at the proteome level, but also the diversity of expression levels of the two varieties after salt stress (Figure 2).
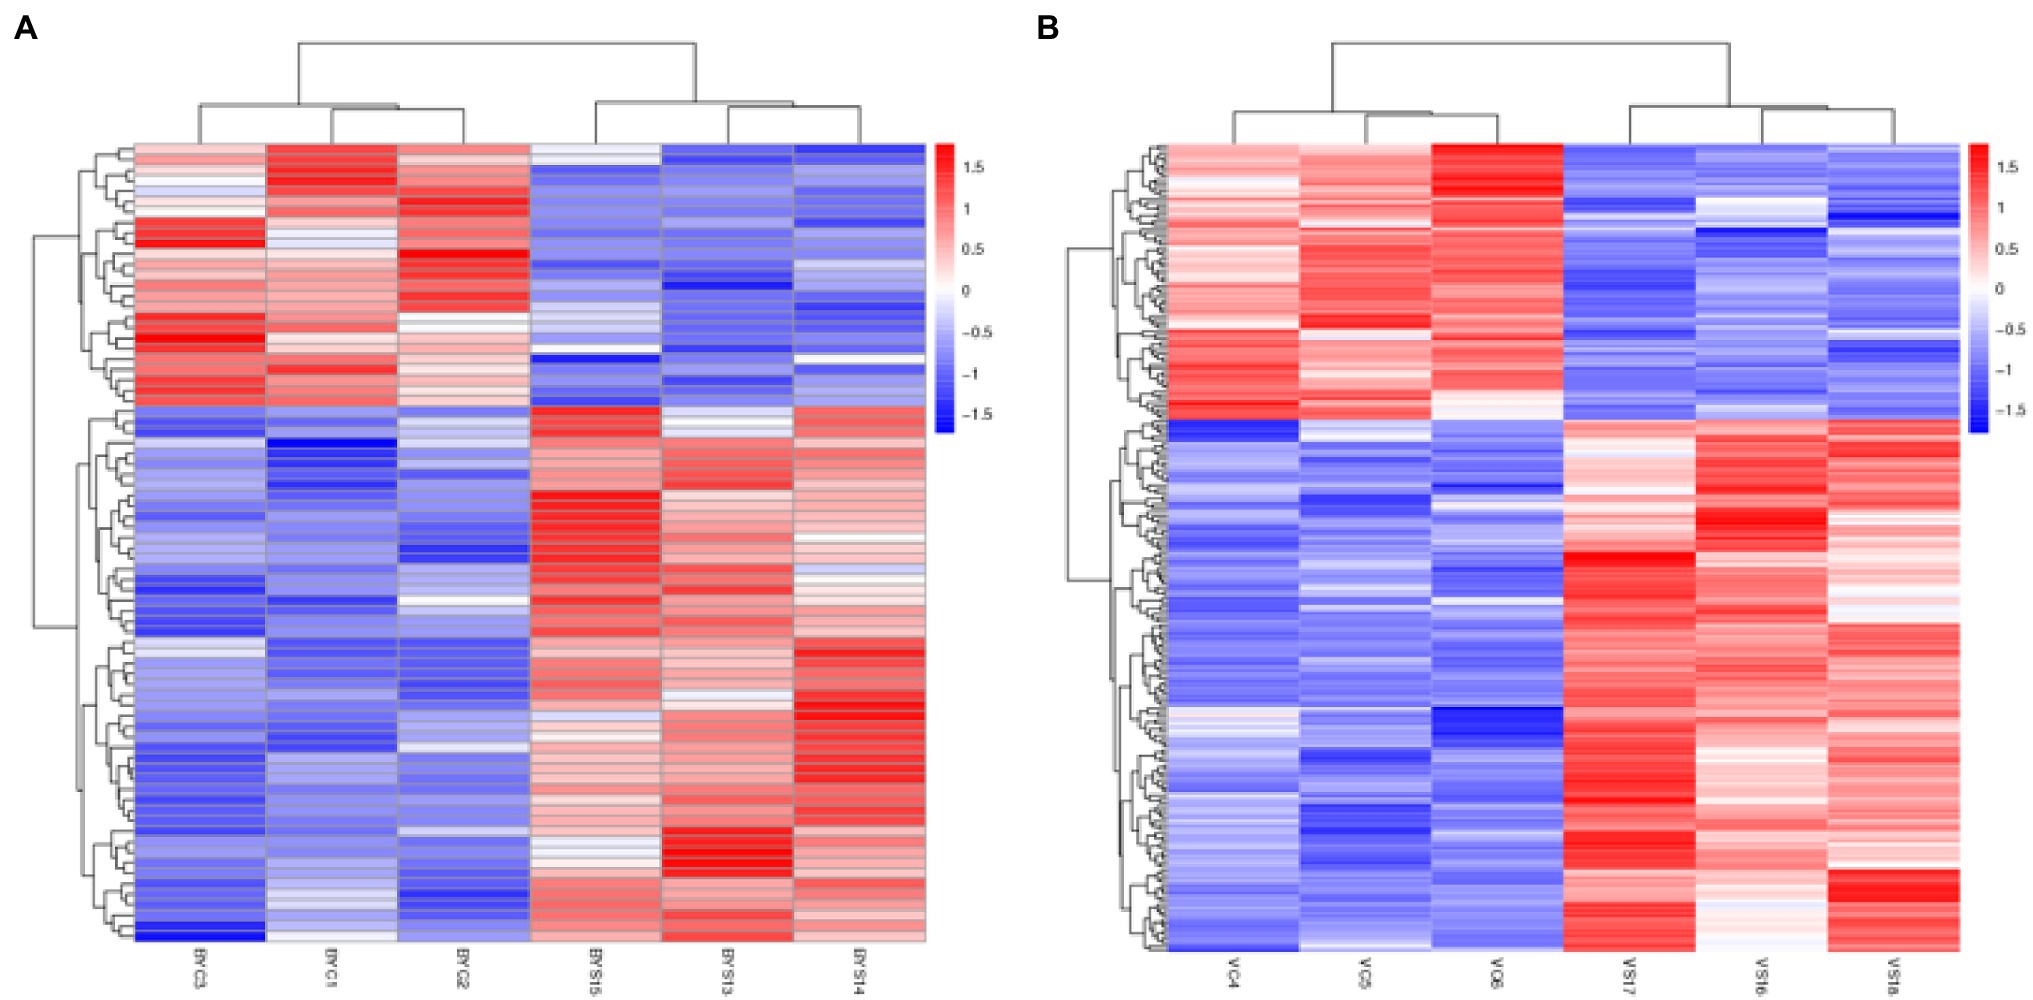
Figure 2. Hierarchical cluster analysis of the differential expressed proteins (DEPs). (A) Hierarchical cluster analysis of the DEPs in Bai5; (B) hierarchical cluster analysis of the DEPs in Vao-9. BYC1, BYC2, BYC3, represent CK samples with three replicates; BYS13, BYS14, BYS15, represent the treated (nNaCl:nNa2SO4 = 1:1) 150 mmol L−1 with three replicates; VC4, VC5, VC6 represent CK samples with three replicates; and VS16, VS17, VS18, represent the treated (nNaCl:nNa2SO4 = 1:1) 150 mmol L−1 with three replicates.
Identification and Classification of DEPs
According to the GO database, we used biological process (BP), cellular component (CC), and molecular function (MF) to perform functional analysis of the DEPs (Figure 3). The obtained results indicated that the functional annotations between the two varieties are similar. The main categories of BP were oxidation–reduction process and translation, while the main categories of CC were ribosome and intracellular. Furthermore, the main categories of MF were oxidoreductase activity, ATP binding, and structural constituent of ribosome. The main KEGG functions of the DEPs in Bai5 were classified into protein processing in the endoplasmic reticulum, estrogen signaling pathway, antigen processing and presentation, longevity regulating pathway-multiple species, arginine and proline metabolism, beta-alanine metabolism, vitamin B6 metabolism, salmonella infection, chloroalkane and chloroalkene degradation, and limonene and pinene degradation. On the other hand, the main KEGG function classification of the DEPs in Vao-9 were ribosome, carbon fixation pathways in prokaryotes, pentose and glucuronate interconversions, GABA ergic synapse, and taurine and hypotaurine metabolism.
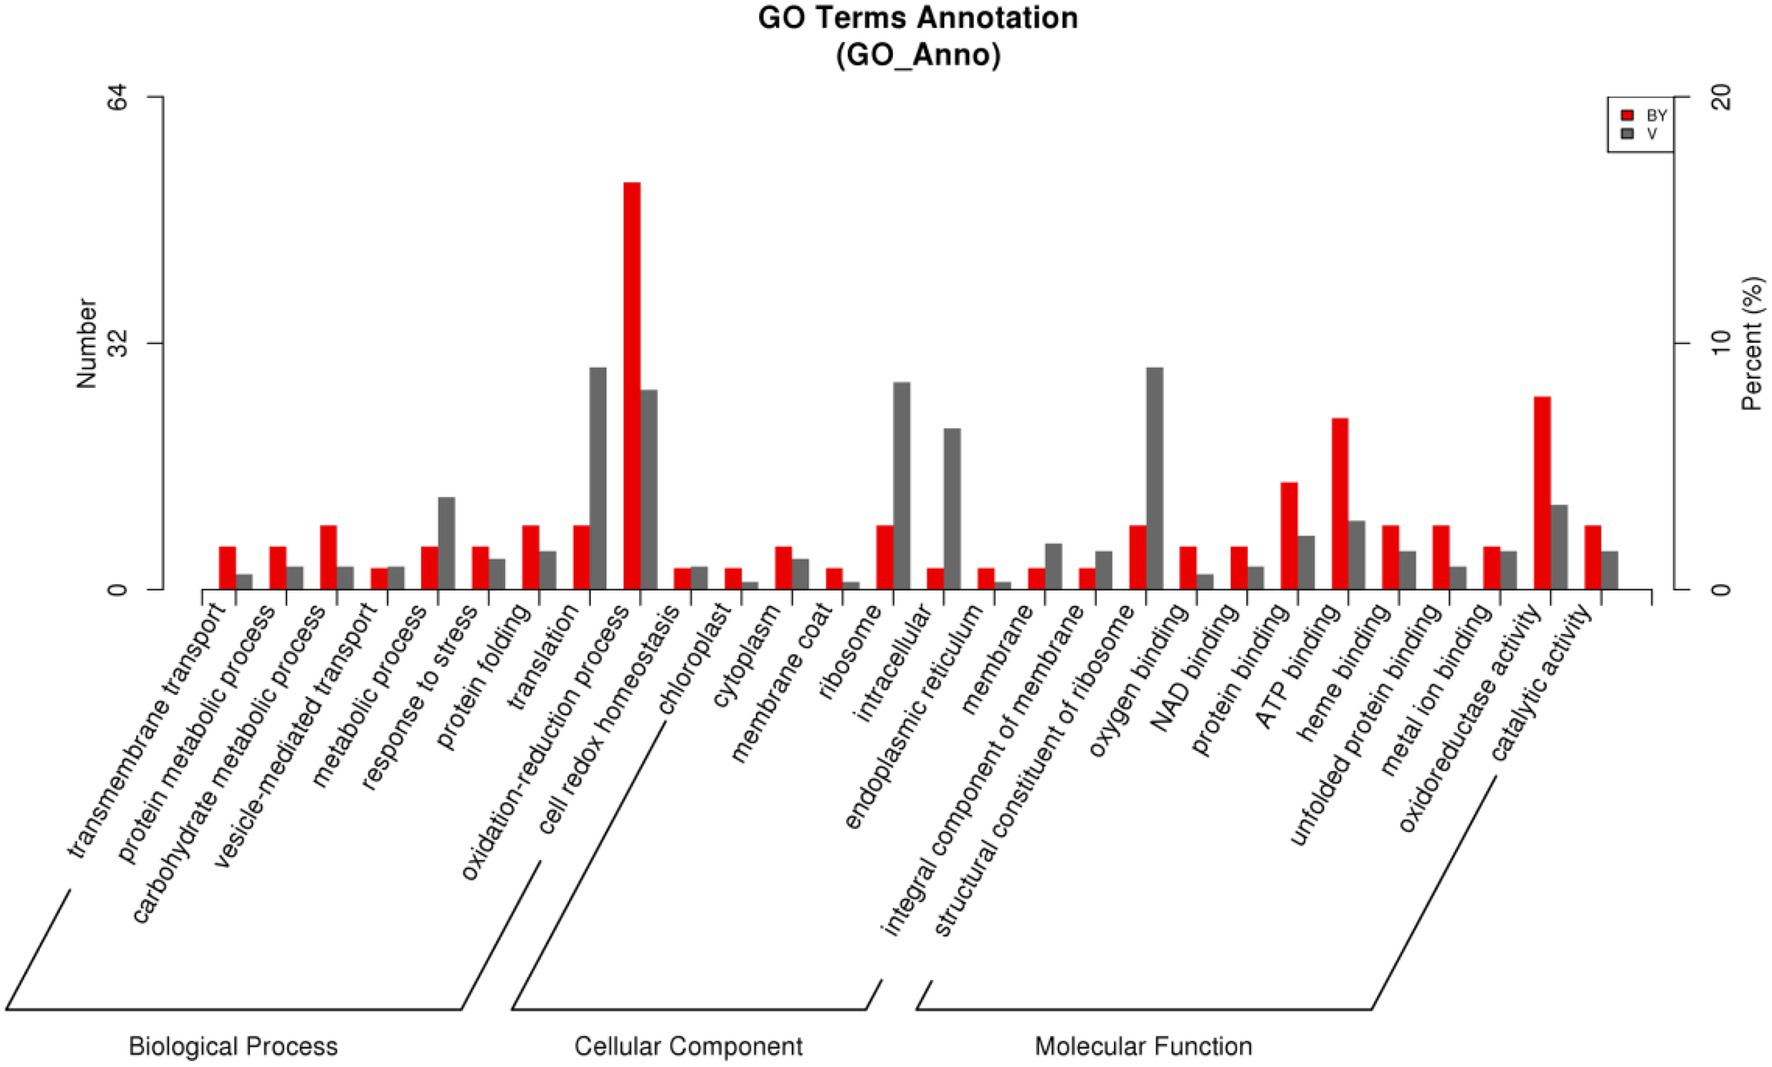
Figure 3. GO function classification of the DEPs.
In addition, the number of DEPs in the main functional categories in the two varieties were compared (Table 3). They include carbohydrate and energy metabolism, photosynthesis and electron transport chain, signal sensing and transduction, protein synthesis, and second metabolism. More proteins involved in carbohydrate and energy metabolism, protein synthesis and second metabolism were found in Vao-9 than in Bai5. Finally, the table shows candidate DEPs showing important functions or tissue-specific expression profiles in the two varieties, while the figure shows their relationship in the main functional categories (Figures 4, 5; Table 4).
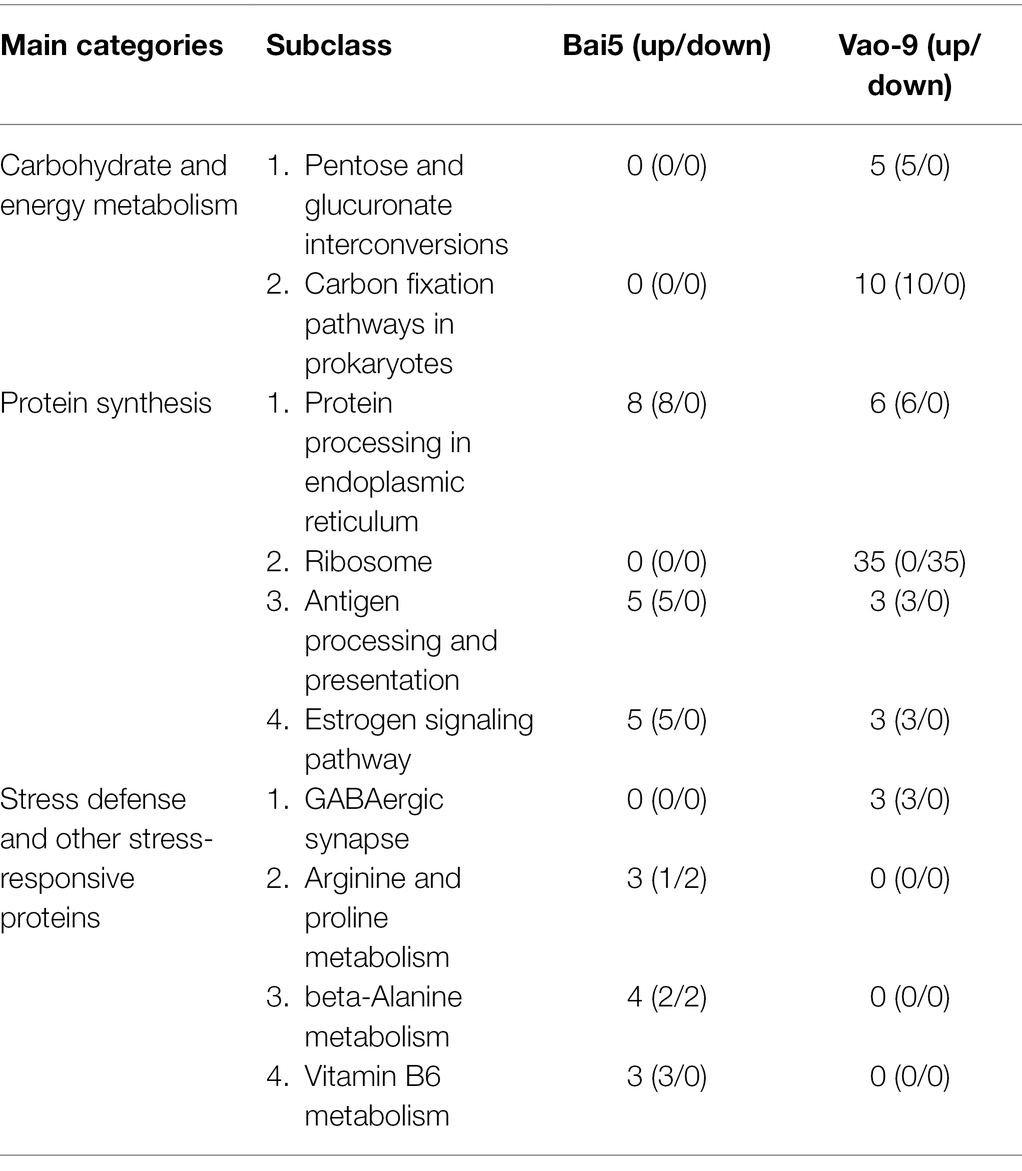
Table 3. The numbers of DEPs from main functional categories in Bai5 and Vao-9.
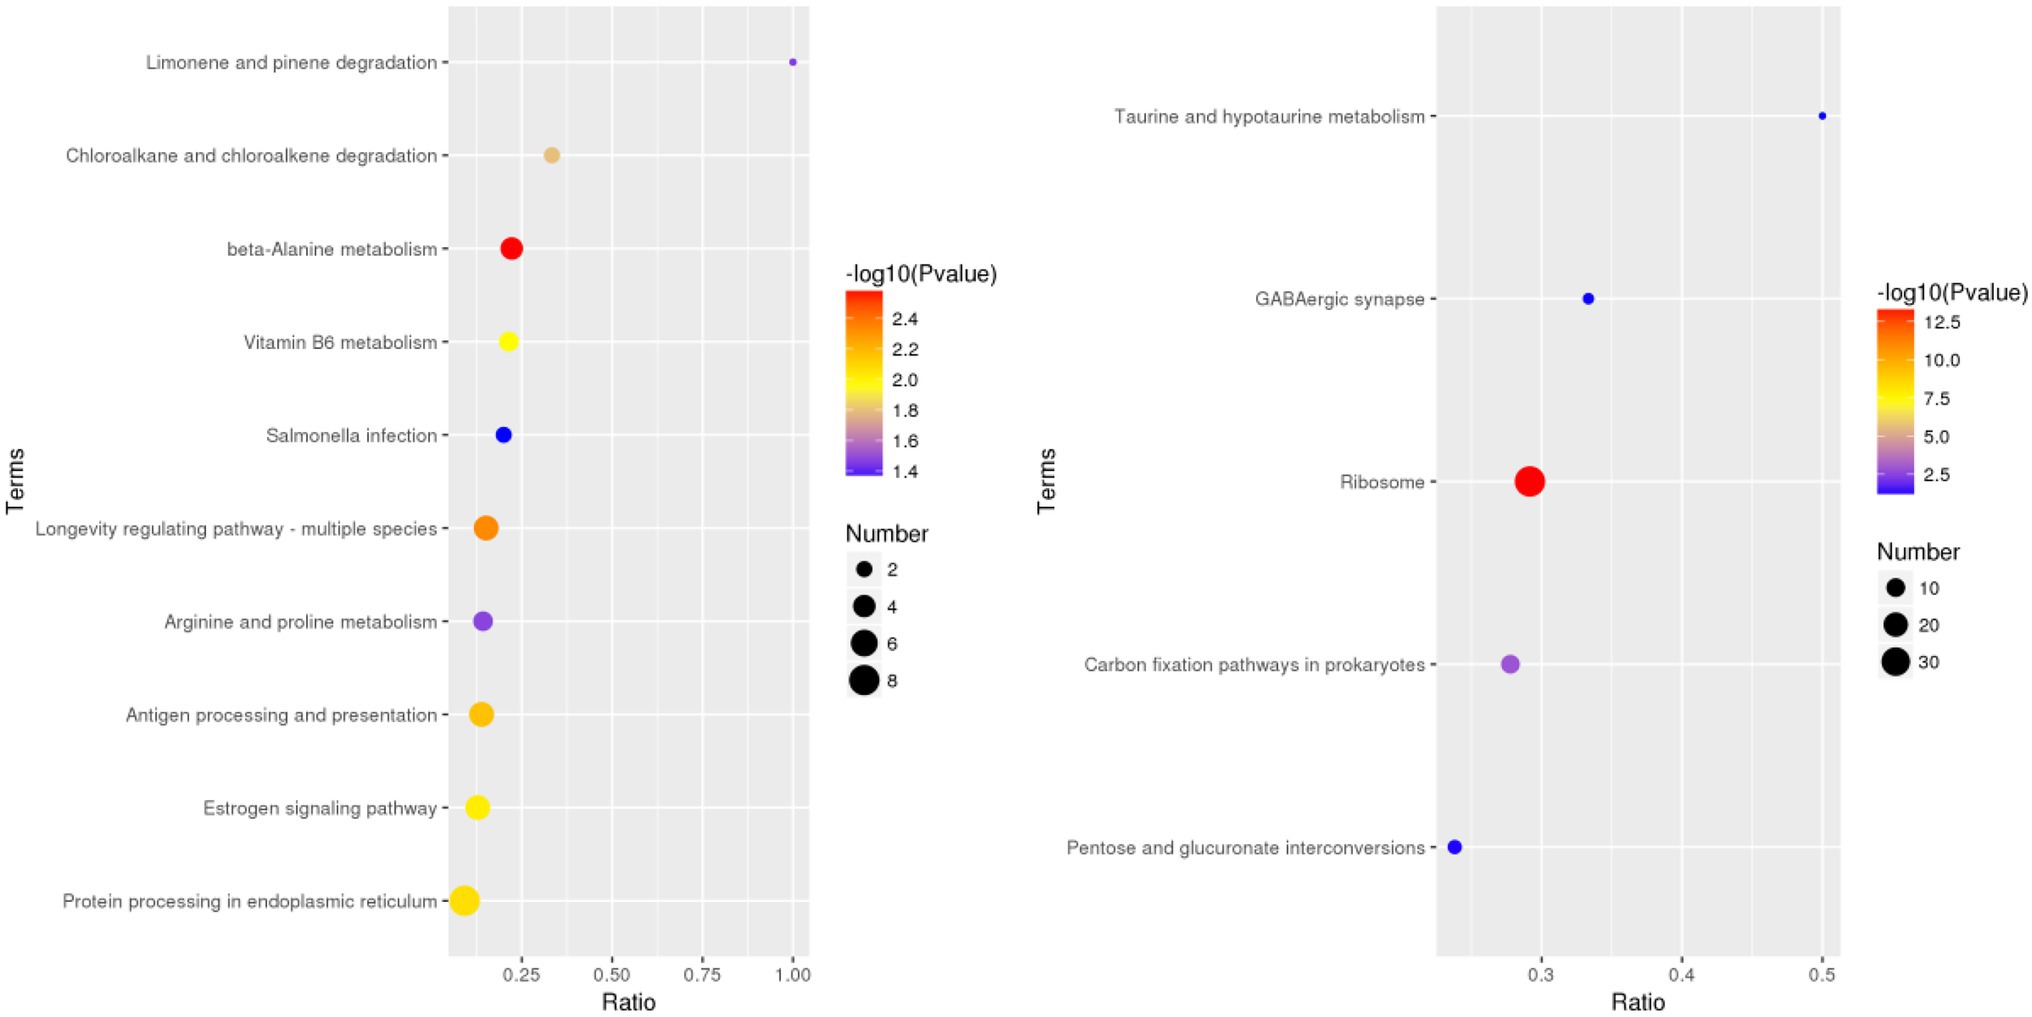
Figure 4. KEGG pathway enrichement analysis of the DEPs in Bai5 and Vao-9.
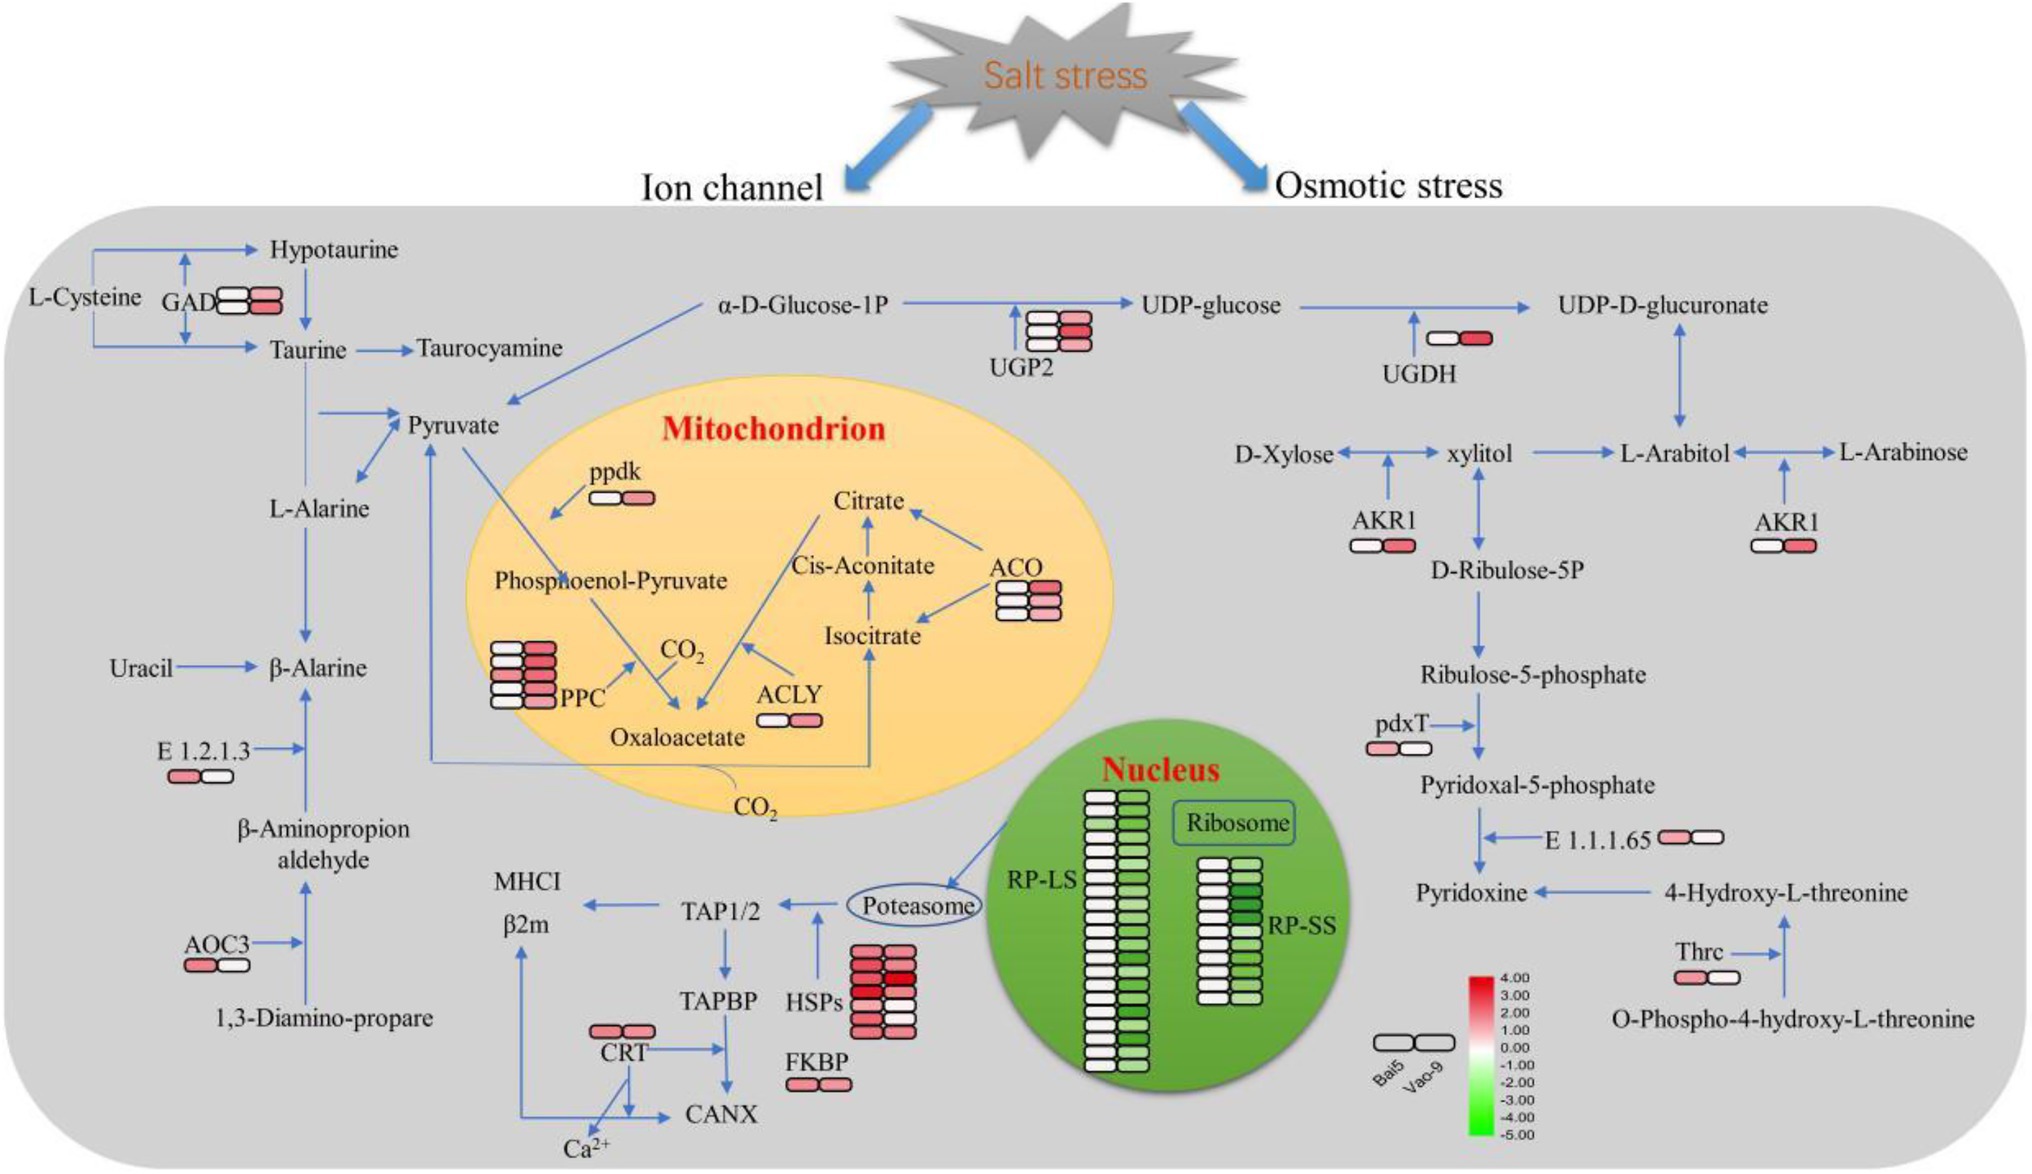
Figure 5. Schematic presentation of the critical salt stress responsive proteins in oats. The fold change of DEPs are indicated by color filled in the squars on the right (see color key). The left square represents the fold change in Bai5 and the right square represents the fold change in Vao-9. The particular definition and fold change of proteins are in Table 4.
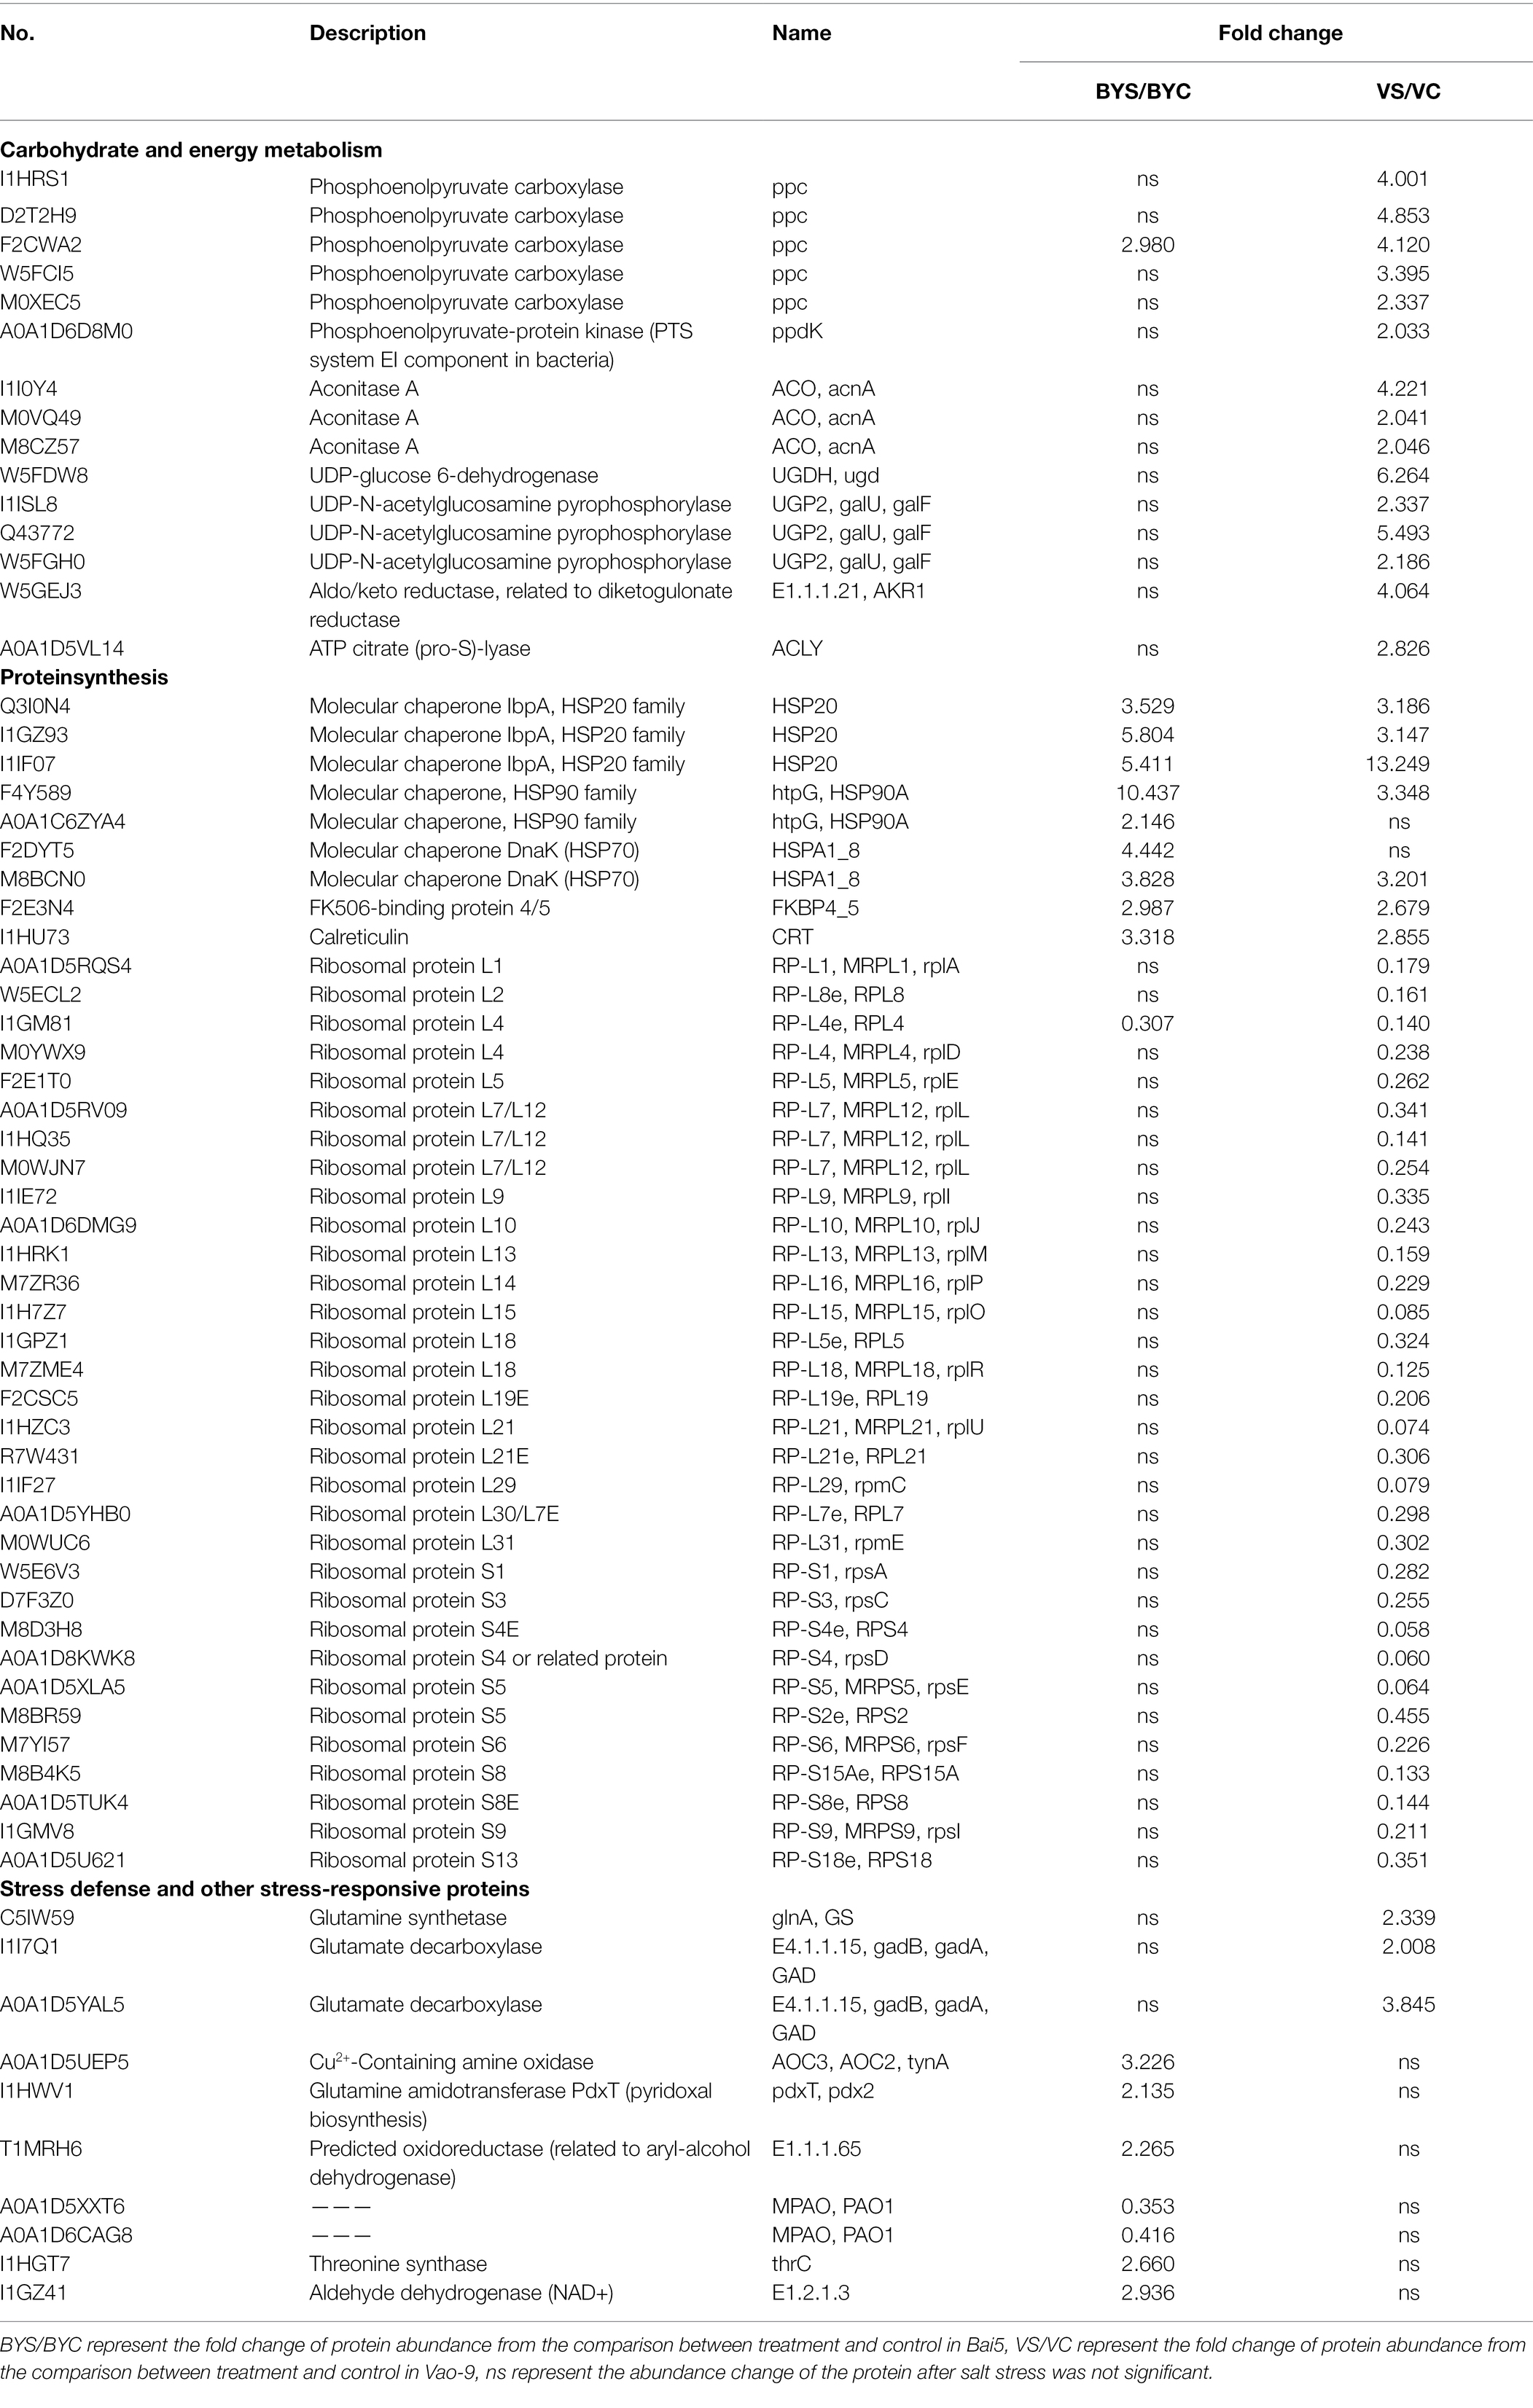
Table 4. The candidate DEPs from main functional categories in Bai5 and Vao-9.
Validation of the Transcript of DEPs by Real-Time Quantitative PCR
Eight candidate differential proteins shared by the leaves of the two cultivars of oat were selected randomly and their transcription levels were determined by qRT-PCR as a reference for the verification of protein expression results. The designed primers are shown in Table 1, and the results are shown in Figure 6. Candidate protein abundance changes were consistent with transcript expression trends. This analysis can improve the confidence of the proteomic data.
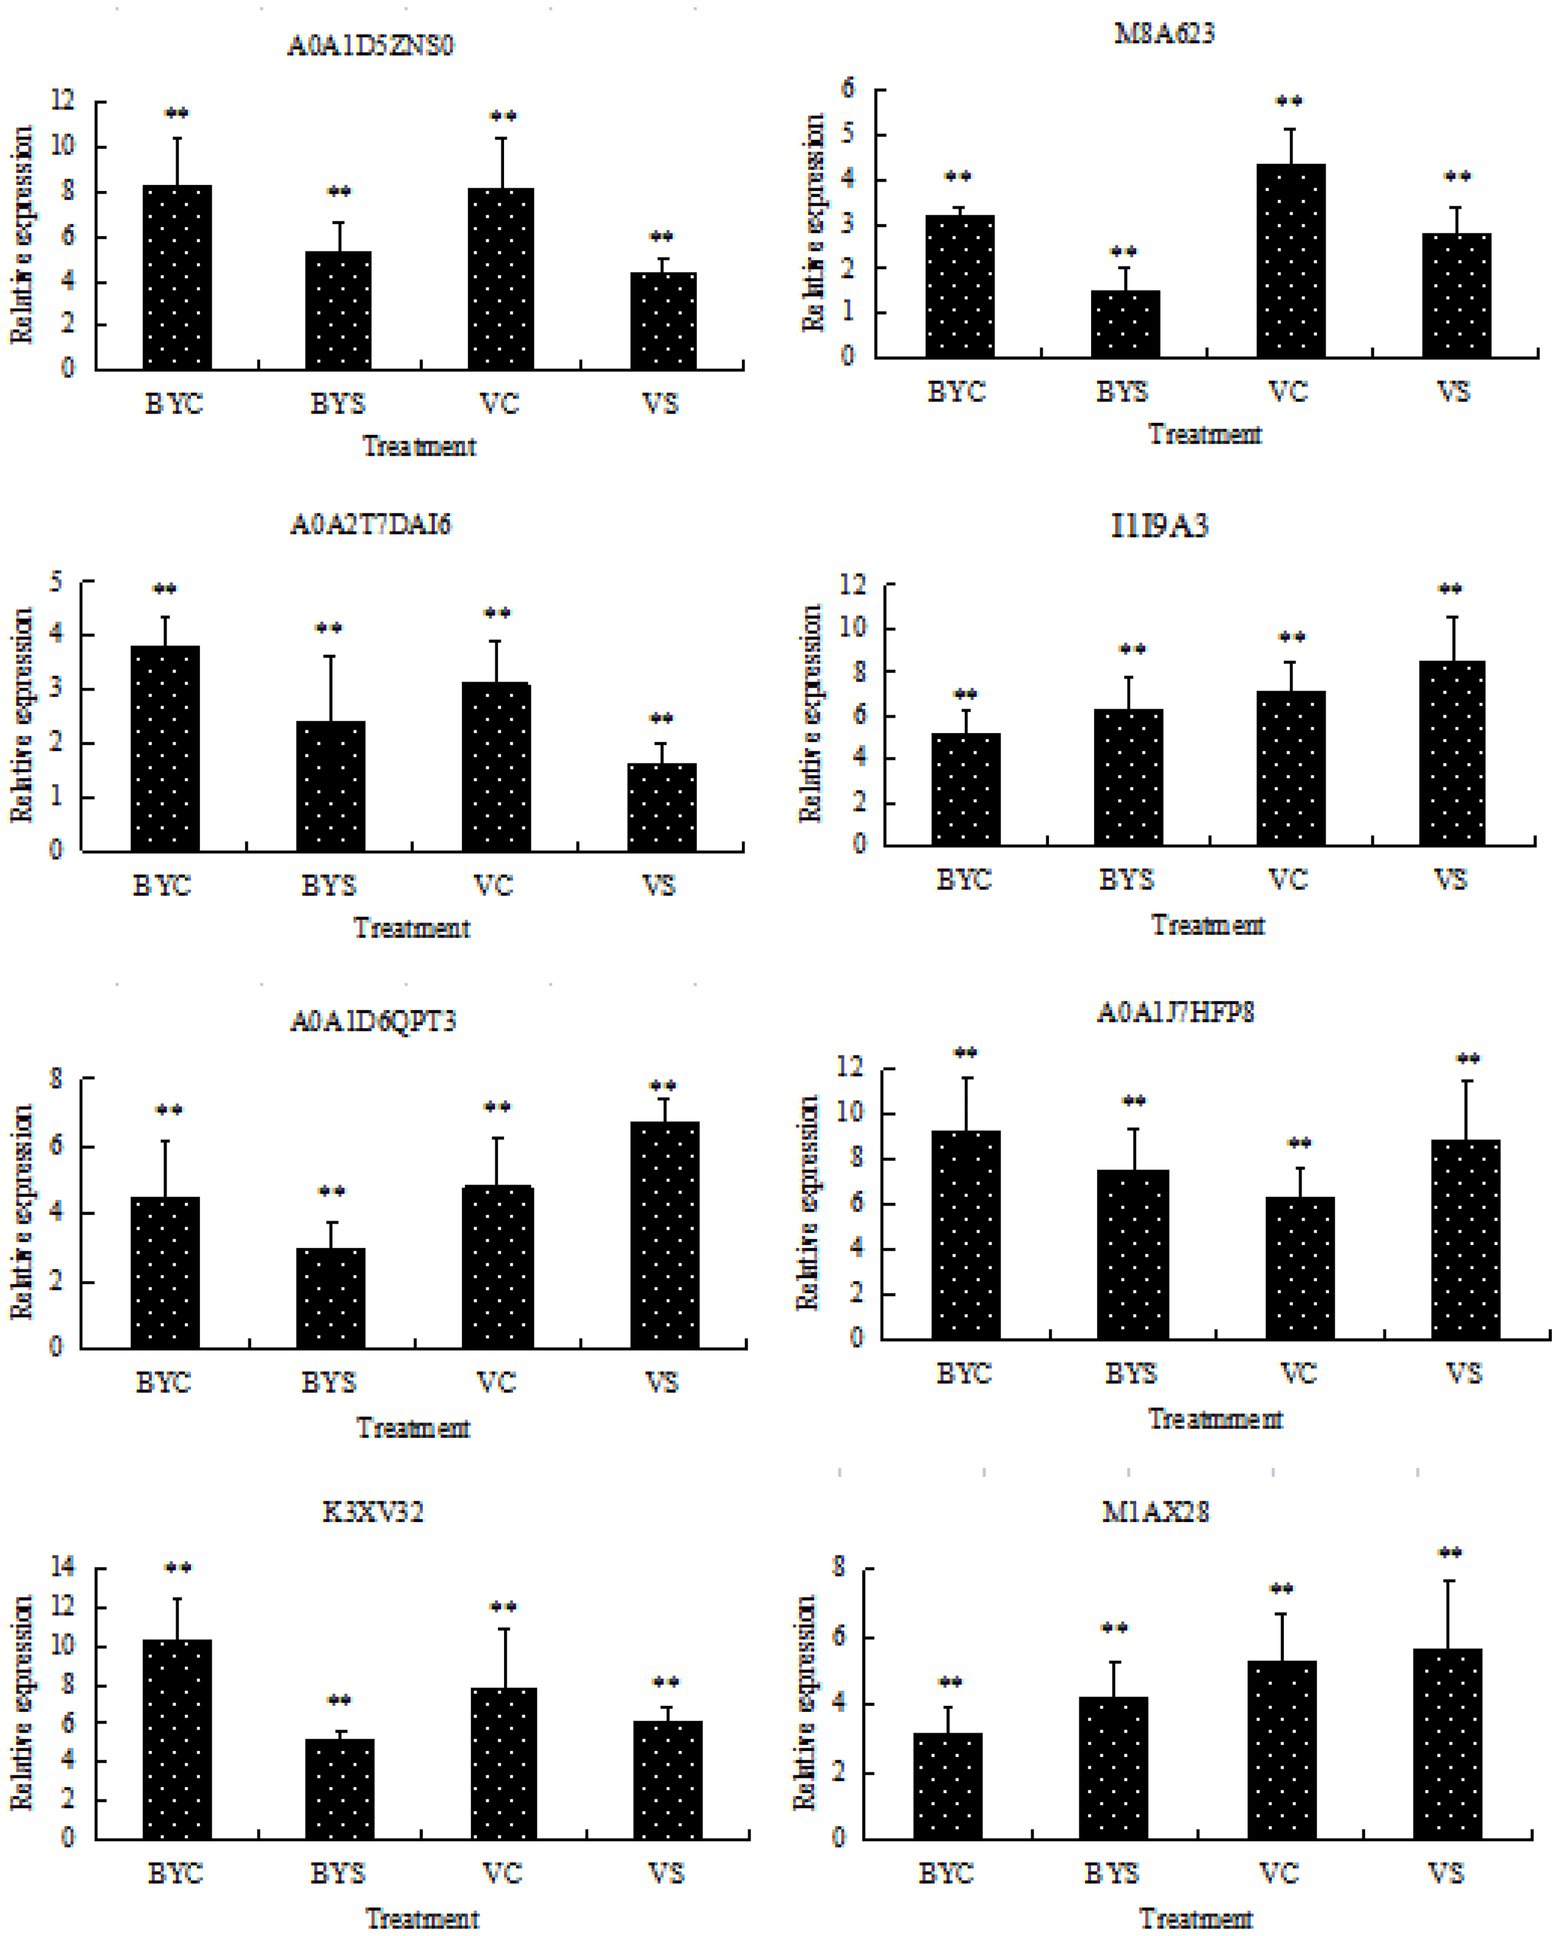
Figure 6. Gene expression analysis of DEPs by qRT-PCR. BYC and VC represent the untreated (CK) samples of Bai5 and Vao-9; BYS and VS represent the salt treated samples of Bai5 and Vao-9. Data given in form of mean ± SE, the significant difference determined by One-way ANOVA (Duncan’s test, **p < 0.01).
Discussion
DEPs Involved in Carbohydrate and Energy Metabolism
Plants will quickly adjust their carbohydrate and energy metabolism to provide energy for resisting salt stress (Ghosh and Xu, 2014). The results obtained in this study indicated that the DEPs in the salt-tolerant variety Vao-9 are associated with carbohydrate and energy metabolism when compared with Bai5. This indicates that the carbohydrate and energy metabolism of Vao-9 undergoes very active and complex changes in the process of salt stress. These DEPs involve two metabolic pathways: pentose and glucuronate interconversions, and carbon fixation pathways in prokaryotes. The two pathways were up-regulated indicating that salt stress promotes the normal carbohydrate and energy metabolism of Vao-9 during the early salt stress response process of oats. UDP-glucuronic acid is a kind of nucleotide sugar, which is the precursor of the cell wall. Previous studies have reported that UDP-glucuronic acid is formed by UDP-glucose 6-dehydrogenase (UGDH), which catalyzes the production of UDP-glucose from UDP-glucose acid (Klinghammer and Tenhaken, 2007; Perner et al., 2016). AKR1 plays a vital role in various plant metabolic reactions including detoxification of aldehydes, secondary metabolism, osmotic biosynthesis, and membrane transport (Zhang and Shi, 2018). The up-regulated expression of these proteins is probably because Vao-9 enhances the glyco-conversion pathway to resist salt stress.
Aconitase A (ACO) is a key intermediate between catabolism and biosynthesis, and the changes in carbon flow at these branch points will affect crop yields and product formation. Previous studies have found that the over expression of PPC reduces the rate of glucose consumption and organic acid excretion (Chao and Liao, 1993). Vao-9 may regulate the metabolic flow between phosphate acetone acid and ACO through the over expressed PPC and phosphoenolpyruvate-protein kinase (ppdK), thereby becoming a critical energy generation pathway under salt stress.
DEPs Involved in P+rotein Synthesis
Most of the DEPs identified in this study are associated with protein synthesis pathways. Ribosome is the main site of protein synthesis, and different kinds of ribosomal proteins play a vital role in translation, ribosomal structure, and biogenesis (Gong et al., 2017). Previous studies have reported that the overexpression of ribosomal protein results from this species maintaining a balance between protein synthesis and degradation by accelerating protein biosynthesis in response to salt stress (Frukh et al., 2020). Inconsistent with these results, the DEPs associated with ribosomes were not enriched in Bai5 and the ribosomal proteins in Vao-9 were all down-regulated, indicating that the salt tolerance mechanisms of plants are diverse. We speculate that the ribosomes may be programmed to be degraded in Vao-9 in order to reduce the cytoplasmic Na+ toxicity under salt stress, but not in Bai5. The results obtained after the analysis of physiological indicators indicated that the content of Pro in Bai5 increased with the increase of salt concentration, while it first decreased and then increased in Vao-9. Therefore, the accumulation in Bai5 is likely due to the conversion of other amino acids, while the accumulation in Vao-9 is probably the result of protein degradation. Heat shock protein (HSP) is considered to have the function of molecular chaperones. Several studies have reported that they are ubiquitous in animals and plants, and play an important role in the stress resistance of plants (Mayer and Bukau, 1998; Ahuja et al., 2010). Under various stresses, HSP can protect its target protein from denaturation, misfolding, and aggregation (Vierling et al., 1989; Santhanagopalan et al., 2018). Previous studies have found that the expression of HSPs in plants is affected by salt stress (Hamilton and Heckathorn, 2001), and HSPs in some plants can enhance stress tolerance when overexpressed in transgenic plants (Huang et al., 2019). However, the function and mechanism of HSP under adversity conditions has not yet been elucidated. Therefore, the expression pattern of oat HSPs detected and identified in this study can be used to explore the function of HSPs under adversity conditions.
The relationship between Ca2+ storage and signaling systems has been fully studied in Arabidopsis. Ca2+ is stored in several organelles including endoplasmic reticulum (ER), vacuoles, mitochondria, chloroplasts, and cell walls. Previous studies have shown that the ER plays an important role in regulating Ca2+ homeostasis despite the vacuoles being the main Ca2+ chelating sites in plant cells (Stael et al., 2012; Costa et al., 2018). The ER contains a variety of Ca2+ binding proteins such as molecular chaperone BiP, calnexin, and calreticulin (CRT). Among them, CRT is mainly responsible for the storage of Ca2+ in plants (Hassan et al., 1995; Mariani et al., 2003; Jia et al., 2009). A previous study reported that the over-expression of complete TaCRT1 cDNA or fragments of the domain that encodes the domain enhances tobacco’s tolerance to salt stress (Xiang et al., 2015). In this study, the Ca2+ content in Bai5 was more reduced after salt stress than in the salt-resistant variety (Vao-9). However, CRT had a higher expression, indicating that Bai5 needed to store Ca2+ through expressed CRTs to resist the harm caused by salt stress.
DEPs Involved in Stress Defense and Other Stress-Responsive Proteins
It is known that glutamine synthetase (glnA) catalyzes the ATP-dependent condensation of glutamate and ammonia to produce glutamine (Liaw et al., 1995). Moreover, proline is a penetrant that overcomes pressure conditions, and glnA is involved in the synthesis of its biological precursors. A previous study reported that the overexpression of glnA in plants confers resistance to biotic and abiotic stresses (Hoshida et al., 2000), which is consistent with the results obtained in this study. Studies have shown that different plants can accumulate non-protein amino acids GABA under different stress conditions (including salinity; Kinnersley and Turano, 2000). GABA metabolism requires GAD enzyme, with pyridoal phosphate as a cofactor, to catalyze the decarboxylation of glutamate to GABA. The results obtained in this study indicated that glutamate decarboxylase (GAD) was up-regulated in Vao-9. This result when combined with existing studies in Arabidopsis indicate that the expression of GAD2 gene was enhanced within 24 h after NaCl treatment (Renault et al., 2010), which may be the performance of resistance to salt stress.
In addition, Glu decarboxylation is not the only way to synthesize GABA in plants because GABA can also be obtained through polyamine (PA) degradation. This process is carried out by amine oxidase (AOs), which is divided into polyamine oxidase (PAO) and two amine oxidase (DAO; Flores and Filner, 1985). A previous study has also proposed that the pathway generated by Pro involves non-enzymatic and enzymatic reactions to synthesize GABA under oxidative stress conditions (Signorelli et al., 2015). The results obtained in this study found that different DEPs exhibit tissue specificity in different resistant oat varieties, indicating that Bai5 and Vao-9 synthesize GABA through the above two different metabolic mechanisms, thereby resisting salt stress on oats. However, further studies should be conducted to determine the specific metabolic process.
Conclusion
This is the first systematic report on the salt reaction mechanism in oat leaves with different salt tolerance based on proteomics analysis. The Label-Free method identified 2,631 salt-reactive proteins. Among these proteins, 262 DEPs changed significantly after 150 mmol L−1 salt treatment, and the changed proteins were mainly divided into three categories. From the results, we obtained tissue-specific information on the expression profiles of oat leaves with different salt tolerance. In the early salt stress response process, the salt-tolerant variety Vao-9 mainly enhances its carbohydrate and energy metabolism through the pentose and glucuronate interconversions, and carbon fixation pathways in prokaryotes, thereby reducing the damage caused by salt stress. In addition, the down-regulation of ribosomes expression and the up-regulated expression of HSPs and CRT were all achieved through the regulation of protein synthesis in response to salt stress, which did not change significantly in Bai5. However, GABA metabolism presents a different synthesis pattern in Bai5 and Vao-9. Therefore, the expression profiles of different salt-tolerant oats show that there is an interconnected but unique salt reaction mechanism in oats. Our comparative analysis of physiology and proteomics of different oat genotypes under salt stress will help in understanding the response process of different oat genotypes to salt stress. Therefore, the results obtained in this study will provide an important basis for further research on the underlying mechanisms of salt response and tolerance in oats and other plant species.
Data Availability Statement
The original contributions presented in the study are publicly available. This data can be found here: iProx, IPX0004215000.
Author Contributions
JL conceived and supervised the experiments. XC performed the experiments, contributed to data analysis, and wrote the paper. ZX, BZ, YY, JM, and ZZ gave valuable advice for the modifications of the paper. All authors contributed to the article and approved the submitted version.
Funding
This work was supported by the National Natural Science Foundation of China (31560357) and the National Modern Agricultural Industry Technology System (CARS-08-B-5). Our sample testing data analysis was assisted by Beijing Novogene Technology Co., Ltd. (Beijing, China).
Conflict of Interest
The authors declare that the research was conducted in the absence of any commercial or financial relationships that could be construed as a potential conflict of interest.
Publisher’s Note
All claims expressed in this article are solely those of the authors and do not necessarily represent those of their affiliated organizations, or those of the publisher, the editors and the reviewers. Any product that may be evaluated in this article, or claim that may be made by its manufacturer, is not guaranteed or endorsed by the publisher.
References
Ahuja, I., de Vos, R. C. H., Bones, A. M., and Hall, R. D. (2010). Plant molecular stress responses face climate change. Trends Plant Sci. 15, 664–674. doi: 10.1016/j.tplants.2010.08.002
Bai, J., Liu, J., Jiao, W., Sa, R., Zhang, N., and Jia, R. (2016). Proteomic analysis of salt-responsive proteins in oat roots (Avena sativa L.). J. Sci. Food Agric. 96, 3867–3875. doi: 10.1002/jsfa.7583
Bradford, M. M. (1976). A rapid and sensitive method for the quantitation of microgram quantities of protein utilizing the principle of protein-dye binding. Anal. Biochem. 72, 248–254. doi: 10.1016/0003-2697(76)90527-3
Chao, Y. P., and Liao, J. C. (1993). Alteration of growth yield by overexpression of phosphoenolpyruvate carboxylase and phosphoenolpyruvate carboxykinase in Escherichia coli. Appl. Environ. Microbiol. 59, 4261–4265. doi: 10.1128/aem.59.12.4261-4265.1993
Chinnusamy, V., Zhu, J., and Zhu, J. K. (2006). Salt stress signaling and mechanisms of plant salt tolerance. Genet. Eng. 27, 141–177. doi: 10.1007/0-387-25856-6_9
Costa, A., Navazio, L., and Szabo, I. (2018). The contribution of organelles to plant intracellular calcium signalling. J. Exp. Bot. 69, 4175–4193. doi: 10.1093/jxb/ery185
Flores, H. E., and Filner, P. (1985). Polyamine Catabolism in Higher Plants: Characterization of Pyrroline Dehydrogenase[M]//Polyamines in Plants. Vol. 3. Dordrecht: Springer, 277–291.
Flowers, T. J., and Colmer, T. D. (2008). Salinity tolerance in halophytes. New Phytol. 179, 945–963. doi: 10.1111/j.1469-8137.2008.02531.x
Frukh, A., Siddiqi, T. O., Khan, M. I. R., and Ahmad, A. (2020). Modulation in growth, biochemical attributes and proteome profile of rice cultivars under salt stress. Plant Physiol. Biochem. 146, 55–70. doi: 10.1016/j.plaphy.2019.11.011
Gao, W., Feng, Z., Bai, Q., He, J., and Wang, Y. (2019). Melatonin-mediated regulation of growth and antioxidant capacity in salt-tolerant naked oat under salt stress. Int. J. Mol. Sci. 20:1176. doi: 10.3390/ijms20051176
Ghosh, D., and Xu, J. (2014). Abiotic stress responses in plant roots: a proteomics perspective. Front. Plant Sci. 5:6. doi: 10.3389/fpls.2014.00006
Gong, W., Xu, F., Sun, J., Peng, Z., He, S., Pan, Z., et al. (2017). ITRAQ-based comparative proteomic analysis of seedling leaves of two upland cotton genotypes differing in salt tolerance. Front. Plant Sci. 8:2113. doi: 10.3389/fpls.2017.02113
Guo, G., Ge, P., Ma, C., Li, X., Lv, D., Wang, S., et al. (2012). Comparative proteomic analysis of salt response proteins in seedling roots of two wheat varieties. J. Proteome 75, 1867–1885. doi: 10.1016/j.jprot.2011.12.032
Hamilton, E. W. III, and Heckathorn, S. A. (2001). Mitochondrial adaptations to NaCl. Complex I is protected by anti-oxidants and small heat shock proteins, whereas complex II is protected by proline and betaine. Plant Physiol. 126, 1266–1274. doi: 10.1104/pp.126.3.1266
Hassan, A. M., Wesson, C., and Trumble, W. R. (1995). Calreticulin is the major Ca2+ storage protein in the endoplasmic reticulum of the pea plant (Pisum sativum). Biochem. Biophys. Res. Commun. 211, 54–59. doi: 10.1006/bbrc.1995.1777
Horie, T., Yoshida, K., Nakayama, H., Yamada, K., Oiki, S., and Shinmyo, A. (2001). Two types of HKT transporters with different properties of Na+ and K+ transport in Oryza sativa. Plant J. 27, 129–138. doi: 10.1046/j.1365-313x.2001.01077.x
Hoshida, H., Tanaka, Y., Hibino, T., Hayashi, Y., Tanaka, A., Takabe, T., et al. (2000). Enhanced tolerance to salt stress in transgenic rice that overexpresses chloroplast glutamine synthetase. Plant Mol. Biol. 43, 103–111. doi: 10.1023/A:1006408712416
Hu, H., Dai, M., Yao, J., Xiao, B., Li, X., Zhang, Q., et al. (2006). Overexpressing a NAM, ATAF, and CUC (NAC) transcription factor enhances drought resistance and salt tolerance in rice. Proc. Natl. Acad. Sci. U. S. A. 103, 12987–12992. doi: 10.1073/pnas.0604882103
Huang, L. J., Cheng, G. X., Khan, A., Wei, A. M., Yu, Q. H., Yang, S. B., et al. (2019). CaHSP16.4, a small heat shock protein gene in pepper, is involved in heat and drought tolerance. Protoplasma 256, 39–51. doi: 10.1007/s00709-018-1280-7
Jacoby, R. P., Millar, A. H., and Taylor, N. L. (2010). Wheat mitochondrial proteomes provide new links between antioxidant defense and plant salinity tolerance. J. Proteome Res. 9, 6595–6604. doi: 10.1021/pr1007834
Jia, X., He, L., Jing, R., and Li, R. (2009). Calreticulin: Conserved protein and diverse functions in plants. Physiol. Plant. 136, 127–138. doi: 10.1111/j.1399-3054.2009.1223.x
Kinnersley, A. M., and Turano, F. J. (2000). Gamma aminobutyric acid (GABA) and plant responses to stress. Crit. Rev. Plant Sci. 19, 479–509.
Klinghammer, M., and Tenhaken, R. (2007). Genome-wide analysis of the UDP-glucose dehydrogenase gene family in Arabidopsis, a key enzyme for matrix polysaccharides in cell walls. J. Exp. Bot. 58, 3609–3621. doi: 10.1093/jxb/erm209
Liaw, S. -H., Kuo, I., and Eisenberg, D. (1995). Discovery of the ammonium substrate site on glutamine synthetase, a third cation binding site. Protein Sci. 4, 2358–2365. doi: 10.1002/pro.5560041114
Mahajan, S., and Tuteja, N. (2005). Cold, salinity and drought stresses: an overview. Arch. Biochem. Biophys. 444, 139–158. doi: 10.1016/j.abb.2005.10.018
Mariani, P., Navazio, L., and Zuppini, A. (2003). Calreticulin and the Endoplasmic Reticulum in Plant Cell Biology[M]//Calreticulin. Boston, MA: Springer, 94–104.
Mayer, M. P., and Bukau, B. (1998). Hsp70 chaperone systems: diversity of cellular functions and mechanism of action. Biol. Chem. 379, 261–268.
Nam, T. N., Thia, L. H., Mai, D. S., and Tuan, N. V. (2017). Overexpression of NbWRKY79 enhances salt stress tolerance in Nicotiana benthamiana. Acta Physiol. Plant. 39:121. doi: 10.1007/s11738-017-2423-8
Pang, Q., Chen, S., Dai, S., Chen, Y., Wang, Y., and Yan, X. (2010). Comparative proteomics of salt tolerance in Arabidopsis thaliana and the llungiella halophila. J. Proteome Res. 9, 2584–2599. doi: 10.1021/pr100034f
Peng, Z., Wang, M., Li, F., Lv, H., Li, C., and Xia, G. (2009). A proteomic study of the response to salinity and drought stress in an introgression strain of bread wheat. Mol. Cell. Proteomics 8, 2676–2686. doi: 10.1074/mcp.M900052-MCP200
Perner, J., Provazník, J., Schrenková, J., Urbanová, V., Ribeiro, J. M. C., and Kopáček, P. (2016). RNA-seq analyses of the midgut from blood-and serum-fed Ixodes ricinus ticks. Sci. Rep. 6:36695. doi: 10.1038/srep36695
Rasoulnia, A., Bihamta, M. R., Peyghambari, S. A., Alizadeh, H., and Rahnama, A. (2011). Proteomic response of barley leaves to salinity. Mol. Biol. Rep. 38, 5055–5063. doi: 10.1007/s11033-010-0651-8
Renault, H., Roussel, V., El Amrani, A., Arzel, M., Renault, D., Bouchereau, A., et al. (2010). The Arabidopsis pop2-1mutant reveals the involvement of GABA transaminase in salt stress tolerance. BMC Plant Biol. 10:20. doi: 10.1186/1471-2229-10-20
Santhanagopalan, I., Degiacomi, M. T., Shepherd, D. A., Hochberg, G. K. A., Benesch, J. L. P., and Vierling, E. (2018). It takes a dimer to tango: oligomeric small heat shock proteins dissociate to capture substrate. J. Biol. Chem. 293, 19511–19521. doi: 10.1074/jbc.RA118.005421
Signorelli, S., Dans, P. D., Coitiño, E. L., Borsani, O., and Monza, J. (2015). Connecting proline and γ-aminobutyric acid in stressed plants through non-enzymatic reactions. PLoS One 10:e0115349. doi: 10.1371/journal.pone.0115349
Stael, S., Wurzinger, B., Mair, A., Mehlmer, N., Vothknecht, U. C., and Teige, M. (2012). Plant organellar calcium signalling: an emerging field. J. Exp. Bot. 63, 1525–1542. doi: 10.1093/jxb/err394
Tuteja, N. (2007). Mechanisms of high salinity tolerance in plants. Methods Enzymol. 428, 419–438. doi: 10.1016/S0076-6879(07)28024-3
Verbruggen, N., Villarroel, R., and Van Montagu, M. (1993). Osmoregulation of a pyrroline-5-carboxylate reductase gene in Arabidopsis thaliana. Plant Physiol. 103, 771–781. doi: 10.1104/pp.103.3.771
Vierling, E., Harris, L. M., and Chen, Q. (1989). The major low-molecular-weight heat shock protein in chloroplasts shows antigenic conservation among diverse higher plant species. Mol. Cell. Biol. 9, 461–468. doi: 10.1128/mcb.9.2.461-468.1989
Wang, Y., Stevanato, P., Lv, C., Li, R., and Geng, G. (2019). Comparative physiological and proteomic analysis of two sugar beet genotypes with contrasting salt tolerance. J. Agric. Food Chem. 67, 6056–6073. doi: 10.1021/acs.jafc.9b00244
Witzel, K., Weidner, A., Surabhi, G. K., Börner, A., and Mock, H. P. (2009). Salt stress-induced alterations in the root proteome of barley genotypes with contrasting response towards salinity. J. Exp. Bot. 60, 3545–3557. doi: 10.1093/jxb/erp198
Wu, B., Munkhtuya, Y., Li, J., Hu, Y., Zhang, Q., and Zhang, Z. (2018). Comparative transcriptional profiling and physiological responses of two contrasting oat genotypes under salt stress. Sci. Rep. 8:16248. doi: 10.1038/s41598-018-34505-5
Xiang, Y., Hai Lu, Y., Song, M., Wang, Y., Xu, W., Wu, L., et al. (2015). Overexpression of a Triticum aestivum calreticulin gene (TaCRT1) improves salinity tolerance in tobacco. PLoS One 10:e0140591. doi: 10.1371/journal.pone.0140591
Xu, Z., Chen, X., Lu, X., Zhao, B., Yang, Y., and Liu, J. (2021). Integrative analysis of transcriptome and metabolome reveal mechanism of tolerance to salt stress in oat (Avena sativa L.). Plant Physiol. Biochem. 160, 315–328. doi: 10.1016/j.plaphy.2021.01.027
Zhang, H., Han, B., Wang, T., Chen, S., Li, H., Zhang, Y., et al. (2012). Mechanisms of plant salt response: insights from proteomics. J. Proteome Res. 11, 49–67. doi: 10.1021/pr200861w
Zhang, C., and Shi, S. (2018). Physiological and proteomic responses of contrasting alfalfa (Medicago sativa L.) varieties to PEG-induced osmotic stress. Front. Plant Sci. 9:1890. doi: 10.3389/fpls.2018.01890
Keywords: oat, salt stress, proteomic, label-free, differentially expressed proteins
Citation: Chen X, Xu Z, Zhao B, Yang Y, Mi J, Zhao Z and Liu J (2022) Physiological and Proteomic Analysis Responsive Mechanisms for Salt Stress in Oat. Front. Plant Sci. 13:891674. doi: 10.3389/fpls.2022.891674
Edited by:
Baris Uzilday, Ege University, TurkeyReviewed by:
Hakan Terzi, Afyon Kocatepe University, TurkeyÁgnes Szepesi, University of Szeged, Hungary
Chian Ju Jong, The University of Iowa, United States
Copyright © 2022 Chen, Xu, Zhao, Yang, Mi, Zhao and Liu. This is an open-access article distributed under the terms of the Creative Commons Attribution License (CC BY). The use, distribution or reproduction in other forums is permitted, provided the original author(s) and the copyright owner(s) are credited and that the original publication in this journal is cited, in accordance with accepted academic practice. No use, distribution or reproduction is permitted which does not comply with these terms.
*Correspondence: Xiaojing Chen, 1131036201@qq.com; Jinghui Liu, cauljh@aliyun.com