 Feifei Wang
 Priyanka Das1†
 Ruchika Bhawal
 Sheng Zhang
 Madan K. Bhattacharyya
- 1Department of Agronomy, Iowa State University, Ames, IA, United States
- 2Proteomics and Metabolomics Facility, Institute of Biotechnology, Cornell University, Ithaca, NY, United States
The soybean root necrosis 1 (rn1) mutation causes progressive browning of the roots soon after germination and provides increased tolerance to the soil-borne oomycete pathogen Phytophthora sojae in soybean. Toward understanding the molecular basis of the rn1 mutant phenotypes, we conducted tandem mass tag (TMT)-labeling proteomics and phosphoproteomics analyses of the root tissues of the rn1 mutant and progenitor T322 line to identify potential proteins involved in manifestation of the mutant phenotype. We identified 3,160 proteins. When the p-value was set at ≤0.05 and the fold change of protein accumulation between rn1 and T322 at ≥1.5 or ≤0.67, we detected 118 proteins that showed increased levels and 32 proteins decreased levels in rn1 as compared to that in T322. The differentially accumulated proteins (DAPs) are involved in several pathways including cellular processes for processing environmental and genetic information, metabolism and organismal systems. Five pathogenesis-related proteins were accumulated to higher levels in the mutant as compared to that in T322. Several of the DAPs are involved in hormone signaling, redox reaction, signal transduction, and cell wall modification processes activated in plant–pathogen interactions. The phosphoproteomics analysis identified 22 phosphopeptides, the levels of phosphorylation of which were significantly different between rn1 and T322 lines. The phosphorylation levels of two type II metacaspases were reduced in rn1 as compared to T322. Type II metacaspase has been shown to be a negative regulator of hypersensitive cell death. In absence of the functional Rn1 protein, two type II metacaspases exhibited reduced phosphorylation levels and failed to show negative regulatory cell death function in the soybean rn1 mutant. We hypothesize that Rn1 directly or indirectly phosphorylates type II metacaspases to negatively regulate the cell death process in soybean roots.
Introduction
Soybean [Glycine max, (L.) Merr.] is one of the most important legumes worldwide and is an important source of both vegetable proteins and oil for human nutrition. However, soybean production is often impeded by attacks from a large number of pathogens including oomycetes, nematodes, fungi, bacteria, and viruses. Soil-borne root pathogens can cause root necrosis and rot resulting in significant yield reductions (Liu et al., 2016; Strom et al., 2020). Plants have evolved with defense mechanisms to protect against pathogen attacks. One of the defense mechanisms is the hypersensitive response (HR), also known as programmed cell death (PCD), which is characterized by rapid death of plants cells that are in contact with the invading pathogens. This is one of the most common and effective host defense responses (Muthamilarasan and Prasad, 2013; Balint-Kurti, 2019). PCD is a ubiquitous and genetically regulated process consisted of activation of finely controlled signaling pathways leading to cellular suicide (Pontier et al., 1998; Salguero-Linares and Coll, 2019; Noman et al., 2020).
Lesion mimic mutants (LMMs), characterized by sudden spontaneous cell death, have become powerful resources in studying the role of cell death in defense response and molecular mechanisms regulating PCD and the HR in plants. Different recessive lesion mimic mutations can lead to PCD with or without activation of host defense responses (Jones and Dangl, 1996; Mittler and Lam, 1996; Lorrain et al., 2003; Bruggeman et al., 2015). LMMs have been reported in many plant species including Arabidopsis (Zhang et al., 2008), barley (Jorgensen, 1992; Rostoks et al., 2006), birch (Li et al., 2017), maize (Walbot, 1991; Gray et al., 1997), rice (Mizobuchi et al., 2002; Jiao et al., 2018; Zhang et al., 2019), soybean (Kosslak et al., 1996), and wheat (Kong et al., 2020). A number of genes regulating the development of LMM phenotypes have been mapped and cloned. Several rice LMM genes have been cloned and the major pathways regulated by these genes have been identified. These include ROS pathways (Takahashi et al., 1999; Wu et al., 2008), chlorophyll synthesis (Nishimura et al., 2019; Cui et al., 2020), fatty acid and lipid biosynthesis (Gao et al., 2019, 2020), signal transduction (Fekih et al., 2015), and kinase signaling pathways (Zhou et al., 2016; Zhang et al., 2019).
In soybean Glycine max lesion mimic mutant 2-1 (Gmlmm2-1), which displays a light-dependent cell death phenotype, is controlled by the GmLMM2 gene encoding a coproporphyrinogen III oxidase involved in tetrapyrrole biosynthesis (Ma et al., 2020). Investigation of the spotted leaf-1 (spl-1) mutant, another LLM in soybean, led to identification of a candidate Glyma.04g242300 gene that showed high similarity to the Arabidopsis At2G02850 gene encoding a plantacyanin, a member of the plant-specific phytocyanin sub-family of blue copper proteins involved in the electron transport chain of photosynthesis (Al Amin et al., 2019). A forward genetic screen for autoimmunity-related LMMs in soybean detected two allelic mutants, which carry mutations in Glyma.13G054400 encoding a malectin-like receptor kinase (Wang et al., 2020a). A soybean LMM, NT302 showing chlorotic and spontaneous lesions on leaves at the R3 pod-stage is governed by lack of a functional GmHPL gene encoding a hydroperoxide lyase. GmHPL is significantly induced in response to methyl jasmonate treatment, wounding, and infestation with common cutworm (Wang et al., 2020b). All these LMMs were identified based on spontaneous necrosis in leaves.
Thirty root necrotic mutants induced mostly by an endogenous transposon, treatment with the chemical mutagen ethyl methanesulfonate or spontaneously have been reported to be allelic suggesting that most likely a single gene regulates the cell death pathway in soybean roots (Palmer et al., 2008). The roots of homozygous root necrosis 1 (rn1) plants, even under axenic conditions, turn brown soon after germination and exhibit increased tolerance to Phytophthora sojae, the root-borne oomycete pathogen that causes root and stem rot disease in soybean (Kosslak et al., 1996). The lack of a functional Rn1 gene causes a progressive browning in the roots between 3 and 5 days after germination and is associated with the accumulation of phytoalexins and pathogenesis-related proteins (Kosslak et al., 1997; Figure 1 and Supplementary Figure 1). The browning is caused by the oxidation of phenolic compounds and is a characteristic symptom of the HR associated with wounding or pathogen attack (Lamb, 1994). Improvement in tolerance to P. sojae is considered to be associated with the onset of defense gene activation in rn1 mutants. The Rn1 gene is yet to be cloned. It is also unknown which genes, proteins or pathways are regulated by Rn1. For better understanding molecular basis of the root necrotic mutant 1 (rn1) phenotype in soybean, we applied proteomics and phosphoproteomics approaches that have been extensively used in recent years for exploring the molecular basis of plant growth and responses to biotic and abiotic stresses in plant species including Arabidopsis (Umezawa et al., 2013), Brachypodium distachyon (Lv et al., 2014; Yuan et al., 2016), rice (Hou et al., 2015; Fang et al., 2019), wheat (Hu et al., 2015), maize (Cao et al., 2019; Zhao et al., 2019), and barley (Ishikawa et al., 2019a,b). We have applied tandem mass tags (TMT)-based quantitative liquid chromatography-tandem mass spectrometry (LC-MS/MS) proteomics and phosphoproteomics approaches to compare the proteomes and phosphoproteomes of the wild-type 322 and rn1 mutant root tissues and identified 22 phosphoproteins including two highly identical type II metacaspases with significantly different phosphorylation levels between the rn1 mutant and the “wild-type T322” progenitor lines.
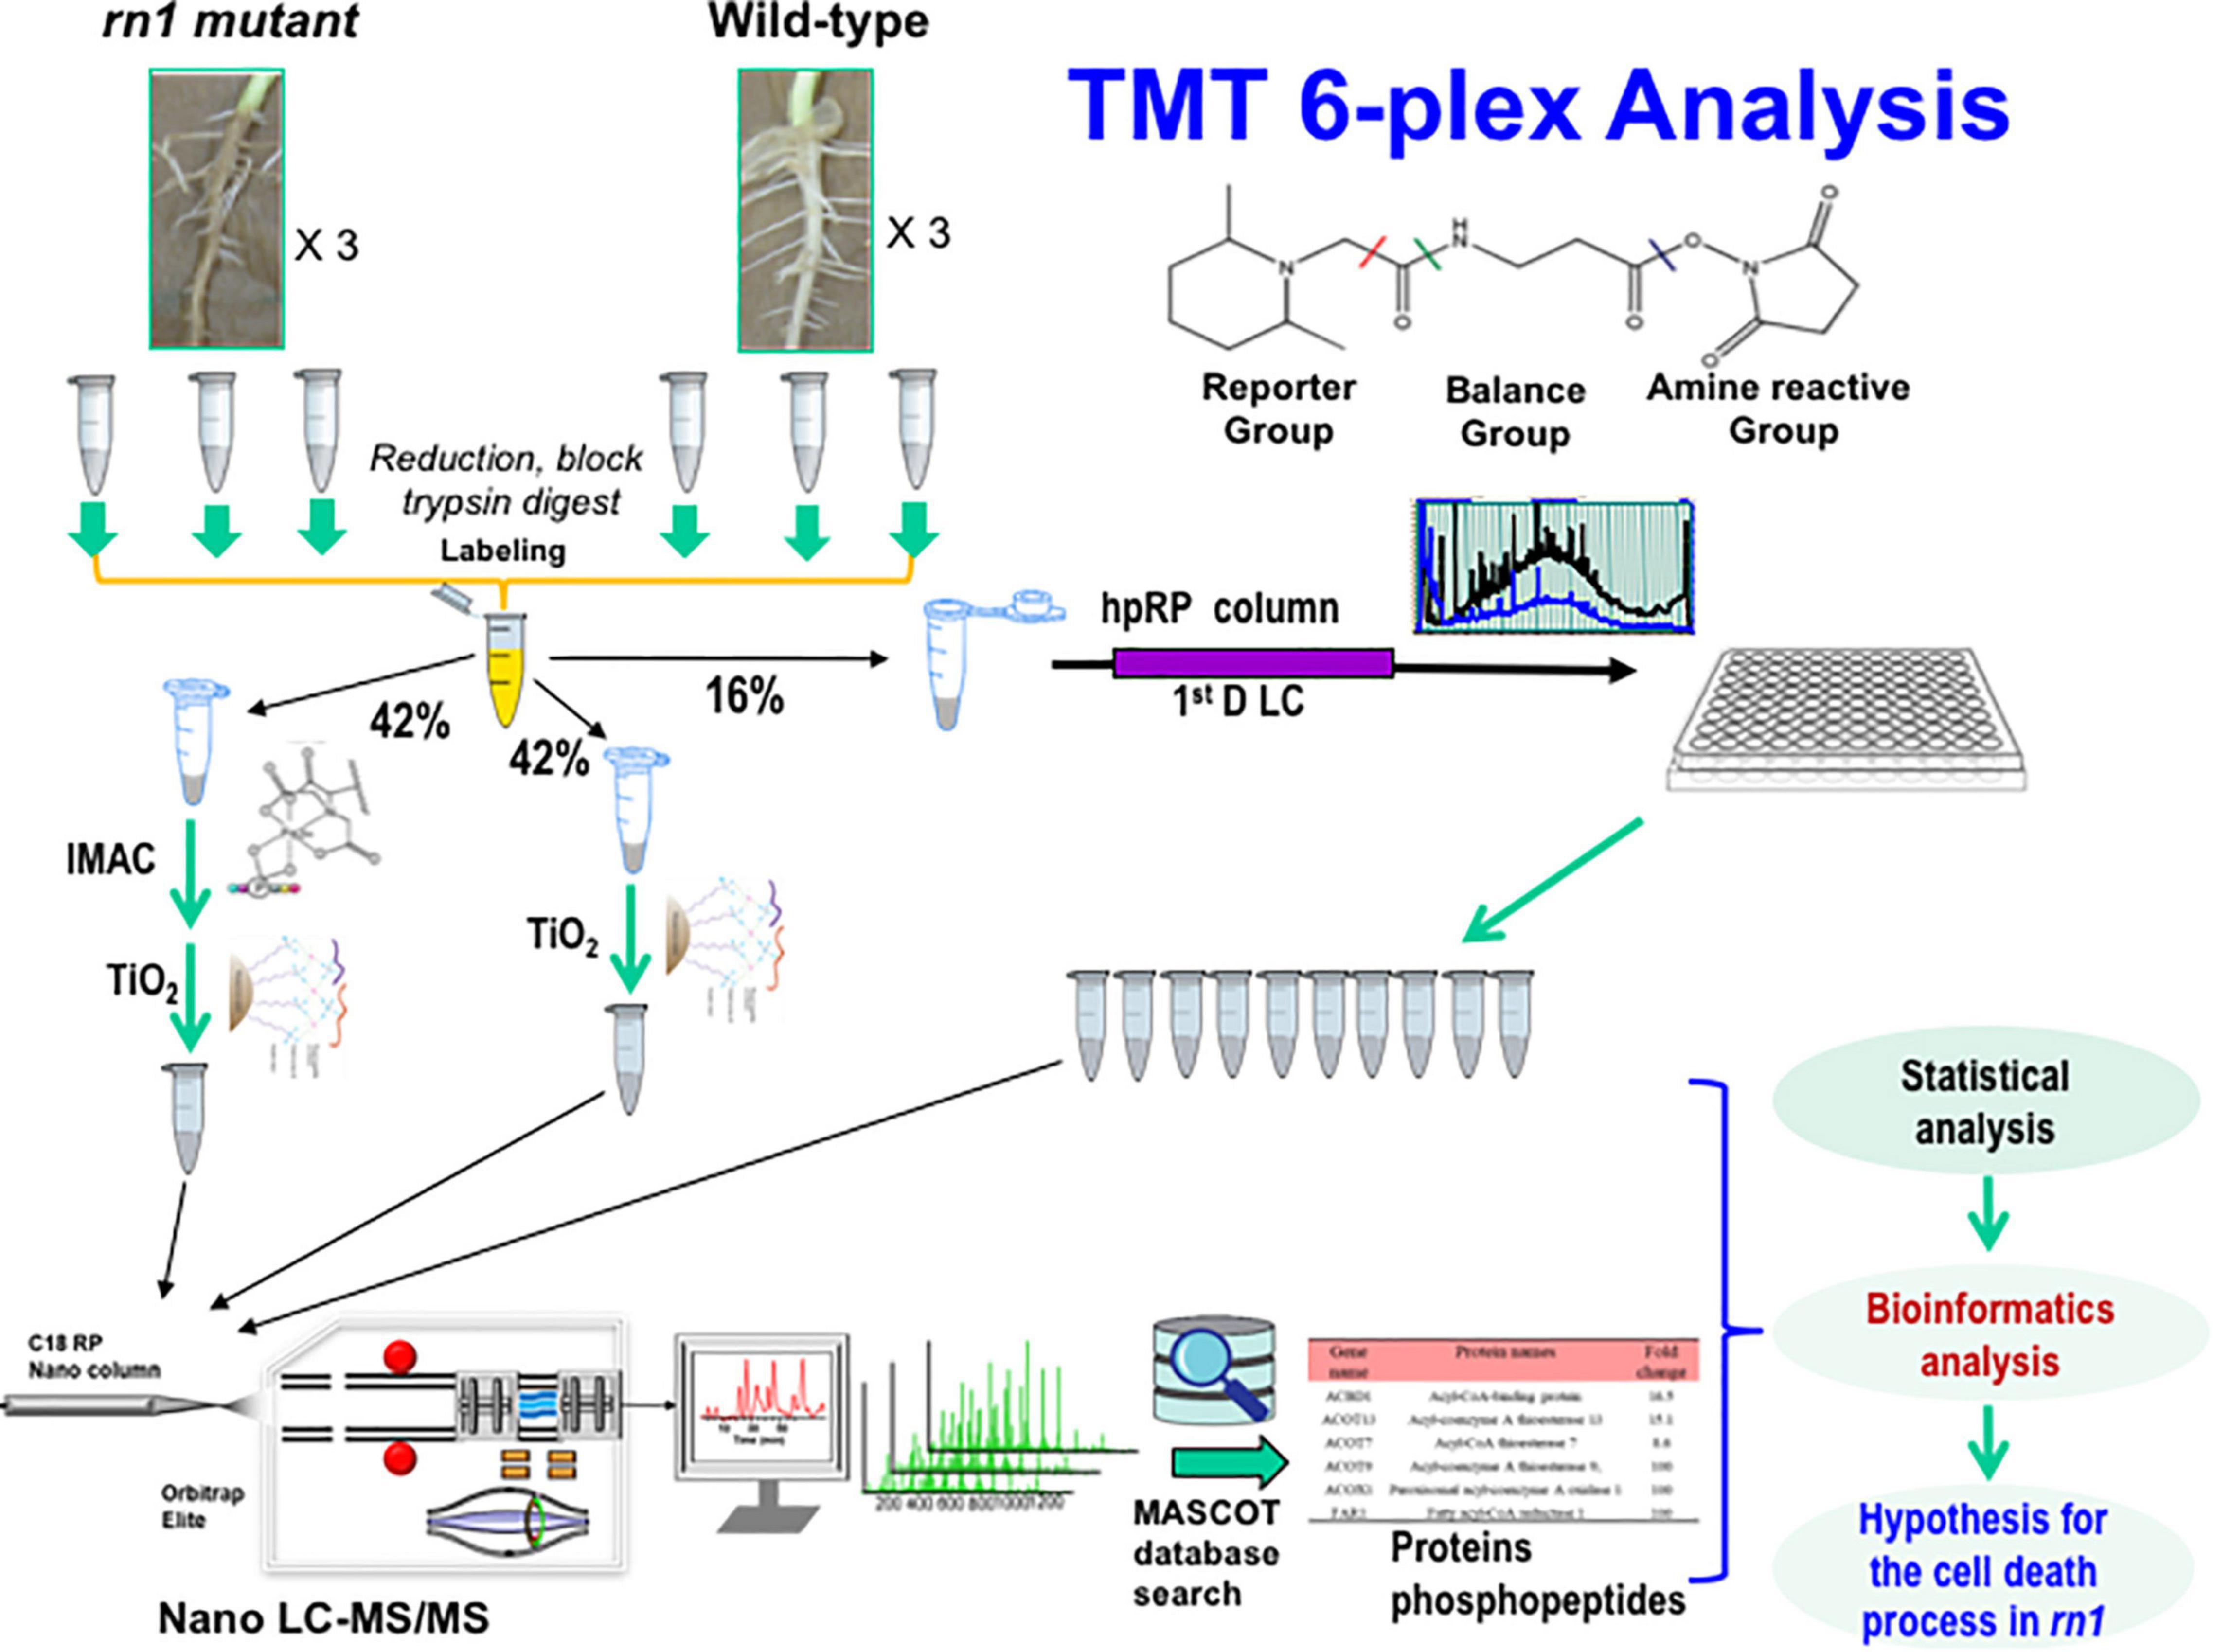
Figure 1. Experimental design and schematic diagram of the workflow for quantitative proteomics of the soybean rn1 mutant and T322 lines. The T322 is the wild-type progenitor of the rn1 mutant line. Soybean root samples of the rn1 mutant and T322 lines in triplicate were analyzed in parallel by TMT 6-plex based quantitative proteomics and phosphoproteomics analyses. TMT labeled peptides were divided to three aliquots and used by high pH fractionation for global proteomics, TiO2 enrichment and IMAC-TiO2 sequential enrichment for phosphoproteomics, respectively. About 16% of total labeled peptides were used for global proteomics and 84% used for phosphoproteomics study. The 10 high-pH RPLC fractions and 2 enriched samples were subjected to nanoLC-MS/MS analysis and subsequent database search using Mascot. After statistical analyses of the global proteomics data and quantitative phosphopeptides, the differentially accumulated proteins, and phosphoproteins with significantly changed phosphorylated peptides/sites were conducted to identify differentially regulated proteins and phosphoproteins by the Rn1 protein for bioinformatics analysis.
Materials and Methods
Plant Material and Growing Conditions
The seeds of the progenitor soybean cultivar T322 and rn1 mutant (T328H) were planted on germinating papers and incubated under the following growing conditions: 24–26°C day/19–21°C night, 16 h light/8 h dark, and 350 μmol photons m–2 s–1 light intensity. Germinating seedlings were phenotyped starting 5 days following sowing for visible necrotic phenotypes. The comparable amounts of necrotic root tissues, as soon as necrotic symptoms started to appear, from the rn1 mutant and healthy tissues from the wild-type T322 plants were harvested and frozen in liquid N2. The root tissues of random plants were pooled to obtain three replications for each of the wild-type T322 and rn1 mutant plants for proteomics and phosphoproteomics studies.
Preparation of Protein Samples
The proteins from roots of soybean were extracted following the method of Toorchi et al. (2009). Phenol extraction buffer, a mixture of equal volume of extraction buffer and buffered phenol, was prepared just before use. The extraction buffer contains 100 mM Tris–HCl, pH 8.8, 10 mM w/v EDTA, 900 mM w/v sucrose, and 0.4% v/v 2-mercaptoethanol. Buffered phenol was prepared by dissolving phenol in Tris buffer and adjusting the pH to 8.8 with HCl. About 5 g tissue sample was ground to powder under liquid N2 using a pestle and mortar. Approximately 10 ml phenol extraction buffer was added to the powdered 5 g tissue in a 50 ml tube and protein was extracted by agitating for 30 min at 4°C. The content was centrifuged at 2,800 g for 30 min at 4°C. The upper phase was then transferred to a fresh 50 ml tube. Protease and phosphatase inhibitors were added to 1% concentration. Ice-cold ammonium acetate/methanol solution (100 mM w/v ammonium acetate in 100% methanol) was added to the upper phase in a ratio of 5:1, mixed and incubated at -20°C to precipitate the phenol extracted proteins. The precipitate was collected after centrifugation at 2,800 g for 30 min at 4°C. The pellet was washed twice with of ice-cold ammonium acetate/methanol solution, then twice with ice-cold 80% acetone solution, and finally with ice-cold 70% ethanol. The pellet was solubilized and denatured in a final concentration of 100 mM phosphate buffer pH 7.8, containing 6M urea and 2% CHAPS, 0.2% Triton X-100, 0.1% SDS and 10 mM DTT, sonicated for 5 min and votexed for 0.5 h until completely solubilized. The protein concentration for each sample was determined by Bradford assay, and further quantified by running on a precast NOVEX 12% Tris/Glycine mini-gel (Invitrogen, Carlsbad, CA, United States) along with a series of amounts of E. coli lysates (2, 5, 10, and 20 μg/lane). The SDS gel was visualized with colloidal Coomassie blue stain (Invitrogen), imaged by Typhoon 9400 scanner followed by ImageQuant TL 8.1 (GE Healthcare).
Tandem Mass Tags Labeling and Phosphopeptide Enrichment and Detection
The proteomics and phosphoproteomics analyses were conducted at the Proteomics and Metabolomics Facility, Cornell University to identify the differentially accumulated proteins (DAPs) and phosphopeptides/sites. For TMT labeling, a total of 200 μg protein of each sample was reduced with 9.5 mM tris(2-carboxyethyl)phosphine for 1 h at room temperature, alkylated with 17 mM iodoacetamide for 1 h in the dark and then quenched by additional of 20 mM Dithiothreitol (DTT). The alkylated proteins were precipitated by adding 6 volumes of ice-cold acetone and incubating at -20°C overnight, and reconstituted in 90 μL of 100 mM triethyl-ammonium bicarbonate. Each sample was digested with 18 μg trypsin for 18 h at 37°C. The TMT 6-plex labels (dried powder) were reconstituted with 45 μL of anhydrous ACN prior to labeling and added with 1: 2 ratio to each of the tryptic digest samples for labeling over 1 h at room temperature. The peptides from the following six samples (mut1, mut2, mut3, WT1, WT2, and WT3) were mixed each TMT tag with 126-tag, 127-tag, 128-tag, 129-tag, 130-tag, and 131-tag, respectively. After checking label incorporation using Orbitrap Elite (Thermo-Fisher Scientific, San Jose, CA, United States) by mixing 1 μL aliquots from each sample and desalting with strong cation-exchange (SCX) ziptip (Millipore, Billerica, MA, United States), the six samples in each set were pooled, evaporated to dryness and subjected to a PolyLC SCX cartridge (PolyLC Inc. Columbia, MD, United States) and Sep-Pak C18 cleanup (Waters, Milford, MA, United States) according to the manufacturer’s instructions. The clean samples were then divided to three aliquots: one aliquot with 200 μg peptides used for subsequent high-pH reverse-phase fractionation into 10 fractions as described previously (Yang et al., 2011). The rest two aliquots (500 μg peptides each) were used for enrichment of phosphopeptides.
Enrichment of phosphopeptides by TiO2 beads: TiO2 enrichment was conducted using a TiO2 Mag Sepharose kit (from GE Healthcare) for each 500 μg aliquot. The TMT 6-plex tagged tryptic peptides were reconstituted in 400 μL of binding buffer (1M glycolic acid in 80% acetonitrile, 5% TFA). The TiO2 slurry (75 μL) was used and incubated with the sample for 30 min at 1,800 rpm vortex. After washing the beads with washing buffer (80% acetonitrile, 1%TFA), the phosphopeptides were eluted with 100 μL of elution buffer (5% ammonium hydroxide) twice. The eluted fraction was dried and reconstituted in 25 μL of 0.5% formic acid for subsequent nano scale LC-MS/MS analysis. The second aliquot (500 μg peptides) was used for sequential enrichment of phosphopeptides by IMAC and TiO2. The IMAC enrichment was carried out using a PHOS-Select Iron Affinity Gel (Sigma P9740) kit following the vendor-recommended procedure. The sequential enrichment steps were conducted as previously reported (Gao et al., 2017).
Nano Liquid Chromatography-Tandem Mass Spectrometry Analysis
The nanoLC-MS/MS analysis was carried out using an Orbitrap Elite (Thermo-Fisher Scientific, San Jose, CA, United States) mass spectrometer equipped with nano ion source using high energy collision dissociation (HCD). The Orbitrap is equipped with a “CorConneX” nano ion source (CorSolutions LLC, Ithaca, NY, United States) coupled with the UltiMate3000 RSLCnano (Thermo, Sunnyvale, CA, United States). The nanoLC-MS/MS was operated in top-15 data-dependent acquisition HCD-MS/MS mode with multiple charged ions above a threshold ion count of 8,000 with normalized collision energy of 37% as described previously for 10 fractions of global proteome (Wang et al., 2014) and two enriched fractions of phosphoproteomics (Gao et al., 2017).
Protein Identification and Quantification
MS raw data files were converted into MGF files for identification and relative quantitation using Proteome Discoverer version (PD) 1.4 (Thermo-Fisher Scientific). A subsequent database search was performed with Mascot Daemon version 2.3 (Matrix Science, Boston, MA, United States) against the Soybean protein RefSeq database (88,647 entries) downloaded on Dec. 1st, 2014, from NCBInr. The default Mascot search settings were as follows: MS peptide tolerance, 15 ppm; fragment mass tolerance, 0.1 Da; trypsin digestion allowing two missed cleavage with fixed modifications of cysteine carbamidomethylation, N-terminal TMT6plex, and lysine TMT6plex; and with deamidation (NQ), oxidation (M), and phosphorylation (STY) as variable modifications. To estimate the false discovery rate (FDR) for a measure of identification certainty in database search, we employed the target–decoy strategy of Elias and Gygi (2007). Specifically, an automatic decoy database search was performed in Mascot by choosing the decoy checkbox in which a random sequence of database is generated and tested for raw spectra as well as the real database. To reduce the probability of false peptide identifications, we considered as identified only those peptides with significant scores (≥25) at the 99% confidence interval by a Mascot probability analysis greater than “identity.” This required that each confident protein identification involve at least two unique peptide identifications indicated in Mascot. In addition, to confidently locate phosphorylation sites, the phosphoRS 3.0 node integrated in PD 1.4 workflow was also used to cross-validate the results of Mascot as reported (Gao et al., 2017).
For protein quantification, we used those proteins that were identified in all six TMT channels with at least two unique peptides in a TMT experiment (Krey et al., 2018). Intensities of the reporter ions from TMT 6-tags upon fragmentation were used for quantification, and the relative quantitation ratios were normalized to median protein ratio for the 6-plex in the dataset. We used Mascot database search engine for processing TMT-based quantitative global proteomics and phosphoproteomics datasets, in which we employed the target–decoy strategy as a measure of identification certainty in database search with 1% FDR as a cutoff. Quantitative comparison of the triplicate samples between the two groups was undertaken with Microsoft Excel software using a student t-test. To identify DAPs related to root-necrosis caused by the rn1 mutation, the quantifiable proteins were tabulated and their differential abundance ratio (treated/control) was log2 transformed. The log2 fold values, hereafter referred as fold change (FC), were fit to a normal distribution to obtain the standard deviation of the quantified proteome. The DAPs between rn1 mutant and wild-type 322 were listed using a cutoff of FC value between the rn1 and wild-type 322 based on the criteria of the p-values ≤ 0.05 and FC values ≥ 1.5 or ≤0.67.
The mass spectrometry proteomics data have been deposited to the ProteomeXchange Consortium via the PRIDE partner repository with the dataset identifier PXD032226.
Bioinformatics Analysis of Proteins
The transcripts of genes encoded the DAPs and phosphorylated proteins were obtained using the fragments per kilobase of exon model per million mapped (FPKM) reads according to the file (genes.fpkm_tracking) listed in the directory of Glycine max Wm82.a2.v11 of the Phytozome V13 database (Severin et al., 2010; Goodstein et al., 2012). A stringent filtering criterion of FPKM value 1.0 (equivalent to one transcript per cell; Mortazavi et al., 2008) in the root was used to identify the root-specific expression level of the genes encoding DAPs and phosphoproteins.
The DAPs and phosphorylated proteins were classified into different categories of gene ontology (GOs), biological processes and molecular functions by using GOatools2.
Molecular functions of the identified DAPs were annotated by Plant MetGenMap Mercator (Joung et al., 2009) and Kyoto Encyclopedia of Genes and Genome (KEGG) databases (Kanehisa et al., 2017), which were separately performed online3. The pathways of the DAPs including 12 phosphorylated DAPs were generated using MapMan software4.
Results
Identification of Differentially Accumulated Root Necrosis-Related Proteins Regulated by Rn1
The rn1 mutant exhibited a root necrotic phenotype and enhanced tolerance to the oomycete pathogen P. sojae (Kosslak et al., 1997). To better understand the mechanisms regulated by the Rn1 protein, we compared the root proteomes of the wild-type T322 (Rn1) and mutant T328H (rn1) lines. We used a TMT mass spectrometry-based quantitative proteomics approach to identify the proteins that were differentially accumulated between the lines. Six TMTs were used to label three replicates of necrotic root tissues of the rn1 (T328H) mutant and three of healthy root tissues from the wild-type progenitor T322 plants (Figure 1 and Supplementary Figure 1).
We detected 3,160 proteins, of which 2,180 were found in at least two replications of both necrotic and healthy root tissues. Of the 2,180 proteins, the 150 were DAPs between rn1 and T322 roots, regulated presumably by Rn1, which were selected for further investigation (Table 1). Among the 150 DAPs, 118 showed ≥ 1.5-fold increase and 32 showed ≤ 0.67-fold decrease in the necrotic root tissues as compared to that in the healthy root tissues at p ≤ 0.05. Genes encoding 138 of the 150 DAPs showed detectable expression levels (Transcript Number ≥ 1) in roots of the soybean cultivar Williams 82 (Table 1).
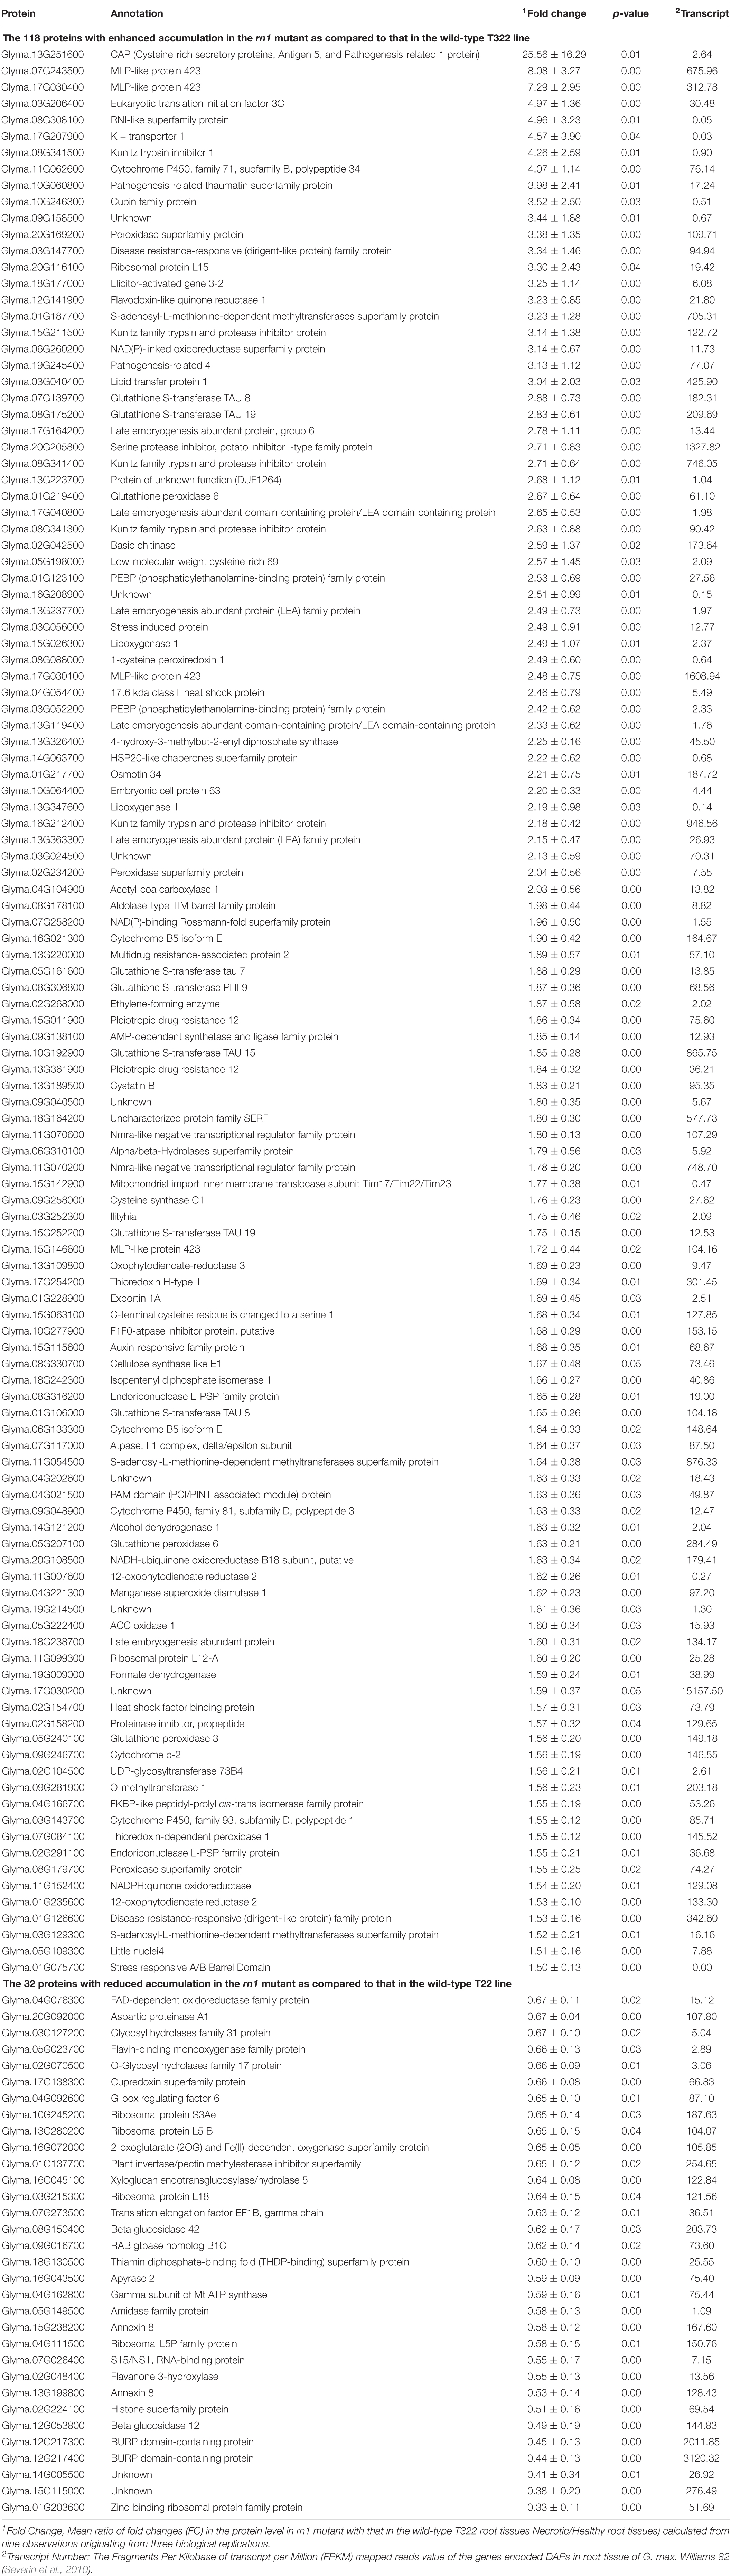
Table 1. The 150 differentially accumulated proteins between rn1 and T322 wild-type lines.
Functional Annotation of Differentially Accumulated Proteins
To understand the role of the 150 DAPs in the spontaneous cell death process leading to root necrosis, DAPs were classified based on biological processes, cellular components and molecular functions by using the plant GO database (Harris et al., 2004). As shown in Figure 2, the DAPs were grouped into 17 basic biological processes including cellular process, metabolic process, single-organism process, response to stimulus, and biological regulation. According to cellular components, the DAPs were grouped into 12 types including cell part, cell, organelle and membrane. Based on molecular functions, the DAPs were grouped into eight classes including binding, catalytic activity, and transporter activity.
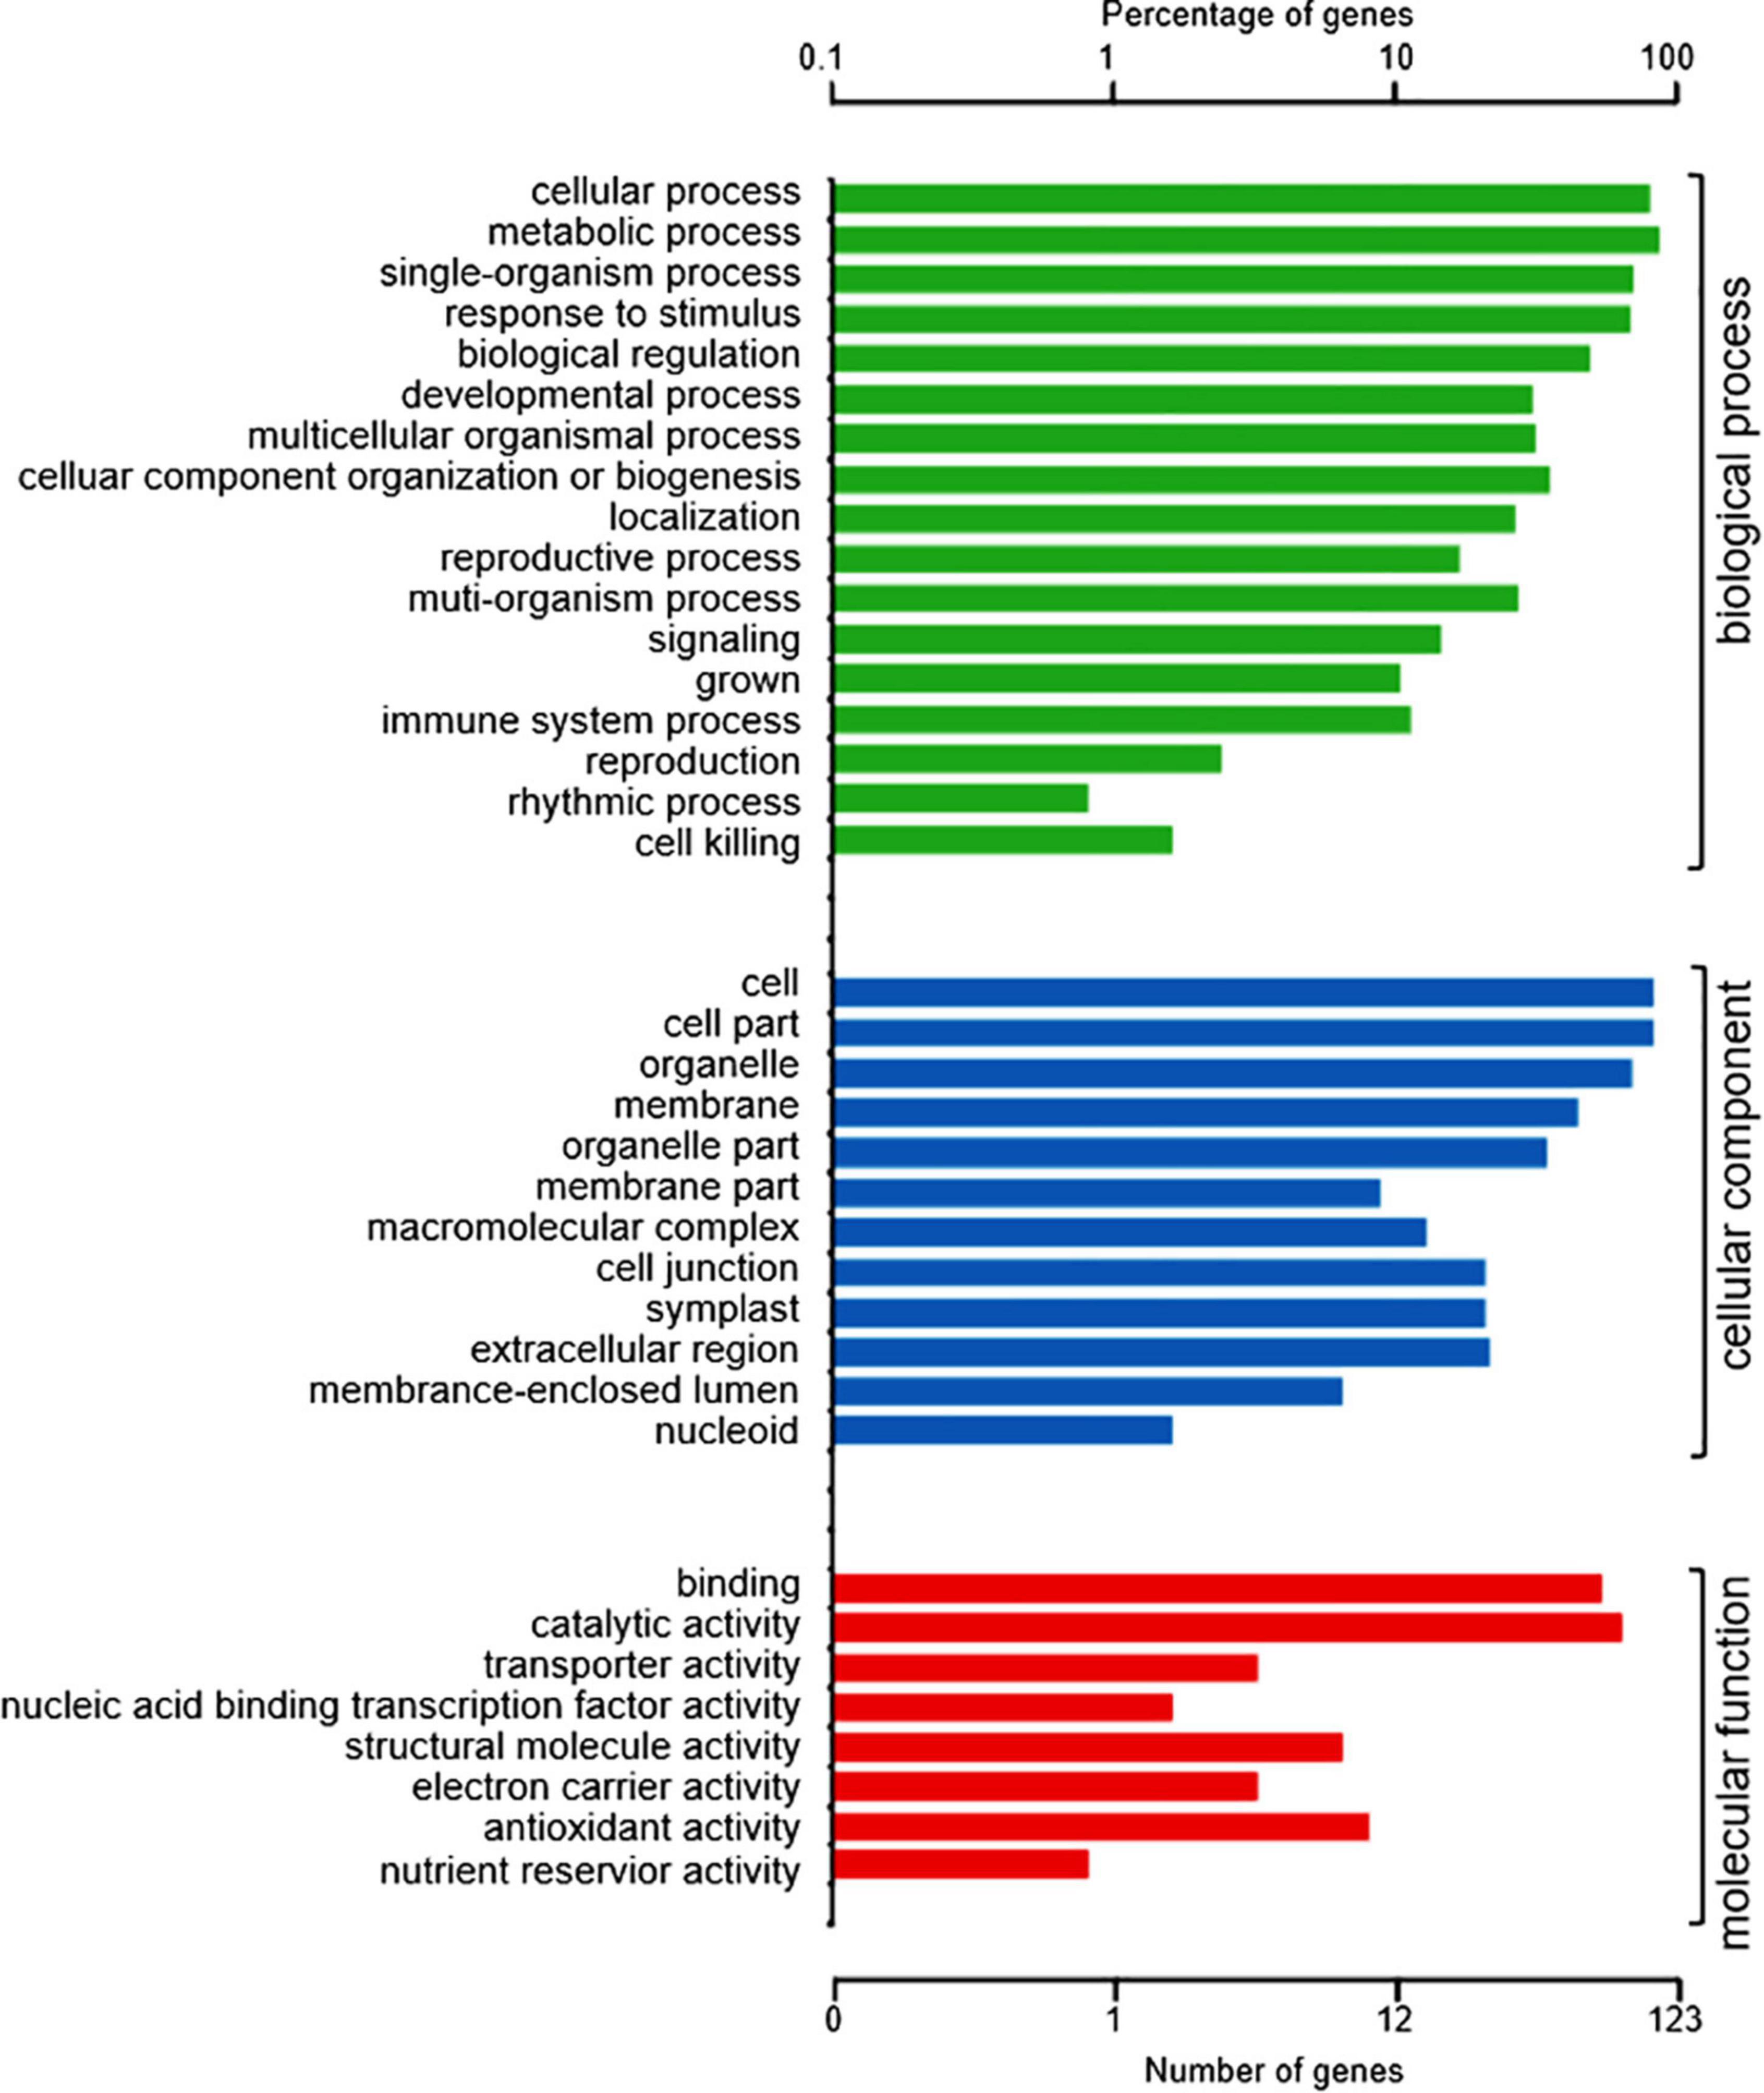
Figure 2. GO annotation of the 150 DAPs between necrotic (rn1) and healthy (T322) root tissues. The DAPs were classified into three categories: biological process, cellular component, and molecular function, based on GO terms.
Based on the plant-specific database of Clusters of Orthologous Groups of proteins (COGs; Tatusov et al., 2003), the 150 DAPs were classified into 17 groups (Supplementary Figure 2). As expected, there were more upregulated proteins than down-regulated ones among 12 of the categories. In five categories, viz. (i) nucleotide transport and metabolism, (ii) carbohydrate transport and metabolism, (iii) intracellular trafficking, and vesicular transport, (iv) chromatin structure and dynamics, and (v) translation, ribosomal structure and biogenesis, more down-regulated proteins than upregulated proteins were represented in the rn1 mutant compared to T322 wild-type line suggesting that transcription and translation machineries may be suppressed in the necrotic root tissues.
Differentially Accumulated Proteins Involved in Metabolic Pathways
To understand how the rn1 mutation affects the accumulation of proteins among the known pathways, we analyzed the proteins using the Kyoto Encyclopedia of Genes and Genomes (KEGG) pathway database. This database is an ideal tool to predict the gene function by linking genomic information with higher order functional information of cellular processes including metabolism, membrane transport, signal transduction and cell cycle (Kanehisa et al., 2017). The overall enrichment of the 150 DAPs is shown in Figure 3A. The majority of the DAPs are involved in metabolism (46.71%). Accumulation patterns of a large number of uncharacterized soybean proteins (27.63%) and with unknown function (15.79%) are also affected by the rn1 mutation. DAPs were classified to 42 pathways under five categories with known functions (Figure 3B). Several of the proteins are involved in primary and secondary metabolism. Pathways enriched among the DAPs include glyoxylate and dicarboxylate metabolism, propanoate metabolism, cyanoamino acid metabolism, sulfur metabolism, arachidonic acid metabolism, alpha-linolenic acid metabolism, linolenic acid metabolism, carbon fixation in photosynthetic organ, terpenoid backbone biosynthesis, isoflavonoid biosynthesis, and phenylpropanoid biosynthesis. DAPs were mapped to pathways using MapMan bin codes (Supplementary Figure 3). The 21 DAPs were found to be associated with RNA-protein syntheses pathways (Supplementary Figure 4).
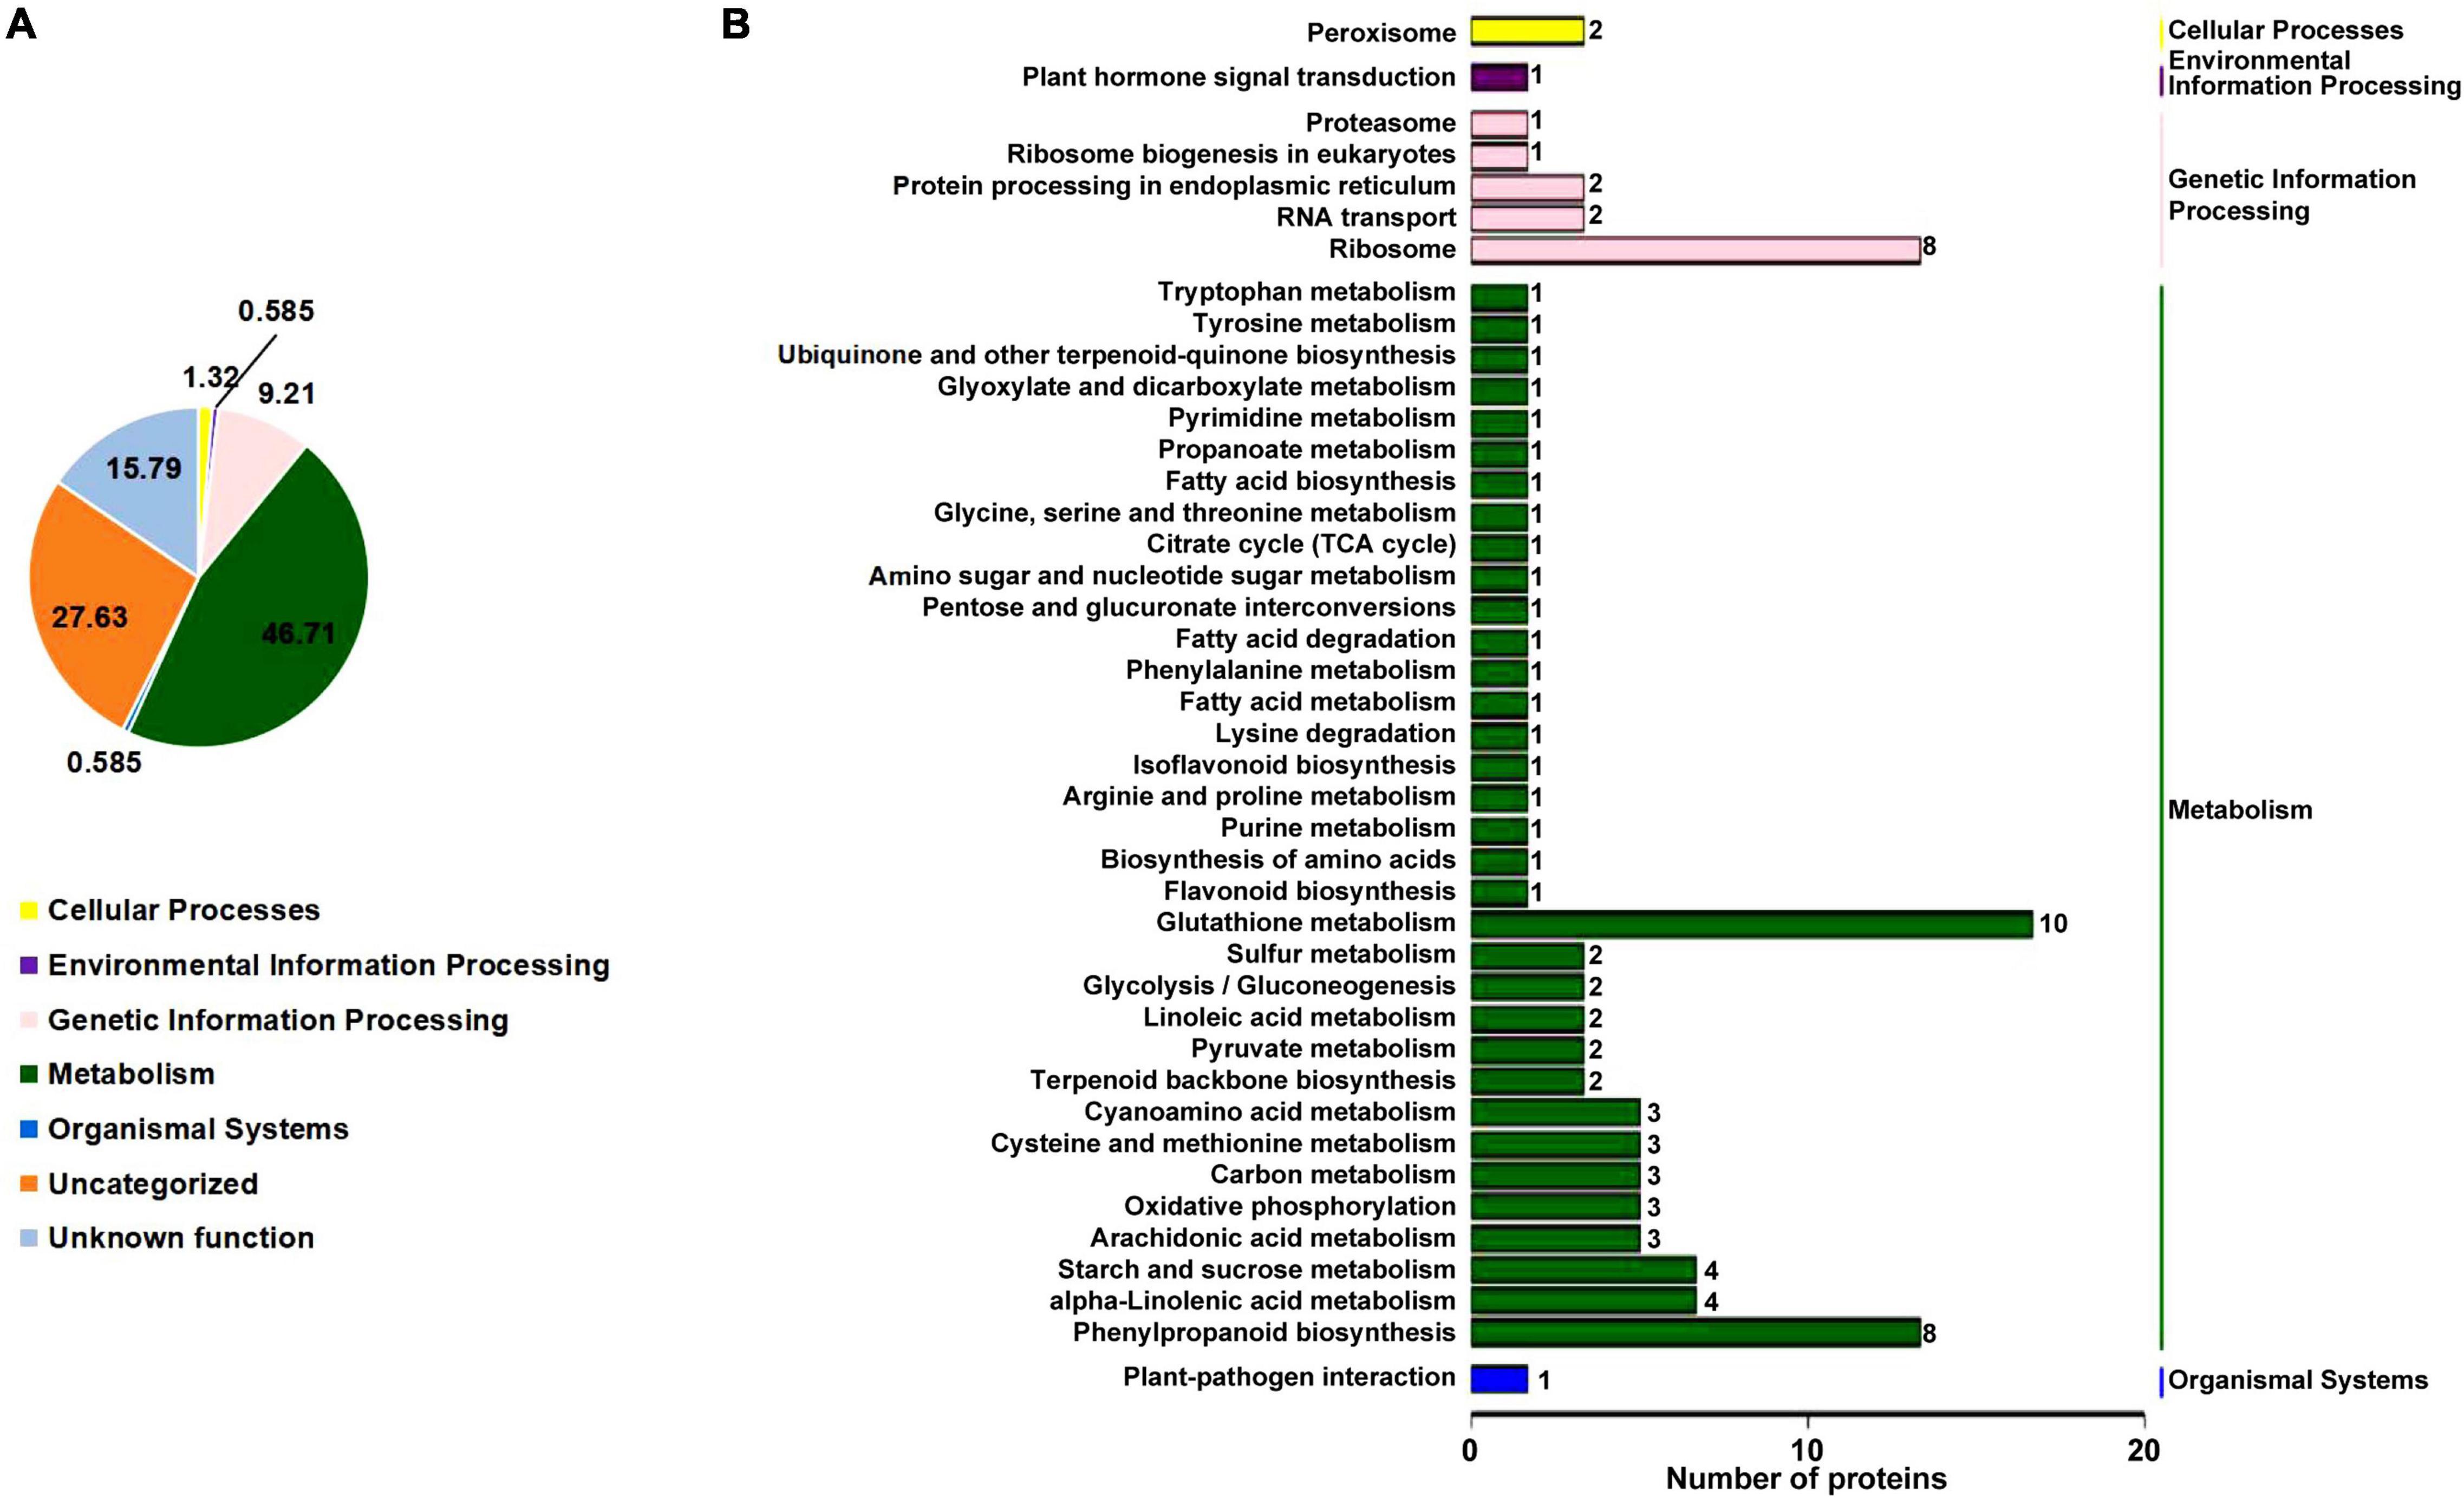
Figure 3. KEGG pathway enrichment analysis of the DAPs. (A) Based on the KEGG database pathway information, the DAPs were classified into five known categories; viz., cellular process, environmental information processing, genetic information processing, metabolism, and organismal systems. Note that 15.79% of the proteins have no known functions. (B) Specific pathways and number of proteins in each pathway classified under each of the five categories of the DAPs with known functions shown in (A) are presented. The five categories are shown on the right side of (B). The number of proteins among the pathways is presented at the end of each bar.
Differentially Accumulated Proteins Involved in Biotic and Abiotic Stress Pathways
The rn1 mutation enhances tolerance to the oomycete pathogen P. sojae in soybean (Kosslak et al., 1997). Plants respond to pathogen attacks by a rapid change in gene expression levels leading to accumulation of biotic stress-related defense proteins and metabolites or compounds. MapMan was used to analyze the 150 DAPs to determine which DAPs are involved in pathways that are activated by biotic and abiotic stresses. Among the 150 DAPs, 53 and eight DAPs were found to be involved in biotic and abiotic stresses, respectively, (Figure 4).
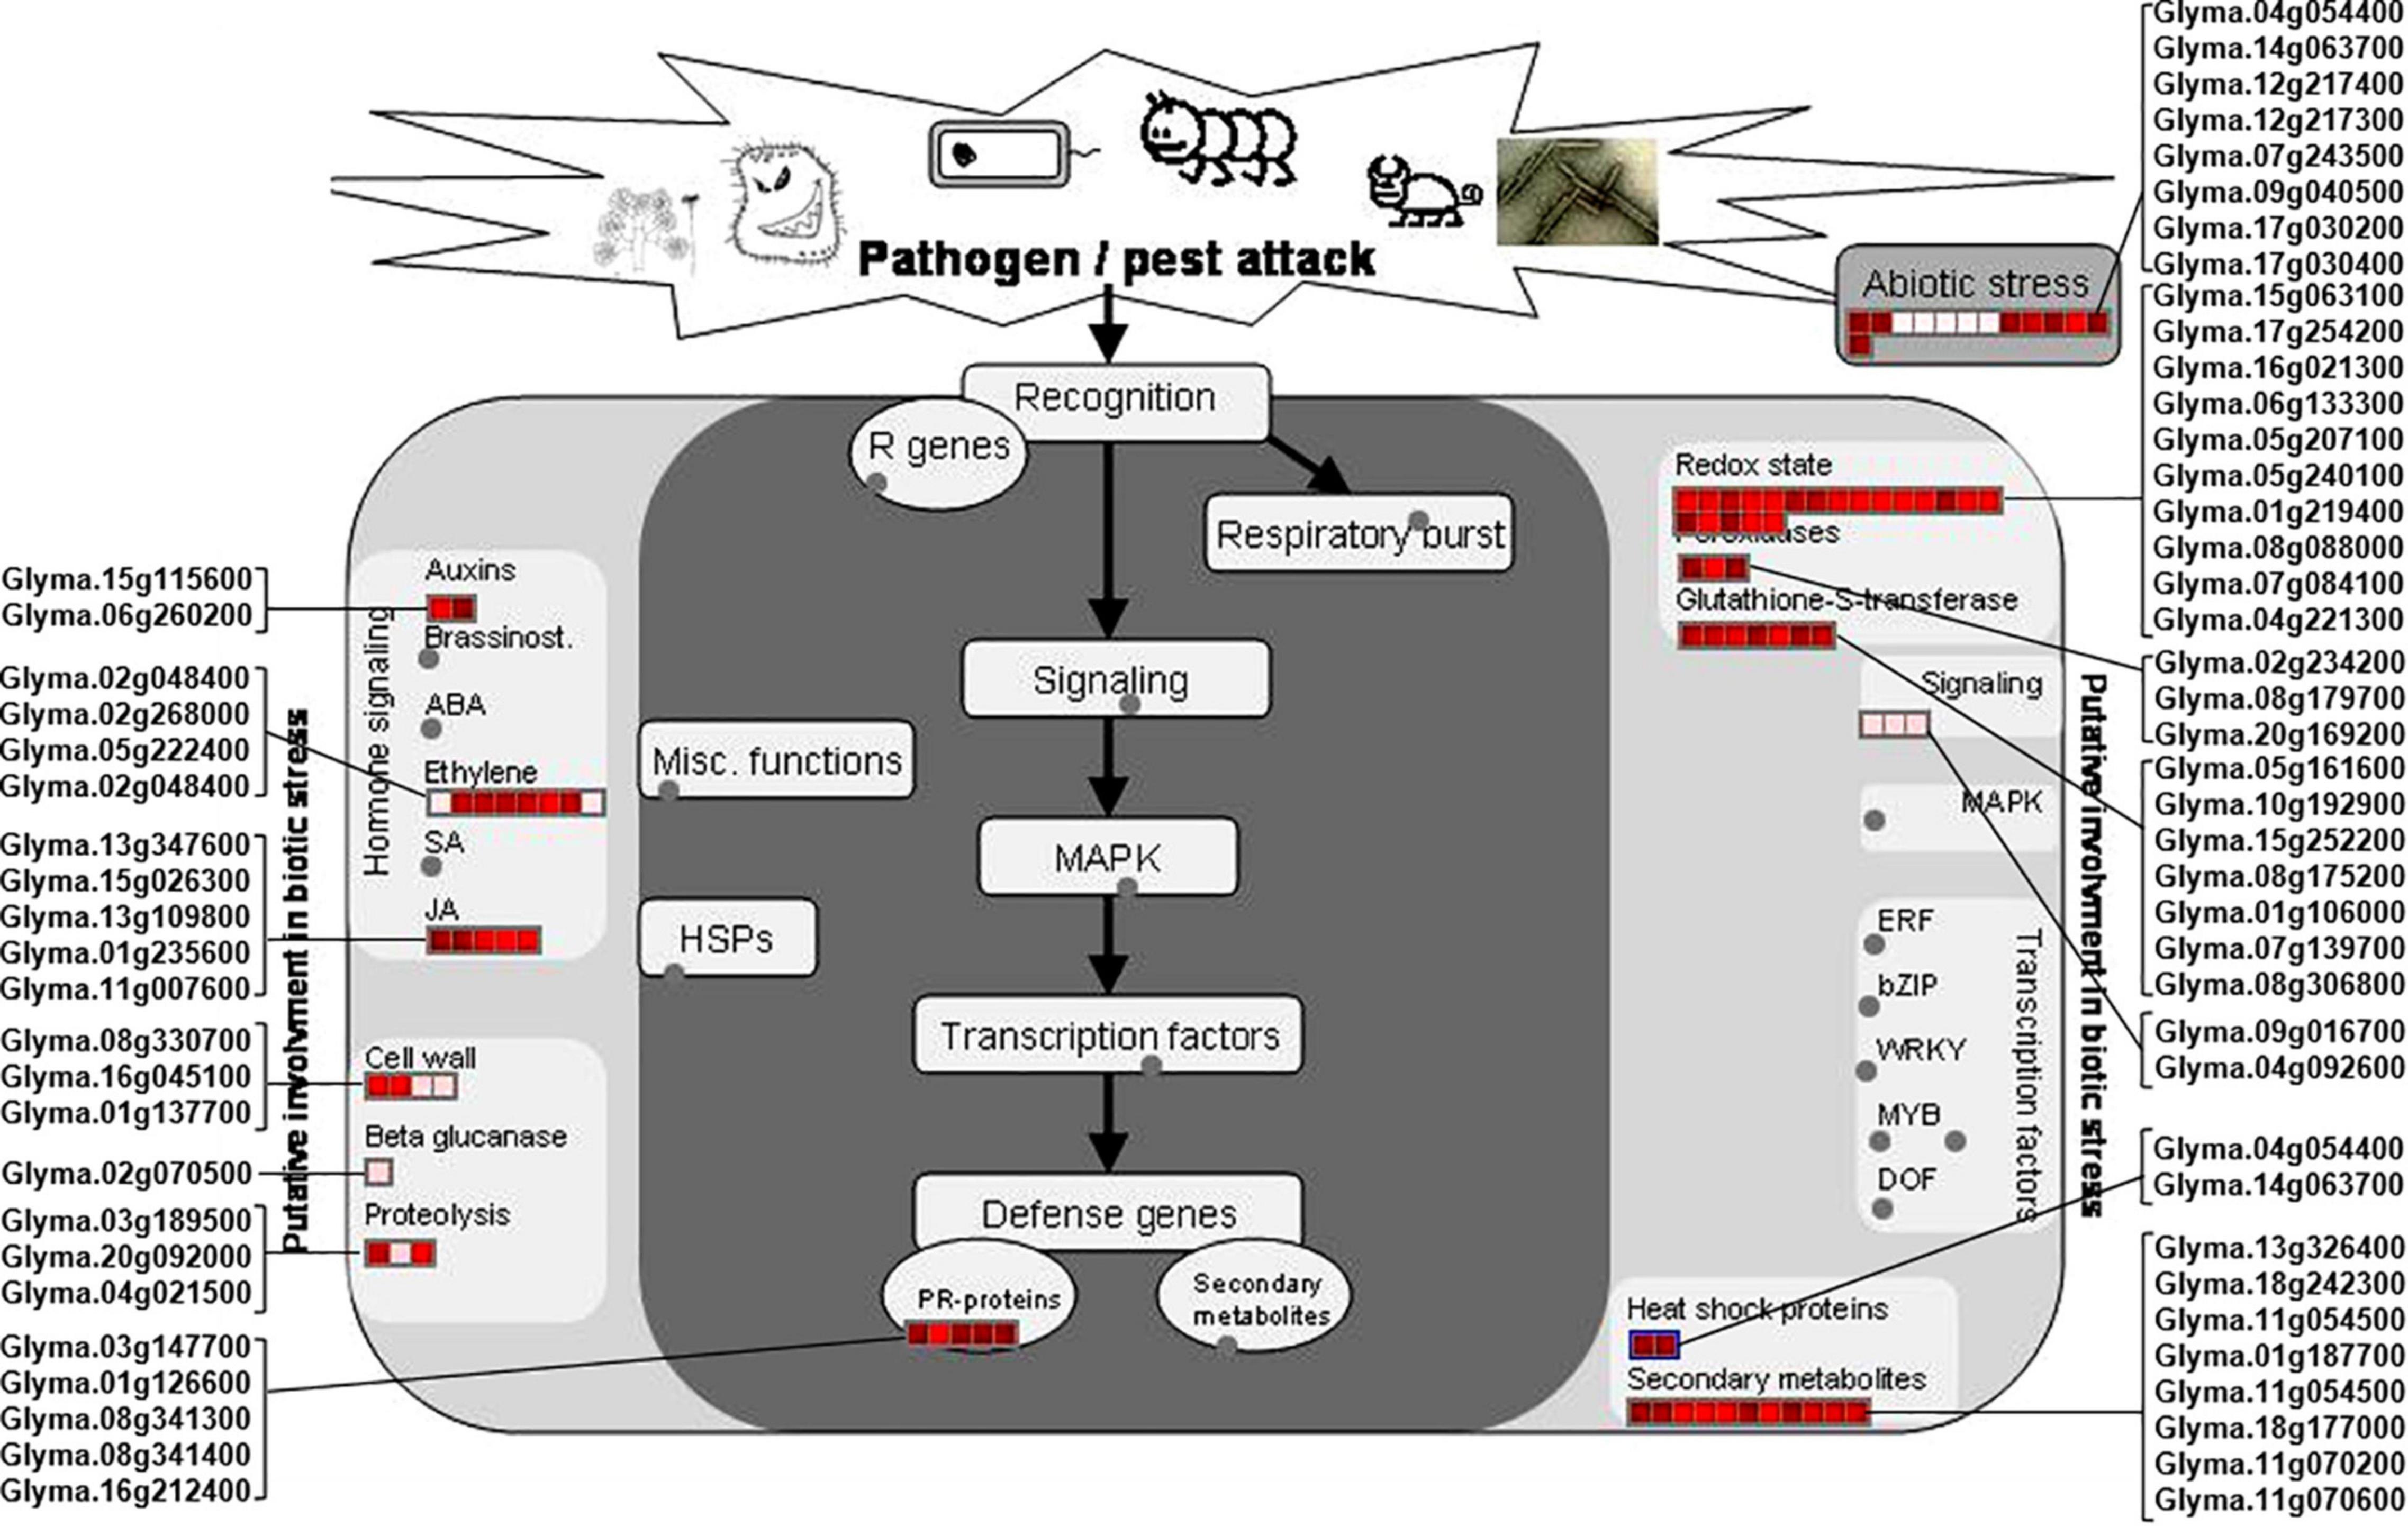
Figure 4. DAPs involved in pathways induced by biotic and abiotic stresses. The DAPs involved in plant biotic and abiotic stresses were mapped using MapMan software. Proteins involved into the biotic and abiotic stresses are presented in red font. The scale represented the fold changes of DAPs, which is presented in the upper left corner of the figure.
Of the identified biotic stress-related proteins, five DAPs (Glyma.01g126600, Glyma.03g147700, Glyma.08g341300, Glyma.08g341400, and Glyma.16g212400) are pathogenesis-related (PR) proteins are highly induced in the rn1 mutant as compared to that in T322. They are also expressed in roots and could be involved in enhancing tolerance to P. sojae (Figure 4).
Several DAPs responsive to biotic stress are involved in hormone signaling, redox reaction, signal transmission, cell wall modification, and synthesis of secondary metabolites observed in plant–pathogen interaction process. For example, 11 DAPs, auxins-associated proteins (Glyma.15g115600 and Glyma. 06g260200), ethylene-associated proteins (Glyma.02g048400, Glyma.02g268000, Glyma.05g222400, and Glyma.02g048400), and JA-associated proteins (Glyma.13g347600, Glyma. 15g026300, Glyma.13g109800, Glyma.01g235600, and Glyma.11g007600), participate in hormone-regulated defense signaling pathways and mediate the biosynthesis of plant defense compounds (Figure 4).
Identification of Phosphorylated Proteins
Protein phosphorylation is a key mechanism involved in regulating protein functions. In this study, we identified a total of 573 phosphopeptides of 146 proteins through LC-MS/MS analysis (Supplementary Table 1). Of the 573 phosphopeptides, only 234 were unique phosphopeptides. Of the 234 peptides, only 165 peptides were identified. GO analysis of the phosphorylated 146 proteins assigned the phosphoproteins (PhosPs) to 19 classes based on biological processes, 11 based on cellular components, and 10 based on molecular functions (Supplementary Figure 5). Based on molecular functions, PhosPs were grouped into many classes of proteins with binding and catalytic activity, transporter activity, nucleic acid binding, signal transducer activity, electron carrier activity, molecular transducer activity, molecular function regulator and antioxidant activity. PhosPs with antioxidant activity could be involved in conferring disease resistance.
Among the 146 PhosPs, 143 proteins displayed detectible expression levels in root (Supplementary Table 1). Only two of 143 proteins were found to be significantly changed in their steady state levels (≤0.67-FC, p-value ≤ 0.05) due to the rn1 mutation. One is Phosphoglucomutase/phosphomannomutase family protein (Glyma.05G237000.1), and the other one is an unknown protein (Glyma.16G037900.1). The levels of phosphorylation for these two differentially accumulated phosphoproteins are significantly reduced in the rn1 mutant root tissues as compared to that in the healthy root tissues of T322.
Phosphorylation Levels of Phosphoproteins Affected by the rn1 Mutation
We analyzed the proteomic and phosphoproteomic data to investigate how the rn1 mutation contributes to the phosphorylation statuses of the PhosPs. For this study, we selected 88 PhosPs that contain phosphopeptides with significantly different levels of phosphorylation between the root tissues of rn1 and T322. For each PhosP, nine comparisons were made for “levels of phosphorylation” (A) and “levels of PhosP” (B); i.e., each of the three replications of the rn1 root sample was compared to each of the three root samples of the T322 wild-type plants for phosphorylation levels (A = rn1/T322) or steady state protein levels of PhosP (B = rn1/T322). The “A” values from nine comparisons were then compared to respective nine “B” values from nine comparisons of PhosP levels to obtain nine A/B ratios for each of the 88 PhosPs.
The phosphoproteomics analysis identified 22 phosphopeptides, the levels of phosphorylation of which were significantly different between rn1 and T322 lines (Table 2). Among the 22 phosphopeptides, two showed enhanced phosphorylation levels, and 20 showed reduced phosphorylation levels in the rn1 compared to the wild-type 322. The PhosPs carrying these 22 phosphopeptides were grouped into 14 classes based on basic biological processes, 11 based on cellular components and seven classes based on molecular functions (Figure 5A). In particular, some of these PhosPs are involved in the immune response process.
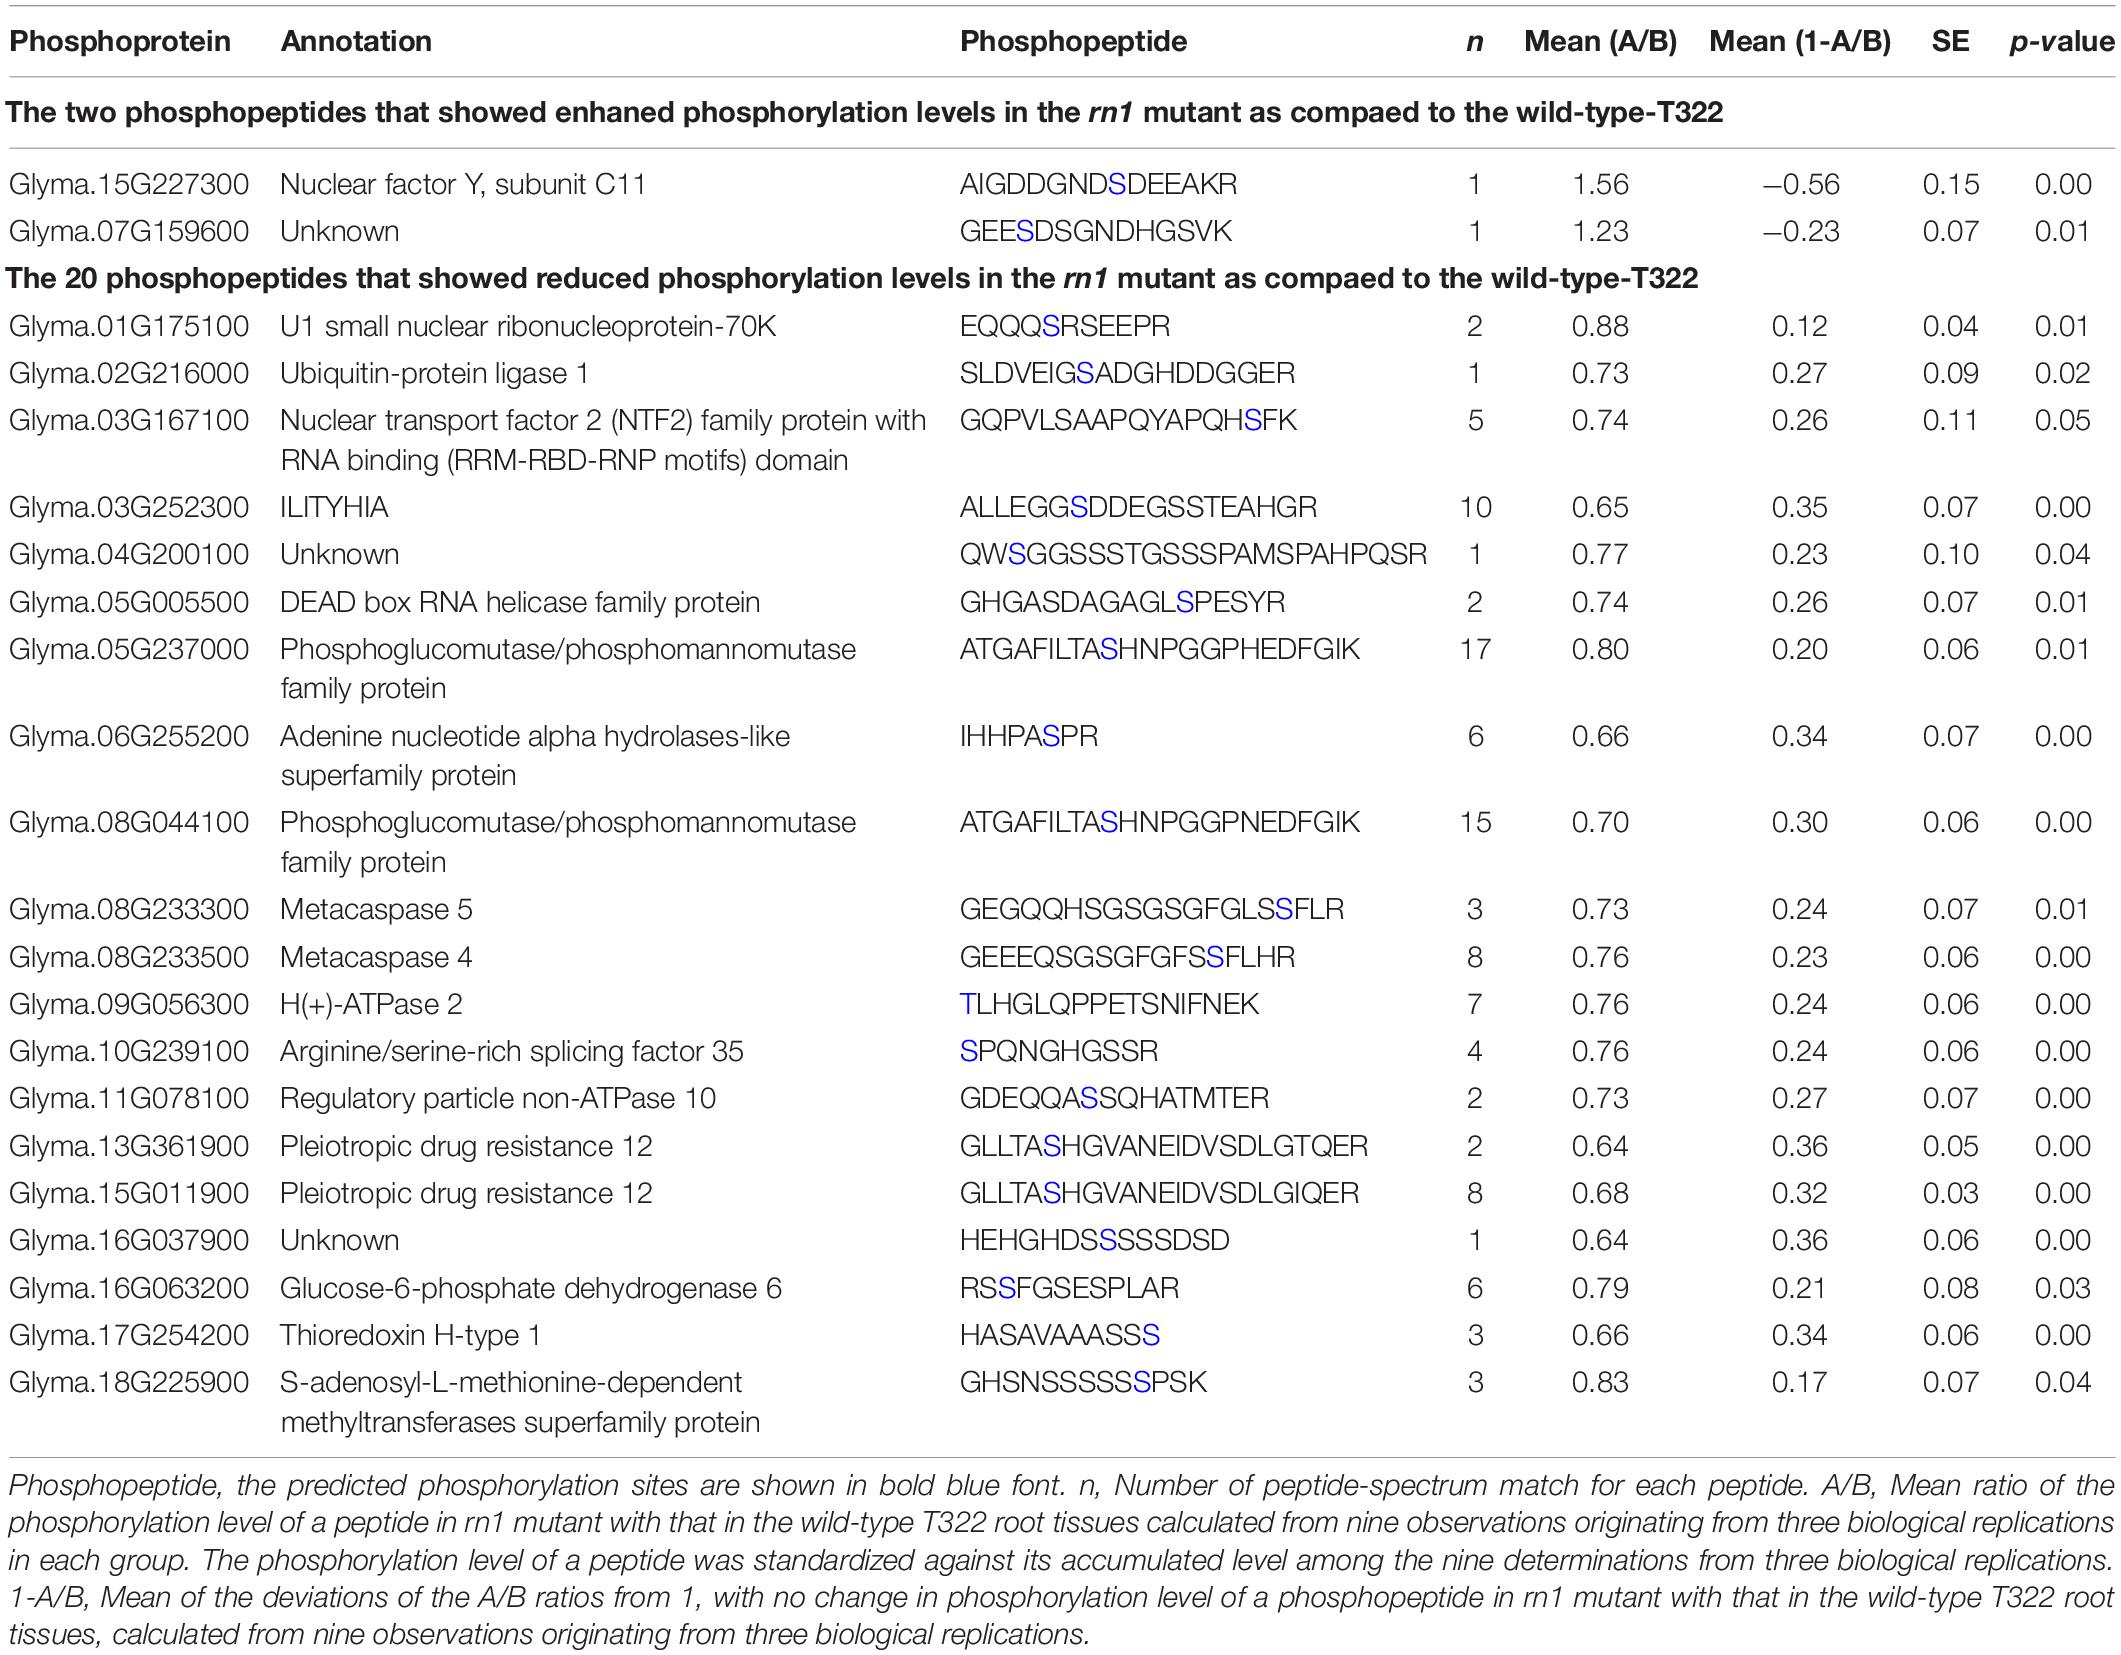
Table 2. Differential phosphorylation levels of 22 phosphopeptides that are detectible.
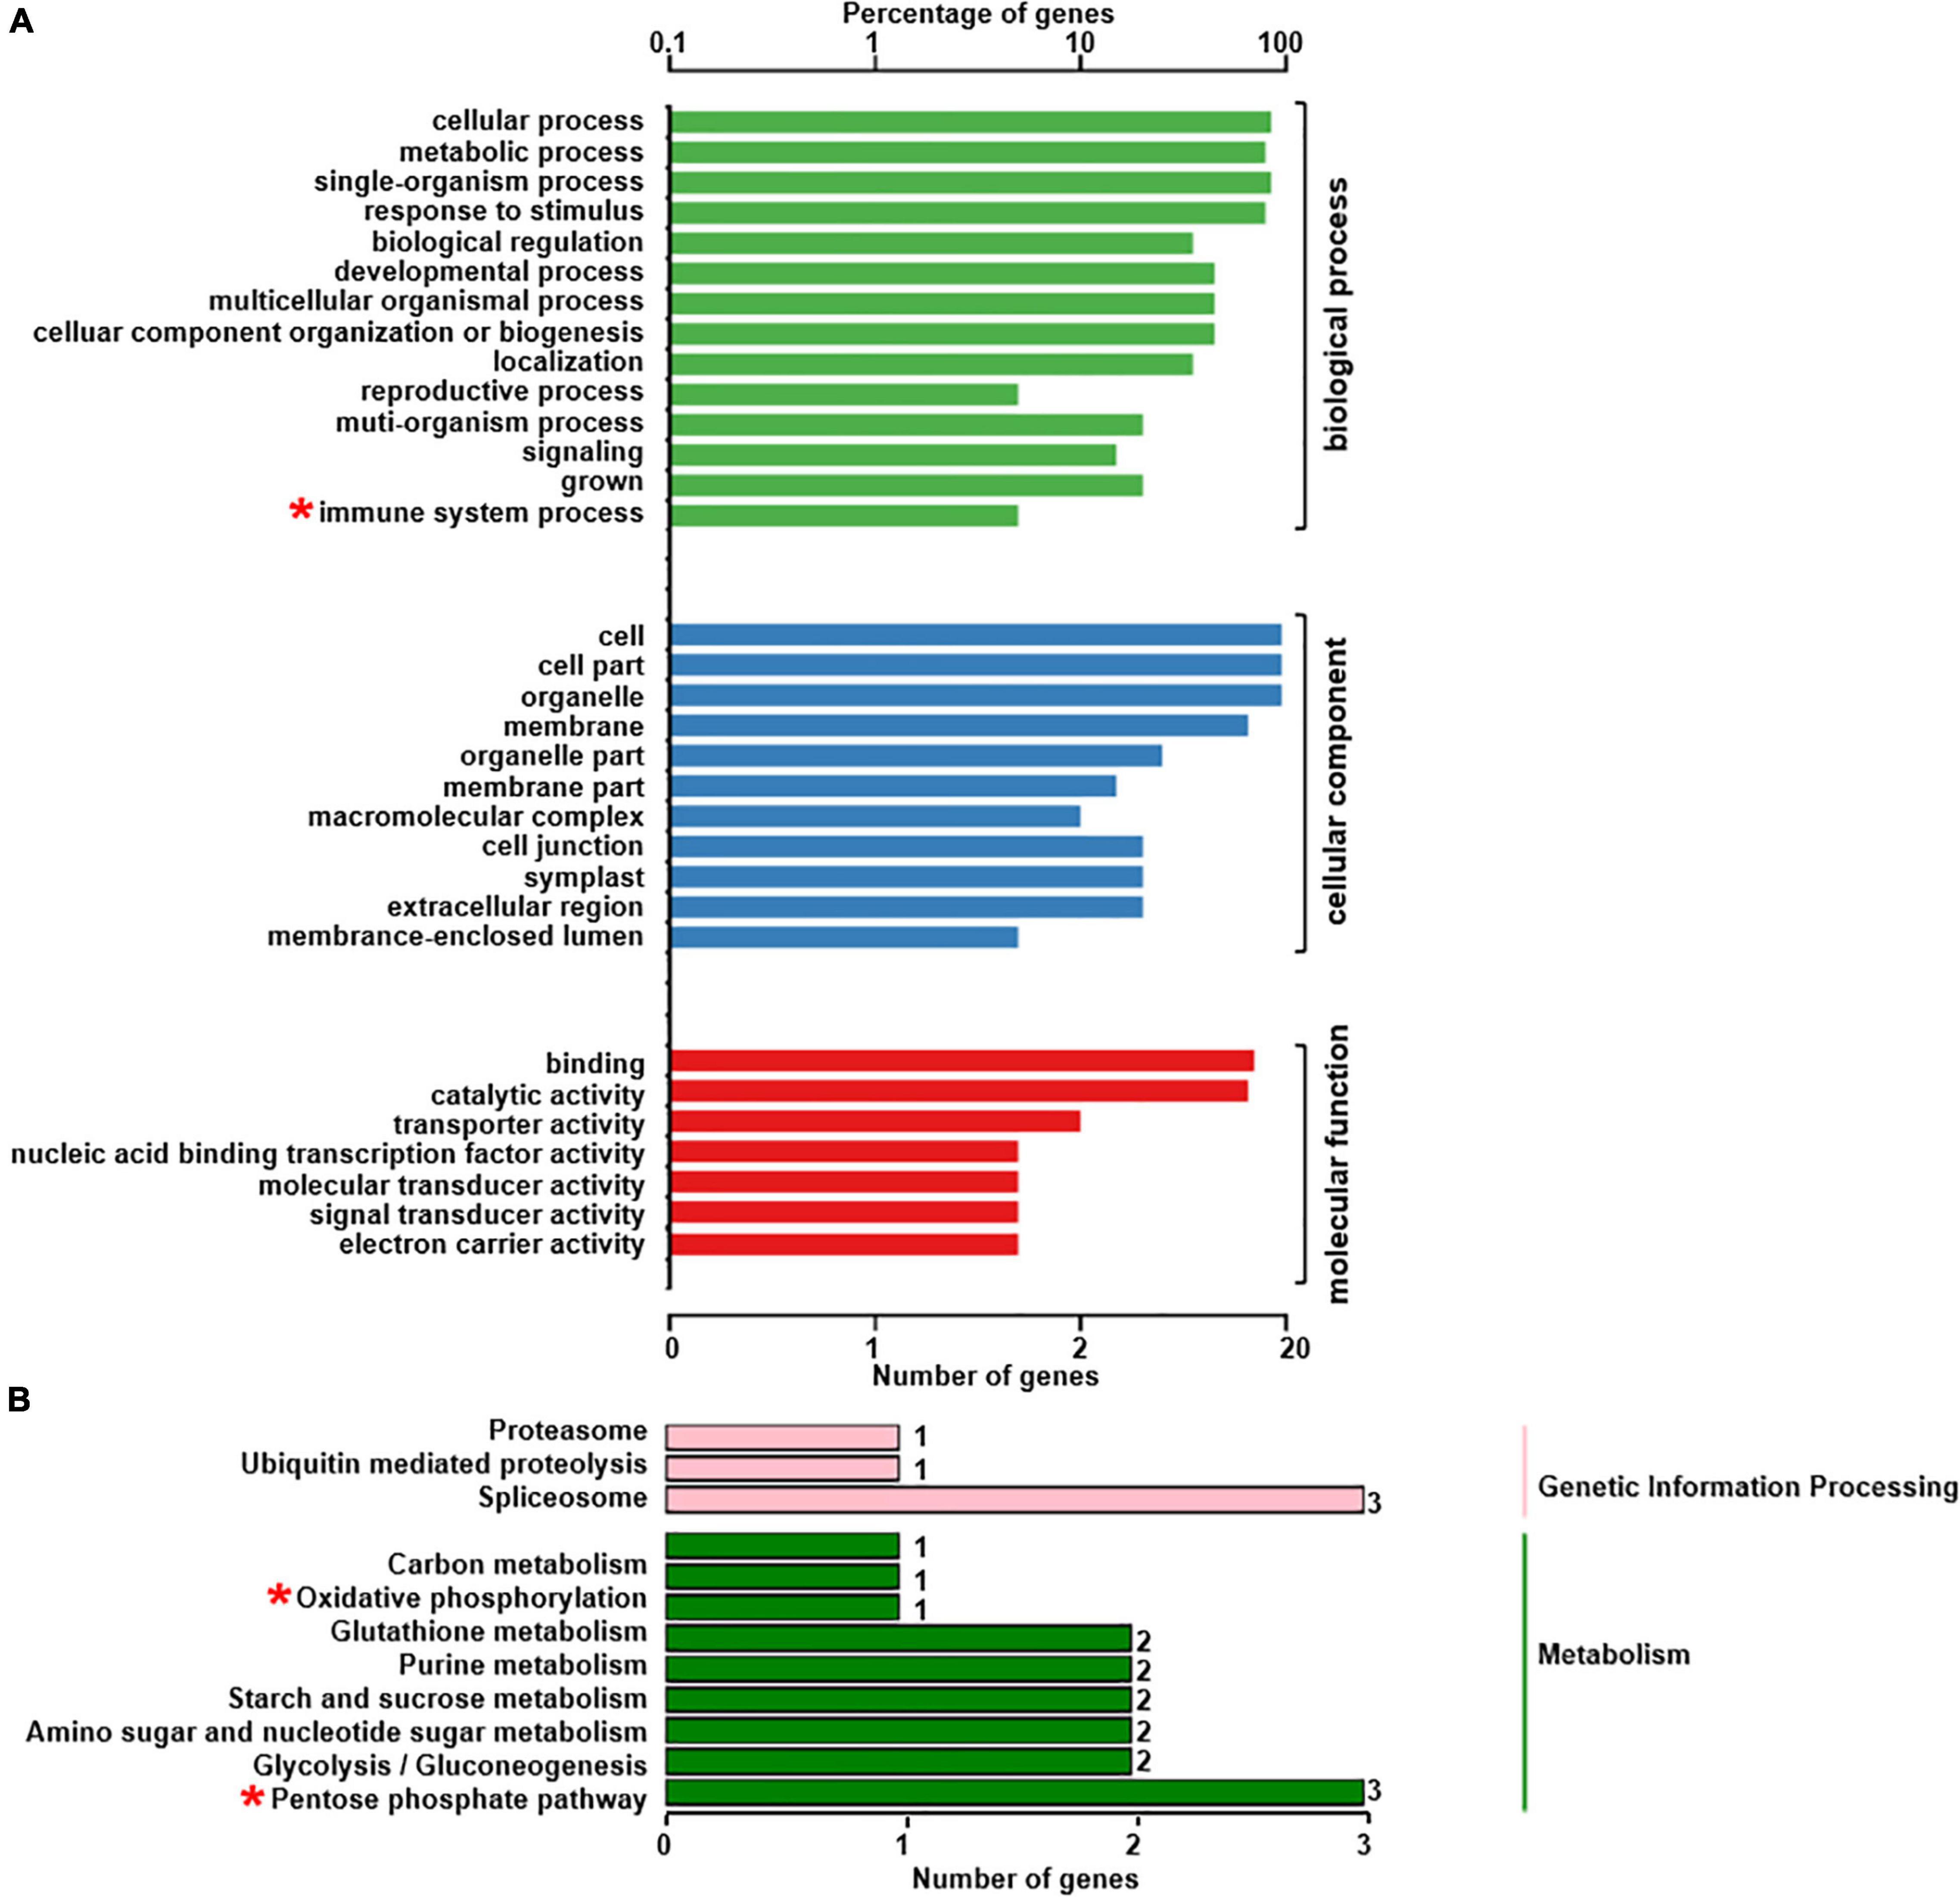
Figure 5. GO and KEGG analysis for 22 phosphoproteins that were detectible (Table 2). (A) Based on GO terms, the phosphoproteins were classified into three categories: biological process, cellular component, and molecular function. (B) Specific pathways and number of phosphoproteins in each pathway classified under each of the two categories. Some phosphoproteins are significantly involved in immune system process, oxidative phosphorylation and pentose phosphate pathway, as indicated by “*”.
The 22 PhosPs were enriched into 12 pathways (Figure 5B). It is clear that some proteins are related to the oxidative phosphorylation and pentose phosphate pathway, viz. (i) H+ ATPase (Glyma.09G056300) involved in oxidative phosphorylation (Supplementary Figure 6); (ii) phosphoproteins related to the pentose phosphate pathway enzymes are glucose-6-phosphate dehydrogenase 6 (Glyma.16g063200 and Glyma.19g082300), phosphoglucomutase/phosphomannomutase (Glyma.08g044100 and Glyma.05g237000) family protein, (Supplementary Figure 7). MapMan analysis revealed that seven of the 22 PhosPs are induced by biotic and abiotic stresses (Figure 6). Especially, phosphorylation levels of two highly similar type II metacaspases (Glyma.08G233300 and Glyma.08G233500) were significantly reduced in the rn1 mutant root tissues as compared to that in the healthy root tissues of T322, suggesting that the dephosphorylation or reduced phosphorylation of type II metacaspases may contribute toward initiating spontaneous cell death observed in roots of the lesion mimic rn1 mutant (Supplementary Figure 8). The phosphopeptides of the Glyma.08G233300 and Glyma.08G233500 with significant differences in phosphorylation levels (Table 2 and Supplementary Table 2), and Glyma.15G219100.1 (Table 3 and Supplementary Table 2) with statistically non-significant reduced phosphorylation level were localized to the C-terminal region of the P20 caspase-like domain (Supplementary Figure 9). The MS/MS spectra of the identified phosphopeptides from all three type II metacaspases (Glyma.08G233300, Glyma.08G233500, and Glyma.15G219100) along with their quantitative changes between the rn1 mutant and wild-type 322 lines are shown in Figure 7.
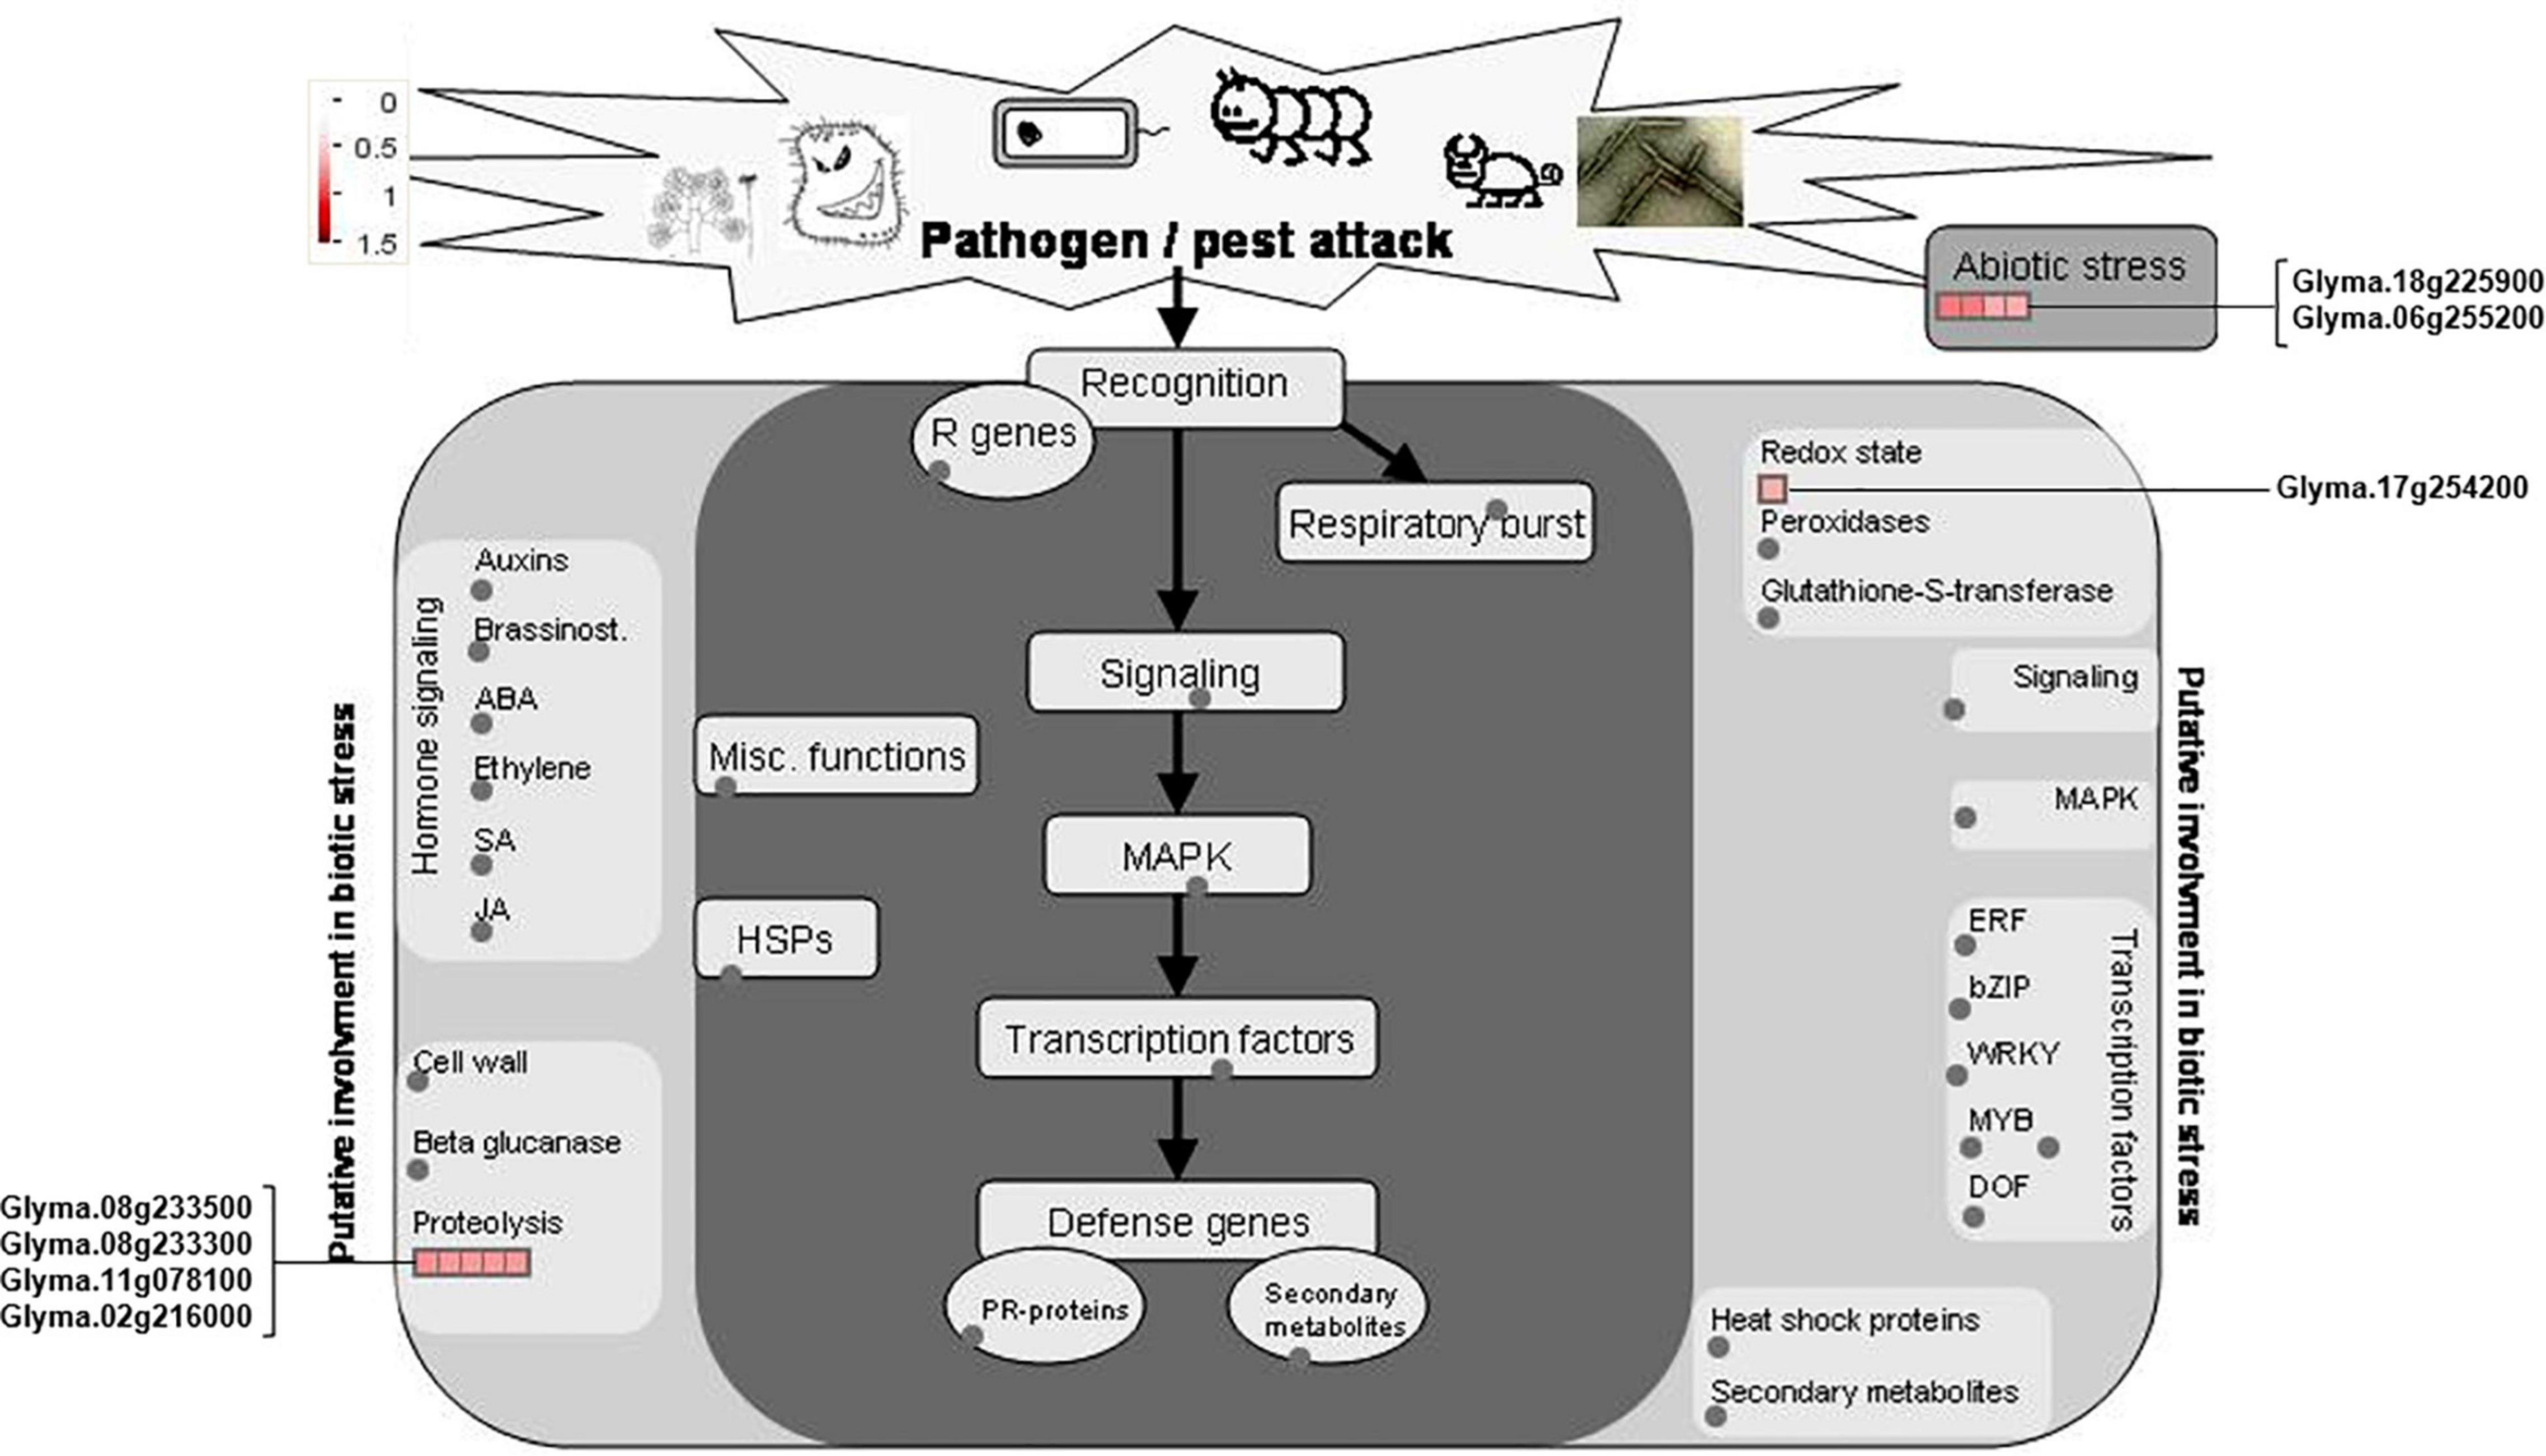
Figure 6. MapMan analysis of 22 PhosPs listed in Table 2. Seven phosphoproteins were induced by biotic and abiotic stresses are shown on both sides of the map.
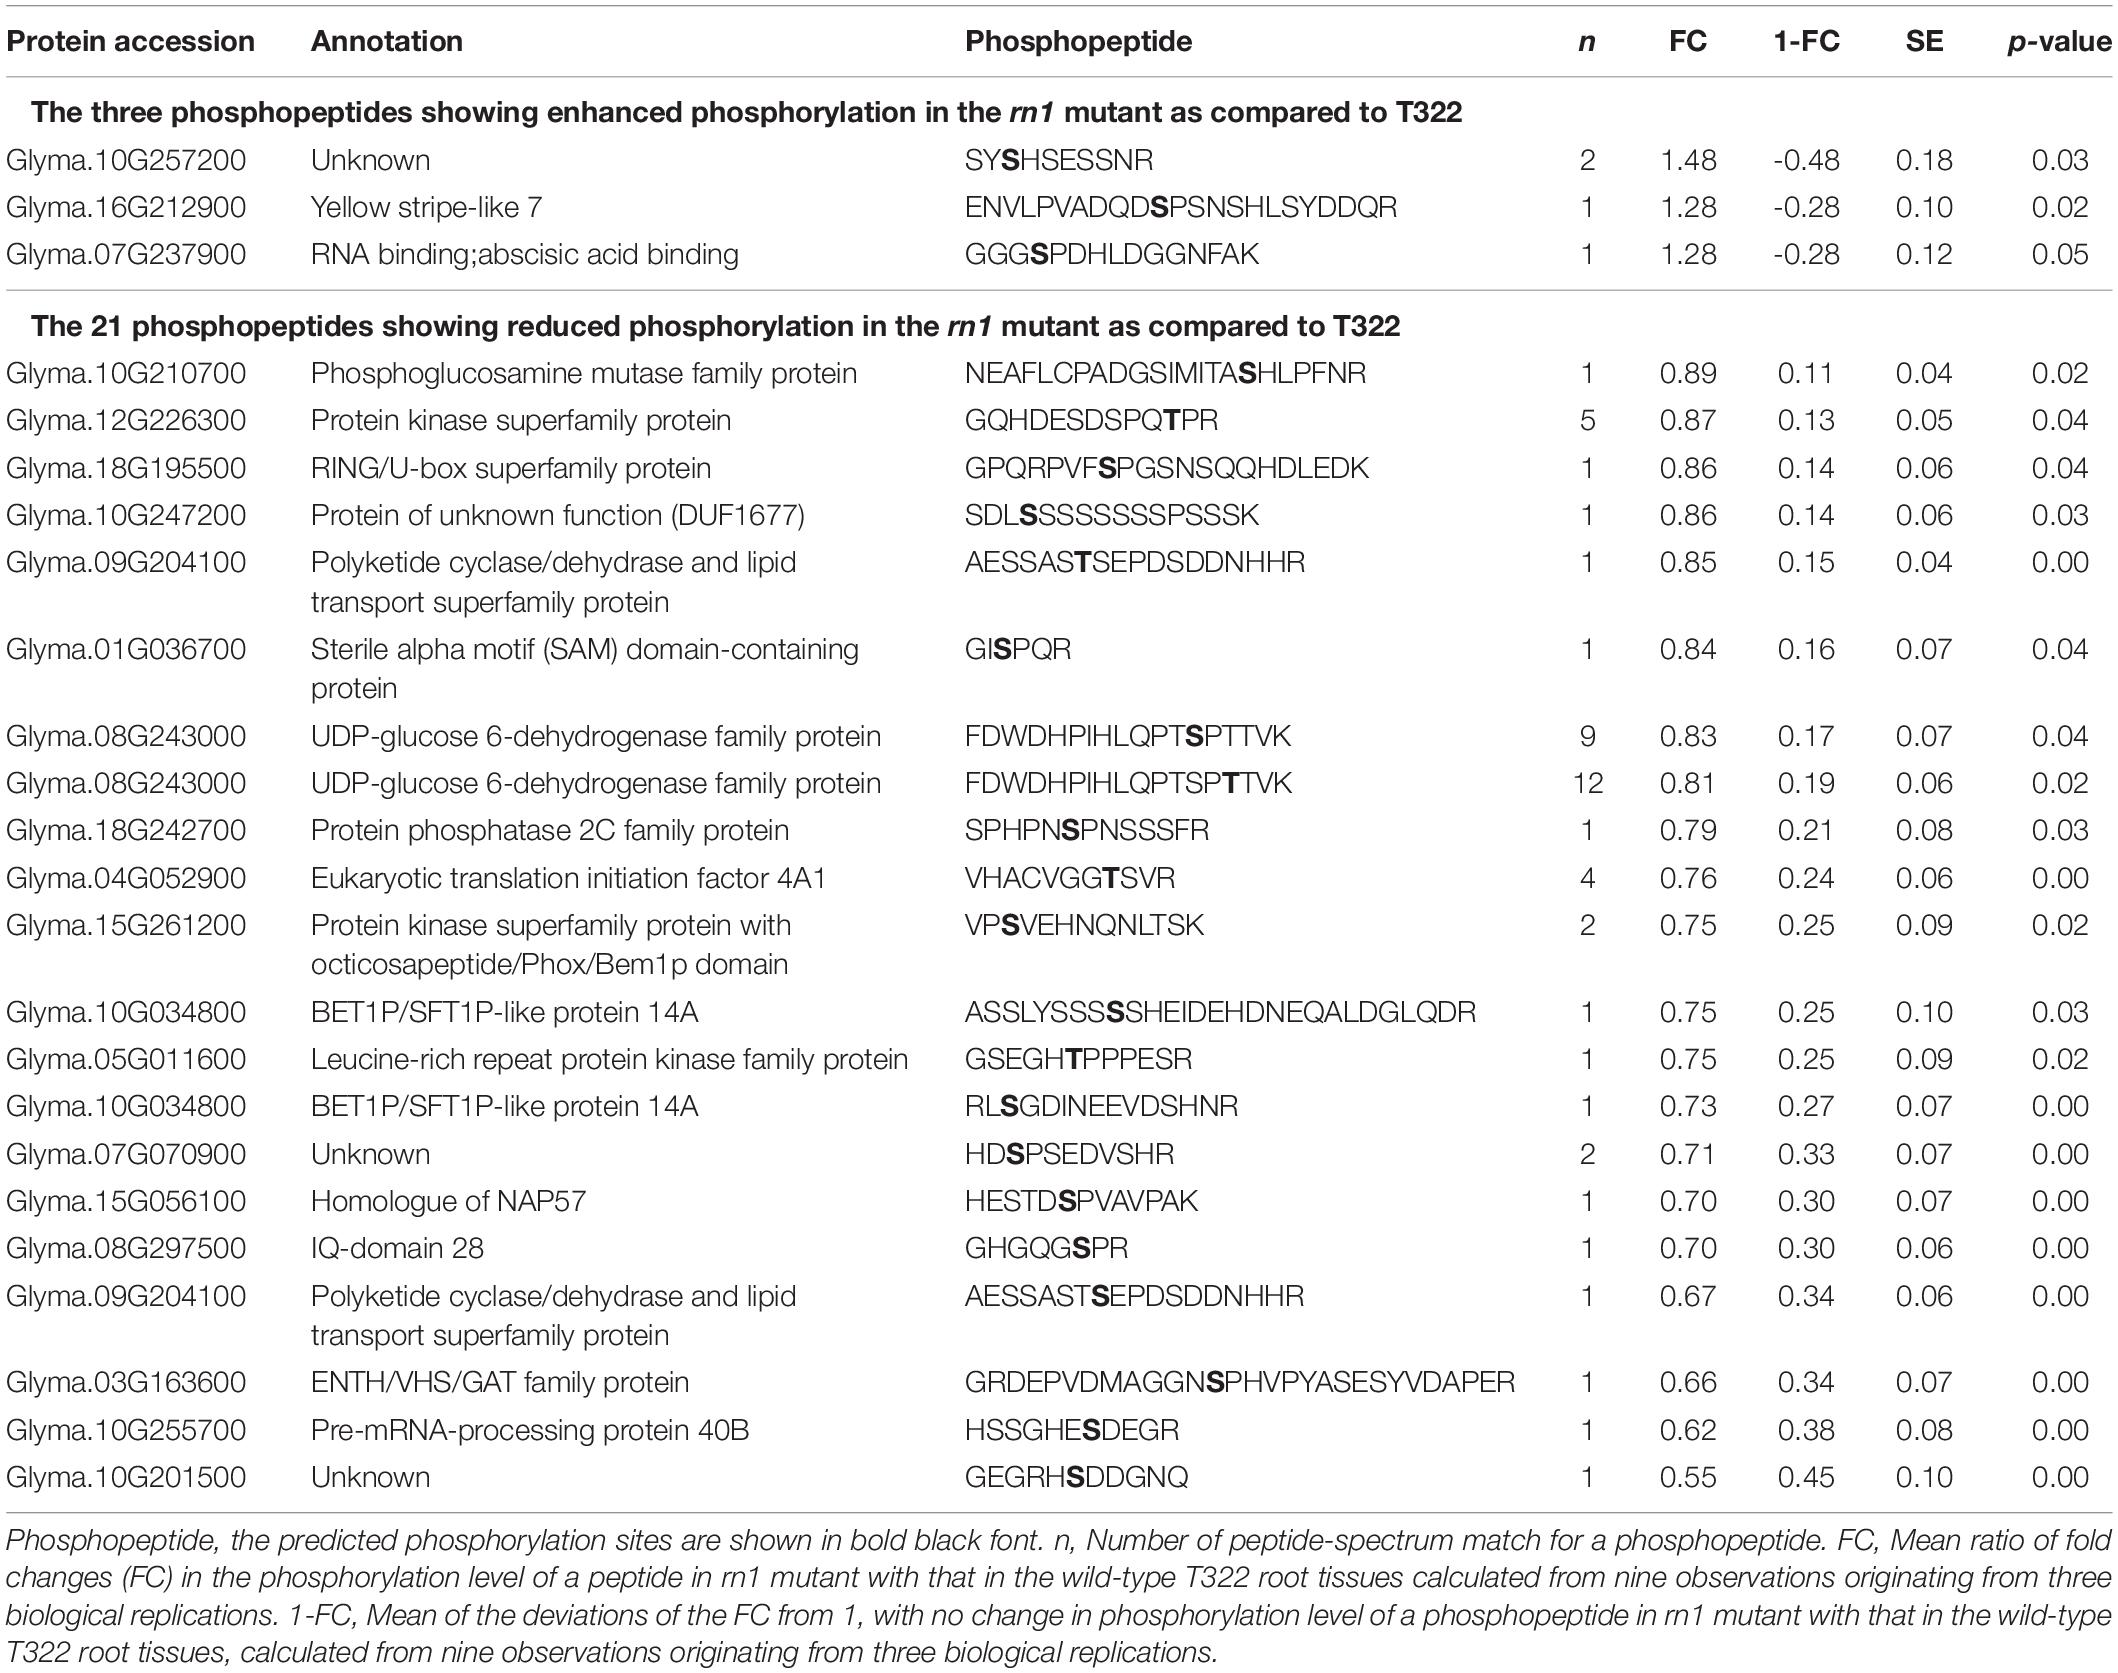
Table 3. Differential phosphorylation of 24 phosphopeptides that are less abundant.
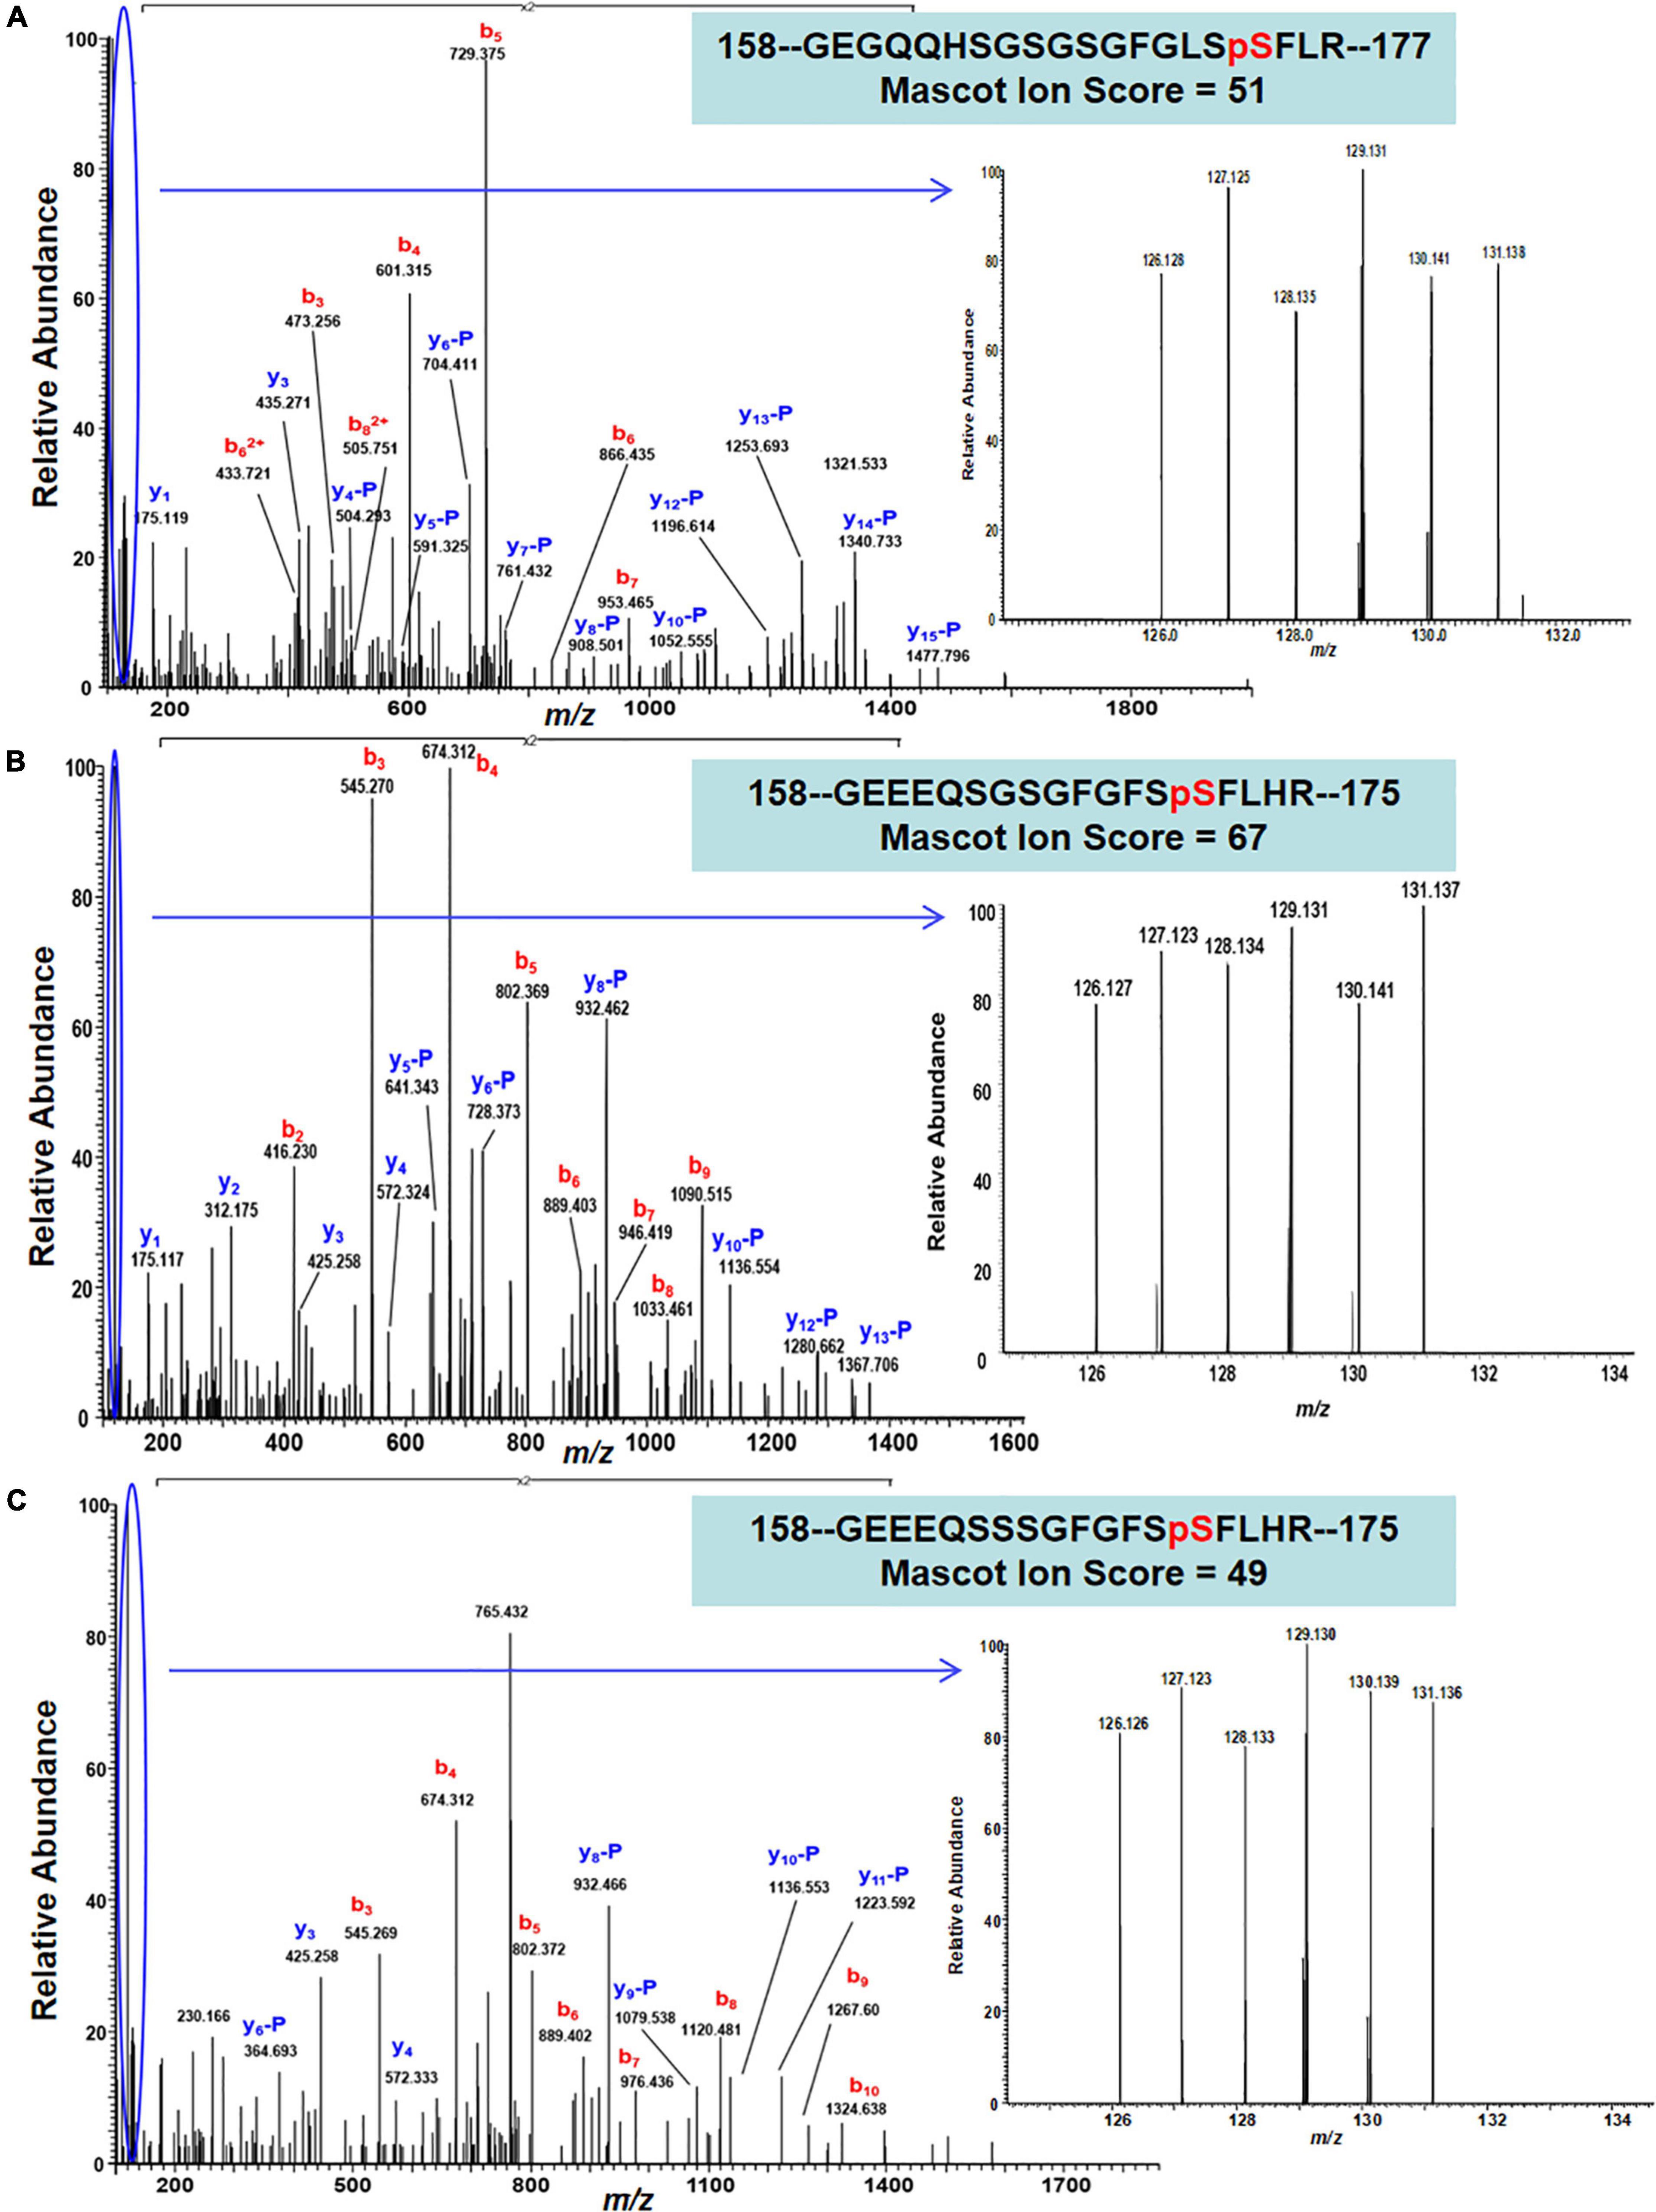
Figure 7. MS/MS spectra show confident identifications of three representative phosphopeptides/sites that were labeled by TMT6-plex from three Metacaspase proteins. (A) An MS/MS spectrum of a triply charged ion at m/z 768.6893+ confidently identifying a TMT-labeled tryptic peptide with S174 phosphorylation site from Metacaspase 5 protein (Glyma.08G233300) between necrotic and healthy roots; (B) an MS/MS spectrum of a triply charged ion at m/z 756.3273+ confidently identifying a TMT-labeled tryptic peptide with S171 phosphorylation site from Metacaspase 4 protein (Glyma.08G233500), and (C) an MS/MS spectrum of a triply charged ion at m/z 766.3303+ confidently identifying a TMT-labeled tryptic peptide with S171 phosphorylation from Metacaspase 4 protein (Glyma.15G219100) between necrotic and healthy roots. The inset of each panel shows the expanded view of relative intensity of 6 TMT reporter ions for determining the abundance changes of the S174, S171, and S171 phosphopeptides in necrotic root triplicate (126, 127, and 128) versus 3 healthy roots (129,130, and 131).
We have identified 24 less abundant PhosPs containing phosphopeptides that exhibited significantly different phosphorylation levels between the rn1 mutant and T322 wild-type root tissues (Table 3 and Supplementary Table 2). The steady state levels of these peptides could not be detected because of their low abundance. Therefore, phosphorylation levels of the 24 phosphopeptides between rn1 mutant and T322 lines could not be compared as in for 22 PhosPs (Table 2), and are considered as candidates for future studies. These phosphopeptides were classified into 15 biological processes, 11 cellular components, and three molecular functions based on GO terms (Supplementary Figure 10A). The 24 phosphopeptides can be classified into nine pathways (Supplementary Figure 10B). MapMan analysis of the 24 phosphopeptides revealed that four proteins (Glyma.08G243000, Glyma.18G195500, Glyma.05G011600, and Glyma.08G297500) involved in biotic and abiotic stresses pathways (Supplementary Figure 11).
Discussion
Lesion mimic mutants have been isolated from multiple plant species (Lorrain et al., 2003) and are ideal for studying the role of cell death in defense responses and molecular mechanisms regulating the PCD process and defense responses in plants (Jones and Dangl, 1996; Mittler and Lam, 1996; Bruggeman et al., 2015). Barley Mlo protein is a negative regulator of immunity against the powdery mildew pathogen Erysiphe graminis f. sp. hordei. Loss of function mlo mutant exhibits broad spectrum resistance against all isolates of E. graminis f. sp. hordei in barley (Jorgensen and Mortensen, 1977). Powdery mildew disease appears in many crop species and Mlo is conserved across plant species. Mlo orthologues have been mutated in several plant species including apple, grapevine, cucumber, pepper, tomato, melon, rose, wheat, Arabidopsis, and tobacco to enhance resistance against the powdery mildew pathogens (Kusch and Panstruga, 2017).
Thirty recessive rn mutant alleles were identified and mapped to the same locus on soybean chromosome 18 (Palmer et al., 2008). The rn1 mutant shows progressive browning of the root system over time with visible necrotic phenotype appearing between 3 and 5 days after germination (Kosslak et al., 1996, 1997). The rn1 mutant showed enhanced accumulation of phytoalexins glyceollin and pathogenesis-related proteins; and as a result, enhanced tolerance of the mutant to P. sojae is observed (Graham and Graham, 1991; Kosslak et al., 1997). Here we have conducted quantitative proteomics and phosphoproteomics studies of the roots of near-isogenic rn1 and wild-type 322 plants to investigate the genetic mechanisms regulated by the Rn1 gene. We detected 150 DAPs, including 118 significantly up-regulated and 32 downregulated proteins in the necrotic root tissues as compared to that in the tissues of healthy roots of the progenitor T322 line.
Analyses of 150 DAPs by applying several bioinformatics tools such as GO annotation, COG, KEGG pathway, MapMan provided a better understanding of the biological or genetic pathways that are affected by the rn1 mutation. As expected, accumulation of many biotic stress-responsive proteins including PR proteins observed in earlier studies was increased in the rn1 mutant (Kosslak et al., 1996, 1997). A majority of the proteins/enzymes are involved in metabolic pathways (46.71%) and greatly affected by the rn1 mutation (Figure 3). In addition, levels of enzymes involved in the secondary metabolic pathways for synthesis of defense compounds are elevated in the rn1 mutant. Analysis based on COGs revealed that although the secondary metabolic pathways for synthesis of defense compounds are elevated, and the accumulation of proteins or enzymes involved in translation, ribosomal structure and biogenesis is reduced in the rn1 mutant indicating that the translation machinery may be compromised in the necrotic tissues due to onset spontaneous cell death. It was observed that 27.63% of the DAPs affected by the rn1 mutation are currently uncharacterized (Figure 3).
This study was undertaken to reveal the molecular basis of cell death pathway mediated by Rn1. Caspase-like activities have been observed in plants during PCD consistently since the first report of the enzyme in 1998 (del Pozo and Lam, 1998). Caspases, cysteine-dependent aspartate specific proteases, are central components that mediate apoptosis, an equivalent process of plant PCD in animals, in response to various stimuli (Parrish et al., 2013). Soon after caspases were identified as major regulators of cell death in mammals, a hunt for homologous peptidases in other kingdoms led to identification of caspase-like proteins, metacaspases, from plants, fungi, and protozoa (Uren et al., 2000).
In certain plant-pathogen interactions, the PCD seems to be mediated by metacaspases (Fagundes et al., 2015). Metacaspases are divided into two types, type I and type II, according to the structural feature of the linker between the P20-like and P10-like domains (Supplementary Figure 9). The type II metacaspases have a much longer linker between the two subunits (Carmona-Gutierrez et al., 2010). Many studies have shown that type II metacaspases play an important role in regulating PCD during biotic and abiotic stresses. In Arabidopsis, AtMC8 was identified as a positive mediator of cell death induced by ultraviolet C radiation and oxidative stress (He et al., 2008). Two AtMCP2d mutants (mcp2d-1 and mcp2d-3) exhibited reduced sensitivity to PCD-inducing mycotoxin fumonisin B1 as well as oxidative stress inducers, whereas AtMCP2d over-expressors were more sensitive to these agents, and exhibited accelerated cell-death progression (Watanabe and Lam, 2011). Knocking down the expression of the type II Triticum aestivum metacaspase gene TaMCA4 through virus-induced gene silencing compromised the immunity of the “Suwon11” wheat line against the avirulent race of Puccinia striiformis f. sp. tritici with reduced necrotic symptoms at the infection sites (Wang et al., 2012). A tomato metacaspase gene is upregulated during PCD induced in Botrytis cinerea-infected leaves (Hoeberichts et al., 2003). A large number of studies suggested that plant type II metacaspases facilitate the development of the morphological features that are characteristics of various classes of the PCD (Ahmad et al., 2012).
In this study, we were able to identify 146 PhosPs that carry phosphopeptides. Of the 146 PhosPs, the phosphorylation levels were significantly changed between rn1 and T322 lines for only 22 PhosPs (Table 2). Among the 22 PhosPs, some are involved in the oxidative phosphorylation, pentose phosphate and plant hormone signaling pathways based on KEGG classification. MapMan analysis suggested that some of the proteins are biotic and abiotic stress-related. A family of two highly similar type II metacaspases was detected (Supplementary Figures 8, 9). The phosphorylation levels of these II metacaspases were significantly reduced in the rn1 mutant root tissues as compared to that in the healthy root tissues of T322, suggesting that the dephosphorylation or reduced phosphorylation of type II metacaspases may contribute toward initiating spontaneous cell death observed in the lesion mimic rn1 mutant. The three phosphopeptides identified from three Type II metacaspases, respectively, are highly similar and localized to the same C-terminal region of the P20 caspase-like domain (Supplementary Figure 9). Earlier, we identified a type II metacaspase (metacaspase 5, Glyma.08G233300; Table 2) as an interactor of the coiled-coil nucleotide-binding site leucine-rich repeat region (NB-LRR) Phytophthora resistance Rps1-k-2 protein (Gao et al., 2005; Gao, 2006; Gao and Bhattacharyya, 2008; Baskett, 2012). The same protein has been identified in this study as PhosPs, phosphorylation level of which is significantly reduced in the rn1 mutant as compared to the wild-type T322 line.
In plants under stress conditions, metacaspase type I positively regulates HR cell death induced by activated NB-LRR proteins following recognition of pathogen effectors. LSD1 negatively regulates the spread of cell death presumably by binding to type I metacaspase. The type II metacaspases with reduced phosphorylation levels may represent an inactive form with no or highly reduced negative regulatory role on metacaspase type I in the rn1 mutant roots resulting in spontaneous root necrosis (Fagundes et al., 2015). This study showed that phosphorylation of at least two type II metacaspases at least partly by Rn1 most likely suppresses the cell death process, which becomes spontaneously active in the rn1 mutant in absence of the functional Rn1 protein. The third type metacaspase identified in this study also showed a trend of reduced phosphorylation level in absence of Rn1 protein. In all three metacaspases identified in this study showed a serine residue for phosphorylation located in the P20-like domain (Figure 7; Supplementary Figure 9; and Table 2).
The phosphorylation levels of these II metacaspases were significantly reduced in the rn1 mutant root tissues as compared to that in the healthy root tissues of T322, suggesting that the dephosphorylation or reduced phosphorylation of type II metacaspases could contribute toward initiating spontaneous cell death observed in the root lesion mimic rn1 mutant.
Conclusion
In this study, we conducted proteomics and phosphoproteomics of the necrotic root tissues of the rn1 mutant and healthy root tissues of the progenitor T322 line, and detected 150 DAPs and 22 potential phosphoproteins involved in manifestation of the root necrotic phenotype. These candidate proteins will facilitate discovering the molecular mechanisms involved in the cell death process in soybean roots. We have identified two type II metacaspases (Glyma.08G233300 and Glyma.08G233500), the phosphorylation levels of which were reduced in rn1 as compared to T322, implying that Rn1 either directly or indirectly phosphorylates type II metacaspases to negatively regulate the cell death process in soybean roots.
Data Availability Statement
The datasets presented in this study can be found in online repositories. The names of the repository/repositories and accession number(s) can be found below: The mass spectrometry proteomics data have been deposited to the ProteomeXChange consortium via the PRIDE partner repository with the dataset identifier PXD032226.
Author Contributions
FW analyzed the data, wrote the manuscript, and prepared the figures. PD and NP performed the experiments. SZ contributed to proteomic and phosphoproteomics data acquisition and analysis, manuscript editing. RB prepared the mass spectrometry figures. MB designed the experiments and edited and finalized the manuscript. All authors contributed to the article and approved the submitted version.
Funding
This research was supported by Iowa Soybean Association. The mass spectrometry data were generated at Proteomic and Metabolomics Facility of Cornell University and the Orbitrap Elite mass spectrometer were supported by NIH SIG 1S10RR25449-1 grant to SZ.
Conflict of Interest
The authors declare that the research was conducted in the absence of any commercial or financial relationships that could be construed as a potential conflict of interest.
Publisher’s Note
All claims expressed in this article are solely those of the authors and do not necessarily represent those of their affiliated organizations, or those of the publisher, the editors and the reviewers. Any product that may be evaluated in this article, or claim that may be made by its manufacturer, is not guaranteed or endorsed by the publisher.
Acknowledgments
We thank D. Grant for kindly reviewing the manuscript and for his invaluable comments. We also thank the China Scholarship Council for visiting fellowship to FW and the Department of Biotechnology, the Government of India for a fellowship to PD.
Supplementary Material
The Supplementary Material for this article can be found online at: https://www.frontiersin.org/articles/10.3389/fpls.2022.882561/full#supplementary-material
Footnotes
- ^ https://phytozome.jgi.doe.gov/pz/portal.html
- ^ https://github.com/tanghaibao/GOatools
- ^ https://www.plabipd.de/portal/mercator-sequence-annotation; http://www.kegg.jp/; or http://www.genome.jp/kegg/
- ^ https://mapman.gabipd.org/
References
Ahmad, R., Zuily-Fodil, Y., Passaquet, C., Bethenod, O., Roche, R., and Repellin, A. (2012). Ozone and aging up-regulate type II metacaspase gene expression and global metacaspase activity in the leaves of field-grown maize (Zea mays L.) plants. Chemosphere 87, 789–795. doi: 10.1016/j.chemosphere.2011.12.081
Al Amin, G. M., Kong, K., Sharmin, R. A., Kong, J., Bhat, J. A., and Zhao, T. (2019). Characterization and rapid gene-mapping of leaf lesion mimic phenotype of spl-1 mutant in soybean (Glycine max (L.) Merr.). Int. J. Mol. Sci. 20:2193. doi: 10.3390/ijms20092193
Balint-Kurti, P. (2019). The plant hypersensitive response: concepts, control and consequences. Mol. Plant Pathol. 20, 1163–1178. doi: 10.1111/mpp.12821
Baskett, J. A. (2012). A Type II Metacaspase Interacts with Rps1-k-2 in Soybean and Analysis of the Soybean Metacaspase Gene Family. M.S. thesis. Ames, IA: Iowa State University.
Bruggeman, Q., Raynaud, C., Benhamed, M., and Delarue, M. (2015). To die or not to die? Lessons from lesion mimic mutants. Front. Plant Sci. 6:24. doi: 10.3389/fpls.2015.00024
Cao, H., Zhou, Y., Chang, Y., Zhang, X., Li, C., and Ren, D. (2019). Comparative phosphoproteomic analysis of developing maize seeds suggests a pivotal role for enolase in promoting starch synthesis. Plant Sci. 289:110243. doi: 10.1016/j.plantsci.2019.110243
Carmona-Gutierrez, D., Frohlich, K. U., Kroemer, G., and Madeo, F. (2010). Metacaspases are caspases. doubt no more. Cell Death Differ. 17, 377–378. doi: 10.1038/cdd.2009.198
Cui, Y., Peng, Y., Zhang, Q., Xia, S., Ruan, B., Xu, Q., et al. (2020). Disruption of EARLY LESION LEAF 1, encoding a cytochrome P450 monooxygenase, induces ROS accumulation and cell death in rice. Plant J. 105, 942–956. doi: 10.1111/tpj.15079
del Pozo, O., and Lam, E. (1998). Caspases and programmed cell death in the hypersensitive response of plants to pathogens. Curr. Biol. 8, 1129–1132. doi: 10.1016/s0960-9822(98)70469-5
Elias, J. E., and Gygi, S. P. (2007). Target-decoy search strategy for increased confidence in large-scale protein identifications by mass spectrometry. Nat. Methods 4, 207–214. doi: 10.1038/nmeth1019
Fagundes, D., Bohn, B., Cabreira, C., Leipelt, F., Dias, N., Bodanese-Zanettini, M. H., et al. (2015). Caspases in plants: metacaspase gene family in plant stress responses. Funct. Integr. Genomics 15, 639–649. doi: 10.1007/s10142-015-0459-7
Fang, Y., Deng, X., Lu, X., Zheng, J., Jiang, H., Rao, Y., et al. (2019). Differential phosphoproteome study of the response to cadmium stress in rice. Ecotoxicol. Environ. Saf. 180, 780–788. doi: 10.1016/j.ecoenv.2019.05.068
Fekih, R., Tamiru, M., Kanzaki, H., Abe, A., Yoshida, K., Kanzaki, E., et al. (2015). The rice (Oryza sativa L.) LESION MIMIC RESEMBLING, which encodes an AAA-type ATPase, is implicated in defense response. Mol. Genet. Genomics 290, 611–622. doi: 10.1007/s00438-014-0944-z
Gao, H. (2006). Recognition and Signal Transduction in the Expression of Phytophthora Resistance in Soybean [Glycine max (L) Merr]. Ph.D. thesis. Ames, IA: Iowa State University.
Gao, H., and Bhattacharyya, M. K. (2008). The soybean-Phytophthora resistance locus Rps1-k encompasses coiled coil-nucleotide binding-leucine rich repeat-like genes and repetitive sequences. BMC Plant Biol. 8:29. doi: 10.1186/1471-2229-8-29
Gao, H., Narayanan, N., Ellison, L., and Bhattacharyya, M. K. (2005). Two classes of highly similar coiled coil-nucleotide binding-leucine rich repeat genes isolated from the Rps1-k locus encode Phytophthora resistance in soybean. Mol. Plant Microbe Interact. 18, 1035–1045. doi: 10.1094/MPMI-18-1035
Gao, J., Zhang, S., He, W. D., Shao, X. H., Li, C. Y., Wei, Y. R., et al. (2017). Comparative phosphoproteomics reveals an important role of MKK2 in banana (Musa spp.) cold signal network. Sci. Rep. 7:40852. doi: 10.1038/srep40852
Gao, Z., Liu, Q., Zhang, Y., Chen, D., Zhan, X., Deng, C., et al. (2020). OsCUL3a-associated molecular switches have functions in cell metabolism, cell death, and disease resistance. J. Agric. Food Chem. 68, 5471–5482. doi: 10.1021/acs.jafc.9b07426
Gao, Z., Liu, Q., Zhang, Y., Fang, H., Zhang, Y., Sinumporn, S., et al. (2019). A proteomic approach identifies novel proteins and metabolites for lesion mimic formation and disease resistance enhancement in rice. Plant Sci. 287:110182. doi: 10.1016/j.plantsci.2019.110182
Goodstein, D. M., Shu, S., Howson, R., Neupane, R., Hayes, R. D., Fazo, J., et al. (2012). Phytozome: a comparative platform for green plant genomics. Nucleic Acids Res. 40, D1178–D1186. doi: 10.1093/nar/gkr944
Graham, M. Y., and Graham, T. L. (1991). Rapid accumulation of anionic peroxidases and phenolic polymers in soybean cotyledon tissue following treatment with Phytophthora megasperma f. sp. glycinea wall glucan. Plant physiol. 97, 1445–1455. doi: 10.1104/pp.97.4.1445
Gray, J., Close, P. S., Briggs, S. P., and Johal, G. S. (1997). A novel suppressor of cell death in plants encoded by the Lls1 gene of maize. Cell 1, 25–30. doi: 10.1016/s0092-8674(00)80179-8
Harris, M. A., Clark, J., Ireland, A., Lomax, J., Ashburner, M., Foulger, R., et al. (2004). The gene ontology (GO) database and informatics resource. Nucleic Acids Res. 32, D258–D261. doi: 10.1093/nar/gkh036
He, R., Drury, G. E., Rotari, V. I., Gordon, A., Willer, M., Farzaneh, T., et al. (2008). Metacaspase-8 modulates programmed cell death induced by ultraviolet light and H2O2 in Arabidopsis. J. Biol. Chem. 283, 774–783. doi: 10.1074/jbc.M704185200
Hoeberichts, F. A., Ten Have, A., and Woltering, E. J. (2003). A tomato metacaspase gene is upregulated during programmed cell death in Botrytis cinerea-infected leaves. Planta 217, 517–522. doi: 10.1007/s00425-003-1049-9
Hou, Y., Qiu, J., Tong, X., Wei, X., Nallamilli, B. R., Wu, W., et al. (2015). A comprehensive quantitative phosphoproteome analysis of rice in response to bacterial blight. BMC Plant Biol. 15:163. doi: 10.1186/s12870-015-0541-2
Hu, X., Wu, L., Zhao, F., Zhang, D., Li, N., Zhu, G., et al. (2015). Phosphoproteomic analysis of the response of maize leaves to drought, heat and their combination stress. Front. Plant Sci. 6:298. doi: 10.3389/fpls.2015.00298
Ishikawa, S., Barrero, J. M., Takahashi, F., Nakagami, H., Peck, S. C., Gubler, F., et al. (2019a). Comparative phosphoproteomic analysis reveals a decay of ABA signaling in barley embryos during after-ripening. Plant Cell Physiol. 60, 2758–2768. doi: 10.1093/pcp/pcz163
Ishikawa, S., Barrero, J., Takahashi, F., Peck, S., Gubler, F., Shinozaki, K., et al. (2019b). Comparative phosphoproteomic analysis of barley embryos with different dormancy during imbibition. Int. J. Mol. Sci. 20:451. doi: 10.3390/ijms20020451
Jiao, R., Xu, N., Hu, J., Song, Z. L., Hu, J. Q., Rao, Y. C., et al. (2018). Advances in traits of lesion mimic mutants and its molecular mechanisms in rice. Chin. J. Rice Sci. 32, 285–295.
Jones, A. M., and Dangl, J. L. (1996). Logjam at the styx: programmed cell death in plants. Trends Plant Sci. 1, 114–119. doi: 10.1016/S1360-1385(96)90005-9
Jorgensen, I. H. (1992). Discovery, characterization and exploitation of Mlo powdery mildew resistance in barley. Euphytica 63, 141–152. doi: 10.1007/BF00023919
Jorgensen, J. H., and Mortensen, K. (1977). Primary infection by Erysiphe graminis f. sp. hordei of barley mutants with resistance genes in the ml-o locus. Phytopathology 67, 678–685. doi: 10.1094/phyto-67-678
Joung, J. G., Corbett, A. M., Fellman, S. M., Tieman, D. M., Klee, H. J., Giovannoni, J. J., et al. (2009). Plant MetGenMAP: an integrative analysis system for plant systems biology. Plant Physiol. 151, 1758–1768. doi: 10.1104/pp.109.145169
Kanehisa, M., Furumichi, M., Tanabe, M., Sato, Y., and Morishima, K. (2017). KEGG: new perspectives on genomes, pathways, diseases and drugs. Nucleic Acids Res. 45, D353–D361. doi: 10.1093/nar/gkw1092
Kong, W., Wang, L., Cao, P., Li, X., Ji, J., Dong, P., et al. (2020). Identification and genetic analysis of EMS-mutagenized wheat mutants conferring lesion-mimic premature aging. BMC Genet. 21:88. doi: 10.1186/s12863-020-00891-x
Kosslak, R. M., Chamberlin, M. A., Palmer, R. G., and Bowen, B. A. (1997). Programmed cell death in the root cortex of soybean root necrosis mutants. Plant J. 11, 729–745. doi: 10.1046/j.1365-313x.1997.11040729.x
Kosslak, R. M., Dieter, J. R., Ruff, R. L., Chamberlin, M. A., Bowen, B. A., and Palmer, R. G. (1996). Tolerance to root-borne infection by Phytophthora sojae in three allelic necrotic-root mutants in soybean. J. Hered. 37, 415–422.
Krey, J. F., Scheffer, D. I., Choi, D., Reddy, A., David, L. L., Corey, D. P., et al. (2018). Mass spectrometry quantitation of proteins from small pools of developing auditory and vestibular cells. Sci. Data 17:180128. doi: 10.1038/sdata.2018.128
Kusch, S., and Panstruga, R. (2017). mlo-Based Resistance: an apparently universal “Weapon” to defeat powdery mildew disease. Mol. Plant Microbe Interact. 30, 179–189. doi: 10.1094/MPMI-12-16-0255-CR
Lamb, C. J. (1994). Plant disease resistance genes in signal perception and transduction. Cell 76, 419–422. doi: 10.1016/0092-8674(94)90106-6
Li, R., Chen, S., Liu, G., Han, R., and Jiang, J. (2017). Characterization and identification of a woody lesion mimic mutant lmd, showing defence response and resistance to Alternaria alternate in birch. Sci. Rep. 7:11308. doi: 10.1038/s41598-017-11748-2
Liu, J. Z., Fang, Y., and Pang, H. (2016). The current status of the soybean-soybean mosaic virus (SMV) pathosystem. Front. Microbiol. 7:1906. doi: 10.3389/fmicb.2016.01906
Lorrain, S., Vailleau, F., Balagué, C., and Roby, D. (2003). Lesion mimic mutants: keys for deciphering cell death and defense pathways in plants? Trends Plant Sci. 8, 263–271. doi: 10.1016/S1360-1385(03)00108-0
Lv, D. W., Subburaj, S., Cao, M., Yan, X., Li, X., Appels, R., et al. (2014). Proteome and phosphoproteome characterization reveals new response and defense mechanisms of Brachypodium distachyon leaves under salt stress. Mol. Cell Proteomics 13, 632–652. doi: 10.1074/mcp.M113.030171
Ma, J., Yang, S., Wang, D., Tang, K., Feng, X. X., and Feng, X. Z. (2020). Genetic mapping of a light-dependent lesion mimic mutant reveals the function of coproporphyrinogen III oxidase homolog in soybean. Front. Plant Sci. 11:557. doi: 10.3389/fpls.2020.00557
Mittler, R., and Lam, E. (1996). Sacrifice in the face of foes: pathogen-induced programmed cell death in plants. Trends Microbiol. 4, 10–15. doi: 10.1016/0966-842x(96)81499-5
Mizobuchi, R., Hirabayashi, H., Kaji, R., Nishizawa, Y., Satoh, H., Ogawa, T., et al. (2002). Differential expression of disease resistance in rice lesion-mimic mutants. Plant Cell Rep. 2, 390–396. doi: 10.1007/s00299-002-0525-1
Mortazavi, A., Williams, B. A., McCue, K., Schaeffer, L., and Wold, B. (2008). Mapping and quantifying mammalian transcriptomes by RNA-Seq. Nat. Methods 5, 621–628. doi: 10.1038/nmeth.1226
Muthamilarasan, M., and Prasad, M. (2013). Plant innate immunity: an updated insight into defense mechanism. J. Biosci. 38, 433–449. doi: 10.1007/s12038-013-9302-2
Nishimura, H., Himi, E., Rikiishi, K., Tsugane, K., and Maekawa, M. (2019). Establishment of nDart1-tagged lines of Koshihikari, an elite variety of rice in Japan. Breed. Sci. 69, 696–701. doi: 10.1270/jsbbs.19049
Noman, A., Aqeel, M., Qari, S. H., Al Surhanee, A. A., Yasin, G., Alamri, S., et al. (2020). Plant hypersensitive response vs pathogen ingression: death of few gives life to others. Microb. Pathog. 145:104224. doi: 10.1016/j.micpath.2020.104224
Palmer, R. G., Zhang, L., Huang, Z., and Xu, M. (2008). Allelism and molecular mapping of soybean necrotic root mutants. Genome 51, 243–250. doi: 10.1139/G08-001
Parrish, A. B., Freel, C. D., and Kornbluth, S. (2013). Cellular mechanisms controlling caspase activation and function. Cold Spring Harb. Perspect. Biol. 5, a008672. doi: 10.1101/cshperspect.a008672
Pontier, D., Balagué, C., and Roby, D. (1998). The hypersensitive response. A programmed cell death associated with plant resistance. C. R. Acad. Sci. III 321, 721–734. doi: 10.1016/s0764-4469(98)80013-9
Rostoks, N., Schmierer, D., Mudie, S., Drader, T., Brueggeman, R., Caldwell, D. G., et al. (2006). Barley necrotic locus nec1 encodes the cyclic nucleotide-gated ion channel 4 homologous to the Arabidopsis HLM1. Mol. Genet. Genom. 275, 159–168. doi: 10.1007/s00438-005-0073-9
Salguero-Linares, J., and Coll, N. S. (2019). Plant proteases in the control of the hypersensitive response. J. Exp. Bot. 70, 2087–2095. doi: 10.1093/jxb/erz030
Severin, A. J., Woody, J. L., Bolon, Y. T., Joseph, B., Diers, B. W., Farmer, A. D., et al. (2010). RNA-Seq Atlas of Glycine max: a guide to the soybean transcriptome. BMC Plant Biol. 10:160. doi: 10.1186/1471-2229-10-160
Strom, N., Hu, W., Haarith, D., Chen, S., and Bushley, K. (2020). Corn and soybean host root endophytic fungi with toxicity toward the soybean cyst nematode. Phytopathology 110, 603–614. doi: 10.1094/PHYTO-07-19-0243-R
Takahashi, A., Kawasaki, T., Henmi, K., ShiI, K., Kodama, O., Satoh, H., et al. (1999). Lesion mimic mutants of rice with alterations in early signaling events of defense. Plant J. 17, 535–545. doi: 10.1046/j.1365-313x.1999.00405.x
Tatusov, R. L., Fedorova, N. D., Jackson, J. D., Jacobs, A. R., Kiryutin, B., Koonin, E. V., et al. (2003). The COG database: an updated version includes eukaryotes. BMC Bioinformatics 4:41. doi: 10.1186/1471-2105-4-41
Toorchi, M., Yukawa, K., Nouri, M. Z., and Komatsu, S. (2009). Proteomics approach for identifying osmotic-stress-related proteins in soybean roots. Peptides 30, 2108–2117. doi: 10.1016/j.peptides.2009.09.006
Umezawa, T., Sugiyama, N., Takahashi, F., Anderson, J. C., Ishihama, Y., Peck, S. C., et al. (2013). Genetics and phosphoproteomics reveal a protein phosphorylation network in the abscisic acid signaling pathway in Arabidopsis thaliana. Sci. Signal. 6:rs8. doi: 10.1126/scisignal.2003509
Uren, A. G., O’Rourke, K., Aravind, L., Pisabarro, M. T., Seshagiri, S., Koonin, E. V., et al. (2000). Identification of paracaspases and metacaspases: two ancient families of caspase-like proteins, one of which plays a key role in malt lymphoma. Mol. Cell 6, 961–967. doi: 10.1016/s1097-2765(00)00094-0
Walbot, V. (1991). Maize mutants for the 21st century. Plant Cell 3, 851–856. doi: 10.1534/genetics.111.130039
Wang, D., Liang, X., Bao, Y., Yang, S., Zhang, X., Yu, H., et al. (2020a). A malectin-like receptor kinase regulates cell death and pattern-triggered immunity in soybean. EMBO Rep. 21:e50442. doi: 10.15252/embr.202050442
Wang, Y., Liu, M., Ge, D., Akhter Bhat, J., Li, Y., and Kong, J. (2020b). Hydroperoxide lyase modulates defense response and confers lesion-mimic leaf phenotype in soybean (Glycine max (L.) Merr.). Plant J. 104, 1315–1333. doi: 10.1111/tpj.15002
Wang, P., Sun, X., Xie, Y., Li, M., Chen, W., Zhang, S., et al. (2014). Melatonin regulates proteomic changes during leaf senescence in Malus hupehensis. J. Pineal Res. 57, 291–307. doi: 10.1111/jpi.12169
Wang, X., Wang, X., Feng, H., Tang, C., Bai, P., Wei, G., et al. (2012). TaMCA4, a novel wheat metacaspase gene functions in programmed cell death induced by the fungal pathogen Puccinia striiformis f. sp. tritici. Mol. Plant. Microbe Interact. 25, 755–764. doi: 10.1094/MPMI-11-11-0283-R
Watanabe, N., and Lam, E. (2011). Arabidopsis metacaspase 2d is a positive mediator of cell death induced during biotic and abiotic stresses. Plant J. 66, 969–982. doi: 10.1111/j.1365-313X.2011.04554.x
Wu, C., Bordeos, A., Madamba, M. R., Baraoidan, M., Ramos, M., Wang, G. L., et al. (2008). Rice lesion mimic mutants with enhanced resistance to diseases. Mol. Genet. Genomics 279, 605–619. doi: 10.1007/s00438-008-0337-2
Yang, Y., Qiang, X., Owsiany, K., Zhang, S., Thannhauser, T. W., and Li, L. (2011). Evaluation of different multidimensional LC-MS/MS pipelines for isobaric tags for relative and absolute quantitation (iTRAQ)-based proteomic analysis of potato tubers in response to cold storage. J. Proteome Res. 10, 4647–4660. doi: 10.1021/pr200455s
Yuan, L. L., Zhang, M., Yan, X., Bian, Y. W., Zhen, S. M., and Yan, Y. M. (2016). Dynamic phosphoproteome analysis of seedling leaves in Brachypodium distachyon L. reveals central phosphorylated proteins involved in the drought stress response. Sci. Rep. 6:35280. doi: 10.1038/srep35280
Zhang, Y., Liu, Q., Zhang, Y., Chen, Y., Yu, N., Cao, Y., et al. (2019). LMM24 encodes receptor-like cytoplasmic kinase 109, which regulates cell death and defense responses in rice. Int. J. Mol. Sci. 20:3243. doi: 10.3390/ijms20133243
Zhang, Z., Lenk, A., Andersson, M. X., Gjetting, T., Pedersen, C., Nielsen, M. E., et al. (2008). A lesion-mimic syntaxin double mutant in Arabidopsis reveals novel complexity of pathogen defense signaling. Mol. Plant. 1, 510–527. doi: 10.1093/mp/ssn011
Zhao, X., Bai, X., Jiang, C., and Li, Z. (2019). Phosphoproteomic analysis of two contrasting maize inbred lines provides insights into the mechanism of salt-stress tolerance. Int. J. Mol. Sci. 20:1886. doi: 10.3390/ijms20081886
Keywords: proteomics, phosphoproteomics, root necrosis, metacaspases, cell death, soybean
Citation: Wang F, Das P, Pal N, Bhawal R, Zhang S and Bhattacharyya MK (2022) A Phosphoproteomics Study of the Soybean root necrosis 1 Mutant Revealed Type II Metacaspases Involved in Cell Death Pathway. Front. Plant Sci. 13:882561. doi: 10.3389/fpls.2022.882561
Received: 23 February 2022; Accepted: 17 May 2022;
Published: 19 July 2022.
Edited by:
Xiaojian Yin, China Pharmaceutical University, ChinaReviewed by:
Wei Zhu, Institute of Cancer and Basic Medicine (CAS), ChinaGhazala Mustafa, Quaid-i-Azam University, Pakistan
Copyright © 2022 Wang, Das, Pal, Bhawal, Zhang and Bhattacharyya. This is an open-access article distributed under the terms of the Creative Commons Attribution License (CC BY). The use, distribution or reproduction in other forums is permitted, provided the original author(s) and the copyright owner(s) are credited and that the original publication in this journal is cited, in accordance with accepted academic practice. No use, distribution or reproduction is permitted which does not comply with these terms.
*Correspondence: Madan K. Bhattacharyya, bWJoYXR0YWNAaWFzdGF0ZS5lZHU=
†Present addresses: Feifei Wang, Key Laboratory of Soybean Molecular Design Breeding, Northeast Institute of Geography and Agroecology, the Chinese Academy of Sciences, Harbin, China; Priyanka Das, Department of Biochemistry and Agricultural Chemistry, Assam Agricultural University, Assam, India; Narinder Pal, USDA-ARS, Ames, IA, United States