 Shuwei Dong
 Wenhui Pang
 Lili Cong
 Guofeng Yang
 Zeng-Yu Wang
 Hongli Xie
- Key Laboratory of National Forestry and Grassland Administration on Grassland Resources and Ecology in the Yellow River Delta, College of Grassland Science, Qingdao Agricultural University, Qingdao, China
In plants, the leaf is an essential photosynthetic organ, and is the primary harvest in forage crops such as alfalfa (Medicago sativa). Premature leaf senescence caused by environmental stress can result in significant yield loss and quality reduction. Therefore, the stay-green trait is important for improving the economic value of forage crops. Alkaline stress can severely damage leaf cells and, consequently, cause leaf senescence. To understand the molecular regulatory mechanisms and identify vital senescence-associated genes under alkaline stress, we used high-throughput sequencing to study transcriptional changes in Medicago truncatula, a model plant for forage crops. We identified 2,165 differentially expressed genes, 985 of which were identical to those in the dark-induced leaf senescence group. Gene ontology (GO) and Kyoto Encyclopedia of Genes and Genomes (KEGG) pathway enrichment analyses showed that the 985 genes were mainly enriched in nutrient cycling processes such as cellular amino acid metabolic processes and organic substance catabolic processes, indicating nutrient redistribution. The other 1,180 differentially expressed genes were significantly enriched in the oxidoreductase complex, aerobic respiration, and ion transport. Our analysis showed the two gene sets guiding the coupled physiological and biochemical alterations play different roles under alkaline stress with a coordinated and integrated way. Many transcription factor families were identified from these differentially expressed genes, including MYB, WRKY, bHLH, and NAC which have particular preference involved in stress resistance and regulation of senescence. Our results contribute to the exploration of the molecular regulatory mechanisms of leaf senescence in M. truncatula under alkaline stress and provide new candidate genes for future breeding to improve the biomass and quality of forage crops.
Introduction
Senescence occurs when the photosynthetic efficiency in a leaf is constantly decreasing; its stages include a color change from green to yellow, wilting, and death. During senescence, the nutrients in the leaf are transferred to new buds, developing flowers, maturing seeds, or other plant development, thus directly enhancing plant adaptability and reproductive success in the face of stress (Uauy et al., 2006; Lim et al., 2007). Therefore, the timing of leaf senescence is of biological significance. Premature senescence caused by environmental stressors can result in significant yield loss and quality reduction. Such stressors include darkness, drought, saline, and alkaline conditions (Guo and Gan, 2012; He et al., 2018; Guo et al., 2021). Saline-alkaline stress is a common abiotic stress that limits plant growth and development, and has become a serious problem restricting crop production as well as ecological environment construction (Zhu, 2016; Wei et al., 2021). High salinity accelerates leaf senescence, thereby reducing plant biomass (Balazadeh et al., 2010; Allu et al., 2014; Yang and Guo, 2018b). We confirmed this phenomenon in our previous study, and preliminarily investigated the associated molecular mechanisms (Dong et al., 2021).
Unlike salt stress, alkaline stress is caused mainly by NaHCO3 and Na2CO3. Therefore, Na+ stress occurs in alkali stress, as well as HCO3– and pH stresses (Zhang et al., 2019). It can induce ion toxicity, osmotic stress, and oxidative damage in plants leading to accelerated leaf senescence (Fan et al., 2021). Alkaline stress can significantly disrupt ion balance and interfere with the uptake of mineral elements, resulting in excessive Na+ accumulation in leaf cytoplasm, thereby producing ion toxicity and inducing leaf senescence (Ghanem et al., 2008; Guo et al., 2009; Yang and Guo, 2018b). The decreasing K+/Na+ ratio disrupts the ultrastructure of chloroplasts, leading to chlorophyll degradation, a reduced photosynthetic rate, and accelerated leaf senescence (Zhao et al., 2001; Wang et al., 2019). Excess ions produce osmotic stress and lead to dehydration in leaves, followed by rapid leaf senescence (Yang and Guo, 2018a; Zhang P. et al., 2021).
The effect of oxidative damage on leaf senescence requires investigation. High pH stress results in increased permeability of the cell membrane in leaves by inducing the accumulation of malondialdehyde (MDA) and reactive oxygen species (ROS), allowing penetration by small molecules of organic substances and electrolytes into the cell. The intracellular molecular structures and functions are in turn damaged, accelerating leaf senescence (An et al., 2016; Zou et al., 2020). Plants have developed a series of regulatory adaptive mechanisms to resist senescence, such as alleviation of osmotic stress, modulation of ion homeostasis, and antioxidant protection (Yang and Guo, 2018b; Wei et al., 2020). It has been reported that with leaf senescence, numerous leaf senescence-associated genes (SAGs) are expressed and associated transcription factors (TFs) are involved in regulation (Buchanan-Wollaston, 1997; Guo and Gan, 2005). TF families (such as NAC, MYB, WRKY, and bZIP) have been shown to participate, often critically, in the regulation of senescence in plants (Hao et al., 2010; Mao et al., 2017; Woo et al., 2019; Xu et al., 2020; Dong et al., 2021). During leaf senescence, a large number of SAGs and TFs are expressed at high levels, and these genes constitute several complex senescence regulatory networks that are interlinked and regulated by each other to control leaf senescence. However, there is little understanding of the relationship between SAGs and alkaline stress.
In recent years, significant progress has been made in elucidating the relationship between SAGs and abiotic stresses in Arabidopsis thaliana (Breeze et al., 2011), tobacco (Pageau et al., 2006) and rice (Lee et al., 2001). At present, few reports have been published on the mechanism of leaf senescence in leguminous forage species (Chao et al., 2018; Yuan et al., 2020). However, the key regulators of leaf senescence induced by alkaline stress remain unclear. Alfalfa (Medicago sativa L.) is considered to be one of the most important forages in the world because of its high yield, high quality, and wide range of adaptations (Bouton, 2007; Wang et al., 2016). Most of nutrients in alfalfa are stored in the leaves, and leaf senescence can greatly affect the nutritional quality of the plant, especially when affected by environmental factors such as saline and alkaline stress. Therefore, preventing premature senescence or delaying senescence appropriately to increase biomass accumulation is important for improving alfalfa quality and increasing agricultural economic efficiency (Zhou et al., 2011). Medicago truncatula has been adopted as a suitable model for studying forage crop improvements and leaf senescence (Barker et al., 1990; Zhang et al., 2014). The highly controlled repeatable detached leaves are widely used to evaluate leaf senescence in different plant species (Mao et al., 2017; He et al., 2018; Sakuraba et al., 2018).
In a previous study, we investigated salt- and dark-induced leaf senescence in M. truncatula by collecting transcriptional data over the course of leaf senescence. In this study, we investigated the relationship between leaf senescence and alkaline stress by analyzing detailed expression profiles and annotating the SAGs. The purpose of this study was to identify the genes involved in alkali-induced leaf senescence so as to provide new candidate genes for breeding management strategies.
Materials and Methods
Plant Material and Alkaline Stress Treatments
The M. truncatula ecotype R108 was used in this study. Seeds that had already been vernalized for 2 days were sown in dishes with moistened filter paper and grown in a light incubator for 7 days. They were then transferred into Hoagland’s nutrient solution for hydroponic growth cultivation, and the culture medium was changed every 3 days. Plants were placed in a light incubator with a 16 h photoperiod, day/night temperatures of 25°C/22°C, and a relative humidity of 60–70%.
After 5 weeks, the third compound leaf of each plant was removed and immediately transferred into Petri dishes containing 0, 10, 20, and 40 mM NaHCO3 solution [prepared with half Murashige–Skoog medium, 3 mM MES (2-morpholine ethyl sulfonic acid) buffer, adjusted to pH 5.8]. The Petri dishes were then placed under light or dark conditions, with the growth conditions: 16 h light (25)/8 h darkness (22°C), relative humidity of 60–70%, and light intensity of 300 mol/m2⋅s.
Individual samples were harvested at 0, 2, 4, and 6 days post-alkaline salt stress treatment and briefly immersed in liquid nitrogen before being stored at −80°C. The sampled materials were used to measure physiological indicators [chlorophyll, MDA, H2O2, and abscisic acid (ABA)] and for transcriptomic sequencing.
Three biological replicates were analyzed for each sample group. All data were subjected to one-way analysis of variance (ANOVA) using SPSS 26 (IBM Corp., Armonk, NY, United States). Mean differences were analyzed using Duncan’s multiple range test, and statistical significance was set at P < 0.05. All charts were created using Microsoft Excel 2019 (Microsoft Corp., Redmond, WA, United States).
A dark treatment group (dark) was established as a positive control to better screen the SAGs (Sobieszczuk-Nowicka et al., 2018). In addition, a light control group (control-light) was established to remove background effects, so as to acquire SAGs involved in senescence upon alkaline stress, not just the genes reacting to alkaline stress.
RNA Quantification and Qualification
Total RNA extraction and quality control were conducted as per the method in an earlier study (Dong et al., 2021). Only high-quality RNA samples (OD260/280 = 1.8–2.2, ≥ 50 ng/μL, > 1 μg) were used for sequence library constructions.
Library Preparation and Transcriptome Sequencing
RNA libraries were prepared using the TruSeq™ RNA sample preparation kit from Illumina (San Diego, CA, United States) using 1 μg of RNA. Messenger RNA (mRNA) was enriched and randomly fragmented into small fragments of approximately 200 bp, and cDNA synthesized using a SuperScript double-stranded cDNA synthesis kit (Invitrogen, CA, United States). The synthesized cDNAs were subjected to end-repair, phosphorylation, and “A” base addition according to Illumina’s library construction protocol. Libraries were size selected for 200–300 bp cDNA target fragments using 2% Low Range Ultra Agarose electrophoresis followed by enrichment of PCR (sample preparation kit; Illumina, San Diego, CA). After quantification using TBS380 (Turner BioSystems, Sunnyvale, CA, United States), the paired-end RNA-seq sequencing library was constructed on an Illumina HiSeq xten/NovaSeq 6000 platform, and 150 bp paired-end reads were generated.
Raw reads were trimmed, and their quality controlled by Fastp (Version: 0.19.5)1 to acquire clean reads. All downstream analyses were based on clean data.
All obtained high-quality and clean reads were separately aligned to the reference genome of M. truncatula (reference genome version MedtrA17_4.0; reference genome source can be accessed via http://plants.ensembl.org/Medicago_truncatula/Info/Index with orientation mode using hisat2 (Version 2.1.0)2 software. The mapped reads of each sample were assembled using StringTie (version 1.3.3 b).3
Quantification of Gene and Differential Expression Analysis
StringTie was used to count the number of reads mapped to each gene. The transcripts per million reads (TPM) of each gene were calculated from gene length and the read count mapped to it. RNA-Seq by Expectation-Maximization (RSEM, Version 1.3.1)4 was applied to quantify gene abundance for each group and time point.
Differential expression analysis was performed using R statistical package software (EdgeR, Version 3.24.3).5 The resulting P-values were adjusted using Benjamini and Hochberg’s approach in order to control the false discovery rate. Genes with adjust < 0.05, |log2FC| ≥ 1 by EdgeR were defined as significantly different.
Gene Ontology and Kyoto Encyclopedia of Genes and Genomes Pathway Enrichment Analysis of Differentially Expressed Genes
Gene Ontology (GO)6 functional enrichment was conducted using Goatools (Version 0.6.5)7 and Fisher’s precision tests. GO terms with BH-corrected P adjustment (<0.05) were considered significantly enriched by DEGs.
We used KOBAS (Version 2.1.1)8 and Fisher’s precision test for DEGs in the Kyoto Encyclopedia of Genes and Genomes (KEGG)9 pathways. The metabolic pathways were considered significantly enriched by DEGs at a BH-corrected value of P < 0.05.
Transcription Factor Analysis
TFs are a class of proteins that bind to specific DNA sequences and are widely found in living organisms. They have an activating or blocking effect on gene expression. TF analysis was undertaken using PlantTFDB 4.0 (Version 4.0).10 A threshold of less than e–5 was used for the Hmmscan search.
Time-Course Senescence-Associated Gene Analysis
Time-series SAG analysis based on the microarray Significant Profiles (maSigPro, Version 1.56.0)11 was performed to obtain genes with different expression profiles throughout the series of sampling time nodes.
A short time-series expression miner (STEM, Version 1.3.11) with a P < 0.05 threshold was used for temporal pattern analysis.
Quantitative Real-Time PCR Analysis
Quantitative real-time PCR (qRT-PCR) was used to verify the reliability of RNA-seq data. The RNAs were reverse transcribed using the M5 Super Plus qPCR RT kit with gRNA remover (mei5 Biotech Co., Ltd., Beijing, China) and then subjected to qRT-PCR using ChamQ SYBR color qPCR Master Mix (Vazyme Biotech Co., Ltd., Nanjing, China). Three replicates were performed for each reaction. Twenty-five genes were chosen for qRT-PCR with the following criteria: TFs (Supplementary Table 5), 15 upregulated genes and 9 downregulated genes, belonging to profiles 21 and 4 of 985 SAGs, and differential expression in different groups. Mt UBC Q-2 served as the reference gene.
Gene-specific primers were designed using Primer 5.0 and are shown in Supplementary Table 1.
Results
Phenotypic and Physiological Responses of Detached Leaves to Alkaline Stress
The detached leaves showed different phenotypic changes across different groups (Figure 1A). In the control light group, leaves remained green throughout 6 days; in the dark group, leaves showed progressive yellowing from days 4 to 6; in the alkaline-stress groups, leaves treated with concentrations of 10 and 20 mM NaHCO3 turned yellow on day 2 and formed eroded lesions; over time, the leaves slowly turned transparent from necrosis. There was a significant correlation between the concentration of NaHCO3 and leaf phenotypic change.
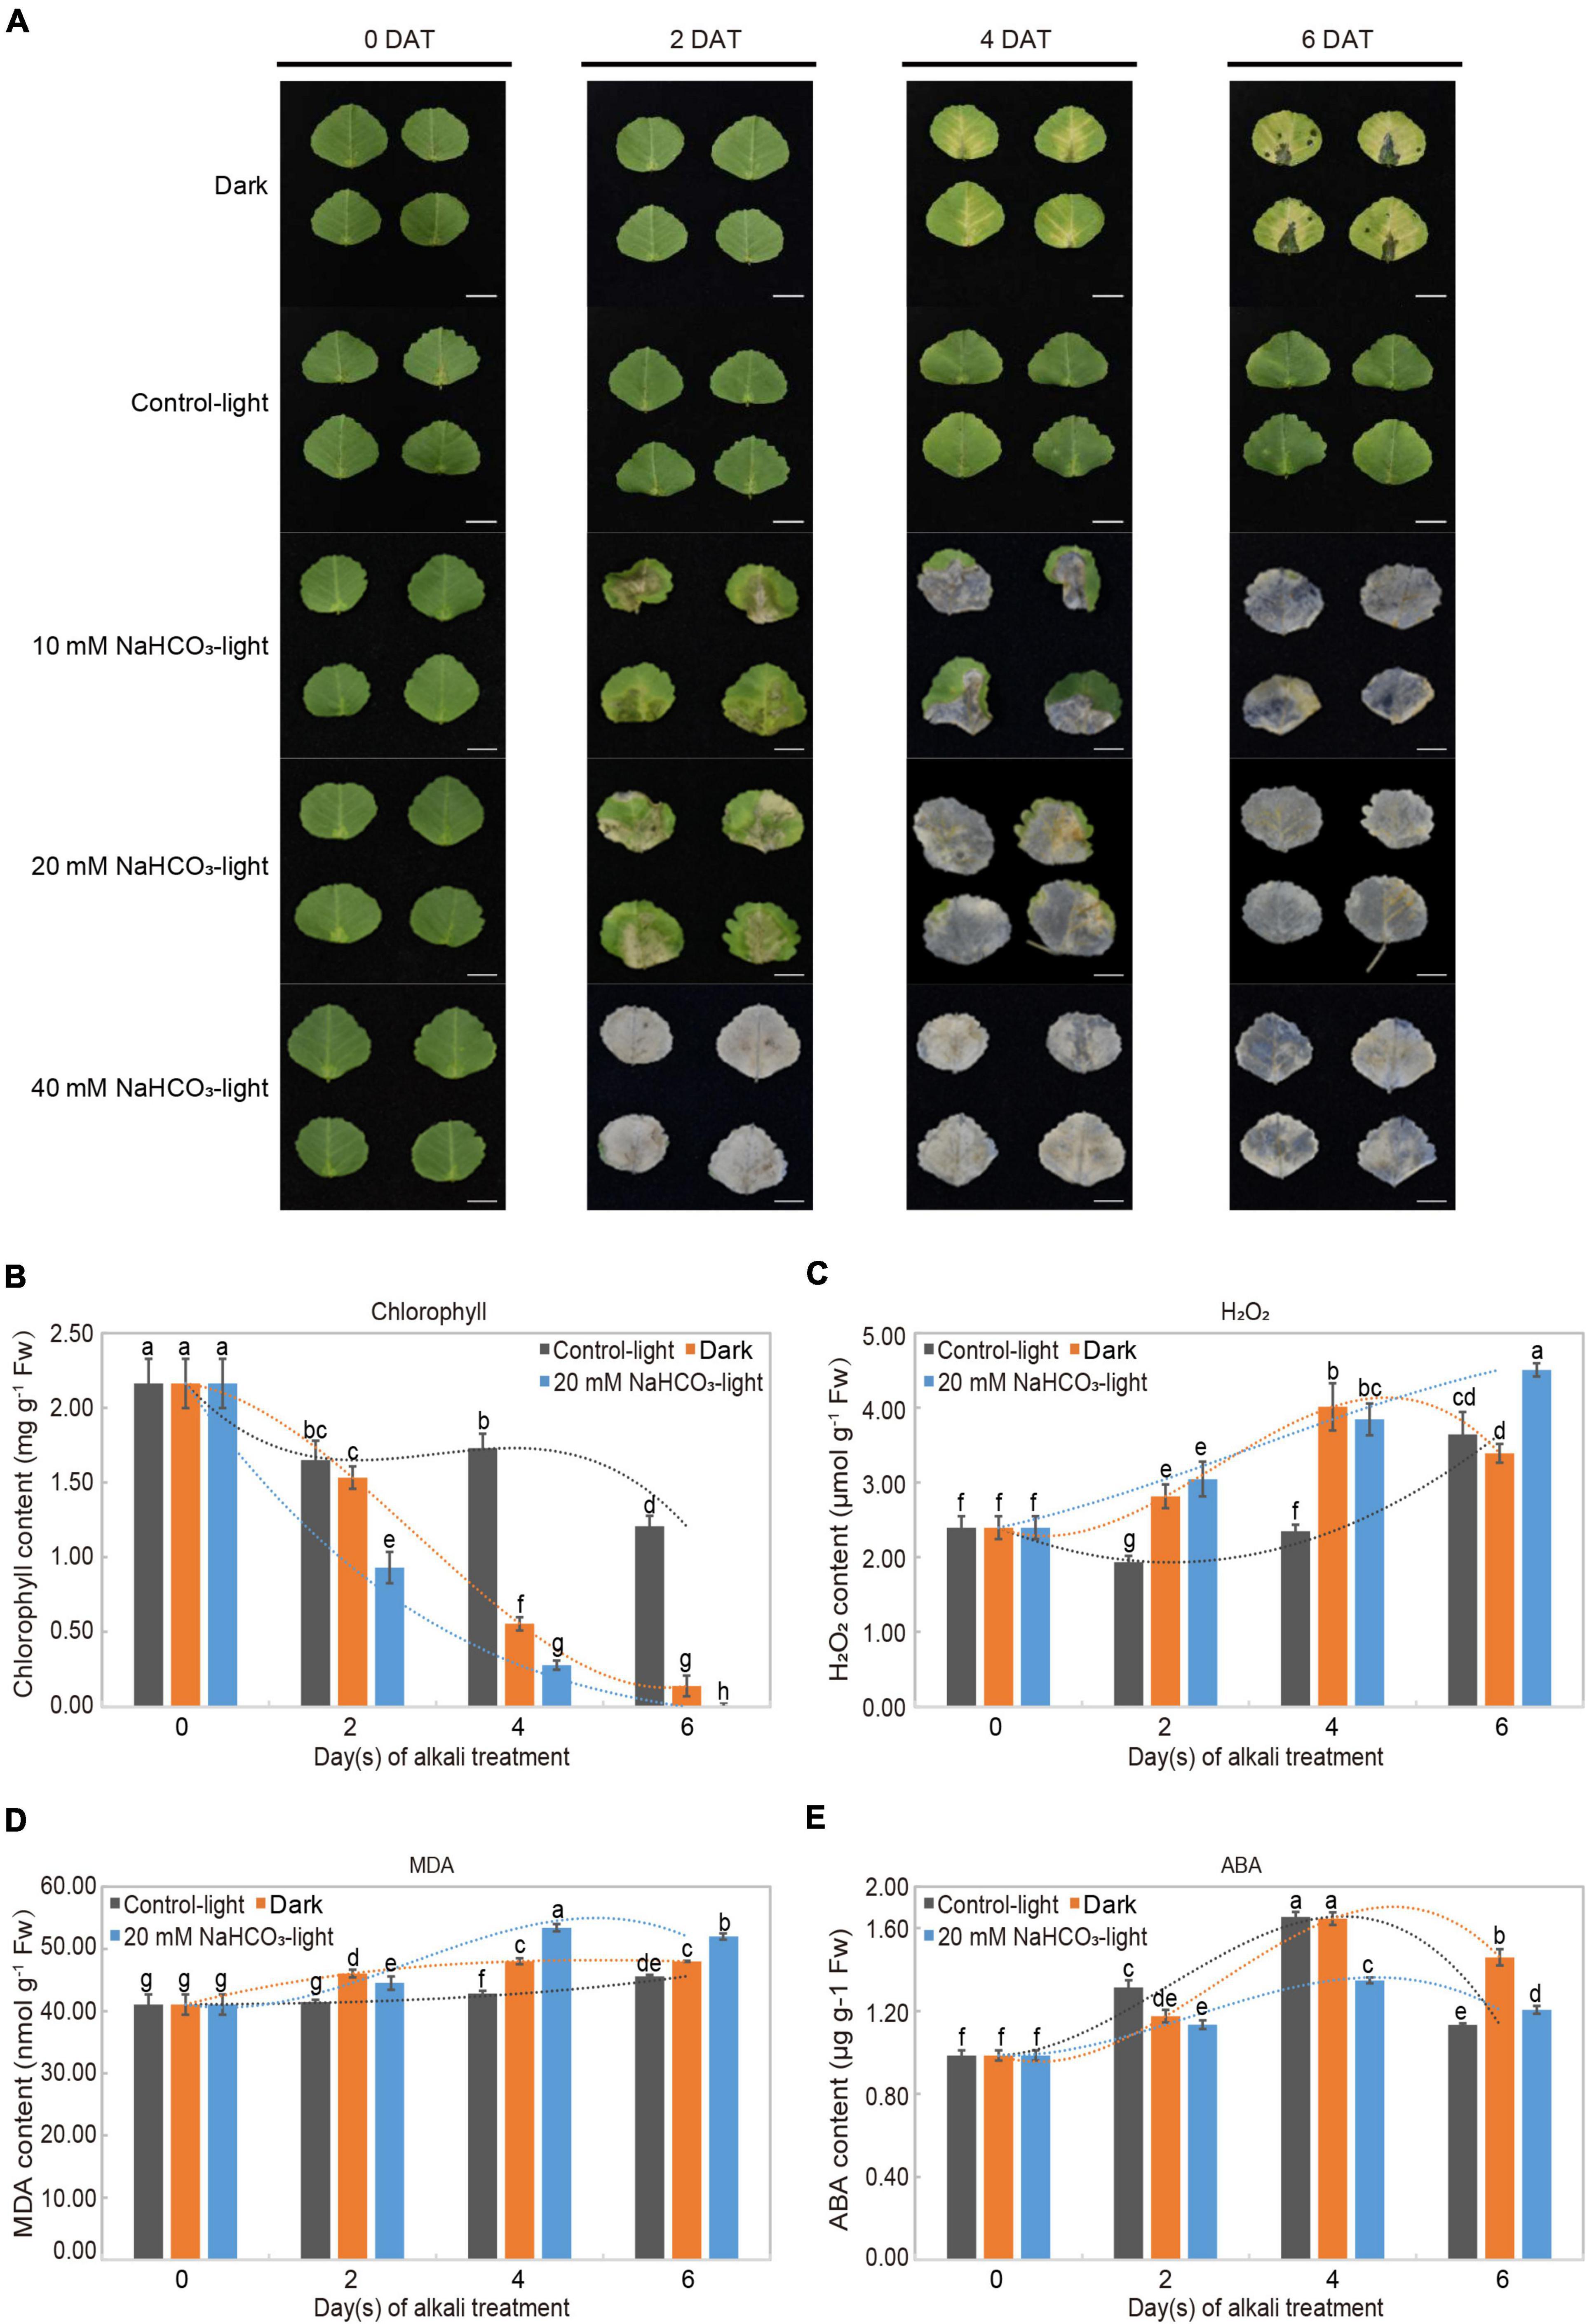
Figure 1. Alkali stress-induced leaf senescence and physiological analysis in Medicago truncatula. (A) Leaf senescence progression and color change of detached M. truncatula leaves under dark (Dark), normal light (Control-light), and 10, 20, 40 mM NaHCO3 (10 mM NaHCO3-light, 20 mM NaHCO3-light and 40 mM NaHCO3-light) conditions for 0, 2, 4, and 6 days. DAT: days after treatment. Scale bar = 1 cm. (B) Chlorophyll (a + b), (C) H2O2, (D) malondialdehyde (MDA), and (E) abscisic acid (ABA) in detached M. truncatula leaves exposed to different conditions during senescence. Values are presented as mean ± SE of three independent biological replicates per time point. Different letters indicate significant differences among treatments according to the analysis of variance (ANOVA, P < 0.05). Error bars correspond to standard error. FW, fresh weight.
The physiological response of detached leaves treated with 20 mM NaHCO3 was investigated through measuring chlorophyll, H2O2, MDA, and ABA contents. These four physiological and biochemical indicators are commonly used to evaluate the leaf senescence process. The chlorophyll content in both the alkaline-stress and dark groups decreased distinctly from days 2 to 6 in comparison to the slight reduction in the control-light group. Moreover, the chlorophyll content was even undetectable in the 20 mM NaHCO3 group on day 6 (Figure 1B). As expected, H2O2 levels in the alkaline-stress group increased progressively from days 2 to 6 during leaf senescence; those in the dark-induced group followed the same trend, steadily increasing from days 2 to 4, and decreasing at day 6, as found in an earlier study (Dong et al., 2021; Figure 1C). MDA content in the alkaline stress and dark groups significantly increased to a maximum on day 4 and then dropped slightly on day 6 compared to the mild increase in the control-light group (Figure 1D). ABA content in both the treatment and control groups peaked on day 4, and then decreased, remaining above the initial value (Figure 1E).
Transcriptome Sequencing
The detached leaves were treated under the conditions of control-light, dark, 10 mM, and 20 mM NaHCO3 for 0, 2, 4, and 6 days; a total of 13 groups with three biological replicates in each group (in total 39 samples) were sampled for library construction and subsequent sequencing. A total of 283.60 Gb high-quality clean data were obtained. The clean reads from each sample exceeded 7.27 Gb, and the matching to the reference genomic sequence was 81.78–89.05%. The GC content was above 42.60% and the percentage of Q30 bases was at least 92.82% (Supplementary Table 2). Principal component analysis (PCA) showed higher similarity among biological replicates of the same group and higher variability among different groups under different conditions (Figure 2A). The high Pearson correlation values of the biological replicates for the 39 samples achieved the expectation of the experimental design (Supplementary Figure 1). The specific gene expression profiles obtained by qRT-PCR analysis were used for the validation of RNA-Seq data, and the results showed similar expression profiles between RNA-Seq and qRT-PCR analysis (Figure 2B and Supplementary Figure 2).
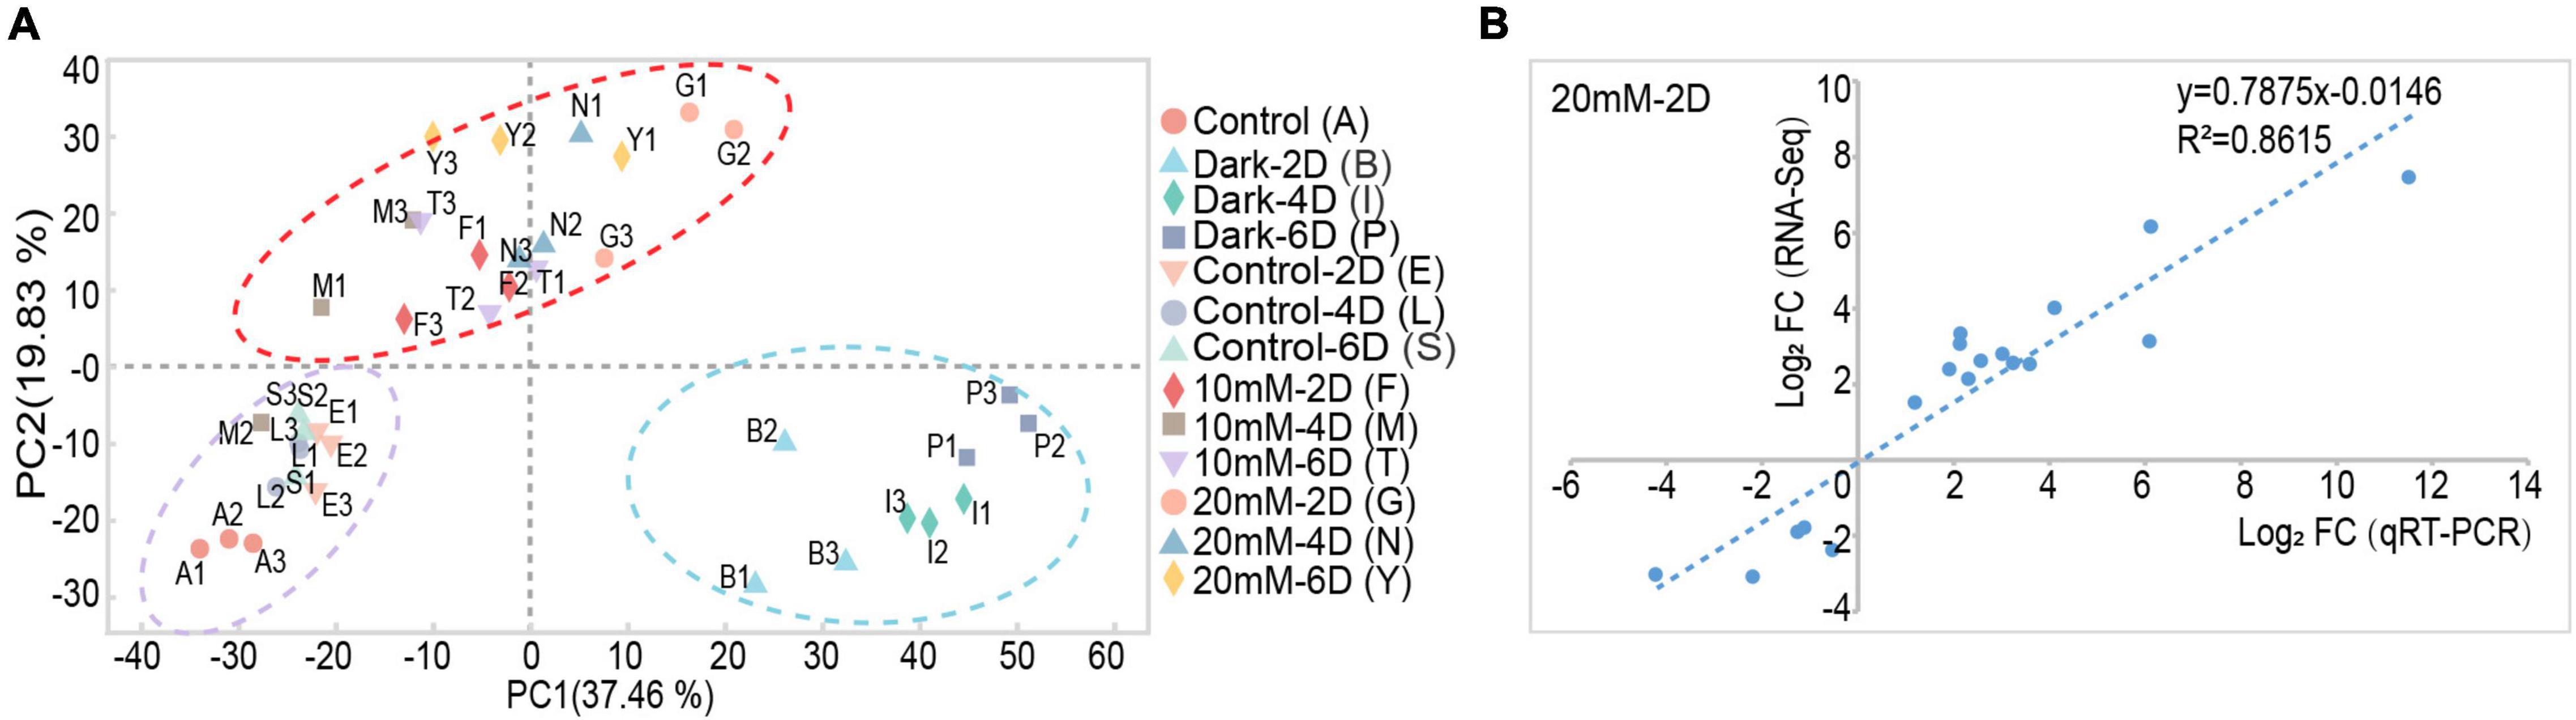
Figure 2. The PCA analysis and qRT-PCR validation of transcriptome data derived from alkali stress-induced detached leaf senescence in M. truncatula. (A) Principal component analysis (PCA) plot of transcriptome profiles from different conditions. (B) Validation of RNA-seq data by qRT-PCR analysis. Correlation of expression changes observed by RNA-seq (Y-axis) and qRT-PCR (X-axis) relative expression levels from log2 fold change of 25 genes in 20 mM NaHCO3-light-2 day; data for other groups are shown in Supplementary Figure 2.
Identification of Differentially Expressed Senescence-Associated Genes
Compared with day 0 levels, the upregulated and downregulated genes in both the control-dark and 20 mM NaHCO3 treatment groups ranged from 8,700 to 11,910, while the number of DEGs in the control-light group was much smaller than that in the treatment group, ranging between 3,800 and 5,300 DEGs (Figure 3A and Supplementary Table 3). The number of upregulated and downregulated genes in the alkaline stress group decreased with extended treatment time, while there was an opposite trend in both control groups.

Figure 3. Analysis of differentially expressed senescence-associated genes (SAGs) under alkali stress. (A) The number of differentially expressed genes that were upregulated or downregulated during leaf senescence compared with 0 day control prior to treatment, as assessed using the difference analysis software edgeR at thresholds of | log2FC| ≥ 1 and P < 0.05. (B) Venn diagram of DEGs (|log2FC| ≥ 1 and P < 0.05) in the 10 mM, 20 mM NaHCO3 treatments and darkness on day 2, 4, and 6 compared with control-light condition. There were 985 SAGs shared by darkness and NaHCO3 treatments across three time points. (C) Short time-series expression miner (STEM) analysis of 985 and 1,180 genes across three time points. Each square box indicates a type of expression profile, with the profile order on the upper left and the P-value on the bottom left. Only significantly enriched cluster profiles with a P < 0.05 threshold are shown.
Venn diagrams at three time points based on all DEGs from both the 10 and 20 mM NaHCO3 treatments groups compared with the DEGs from the control-light group were constructed to obtain SAGs in order to identify genes associated with leaf senescence (Figure 3B). We identified 2,165 unique genes in the 10 and 20 mM NaHCO3 treatment groups compared with the control group. These genes were then divided into two parts after taking the intersection with the set of SAGs obtained from the dark-induced groups: 985 SAGs and 1,180 genes (Supplementary Table 4). STEM temporal pattern analysis showed genes with the same expression type were grouped into the same profile (Figure 3C). The 985 SAGs were divided into four significant gene expression profiles (P < 0.05), including one upregulated profile (red; profile 21; 340 genes), two downregulated profiles (green; profiles 3 and 4; 71 and 394 genes), and one other profile (gray; profile 6; 60 genes). The 1,180 genes were divided into six significant gene expression profiles: three being upregulated (profiles 21, 23, and 24; with 461, 42, and 127 genes, respectively), two downregulated (profiles 3 and 4; with 106 and 219 genes, respectively), and one other profile (profile 6; 30 genes).
Gene Ontology and Kyoto Encyclopedia of Genes and Genomes Pathway Enrichment Analysis
GO enrichment analysis characterizes the gene function and relations in three categories: biological processes (BP), molecular functions (MF), and cellular components (CC). As shown in Table 1, the GO terms with the top 10 highest enrichment degree were all went to BP category for 985 SAGs, while for 1,180 DEGs the top 10 highest enrichments were classified into CC and BP categories. For the 985 SAGs, the top GO terms were mainly involved in “small molecule catabolic and metabolic process,” “cellular amino acid metabolic processes,” “carboxylic acid catabolic and metabolic process,” and “organic acid and substance catabolic process” of BP category; while among the 1,180 DEGs, the top GO terms in BP category were “aerobic respiration,” “aerobic electron transport chain,” “ion transport,” and “cation transport”; also in CC category, “mitochondrion,” “oxidoreductase complex,” “NADH dehydrogenase complex,” and “Membrane-bounded organelle” were significantly enriched. In all, the enrichment of GO terms with higher degrees from the two gene sets (985 SAGs and 1,180 DEGs) was remarkably significantly different, indicating that the genes of the two gene sets play different roles under alkaline stress.
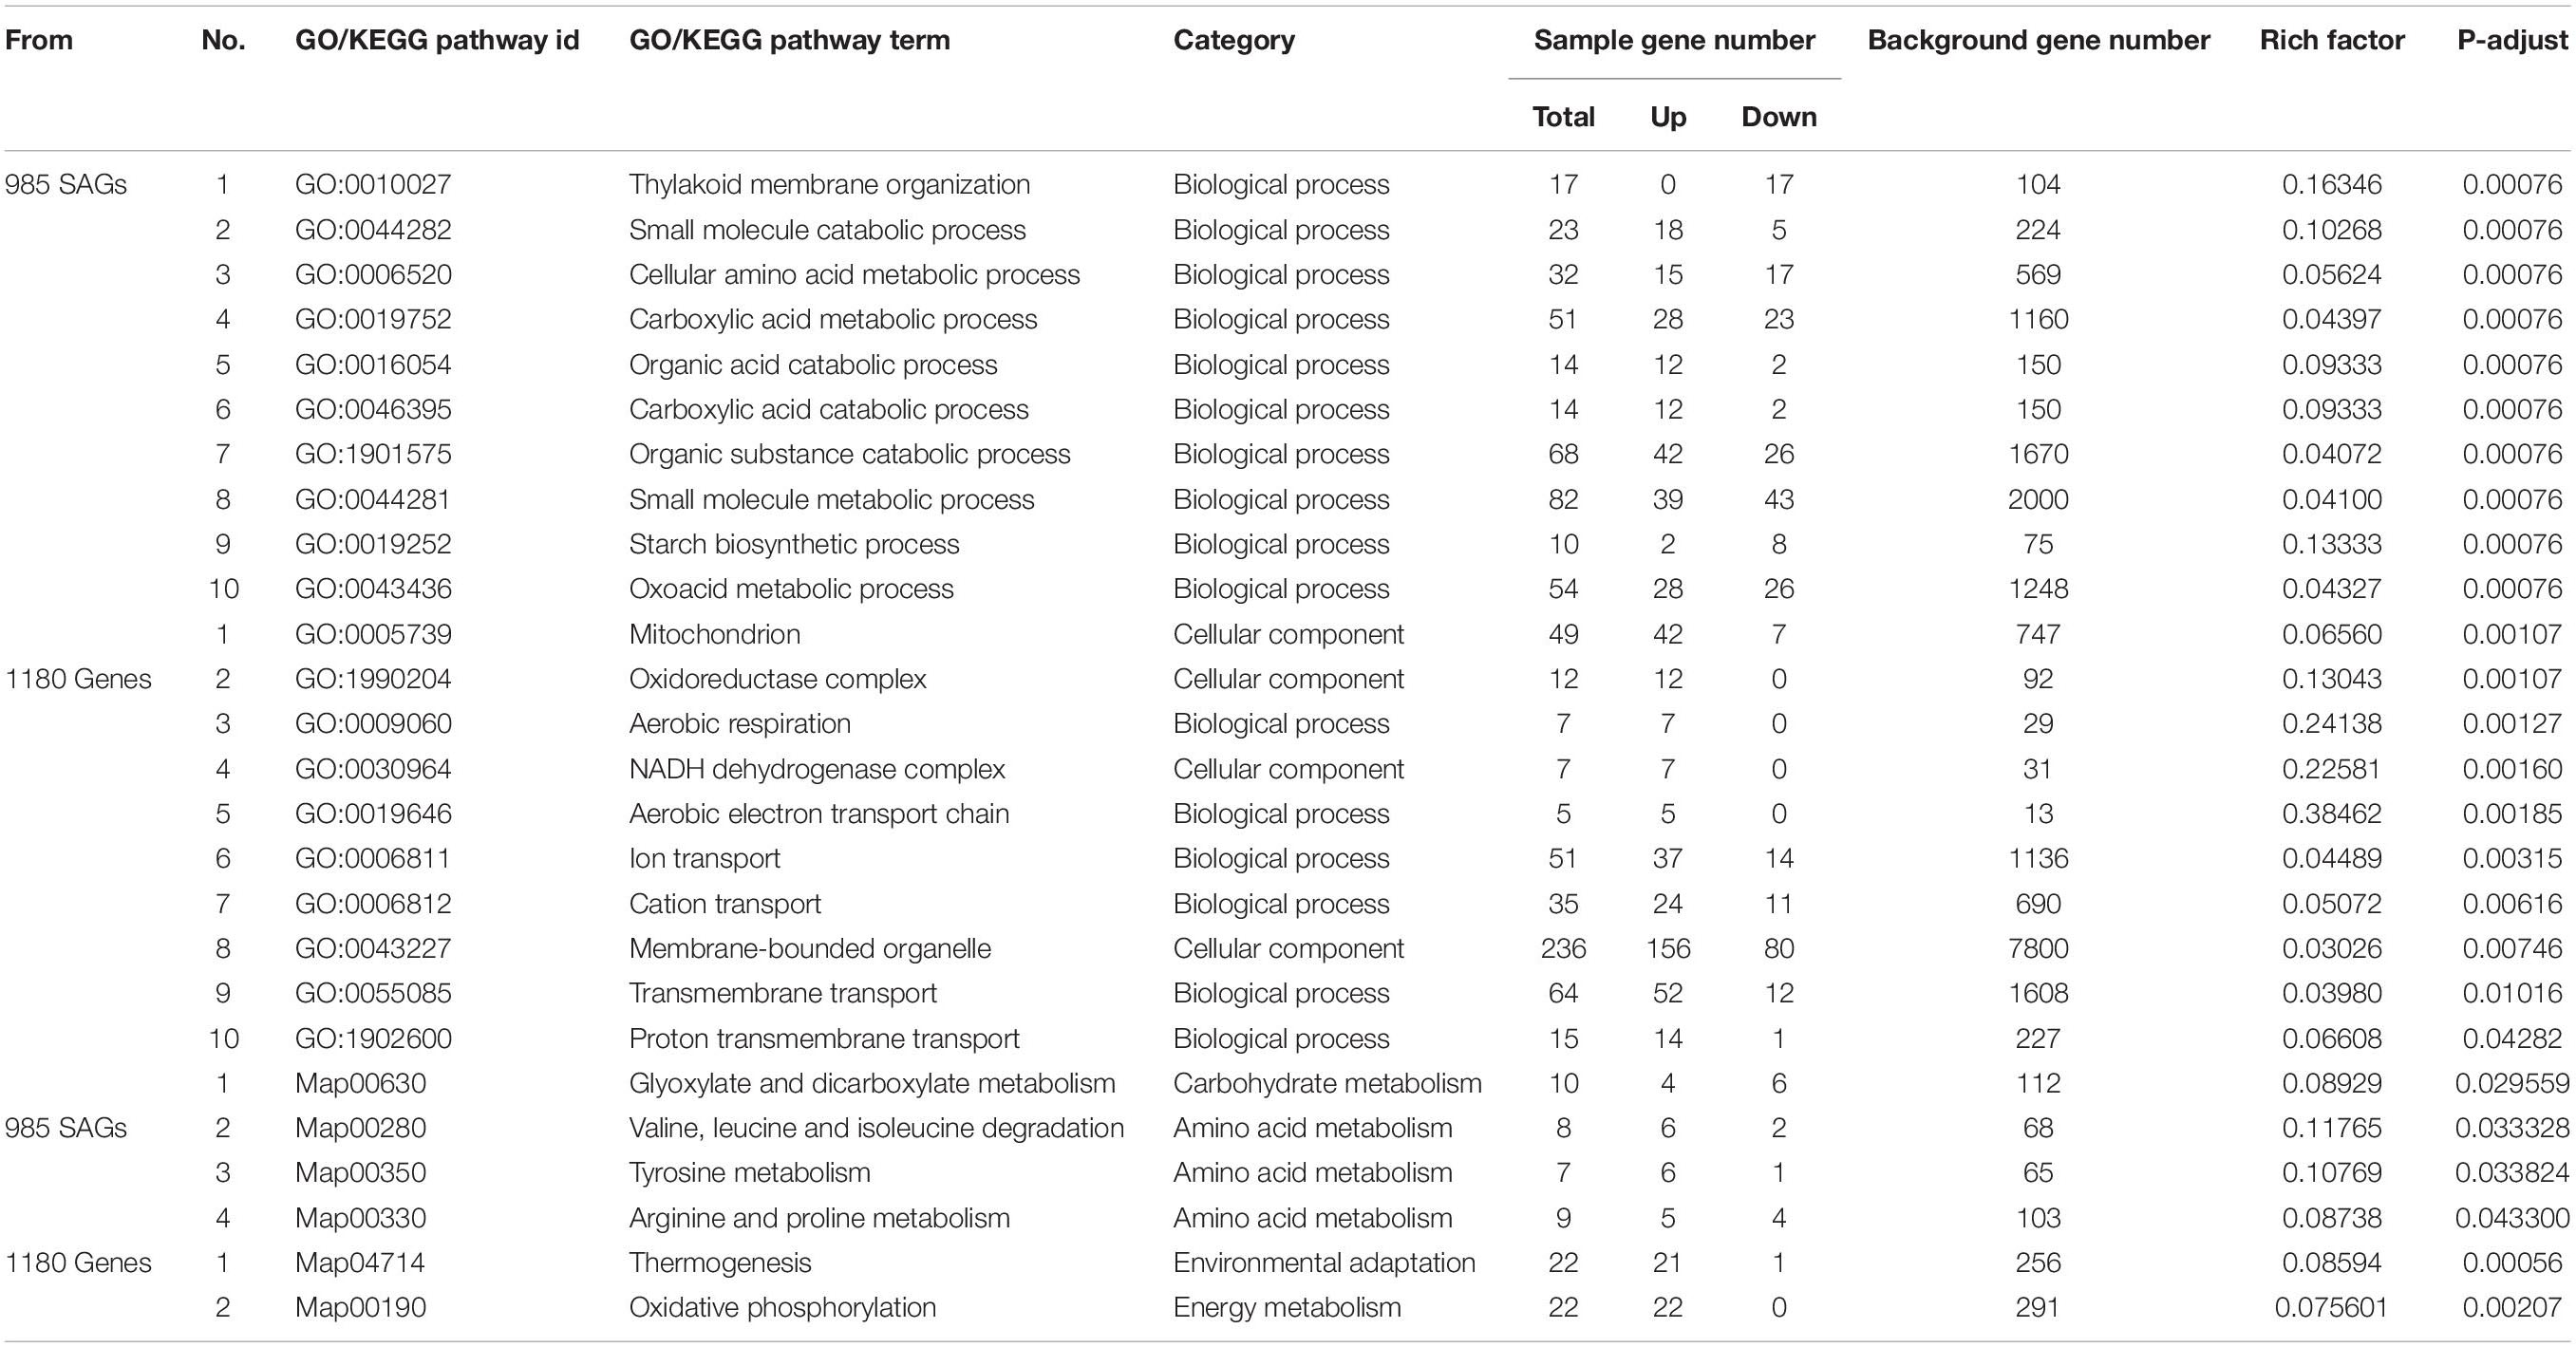
Table 1. Gene ontology (GO) and Kyoto Encyclopedia of genes and genomes (KEGG) pathways enrichment analysis of DEGs (Figure 3B, 985 SAGs and 1,180 genes) shared by darkness and alkaline-induced leaf senescence at three time points.
KEGG enrichment analysis showed that the most significantly enriched pathways in 985 genes were related to “glyoxylate and dicarboxylate metabolism,” “valine, leucine, and isoleucine degradation,” “tyrosine metabolism,” and “arginine and proline metabolism.” On the contrary, thermogenesis, and oxidative phosphorylation were the enriched KEGG pathway terms for the 1,180 genes.
It is reported that regulation of plasma membrane (PM) H+-ATPase activity is important for plant adaptation to alkali stress and enhancement of higher leaf photosynthesis (Fuglsang et al., 2007; Yang et al., 2010, 2019; Zhang M. et al., 2021). Four key genes related to PM H+-ATPase are up-regulated expression, and phylogenetic analysis indicated that MTR_5g009720, MTR_6g011310, MTR_7g117500, and MTR_1g064540 are orthologs of Arabidopsis PM H+-ATPase (Figure 4).

Figure 4. Phylogenetic analysis of PM H+-ATPase gene family members in M. truncatula and Arabidopsis thaliana. The upward red arrows indicates that the genes are up-regulated in the alkali stress-induced detached leaf senescence in M. truncatula; and the asterisk shows the alkaline-stress-regulated PM H+-ATPase gene in Arabidopsis. The scale bar indicates the sequence divergence is 0.10 per unit bar.
Transcription Factor Analysis
TFs play an important role in regulating leaf senescence; the PlantTFDB 4.0 match analysis was used for predicting TFs. We identified 101 and 173 TFs in 985 SAGs and 1,180 DEGs, belonging to 16 and 26 TF families, respectively (Supplementary Table 5). The most typical representative TF families in 985 SAGs included bHLH (seven genes), MYB (four genes), and WRKY (three genes), while B3 (seven genes), MYB (seven genes), and HB-other (six genes) were the most representatives in 1,180 DEGs (Table 2). As shown in Table 2 for the representatives from 1,180 DEGs, most B3, HB-other, and ARF TFs were downregulated, whereas the MYB and WRKY TF families were upregulated.
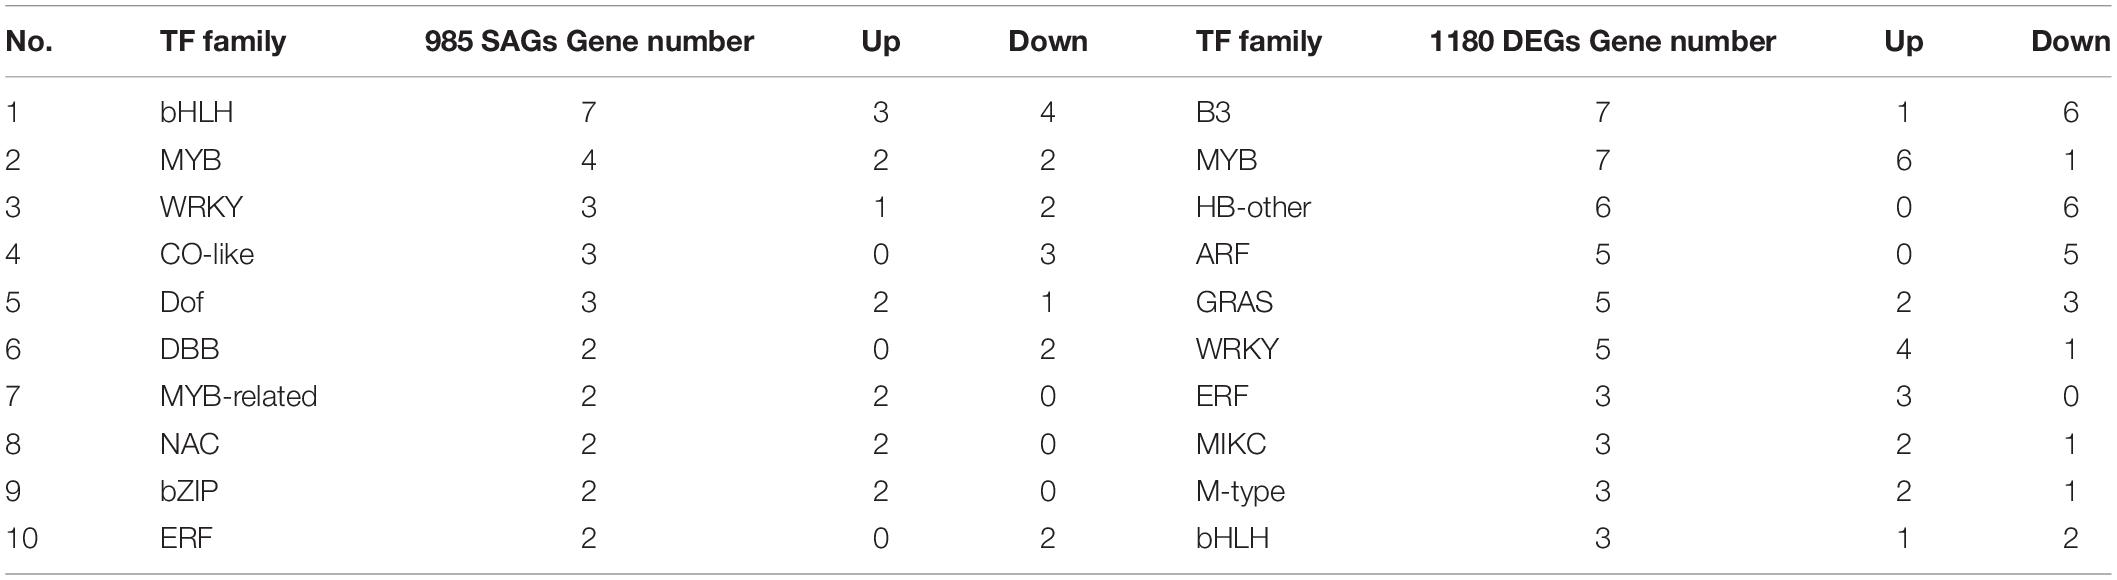
Table 2. Transcription factors (TFs) predicted from 985 SAGs and 1,180 DEGs (Figure 3B).
The families and numbers of TFs have big differences in the two gene sets. The NAC and bZIP TF families belong to 985 SAGs, and these TF families are widely reported in the regulation of senescence. The B3, HB-other, and ARF TF families in the 1,180 DEGs play an important role in abiotic stress defense responses. The MYB, WRKY, and bHLH families are multifunctional but essentially regulate plant senescence directly or indirectly.
Time-Course Senescence-Associated Gene Analysis
Time-course gene expression analysis found that 985 SAGs and 1,180 DEGs (Figure 3B) were divided into eight clusters, each of which included certain genes with the same expression patterns. The gene expression trend differences between the control and treated groups are illustrated in Figure 5. Among the 985 SAGs, the 106 genes were upregulated in clusters 1, 2, 5, 6, and 8, and the 108 downregulated genes (50.5%) were enriched in clusters 3, 4, and 7 (Figure 5A). In clusters 1, 2, 4, 6, 7, and 8 of 1,180 DEGs, 81 genes were upregulated, while in clusters 3 and 5, 34 genes (29.6%) were downregulated (Figure 5B). The expression patterns of all genes are shown in Supplementary Figure 3.
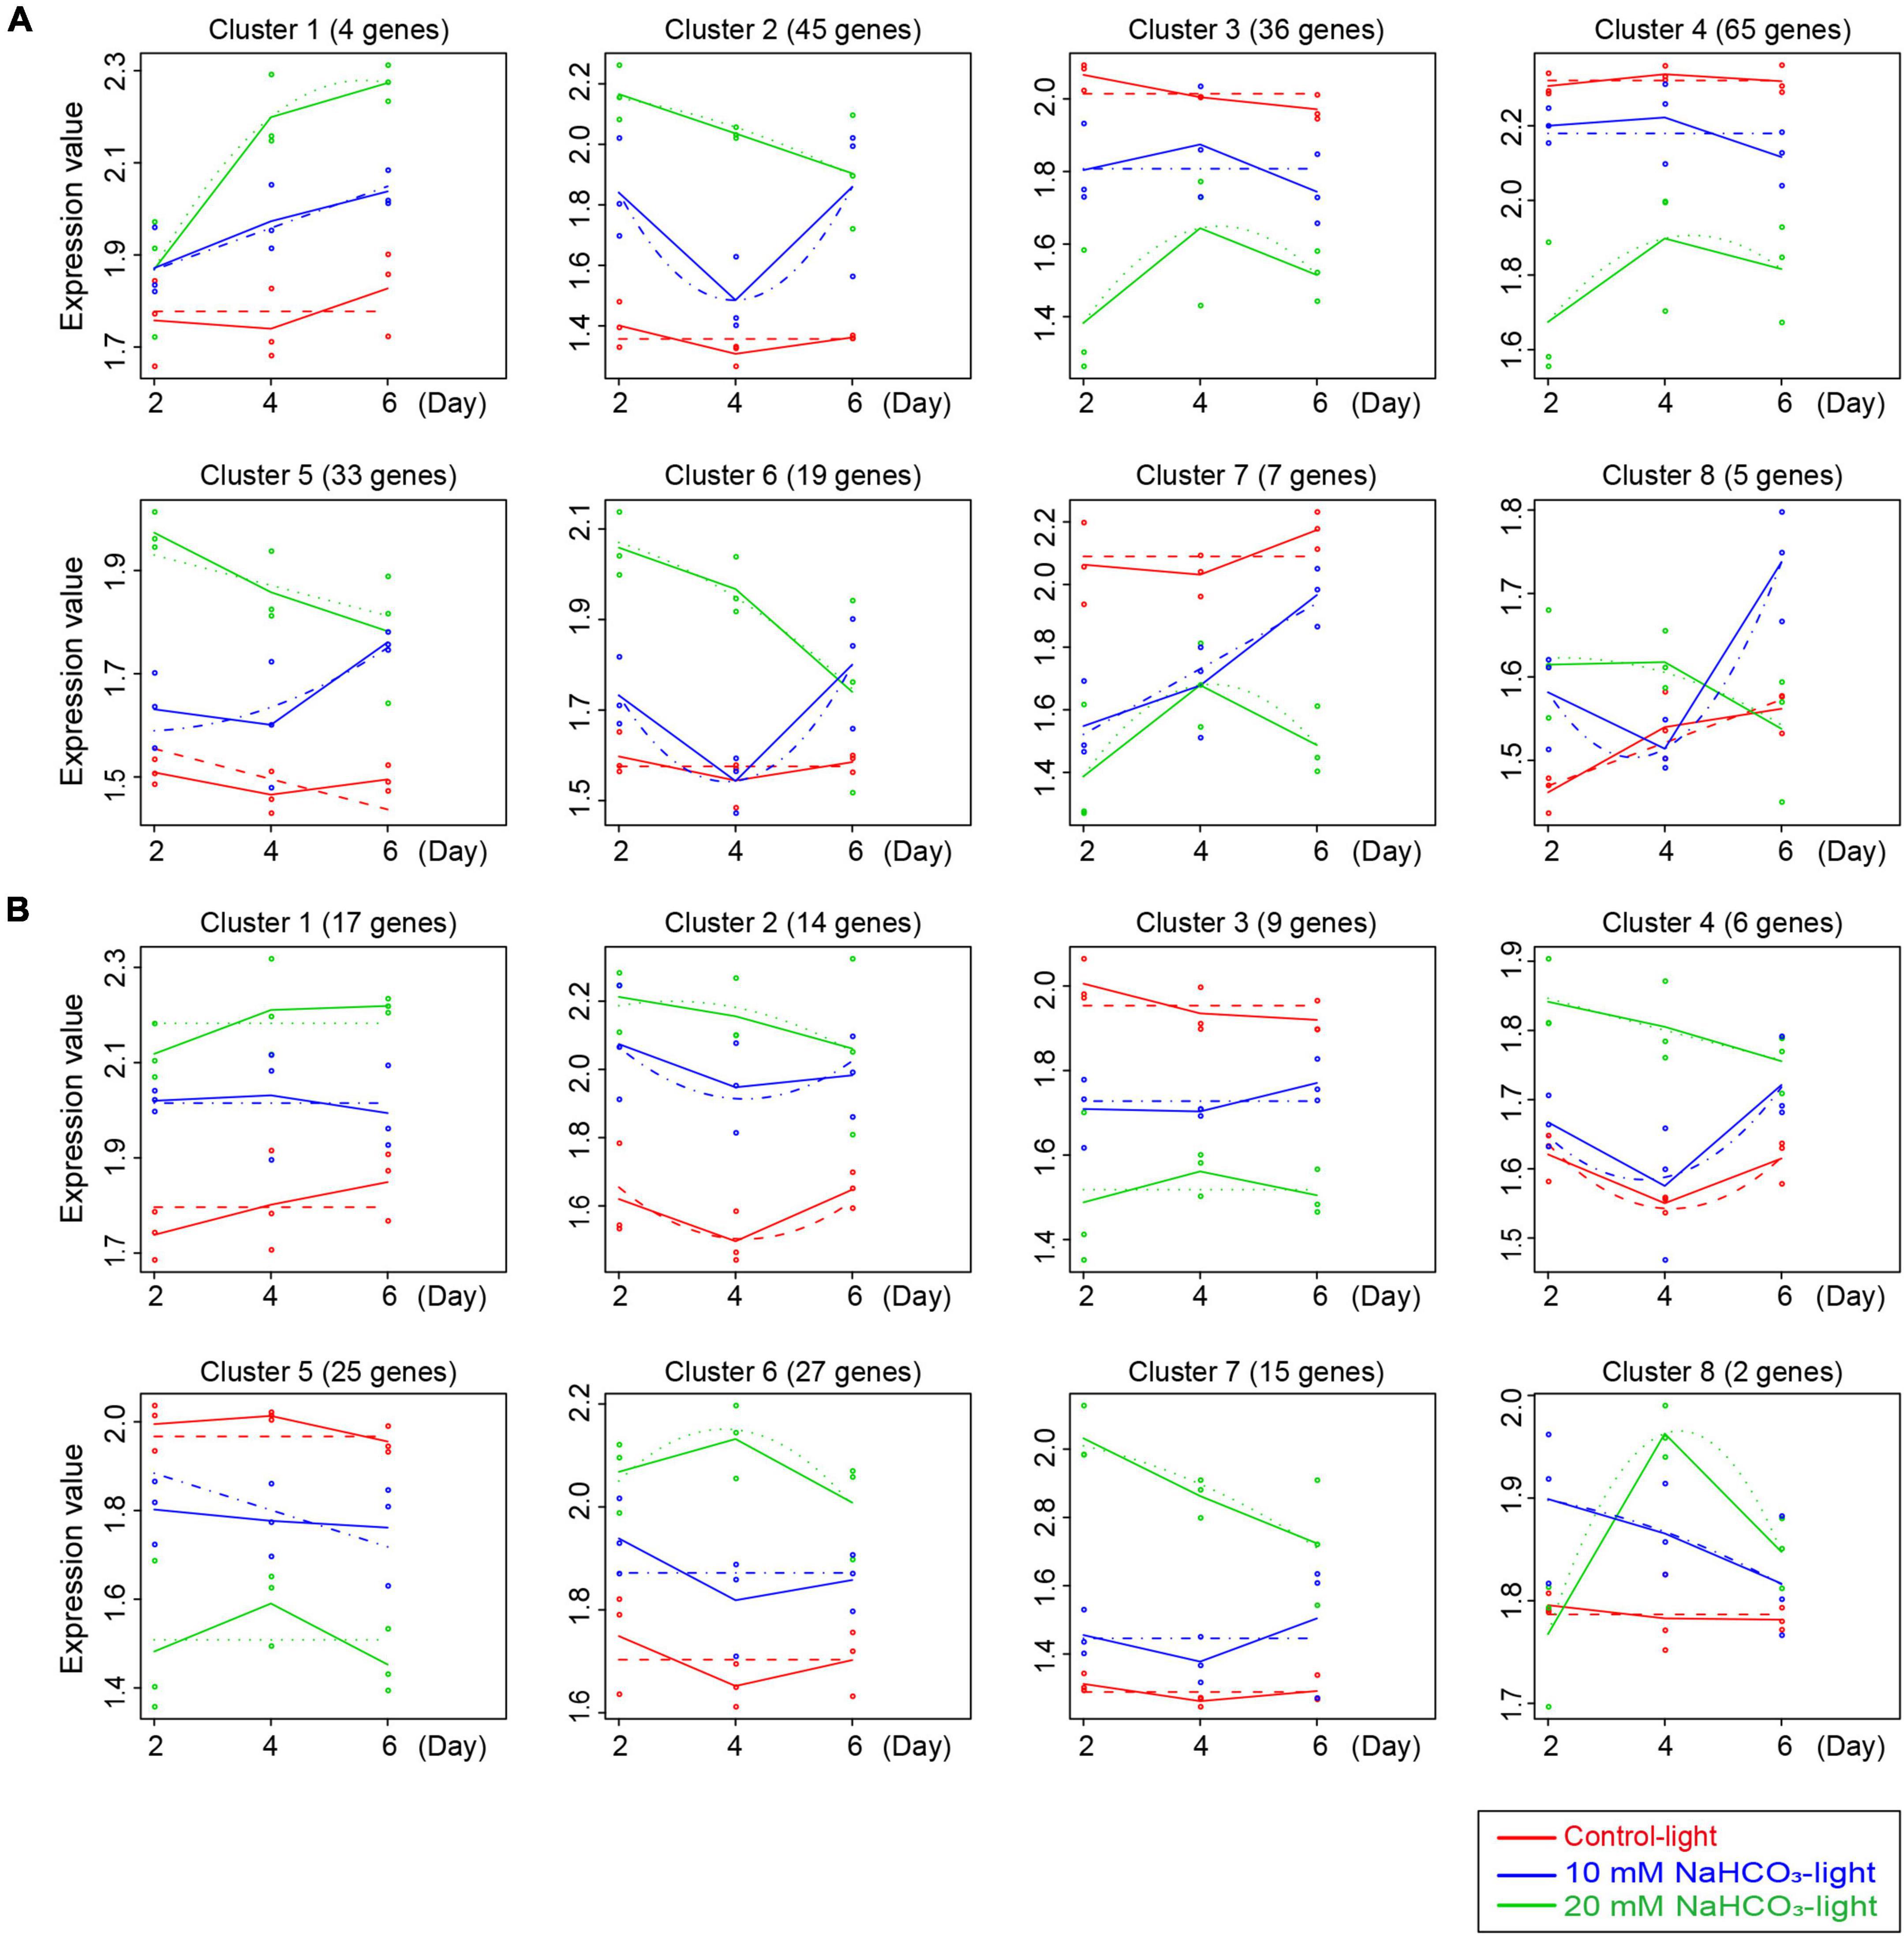
Figure 5. Data visualization according to the cluster analysis. Each map shows the average expression profiles of the gene clusters from all samples. The horizontal coordinates represent different time points, and the vertical coordinates represent the treated expression values. Different colored lines represent different groups (red, blue, and green lines represent the control light, 10 mM NaHCO3-light, and 20 mM NaHCO3-light groups, respectively) and show the actual average value of gene expression at each time point. Different points represent the actual average expression levels for specific individual samples. The dotted lines represent the fitted curves of gene expression at each time point. (A,B) Are the cluster analysis for 985 SAGs and 1,180 DEGs, respectively.
To elucidate the expression pattern and function of genes in different clusters of 985 SAGs and 1,180 DEGs, we performed KEGG pathway enrichment analysis. Among the 985 SAGs, the genes related to nutrient cycling are enriched in the clusters of upregulated genes, including clusters 1, 2, and 8 with strikingly expressed amino acid metabolism-related genes. The genes related to photosynthesis are enriched in clusters 3, 4, and 7 with downregulated expression patterns. There was a strong difference of enriched genes’ function between 985 SAGs and 1,180 DEGs. Among the 1,180 DEGs, the genes related to oxidative phosphorylation and thermogenesis are enriched in clusters of upregulated genes, especially in clusters 1 and 5. It is worth noting that there are arginine and proline metabolism-related genes present in clusters 7 and 8, and these genes are acting to relieve osmotic stress (Supplementary Table 6).
Integration Analysis of the Physiological Data and Transcriptome
Physiological indicators were closely linked to the transcriptome during plant leaf senescence (Table 3). A large number of genes related to nutrient metabolism were differentially expressed, such as 59 DEGs involved in amino acid metabolism, which could be expected to rapidly loose and shift nutrients during leaf senescence; and 76 chloroplast and thylakoid metabolism-related genes were observed, consistent with leaf yellowing and chlorophyll breakdown. Alkaline stress induced ROS production and accelerated leaf senescence; 178 genes related to oxidation activity were differentially expressed, in alignment with the increased H2O2 and MDA contents observed. Furthermore, the accumulation of ROS increased the permeability of the cell membrane in leaves, causing 169 genes related to ion transport to be differentially expressed (Supplementary Table 7).
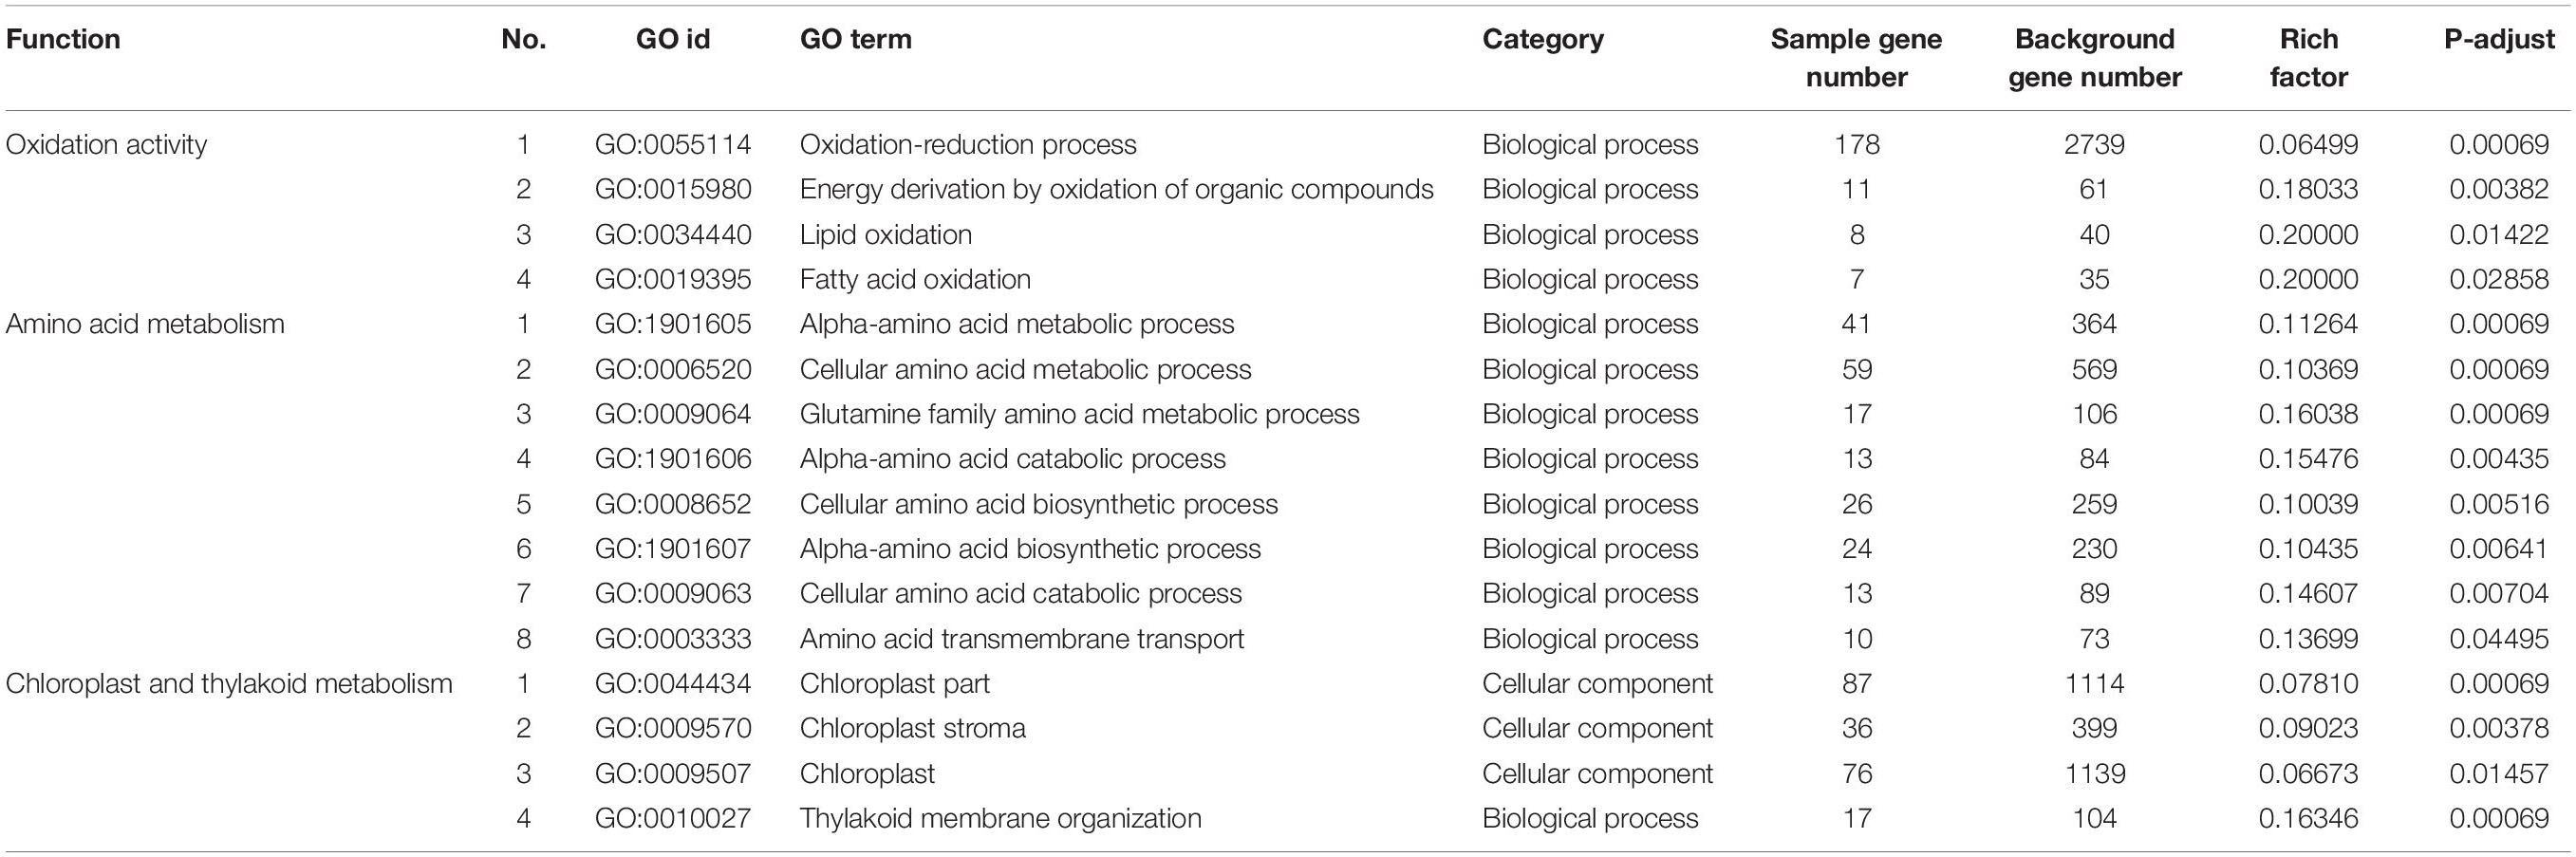
Table 3. Gene ontology (GO) enrichment analysis of DEGs (Figure 3B, 2,165 genes) that regulation of physiological activity.
The enrichment network map for GO terms described in Table 3 is displayed in Figure 6, and highlights the relationships between GO terms and GO terms, and between GO terms and genes. Functionally related GO terms were highly correlated.
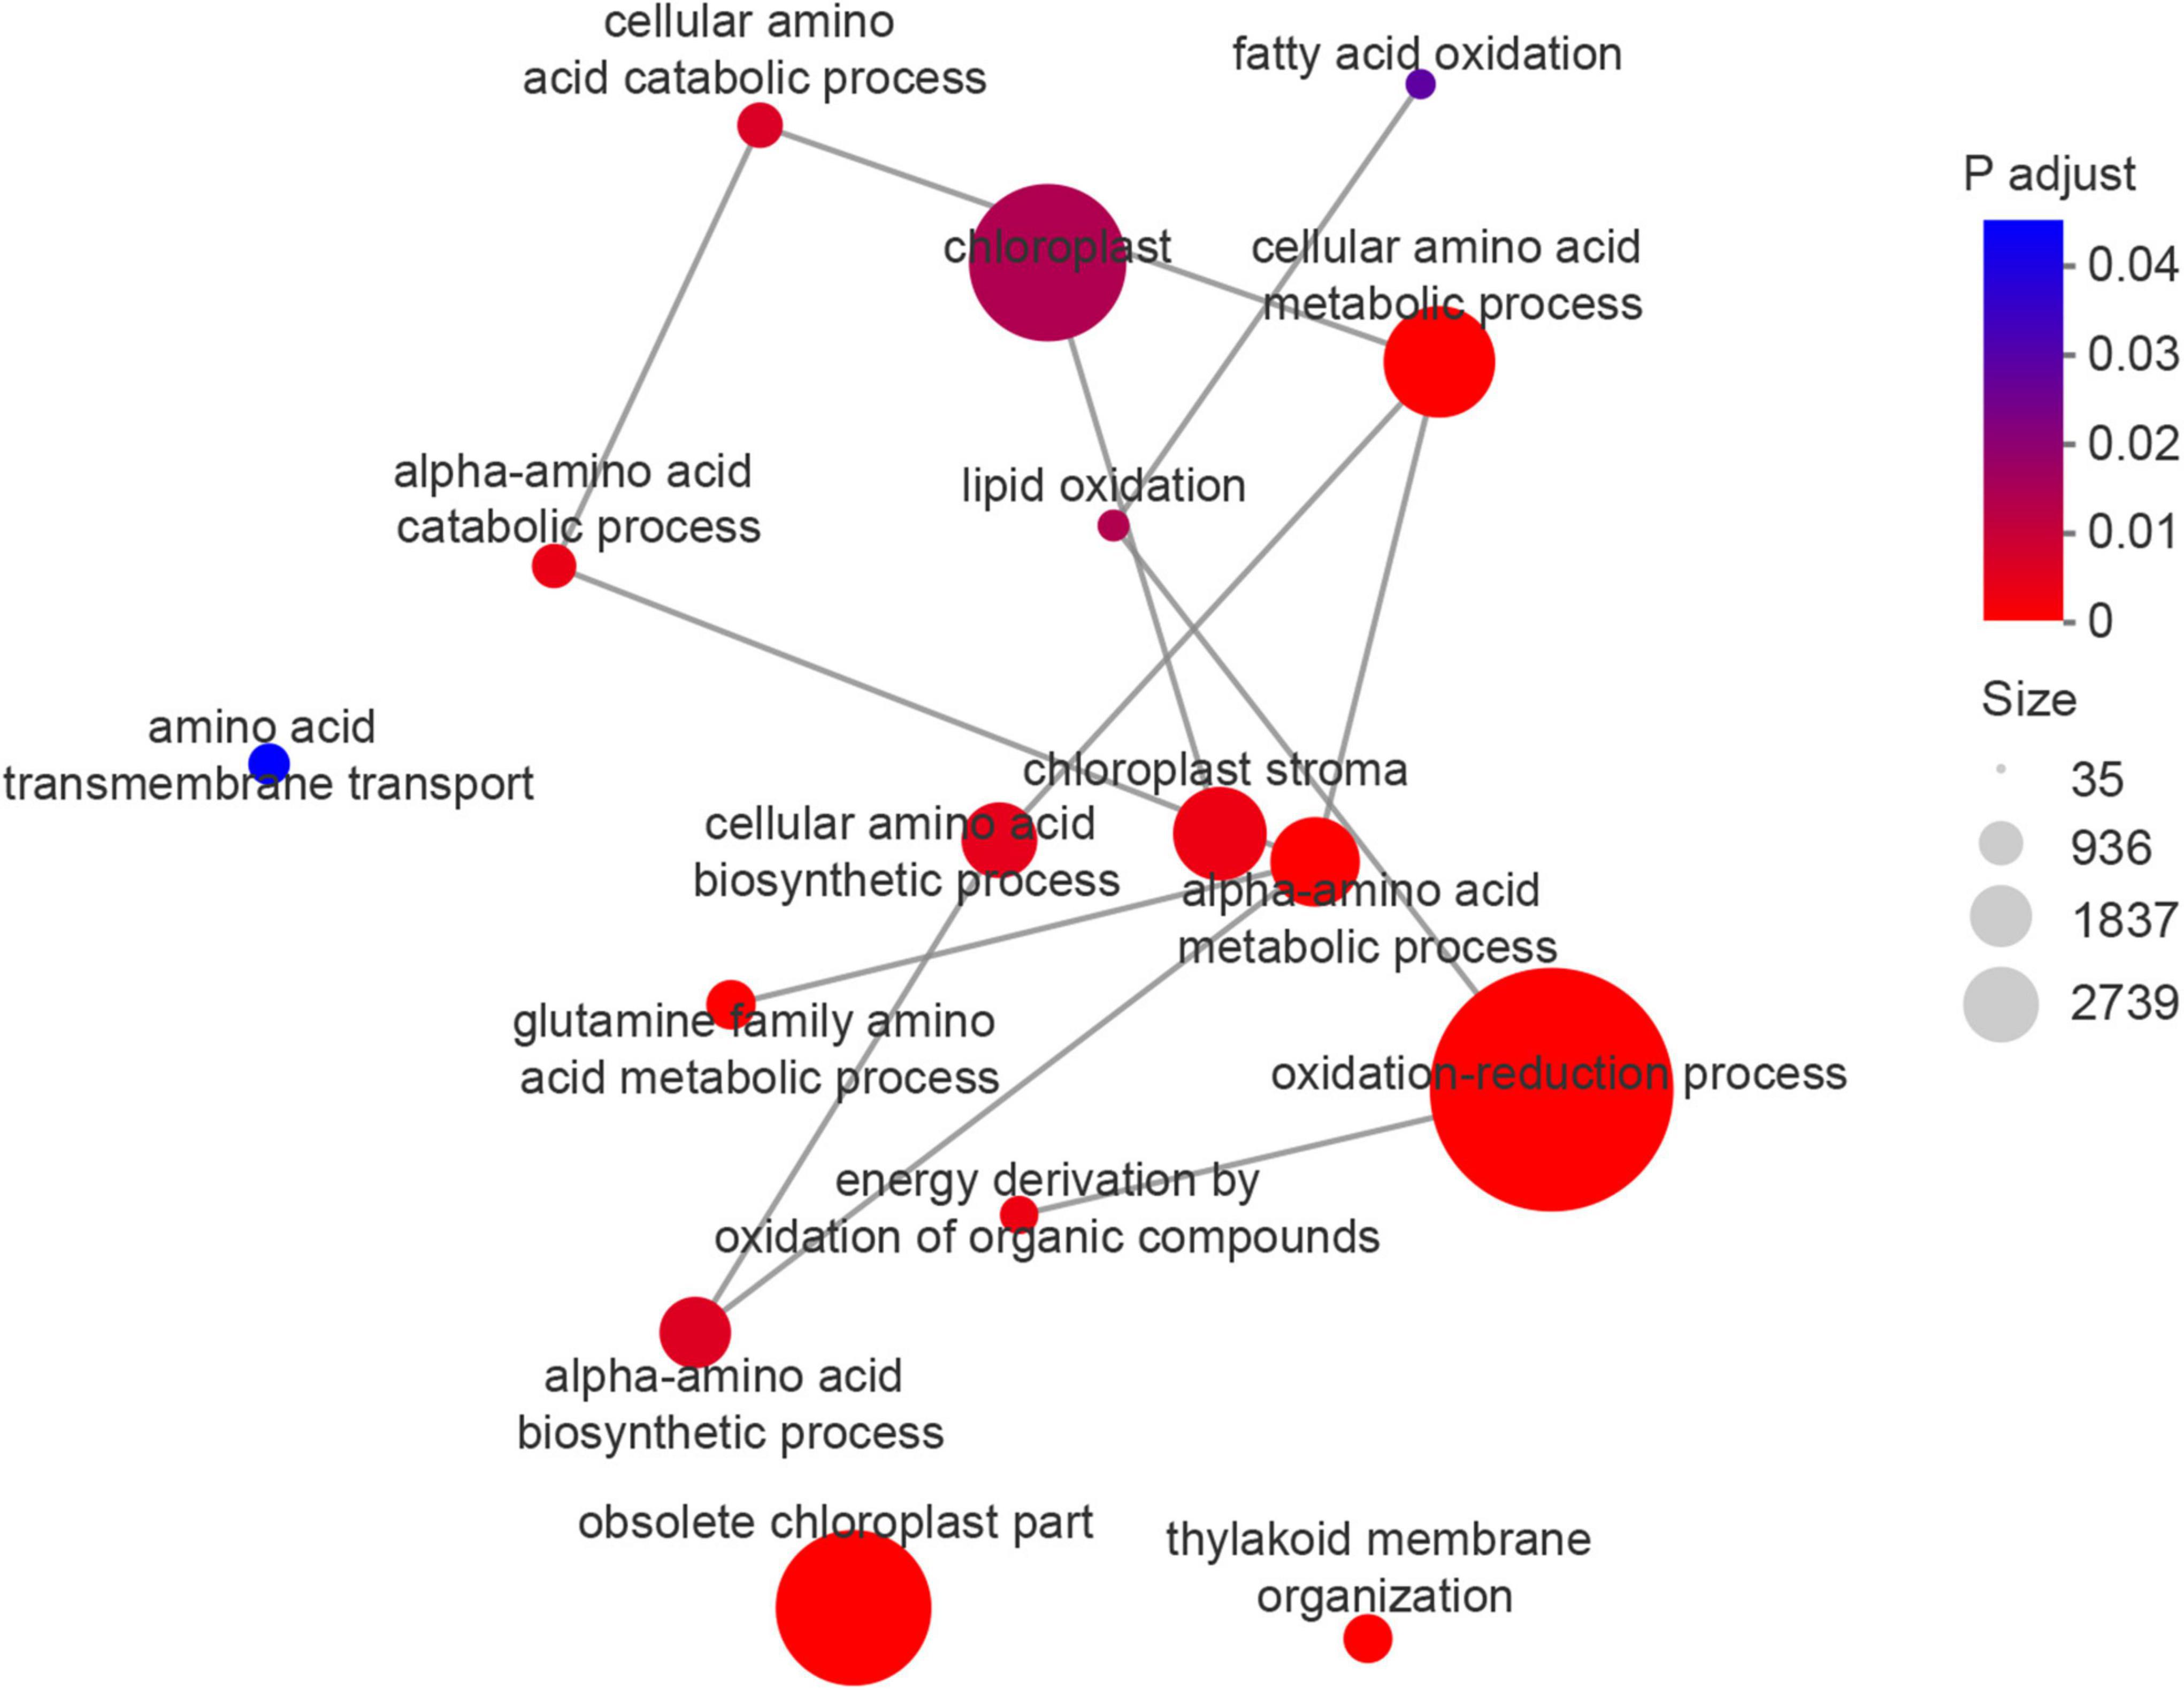
Figure 6. Enrichment network map for GO terms (Table 3), highlighting the relationship between GO terms and GO terms, GO terms and genes.
Responses of Detached Leaves to Salt Stress and Alkali Stress
The transcription profiles of salt stress have been analyzed in our previous study (Dong et al., 2021). Combined with the previous data, analysis showed that 1,463 DEGs were induced by both salt and alkali stresses, and these genes were mostly associated with nutrient cycling metabolism. The 702 DEGs were induced by alkali stress and enriched in thermogenic and oxidative phosphorylation pathways; 1,518 DEGs were induced by salt stress and enriched in porphyrin and chlorophyll metabolism, the citrate cycle (TCA cycle), and photosynthesis (Figure 7A and Supplementary Table 8). On this basis, we focused on the differential expression of senescence-associated genes in the two stresses; 792 SAGs were induced under both salt and alkali stresses (Figure 7B).
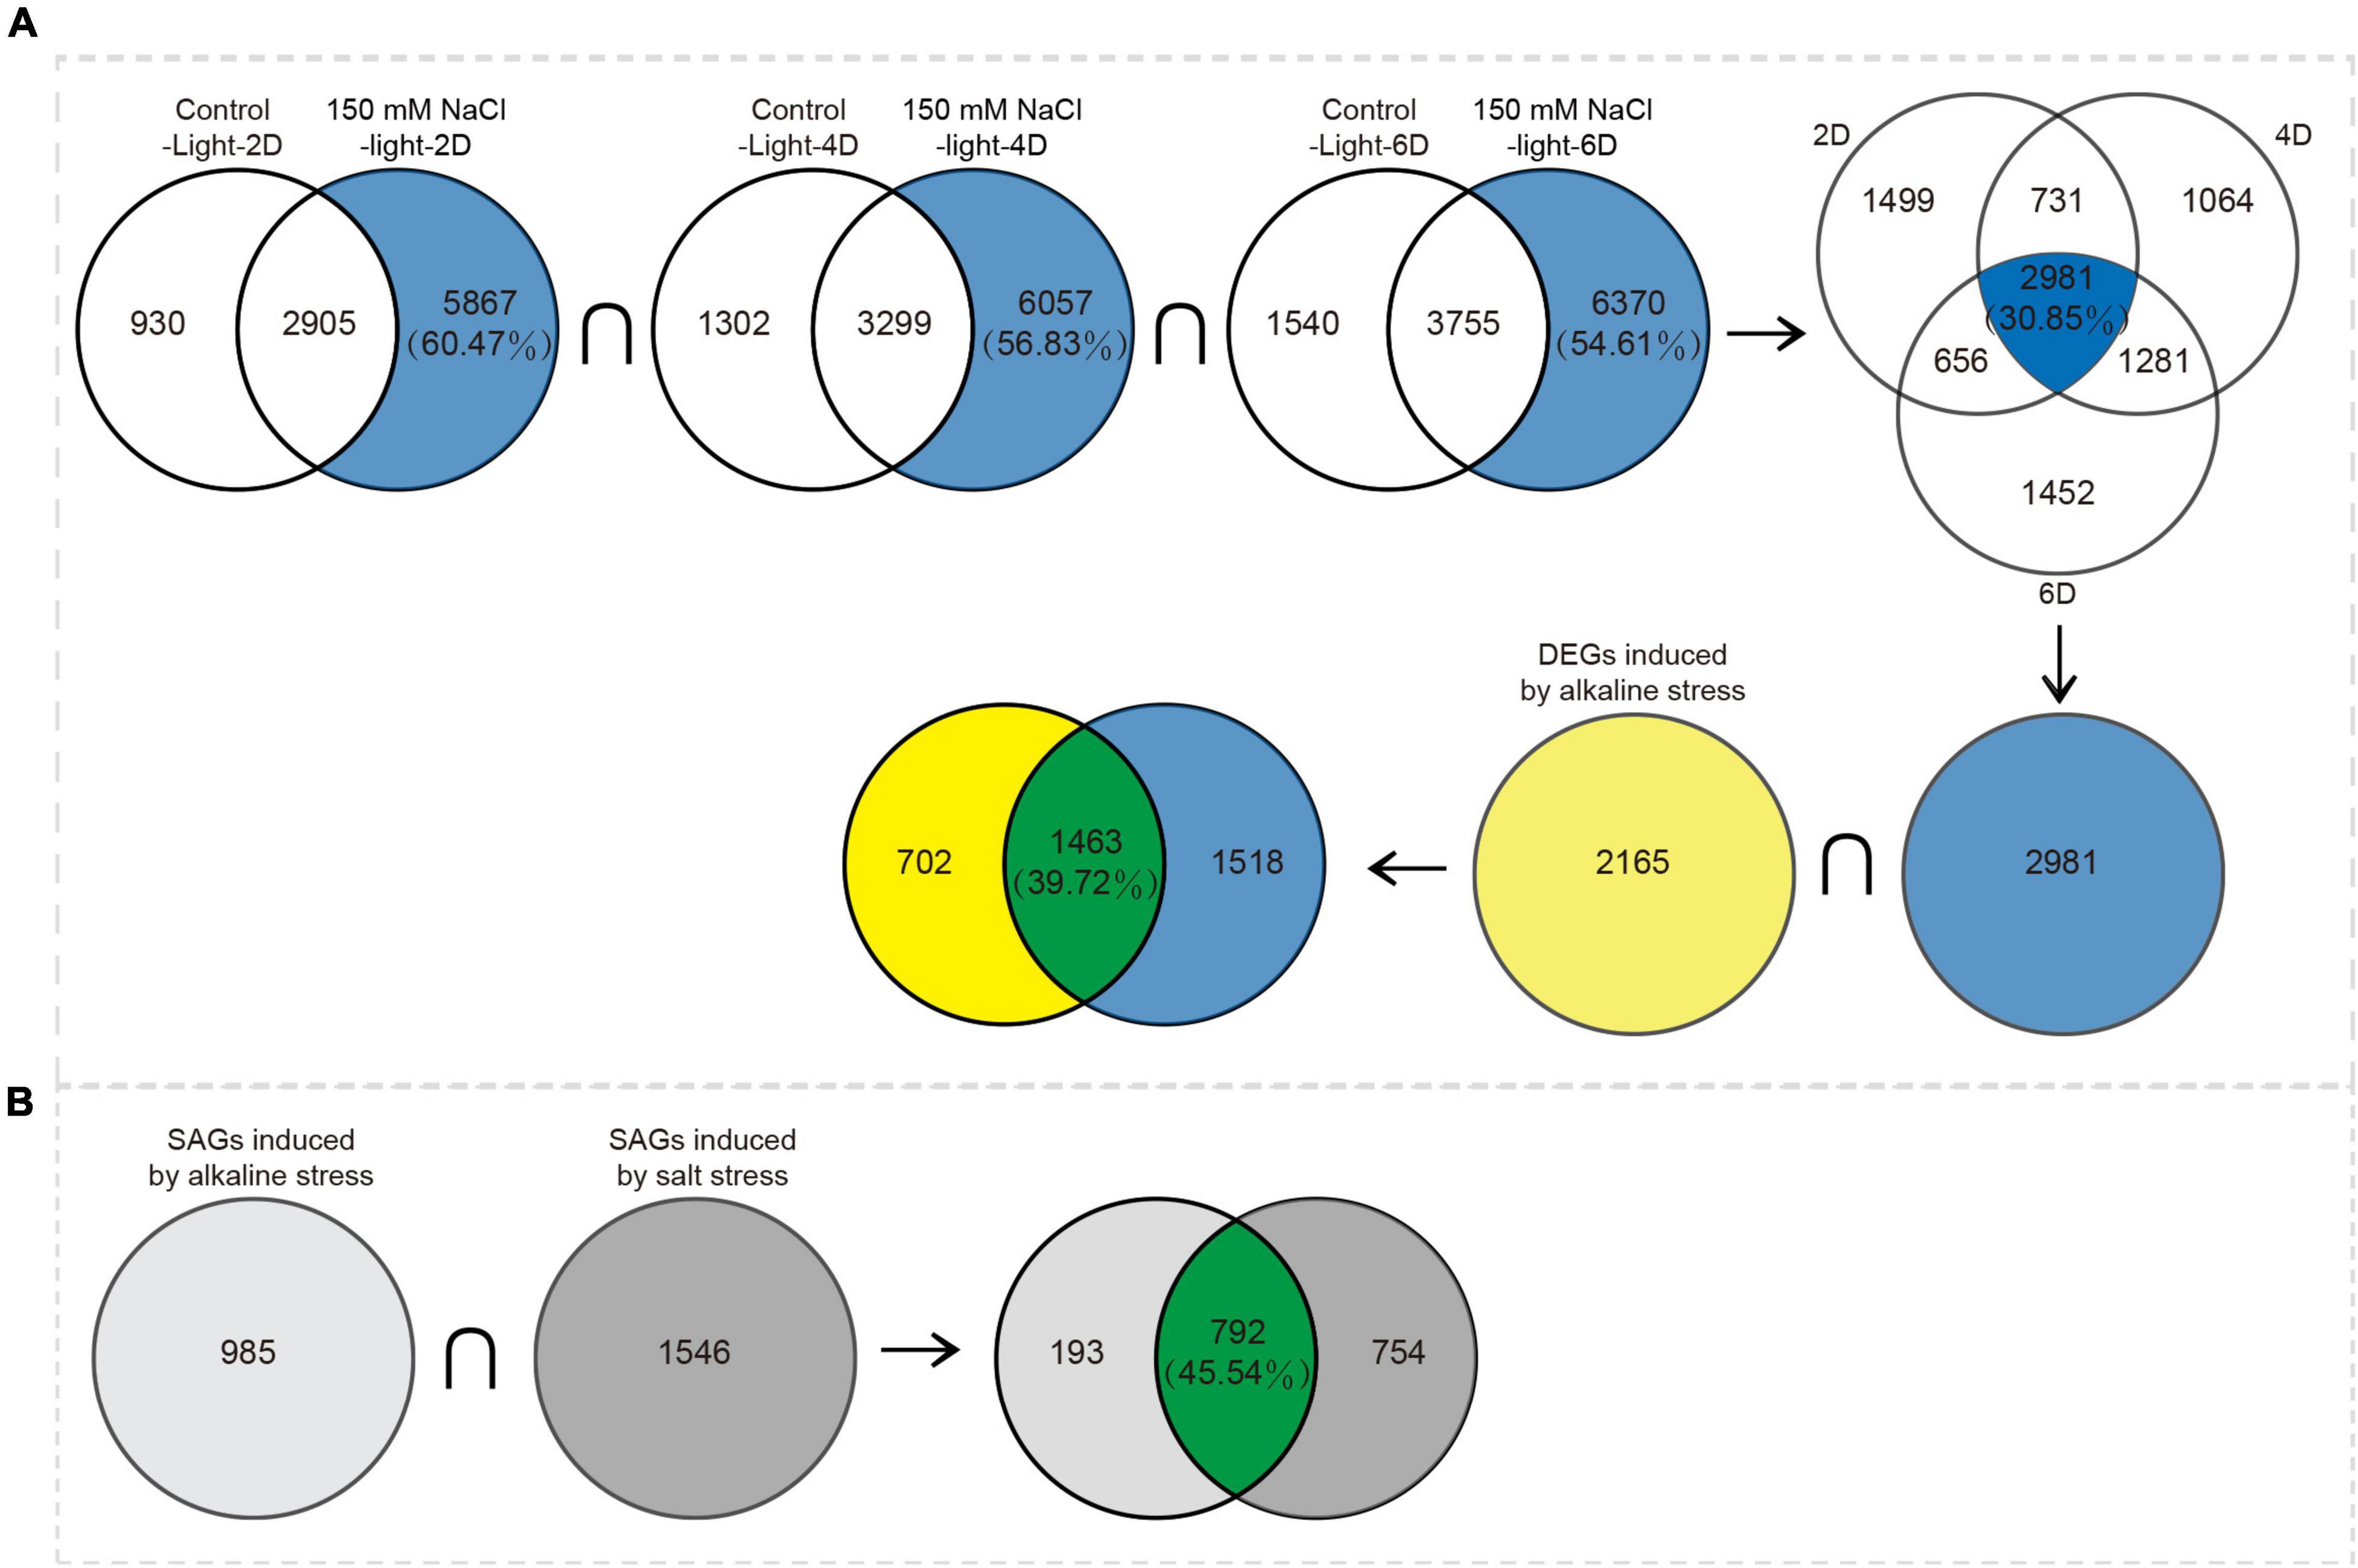
Figure 7. Venn diagram analysis of DEGs induced by alkaline stress and by salt stress. (A) Differences between DEGs induced by alkaline stress and by salt stress. (B) Differences between SAGs induced by alkaline stress and by salt stress.
Discussion
We obtained high-precision RNA-seq data from highly controlled and detached leaves from individual M. truncatula plants at four time points; and analyzed data through standard procedures. In addition, we compared the data from this study (alkali stress-induced leaf senescence) with data from a previous study (salt stress-induced leaf senescence) to construct a complete and rigorous experimental design strategy.
Salinity and alkaline conditions are widely recognized as abiotic stresses which restrict crop production as well as ecological environment construction. High salinity can affect the growth and development of plants by accelerating leaf senescence and plant death (Guo et al., 2021). In this process, chlorophyll degrades, and leaf color changes from green to yellow (Xue et al., 2021). Our physiological data confirmed this phenomenon (Figures 1A,B). We found that alkaline stress was more toxic than salt stress because of more rapid chlorophyll breakdown and more severely eroded leaves. Transcriptome data also showed that the molecular mechanisms of leaf senescence induced by the two stresses were not the same (Figure 7 and Supplementary Table 8), and many studies have reached similar conclusions (Guo et al., 2009; Yang et al., 2009; Li et al., 2010). Salt stress (mainly NaCl) and alkali stress (mainly Na2CO3 and NaHCO3) can accelerate leaf senescence through ion toxicity, osmotic stress, and oxidative stress. However, alkali stress causes more damage to leaves in less time, and the molecular mechanism is more complex (Guo et al., 2015). We propose a model of the physiological activities and molecular mechanisms of M. truncatula leaf responding to alkali stress. As shown in Figure 8, in the early stage of leaves upon to alkali stress, plant mainly faces to resist the stress. The corresponding physiological activities included ion transport, alleviation of osmotic stress, pH rebalance, hormone regulation, ROS protection; In molecular mechanisms, more changes focus on: (1) signal Transduction Pathways; (2) expression of alkali resistance-associated genes; (3) Ca2+ signaling system; (4) transcription factors; (5) epigenetic Changes. In the late stage of leaves under alkali stress, plant mainly shift to nutrient transport. The corresponding physiological activities included chlorophyll degradation, protein degradation and nutrient recycling. This strategy adjustment means that plant is about to give up the leaves that suffer from alkali stress.
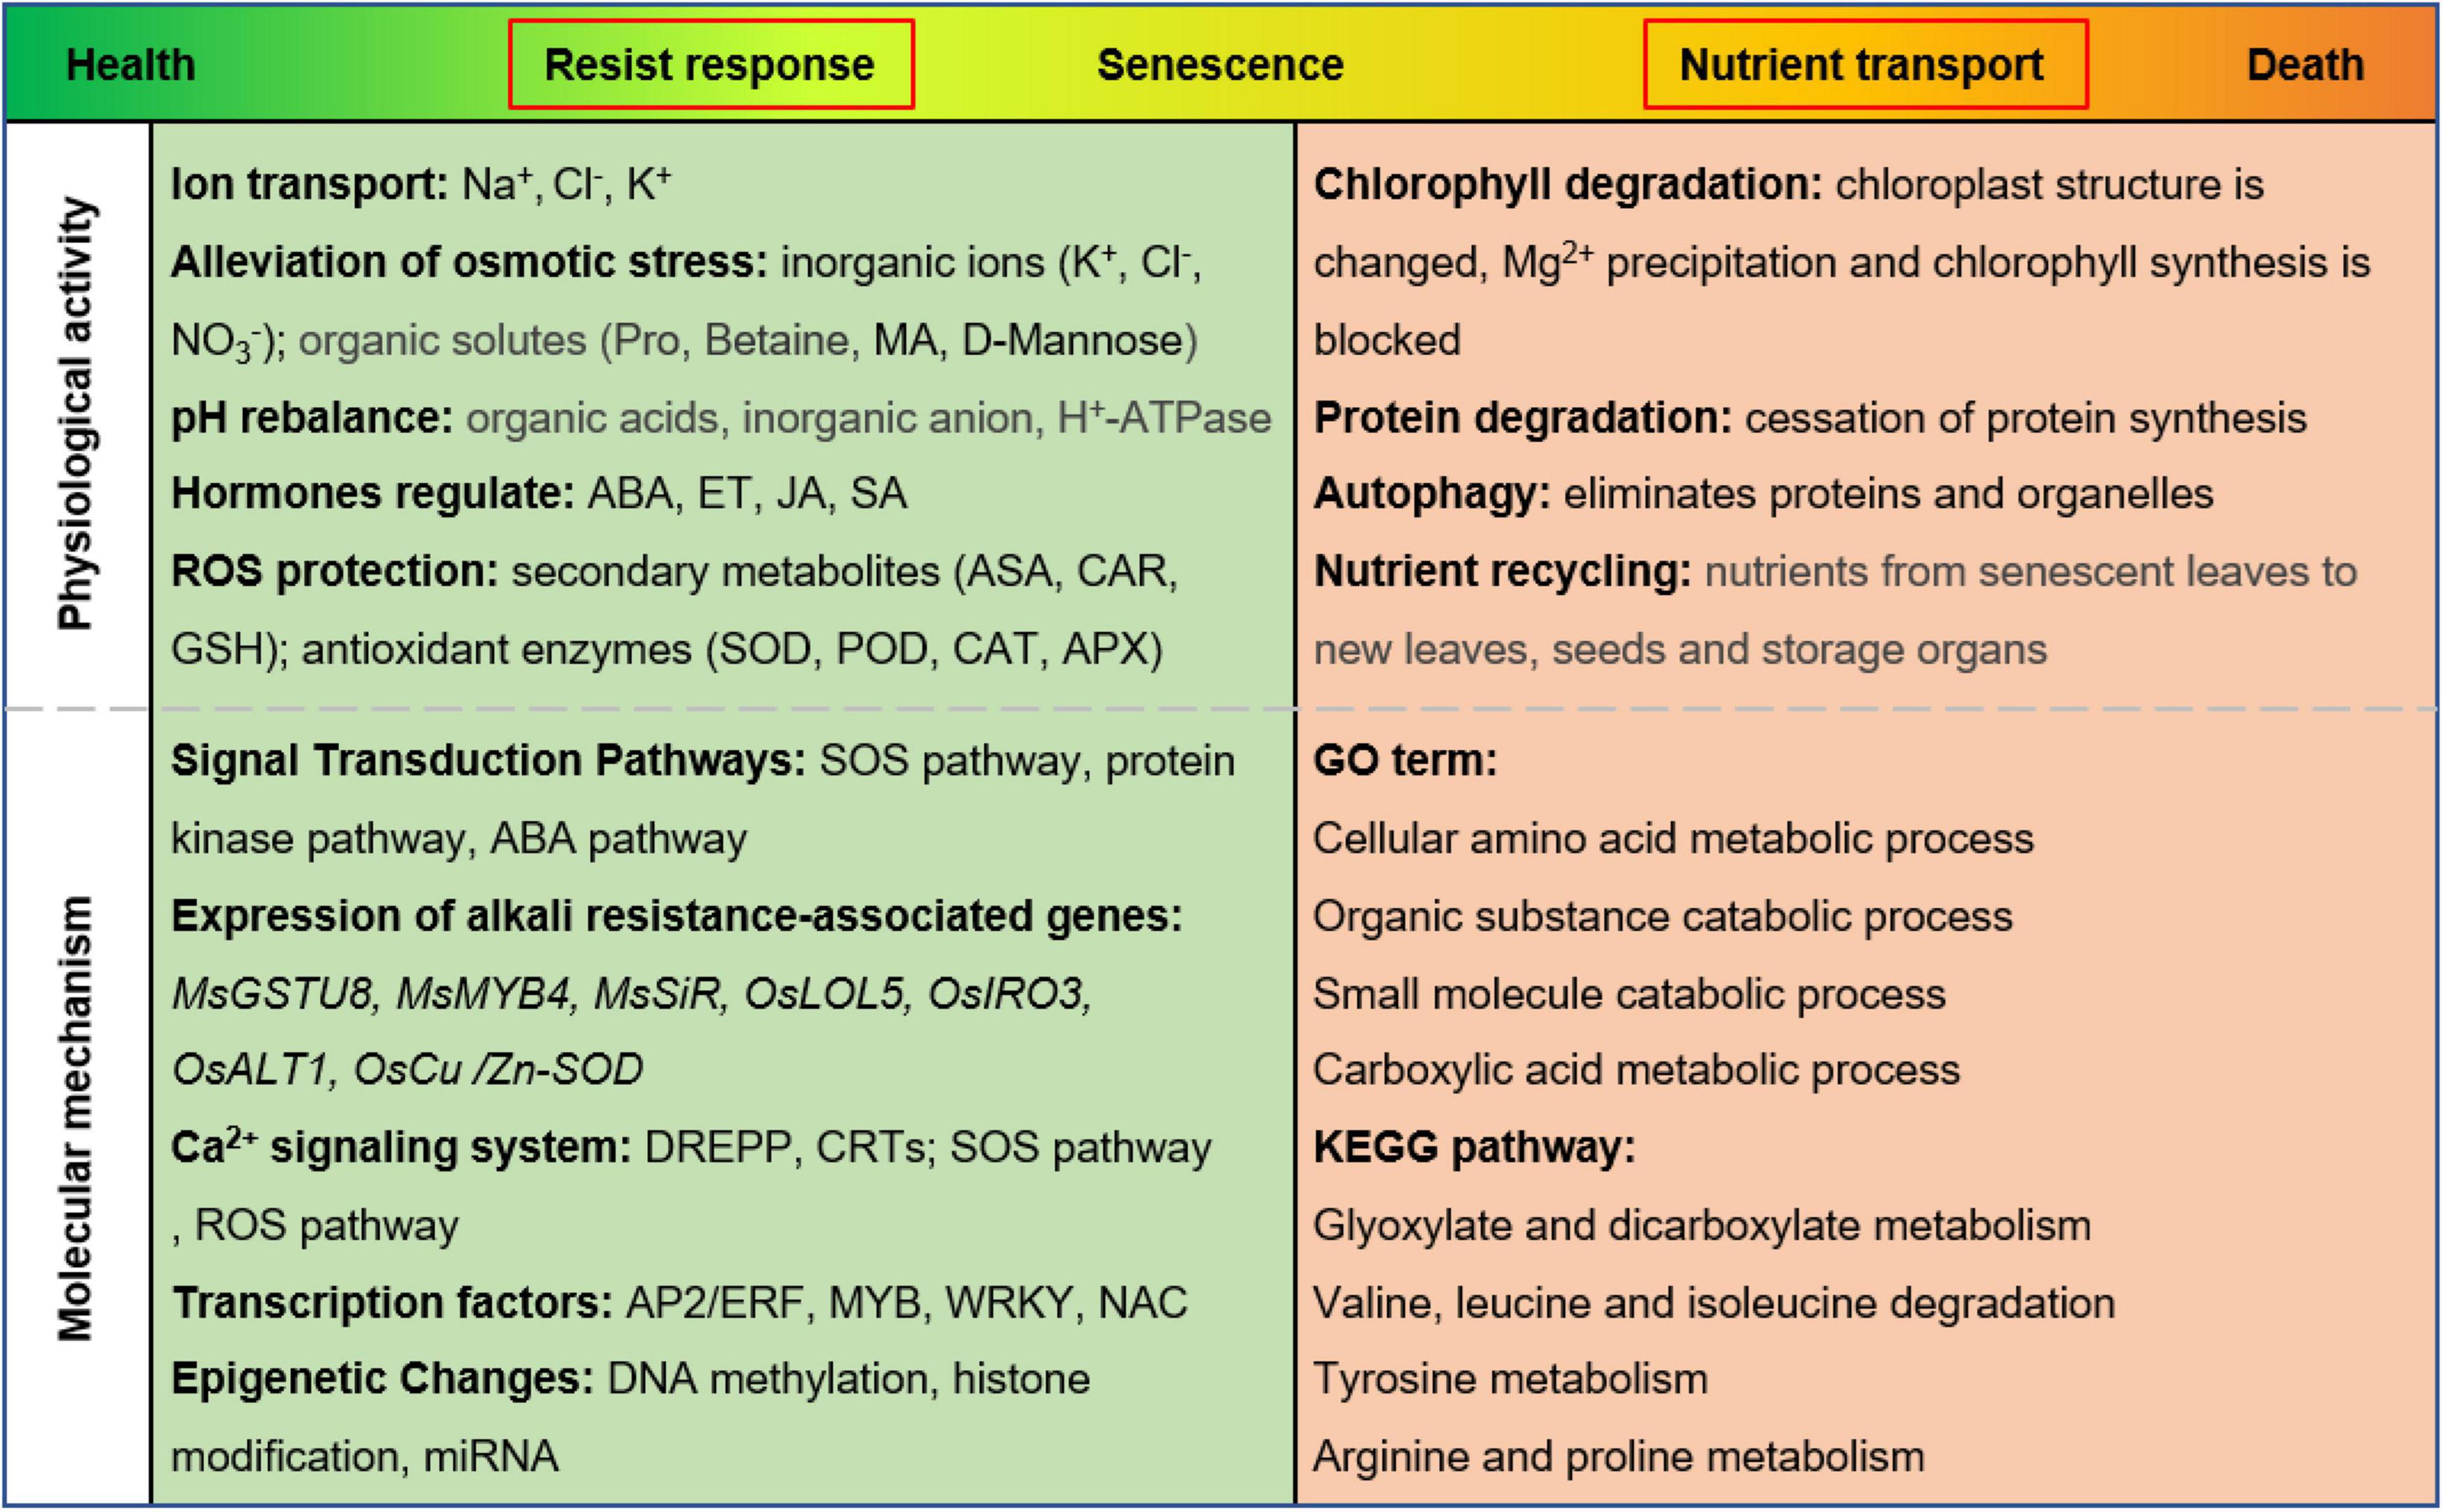
Figure 8. A model of leaf senescence regulation under alkaline stress in M. truncatula.
Alkaline stress greatly disrupts the ionic dynamic balance in plants and interferes with the uptake of mineral elements, leading to excessive accumulation of Na+ in the leaf cytoplasm, causing ion toxicity which damages cell organelles (Yang et al., 2008; Ruiz et al., 2016). In our assay, enrichment of DEGs related to ion transport and transmembrane transport was detected, with most being upregulated (Table 1). It has been reported that alkali stress can affect the distribution of ions in plant organs; for example, a large amount of Na+ and Cl– accumulates in old leaves, and the content of Na+ and Cl– in new leaves is lower (Foolad, 2004; Wang et al., 2012). The Na+ content in the leaves also increases significantly with increasing alkali stress (Dai et al., 2014; Abdel Latef and Tran, 2016). Plants maintain ion balance through ion metabolism, an important mechanism for adaptation to alkali stress (Blumwald et al., 2000).
Alkali stress can lead to massive water shortages in the leaves and accelerate leaf senescence (Zhang P. et al., 2021). In our study, genes related to metabolic intermediates, such as organic acid catabolic process and proline metabolism, were found to be significantly enriched; these metabolic intermediates act to relieve osmotic stress and contribute to the maintenance of normal water content in the leaves (Ali et al., 2008).
The effect of oxidative damage on leaf senescence is notable. High salinity can induce superoxide radicals, resulting in membrane lipid peroxidation and disruption of membrane integrity, which is a direct and important cause of leaf senescence. MDA is one of the main products of membrane lipid peroxidation (Bao et al., 2009), and we found that MDA content accumulated during leaf senescence (Figure 1D), suggesting that leaves suffered oxidative damage under alkaline stress. Similar results have been reported elsewhere (Zou et al., 2020; Wei et al., 2021; Wu et al., 2021). H2O2 is a common ROS involved in plant senescence. It can oxidize macromolecules and damage cell membranes, causing senescence (Halliwell, 1984; Chen et al., 2012). The H2O2 content increased during alkaline-induced senescence (Figure 1C). Transcriptional profile analysis also confirmed this result, with a large number of DEGs enriched in the oxidation-reduction process, energy derivation by oxidation of organic compounds, lipid oxidation, and fatty acid oxidation (Table 3). The levels of MDA and H2O2, as markers of oxidative stress-induced cellular damage, are widely used to assess the degree of plant senescence in Arabidopsis (Cui et al., 2013), alfalfa (Wei et al., 2021), rice (Chen et al., 2018), and adzuki bean (Li et al., 2020). Plants have ROS scavenging systems, including secondary metabolites and antioxidant enzymes, to reduce accumulated ROS and defend against oxidative damage (Gong et al., 2013; Wu et al., 2021). Secondary metabolites act as antioxidants to help plants scavenge ROS, such as ASA, carotenoids, glutathione, and certain low-molecular-weight compounds (Fan et al., 2021; Fang et al., 2021). Our transcriptome analysis showed that DEGs were enriched in KEGG pathways of secondary metabolites, such as carotenoid biosynthesis and glutathione metabolism (Supplementary Figure 4 and Supplementary Table 9). These DEGs may be involved in ROS elimination. Antioxidant enzymes play the most important role in the ROS scavenging system, and mainly include superoxide dismutase, peroxidase, and catalase, which catalyze H2O2 into O2 and H2O (Sun et al., 2019), and ascorbic acid peroxidase, which reduces membrane lipid peroxidation by scavenging MDA (Fang et al., 2021). It has been reported that overexpression of Cu/Zn-superoxide dismutase can increase the degree of tolerance to H2O2, thus reducing the damage caused by alkaline stress in plants (Wu et al., 2016). Additionally, antioxidant enzymes and antioxidants work together to effectively scavenge ROS and alleviate oxidative stress (Fu et al., 2017). Although plants have developed a series of regulatory adaptive mechanisms to resist alkali stress-induced senescence, the regulatory adaptive mechanisms of plants lose their effect if the concentration of alkali stress exceeds a threshold, leading to senescence and death.
In our assay, 2,165 DEGs were identified through transcriptomics of alkali-induced detached leaves. For further analysis, we divided the 2,165 DEGs into two parts: 985 SAGs and 1,180 DEGs; 985 genes were identical to the SAGs of the dark treatment group, which we believe are directly involved in the leaf senescence process. The remaining 1,180 genes may indirectly regulate leaf senescence (Figure 3B). GO and KEGG pathway enrichment analysis confirmed our conjecture that the genes of the two gene sets play different roles in leaf senescence: 985 SAGs were mainly enriched in nutrient cycling processes, such as cellular amino acid metabolic processes and organic substance catabolic processes, indicating nutrient redistribution. The 1,180 SAGs were significantly enriched in oxidoreductase complex, aerobic respiration, and ion transport (Table 1), most of which were upregulated during senescence (Figure 5).
TFs are the most significant components in the regulation of leaf senescence (Guo et al., 2004; Balazadeh et al., 2008). In our study, we identified 101 and 173 TFs among the 985 SAGs and 1,180 DEGs, respectively. The MYB, WRKY, NAC, and bZIP TF families belonged to the 985 SAGs, which are known to be involved in the regulation of senescence (Guo et al., 2004; Ay et al., 2010; Guo and Gan, 2011). The B3, HB-other, and ARF TF families in the 1,180 DEGs play an important role in abiotic stress defense responses. MYB, WRKY, and bHLH are multifunctional but essentially regulate plant senescence directly or indirectly.
The leaf is an important site for photosynthesis in plants and is sensitive to senescence. Premature leaf senescence caused by numerous environmental stresses (such as darkness, drought, salt, and alkali stress) can result in significant yield loss and quality reduction, especially in plants that focus on harvesting leaves, such as alfalfa. Therefore, the regulation of appropriate senescence time under abiotic stress needs investigation, with the aim to obtain varieties with an ideal senescence time. Alfalfa is considered a major forage crop worldwide, due to its high yield, high nutrient quality, and wide range of adaptation; however, premature leaf senescence caused by stress affects the quality and yield of alfalfa.
In summary, this study described detailed expression profiles of leaf senescence induced by alkali stress in M. truncatula, and annotated many SAGs. New candidate genes have been identified for further senescence resistance breeding, in order to improve the biomass and quality of forage crops under alkaline stress.
Data Availability Statement
The datasets presented in this study can be found in online repositories. The names of the repository/repositories and accession number(s) can be found below: National Center for Biotechnology Information (NCBI) BioProject database under accession number PRJNA805030.
Author Contributions
HX, Z-YW, and SD conceived and designed the experiments. SD, WP, HL, and KZ performed the experiments. SD, ZL, LC, and GY analyzed the data. SD wrote the manuscript. HX and Z-YW revised the manuscript. All authors read, revised and approved the final manuscript.
Funding
This work was supported by the Start Up Funds for High Level Talents of Qingdao Agricultural University (663-1120001), the National Natural Science Foundation of China (U1906201), and the First Class Grassland Science Discipline Program of Shandong Province, China.
Conflict of Interest
The authors declare that the research was conducted in the absence of any commercial or financial relationships that could be construed as a potential conflict of interest.
Publisher’s Note
All claims expressed in this article are solely those of the authors and do not necessarily represent those of their affiliated organizations, or those of the publisher, the editors and the reviewers. Any product that may be evaluated in this article, or claim that may be made by its manufacturer, is not guaranteed or endorsed by the publisher.
Supplementary Material
The Supplementary Material for this article can be found online at: https://www.frontiersin.org/articles/10.3389/fpls.2022.881456/full#supplementary-material
Supplementary Figure 1 | Correlation analysis showed the direct association between samples in the same treatment.
Supplementary Figure 2 | Validation of RNA-seq data by the qRT-PCR analysis. Correlation of expression changes observed by RNA-seq (Y-axis) and qRT-PCR (X-axis) relative expression levels from log2 Fold Change of 25 genes in different groups.
Supplementary Figure 3 | Data visualization according to cluster analysis. The horizontal coordinates represent specific samples, the vertical coordinates represent the expression values after treatment log10(x + 1) and the different colored lines represent the trend of different genes in all samples.
Supplementary Figure 4 | Pathview analysis of the Carotenoid (CAR) biosynthesis and Glutathione (GSH) metabolism pathway. The genes in the red rectangle are up-regulated.
Supplementary Table 1 | Primers of genes used for real-time quantitative PCR in this study.
Supplementary Table 2 | Project sample information, raw data, quality control data and comparison data.
Supplementary Table 3 | Differentially expressed genes (DEGs) at days 2, 4, and 6.
Supplementary Table 4 | 985 SAGs and 1,180 genes are obtained using the Venn diagram.
Supplementary Table 5 | TF family analysis data.
Supplementary Table 6 | KEGG pathway enrichment analysis in individual cluster.
Supplementary Table 7 | 169 DEGs related to ion transport.
Supplementary Table 8 | Responses of detached leaves to salt stress and alkali stress.
Supplementary Table 9 | Carotenoid biosynthesis and glutathione metabolism.
Footnotes
- ^ https://github.com/OpenGene/fastp
- ^ http://ccb.jhu.edu/software/hisat2/index.shtml
- ^ https://ccb.jhu.edu/software/stringtie/
- ^ http://deweylab.biostat.wisc.edu/rsem/
- ^ http://bioconductor.org/packages/stats/bioc/edgeR/
- ^ http://www.geneontology.org/
- ^ https://github.com/tanghaibao/Goatools
- ^ http://kobas.cbi.pku.edu.cn/home.do
- ^ http://www.genome.jp/kegg/
- ^ http://planttfdb.cbi.pku.edu.cn/
- ^ http://www.bioconductor.org/packages/release/bioc/html/maSigPro.html
References
Abdel Latef, A. A., and Tran, L. S. (2016). Impacts of priming with silicon on the growth and tolerance of maize plants to alkaline stress. Front. Plant Sci. 7:243. doi: 10.3389/fpls.2016.00243
Ali, Q., Athar, H.-U.-R., and Ashraf, M. (2008). Modulation of growth, photosynthetic capacity and water relations in salt stressed wheat plants by exogenously applied 24-epibrassinolide. Plant Growth Regul. 56, 107–116. doi: 10.1007/s10725-008-9290-7
Allu, A. D., Soja, A. M., Wu, A., Szymanski, J., and Balazadeh, S. (2014). Salt stress and senescence: identification of cross-talk regulatory components. J. Exp. Bot. 65, 3993–4008. doi: 10.1093/jxb/eru173
An, Y. M., Song, L. L., Liu, Y. R., Shu, Y. J., and Guo, C. H. (2016). De novo transcriptional analysis of alfalfa in response to saline-alkaline stress. Front. Plant Sci. 7:931. doi: 10.3389/fpls.2016.00931
Ay, N., Irmler, K., Fischer, A., Uhlemann, R., Reuter, G., and Humbeck, K. (2010). Epigenetic programming via histone methylation at WRKY53 controls leaf senescence in Arabidopsis thaliana. Plant J. Cell Mol. Biol. 58, 333–346. doi: 10.1111/j.1365-313X.2008.03782.x
Balazadeh, S., Riano-Pachon, D. M., and Mueller-Roeber, B. (2008). Transcription factors regulating leaf senescence in Arabidopsis thaliana. Plant Biol. 10(Suppl. 1) 63–75. doi: 10.1111/j.1438-8677.2008.00088.x
Balazadeh, S., Wu, A., and Mueller-Roeber, B. (2010). Salt-triggered expression of the ANAC092-dependent senescence regulon in Arabidopsis thaliana. Plant Signal. Behav. 5, 733–735. doi: 10.4161/psb.5.6.11694
Bao, A.-K., Wang, S.-M., Wu, G.-Q., Xi, J.-J., Zhang, J.-L., and Wang, C.-M. (2009). Overexpression of the Arabidopsis H+-PPase enhanced resistance to salt and drought stress in transgenic alfalfa (Medicago sativa L.). Plant Sci. 176, 232–240. doi: 10.1016/j.plantsci.2008.10.009
Barker, D. G., Bianchi, S., Blondon, F., Dattée, Y., Duc, G., Essad, S., et al. (1990). Medicago truncatula, a model plant for studying the molecular genetics of the Rhizobium-legume symbiosis. Plant Mol. Biol. Rep. 8, 40–49. doi: 10.1007/BF02668879
Blumwald, E., Aharon, G. S., and Apse, M. P. (2000). Sodium transport in plant cells. Biochim. Biophys. Acta 1465, 140–151. doi: 10.1016/S0005-2736(00)00135-8
Bouton, J. (2007). The economic benefits of forage improvement in the United States. Euphytica 154, 263–270. doi: 10.1007/s10681-006-9220-6
Breeze, E., Harrison, E., Mchattie, S., Hughes, L., Hickman, R., Hill, C., et al. (2011). High-resolution temporal profiling of transcripts during Arabidopsis leaf senescence reveals a distinct chronology of processes and regulation. Plant Cell 23, 873–894. doi: 10.1105/tpc.111.083345
Buchanan-Wollaston, V. (1997). The molecular biology of leaf senescence. J. Exp. Bot. 48, 181–199. doi: 10.1093/jxb/48.2.181
Chao, Y., Xie, L., Yuan, J., Guo, T., Li, Y., Liu, F., et al. (2018). Transcriptome analysis of leaf senescence in red clover (Trifolium pratense L.). Physiol. Mol. Biol. Plants 24, 753–765. doi: 10.1007/s12298-018-0562-z
Chen, G., Wu, C., He, L., Qiu, Z., Zhang, S., Zhang, Y., et al. (2018). Knocking out the gene RLS1 induces hypersensitivity to oxidative stress and premature leaf senescence in rice. Int. J. Mol. Sci. 19:2853. doi: 10.3390/ijms19102853
Chen, H. J., Lin, Z. W., Huang, G. J., and Lin, Y. H. (2012). Sweet potato calmodulin SPCAM is involved in salt stress-mediated leaf senescence, H2O2 elevation and senescence-associated gene expression. J. Plant Physiol. 169, 1892–1902. doi: 10.1016/j.jplph.2012.08.004
Cui, M. H., Ok, S. H., Yoo, K. S., Jung, K. W., Yoo, S. D., and Shin, J. S. (2013). An Arabidopsis cell growth defect factor-related protein, CRS, promotes plant senescence by increasing the production of hydrogen peroxide. Plant Cell Physiol. 54, 155–167. doi: 10.1093/pcp/pcs161
Dai, L. Y., Zhang, L. J., Jiang, S. J., and Yin, K. D. (2014). Saline and alkaline stress genotypic tolerance in sweet sorghum is linked to sodium distribution. Acta Agric. Scand. B Soil Plant Sci. 64, 471–481. doi: 10.1080/09064710.2014.925574
Dong, S., Sang, L., Xie, H., Chai, M., and Wang, Z. Y. (2021). Comparative transcriptome analysis of salt stress-induced leaf senescence in Medicago truncatula. Front. Plant Sci. 12:666660. doi: 10.3389/fpls.2021.666660
Fan, Y., Lu, X., Chen, X., Wang, J., Wang, D., Wang, S., et al. (2021). Cotton transcriptome analysis reveals novel biological pathways that eliminate reactive oxygen species (ROS) under sodium bicarbonate (NaHCO3) alkaline stress. Genomics 113, 1157–1169. doi: 10.1016/j.ygeno.2021.02.022
Fang, S., Hou, X., and Liang, X. (2021). Response mechanisms of plants under saline-alkali stress. Front. Plant Sci. 12:667458. doi: 10.3389/fpls.2021.667458
Foolad, M. (2004). Recent advances in genetics of salt tolerance in tomato. Plant Cell Tissue Organ Cult. 76, 101–119. doi: 10.1023/B:TICU.0000007308.47608.88
Fu, J., Liu, Z., Li, Z., Wang, Y., and Yang, K. (2017). Alleviation of the effects of saline-alkaline stress on maize seedlings by regulation of active oxygen metabolism by Trichoderma asperellum. PLoS One 12:e0179617. doi: 10.1371/journal.pone.0179617
Fuglsang, A. T., Guo, Y., Cuin, T. A., Qiu, Q., Song, C., Kristiansen, K. A., et al. (2007). Arabidopsis protein kinase PKS5 inhibits the plasma membrane H+ -ATPase by preventing interaction with 14-3-3 protein. Plant Cell 19, 1617–1634. doi: 10.1105/tpc.105.035626
Ghanem, M. E., Albacete, A., Martinez-Andujar, C., Acosta, M., Romero-Aranda, R., Dodd, I. C., et al. (2008). Hormonal changes during salinity-induced leaf senescence in tomato (Solanum lycopersicum L.). J. Exp. Bot. 59, 3039–3050. doi: 10.1093/jxb/ern153
Gong, B., Wen, D., Vandenlangenberg, K., Wei, M., Yang, F., Shi, Q., et al. (2013). Comparative effects of NaCl and NaHCO3 stress on photosynthetic parameters, nutrient metabolism, and the antioxidant system in tomato leaves. Sci. Hortic. 157, 1–12. doi: 10.1016/j.scienta.2013.03.032
Guo, R., Shi, L., and Yang, Y. (2009). Germination, growth, osmotic adjustment and ionic balance of wheat in response to saline and alkaline stresses. Soil Sci. Plant Nutr. 55, 667–679. doi: 10.1111/j.1747-0765.2009.00406.x
Guo, R., Yang, Z., Li, F., Yan, C., Zhong, X., Liu, Q., et al. (2015). Comparative metabolic responses and adaptive strategies of wheat (Triticum aestivum) to salt and alkali stress. BMC plant biology 15:170. doi: 10.1186/s12870-015-0546-x
Guo, Y., Cai, Z., and Gan, S. (2004). Transcriptome of Arabidopsis leaf senescence. Plant Cell Environ. 27, 521–549. doi: 10.1111/j.1365-3040.2003.01158.x
Guo, Y., and Gan, S. (2005). Leaf senescence: signals, execution, and regulation. Curr. Top. Dev. Biol. 71, 83–112. doi: 10.1016/S0070-2153(05)71003-6
Guo, Y., and Gan, S. (2011). AtMYB2 regulates whole plant senescence by inhibiting cytokinin-mediated branching at late stages of development in Arabidopsis. Plant Physiol. 156, 1612–1619. doi: 10.1104/pp.111.177022
Guo, Y., and Gan, S. S. (2012). Convergence and divergence in gene expression profiles induced by leaf senescence and 27 senescence-promoting hormonal, pathological and environmental stress treatments. Plant Cell Environ. 35, 644–655. doi: 10.1111/j.1365-3040.2011.02442.x
Guo, Y., Ren, G., Zhang, K., Li, Z., Miao, Y., and Guo, H. (2021). Leaf senescence: progression, regulation, and application. Mol. Hortic. 1, 1–25. doi: 10.1186/s43897-021-00006-9
Halliwell, B. (1984). Chloroplast Metabolism: The Structure and Function of Chloroplasts in Green Leaf Cells. Oxford: Clarendon Press.
Hao, Y. J., Song, Q. X., Chen, H. W., Zou, H. F., Wei, W., Kang, X. S., et al. (2010). Plant NAC-type transcription factor proteins contain a NARD domain for repression of transcriptional activation. Planta 232, 1033–1043. doi: 10.1007/s00425-010-1238-2
He, L., Wu, W., Zinta, G., Yang, L., Wang, D., Liu, R., et al. (2018). A naturally occurring epiallele associates with leaf senescence and local climate adaptation in Arabidopsis accessions. Nat. Commun. 9:460. doi: 10.1038/s41467-018-02839-3
Lee, R. H., Wang, C. H., Huang, L. T., and Chen, S. C. (2001). Leaf senescence in rice plants: cloning and characterization of senescence up-regulated genes. J. Exp. Bot. 52, 1117–1121. doi: 10.1093/jexbot/52.358.1117
Li, R., Shi, F., Fukuda, K., and Yang, Y. (2010). Effects of salt and alkali stresses on germination, growth, photosynthesis and ion accumulation in alfalfa (Medicago sativa L.). Soil Sci. Plant Nutr. 56, 725–733. doi: 10.1111/j.1747-0765.2010.00506.x
Li, W. Y., Wang, C., Shi, H. H., Wang, B., Wang, J. X., Liu, Y. S., et al. (2020). Genome-wide analysis of ethylene-response factor family in adzuki bean and functional determination of VaERF3 under saline-alkaline stress. Plant Physiol. Biochem. 147, 215–222. doi: 10.1016/j.plaphy.2019.12.019
Lim, P. O., Kim, H. J., and Gil Nam, H. (2007). Leaf senescence. Annu. Rev. Plant Biol. 58, 115–136. doi: 10.1146/annurev.arplant.57.032905.105316
Mao, C., Lu, S., Lv, B., Zhang, B., and Ming, F. (2017). A rice NAC transcription factor promotes leaf senescence via ABA biosynthesis. Plant Physiology 174, 1747–1763. doi: 10.1104/pp.17.00542
Pageau, K., Reisdorf-Cren, M., Morot-Gaudry, J. F., and Masclaux-Daubresse, C. (2006). The two senescence-related markers, GS1 (cytosolic glutamine synthetase) and GDH (glutamate dehydrogenase), involved in nitrogen mobilization, are differentially regulated during pathogen attack and by stress hormones and reactive oxygen species in Nicotiana tabacum L. leaves. J. Exp. Bot. 57, 547–557. doi: 10.1093/jxb/erj035
Ruiz, K., Biondi, S., Martínez, E., Orsini, F., Antognoni, F., and Jacobsen, S.-E. (2016). Quinoa–a model crop for understanding salt-tolerance mechanisms in halophytes. Plant Biosyst. 150, 357–371. doi: 10.1080/11263504.2015.1027317
Sobieszczuk-Nowicka, E., Wrzesiński, T., Bagniewska-Zadworna, A., Kubala, S., Rucińska-Sobkowiak, R., Polcyn, W., et al. (2018). Physio-genetic dissection of dark-induced leaf senescence and timing its reversal in barley. Plant Physiol. 178, 654–671. doi: 10.1104/pp.18.00516
Sun, J., He, L., and Li, T. (2019). Response of seedling growth and physiology of Sorghum bicolor (L.) moench to saline-alkali stress. PLoS One 14:e0220340. doi: 10.1371/journal.pone.0220340
Uauy, C., Distelfeld, A., Fahima, T., Blechl, A., and Dubcovsky, J. (2006). A NAC Gene regulating senescence improves grain protein, zinc, and iron content in wheat. Science 314, 1298–1301. doi: 10.1126/science.1133649
Wang, H., Wu, Z., Han, J., Zheng, W., and Yang, C. (2012). Comparison of ion balance and nitrogen metabolism in old and young leaves of alkali-stressed rice plants. PLoS One 7:e37817. doi: 10.1371/journal.pone.0037817
Wang, J., Zhao, Y., Ray, I., and Song, M. (2016). Transcriptome responses in alfalfa associated with tolerance to intensive animal grazing. Sci Rep 6:19438. doi: 10.1038/srep19438
Wang, N., Wang, X., Shi, J., Liu, X., Xu, Q., Zhou, H., et al. (2019). Mepiquat chloride-priming induced salt tolerance during seed germination of cotton (Gossypium hirsutum L.) through regulating water transport and K+/Na+homeostasis. Environ. Exp. Bot. 159, 168–178. doi: 10.1016/j.envexpbot.2018.12.024
Wei, T., Wang, Y., and Liu, J. H. (2020). Comparative transcriptome analysis reveals synergistic and disparate defense pathways in the leaves and roots of trifoliate orange (Poncirus trifoliata) autotetraploids with enhanced salt tolerance. Hortic. Res. 7:88. doi: 10.1038/s41438-020-0311-7
Wei, T.-J., Wang, M.-M., Jin, Y.-Y., Zhang, G.-H., Liu, M., Yang, H.-Y., et al. (2021). Abscisic acid priming creates alkaline tolerance in alfalfa seedlings (Medicago sativa L.). Agriculture 11:608. doi: 10.3390/agriculture11070608
Woo, H. R., Kim, H. J., Lim, P. O., and Nam, H. G. (2019). Leaf senescence: systems and dynamics aspects. Annu. Rev. Plant Biol. 70, 347–376. doi: 10.1146/annurev-arplant-050718-095859
Wu, G.-Q., Li, H., Zhu, Y.-H., and Li, S.-J. (2021). Comparative physiological response of sainfoin (Onobrychis viciaefolia) seedlings to alkaline and saline-alkaline stress. J. Anim. Plant Sci. 31, 1028–1035. doi: 10.36899/JAPS.2021.4.0299
Wu, J., Zhang, J., Li, X., Xu, J., and Wang, L. (2016). Identification and characterization of a PutCu/Zn-SOD gene from Puccinellia tenuiflora (Turcz.) Scribn. et Merr. Plant Growth Regul. 79, 55–64. doi: 10.1007/s10725-015-0110-6
Xu, P., Chen, H., and Cai, W. (2020). Transcription factor CDF4 promotes leaf senescence and floral organ abscission by regulating abscisic acid and reactive oxygen species pathways in Arabidopsis. EMBO Rep. 21:e48967. doi: 10.15252/embr.201948967
Xue, J., Lu, D., Wang, S., Lu, Z., Liu, W., Wang, X., et al. (2021). Integrated transcriptomic and metabolomic analysis provides insight into the regulation of leaf senescence in rice. Sci. Rep. 11:14083. doi: 10.1038/s41598-021-93532-x
Yang, C., Shi, D., and Wang, D. (2008). Comparative effects of salt and alkali stresses on growth, osmotic adjustment and ionic balance of an alkali-resistant halophyte Suaeda glauca (Bge.). Plant Growth Regul. 56, 179–190. doi: 10.1007/s10725-008-9299-y
Yang, C.-W., Xu, H.-H., Wang, L.-L., Liu, J., Shi, D.-C., and Wang, D.-L. (2009). Comparative effects of salt-stress and alkali-stress on the growth, photosynthesis, solute accumulation, and ion balance of barley plants. Photosynthetica 47, 79–86. doi: 10.1007/s11099-009-0013-8
Yang, Y., and Guo, Y. (2018a). Elucidating the molecular mechanisms mediating plant salt-stress responses. New Phytol. 217, 523–539. doi: 10.1111/nph.14920
Yang, Y., and Guo, Y. (2018b). Unraveling salt stress signaling in plants. J. Integr. Plant Biol. 60, 796–804. doi: 10.1111/jipb.12689
Yang, Y., Qin, Y., Xie, C., Zhao, F., Zhao, J., Liu, D., et al. (2010). The Arabidopsis chaperone J3 regulates the plasma membrane H+-ATPase through interaction with the PKS5 kinase. Plant Cell 22, 1313–1332. doi: 10.1105/tpc.109.069609
Yang, Y., Wu, Y., Ma, L., Yang, Z., Dong, Q., Li, Q., et al. (2019). The Ca2+ sensor SCaBP3/CBL7 modulates plasma membrane H+-ATPase activity and promotes alkali tolerance in Arabidopsis. Plant Cell 31, 1367–1384. doi: 10.1105/tpc.18.00568
Yuan, J., Sun, X., Guo, T., Chao, Y., and Han, L. (2020). Global transcriptome analysis of alfalfa reveals six key biological processes of senescent leaves. PeerJ 8:e8426. doi: 10.7717/peerj.8426
Zhang, J. Y., Cruz De Carvalho, M. H., Torres-Jerez, I., Kang, Y., Allen, S. N., Huhman, D. V., et al. (2014). Global reprogramming of transcription and metabolism in Medicago truncatula during progressive drought and after rewatering. Plant Cell Environ. 37, 2553–2576. doi: 10.1111/pce.12328
Zhang, M., Wang, Y., Chen, X., Xu, F., Ding, M., Ye, W., et al. (2021). Plasma membrane H+ -ATPase overexpression increases rice yield via simultaneous enhancement of nutrient uptake and photosynthesis. Nat. Commun. 12:735. doi: 10.1038/s41467-021-20964-4
Zhang, P., Duo, T., Wang, F., Zhang, X., Yang, Z., and Hu, G. (2021). De novo transcriptome in roots of switchgrass (Panicum virgatum L.) reveals gene expression dynamic and act network under alkaline salt stress. BMC Genomics 22:82. doi: 10.1186/s12864-021-07368-w
Zhang, Z., He, K., Zhang, T., Tang, D., Li, R., and Jia, S. (2019). Physiological responses of Goji berry (Lycium barbarum L.) to saline-alkaline soil from Qinghai region, China. Sci. Rep. 9:12057. doi: 10.1038/s41598-019-48514-5
Zhao, D., Oosterhuis, D., and Bednarz, C. (2001). Influence of potassium deficiency on photosynthesis, chlorophyll content, and chloroplast ultrastructure of cotton plants. Photosynthetica 39, 103–109. doi: 10.1023/A:1012404204910
Zhou, C., Han, L., Pislariu, C., Jin, N., and Fu, C. (2011). From model to crop: functional analysis of a STAY-GREEN gene in the model legume Medicago truncatula and effective use of the gene for alfalfa improvement. Plant Physiol. 157, 1483–1496. doi: 10.1104/pp.111.185140
Zhu, J. K. (2016). Abiotic stress signaling and responses in plants. Cell 167, 313–324. doi: 10.1016/j.cell.2016.08.029
Keywords: alkaline stress, Medicago truncatula, leaf senescence, transcriptome analysis, senescence-associated genes (SAGs)
Citation: Dong S, Pang W, Liu Z, Li H, Zhang K, Cong L, Yang G, Wang Z-Y and Xie H (2022) Transcriptome Analysis of Leaf Senescence Regulation Under Alkaline Stress in Medicago truncatula. Front. Plant Sci. 13:881456. doi: 10.3389/fpls.2022.881456
Received: 22 February 2022; Accepted: 01 April 2022;
Published: 28 April 2022.
Edited by:
Jing Zhang, Nanjing Agricultural University, ChinaReviewed by:
Naichong Chen, Oklahoma State University, United StatesBin Xu, Nanjing Agricultural University, China
Copyright © 2022 Dong, Pang, Liu, Li, Zhang, Cong, Yang, Wang and Xie. This is an open-access article distributed under the terms of the Creative Commons Attribution License (CC BY). The use, distribution or reproduction in other forums is permitted, provided the original author(s) and the copyright owner(s) are credited and that the original publication in this journal is cited, in accordance with accepted academic practice. No use, distribution or reproduction is permitted which does not comply with these terms.
*Correspondence: Hongli Xie, aGx4aWUwOEAxMjYuY29t, orcid.org/0000-0001-6392-0494